What were the Fund costs for the past year?
(based on a hypothetical $10,000 investment)
| Fund Name | Costs of a $10,000 | Costs paid as a |
| OTG Latin America ETF | $140 | 1.19% |
How did the ETF Perform?
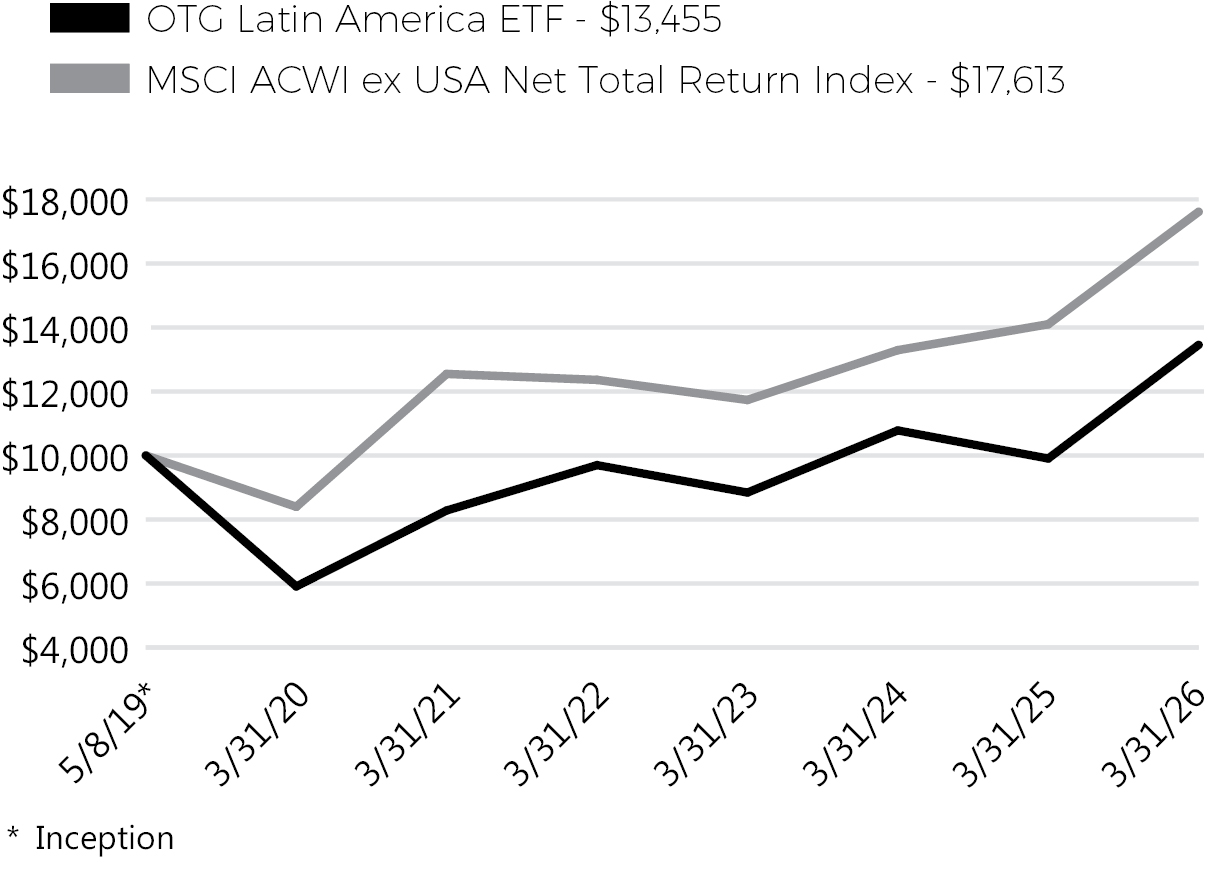
The OTG Latin America ETF (the “Fund”) returned 35.84% for the period April 1, 2025, through March 31, 2026. The Fund commenced operations as an exchange-traded fund on July 11, 2025, following its conversion from a predecessor mutual fund. The Fund’s performance reflects its results as a mutual fund prior to the conversion and as an ETF thereafter. This performance outperformed its broad-based benchmark, the MSCI ACWI ex USA Net Total Return Index, which returned 24.91% during the same period.
The Fund was launched to provide an investment vehicle focused on opportunities in the Latin America region. The investment strategy is supported by a research team located within the region, allowing for a localized approach to identifying portfolio companies.
Latin America continues to undergo a structural transformation. The region is currently benefiting from global shift, characterized by:
• Nearshoring & Trade Realignment: Supply chains are rerouting closer to the U.S. market, with Mexico particularly benefiting from increased manufacturing and tech exports.
• Energy Transition: The global push toward electrification has placed a premium on the region’s critical minerals, including copper and lithium from Chile and Peru.
• Demographic Resilience: An expanding middle class and the rapid adoption of fintech and digital infrastructure continue to drive internal demand in sectors like financial services and telecommunications.
Factors which Influenced Performance
During this period, Latin American markets transitioned from a period of high volatility to one of renewed institutional interest. Several key factors contributed to our outperformance:
• Active Country Allocation: Our flexible mandate allowed us to capitalize on “market-friendly” policy shifts across the region. The region is no longer uniformly left-leaning. There is a clear ideological split, and many countries are shifting towards more pragmatic pro-market governance.
• Commodity Leverage: Strong global demand for materials and energy transition metals provided a significant tailwind for our holdings in the materials and energy sectors.
• Sector Selection: The Fund’s ability to remain active meant we could overweight the “winners” of the new macro regimes, specifically materials and financials — while maintaining a tactical cash position (approx. 1.8% to 5%) to buy into dips during periods of currency volatility. This selection process ensured the portfolio was composed of companies with high pricing power and direct exposure to global growth catalysts.
Cumulative Performance
(based on a hypothetical $10,000 investment)
Annual Performance
| 1 Year | 5 Year | Average Annual | |
| OTG Latin America ETF | 35.84% | 10.19% | 4.40% |
| MSCI ACWI ex USA Net Total Return Index | 24.91% | 7.02% | 8.55% |
The MSCI ACWI ex USA Net Total Return Index captures large-and mid-cap representation across developed and emerging markets countries, excluding the United States, and covers approximately 85% of the free float-adjusted market capitalization.
Visit https://otgam.net/products/exchanged-traded-fund/latin-america-etf-otgl for more recent performance information.
Key Fund Statistics
(as of March 31, 2026)
| Fund Net Assets | $28,577,762 |
| Number of Holdings | 56 |
| Total Net Advisory Fee | $177,781 |
| Portfolio Turnover Rate | 46.58% |
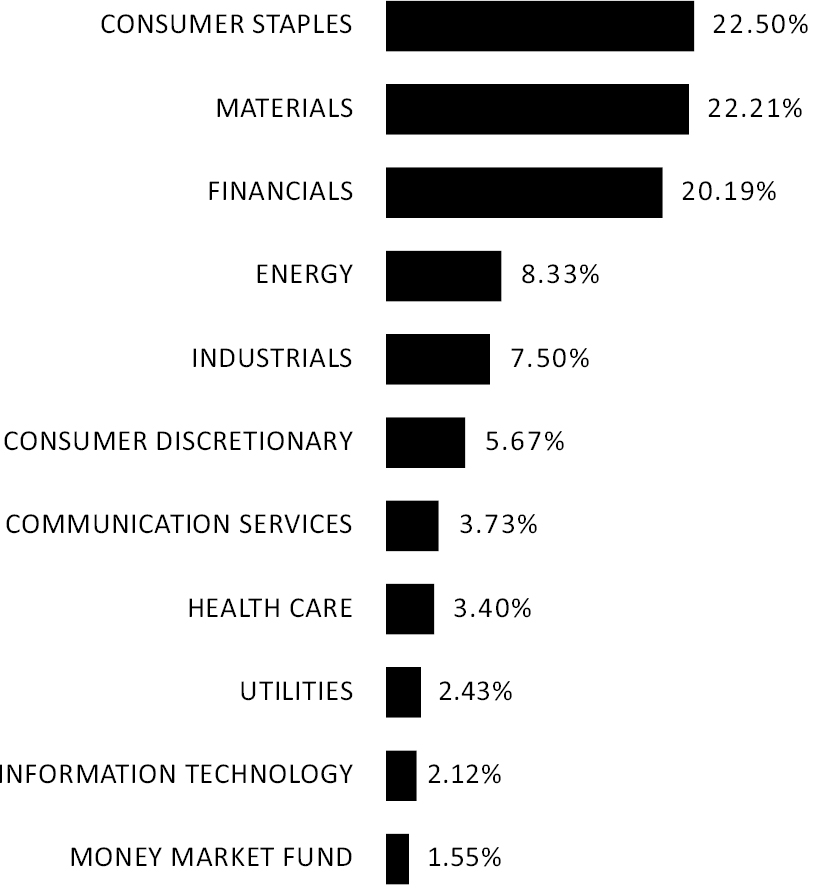
What did the Fund invest in?
(% of Net Assets as of March 31, 2026)
Sector Breakdown
Top 10 Holdings
| Vale SA | 4.48% |
| Petroleo Brasileiro SA | 3.78% |
| Banco Itau Chile SA | 3.61% |
| Southern Copper Corp. | 3.35% |
| Walmart de Mexico S.A.B. de C.V. | 3.12% |
| Lojas Renner SA | 3.11% |
| Nu Holdings Ltd. | 3.09% |
| Cemex S.A.B. de C.V. | 3.05% |
| Intercorp Financial Services, Inc. | 2.93% |
| Ambev SA | 2.92% |
| Material Changes Reorganization Effective July 11, 2025, the Fund was reorganized from a mutual fund into an exchange-traded fund (“ETF”). The Fund is the successor to the OTG Latin America Fund, a series of World Funds Trust (the “Predecessor Mutual Fund”), and continues to have the same investment objective and principal investment strategies. As a result of a reorganization, the Fund acquired all the assets and liabilities of the Predecessor Mutual Fund. Shareholders of the Predecessor Mutual Fund became shareholders of the Fund with a value equal to the aggregate net asset value of their shares of the Predecessor Mutual Fund. The Predecessor Mutual Fund commenced operations on May 8, 2019. |