Shareholder Report
Mar. 31, 2026
USD ($)
$ / shares
This report describes changes to the Fund that occurred during the reporting period.
WHAT WERE THE FUND COSTS FOR THE PAST YEAR? (based on a hypothetical $10,000 investment)
|
Class Name
|
Costs of a $10,000 investment*
|
Costs paid as a percentage of a $10,000 investment**
|
|
Class H
|
$15
|
0.48%
|
HOW DID THE FUND PERFORM LAST YEAR AND WHAT AFFECTED ITS PERFORMANCE?
|
•
|
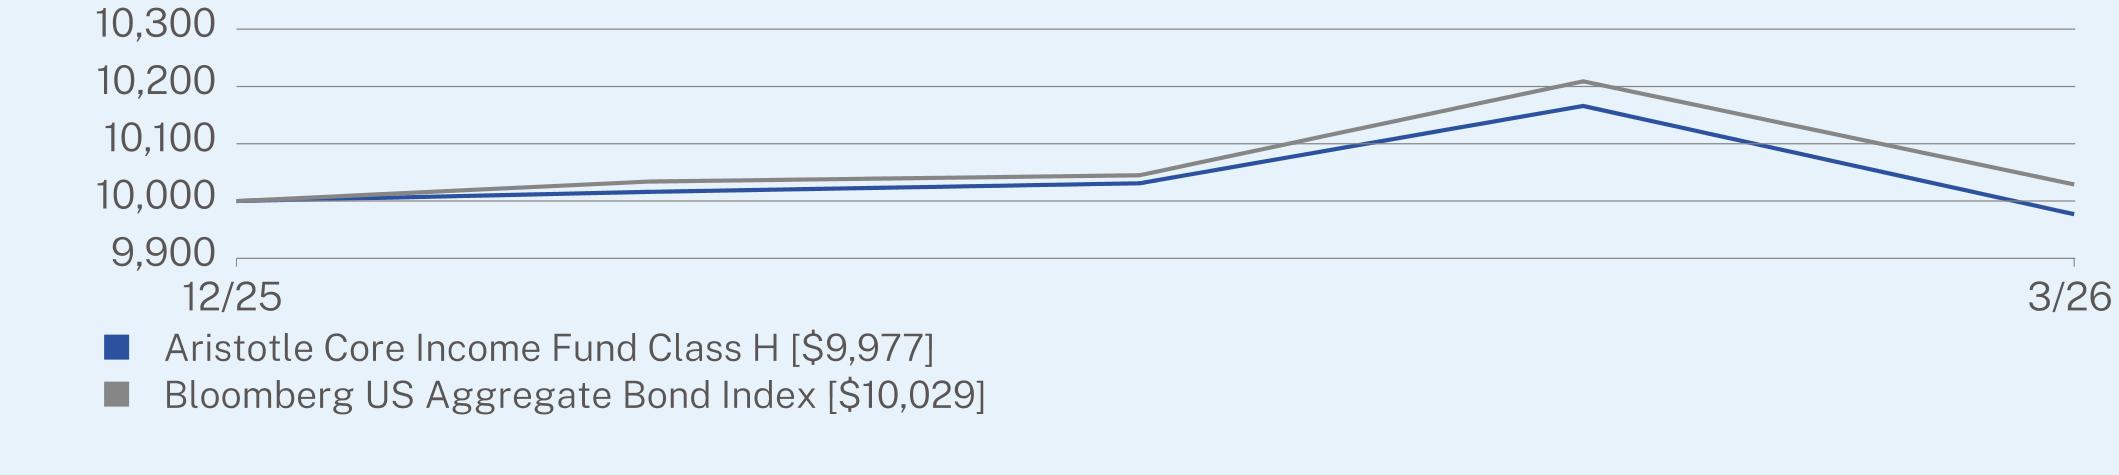
Since its inception on December 5, 2025, the Fund underperformed its performance benchmark, the Bloomberg US Aggregate Bond Index. The Fund invests principally in income-producing debt instruments.
|
|
•
|
Over the past 12 months, the U.S. Treasury yield curve transitioned toward a more normalized, upward-sloping shape, reflecting easing monetary policy expectations and an improving growth outlook; yields remained elevated relative to recent history—supporting returns—while corporate spreads also provided a favorable backdrop.
|
|
•
|
Exposure to specific credit-sensitive sectors benefited performance for most of the period as credit remained broadly supported. The intermediate positioning and historically elevated yield profile helped insulate from the full effect of episodic credit spread widening as compared to longer duration-based offerings.
|
|
•
|
By credit quality, BBB rated credits were most beneficial to performance. By asset class, investment grade corporate bonds were most beneficial to performance followed by agency mortgage exposure.
|
|
•
|
Positive contributions to relative performance were led by credit selection and asset class rotation.
|
|
•
|
While the Fund duration tactically adjusted over the last twelve months, the point-to-point duration was nearly flat. The Fund did remain close to its benchmark duration. The Fund benefited from an elevated yield environment over the period. On a year-over-year basis, we materially reduced government bond exposure, while increasing investment grade bond exposure as well as agency and non-agency mortgage-backed securities allocations.
|
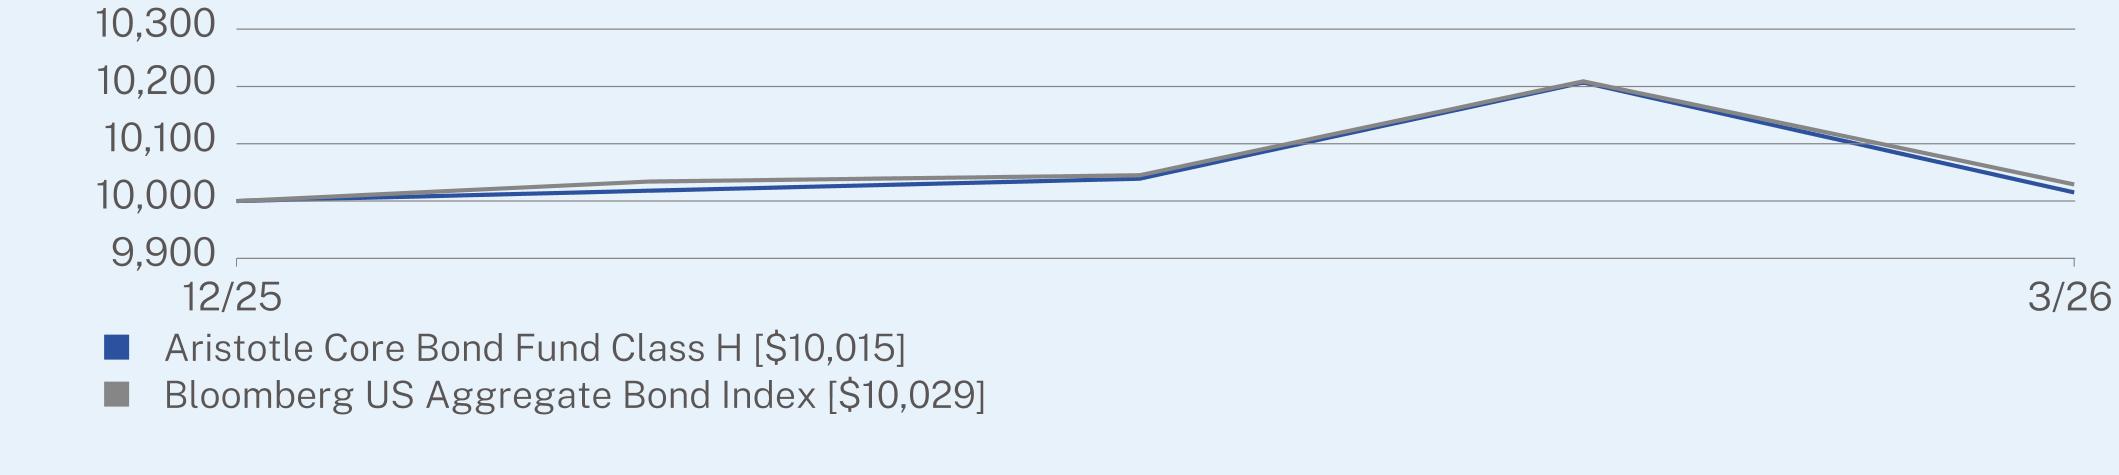
CUMULATIVE TOTAL RETURN (%)
|
|
Since Inception
(12/05/2025) |
|
Class H (without sales charge)
|
0.15
|
|
Bloomberg US Aggregate Bond Index
|
0.29
|
Visit https://www.aristotlefunds.com/resources/prospectuses-reports for more recent performance information.
KEY FUND STATISTICS (as of March 31, 2026)
|
Net Assets
|
$270,044,758
|
|
Number of Holdings
|
340
|
|
Net Advisory Fee
|
$520,753
|
|
Portfolio Turnover Rate
|
142%
|
WHAT DID THE FUND INVEST IN? (as of March 31, 2026)*
|
Top 10 Issuers
|
(%)
|
|
United States Treasury Note/Bond
|
24.8%
|
|
Federal National Mortgage Association
|
10.0%
|
|
Federal Home Loan Mortgage Corp.
|
6.7%
|
|
Ginnie Mae II Pool
|
3.3%
|
|
JPMorgan Chase & Co.
|
1.7%
|
|
Morgan Stanley
|
1.4%
|
|
Bank of America Corp.
|
1.3%
|
|
Goldman Sachs Group, Inc.
|
1.2%
|
|
GCAT
|
1.1%
|
|
Wells Fargo & Co.
|
1.0%
|
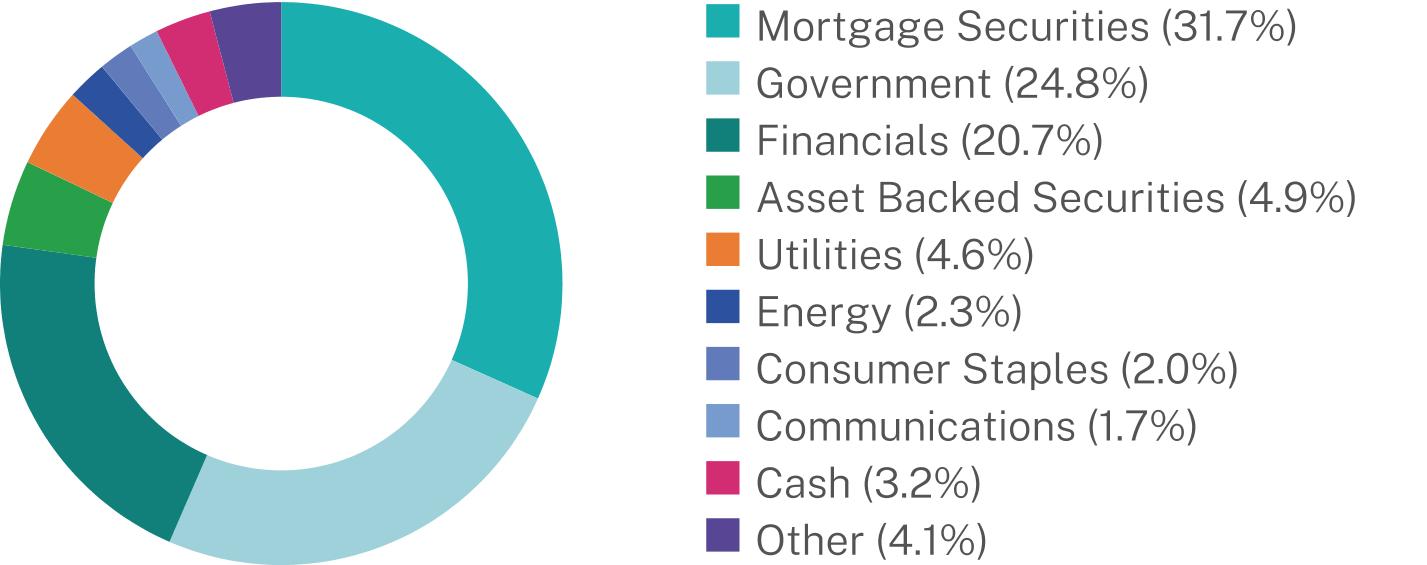
Sector Breakdown (%)

Changes to Fund’s Principal Risks:
In the Fund’s Principal Risks, Liquidity Risk, Underlying Fund Risk and Securities Lending Risk were added.
Changes to the Fund’s Principal Investment Strategy:
The Fund’s Principal Investment Strategies were revised to note that the Fund will invest at least 80% of its assets in debt securities, and that the Fund may lend its portfolio securities to generate additional income.
This report describes changes to the Fund that occurred during the reporting period.
WHAT WERE THE FUND COSTS FOR THE PAST YEAR? (based on a hypothetical $10,000 investment)
|
Class Name
|
Costs of a $10,000 investment
|
Costs paid as a percentage of a $10,000 investment
|
|
Class I
|
$48
|
0.47%
|
HOW DID THE FUND PERFORM LAST YEAR AND WHAT AFFECTED ITS PERFORMANCE?
|
•
|
For the 12-month period ended March 31, 2026, the Fund outperformed its performance benchmark, the Bloomberg US Aggregate Bond Index. The Fund invests principally in income-producing debt instruments.
|
|
•
|
Over the past 12 months, the U.S. Treasury yield curve transitioned toward a more normalized, upward-sloping shape, reflecting easing monetary policy expectations and an improving growth outlook; yields remained elevated relative to recent history—supporting returns—while corporate spreads also provided a favorable backdrop.
|
|
•
|
Exposure to specific credit-sensitive sectors benefited performance for most of the period as credit remained broadly supported. The intermediate positioning and historically elevated yield profile helped insulate from the full effect of episodic credit spread widening as compared to longer duration-based offerings.
|
|
•
|
By credit quality, BBB rated credits were most beneficial to performance. By asset class, investment grade corporate bonds were most beneficial to performance followed by agency mortgage exposure.
|
|
•
|
Positive contributions to relative performance were led by credit selection and asset class rotation.
|
|
•
|
While the Fund duration tactically adjusted over the last twelve months, the point-to-point duration was nearly flat. The Fund did remain close to its benchmark duration. The Fund benefited from an elevated yield environment over the period. On a year-over-year basis, we materially reduced government bond exposure, while increasing investment grade bond exposure as well as agency and non-agency mortgage-backed securities allocations.
|
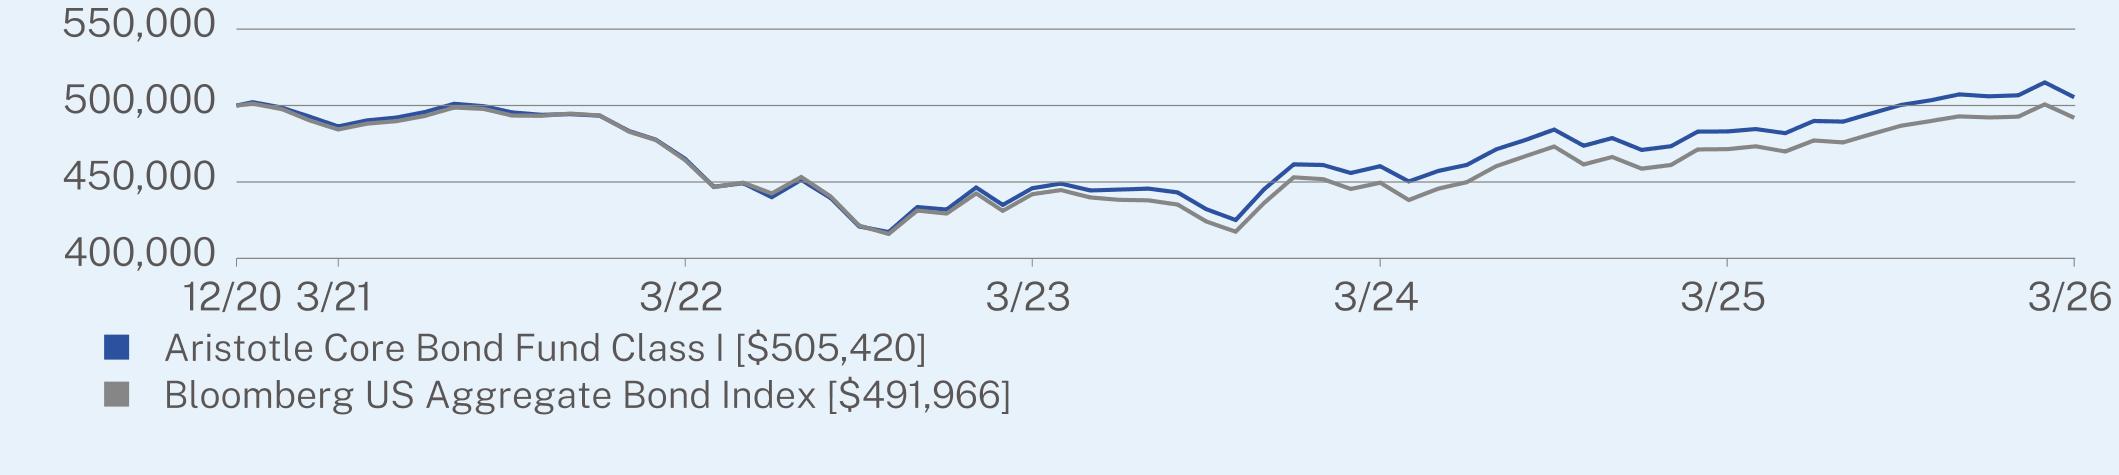
ANNUAL AVERAGE TOTAL RETURN (%)
|
|
1 Year
|
5 Year
|
Since Inception
(12/14/2020) |
|
Class I (without sales charge)
|
4.63
|
0.77
|
0.20
|
|
Bloomberg US Aggregate Bond Index
|
4.35
|
0.31
|
-0.31
|
Visit https://www.aristotlefunds.com/resources/prospectuses-reports for more recent performance information.
KEY FUND STATISTICS (as of March 31, 2026)
|
Net Assets
|
$270,044,758
|
|
Number of Holdings
|
340
|
|
Net Advisory Fee
|
$520,753
|
|
Portfolio Turnover Rate
|
142%
|
WHAT DID THE FUND INVEST IN? (as of March 31, 2026)*
|
Top 10 Issuers
|
(%)
|
|
United States Treasury Note/Bond
|
24.8%
|
|
Federal National Mortgage Association
|
10.0%
|
|
Federal Home Loan Mortgage Corp.
|
6.7%
|
|
Ginnie Mae II Pool
|
3.3%
|
|
JPMorgan Chase & Co.
|
1.7%
|
|
Morgan Stanley
|
1.4%
|
|
Bank of America Corp.
|
1.3%
|
|
Goldman Sachs Group, Inc.
|
1.2%
|
|
GCAT
|
1.1%
|
|
Wells Fargo & Co.
|
1.0%
|
Sector Breakdown (%)
Changes to Fund’s Principal Risks:
In the Fund’s Principal Risks, Liquidity Risk, Underlying Fund Risk and Securities Lending Risk were added.
Changes to the Fund’s Principal Investment Strategy:
The Fund’s Principal Investment Strategies were revised to note that the Fund will invest at least 80% of its assets in debt securities, and that the Fund may lend its portfolio securities to generate additional income.
Changes to Shareholder Fees (fees paid directly from your investment).
Effective December 29, 2025, the Fund’s Supervision and Administration Fee for Class I has been decreased from 0.13% to 0.09%. As a result, the total Management Fee has been reduced by 0.04%. In addition, the contractual fee waiver for Class I has been reduced from 0.48% to 0.44%.
This report describes changes to the Fund that occurred during the reporting period.
WHAT WERE THE FUND COSTS FOR THE PAST YEAR? (based on a hypothetical $10,000 investment)
|
Class Name
|
Costs of a $10,000 investment
|
Costs paid as a percentage of a $10,000 investment
|
|
Class I-2
|
$49
|
0.48%
|
HOW DID THE FUND PERFORM LAST YEAR AND WHAT AFFECTED ITS PERFORMANCE?
|
•
|
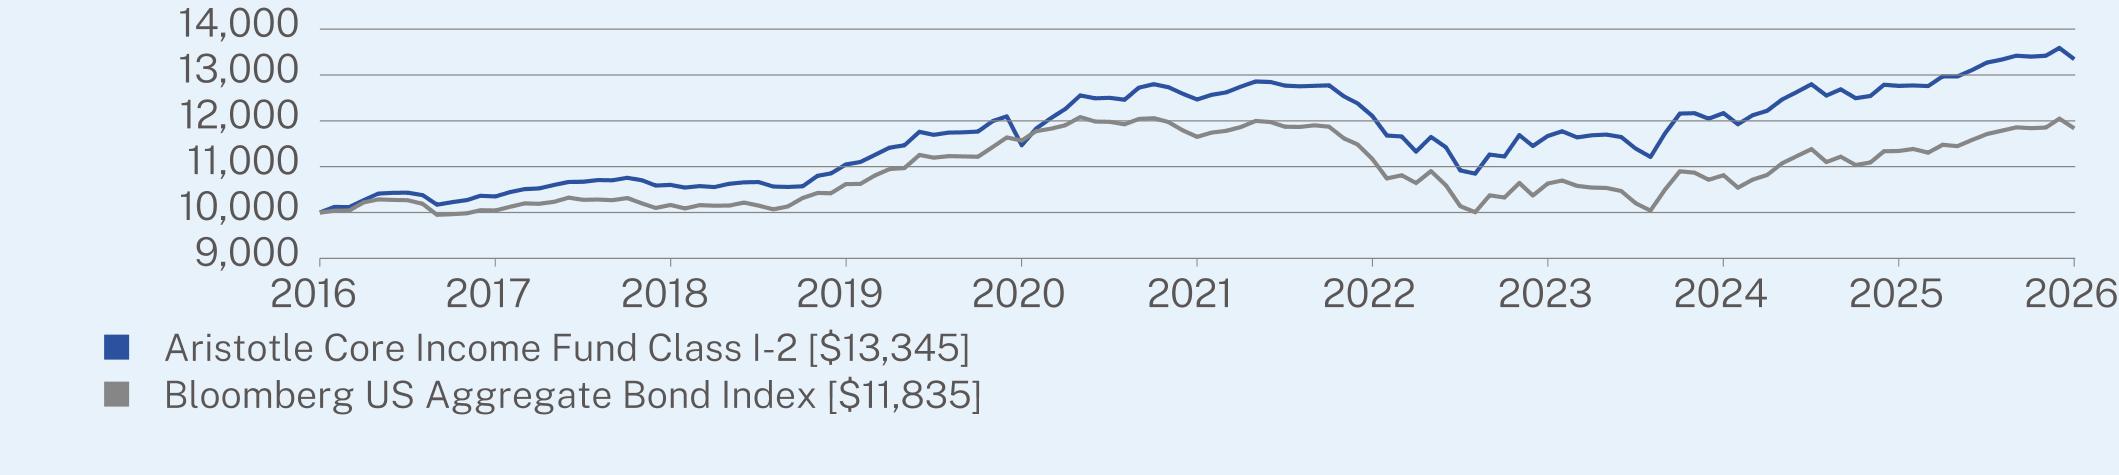
For the 12-month period ended March 31, 2026, the Fund outperformed its performance benchmark, the Bloomberg US Aggregate Bond Index. The Fund invests principally in income-producing debt instruments.
|
|
•
|
Over the past 12 months, the U.S. Treasury yield curve transitioned toward a more normalized, upward-sloping shape, reflecting easing monetary policy expectations and an improving growth outlook; yields remained elevated relative to recent history—supporting returns—while corporate spreads also provided a favorable backdrop.
|
|
•
|
Exposure to specific credit-sensitive sectors benefited performance for most of the period as credit remained broadly supported. The intermediate positioning and historically elevated yield profile helped insulate from the full effect of episodic credit spread widening as compared to longer duration-based offerings.
|
|
•
|
By credit quality, BBB rated credits were most beneficial to performance. By asset class, investment grade corporate bonds were most beneficial to performance followed by agency mortgage exposure.
|
|
•
|
Positive contributions to relative performance were led by credit selection and asset class rotation.
|
|
•
|
While the Fund duration tactically adjusted over the last twelve months, the point-to-point duration was nearly flat. The Fund did remain close to its benchmark duration. The Fund benefited from an elevated yield environment over the period. On a year-over-year basis, we materially reduced government bond exposure, while increasing investment grade bond exposure as well as agency and non-agency mortgage-backed securities allocations.
|
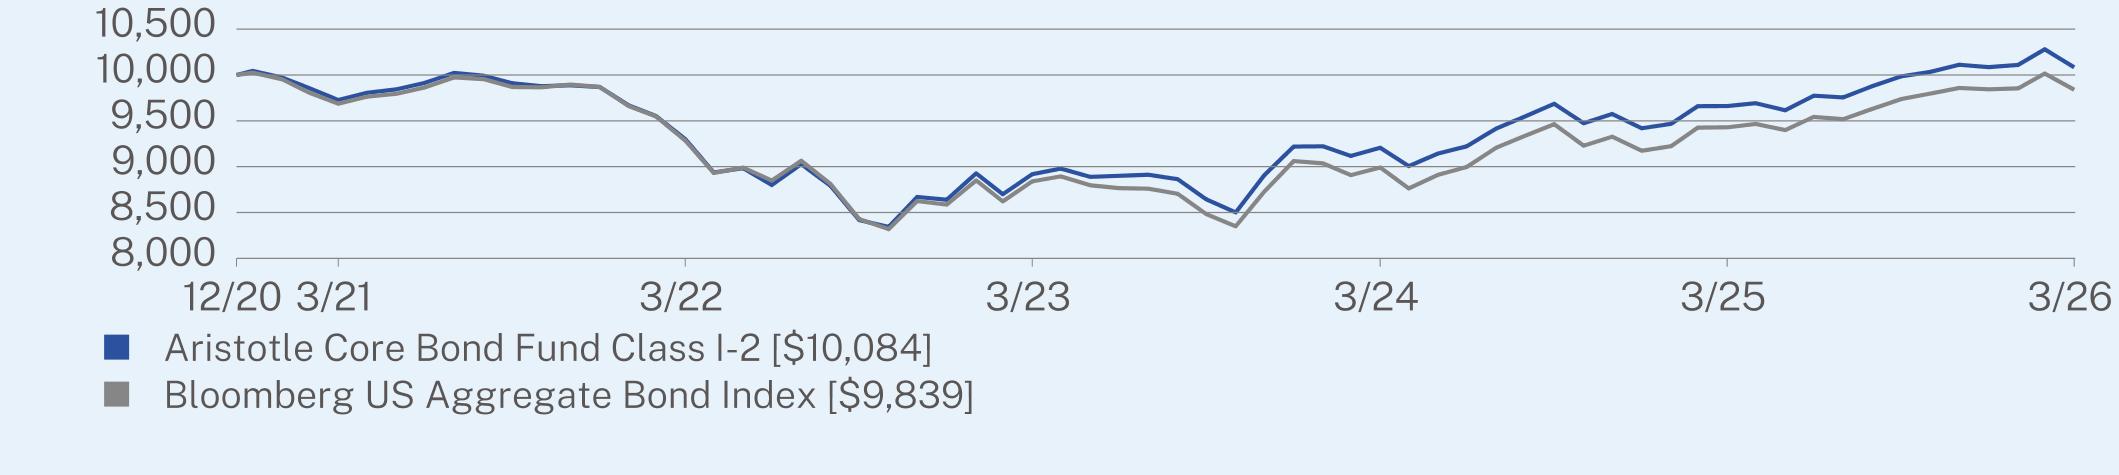
ANNUAL AVERAGE TOTAL RETURN (%)
|
|
1 Year
|
5 Year
|
Since Inception
(12/14/2020) |
|
Class I-2 (without sales charge)
|
4.39
|
0.72
|
0.16
|
|
Bloomberg US Aggregate Bond Index
|
4.35
|
0.31
|
-0.31
|
Visit https://www.aristotlefunds.com/resources/prospectuses-reports for more recent performance information.
KEY FUND STATISTICS (as of March 31, 2026)
|
Net Assets
|
$270,044,758
|
|
Number of Holdings
|
340
|
|
Net Advisory Fee
|
$520,753
|
|
Portfolio Turnover Rate
|
142%
|
WHAT DID THE FUND INVEST IN? (as of March 31, 2026)*
|
Top 10 Issuers
|
(%)
|
|
United States Treasury Note/Bond
|
24.8%
|
|
Federal National Mortgage Association
|
10.0%
|
|
Federal Home Loan Mortgage Corp.
|
6.7%
|
|
Ginnie Mae II Pool
|
3.3%
|
|
JPMorgan Chase & Co.
|
1.7%
|
|
Morgan Stanley
|
1.4%
|
|
Bank of America Corp.
|
1.3%
|
|
Goldman Sachs Group, Inc.
|
1.2%
|
|
GCAT
|
1.1%
|
|
Wells Fargo & Co.
|
1.0%
|
Sector Breakdown (%)

Changes to Fund’s Principal Risks:
In the Fund’s Principal Risks, Liquidity Risk, Underlying Fund Risk and Securities Lending Risk were added.
Changes to the Fund’s Principal Investment Strategy:
The Fund’s Principal Investment Strategies were revised to note that the Fund will invest at least 80% of its assets in debt securities, and that the Fund may lend its portfolio securities to generate additional income.
This report describes changes to the Fund that occurred during the reporting period.
WHAT WERE THE FUND COSTS FOR THE PAST YEAR? (based on a hypothetical $10,000 investment)
|
Class Name
|
Costs of a $10,000 investment
|
Costs paid as a percentage of a $10,000 investment
|
|
Class A
|
$99
|
0.90%
|
HOW DID THE FUND PERFORM LAST YEAR AND WHAT AFFECTED ITS PERFORMANCE?
|
•
|
For the 12-month period ended March 31, 2026, the Fund outperformed its performance benchmark, the S&P 500 Index. The Fund invests at least 80% of its assets in equity securities.
|
|
•
|
The outperformance of the Fund relative to the S&P 500 Index over the 1-year period was due to both security selection and sector allocation.
|
|
•
|
Security selection in information technology and consumer staples contributed the most to relative performance. Conversely, security selection in energy and materials detracted.
|
|
•
|
Guardant Health, Darling Ingredients and Broadcom were the largest contributors over the period. Meanwhile, Boston Scientific, Becton, Dickinson and Company and Ameriprise Financial were the top detractors from relative performance for the year.
|
|
•
|
From a sector allocation standpoint, underweights in consumer staples and information technology contributed to relative performance. Conversely, overweights to healthcare and industrials detracted from relative performance.
|
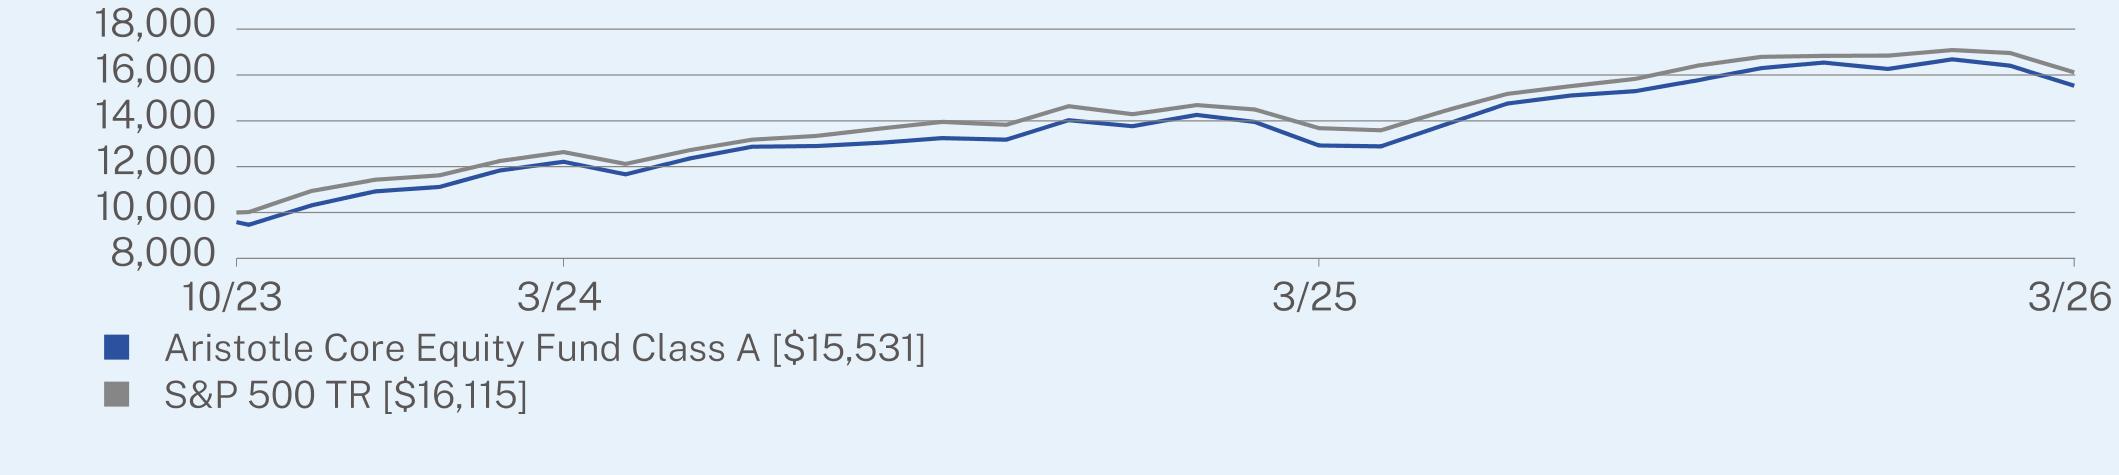
ANNUAL AVERAGE TOTAL RETURN (%)
|
|
1 Year
|
Since Inception
(10/25/2023) |
|
Class A (without sales charge)
|
20.17
|
21.98
|
|
Class A (with sales charge)
|
15.06
|
19.84
|
|
S&P 500 TR
|
17.80
|
21.67
|
Visit https://www.aristotlefunds.com/resources/prospectuses-reports for more recent performance information.
KEY FUND STATISTICS (as of March 31, 2026)
|
Net Assets
|
$518,451,973
|
|
Number of Holdings
|
54
|
|
Net Advisory Fee
|
$2,679,117
|
|
Portfolio Turnover Rate
|
16%
|
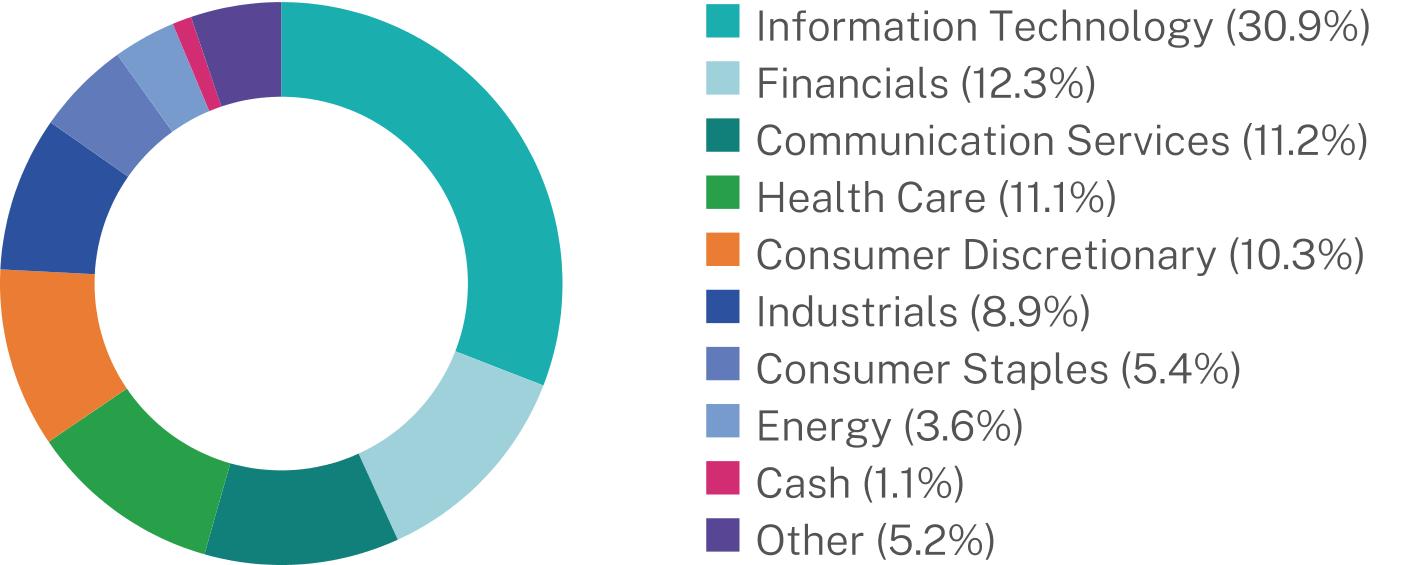
WHAT DID THE FUND INVEST IN? (as of March 31, 2026)*
|
Top 10 Issuers
|
(%)
|
|
NVIDIA Corp.
|
8.1%
|
|
Alphabet, Inc.
|
6.3%
|
|
Microsoft Corp.
|
5.8%
|
|
Apple, Inc.
|
4.8%
|
|
Broadcom, Inc.
|
4.3%
|
|
Amazon.com, Inc.
|
4.2%
|
|
Meta Platforms, Inc.
|
3.6%
|
|
Darling Ingredients, Inc.
|
2.6%
|
|
Costco Wholesale Corp.
|
2.5%
|
|
Chubb Ltd.
|
2.4%
|
Sector Breakdown (%)**
Changes to Fund’s Principal Risks:
In the Fund’s Principal Risks, Securities Lending Risk was added.
Changes to the Fund’s Principal Investment Strategy:
The Fund’s Principal Investment Strategies were revised to note that the Fund may invest in exchange traded funds and may lend its portfolio securities to generate additional income.
This report describes changes to the Fund that occurred during the reporting period.
WHAT WERE THE FUND COSTS FOR THE PAST YEAR? (based on a hypothetical $10,000 investment)
|
Class Name
|
Costs of a $10,000 investment
|
Costs paid as a percentage of a $10,000 investment
|
|
Class I
|
$72
|
0.65%
|
HOW DID THE FUND PERFORM LAST YEAR AND WHAT AFFECTED ITS PERFORMANCE?
|
•
|
For the 12-month period ended March 31, 2026, the Fund outperformed its performance benchmark, the S&P 500 Index. The Fund invests at least 80% of its assets in equity securities.
|
|
•
|
The outperformance of the Fund relative to the S&P 500 Index over the 1-year period was due to both security selection and sector allocation.
|
|
•
|
Security selection in information technology and consumer staples contributed the most to relative performance. Conversely, security selection in energy and materials detracted.
|
|
•
|
Guardant Health, Darling Ingredients and Broadcom were the largest contributors over the period. Meanwhile, Boston Scientific, Becton, Dickinson and Company and Ameriprise Financial were the top detractors from relative performance for the year.
|
|
•
|
From a sector allocation standpoint, underweights in consumer staples and information technology contributed to relative performance. Conversely, overweights to healthcare and industrials detracted from relative performance.
|
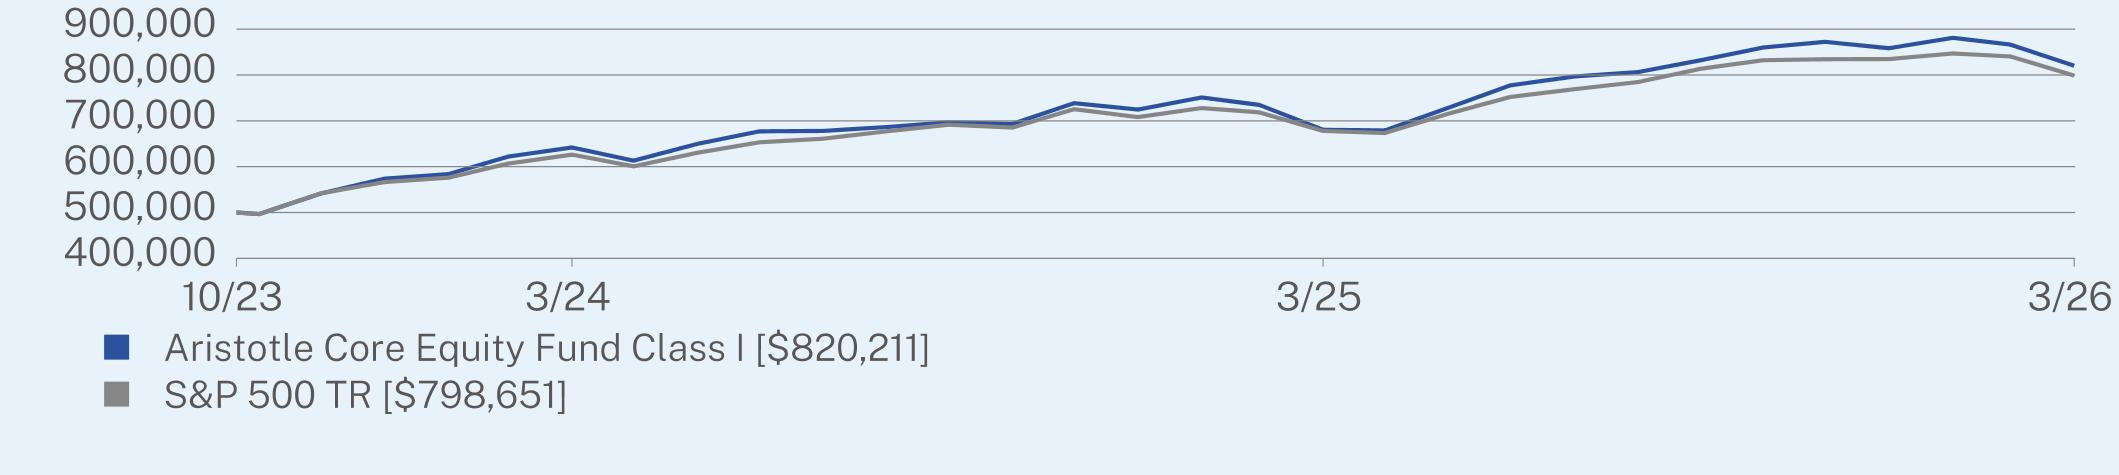
ANNUAL AVERAGE TOTAL RETURN (%)
|
|
1 Year
|
Since Inception
(10/20/2023) |
|
Class I (without sales charge)
|
20.53
|
22.42
|
|
S&P 500 TR
|
17.80
|
21.10
|
Visit https://www.aristotlefunds.com/resources/prospectuses-reports for more recent performance information.
KEY FUND STATISTICS (as of March 31, 2026)
|
Net Assets
|
$518,451,973
|
|
Number of Holdings
|
54
|
|
Net Advisory Fee
|
$2,679,117
|
|
Portfolio Turnover Rate
|
16%
|
WHAT DID THE FUND INVEST IN? (as of March 31, 2026)*
|
Top 10 Issuers
|
(%)
|
|
NVIDIA Corp.
|
8.1%
|
|
Alphabet, Inc.
|
6.3%
|
|
Microsoft Corp.
|
5.8%
|
|
Apple, Inc.
|
4.8%
|
|
Broadcom, Inc.
|
4.3%
|
|
Amazon.com, Inc.
|
4.2%
|
|
Meta Platforms, Inc.
|
3.6%
|
|
Darling Ingredients, Inc.
|
2.6%
|
|
Costco Wholesale Corp.
|
2.5%
|
|
Chubb Ltd.
|
2.4%
|
Sector Breakdown (%)**

Changes to Fund’s Principal Risks:
In the Fund’s Principal Risks, Securities Lending Risk was added.
Changes to the Fund’s Principal Investment Strategy:
The Fund’s Principal Investment Strategies were revised to note that the Fund may invest in exchange traded funds and may lend its portfolio securities to generate additional income.
This report describes changes to the Fund that occurred during the reporting period.
WHAT WERE THE FUND COSTS FOR THE PAST YEAR? (based on a hypothetical $10,000 investment)
|
Class Name
|
Costs of a $10,000 investment
|
Costs paid as a percentage of a $10,000 investment
|
|
Class I-2
|
$72
|
0.65%
|
HOW DID THE FUND PERFORM LAST YEAR AND WHAT AFFECTED ITS PERFORMANCE?
|
•
|
For the 12-month period ended March 31, 2026, the Fund outperformed its performance benchmark, the S&P 500 Index. The Fund invests at least 80% of its assets in equity securities.
|
|
•
|
The outperformance of the Fund relative to the S&P 500 Index over the 1-year period was due to both security selection and sector allocation.
|
|
•
|
Security selection in information technology and consumer staples contributed the most to relative performance. Conversely, security selection in energy and materials detracted.
|
|
•
|
Guardant Health, Darling Ingredients and Broadcom were the largest contributors over the period. Meanwhile, Boston Scientific, Becton, Dickinson and Company and Ameriprise Financial were the top detractors from relative performance for the year.
|
|
•
|
From a sector allocation standpoint, underweights in consumer staples and information technology contributed to relative performance. Conversely, overweights to healthcare and industrials detracted from relative performance.
|
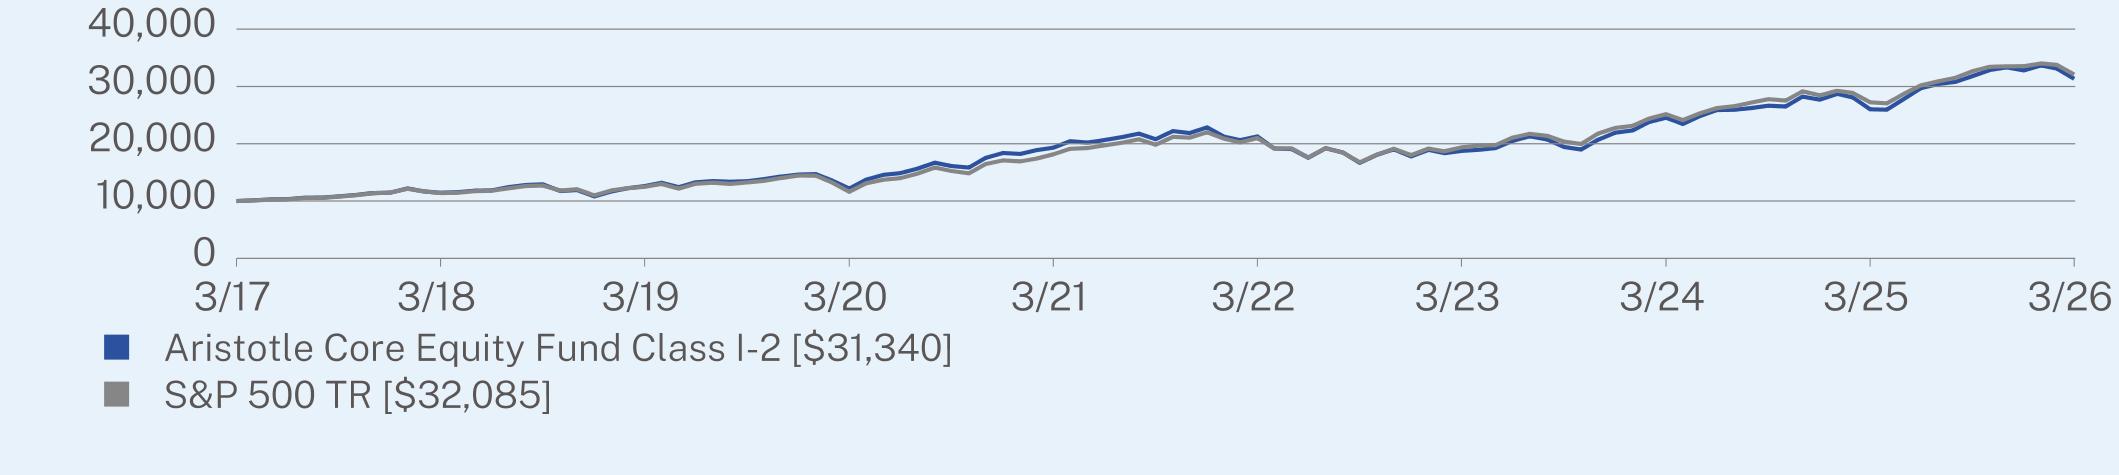
ANNUAL AVERAGE TOTAL RETURN (%)
|
|
1 Year
|
5 Year
|
Since Inception
(03/31/2017) |
|
Class I-2 (without sales charge)
|
20.47
|
10.17
|
13.53
|
|
S&P 500 TR
|
17.80
|
12.06
|
13.83
|
Visit https://www.aristotlefunds.com/resources/prospectuses-reports for more recent performance information.
KEY FUND STATISTICS (as of March 31, 2026)
|
Net Assets
|
$518,451,973
|
|
Number of Holdings
|
54
|
|
Net Advisory Fee
|
$2,679,117
|
|
Portfolio Turnover Rate
|
16%
|
WHAT DID THE FUND INVEST IN? (as of March 31, 2026)*
|
Top 10 Issuers
|
(%)
|
|
NVIDIA Corp.
|
8.1%
|
|
Alphabet, Inc.
|
6.3%
|
|
Microsoft Corp.
|
5.8%
|
|
Apple, Inc.
|
4.8%
|
|
Broadcom, Inc.
|
4.3%
|
|
Amazon.com, Inc.
|
4.2%
|
|
Meta Platforms, Inc.
|
3.6%
|
|
Darling Ingredients, Inc.
|
2.6%
|
|
Costco Wholesale Corp.
|
2.5%
|
|
Chubb Ltd.
|
2.4%
|
Sector Breakdown (%)**

Changes to Fund’s Principal Risks:
In the Fund’s Principal Risks, Securities Lending Risk was added.
Changes to the Fund’s Principal Investment Strategy:
The Fund’s Principal Investment Strategies were revised to note that the Fund may invest in exchange traded funds and may lend its portfolio securities to generate additional income.
This report describes changes to the Fund that occurred during the reporting period.
WHAT WERE THE FUND COSTS FOR THE PAST YEAR? (based on a hypothetical $10,000 investment)
|
Class Name
|
Costs of a $10,000 investment
|
Costs paid as a percentage of a $10,000 investment
|
|
Class A
|
$87
|
0.85%
|
HOW DID THE FUND PERFORM LAST YEAR AND WHAT AFFECTED ITS PERFORMANCE?
|
•
|
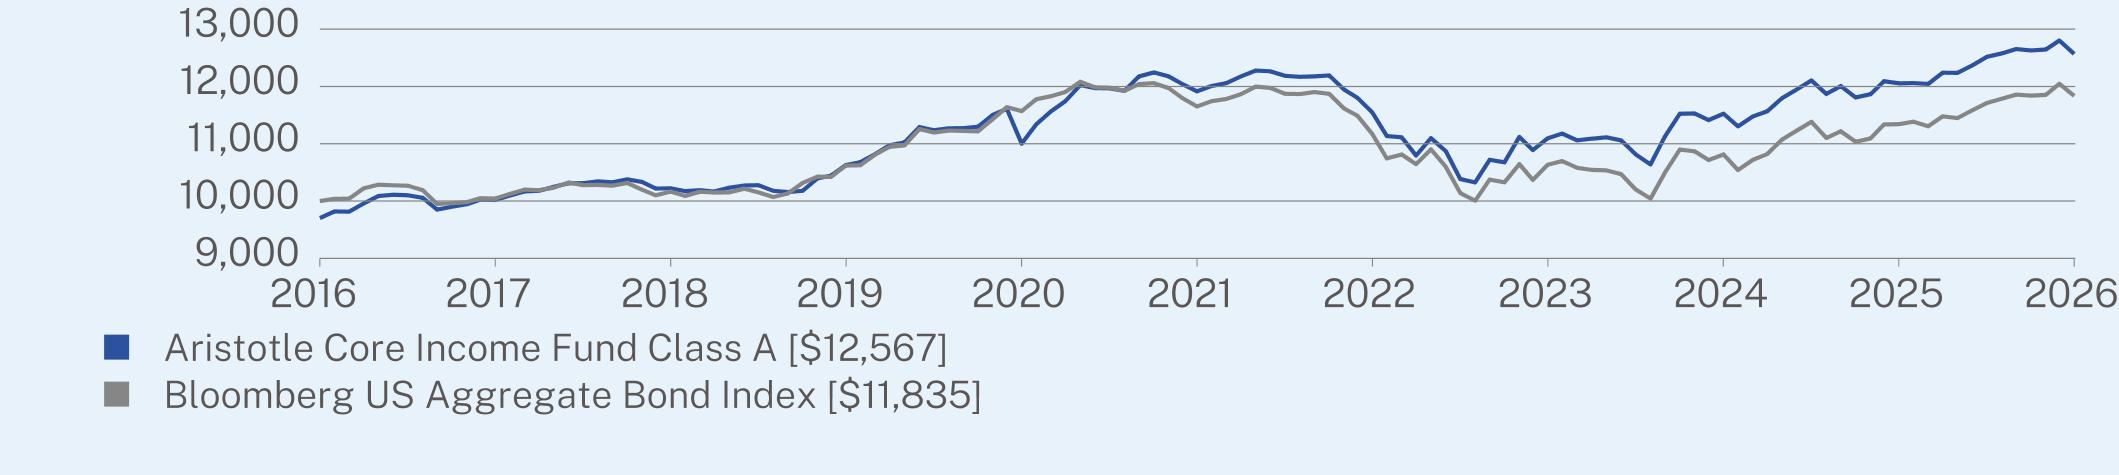
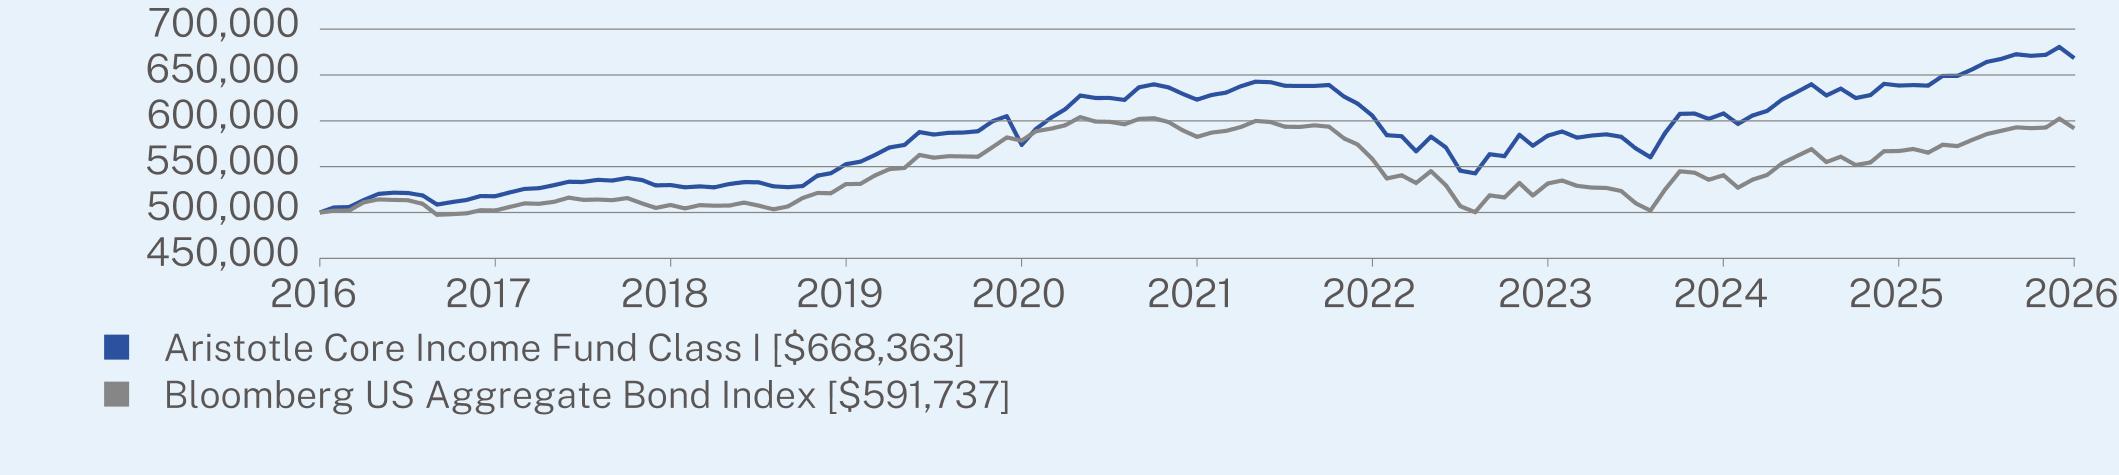
For the 12-month period ended March 31, 2026, the Fund underperformed its performance benchmark, the Bloomberg US Aggregate Bond Index. The Fund invests principally in income-producing debt instruments.
|
|
•
|
Over the past 12 months, the U.S. Treasury yield curve transitioned toward a more normalized, upward-sloping shape, reflecting easing monetary policy expectations and an improving growth outlook; yields remained elevated relative to recent history—supporting returns—while corporate spreads also provided a favorable backdrop.
|
|
•
|
Exposure to specific credit-sensitive sectors benefited performance for most of the period as credit remained broadly supported. The intermediate positioning and historically elevated yield profile helped insulate from the full effect of episodic credit spread widening as compared to longer duration-based offerings.
|
|
•
|
By credit quality, BBB rated credits were most beneficial to performance. By asset class, investment grade corporate bonds were most beneficial to performance followed by agency mortgage exposure.
|
|
•
|
Positive contributions to relative performance were led by credit selection and asset class rotation.
|
|
•
|
While the Fund slightly increased its duration profile over the last twelve months but remained very close to benchmark duration. The Fund benefited from an elevated yield environment over the period. On a year-over-year basis, we increased exposures to investment grade corporate bonds as well as agency and non-agency mortgage-backed securities. The Fund reduced its government and floating rate loan exposures over the period.
|
ANNUAL AVERAGE TOTAL RETURN (%)
|
|
1 Year
|
5 Year
|
10 Year
|
|
Class A (without sales charge)
|
4.26
|
1.07
|
2.62
|
|
Class A (with sales charge)
|
-0.20
|
0.19
|
2.18
|
|
Bloomberg US Aggregate Bond Index
|
4.35
|
0.31
|
1.70
|
Visit https://www.aristotlefunds.com/resources/prospectuses-reports for more recent performance information.
KEY FUND STATISTICS (as of March 31, 2026)
|
Net Assets
|
$3,112,880,365
|
|
Number of Holdings
|
496
|
|
Net Advisory Fee
|
$12,409,806
|
|
Portfolio Turnover Rate
|
76%
|
WHAT DID THE FUND INVEST IN? (as of March 31, 2026)*
|
Top 10 Issuers
|
(%)
|
|
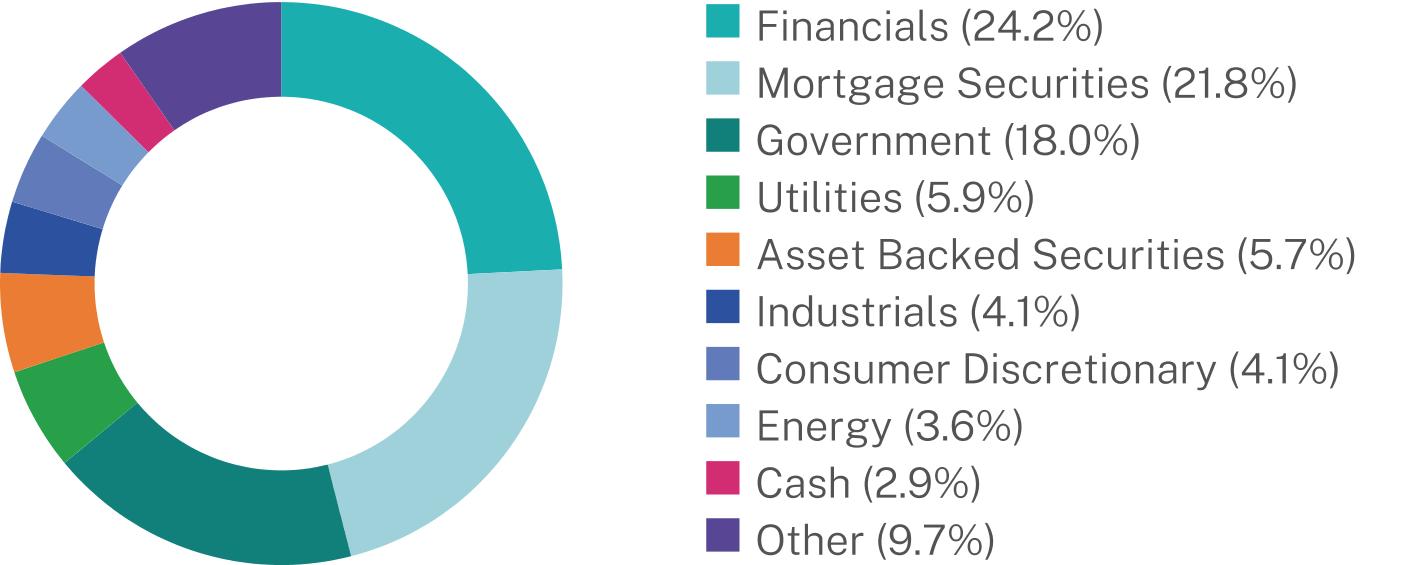
United States Treasury Note/Bond
|
18.1%
|
|
Federal National Mortgage Association
|
8.3%
|
|
Federal Home Loan Mortgage Corp.
|
4.3%
|
|
JPMorgan Chase & Co.
|
1.9%
|
|
Ginnie Mae II Pool
|
1.7%
|
|
Morgan Stanley
|
1.0%
|
|
Bank of America Corp.
|
1.0%
|
|
Freddie Mac Seasoned Credit Risk Transfer Trust
|
0.7%
|
|
A&D Mortgage LLC
|
0.4%
|
|
Transdigm, Inc.
|
0.4%
|
Sector Breakdown (%)
Changes to Fund’s Principal Risks:
In the Fund’s Principal Risks, Financial Sector Risk and Securities Lending Risk were added.
Changes to the Fund’s Principal Investment Strategy:
The Fund’s Principal Investment Strategies were revised to note that the Fund may lend its portfolio securities to generate additional income.
Changes to Fund’s Portfolio Manager or Portfolio Management Team:
Effective December 29, 2025, Jeff Klingelhofer, CFA, was added as a Portfolio Manager of Aristotle Core Income Fund.
This report describes changes to the Fund that occurred during the reporting period.
WHAT WERE THE FUND COSTS FOR THE PAST YEAR? (based on a hypothetical $10,000 investment)
|
Class Name
|
Costs of a $10,000 investment
|
Costs paid as a percentage of a $10,000 investment
|
|
Class C
|
$163
|
1.60%
|
HOW DID THE FUND PERFORM LAST YEAR AND WHAT AFFECTED ITS PERFORMANCE?
|
•
|
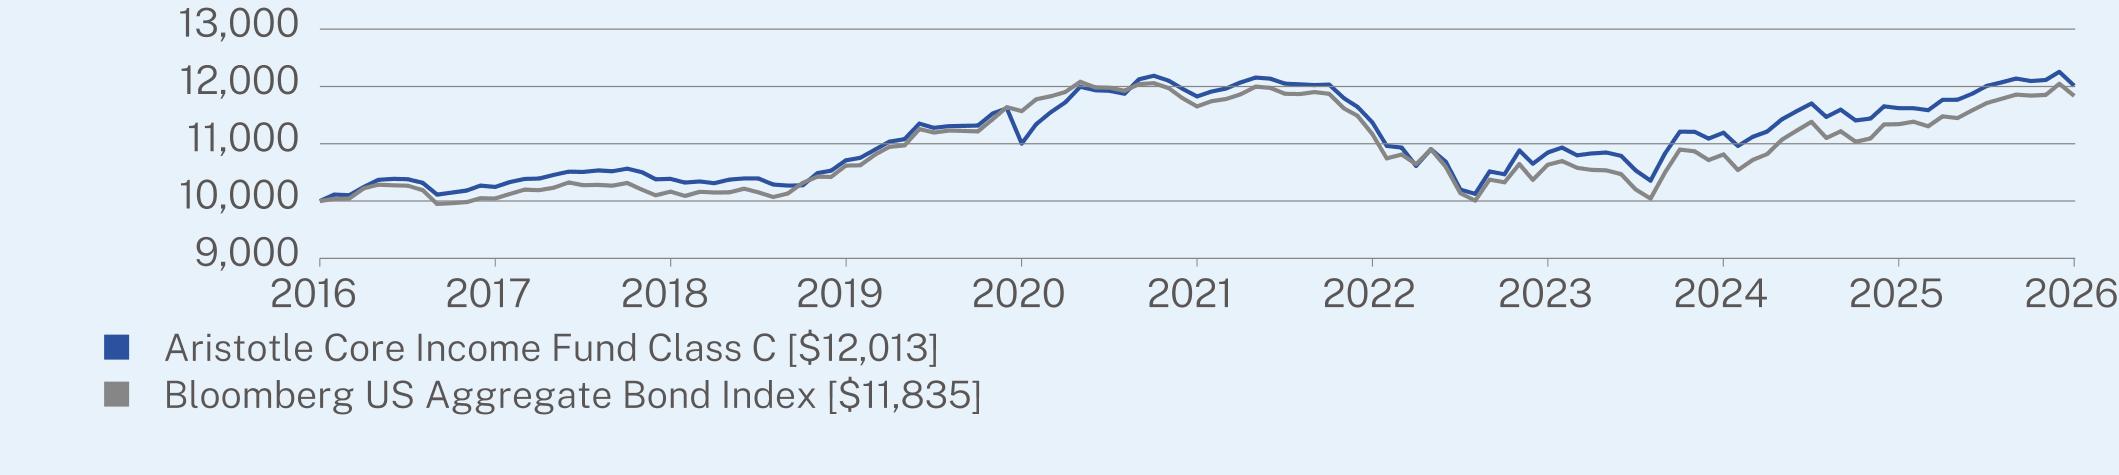
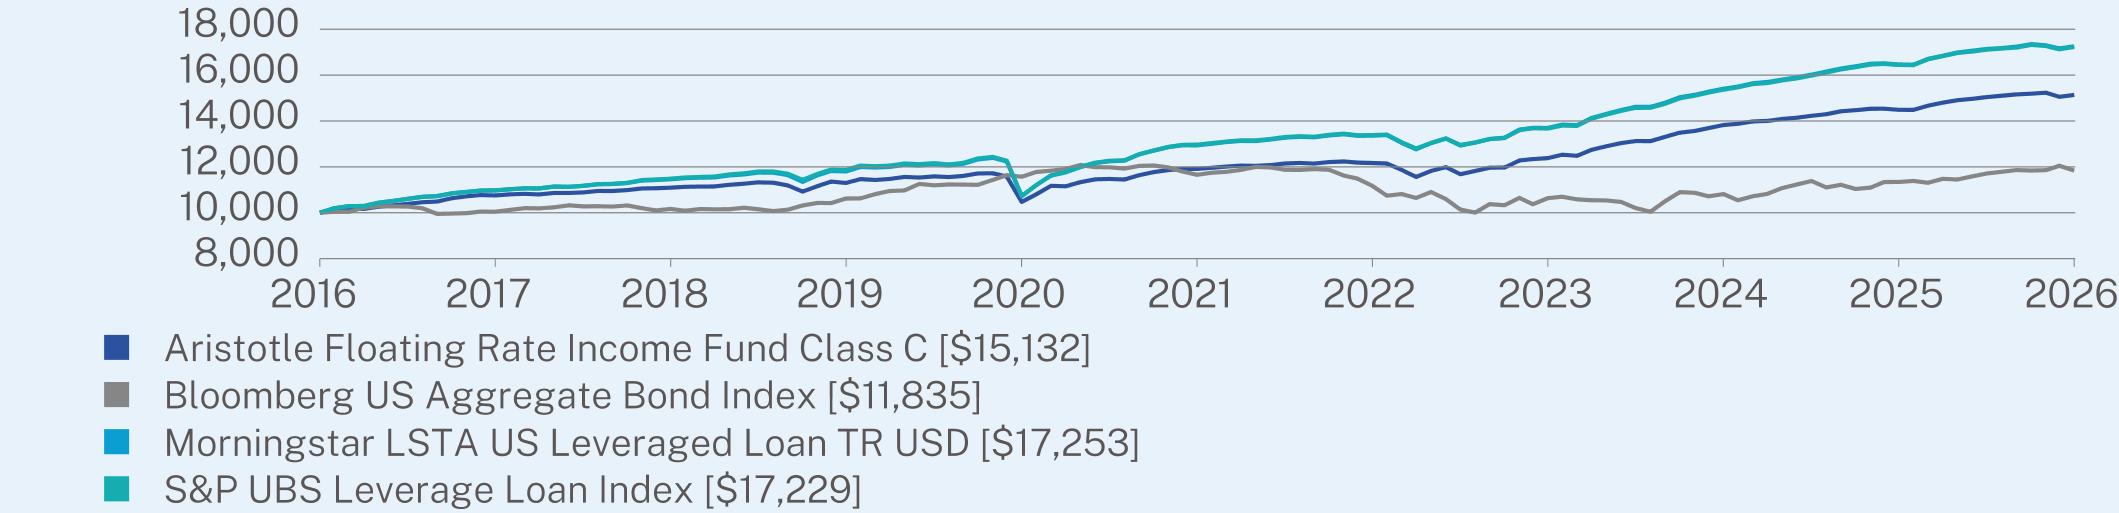
For the 12-month period ended March 31, 2026, the Fund underperformed its performance benchmark, the Bloomberg US Aggregate Bond Index. The Fund invests principally in income-producing debt instruments.
|
|
•
|
Over the past 12 months, the U.S. Treasury yield curve transitioned toward a more normalized, upward-sloping shape, reflecting easing monetary policy expectations and an improving growth outlook; yields remained elevated relative to recent history—supporting returns—while corporate spreads also provided a favorable backdrop.
|
|
•
|
Exposure to specific credit-sensitive sectors benefited performance for most of the period as credit remained broadly supported. The intermediate positioning and historically elevated yield profile helped insulate from the full effect of episodic credit spread widening as compared to longer duration-based offerings.
|
|
•
|
By credit quality, BBB rated credits were most beneficial to performance. By asset class, investment grade corporate bonds were most beneficial to performance followed by agency mortgage exposure.
|
|
•
|
Positive contributions to relative performance were led by credit selection and asset class rotation.
|
|
•
|
While the Fund slightly increased its duration profile over the last twelve months but remained very close to benchmark duration. The Fund benefited from an elevated yield environment over the period. On a year-over-year basis, we increased exposures to investment grade corporate bonds as well as agency and non-agency mortgage-backed securities. The Fund reduced its government and floating rate loan exposures over the period.
|
ANNUAL AVERAGE TOTAL RETURN (%)
|
|
1 Year
|
5 Year
|
10 Year
|
|
Class C (without sales charge)
|
3.37
|
0.31
|
1.85
|
|
Class C (with sales charge)
|
2.37
|
0.31
|
1.85
|
|
Bloomberg US Aggregate Bond Index
|
4.35
|
0.31
|
1.70
|
Visit https://www.aristotlefunds.com/resources/prospectuses-reports for more recent performance information.
KEY FUND STATISTICS (as of March 31, 2026)
|
Net Assets
|
$3,112,880,365
|
|
Number of Holdings
|
496
|
|
Net Advisory Fee
|
$12,409,806
|
|
Portfolio Turnover Rate
|
76%
|
WHAT DID THE FUND INVEST IN? (as of March 31, 2026)*
|
Top 10 Issuers
|
(%)
|
|
United States Treasury Note/Bond
|
18.1%
|
|
Federal National Mortgage Association
|
8.3%
|
|
Federal Home Loan Mortgage Corp.
|
4.3%
|
|
JPMorgan Chase & Co.
|
1.9%
|
|
Ginnie Mae II Pool
|
1.7%
|
|
Morgan Stanley
|
1.0%
|
|
Bank of America Corp.
|
1.0%
|
|
Freddie Mac Seasoned Credit Risk Transfer Trust
|
0.7%
|
|
A&D Mortgage LLC
|
0.4%
|
|
Transdigm, Inc.
|
0.4%
|
Sector Breakdown (%)

Changes to Fund’s Principal Risks:
In the Fund’s Principal Risks, Financial Sector Risk and Securities Lending Risk were added.
Changes to the Fund’s Principal Investment Strategy:
The Fund’s Principal Investment Strategies were revised to note that the Fund may lend its portfolio securities to generate additional income.
Changes to Fund’s Portfolio Manager or Portfolio Management Team:
Effective December 29, 2025, Jeff Klingelhofer, CFA, was added as a Portfolio Manager of Aristotle Core Income Fund.
This report describes changes to the Fund that occurred during the reporting period.
WHAT WERE THE FUND COSTS FOR THE PAST YEAR? (based on a hypothetical $10,000 investment)
|
Class Name
|
Costs of a $10,000 investment*
|
Costs paid as a percentage of a $10,000 investment**
|
|
Class H
|
$15
|
0.46%
|
HOW DID THE FUND PERFORM LAST YEAR AND WHAT AFFECTED ITS PERFORMANCE?
|
•
|
Since its inception on December 5, 2025, the Fund underperformed its performance benchmark, the Bloomberg US Aggregate Bond Index. The Fund invests principally in income-producing debt instruments.
|
|
•
|
Over the past 12 months, the U.S. Treasury yield curve transitioned toward a more normalized, upward-sloping shape, reflecting easing monetary policy expectations and an improving growth outlook; yields remained elevated relative to recent history—supporting returns—while corporate spreads also provided a favorable backdrop.
|
|
•
|
Exposure to specific credit-sensitive sectors benefited performance for most of the period as credit remained broadly supported. The intermediate positioning and historically elevated yield profile helped insulate from the full effect of episodic credit spread widening as compared to longer duration-based offerings.
|
|
•
|
By credit quality, BBB rated credits were most beneficial to performance. By asset class, investment grade corporate bonds were most beneficial to performance followed by agency mortgage exposure.
|
|
•
|
Positive contributions to relative performance were led by credit selection and asset class rotation.
|
|
•
|
While the Fund slightly increased its duration profile over the last twelve months but remained very close to benchmark duration. The Fund benefited from an elevated yield environment over the period. On a year-over-year basis, we increased exposures to investment grade corporate bonds as well as agency and non-agency mortgage-backed securities. The Fund reduced its government and floating rate loan exposures over the period.
|
CUMULATIVE TOTAL RETURN (%)
|
|
Since Inception
(12/05/2025) |
|
Class H (without sales charge)
|
-0.23
|
|
Bloomberg US Aggregate Bond Index
|
0.29
|
Visit https://www.aristotlefunds.com/resources/prospectuses-reports for more recent performance information.
KEY FUND STATISTICS (as of March 31, 2026)
|
Net Assets
|
$3,112,880,365
|
|
Number of Holdings
|
496
|
|
Net Advisory Fee
|
$12,409,806
|
|
Portfolio Turnover Rate
|
76%
|
WHAT DID THE FUND INVEST IN? (as of March 31, 2026)*
|
Top 10 Issuers
|
(%)
|
|
United States Treasury Note/Bond
|
18.1%
|
|
Federal National Mortgage Association
|
8.3%
|
|
Federal Home Loan Mortgage Corp.
|
4.3%
|
|
JPMorgan Chase & Co.
|
1.9%
|
|
Ginnie Mae II Pool
|
1.7%
|
|
Morgan Stanley
|
1.0%
|
|
Bank of America Corp.
|
1.0%
|
|
Freddie Mac Seasoned Credit Risk Transfer Trust
|
0.7%
|
|
A&D Mortgage LLC
|
0.4%
|
|
Transdigm, Inc.
|
0.4%
|
Sector Breakdown (%)

Changes to Fund’s Principal Risks:
In the Fund’s Principal Risks, Financial Sector Risk and Securities Lending Risk were added.
Changes to the Fund’s Principal Investment Strategy:
The Fund’s Principal Investment Strategies were revised to note that the Fund may lend its portfolio securities to generate additional income.
Changes to Fund’s Portfolio Manager or Portfolio Management Team:
Effective December 29, 2025, Jeff Klingelhofer, CFA, was added as a Portfolio Manager of Aristotle Core Income Fund.
This report describes changes to the Fund that occurred during the reporting period.
WHAT WERE THE FUND COSTS FOR THE PAST YEAR? (based on a hypothetical $10,000 investment)
|
Class Name
|
Costs of a $10,000 investment
|
Costs paid as a percentage of a $10,000 investment
|
|
Class I
|
$46
|
0.45%
|
HOW DID THE FUND PERFORM LAST YEAR AND WHAT AFFECTED ITS PERFORMANCE?
|
•
|
For the 12-month period ended March 31, 2026, the Fund outperformed its performance benchmark, the Bloomberg US Aggregate Bond Index. The Fund invests principally in income-producing debt instruments.
|
|
•
|
Over the past 12 months, the U.S. Treasury yield curve transitioned toward a more normalized, upward-sloping shape, reflecting easing monetary policy expectations and an improving growth outlook; yields remained elevated relative to recent history—supporting returns—while corporate spreads also provided a favorable backdrop.
|
|
•
|
Exposure to specific credit-sensitive sectors benefited performance for most of the period as credit remained broadly supported. The intermediate positioning and historically elevated yield profile helped insulate from the full effect of episodic credit spread widening as compared to longer duration-based offerings.
|
|
•
|
By credit quality, BBB rated credits were most beneficial to performance. By asset class, investment grade corporate bonds were most beneficial to performance followed by agency mortgage exposure.
|
|
•
|
Positive contributions to relative performance were led by credit selection and asset class rotation.
|
|
•
|
While the Fund slightly increased its duration profile over the last twelve months but remained very close to benchmark duration. The Fund benefited from an elevated yield environment over the period. On a year-over-year basis, we increased exposures to investment grade corporate bonds as well as agency and non-agency mortgage-backed securities. The Fund reduced its government and floating rate loan exposures over the period.
|
ANNUAL AVERAGE TOTAL RETURN (%)
|
|
1 Year
|
5 Year
|
10 Year
|
|
Class I (without sales charge)
|
4.67
|
1.41
|
2.94
|
|
Bloomberg US Aggregate Bond Index
|
4.35
|
0.31
|
1.70
|
Visit https://www.aristotlefunds.com/resources/prospectuses-reports for more recent performance information.
KEY FUND STATISTICS (as of March 31, 2026)
|
Net Assets
|
$3,112,880,365
|
|
Number of Holdings
|
496
|
|
Net Advisory Fee
|
$12,409,806
|
|
Portfolio Turnover Rate
|
76%
|
WHAT DID THE FUND INVEST IN? (as of March 31, 2026)*
|
Top 10 Issuers
|
(%)
|
|
United States Treasury Note/Bond
|
18.1%
|
|
Federal National Mortgage Association
|
8.3%
|
|
Federal Home Loan Mortgage Corp.
|
4.3%
|
|
JPMorgan Chase & Co.
|
1.9%
|
|
Ginnie Mae II Pool
|
1.7%
|
|
Morgan Stanley
|
1.0%
|
|
Bank of America Corp.
|
1.0%
|
|
Freddie Mac Seasoned Credit Risk Transfer Trust
|
0.7%
|
|
A&D Mortgage LLC
|
0.4%
|
|
Transdigm, Inc.
|
0.4%
|
Sector Breakdown (%)

Changes to Fund’s Principal Risks:
In the Fund’s Principal Risks, Financial Sector Risk and Securities Lending Risk were added.
Changes to the Fund’s Principal Investment Strategy:
The Fund’s Principal Investment Strategies were revised to note that the Fund may lend its portfolio securities to generate additional income.
Changes to Fund’s Portfolio Manager or Portfolio Management Team:
Effective December 29, 2025, Jeff Klingelhofer, CFA, was added as a Portfolio Manager of Aristotle Core Income Fund.
This report describes changes to the Fund that occurred during the reporting period.
WHAT WERE THE FUND COSTS FOR THE PAST YEAR? (based on a hypothetical $10,000 investment)
|
Class Name
|
Costs of a $10,000 investment
|
Costs paid as a percentage of a $10,000 investment
|
|
Class I-2
|
$56
|
0.55%
|
HOW DID THE FUND PERFORM LAST YEAR AND WHAT AFFECTED ITS PERFORMANCE?
|
•
|
For the 12-month period ended March 31, 2026, the Fund outperformed its performance benchmark, the Bloomberg US Aggregate Bond Index. The Fund invests principally in income-producing debt instruments.
|
|
•
|
Over the past 12 months, the U.S. Treasury yield curve transitioned toward a more normalized, upward-sloping shape, reflecting easing monetary policy expectations and an improving growth outlook; yields remained elevated relative to recent history—supporting returns—while corporate spreads also provided a favorable backdrop.
|
|
•
|
Exposure to specific credit-sensitive sectors benefited performance for most of the period as credit remained broadly supported. The intermediate positioning and historically elevated yield profile helped insulate from the full effect of episodic credit spread widening as compared to longer duration-based offerings.
|
|
•
|
By credit quality, BBB rated credits were most beneficial to performance. By asset class, investment grade corporate bonds were most beneficial to performance followed by agency mortgage exposure.
|
|
•
|
Positive contributions to relative performance were led by credit selection and asset class rotation.
|
|
•
|
While the Fund slightly increased its duration profile over the last twelve months but remained very close to benchmark duration. The Fund benefited from an elevated yield environment over the period. On a year-over-year basis, we increased exposures to investment grade corporate bonds as well as agency and non-agency mortgage-backed securities. The Fund reduced its government and floating rate loan exposures over the period.
|
ANNUAL AVERAGE TOTAL RETURN (%)
|
|
1 Year
|
5 Year
|
10 Year
|
|
Class I-2 (without sales charge)
|
4.56
|
1.37
|
2.93
|
|
Bloomberg US Aggregate Bond Index
|
4.35
|
0.31
|
1.70
|
Visit https://www.aristotlefunds.com/resources/prospectuses-reports for more recent performance information.
KEY FUND STATISTICS (as of March 31, 2026)
|
Net Assets
|
$3,112,880,365
|
|
Number of Holdings
|
496
|
|
Net Advisory Fee
|
$12,409,806
|
|
Portfolio Turnover Rate
|
76%
|
WHAT DID THE FUND INVEST IN? (as of March 31, 2026)*
|
Top 10 Issuers
|
(%)
|
|
United States Treasury Note/Bond
|
18.1%
|
|
Federal National Mortgage Association
|
8.3%
|
|
Federal Home Loan Mortgage Corp.
|
4.3%
|
|
JPMorgan Chase & Co.
|
1.9%
|
|
Ginnie Mae II Pool
|
1.7%
|
|
Morgan Stanley
|
1.0%
|
|
Bank of America Corp.
|
1.0%
|
|
Freddie Mac Seasoned Credit Risk Transfer Trust
|
0.7%
|
|
A&D Mortgage LLC
|
0.4%
|
|
Transdigm, Inc.
|
0.4%
|
Sector Breakdown (%)

Changes to Fund’s Principal Risks:
In the Fund’s Principal Risks, Financial Sector Risk and Securities Lending Risk were added.
Changes to the Fund’s Principal Investment Strategy:
The Fund’s Principal Investment Strategies were revised to note that the Fund may lend its portfolio securities to generate additional income.
Changes to Fund’s Portfolio Manager or Portfolio Management Team:
Effective December 29, 2025, Jeff Klingelhofer, CFA, was added as a Portfolio Manager of Aristotle Core Income Fund.
This report describes changes to the Fund that occurred during the reporting period.
WHAT WERE THE FUND COSTS FOR THE PAST YEAR? (based on a hypothetical $10,000 investment)
|
Class Name
|
Costs of a $10,000 investment
|
Costs paid as a percentage of a $10,000 investment
|
|
Class A
|
$106
|
1.03%
|
HOW DID THE FUND PERFORM LAST YEAR AND WHAT AFFECTED ITS PERFORMANCE?
|
•
|
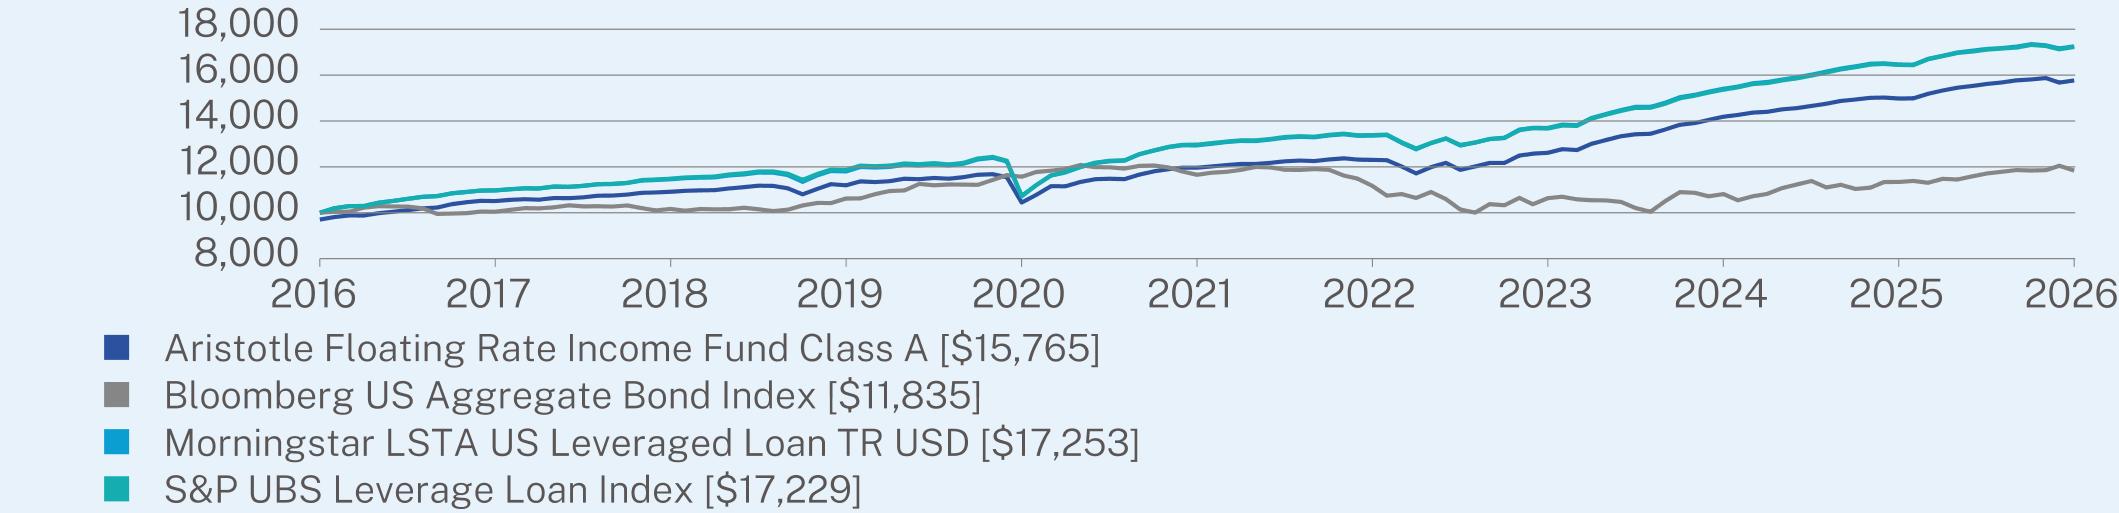
For the 12-month period ended March 31, 2026, the Fund outperformed its performance benchmark, the Morningstar LSTA US Leveraged Loan Index. The Fund invests principally in income-producing floating rate loans and floating rate debt securities.
|
|
•
|
The Fund continues to avoid lower-quality and distressed credits, instead emphasizing large-cap issuers and the performing segment of the loan market. The asset class ended the most recent quarter with an effective yield above 8%, which we view as an attractive level. We believe loans should continue to provide stability amid a volatile interest rate environment.
|
|
•
|
While the market experienced sector specific weakness in the first quarter of 2026, the Fund benefited from largely supportive corporate fundamentals, technicals and an attractive asset class relative value trade.
|
|
•
|
On a year-over-year basis, the Fund maintained its focused exposure inside of the floating rate loan asset class, specifically seeking out the larger more-liquid credits while seeking to avoid deteriorating credits and unfavorable sectors.
|
ANNUAL AVERAGE TOTAL RETURN (%)
|
|
1 Year
|
5 Year
|
10 Year
|
|
Class A (without sales charge)
|
5.25
|
5.68
|
4.97
|
|
Class A (with sales charge)
|
2.09
|
5.04
|
4.66
|
|
Bloomberg US Aggregate Bond Index
|
4.35
|
0.31
|
1.70
|
|
Morningstar LSTA US Leveraged Loan TR USD
|
4.81
|
5.93
|
5.61
|
|
S&P UBS Leverage Loan Index
|
4.79
|
5.85
|
5.59
|
Visit https://www.aristotlefunds.com/resources/prospectuses-reports for more recent performance information.
KEY FUND STATISTICS (as of March 31, 2026)
|
Net Assets
|
$3,489,671,006
|
|
Number of Holdings
|
161
|
|
Net Advisory Fee
|
$21,262,845
|
|
Portfolio Turnover Rate
|
170%
|
WHAT DID THE FUND INVEST IN? (as of March 31, 2026)*
|
Top 10 Issuers
|
(%)
|
|
Alliant Holdings Intermediate LLC / Alliant Holdings Co.-Issuer
|
3.9%
|
|
CoreLogic, Inc.
|
3.6%
|
|
CRC Insurance Group LLC
|
3.6%
|
|
Proofpoint, Inc.
|
3.5%
|
|
TransDigm, Inc.
|
3.2%
|
|
RealPage, Inc.
|
3.0%
|
|
Gainwell Acquisition Corp.
|
2.7%
|
|
Ellucian Holdings, Inc.
|
2.6%
|
|
Allied Universal Holdco LLC
|
2.6%
|
|
TK Elevator US Newco, Inc.
|
2.2%
|
Sector Breakdown (%)
Changes to Fund’s Principal Risks:
In the Fund’s Principal Risks, Financial Sector Risk and Securities Lending Risk were added.
Changes to the Fund’s Principal Investment Strategy:
The Fund’s Principal Investment Strategies were updated to remove the statement that a significant portion of the floating rate loans held by the Fund may be “covenant-lite” loans, and to add that the Fund may lend its portfolio securities to generate additional income.
Changes to Fund’s Portfolio Manager or Portfolio Management Team:
Effective January 31, 2026, J.P. Leasure no longer served as a Portfolio Manager of the Fund.
This report describes changes to the Fund that occurred during the reporting period.
WHAT WERE THE FUND COSTS FOR THE PAST YEAR? (based on a hypothetical $10,000 investment)
|
Class Name
|
Costs of a $10,000 investment
|
Costs paid as a percentage of a $10,000 investment
|
|
Class C
|
$182
|
1.78%
|
HOW DID THE FUND PERFORM LAST YEAR AND WHAT AFFECTED ITS PERFORMANCE?
|
•
|
For the 12-month period ended March 31, 2026, the Fund underperformed its performance benchmark, the Morningstar LSTA US Leveraged Loan Index. The Fund invests principally in income-producing floating rate loans and floating rate debt securities.
|
|
•
|
The Fund continues to avoid lower-quality and distressed credits, instead emphasizing large-cap issuers and the performing segment of the loan market. The asset class ended the most recent quarter with an effective yield above 8%, which we view as an attractive level. We believe loans should continue to provide stability amid a volatile interest rate environment.
|
|
•
|
While the market experienced sector specific weakness in the first quarter of 2026, the Fund benefited from largely supportive corporate fundamentals, technicals and an attractive asset class relative value trade.
|
|
•
|
On a year-over-year basis, the Fund maintained its focused exposure inside of the floating rate loan asset class, specifically seeking out the larger more-liquid credits while seeking to avoid deteriorating credits and unfavorable sectors.
|
ANNUAL AVERAGE TOTAL RETURN (%)
|
|
1 Year
|
5 Year
|
10 Year
|
|
Class C (without sales charge)
|
4.47
|
4.91
|
4.23
|
|
Class C (with sales charge)
|
3.48
|
4.91
|
4.23
|
|
Bloomberg US Aggregate Bond Index
|
4.35
|
0.31
|
1.70
|
|
Morningstar LSTA US Leveraged Loan TR USD
|
4.81
|
5.93
|
5.61
|
|
S&P UBS Leverage Loan Index
|
4.79
|
5.85
|
5.59
|
Visit https://www.aristotlefunds.com/resources/prospectuses-reports for more recent performance information.
KEY FUND STATISTICS (as of March 31, 2026)
|
Net Assets
|
$3,489,671,006
|
|
Number of Holdings
|
161
|
|
Net Advisory Fee
|
$21,262,845
|
|
Portfolio Turnover Rate
|
170%
|
WHAT DID THE FUND INVEST IN? (as of March 31, 2026)*
|
Top 10 Issuers
|
(%)
|
|
Alliant Holdings Intermediate LLC / Alliant Holdings Co.-Issuer
|
3.9%
|
|
CoreLogic, Inc.
|
3.6%
|
|
CRC Insurance Group LLC
|
3.6%
|
|
Proofpoint, Inc.
|
3.5%
|
|
TransDigm, Inc.
|
3.2%
|
|
RealPage, Inc.
|
3.0%
|
|
Gainwell Acquisition Corp.
|
2.7%
|
|
Ellucian Holdings, Inc.
|
2.6%
|
|
Allied Universal Holdco LLC
|
2.6%
|
|
TK Elevator US Newco, Inc.
|
2.2%
|
Sector Breakdown (%)

Changes to Fund’s Principal Risks:
In the Fund’s Principal Risks, Financial Sector Risk and Securities Lending Risk were added.
Changes to the Fund’s Principal Investment Strategy:
The Fund’s Principal Investment Strategies were updated to remove the statement that a significant portion of the floating rate loans held by the Fund may be “covenant-lite” loans, and to add that the Fund may lend its portfolio securities to generate additional income.
Changes to Fund’s Portfolio Manager or Portfolio Management Team:
Effective January 31, 2026, J.P. Leasure no longer served as a Portfolio Manager of the Fund.
This report describes changes to the Fund that occurred during the reporting period.
WHAT WERE THE FUND COSTS FOR THE PAST YEAR? (based on a hypothetical $10,000 investment)
|
Class Name
|
Costs of a $10,000 investment
|
Costs paid as a percentage of a $10,000 investment
|
|
Class I
|
$72
|
0.70%
|
HOW DID THE FUND PERFORM LAST YEAR AND WHAT AFFECTED ITS PERFORMANCE?
|
•
|
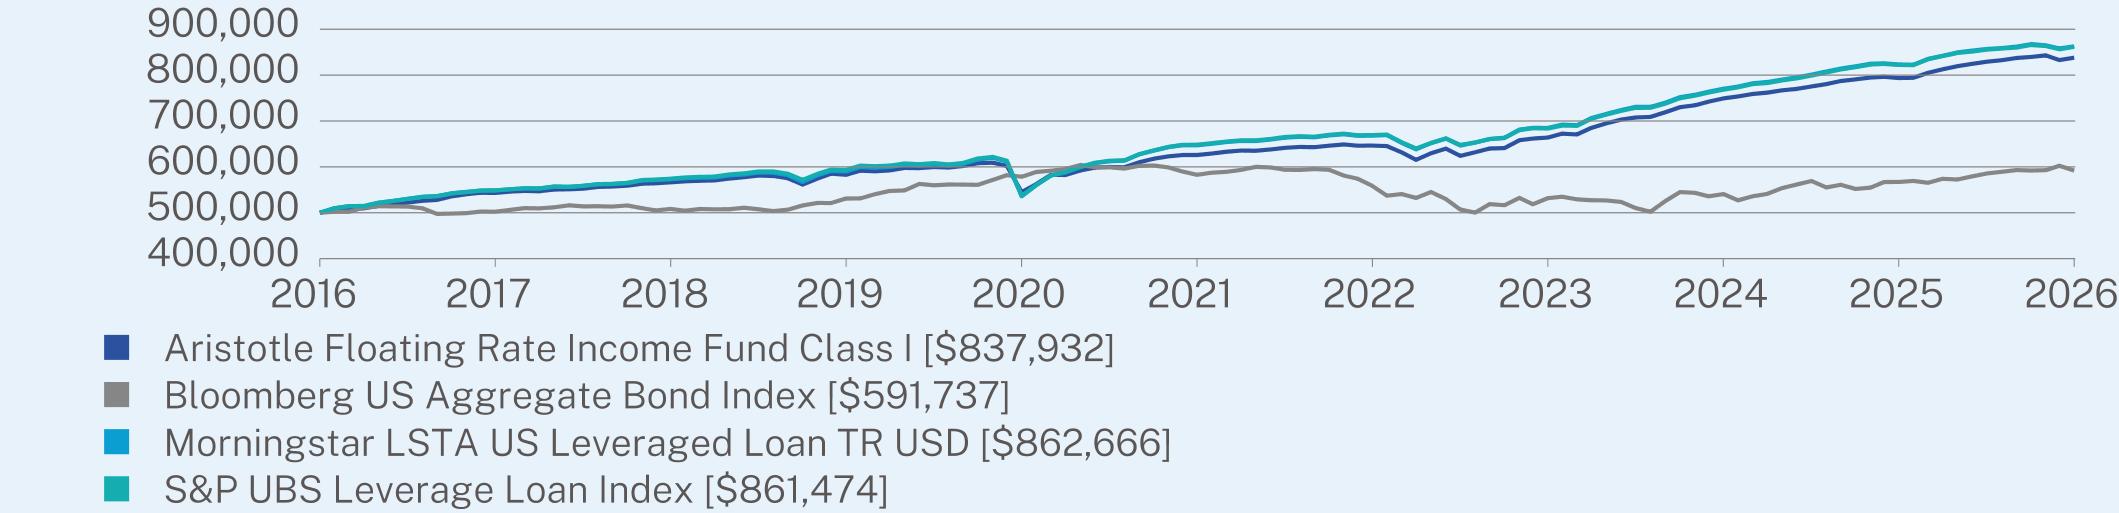
For the 12-month period ended March 31, 2026, the Fund outperformed its performance benchmark, the Morningstar LSTA US Leveraged Loan Index. The Fund invests principally in income-producing floating rate loans and floating rate debt securities.
|
|
•
|
The Fund continues to avoid lower-quality and distressed credits, instead emphasizing large-cap issuers and the performing segment of the loan market. The asset class ended the most recent quarter with an effective yield above 8%, which we view as an attractive level. We believe loans should continue to provide stability amid a volatile interest rate environment.
|
|
•
|
While the market experienced sector specific weakness in the first quarter of 2026, the Fund benefited from largely supportive corporate fundamentals, technicals and an attractive asset class relative value trade.
|
|
•
|
On a year-over-year basis, the Fund maintained its focused exposure inside of the floating rate loan asset class, specifically seeking out the larger more-liquid credits while seeking to avoid deteriorating credits and unfavorable sectors.
|
ANNUAL AVERAGE TOTAL RETURN (%)
|
|
1 Year
|
5 Year
|
10 Year
|
|
Class I (without sales charge)
|
5.60
|
6.01
|
5.30
|
|
Bloomberg US Aggregate Bond Index
|
4.35
|
0.31
|
1.70
|
|
Morningstar LSTA US Leveraged Loan TR USD
|
4.81
|
5.93
|
5.61
|
|
S&P UBS Leverage Loan Index
|
4.79
|
5.85
|
5.59
|
Visit https://www.aristotlefunds.com/resources/prospectuses-reports for more recent performance information.
KEY FUND STATISTICS (as of March 31, 2026)
|
Net Assets
|
$3,489,671,006
|
|
Number of Holdings
|
161
|
|
Net Advisory Fee
|
$21,262,845
|
|
Portfolio Turnover Rate
|
170%
|
WHAT DID THE FUND INVEST IN? (as of March 31, 2026)*
|
Top 10 Issuers
|
(%)
|
|
Alliant Holdings Intermediate LLC / Alliant Holdings Co.-Issuer
|
3.9%
|
|
CoreLogic, Inc.
|
3.6%
|
|
CRC Insurance Group LLC
|
3.6%
|
|
Proofpoint, Inc.
|
3.5%
|
|
TransDigm, Inc.
|
3.2%
|
|
RealPage, Inc.
|
3.0%
|
|
Gainwell Acquisition Corp.
|
2.7%
|
|
Ellucian Holdings, Inc.
|
2.6%
|
|
Allied Universal Holdco LLC
|
2.6%
|
|
TK Elevator US Newco, Inc.
|
2.2%
|
Sector Breakdown (%)

Changes to Fund’s Principal Risks:
In the Fund’s Principal Risks, Financial Sector Risk and Securities Lending Risk were added.
Changes to the Fund’s Principal Investment Strategy:
The Fund’s Principal Investment Strategies were updated to remove the statement that a significant portion of the floating rate loans held by the Fund may be “covenant-lite” loans, and to add that the Fund may lend its portfolio securities to generate additional income.
Changes to Fund’s Portfolio Manager or Portfolio Management Team:
Effective January 31, 2026, J.P. Leasure no longer served as a Portfolio Manager of the Fund.
This report describes changes to the Fund that occurred during the reporting period.
WHAT WERE THE FUND COSTS FOR THE PAST YEAR? (based on a hypothetical $10,000 investment)
|
Class Name
|
Costs of a $10,000 investment
|
Costs paid as a percentage of a $10,000 investment
|
|
Class I-2
|
$80
|
0.78%
|
HOW DID THE FUND PERFORM LAST YEAR AND WHAT AFFECTED ITS PERFORMANCE?
|
•
|
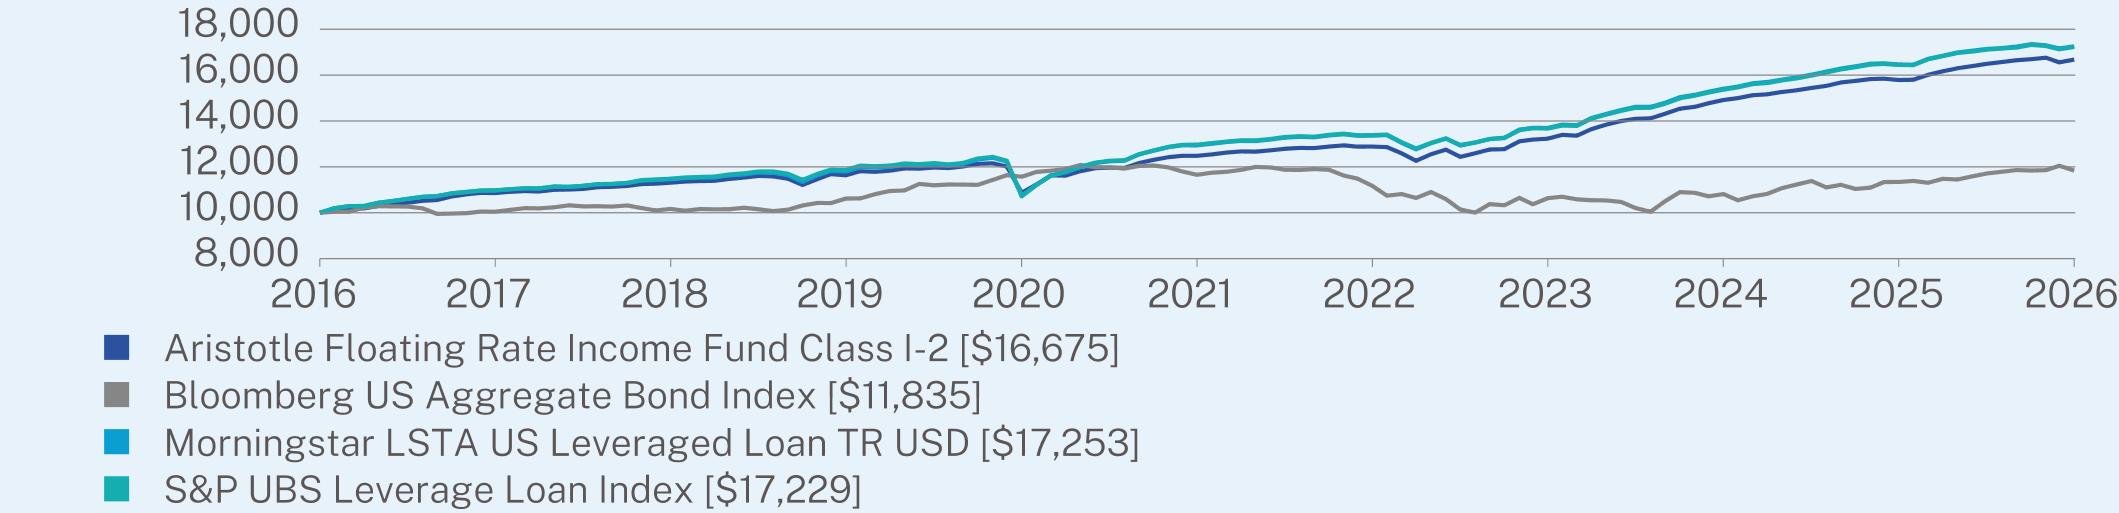
For the 12-month period ended March 31, 2026, the Fund outperformed its performance benchmark, the Morningstar LSTA US Leveraged Loan Index. The Fund invests principally in income-producing floating rate loans and floating rate debt securities.
|
|
•
|
The Fund continues to avoid lower-quality and distressed credits, instead emphasizing large-cap issuers and the performing segment of the loan market. The asset class ended the most recent quarter with an effective yield above 8%, which we view as an attractive level. We believe loans should continue to provide stability amid a volatile interest rate environment.
|
|
•
|
While the market experienced sector specific weakness in the first quarter of 2026, the Fund benefited from largely supportive corporate fundamentals, technicals and an attractive asset class relative value trade.
|
|
•
|
On a year-over-year basis, the Fund maintained its focused exposure inside of the floating rate loan asset class, specifically seeking out the larger more-liquid credits while seeking to avoid deteriorating credits and unfavorable sectors.
|
ANNUAL AVERAGE TOTAL RETURN (%)
|
|
1 Year
|
5 Year
|
10 Year
|
|
Class I-2 (without sales charge)
|
5.64
|
5.97
|
5.25
|
|
Bloomberg US Aggregate Bond Index
|
4.35
|
0.31
|
1.70
|
|
Morningstar LSTA US Leveraged Loan TR USD
|
4.81
|
5.93
|
5.61
|
|
S&P UBS Leverage Loan Index
|
4.79
|
5.85
|
5.59
|
Visit https://www.aristotlefunds.com/resources/prospectuses-reports for more recent performance information.
KEY FUND STATISTICS (as of March 31, 2026)
|
Net Assets
|
$3,489,671,006
|
|
Number of Holdings
|
161
|
|
Net Advisory Fee
|
$21,262,845
|
|
Portfolio Turnover Rate
|
170%
|
WHAT DID THE FUND INVEST IN? (as of March 31, 2026)*
|
Top 10 Issuers
|
(%)
|
|
Alliant Holdings Intermediate LLC / Alliant Holdings Co.-Issuer
|
3.9%
|
|
CoreLogic, Inc.
|
3.6%
|
|
CRC Insurance Group LLC
|
3.6%
|
|
Proofpoint, Inc.
|
3.5%
|
|
TransDigm, Inc.
|
3.2%
|
|
RealPage, Inc.
|
3.0%
|
|
Gainwell Acquisition Corp.
|
2.7%
|
|
Ellucian Holdings, Inc.
|
2.6%
|
|
Allied Universal Holdco LLC
|
2.6%
|
|
TK Elevator US Newco, Inc.
|
2.2%
|
Sector Breakdown (%)

Changes to Fund’s Principal Risks:
In the Fund’s Principal Risks, Financial Sector Risk and Securities Lending Risk were added.
Changes to the Fund’s Principal Investment Strategy:
The Fund’s Principal Investment Strategies were updated to remove the statement that a significant portion of the floating rate loans held by the Fund may be “covenant-lite” loans, and to add that the Fund may lend its portfolio securities to generate additional income.
Changes to Fund’s Portfolio Manager or Portfolio Management Team:
Effective January 31, 2026, J.P. Leasure no longer served as a Portfolio Manager of the Fund.
This report describes changes to the Fund that occurred during the reporting period.
WHAT WERE THE FUND COSTS FOR THE PAST YEAR? (based on a hypothetical $10,000 investment)
|
Class Name
|
Costs of a $10,000 investment
|
Costs paid as a percentage of a $10,000 investment
|
|
Class A
|
$104
|
0.95%
|
HOW DID THE FUND PERFORM LAST YEAR AND WHAT AFFECTED ITS PERFORMANCE?
|
•
|
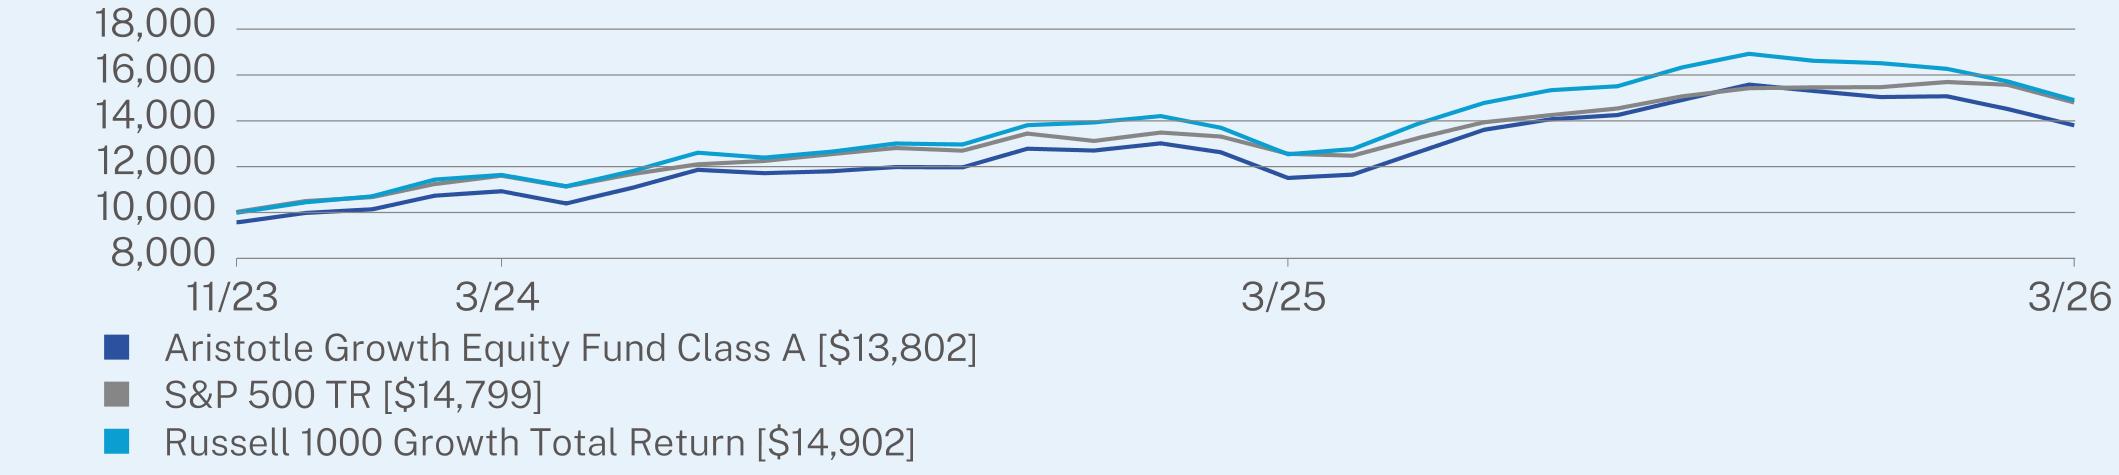
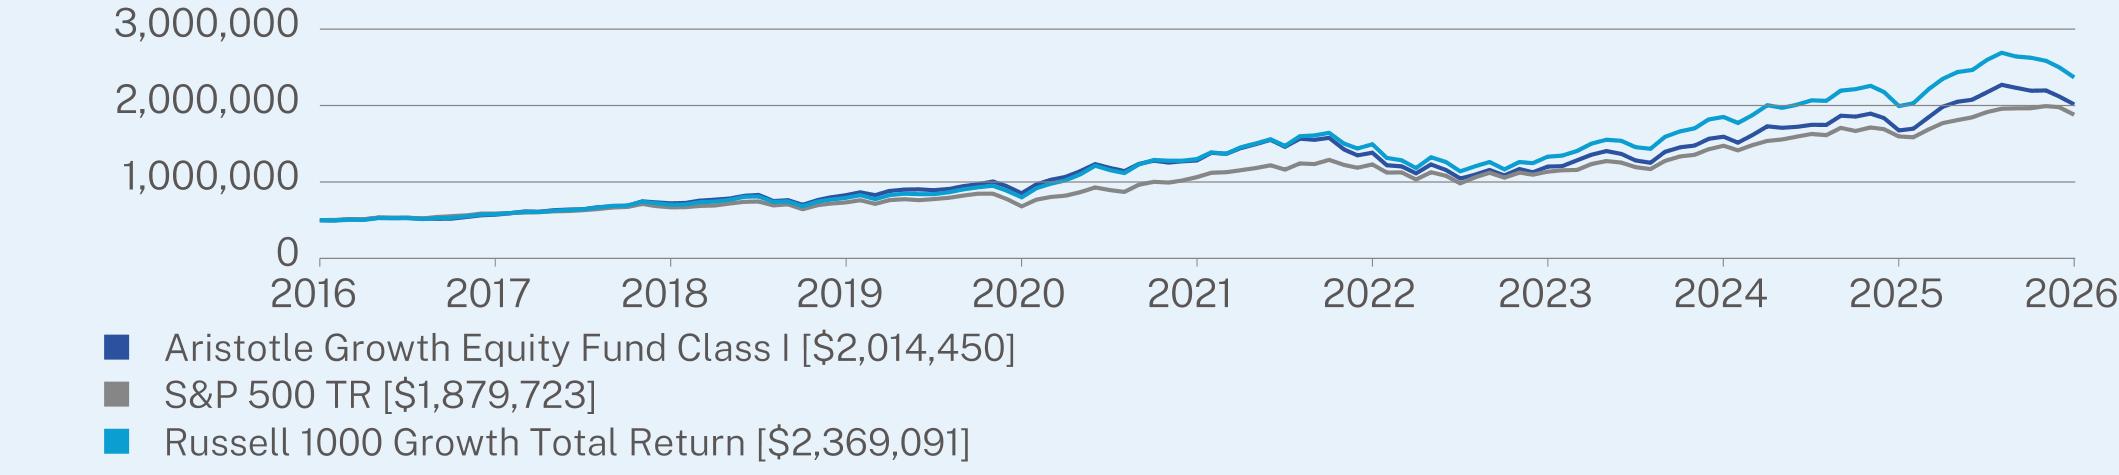
For the 12-month period ended March 31, 2026, the Fund outperformed its performance benchmark, the Russell 1000 Growth Index. The Fund invests at least 80% of its assets in equity securities.
|
|
•
|
The outperformance of the Fund relative to the Russell 1000 Growth Index over the 1-year period was due to security selection and sector allocation.
|
|
•
|
Security selection in industrials and healthcare contributed the most to relative performance. Conversely, security selection in consumer discretionary and financials detracted.
|
|
•
|
Guardant Health, KLA Corporation and Quanta Services were the largest contributors over the period. Meanwhile, Visa, Hubspot and Bio-Techne Corporation were the top detractors from relative performance for the year.
|
|
•
|
From a sector allocation standpoint, an underweight to financials and an overweight to healthcare contributed to relative performance. Conversely, an overweight to materials and underweight in information technology detracted from relative performance.
|
ANNUAL AVERAGE TOTAL RETURN (%)
|
|
1 Year
|
Since Inception
(11/29/2023) |
|
Class A (without sales charge)
|
19.94
|
16.92
|
|
Class A (with sales charge)
|
14.83
|
14.79
|
|
S&P 500 TR
|
17.80
|
18.26
|
|
Russell 1000 Growth Total Return
|
18.81
|
18.61
|
Visit https://www.aristotlefunds.com/resources/prospectuses-reports for more recent performance information.
KEY FUND STATISTICS (as of March 31, 2026)
|
Net Assets
|
$219,493,897
|
|
Number of Holdings
|
45
|
|
Net Advisory Fee
|
$1,172,585
|
|
Portfolio Turnover Rate
|
39%
|
WHAT DID THE FUND INVEST IN? (as of March 31, 2026)*
|
Top 10 Issuers
|
(%)
|
|
NVIDIA Corp.
|
14.7%
|
|
Microsoft Corp.
|
9.4%
|
|
Apple, Inc.
|
9.4%
|
|
Amazon.com, Inc.
|
7.3%
|
|
Alphabet, Inc.
|
6.4%
|
|
Broadcom, Inc.
|
4.8%
|
|
Meta Platforms, Inc.
|
3.8%
|
|
Visa, Inc.
|
3.5%
|
|
KLA Corp.
|
2.4%
|
|
Quanta Services, Inc.
|
2.1%
|
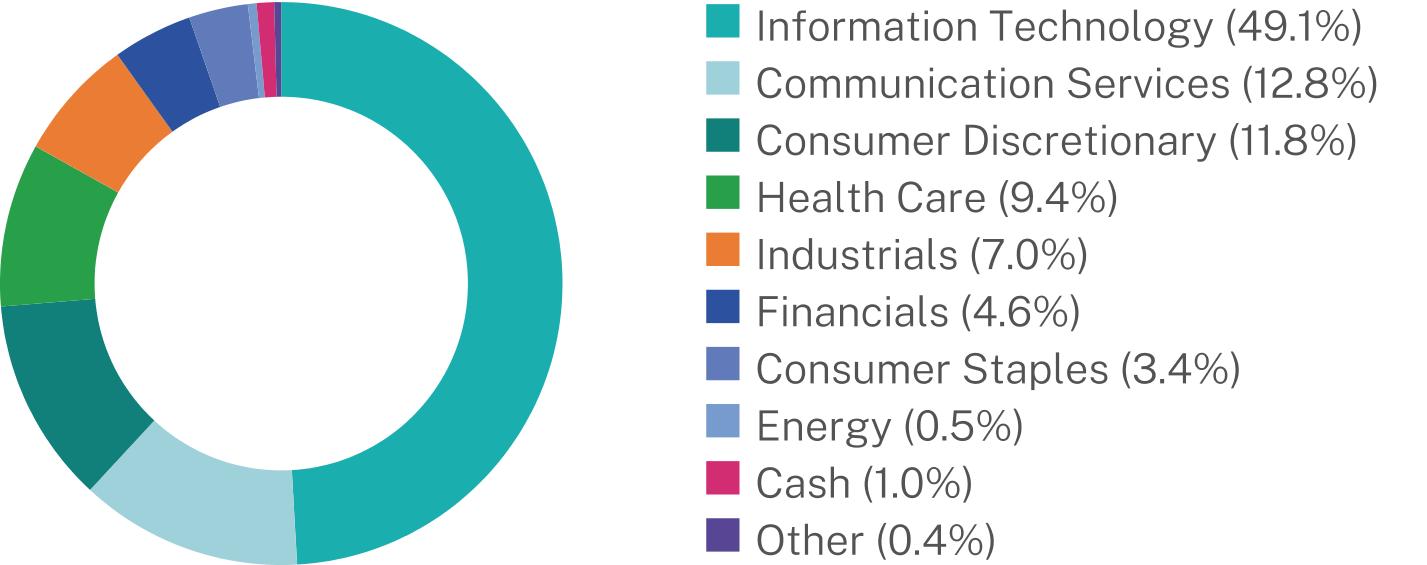
Sector Breakdown (%)**

Changes to Fund’s Principal Risks:
In the Fund’s Principal Risks, Securities Lending Risk was added.
Changes to the Fund’s Principal Investment Strategy:
The Fund’s Principal Investment Strategies were revised to note that the Fund may lend its portfolio securities to generate additional income.
This report describes changes to the Fund that occurred during the reporting period.
WHAT WERE THE FUND COSTS FOR THE PAST YEAR? (based on a hypothetical $10,000 investment)
|
Class Name
|
Costs of a $10,000 investment
|
Costs paid as a percentage of a $10,000 investment
|
|
Class I
|
$77
|
0.70%
|
HOW DID THE FUND PERFORM LAST YEAR AND WHAT AFFECTED ITS PERFORMANCE?
|
•
|
For the 12-month period ended March 31, 2026, the Fund outperformed its performance benchmark, the Russell 1000 Growth Index. The Fund invests at least 80% of its assets in equity securities.
|
|
•
|
The outperformance of the Fund relative to the Russell 1000 Growth Index over the 1-year period was due to security selection and sector allocation.
|
|
•
|
Security selection in industrials and healthcare contributed the most to relative performance. Conversely, security selection in consumer discretionary and financials detracted.
|
|
•
|
Guardant Health, KLA Corporation and Quanta Services were the largest contributors over the period. Meanwhile, Visa, Hubspot and Bio-Techne Corporation were the top detractors from relative performance for the year.
|
|
•
|
From a sector allocation standpoint, an underweight to financials and an overweight to healthcare contributed to relative performance. Conversely, an overweight to materials and underweight in information technology detracted from relative performance.
|
ANNUAL AVERAGE TOTAL RETURN (%)
|
|
1 Year
|
5 Year
|
10 Year
|
|
Class I (without sales charge)
|
20.31
|
9.46
|
14.95
|
|
S&P 500 TR
|
17.80
|
12.06
|
14.16
|
|
Russell 1000 Growth Total Return
|
18.81
|
12.76
|
16.83
|
Visit https://www.aristotlefunds.com/resources/prospectuses-reports for more recent performance information.
KEY FUND STATISTICS (as of March 31, 2026)
|
Net Assets
|
$219,493,897
|
|
Number of Holdings
|
45
|
|
Net Advisory Fee
|
$1,172,585
|
|
Portfolio Turnover Rate
|
39%
|
WHAT DID THE FUND INVEST IN? (as of March 31, 2026)*
|
Top 10 Issuers
|
(%)
|
|
NVIDIA Corp.
|
14.7%
|
|
Microsoft Corp.
|
9.4%
|
|
Apple, Inc.
|
9.4%
|
|
Amazon.com, Inc.
|
7.3%
|
|
Alphabet, Inc.
|
6.4%
|
|
Broadcom, Inc.
|
4.8%
|
|
Meta Platforms, Inc.
|
3.8%
|
|
Visa, Inc.
|
3.5%
|
|
KLA Corp.
|
2.4%
|
|
Quanta Services, Inc.
|
2.1%
|
Sector Breakdown (%)**

Changes to Fund’s Principal Risks:
In the Fund’s Principal Risks, Securities Lending Risk was added.
Changes to the Fund’s Principal Investment Strategy:
The Fund’s Principal Investment Strategies were revised to note that the Fund may lend its portfolio securities to generate additional income.
This report describes changes to the Fund that occurred during the reporting period.
WHAT WERE THE FUND COSTS FOR THE PAST YEAR? (based on a hypothetical $10,000 investment)
|
Class Name
|
Costs of a $10,000 investment
|
Costs paid as a percentage of a $10,000 investment
|
|
Class I-2
|
$77
|
0.70%
|
HOW DID THE FUND PERFORM LAST YEAR AND WHAT AFFECTED ITS PERFORMANCE?
|
•
|
For the 12-month period ended March 31, 2026, the Fund outperformed its performance benchmark, the Russell 1000 Growth Index. The Fund invests at least 80% of its assets in equity securities.
|
|
•
|
The outperformance of the Fund relative to the Russell 1000 Growth Index over the 1-year period was due to security selection and sector allocation.
|
|
•
|
Security selection in industrials and healthcare contributed the most to relative performance. Conversely, security selection in consumer discretionary and financials detracted.
|
|
•
|
Guardant Health, KLA Corporation and Quanta Services were the largest contributors over the period. Meanwhile, Visa, Hubspot and Bio-Techne Corporation were the top detractors from relative performance for the year.
|
|
•
|
From a sector allocation standpoint, an underweight to financials and an overweight to healthcare contributed to relative performance. Conversely, an overweight to materials and underweight in information technology detracted from relative performance.
|
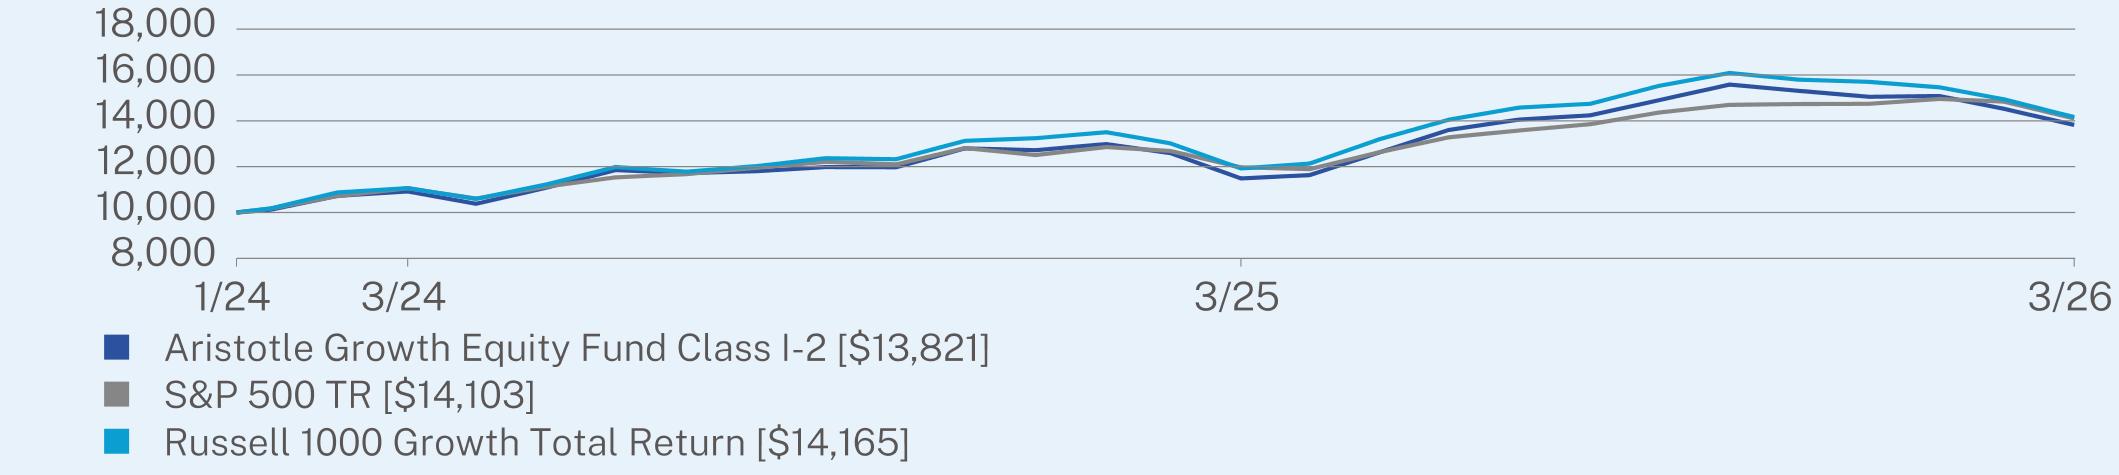
ANNUAL AVERAGE TOTAL RETURN (%)
|
|
1 Year
|
Since Inception
(01/16/2024) |
|
Class I-2 (without sales charge)
|
20.30
|
15.80
|
|
S&P 500 TR
|
17.80
|
16.87
|
|
Russell 1000 Growth Total Return
|
18.81
|
17.10
|
Visit https://www.aristotlefunds.com/resources/prospectuses-reports for more recent performance information.
KEY FUND STATISTICS (as of March 31, 2026)
|
Net Assets
|
$219,493,897
|
|
Number of Holdings
|
45
|
|
Net Advisory Fee
|
$1,172,585
|
|
Portfolio Turnover Rate
|
39%
|
WHAT DID THE FUND INVEST IN? (as of March 31, 2026)*
|
Top 10 Issuers
|
(%)
|
|
NVIDIA Corp.
|
14.7%
|
|
Microsoft Corp.
|
9.4%
|
|
Apple, Inc.
|
9.4%
|
|
Amazon.com, Inc.
|
7.3%
|
|
Alphabet, Inc.
|
6.4%
|
|
Broadcom, Inc.
|
4.8%
|
|
Meta Platforms, Inc.
|
3.8%
|
|
Visa, Inc.
|
3.5%
|
|
KLA Corp.
|
2.4%
|
|
Quanta Services, Inc.
|
2.1%
|
Sector Breakdown (%)**
Changes to Fund’s Principal Risks:
In the Fund’s Principal Risks, Securities Lending Risk was added.
Changes to the Fund’s Principal Investment Strategy:
The Fund’s Principal Investment Strategies were revised to note that the Fund may lend its portfolio securities to generate additional income.
This report describes changes to the Fund that occurred during the reporting period.
WHAT WERE THE FUND COSTS FOR THE PAST YEAR? (based on a hypothetical $10,000 investment)
|
Class Name
|
Costs of a $10,000 investment
|
Costs paid as a percentage of a $10,000 investment
|
|
Class A
|
$98
|
0.95%
|
HOW DID THE FUND PERFORM LAST YEAR AND WHAT AFFECTED ITS PERFORMANCE?
|
•
|
For the 12-month period ended March 31, 2026, the Fund underperformed its performance benchmark, the Bloomberg US High Yield 2% Issuer Capped Bond Total Return Index. The Fund invests at least 80% of its assets in non-investment grade (high yield/high risk, sometimes called “junk bonds”) debt instruments or in instruments with characteristics of non-investment grade debt instruments.
|
|
•
|
The Fund’s underperformance is, in part, attributable to a lack of exposure to lower-quality distressed credits that benefited during portions of the period. The Fund did benefit from a supportive rate environment as well as generally compressed credit spreads.
|
|
•
|
Exposure to specific credit-sensitive sectors benefited performance for most of the period as credit remained broadly supported. The intermediate positioning and historically elevated yield profile helped insulate from the full effect of episodic credit spread widening as compared to longer duration-based offerings.
|
|
•
|
The Fund benefited from BB and single B rated credit exposures over the period. By asset class, high yield bonds and floating rate loans were most beneficial to performance.
|
|
•
|
Positive contributions to relative performance were led by credit selection and active asset class allocation.
|
|
•
|
While the Fund duration tactically adjusted over the last 12 months, the point-to-point duration ended only slightly lower. The Fund benefited from an elevated yield environment over the period.
|
|
•
|
On a year-over-year basis, we reduced a portion of our high yield bond exposure while increasing a limited exposure to investment grade bond and asset backed exposure.
|
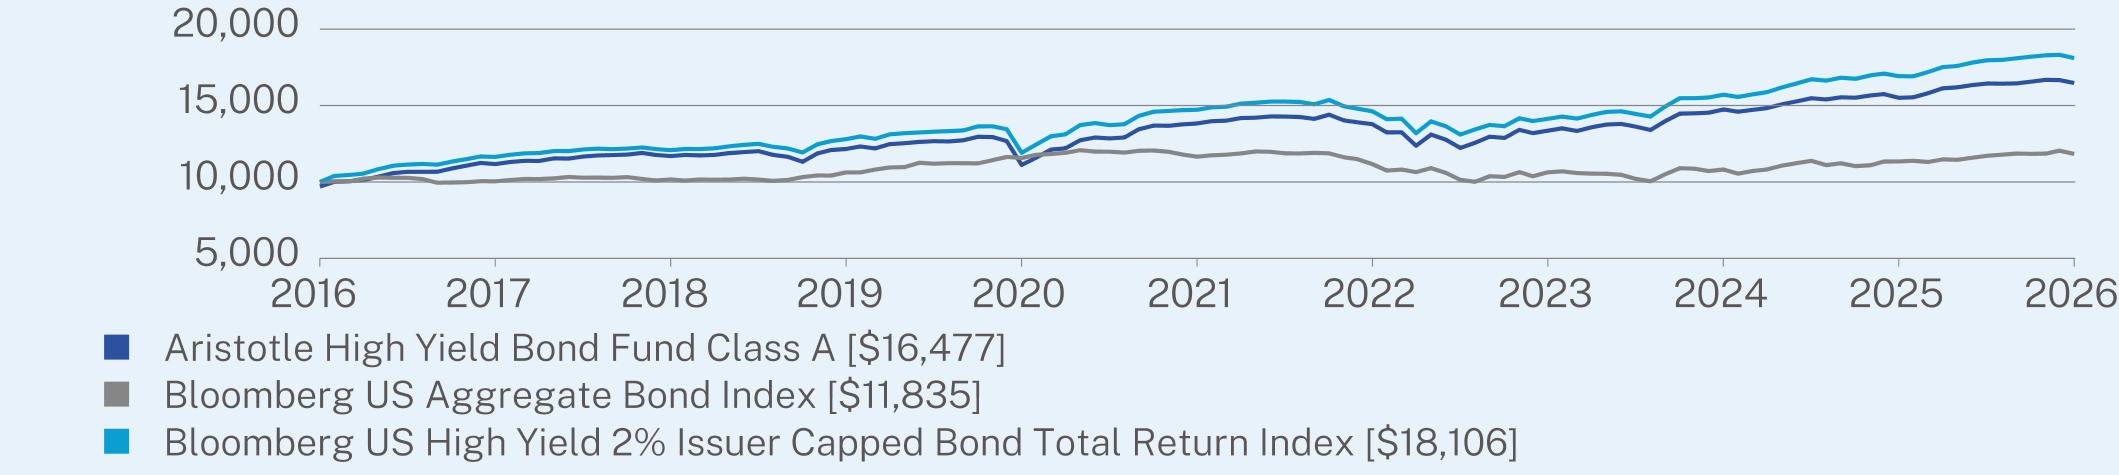
ANNUAL AVERAGE TOTAL RETURN (%)
|
|
1 Year
|
5 Year
|
10 Year
|
|
Class A (without sales charge)
|
6.28
|
3.57
|
5.44
|
|
Class A (with sales charge)
|
1.76
|
2.67
|
4.98
|
|
Bloomberg US Aggregate Bond Index
|
4.35
|
0.31
|
1.70
|
|
Bloomberg US High Yield 2% Issuer Capped Bond Total Return Index
|
7.01
|
4.22
|
6.12
|
Visit https://www.aristotlefunds.com/resources/prospectuses-reports for more recent performance information.
KEY FUND STATISTICS (as of March 31, 2026)
|
Net Assets
|
$109,996,477
|
|
Number of Holdings
|
217
|
|
Net Advisory Fee
|
$499,726
|
|
Portfolio Turnover Rate
|
72%
|
WHAT DID THE FUND INVEST IN? (as of March 31, 2026)*
|
Top 10 Issuers
|
(%)
|
|
TransDigm, Inc.
|
2.7%
|
|
MajorDrive Holdings IV LLC
|
2.6%
|
|
Alliant Holdings Intermediate LLC / Alliant Holdings Co.-Issuer
|
1.8%
|
|
Acrisure LLC / Acrisure Finance, Inc.
|
1.8%
|
|
NCL Corp. Ltd.
|
1.7%
|
|
Energy Transfer LP
|
1.5%
|
|
CCO Holdings LLC / CCO Holdings Capital Corp.
|
1.5%
|
|
Venture Global LNG, Inc.
|
1.5%
|
|
Sunoco LP
|
1.5%
|
|
Antero Midstream Partners LP / Antero Midstream Finance Corp.
|
1.2%
|
Sector Breakdown (%)

Changes to Fund’s Principal Risks:
In the Fund’s Principal Risks, Securities Lending Risk was added.
Changes to the Fund’s Principal Investment Strategy:
The Fund’s Principal Investment Strategies were revised to note that the Fund may lend its portfolio securities to generate additional income.
This report describes changes to the Fund that occurred during the reporting period.
WHAT WERE THE FUND COSTS FOR THE PAST YEAR? (based on a hypothetical $10,000 investment)
|
Class Name
|
Costs of a $10,000 investment
|
Costs paid as a percentage of a $10,000 investment
|
|
Class C
|
$175
|
1.70%
|
HOW DID THE FUND PERFORM LAST YEAR AND WHAT AFFECTED ITS PERFORMANCE?
|
•
|
For the 12-month period ended March 31, 2026, the Fund underperformed its performance benchmark, the Bloomberg US High Yield 2% Issuer Capped Bond Total Return Index. The Fund invests at least 80% of its assets in non-investment grade (high yield/high risk, sometimes called “junk bonds”) debt instruments or in instruments with characteristics of non-investment grade debt instruments.
|
|
•
|
The Fund’s underperformance is, in part, attributable to a lack of exposure to lower-quality distressed credits that benefited during portions of the period. The Fund did benefit from a supportive rate environment as well as generally compressed credit spreads.
|
|
•
|
Exposure to specific credit-sensitive sectors benefited performance for most of the period as credit remained broadly supported. The intermediate positioning and historically elevated yield profile helped insulate from the full effect of episodic credit spread widening as compared to longer duration-based offerings.
|
|
•
|
The Fund benefited from BB and single B rated credit exposures over the period. By asset class, high yield bonds and floating rate loans were most beneficial to performance.
|
|
•
|
Positive contributions to relative performance were led by credit selection and active asset class allocation.
|
|
•
|
While the Fund duration tactically adjusted over the last 12 months, the point-to-point duration ended only slightly lower. The Fund benefited from an elevated yield environment over the period.
|
|
•
|
On a year-over-year basis, we reduced a portion of our high yield bond exposure while increasing a limited exposure to investment grade bond and asset backed exposure.
|

ANNUAL AVERAGE TOTAL RETURN (%)
|
|
1 Year
|
5 Year
|
10 Year
|
|
Class C (without sales charge)
|
5.61
|
2.82
|
4.69
|
|
Class C (with sales charge)
|
4.61
|
2.82
|
4.69
|
|
Bloomberg US Aggregate Bond Index
|
4.35
|
0.31
|
1.70
|
|
Bloomberg US High Yield 2% Issuer Capped Bond Total Return Index
|
7.01
|
4.22
|
6.12
|
Visit https://www.aristotlefunds.com/resources/prospectuses-reports for more recent performance information.
KEY FUND STATISTICS (as of March 31, 2026)
|
Net Assets
|
$109,996,477
|
|
Number of Holdings
|
217
|
|
Net Advisory Fee
|
$499,726
|
|
Portfolio Turnover Rate
|
72%
|
WHAT DID THE FUND INVEST IN? (as of March 31, 2026)*
|
Top 10 Issuers
|
(%)
|
|
TransDigm, Inc.
|
2.7%
|
|
MajorDrive Holdings IV LLC
|
2.6%
|
|
Alliant Holdings Intermediate LLC / Alliant Holdings Co.-Issuer
|
1.8%
|
|
Acrisure LLC / Acrisure Finance, Inc.
|
1.8%
|
|
NCL Corp. Ltd.
|
1.7%
|
|
Energy Transfer LP
|
1.5%
|
|
CCO Holdings LLC / CCO Holdings Capital Corp.
|
1.5%
|
|
Venture Global LNG, Inc.
|
1.5%
|
|
Sunoco LP
|
1.5%
|
|
Antero Midstream Partners LP / Antero Midstream Finance Corp.
|
1.2%
|
Sector Breakdown (%)

Changes to Fund’s Principal Risks:
In the Fund’s Principal Risks, Securities Lending Risk was added.
Changes to the Fund’s Principal Investment Strategy:
The Fund’s Principal Investment Strategies were revised to note that the Fund may lend its portfolio securities to generate additional income.
This report describes changes to the Fund that occurred during the reporting period.
WHAT WERE THE FUND COSTS FOR THE PAST YEAR? (based on a hypothetical $10,000 investment)
|
Class Name
|
Costs of a $10,000 investment
|
Costs paid as a percentage of a $10,000 investment
|
|
Class I
|
$57
|
0.55%
|
HOW DID THE FUND PERFORM LAST YEAR AND WHAT AFFECTED ITS PERFORMANCE?
|
•
|
For the 12-month period ended March 31, 2026, the Fund underperformed its performance benchmark, the Bloomberg US High Yield 2% Issuer Capped Bond Total Return Index. The Fund invests at least 80% of its assets in non-investment grade (high yield/high risk, sometimes called “junk bonds”) debt instruments or in instruments with characteristics of non-investment grade debt instruments.
|
|
•
|
The Fund’s underperformance is, in part, attributable to a lack of exposure to lower-quality distressed credits that benefited during portions of the period. The Fund did benefit from a supportive rate environment as well as generally compressed credit spreads.
|
|
•
|
Exposure to specific credit-sensitive sectors benefited performance for most of the period as credit remained broadly supported. The intermediate positioning and historically elevated yield profile helped insulate from the full effect of episodic credit spread widening as compared to longer duration-based offerings.
|
|
•
|
The Fund benefited from BB and single B rated credit exposures over the period. By asset class, high yield bonds and floating rate loans were most beneficial to performance.
|
|
•
|
Positive contributions to relative performance were led by credit selection and active asset class allocation.
|
|
•
|
While the Fund duration tactically adjusted over the last 12 months, the point-to-point duration ended only slightly lower. The Fund benefited from an elevated yield environment over the period.
|
|
•
|
On a year-over-year basis, we reduced a portion of our high yield bond exposure while increasing a limited exposure to investment grade bond and asset backed exposure.
|
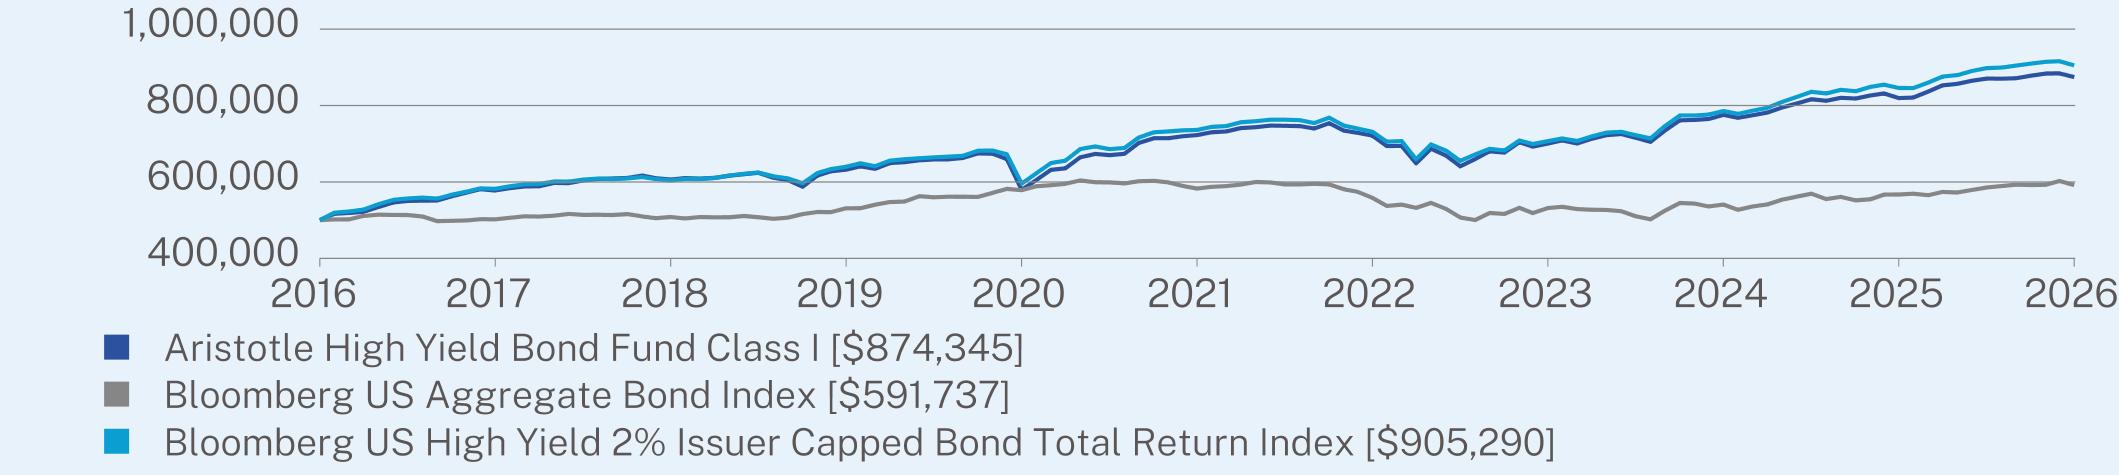
ANNUAL AVERAGE TOTAL RETURN (%)
|
|
1 Year
|
5 Year
|
10 Year
|
|
Class I (without sales charge)
|
6.69
|
3.88
|
5.75
|
|
Bloomberg US Aggregate Bond Index
|
4.35
|
0.31
|
1.70
|
|
Bloomberg US High Yield 2% Issuer Capped Bond Total Return Index
|
7.01
|
4.22
|
6.12
|
Visit https://www.aristotlefunds.com/resources/prospectuses-reports for more recent performance information.
KEY FUND STATISTICS (as of March 31, 2026)
|
Net Assets
|
$109,996,477
|
|
Number of Holdings
|
217
|
|
Net Advisory Fee
|
$499,726
|
|
Portfolio Turnover Rate
|
72%
|
WHAT DID THE FUND INVEST IN? (as of March 31, 2026)*
|
Top 10 Issuers
|
(%)
|
|
TransDigm, Inc.
|
2.7%
|
|
MajorDrive Holdings IV LLC
|
2.6%
|
|
Alliant Holdings Intermediate LLC / Alliant Holdings Co.-Issuer
|
1.8%
|
|
Acrisure LLC / Acrisure Finance, Inc.
|
1.8%
|
|
NCL Corp. Ltd.
|
1.7%
|
|
Energy Transfer LP
|
1.5%
|
|
CCO Holdings LLC / CCO Holdings Capital Corp.
|
1.5%
|
|
Venture Global LNG, Inc.
|
1.5%
|
|
Sunoco LP
|
1.5%
|
|
Antero Midstream Partners LP / Antero Midstream Finance Corp.
|
1.2%
|
Sector Breakdown (%)

Changes to Fund’s Principal Risks:
In the Fund’s Principal Risks, Securities Lending Risk was added.
Changes to the Fund’s Principal Investment Strategy:
The Fund’s Principal Investment Strategies were revised to note that the Fund may lend its portfolio securities to generate additional income.
This report describes changes to the Fund that occurred during the reporting period.
WHAT WERE THE FUND COSTS FOR THE PAST YEAR? (based on a hypothetical $10,000 investment)
|
Class Name
|
Costs of a $10,000 investment
|
Costs paid as a percentage of a $10,000 investment
|
|
Class I-2
|
$67
|
0.65%
|
HOW DID THE FUND PERFORM LAST YEAR AND WHAT AFFECTED ITS PERFORMANCE?
|
•
|
For the 12-month period ended March 31, 2026, the Fund underperformed its performance benchmark, the Bloomberg US High Yield 2% Issuer Capped Bond Total Return Index. The Fund invests at least 80% of its assets in non-investment grade (high yield/high risk, sometimes called “junk bonds”) debt instruments or in instruments with characteristics of non-investment grade debt instruments.
|
|
•
|
The Fund’s underperformance is, in part, attributable to a lack of exposure to lower-quality distressed credits that benefited during portions of the period. The Fund did benefit from a supportive rate environment as well as generally compressed credit spreads.
|
|
•
|
Exposure to specific credit-sensitive sectors benefited performance for most of the period as credit remained broadly supported. The intermediate positioning and historically elevated yield profile helped insulate from the full effect of episodic credit spread widening as compared to longer duration-based offerings.
|
|
•
|
The Fund benefited from BB and single B rated credit exposures over the period. By asset class, high yield bonds and floating rate loans were most beneficial to performance.
|
|
•
|
Positive contributions to relative performance were led by credit selection and active asset class allocation.
|
|
•
|
While the Fund duration tactically adjusted over the last 12 months, the point-to-point duration ended only slightly lower. The Fund benefited from an elevated yield environment over the period.
|
|
•
|
On a year-over-year basis, we reduced a portion of our high yield bond exposure while increasing a limited exposure to investment grade bond and asset backed exposure.
|
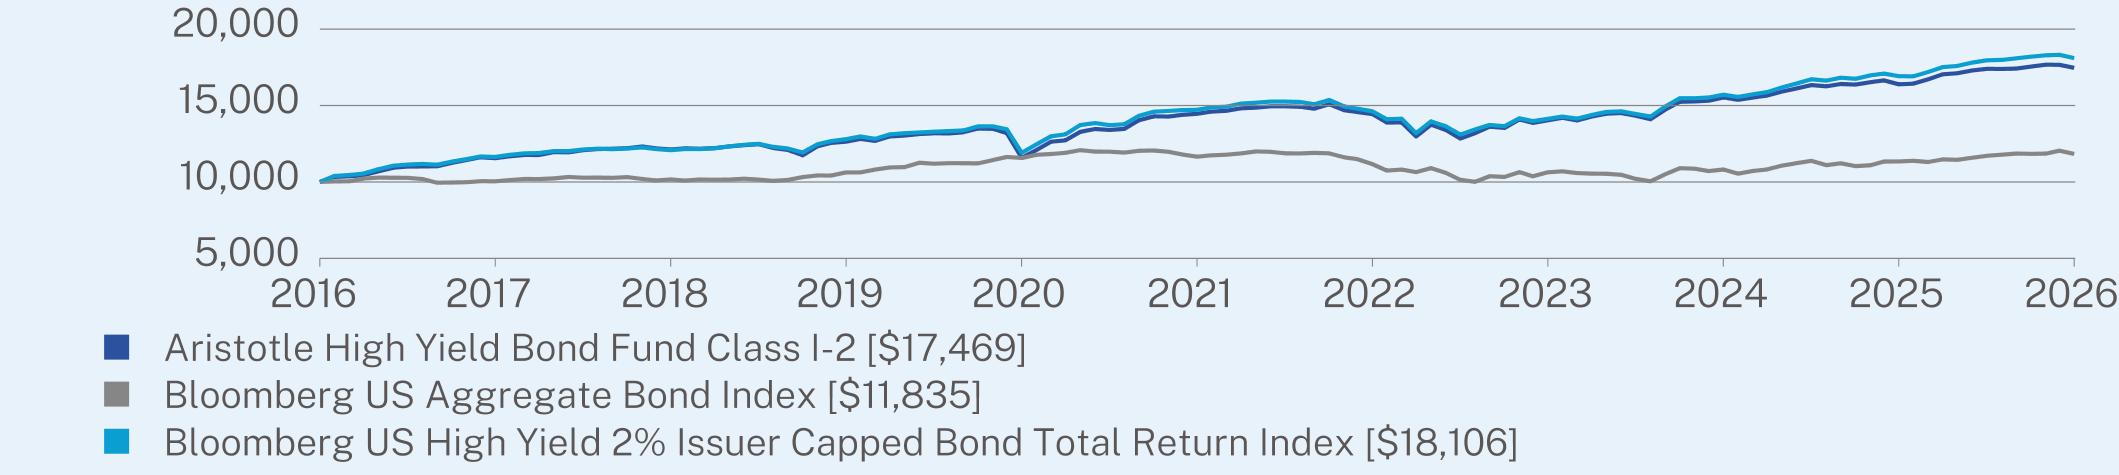
ANNUAL AVERAGE TOTAL RETURN (%)
|
|
1 Year
|
5 Year
|
10 Year
|
|
Class I-2 (without sales charge)
|
6.58
|
3.86
|
5.74
|
|
Bloomberg US Aggregate Bond Index
|
4.35
|
0.31
|
1.70
|
|
Bloomberg US High Yield 2% Issuer Capped Bond Total Return Index
|
7.01
|
4.22
|
6.12
|
Visit https://www.aristotlefunds.com/resources/prospectuses-reports for more recent performance information.
KEY FUND STATISTICS (as of March 31, 2026)
|
Net Assets
|
$109,996,477
|
|
Number of Holdings
|
217
|
|
Net Advisory Fee
|
$499,726
|
|
Portfolio Turnover Rate
|
72%
|
WHAT DID THE FUND INVEST IN? (as of March 31, 2026)*
|
Top 10 Issuers
|
(%)
|
|
TransDigm, Inc.
|
2.7%
|
|
MajorDrive Holdings IV LLC
|
2.6%
|
|
Alliant Holdings Intermediate LLC / Alliant Holdings Co.-Issuer
|
1.8%
|
|
Acrisure LLC / Acrisure Finance, Inc.
|
1.8%
|
|
NCL Corp. Ltd.
|
1.7%
|
|
Energy Transfer LP
|
1.5%
|
|
CCO Holdings LLC / CCO Holdings Capital Corp.
|
1.5%
|
|
Venture Global LNG, Inc.
|
1.5%
|
|
Sunoco LP
|
1.5%
|
|
Antero Midstream Partners LP / Antero Midstream Finance Corp.
|
1.2%
|
Sector Breakdown (%)
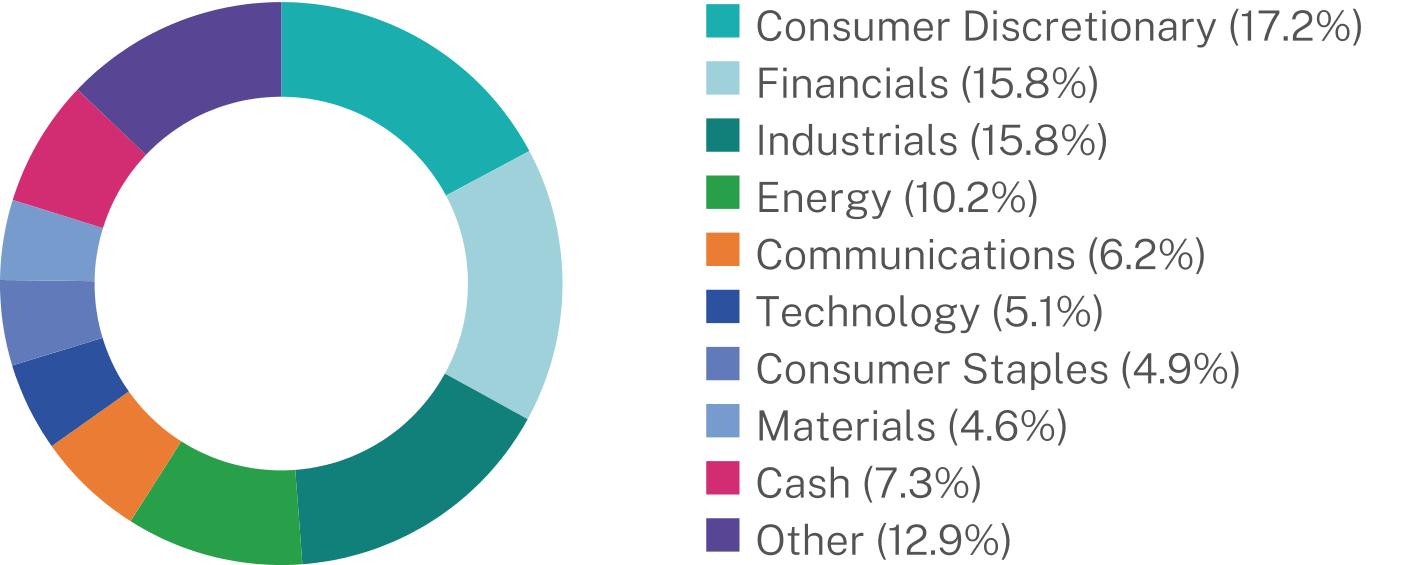
Changes to Fund’s Principal Risks:
In the Fund’s Principal Risks, Securities Lending Risk was added.
Changes to the Fund’s Principal Investment Strategy:
The Fund’s Principal Investment Strategies were revised to note that the Fund may lend its portfolio securities to generate additional income.
This report describes changes to the Fund that occurred during the reporting period.
WHAT WERE THE FUND COSTS FOR THE PAST YEAR? (based on a hypothetical $10,000 investment)
|
Class Name
|
Costs of a $10,000 investment
|
Costs paid as a percentage of a $10,000 investment
|
|
Class A
|
$111
|
1.04%
|
HOW DID THE FUND PERFORM LAST YEAR AND WHAT AFFECTED ITS PERFORMANCE?
|
•
|
For the 12-month period ended March 31, 2026, the Fund underperformed its primary and secondary performance benchmarks, the MSCI EAFE Index (net), and the MSCI ACWI ex USA Index (net), respectively. The Fund invests at least 80% of its assets in publicly traded equity securities or depositary receipts of companies organized, headquartered, or doing a substantial amount of business outside of the United States.
|
|
•
|
The performance explanation is provided relative to the primary benchmark, the MSCI EAFE Index (net). The underperformance of the Fund relative to the MSCI EAFE Index (net) over the 1-year period came from both security and sector allocation.
|
|
•
|
Security selection in the industrials and information technology sectors detracted the most from relative performance. On the other hand, security selection in the energy and financials sectors contributed the most. MonotaRO, Nemetschek and Accenture detracted most from relative returns. Meanwhile, Cameco, Samsung Electronics and Credicorp were the top contributors to relative performance for the year.
|
|
•
|
Certain large benchmark constituents not owned by the Fund, notably ASML, benefited from strong demand for advanced semiconductor equipment driven by continued investment in artificial intelligence infrastructure. As a key supplier to leading-edge chip manufacturers, ASML’s performance reflected its critical role in the semiconductor value chain, and the Fund’s lack of exposure to the company represented a headwind to relative results.
|
|
•
|
From a sector allocation standpoint, an overweight position in the consumer discretionary sector and a lack of exposure to the utilities sector detracted from relative performance. An overweight exposure to the energy sector and a lack of exposure to the communication services sector added value.
|
|
•
|
Regionally, security selection in Developed Europe & Middle East detracted most from relative return, while security selection in Emerging Markets contributed. An underweight allocation to Developed Asia detracted from relative performance but was offset by the Fund’s exposure to Canada.
|
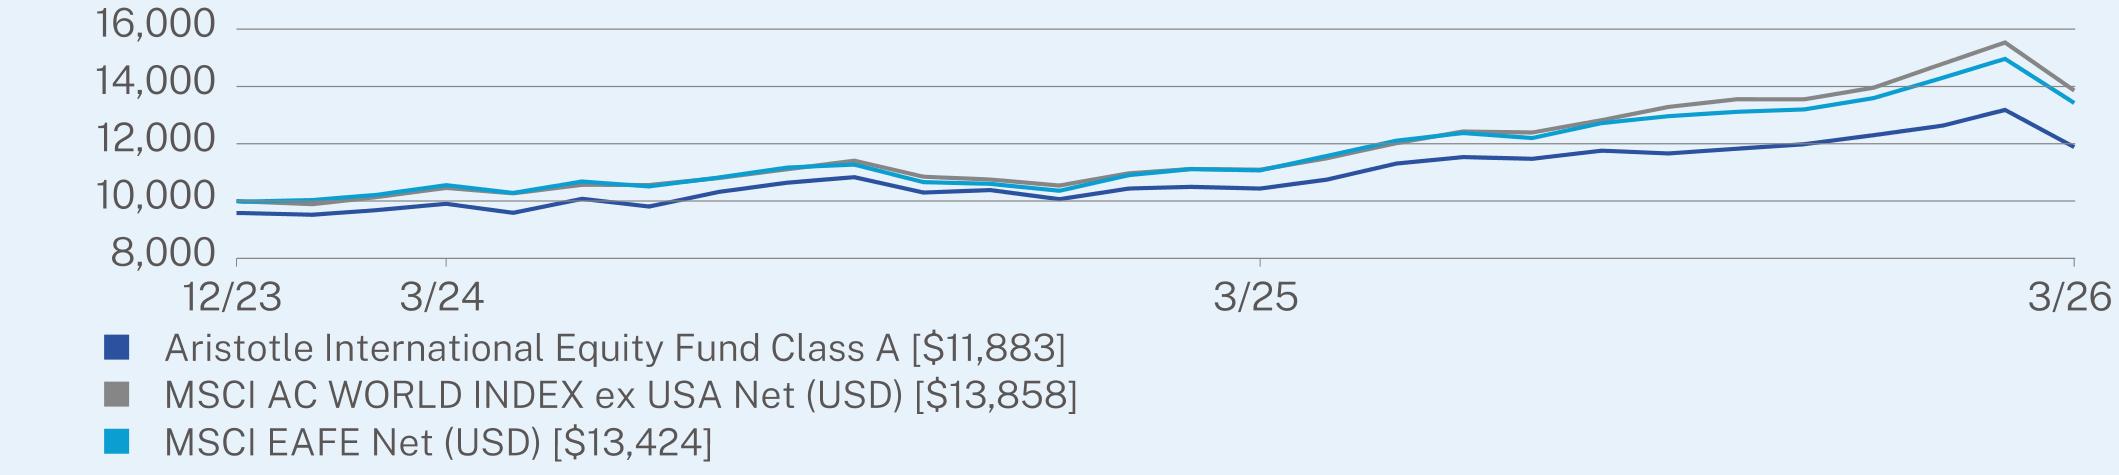
ANNUAL AVERAGE TOTAL RETURN (%)
|
|
1 Year
|
Since Inception
(12/28/2023) |
|
Class A (without sales charge)
|
13.86
|
10.02
|
|
Class A (with sales charge)
|
9.05
|
7.94
|
|
MSCI AC WORLD INDEX ex USA Net (USD)
|
24.91
|
15.55
|
|
MSCI EAFE Net (USD)
|
21.27
|
13.93
|
Visit https://www.aristotlefunds.com/resources/prospectuses-reports for more recent performance information.
KEY FUND STATISTICS (as of March 31, 2026)
|
Net Assets
|
$577,399,742
|
|
Number of Holdings
|
40
|
|
Net Advisory Fee
|
$3,412,164
|
|
Portfolio Turnover Rate
|
17%
|
WHAT DID THE FUND INVEST IN? (as of March 31, 2026)*
|
Top 10 Issuers
|
(%)
|
|
Cameco Corp.
|
4.9%
|
|
Credicorp Ltd.
|
4.5%
|
|
Brookfield Corp.
|
4.2%
|
|
Safran SA
|
4.1%
|
|
Erste Group Bank AG
|
4.0%
|
|
DBS Group Holdings Ltd.
|
3.9%
|
|
Samsung Electronics Co. Ltd.
|
3.7%
|
|
Roche Holding AG
|
3.5%
|
|
Pan Pacific International Holdings Corp.
|
3.4%
|
|
Sony Group Corp.
|
3.2%
|
Sector Breakdown (%)**

|
Top Ten Countries
|
(%)
|
|
Japan
|
16.7%
|
|
United Kingdom
|
12.2%
|
|
France
|
10.5%
|
|
Canada
|
9.0%
|
|
Switzerland
|
6.4%
|
|
Germany
|
6.2%
|
|
Hong Kong
|
4.7%
|
|
Peru
|
4.5%
|
|
Cash
|
1.9%
|
|
Other
|
27.9%
|
Changes to Fund’s Principal Risks:
In the Fund’s Principal Risks, Large-Capitalization Companies Risk, Small-Capitalization Companies Risk, Mid-Capitalization Companies Risk, ETF Risk, Liquidity Risk and Securities Lending Risk were added.
Changes to the Fund’s Principal Investment Strategy:
The Fund’s Principal Investment Strategies were revised to note that the Fund may invest in exchange traded funds and may lend its portfolio securities to generate additional income.
This report describes changes to the Fund that occurred during the reporting period.
WHAT WERE THE FUND COSTS FOR THE PAST YEAR? (based on a hypothetical $10,000 investment)
|
Class Name
|
Costs of a $10,000 investment
|
Costs paid as a percentage of a $10,000 investment
|
|
Class I
|
$85
|
0.79%
|
HOW DID THE FUND PERFORM LAST YEAR AND WHAT AFFECTED ITS PERFORMANCE?
|
•
|
For the 12-month period ended March 31, 2026, the Fund underperformed its primary and secondary performance benchmarks, the MSCI EAFE Index (net), and the MSCI ACWI ex USA Index (net), respectively. The Fund invests at least 80% of its assets in publicly traded equity securities or depositary receipts of companies organized, headquartered, or doing a substantial amount of business outside of the United States.
|
|
•
|
The performance explanation is provided relative to the primary benchmark, the MSCI EAFE Index (net). The underperformance of the Fund relative to the MSCI EAFE Index (net) over the 1-year period came from both security and sector allocation.
|
|
•
|
Security selection in the industrials and information technology sectors detracted the most from relative performance. On the other hand, security selection in the energy and financials sectors contributed the most. MonotaRO, Nemetschek and Accenture detracted most from relative returns. Meanwhile, Cameco, Samsung Electronics and Credicorp were the top contributors to relative performance for the year.
|
|
•
|
Certain large benchmark constituents not owned by the Fund, notably ASML, benefited from strong demand for advanced semiconductor equipment driven by continued investment in artificial intelligence infrastructure. As a key supplier to leading-edge chip manufacturers, ASML’s performance reflected its critical role in the semiconductor value chain, and the Fund’s lack of exposure to the company represented a headwind to relative results.
|
|
•
|
From a sector allocation standpoint, an overweight position in the consumer discretionary sector and a lack of exposure to the utilities sector detracted from relative performance. An overweight exposure to the energy sector and a lack of exposure to the communication services sector added value.
|
|
•
|
Regionally, security selection in Developed Europe & Middle East detracted most from relative return, while security selection in Emerging Markets contributed. An underweight allocation to Developed Asia detracted from relative performance but was offset by the Fund’s exposure to Canada.
|
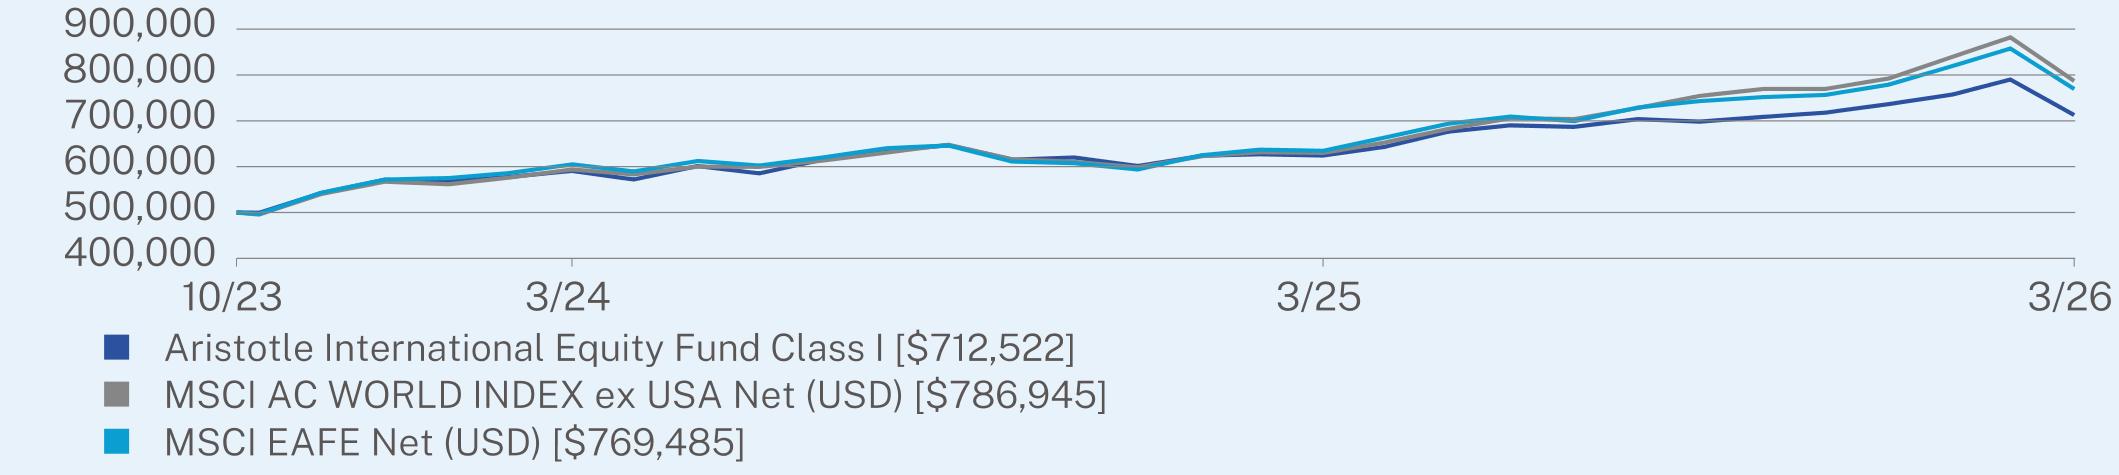
ANNUAL AVERAGE TOTAL RETURN (%)
|
|
1 Year
|
Since Inception
(10/20/2023) |
|
Class I (without sales charge)
|
14.13
|
15.58
|
|
MSCI AC WORLD INDEX ex USA Net (USD)
|
24.91
|
20.37
|
|
MSCI EAFE Net (USD)
|
21.27
|
19.27
|
Visit https://www.aristotlefunds.com/resources/prospectuses-reports for more recent performance information.
KEY FUND STATISTICS (as of March 31, 2026)
|
Net Assets
|
$577,399,742
|
|
Number of Holdings
|
40
|
|
Net Advisory Fee
|
$3,412,164
|
|
Portfolio Turnover Rate
|
17%
|
WHAT DID THE FUND INVEST IN? (as of March 31, 2026)*
|
Top 10 Issuers
|
(%)
|
|
Cameco Corp.
|
4.9%
|
|
Credicorp Ltd.
|
4.5%
|
|
Brookfield Corp.
|
4.2%
|
|
Safran SA
|
4.1%
|
|
Erste Group Bank AG
|
4.0%
|
|
DBS Group Holdings Ltd.
|
3.9%
|
|
Samsung Electronics Co. Ltd.
|
3.7%
|
|
Roche Holding AG
|
3.5%
|
|
Pan Pacific International Holdings Corp.
|
3.4%
|
|
Sony Group Corp.
|
3.2%
|
Sector Breakdown (%)**

|
Top Ten Countries
|
(%)
|
|
Japan
|
16.7%
|
|
United Kingdom
|
12.2%
|
|
France
|
10.5%
|
|
Canada
|
9.0%
|
|
Switzerland
|
6.4%
|
|
Germany
|
6.2%
|
|
Hong Kong
|
4.7%
|
|
Peru
|
4.5%
|
|
Cash
|
1.9%
|
|
Other
|
27.9%
|
Changes to Fund’s Principal Risks:
In the Fund’s Principal Risks, Large-Capitalization Companies Risk, Small-Capitalization Companies Risk, Mid-Capitalization Companies Risk, ETF Risk, Liquidity Risk and Securities Lending Risk were added.
Changes to the Fund’s Principal Investment Strategy:
The Fund’s Principal Investment Strategies were revised to note that the Fund may invest in exchange traded funds and may lend its portfolio securities to generate additional income.
This report describes changes to the Fund that occurred during the reporting period.
WHAT WERE THE FUND COSTS FOR THE PAST YEAR? (based on a hypothetical $10,000 investment)
|
Class Name
|
Costs of a $10,000 investment
|
Costs paid as a percentage of a $10,000 investment
|
|
Class I-2
|
$85
|
0.79%
|
HOW DID THE FUND PERFORM LAST YEAR AND WHAT AFFECTED ITS PERFORMANCE?
|
•
|
For the 12-month period ended March 31, 2026, the Fund underperformed its primary and secondary performance benchmarks, the MSCI EAFE Index (net), and the MSCI ACWI ex USA Index (net), respectively. The Fund invests at least 80% of its assets in publicly traded equity securities or depositary receipts of companies organized, headquartered, or doing a substantial amount of business outside of the United States.
|
|
•
|
The performance explanation is provided relative to the primary benchmark, the MSCI EAFE Index (net). The underperformance of the Fund relative to the MSCI EAFE Index (net) over the 1-year period came from both security and sector allocation.
|
|
•
|
Security selection in the industrials and information technology sectors detracted the most from relative performance. On the other hand, security selection in the energy and financials sectors contributed the most. MonotaRO, Nemetschek and Accenture detracted most from relative returns. Meanwhile, Cameco, Samsung Electronics and Credicorp were the top contributors to relative performance for the year.
|
|
•
|
Certain large benchmark constituents not owned by the Fund, notably ASML, benefited from strong demand for advanced semiconductor equipment driven by continued investment in artificial intelligence infrastructure. As a key supplier to leading-edge chip manufacturers, ASML’s performance reflected its critical role in the semiconductor value chain, and the Fund’s lack of exposure to the company represented a headwind to relative results.
|
|
•
|
From a sector allocation standpoint, an overweight position in the consumer discretionary sector and a lack of exposure to the utilities sector detracted from relative performance. An overweight exposure to the energy sector and a lack of exposure to the communication services sector added value.
|
|
•
|
Regionally, security selection in Developed Europe & Middle East detracted most from relative return, while security selection in Emerging Markets contributed. An underweight allocation to Developed Asia detracted from relative performance but was offset by the Fund’s exposure to Canada.
|
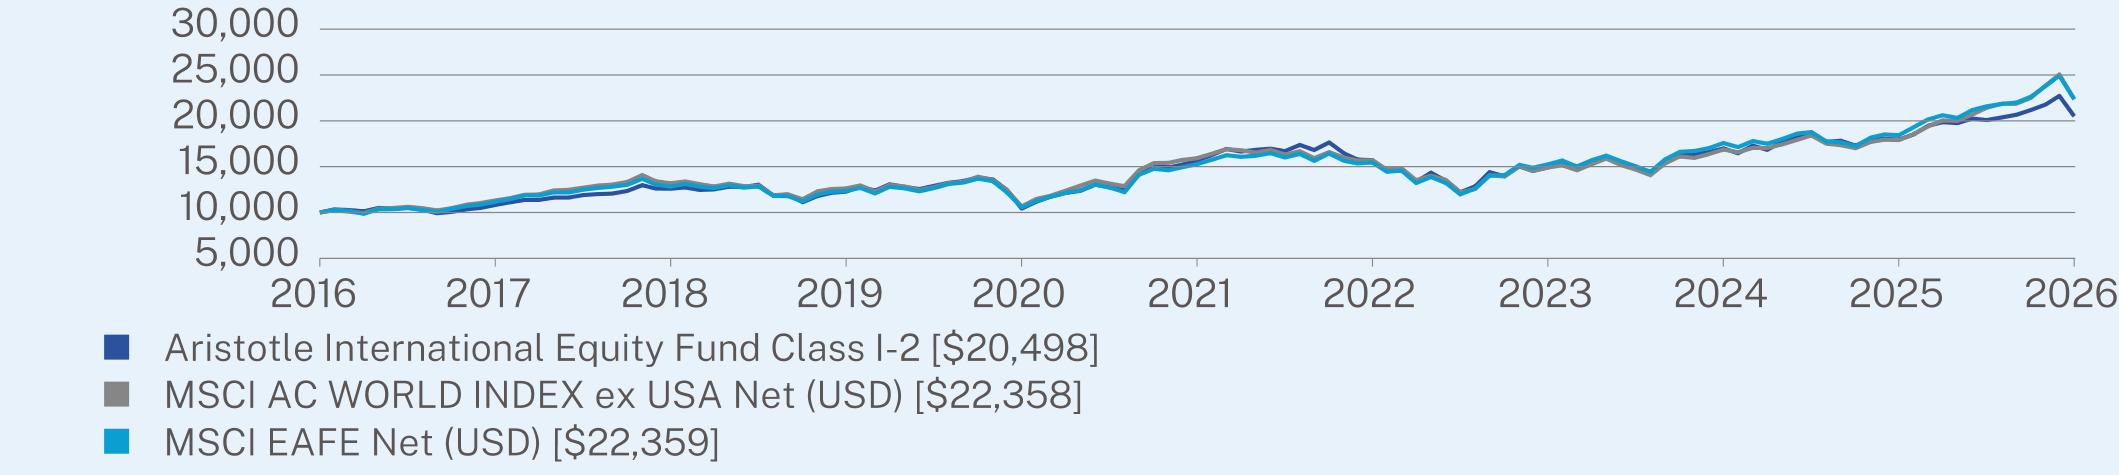
ANNUAL AVERAGE TOTAL RETURN (%)
|
|
1 Year
|
5 Year
|
10 Year
|
|
Class I-2 (without sales charge)
|
14.15
|
5.52
|
7.44
|
|
MSCI AC WORLD INDEX ex USA Net (USD)
|
24.91
|
7.02
|
8.38
|
|
MSCI EAFE Net (USD)
|
21.27
|
7.91
|
8.38
|
Visit https://www.aristotlefunds.com/resources/prospectuses-reports for more recent performance information.
KEY FUND STATISTICS (as of March 31, 2026)
|
Net Assets
|
$577,399,742
|
|
Number of Holdings
|
40
|
|
Net Advisory Fee
|
$3,412,164
|
|
Portfolio Turnover Rate
|
17%
|
WHAT DID THE FUND INVEST IN? (as of March 31, 2026)*
|
Top 10 Issuers
|
(%)
|
|
Cameco Corp.
|
4.9%
|
|
Credicorp Ltd.
|
4.5%
|
|
Brookfield Corp.
|
4.2%
|
|
Safran SA
|
4.1%
|
|
Erste Group Bank AG
|
4.0%
|
|
DBS Group Holdings Ltd.
|
3.9%
|
|
Samsung Electronics Co. Ltd.
|
3.7%
|
|
Roche Holding AG
|
3.5%
|
|
Pan Pacific International Holdings Corp.
|
3.4%
|
|
Sony Group Corp.
|
3.2%
|
Sector Breakdown (%)**

|
Top Ten Countries
|
(%)
|
|
Japan
|
16.7%
|
|
United Kingdom
|
12.2%
|
|
France
|
10.5%
|
|
Canada
|
9.0%
|
|
Switzerland
|
6.4%
|
|
Germany
|
6.2%
|
|
Hong Kong
|
4.7%
|
|
Peru
|
4.5%
|
|
Cash
|
1.9%
|
|
Other
|
27.9%
|
Changes to Fund’s Principal Risks:
In the Fund’s Principal Risks, Large-Capitalization Companies Risk, Small-Capitalization Companies Risk, Mid-Capitalization Companies Risk, ETF Risk, Liquidity Risk and Securities Lending Risk were added.
Changes to the Fund’s Principal Investment Strategy:
The Fund’s Principal Investment Strategies were revised to note that the Fund may invest in exchange traded funds and may lend its portfolio securities to generate additional income.
WHAT WERE THE FUND COSTS FOR THE PAST YEAR? (based on a hypothetical $10,000 investment)
|
Class Name
|
Costs of a $10,000 investment*
|
Costs paid as a percentage of a $10,000 investment**
|
|
Aristotle Pacific EXclusive Fund Series H
|
$2
|
0.03%
|
HOW DID THE FUND PERFORM LAST YEAR AND WHAT AFFECTED ITS PERFORMANCE?
|
•
|
Since its inception on June 23, 2025, the Fund underperformed its performance benchmark, the Bloomberg US Aggregate Bond Index. The Fund primarily invests in non-investment grade (high yield/high risk, sometimes called “junk bonds”) debt instruments or in instruments with characteristics of non-investment grade debt instruments.
|
|
•
|
The Fund’s underperformance is, in part, attributable to a lack of exposure to lower-quality distressed credits that benefited during portions of the period. The Fund did benefit from a supportive rate environment as well as generally compressed credit spreads.
|
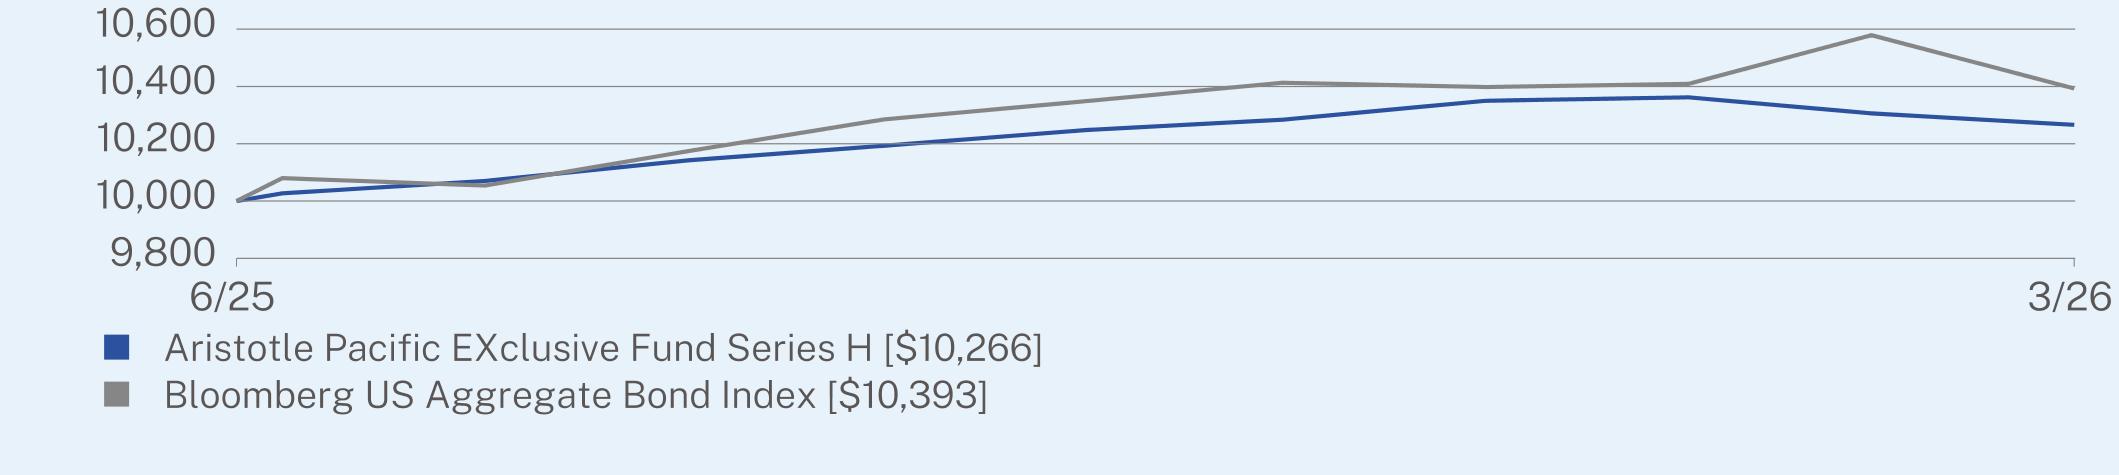
CUMULATIVE TOTAL RETURN (%)
|
|
Since Inception
(06/23/2025) |
|
Aristotle Pacific EXclusive Fund Series H (without sales charge)
|
2.66
|
|
Bloomberg US Aggregate Bond Index
|
3.93
|
Visit https://www.aristotlefunds.com/resources/prospectuses-reports for more recent performance information.
KEY FUND STATISTICS (as of March 31, 2026)
|
Net Assets
|
$5,252,115
|
|
Number of Holdings
|
56
|
|
Net Advisory Fee
|
$0
|
|
Portfolio Turnover Rate
|
33%
|
WHAT DID THE FUND INVEST IN? (as of March 31, 2026)*
|
Top 10 Issuers
|
(%)
|
|
Banco Mercantil del Norte SA/Grand Cayman
|
3.8%
|
|
TK Elevator US Newco, Inc.
|
3.8%
|
|
Colossus Acquireco LLC
|
3.8%
|
|
USI, Inc.
|
3.8%
|
|
Indicor LLC
|
3.8%
|
|
CoreLogic, Inc.
|
3.6%
|
|
TransDigm, Inc.
|
3.4%
|
|
Burford Capital Global Finance LLC
|
3.2%
|
|
Avolon TLB Borrower 1 US LLC
|
2.8%
|
|
Quikrete Holdings, Inc.
|
2.8%
|
Sector Breakdown (%)
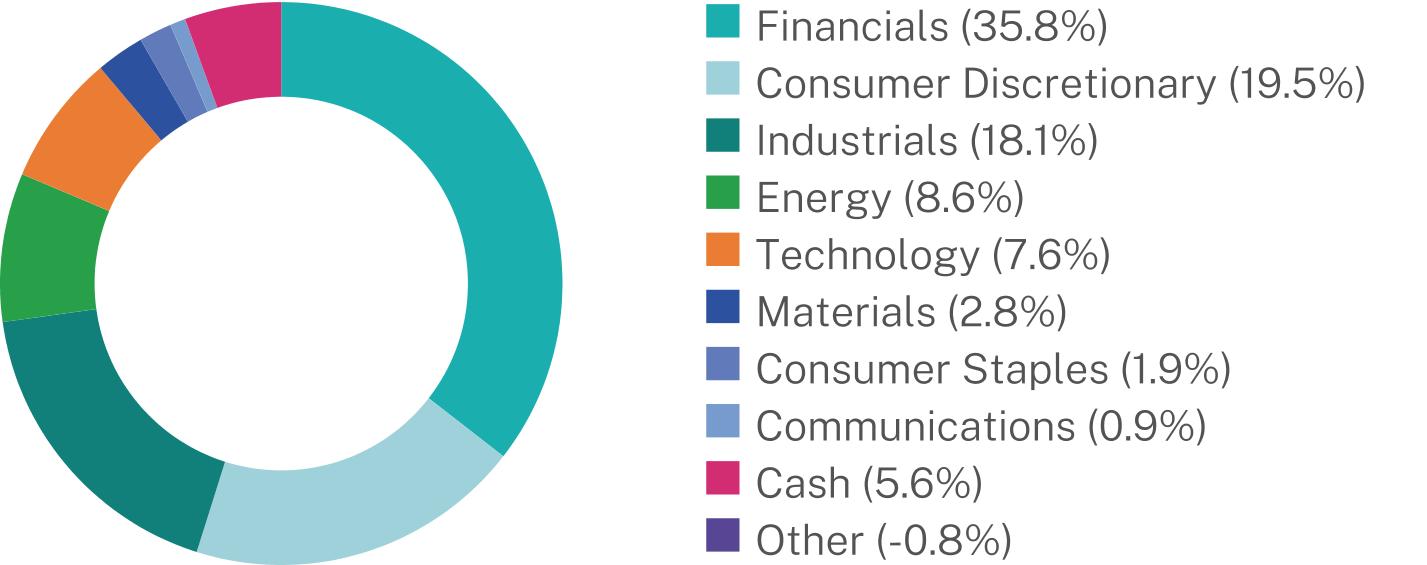
WHAT WERE THE FUND COSTS FOR THE PAST YEAR? (based on a hypothetical $10,000 investment)
|
Class Name
|
Costs of a $10,000 investment*
|
Costs paid as a percentage of a $10,000 investment**
|
|
Aristotle Pacific EXclusive Fund Series I
|
$0
|
0.00%
|
HOW DID THE FUND PERFORM LAST YEAR AND WHAT AFFECTED ITS PERFORMANCE?
|
•
|
Since its inception on June 23, 2025, the Fund underperformed its performance benchmark, the Bloomberg US Aggregate Bond Index. The Fund primarily invests in a broad range of investment grade debt securities, including corporate bonds, mortgage-related securities, asset-backed securities, debt securities issued by the U.S. government or its related agencies, debt securities issued by states or local governments and their agencies, authorities and other instrumentalities, U.S. dollar-denominated debt securities issued by developed foreign governments and corporations and floating and variable rate debt instruments; structured notes, including hybrid or “indexed” securities and event-linked bonds; delayed funding loans and revolving credit facilities; bank certificates of deposit; fixed time deposits and bankers’ acceptances; repurchase agreements and reverse repurchase agreements.
|
|
•
|
Investment grade bonds were not immune to the risk-off environment and generated largely negative returns recently, with performance favoring short maturities and higher-rated bonds within the universe.
|
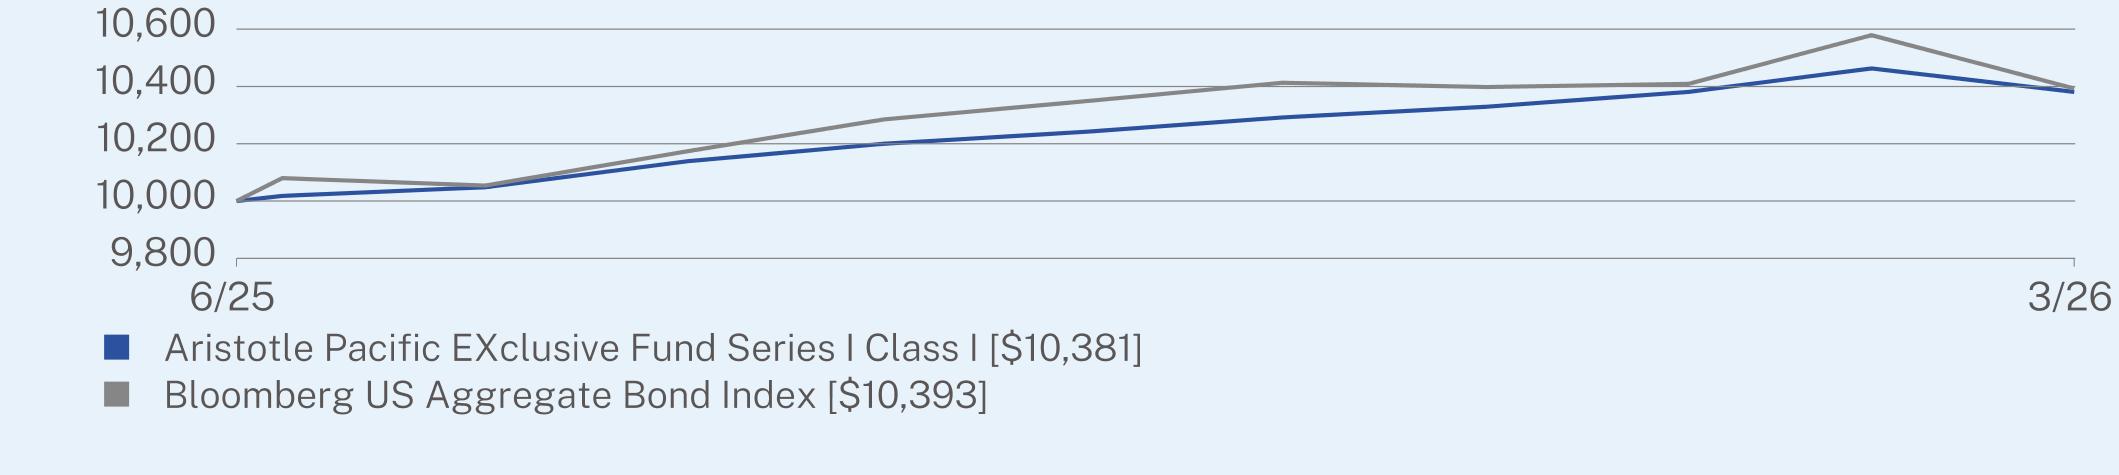
CUMULATIVE TOTAL RETURN (%)
|
|
Since Inception
(06/23/2025) |
|
Aristotle Pacific EXclusive Fund Series I (without sales charge)
|
3.81
|
|
Bloomberg US Aggregate Bond Index
|
3.93
|
Visit https://www.aristotlefunds.com/resources/prospectuses-reports for more recent performance information.
KEY FUND STATISTICS (as of March 31, 2026)
|
Net Assets
|
$3,551,644
|
|
Number of Holdings
|
43
|
|
Net Advisory Fee
|
$0
|
|
Portfolio Turnover Rate
|
44%
|
WHAT DID THE FUND INVEST IN? (as of March 31, 2026)*
|
Top 10 Issuers
|
(%)
|
|
Elmwood CLO Ltd.
|
7.0%
|
|
BRAVO Residential Funding Trust, Series 2024-NQM3
|
4.4%
|
|
Angel Oak Mortgage Trust LLC, Series 2025-7
|
3.8%
|
|
Upstart Securitization Trust
|
3.7%
|
|
BRAVO Residential Funding Trust, Series 2025-NQM6
|
3.3%
|
|
Angel Oak Mortgage Trust LLC, Series 2025-4
|
3.2%
|
|
Northwestern Mutual Life Insurance Co.
|
2.9%
|
|
JPMorgan Chase & Co.
|
2.9%
|
|
Bank of America Corp.
|
2.9%
|
|
ROCK Trust 2024-CNTR
|
2.9%
|
Sector Breakdown (%)
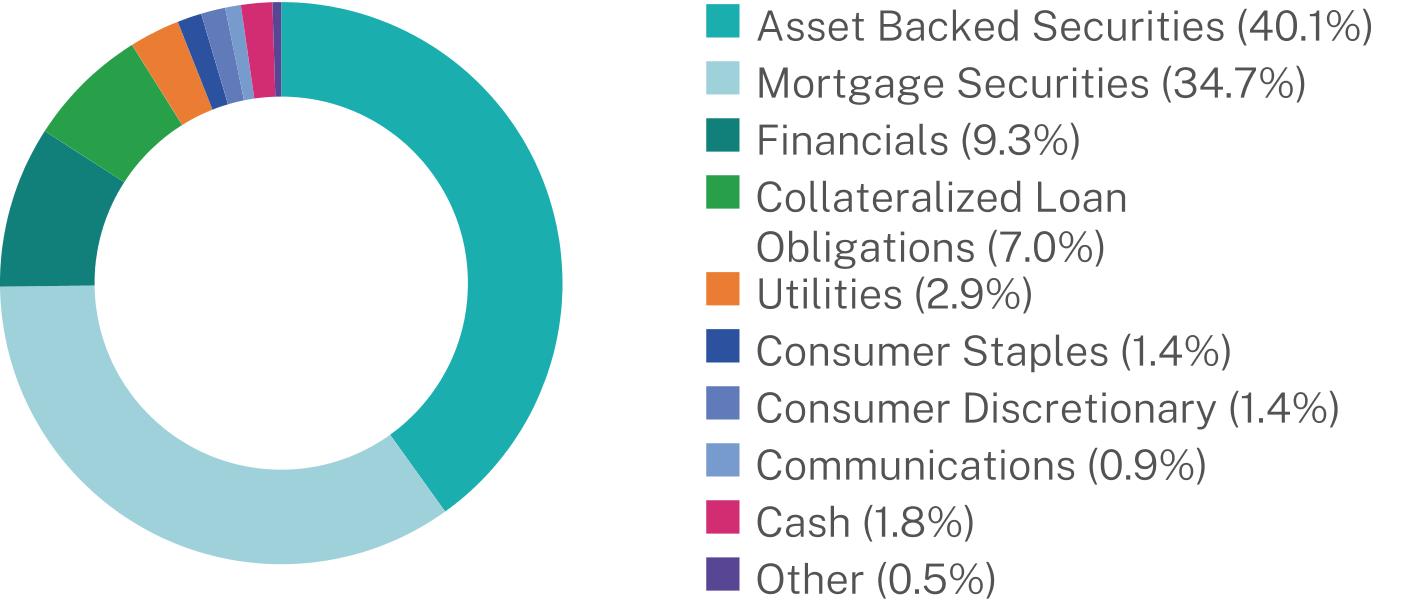
This report describes changes to the Fund that occurred during the reporting period.
WHAT WERE THE FUND COSTS FOR THE PAST YEAR? (based on a hypothetical $10,000 investment)
|
Class Name
|
Costs of a $10,000 investment
|
Costs paid as a percentage of a $10,000 investment
|
|
Class A
|
$76
|
0.70%
|
HOW DID THE FUND PERFORM LAST YEAR AND WHAT AFFECTED ITS PERFORMANCE?
|
•
|
For the 12-month period ended March 31, 2026, the Fund outperformed the Aristotle Portfolio Optimization Aggressive Growth Composite Benchmark1. The Fund is a “fund of funds” that seeks to achieve its investment goal by investing in a combination of underlying funds, including funds that are actively managed by an affiliate of the investment adviser and unaffiliated ETFs, including passively managed funds that seek to track the performance of a benchmark index.
|
|
•
|
For the 12-month period ending March 31, 2026, both equity and fixed income markets ended in positive territory.
|
|
•
|
Equities delivered double-digit positive returns despite sharp pullbacks in April 2025 amidst tariff worries, and in March 2026 due to the Iran war and energy price shock.
|
|
•
|
Both developed and emerging market international equities outperformed the U.S. over the period.
|
|
•
|
Fixed income had a strong 2025 but gave back some of the gains as interest rates rose in March 2026. Credit spreads remained near historically tight levels.
|
|
•
|
The Fund was positioned to be overweight U.S. equity and slightly underweight to international equity and fixed income.
|
|
•
|
Top contributors from asset allocation came from an overweight to international large-cap value equity and an underweight to U.S. core bond, while top detractors came from the underweight to U.S. small-cap growth equity and overweight to U.S. short-term bond.
|
|
•
|
Top contributors within manager research came from an outperformance by U.S. large-cap growth and U.S. large-cap value equity, while top detractors came from international large-cap value and growth equity.
|
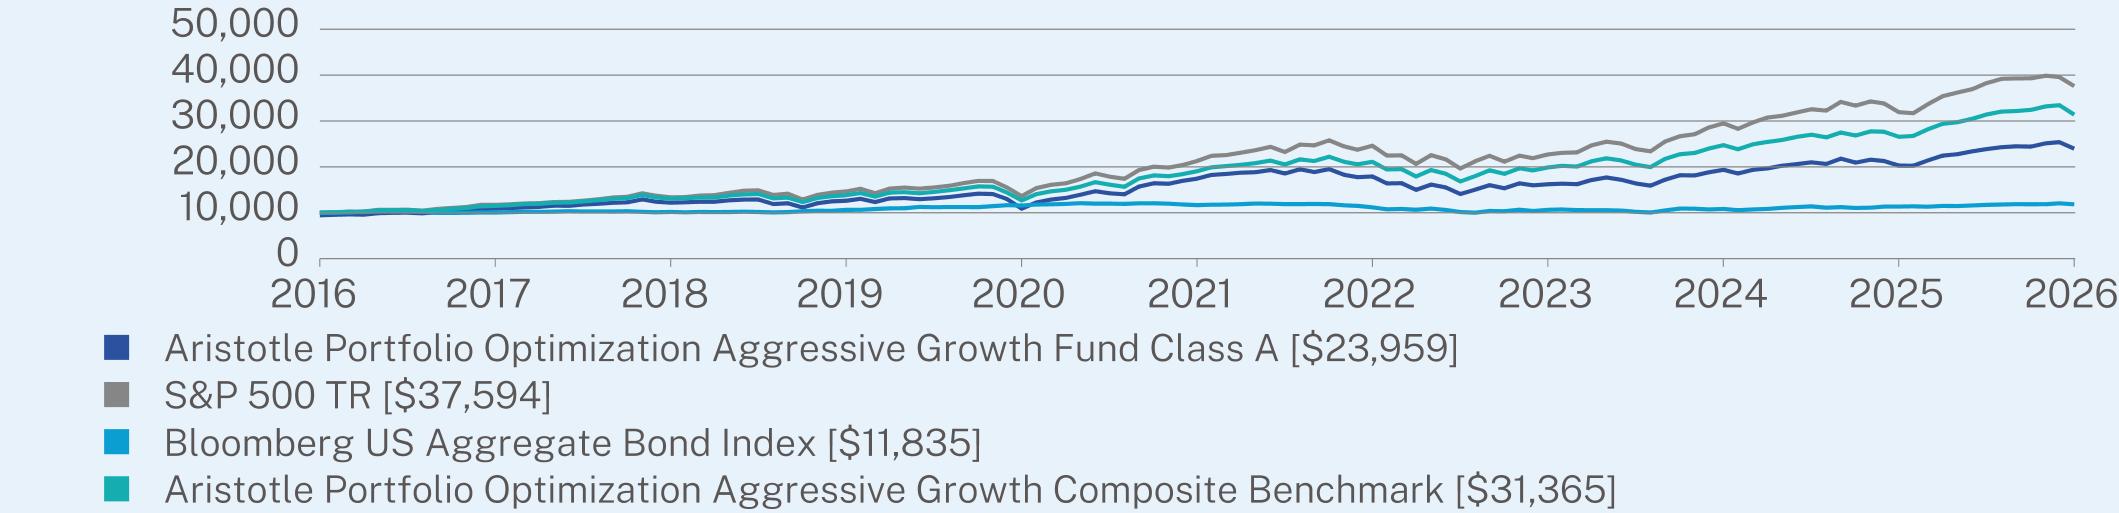
ANNUAL AVERAGE TOTAL RETURN (%)
|
|
1 Year
|
5 Year
|
10 Year
|
|
Class A (without sales charge)
|
18.27
|
6.58
|
9.75
|
|
Class A (with sales charge)
|
11.74
|
5.38
|
9.13
|
|
S&P 500 TR
|
17.80
|
12.06
|
14.16
|
|
Bloomberg US Aggregate Bond Index
|
4.35
|
0.31
|
1.70
|
|
Aristotle Portfolio Optimization Aggressive Growth Composite Benchmark
|
18.16
|
10.50
|
12.11
|
Visit https://www.aristotlefunds.com/resources/prospectuses-reports for more recent performance information.
KEY FUND STATISTICS (as of March 31, 2026)
|
Net Assets
|
$272,119,049
|
|
Number of Holdings
|
21
|
|
Net Advisory Fee
|
$553,358
|
|
Portfolio Turnover Rate
|
33%
|
WHAT DID THE FUND INVEST IN? (as of March 31, 2026)*
|
Top 10 Issuers
|
(%)
|
|
Aristotle Core Equity Fund
|
21.0%
|
|
Aristotle Growth Equity Fund
|
14.0%
|
|
iShares Russell 1000 Value ETF
|
10.0%
|
|
Aristotle International Equity Fund
|
9.0%
|
|
iShares Russell 2000 Value ETF
|
8.9%
|
|
iShares Russell Mid-Cap Value ETF
|
7.0%
|
|
iShares Russell Mid-Cap Growth ETF
|
6.0%
|
|
iShares Russell 2000 Growth ETF
|
6.0%
|
|
iShares Core MSCI Emerging Markets ETF
|
3.6%
|
|
Aristotle High Yield Bond Fund
|
3.0%
|
Security Type Breakdown (%)

Changes to Fund’s Principal Risks:
In the Fund’s Principal Risks, Securities Lending Risk was added.
In the Fund’s Principal Risks from Holdings in Underlying Funds, Debt Securities Risk, Liquidiy Risk, Financial Sector Risk, Industrials Sector Risk, Industry Concentration Risk, Healthcare Sector Risk and Securities Lending Risk were added and Geographic Focus Risk was removed.
Changes to the Fund’s Principal Investment Strategy:
The Fund’s Principal Investment Strategies were revised to note that the Fund may lend its portfolio securities to generate additional income.
Changes to Fund’s Portfolio Manager or Portfolio Management Team:
Effective July 29, 2025, Howard T. Hirakawa was no longer a portfolio manager of the Fund.
This report describes changes to the Fund that occurred during the reporting period.
WHAT WERE THE FUND COSTS FOR THE PAST YEAR? (based on a hypothetical $10,000 investment)
|
Class Name
|
Costs of a $10,000 investment
|
Costs paid as a percentage of a $10,000 investment
|
|
Class C
|
$158
|
1.45%
|
HOW DID THE FUND PERFORM LAST YEAR AND WHAT AFFECTED ITS PERFORMANCE?
|
•
|
For the 12-month period ended March 31, 2026, the Fund underperformed the Aristotle Portfolio Optimization Aggressive Growth Composite Benchmark1. The Fund is a “fund of funds” that seeks to achieve its investment goal by investing in a combination of underlying funds, including funds that are actively managed by an affiliate of the investment adviser and unaffiliated ETFs, including passively managed funds that seek to track the performance of a benchmark index.
|
|
•
|
For the 12-month period ending March 31, 2026, both equity and fixed income markets ended in positive territory.
|
|
•
|
Equities delivered double-digit positive returns despite sharp pullbacks in April 2025 amidst tariff worries, and in March 2026 due to the Iran war and energy price shock.
|
|
•
|
Both developed and emerging market international equities outperformed the U.S. over the period.
|
|
•
|
Fixed income had a strong 2025 but gave back some of the gains as interest rates rose in March 2026. Credit spreads remained near historically tight levels.
|
|
•
|
The Fund was positioned to be overweight U.S. equity and slightly underweight to international equity and fixed income.
|
|
•
|
Top contributors from asset allocation came from an overweight to international large-cap value equity and an underweight to U.S. core bond, while top detractors came from the underweight to U.S. small-cap growth equity and overweight to U.S. short-term bond.
|
|
•
|
Top contributors within manager research came from an outperformance by U.S. large-cap growth and U.S. large-cap value equity, while top detractors came from international large-cap value and growth equity.
|
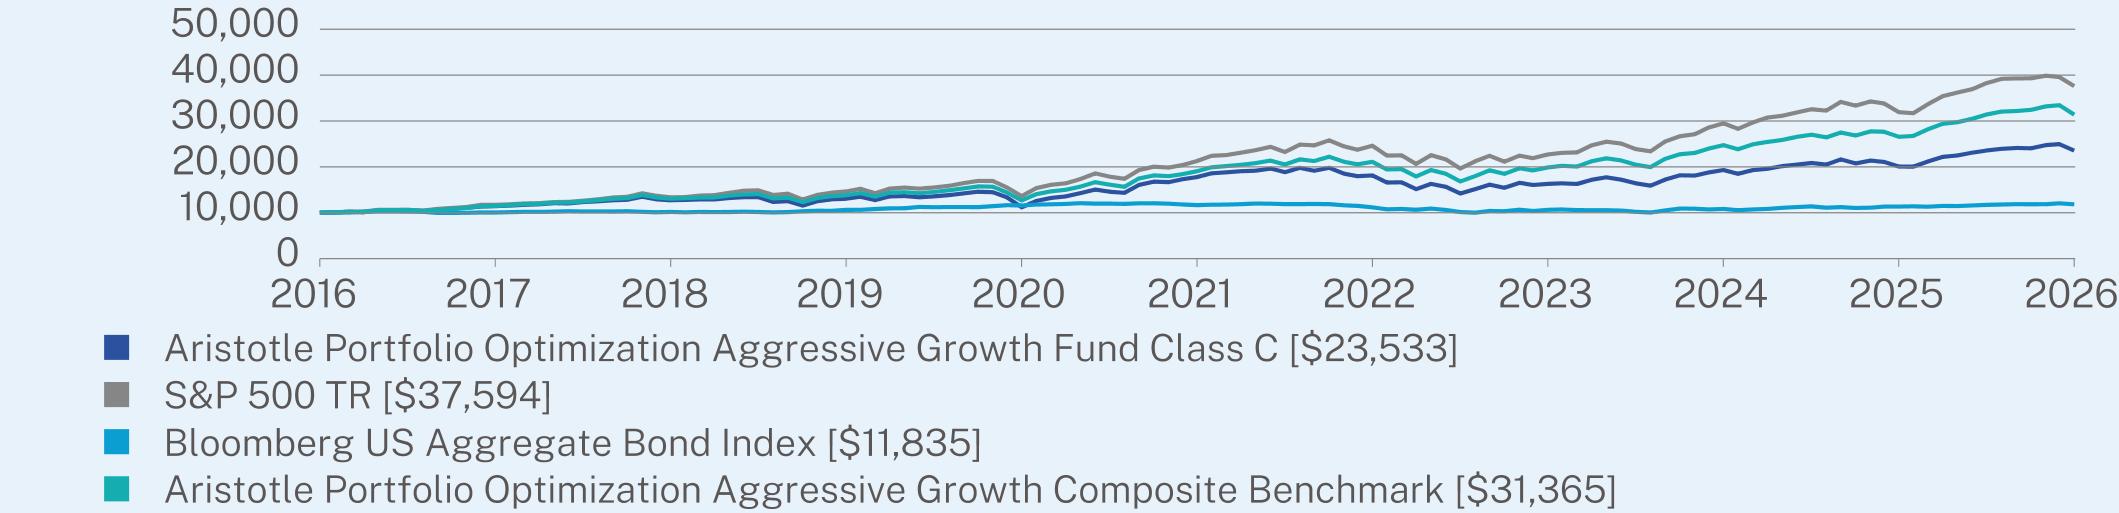
ANNUAL AVERAGE TOTAL RETURN (%)
|
|
1 Year
|
5 Year
|
10 Year
|
|
Class C (without sales charge)
|
17.32
|
5.78
|
8.94
|
|
Class C (with sales charge)
|
16.32
|
5.78
|
8.94
|
|
S&P 500 TR
|
17.80
|
12.06
|
14.16
|
|
Bloomberg US Aggregate Bond Index
|
4.35
|
0.31
|
1.70
|
|
Aristotle Portfolio Optimization Aggressive Growth Composite Benchmark
|
18.16
|
10.50
|
12.11
|
Visit https://www.aristotlefunds.com/resources/prospectuses-reports for more recent performance information.
KEY FUND STATISTICS (as of March 31, 2026)
|
Net Assets
|
$272,119,049
|
|
Number of Holdings
|
21
|
|
Net Advisory Fee
|
$553,358
|
|
Portfolio Turnover Rate
|
33%
|
WHAT DID THE FUND INVEST IN? (as of March 31, 2026)*
|
Top 10 Issuers
|
(%)
|
|
Aristotle Core Equity Fund
|
21.0%
|
|
Aristotle Growth Equity Fund
|
14.0%
|
|
iShares Russell 1000 Value ETF
|
10.0%
|
|
Aristotle International Equity Fund
|
9.0%
|
|
iShares Russell 2000 Value ETF
|
8.9%
|
|
iShares Russell Mid-Cap Value ETF
|
7.0%
|
|
iShares Russell Mid-Cap Growth ETF
|
6.0%
|
|
iShares Russell 2000 Growth ETF
|
6.0%
|
|
iShares Core MSCI Emerging Markets ETF
|
3.6%
|
|
Aristotle High Yield Bond Fund
|
3.0%
|
Security Type Breakdown (%)
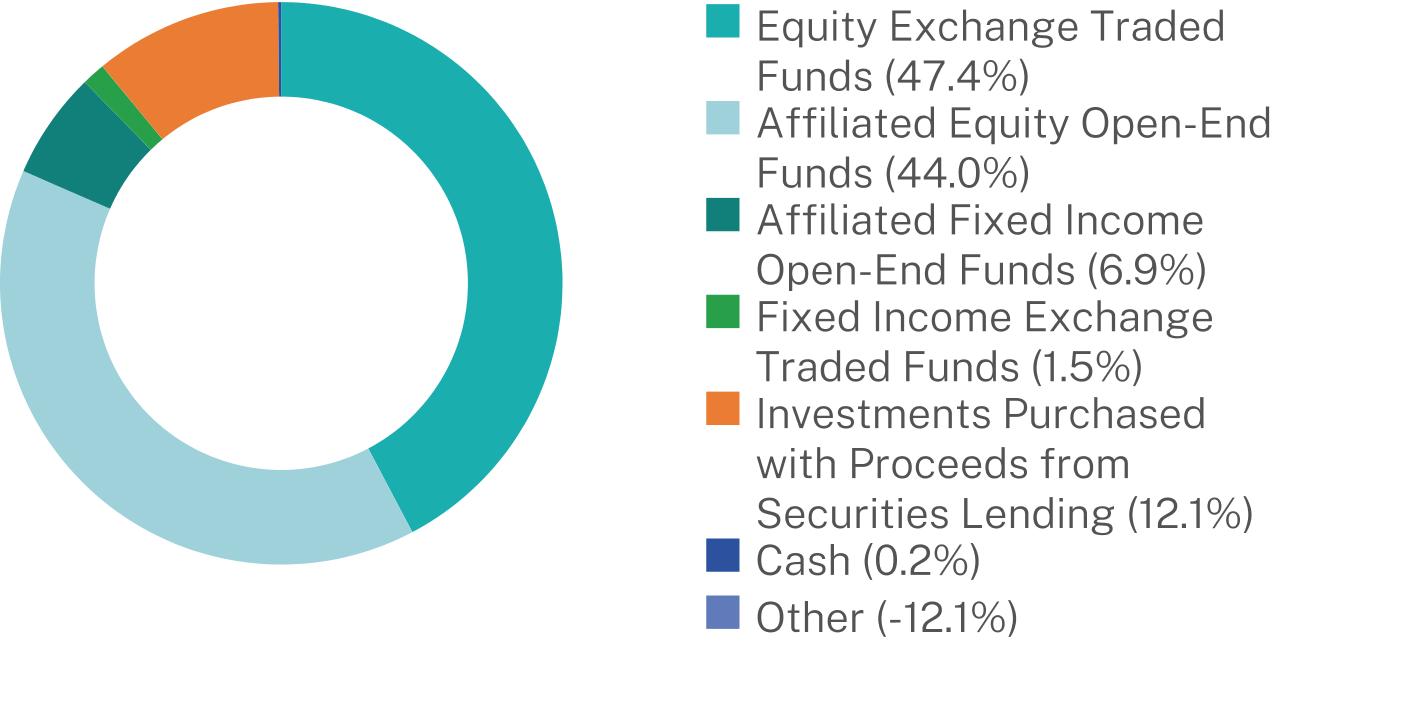
Changes to Fund’s Principal Risks:
In the Fund’s Principal Risks, Securities Lending Risk was added.
In the Fund’s Principal Risks from Holdings in Underlying Funds, Debt Securities Risk, Liquidiy Risk, Financial Sector Risk, Industrials Sector Risk, Industry Concentration Risk, Healthcare Sector Risk and Securities Lending Risk were added and Geographic Focus Risk was removed.
Changes to the Fund’s Principal Investment Strategy:
The Fund’s Principal Investment Strategies were revised to note that the Fund may lend its portfolio securities to generate additional income.
Changes to Fund’s Portfolio Manager or Portfolio Management Team:
Effective July 29, 2025, Howard T. Hirakawa was no longer a portfolio manager of the Fund.
This report describes changes to the Fund that occurred during the reporting period.
WHAT WERE THE FUND COSTS FOR THE PAST YEAR? (based on a hypothetical $10,000 investment)
|
Class Name
|
Costs of a $10,000 investment
|
Costs paid as a percentage of a $10,000 investment
|
|
Class I-2
|
$49
|
0.45%
|
HOW DID THE FUND PERFORM LAST YEAR AND WHAT AFFECTED ITS PERFORMANCE?
|
•
|
For the 12-month period ended March 31, 2026, the Fund outperformed the Aristotle Portfolio Optimization Aggressive Growth Composite Benchmark1. The Fund is a “fund of funds” that seeks to achieve its investment goal by investing in a combination of underlying funds, including funds that are actively managed by an affiliate of the investment adviser and unaffiliated ETFs, including passively managed funds that seek to track the performance of a benchmark index.
|
|
•
|
For the 12-month period ending March 31, 2026, both equity and fixed income markets ended in positive territory.
|
|
•
|
Equities delivered double-digit positive returns despite sharp pullbacks in April 2025 amidst tariff worries, and in March 2026 due to the Iran war and energy price shock.
|
|
•
|
Both developed and emerging market international equities outperformed the U.S. over the period.
|
|
•
|
Fixed income had a strong 2025 but gave back some of the gains as interest rates rose in March 2026. Credit spreads remained near historically tight levels.
|
|
•
|
The Fund was positioned to be overweight U.S. equity and slightly underweight to international equity and fixed income.
|
|
•
|
Top contributors from asset allocation came from an overweight to international large-cap value equity and an underweight to U.S. core bond, while top detractors came from the underweight to U.S. small-cap growth equity and overweight to U.S. short-term bond.
|
|
•
|
Top contributors within manager research came from an outperformance by U.S. large-cap growth and U.S. large-cap value equity, while top detractors came from international large-cap value and growth equity.
|
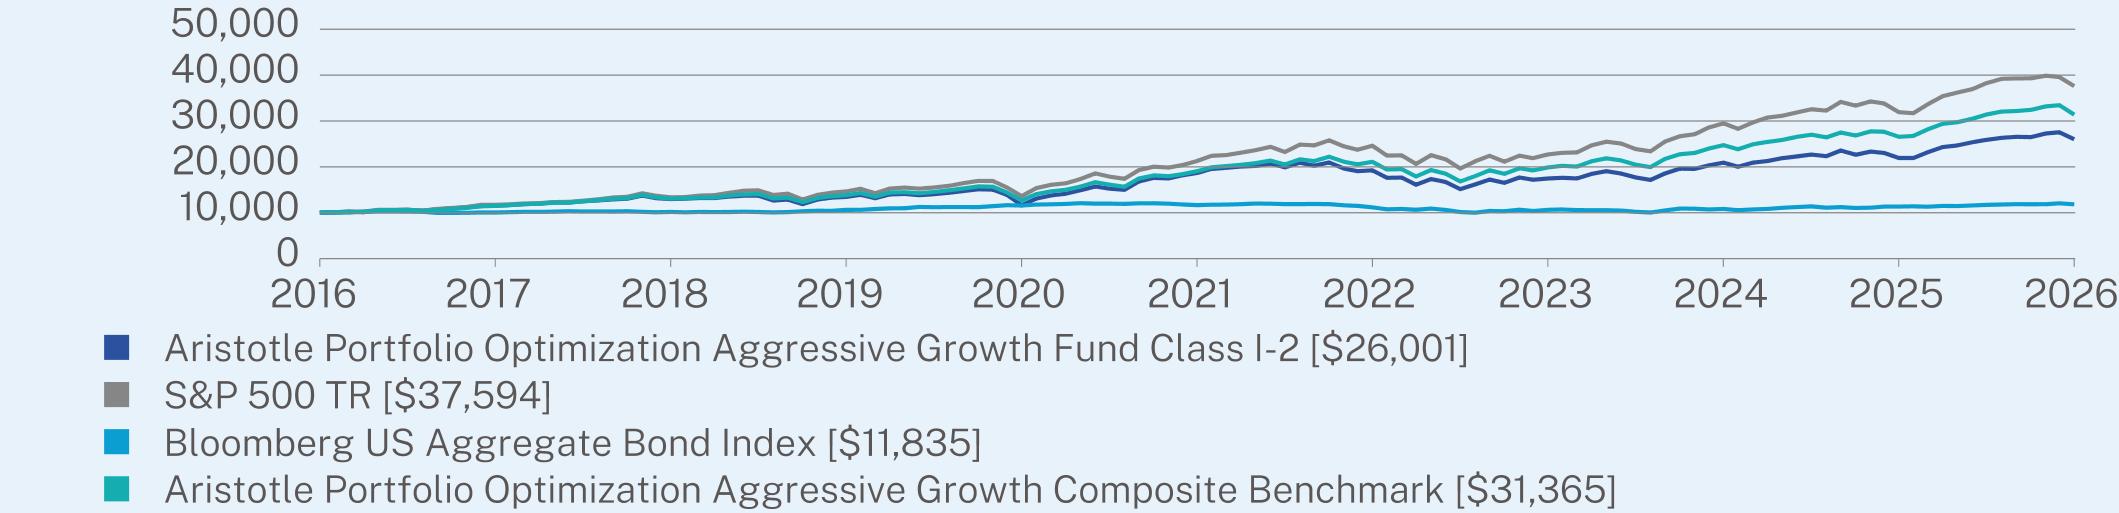
ANNUAL AVERAGE TOTAL RETURN (%)
|
|
1 Year
|
5 Year
|
10 Year
|
|
Class I-2 (without sales charge)
|
18.60
|
6.85
|
10.03
|
|
S&P 500 TR
|
17.80
|
12.06
|
14.16
|
|
Bloomberg US Aggregate Bond Index
|
4.35
|
0.31
|
1.70
|
|
Aristotle Portfolio Optimization Aggressive Growth Composite Benchmark
|
18.16
|
10.50
|
12.11
|
Visit https://www.aristotlefunds.com/resources/prospectuses-reports for more recent performance information.
KEY FUND STATISTICS (as of March 31, 2026)
|
Net Assets
|
$272,119,049
|
|
Number of Holdings
|
21
|
|
Net Advisory Fee
|
$553,358
|
|
Portfolio Turnover Rate
|
33%
|
WHAT DID THE FUND INVEST IN? (as of March 31, 2026)*
|
Top 10 Issuers
|
(%)
|
|
Aristotle Core Equity Fund
|
21.0%
|
|
Aristotle Growth Equity Fund
|
14.0%
|
|
iShares Russell 1000 Value ETF
|
10.0%
|
|
Aristotle International Equity Fund
|
9.0%
|
|
iShares Russell 2000 Value ETF
|
8.9%
|
|
iShares Russell Mid-Cap Value ETF
|
7.0%
|
|
iShares Russell Mid-Cap Growth ETF
|
6.0%
|
|
iShares Russell 2000 Growth ETF
|
6.0%
|
|
iShares Core MSCI Emerging Markets ETF
|
3.6%
|
|
Aristotle High Yield Bond Fund
|
3.0%
|
Security Type Breakdown (%)

Changes to Fund’s Principal Risks:
In the Fund’s Principal Risks, Securities Lending Risk was added.
In the Fund’s Principal Risks from Holdings in Underlying Funds, Debt Securities Risk, Liquidiy Risk, Financial Sector Risk, Industrials Sector Risk, Industry Concentration Risk, Healthcare Sector Risk and Securities Lending Risk were added and Geographic Focus Risk was removed.
Changes to the Fund’s Principal Investment Strategy:
The Fund’s Principal Investment Strategies were revised to note that the Fund may lend its portfolio securities to generate additional income.
Changes to Fund’s Portfolio Manager or Portfolio Management Team:
Effective July 29, 2025, Howard T. Hirakawa was no longer a portfolio manager of the Fund.
This report describes changes to the Fund that occurred during the reporting period.
WHAT WERE THE FUND COSTS FOR THE PAST YEAR? (based on a hypothetical $10,000 investment)
|
Class Name
|
Costs of a $10,000 investment
|
Costs paid as a percentage of a $10,000 investment
|
|
Class A
|
$73
|
0.70%
|
HOW DID THE FUND PERFORM LAST YEAR AND WHAT AFFECTED ITS PERFORMANCE?
|
•
|
For the 12-month period ended March 31, 2026, the Fund outperformed the Aristotle Portfolio Optimization Conservative Composite Benchmark1. The Fund is a “fund of funds” that seeks to achieve its investment goal by investing in a combination of underlying funds, including funds that are actively managed by an affiliate of the investment adviser and unaffiliated ETFs, including passively managed funds that seek to track the performance of a benchmark index.
|
|
•
|
For the 12-month period ending March 31, 2026, both equity and fixed income markets ended in positive territory.
|
|
•
|
Equities delivered double-digit positive returns despite sharp pullbacks in April 2025 amidst tariff worries, and in March 2026 due to the Iran war and energy price shock.
|
|
•
|
Both developed and emerging market international equities outperformed the U.S. over the period.
|
|
•
|
Fixed income had a strong 2025 but gave back some of the gains as interest rates rose in March 2026. Credit spreads remained near historically tight levels.
|
|
•
|
The Fund was positioned to be overweight U.S. equity, slightly overweight to international equity, and slightly underweight to fixed income.
|
|
•
|
Top contributors from asset allocation came from an overweight to U.S. large-cap growth and U.S. mid-cap growth equity, while detractors came from the underweight to U.S. small-cap growth and international large-cap growth equity.
|
|
•
|
Top contributors within manager research came from an outperformance by U.S. large-cap growth equity and U.S. core bond, while top detractors came from international large-cap value equity and U.S. high yield bond.
|
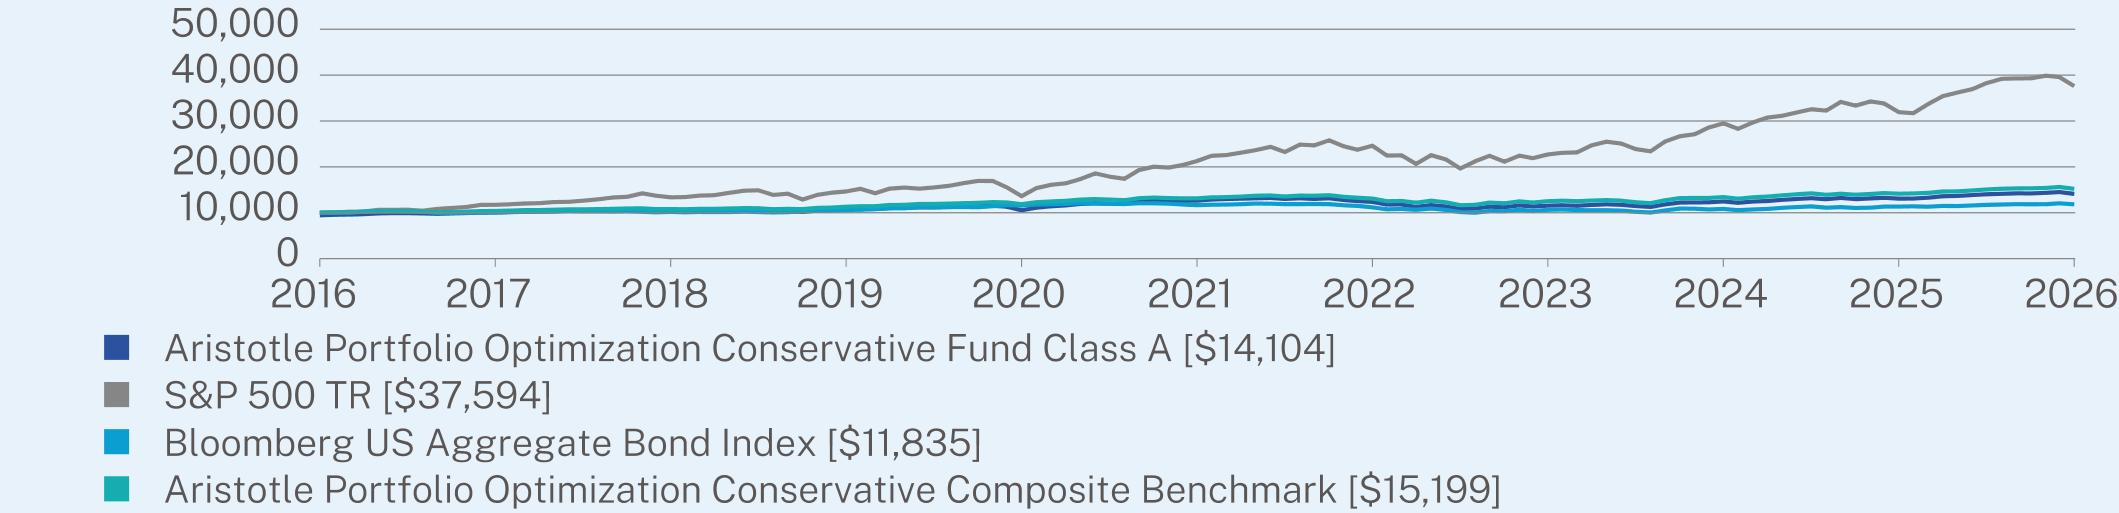
ANNUAL AVERAGE TOTAL RETURN (%)
|
|
1 Year
|
5 Year
|
10 Year
|
|
Class A (without sales charge)
|
7.92
|
2.24
|
4.09
|
|
Class A (with sales charge)
|
1.94
|
1.09
|
3.50
|
|
S&P 500 TR
|
17.80
|
12.06
|
14.16
|
|
Bloomberg US Aggregate Bond Index
|
4.35
|
0.31
|
1.70
|
|
Aristotle Portfolio Optimization Conservative Composite Benchmark
|
7.42
|
2.96
|
4.28
|
Visit https://www.aristotlefunds.com/resources/prospectuses-reports for more recent performance information.
KEY FUND STATISTICS (as of March 31, 2026)
|
Net Assets
|
$117,932,894
|
|
Number of Holdings
|
20
|
|
Net Advisory Fee
|
$248,416
|
|
Portfolio Turnover Rate
|
56%
|
WHAT DID THE FUND INVEST IN? (as of March 31, 2026)*
|
Top 10 Issuers
|
(%)
|
|
Aristotle Core Bond Fund
|
32.9%
|
|
Aristotle Core Income Fund
|
14.1%
|
|
Aristotle High Yield Bond Fund
|
10.4%
|
|
Aristotle Short Duration Income Fund
|
9.0%
|
|
Aristotle Core Equity Fund
|
6.3%
|
|
iShares J.P. Morgan USD Emerging Markets Bond ETF
|
5.0%
|
|
Aristotle Growth Equity Fund
|
3.4%
|
|
iShares Russell 1000 Value ETF
|
3.3%
|
|
iShares TIPS Bond ETF
|
2.5%
|
|
iShares Russell Mid-Cap Value ETF
|
2.0%
|
Security Type Breakdown (%)

Changes to Fund’s Principal Risks:
In the Fund’s Principal Risks, Securities Lending Risk was added.
In the Fund’s Principal Risks from Holdings in Underlying Funds, Small-Capitalization Companies Risk, Warrants and Rights Risk, Information Technology Sector Risk, Industry Concentration Risk and Securities Lending Risk were added.
Changes to the Fund’s Principal Investment Strategy:
The Fund’s Principal Investment Strategies were revised to note that the Fund may lend its portfolio securities to generate additional income.
Changes to Fund’s Portfolio Manager or Portfolio Management Team:
Effective July 29, 2025, Howard T. Hirakawa was no longer a portfolio manager of the Fund.
This report describes changes to the Fund that occurred during the reporting period.
WHAT WERE THE FUND COSTS FOR THE PAST YEAR? (based on a hypothetical $10,000 investment)
|
Class Name
|
Costs of a $10,000 investment
|
Costs paid as a percentage of a $10,000 investment
|
|
Class C
|
$150
|
1.45%
|
HOW DID THE FUND PERFORM LAST YEAR AND WHAT AFFECTED ITS PERFORMANCE?
|
•
|
For the 12-month period ended March 31, 2026, the Fund underperformed the Aristotle Portfolio Optimization Conservative Composite Benchmark1. The Fund is a “fund of funds” that seeks to achieve its investment goal by investing in a combination of underlying funds, including funds that are actively managed by an affiliate of the investment adviser and unaffiliated ETFs, including passively managed funds that seek to track the performance of a benchmark index.
|
|
•
|
For the 12-month period ending March 31, 2026, both equity and fixed income markets ended in positive territory.
|
|
•
|
Equities delivered double-digit positive returns despite sharp pullbacks in April 2025 amidst tariff worries, and in March 2026 due to the Iran war and energy price shock.
|
|
•
|
Both developed and emerging market international equities outperformed the U.S. over the period.
|
|
•
|
Fixed income had a strong 2025 but gave back some of the gains as interest rates rose in March 2026. Credit spreads remained near historically tight levels.
|
|
•
|
The Fund was positioned to be overweight U.S. equity, slightly overweight to international equity, and slightly underweight to fixed income.
|
|
•
|
Top contributors from asset allocation came from an overweight to U.S. large-cap growth and U.S. mid-cap growth equity, while detractors came from the underweight to U.S. small-cap growth and international large-cap growth equity.
|
|
•
|
Top contributors within manager research came from an outperformance by U.S. large-cap growth equity and U.S. core bond, while top detractors came from international large-cap value equity and U.S. high yield bond.
|
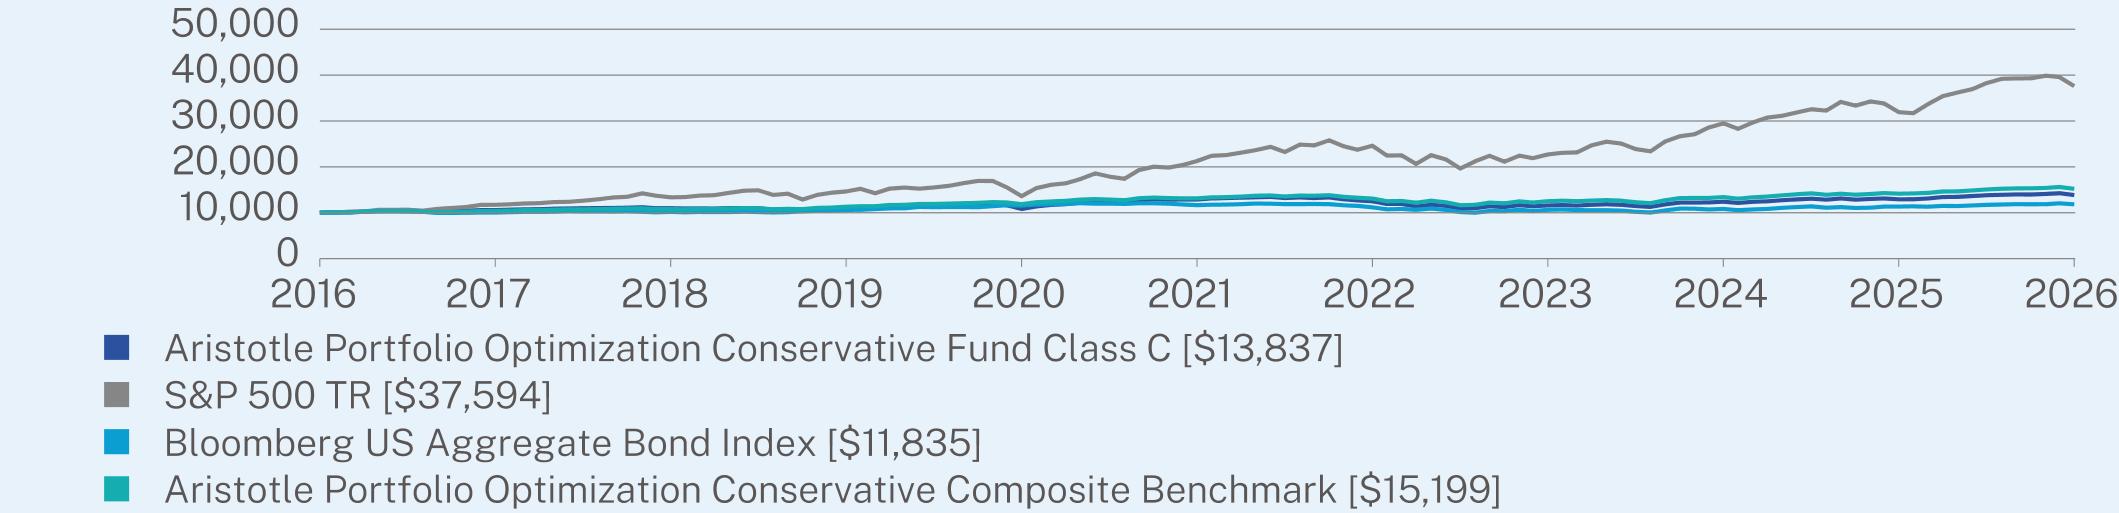
ANNUAL AVERAGE TOTAL RETURN (%)
|
|
1 Year
|
5 Year
|
10 Year
|
|
Class C (without sales charge)
|
7.12
|
1.47
|
3.30
|
|
Class C (with sales charge)
|
6.12
|
1.47
|
3.30
|
|
S&P 500 TR
|
17.80
|
12.06
|
14.16
|
|
Bloomberg US Aggregate Bond Index
|
4.35
|
0.31
|
1.70
|
|
Aristotle Portfolio Optimization Conservative Composite Benchmark
|
7.42
|
2.96
|
4.28
|
Visit https://www.aristotlefunds.com/resources/prospectuses-reports for more recent performance information.
KEY FUND STATISTICS (as of March 31, 2026)
|
Net Assets
|
$117,932,894
|
|
Number of Holdings
|
20
|
|
Net Advisory Fee
|
$248,416
|
|
Portfolio Turnover Rate
|
56%
|
WHAT DID THE FUND INVEST IN? (as of March 31, 2026)*
|
Top 10 Issuers
|
(%)
|
|
Aristotle Core Bond Fund
|
32.9%
|
|
Aristotle Core Income Fund
|
14.1%
|
|
Aristotle High Yield Bond Fund
|
10.4%
|
|
Aristotle Short Duration Income Fund
|
9.0%
|
|
Aristotle Core Equity Fund
|
6.3%
|
|
iShares J.P. Morgan USD Emerging Markets Bond ETF
|
5.0%
|
|
Aristotle Growth Equity Fund
|
3.4%
|
|
iShares Russell 1000 Value ETF
|
3.3%
|
|
iShares TIPS Bond ETF
|
2.5%
|
|
iShares Russell Mid-Cap Value ETF
|
2.0%
|
Security Type Breakdown (%)

Changes to Fund’s Principal Risks:
In the Fund’s Principal Risks, Securities Lending Risk was added.
In the Fund’s Principal Risks from Holdings in Underlying Funds, Small-Capitalization Companies Risk, Warrants and Rights Risk, Information Technology Sector Risk, Industry Concentration Risk and Securities Lending Risk were added.
Changes to the Fund’s Principal Investment Strategy:
The Fund’s Principal Investment Strategies were revised to note that the Fund may lend its portfolio securities to generate additional income.
Changes to Fund’s Portfolio Manager or Portfolio Management Team:
Effective July 29, 2025, Howard T. Hirakawa was no longer a portfolio manager of the Fund.
This report describes changes to the Fund that occurred during the reporting period.
WHAT WERE THE FUND COSTS FOR THE PAST YEAR? (based on a hypothetical $10,000 investment)
|
Class Name
|
Costs of a $10,000 investment
|
Costs paid as a percentage of a $10,000 investment
|
|
Class I-2
|
$47
|
0.45%
|
HOW DID THE FUND PERFORM LAST YEAR AND WHAT AFFECTED ITS PERFORMANCE?
|
•
|
For the 12-month period ended March 31, 2026, the Fund outperformed the Aristotle Portfolio Optimization Conservative Composite Benchmark1. The Fund is a “fund of funds” that seeks to achieve its investment goal by investing in a combination of underlying funds, including funds that are actively managed by an affiliate of the investment adviser and unaffiliated ETFs, including passively managed funds that seek to track the performance of a benchmark index.
|
|
•
|
For the 12-month period ending March 31, 2026, both equity and fixed income markets ended in positive territory.
|
|
•
|
Equities delivered double-digit positive returns despite sharp pullbacks in April 2025 amidst tariff worries, and in March 2026 due to the Iran war and energy price shock.
|
|
•
|
Both developed and emerging market international equities outperformed the U.S. over the period.
|
|
•
|
Fixed income had a strong 2025 but gave back some of the gains as interest rates rose in March 2026. Credit spreads remained near historically tight levels.
|
|
•
|
The Fund was positioned to be overweight U.S. equity, slightly overweight to international equity, and slightly underweight to fixed income.
|
|
•
|
Top contributors from asset allocation came from an overweight to U.S. large-cap growth and U.S. mid-cap growth equity, while detractors came from the underweight to U.S. small-cap growth and international large-cap growth equity.
|
|
•
|
Top contributors within manager research came from an outperformance by U.S. large-cap growth equity and U.S. core bond, while top detractors came from international large-cap value equity and U.S. high yield bond.
|
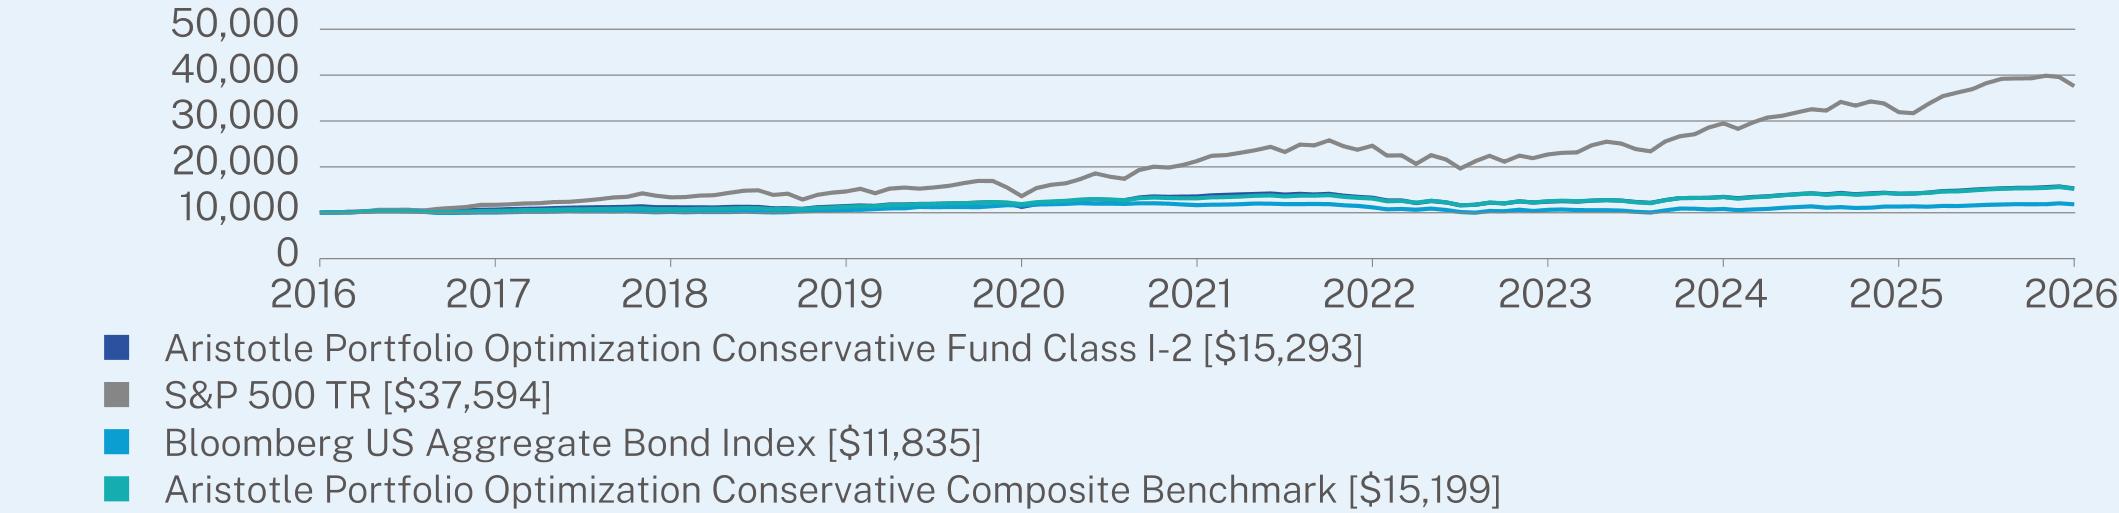
ANNUAL AVERAGE TOTAL RETURN (%)
|
|
1 Year
|
5 Year
|
10 Year
|
|
Class I-2 (without sales charge)
|
8.05
|
2.48
|
4.34
|
|
S&P 500 TR
|
17.80
|
12.06
|
14.16
|
|
Bloomberg US Aggregate Bond Index
|
4.35
|
0.31
|
1.70
|
|
Aristotle Portfolio Optimization Conservative Composite Benchmark
|
7.42
|
2.96
|
4.28
|
Visit https://www.aristotlefunds.com/resources/prospectuses-reports for more recent performance information.
KEY FUND STATISTICS (as of March 31, 2026)
|
Net Assets
|
$117,932,894
|
|
Number of Holdings
|
20
|
|
Net Advisory Fee
|
$248,416
|
|
Portfolio Turnover Rate
|
56%
|
WHAT DID THE FUND INVEST IN? (as of March 31, 2026)*
|
Top 10 Issuers
|
(%)
|
|
Aristotle Core Bond Fund
|
32.9%
|
|
Aristotle Core Income Fund
|
14.1%
|
|
Aristotle High Yield Bond Fund
|
10.4%
|
|
Aristotle Short Duration Income Fund
|
9.0%
|
|
Aristotle Core Equity Fund
|
6.3%
|
|
iShares J.P. Morgan USD Emerging Markets Bond ETF
|
5.0%
|
|
Aristotle Growth Equity Fund
|
3.4%
|
|
iShares Russell 1000 Value ETF
|
3.3%
|
|
iShares TIPS Bond ETF
|
2.5%
|
|
iShares Russell Mid-Cap Value ETF
|
2.0%
|
Security Type Breakdown (%)
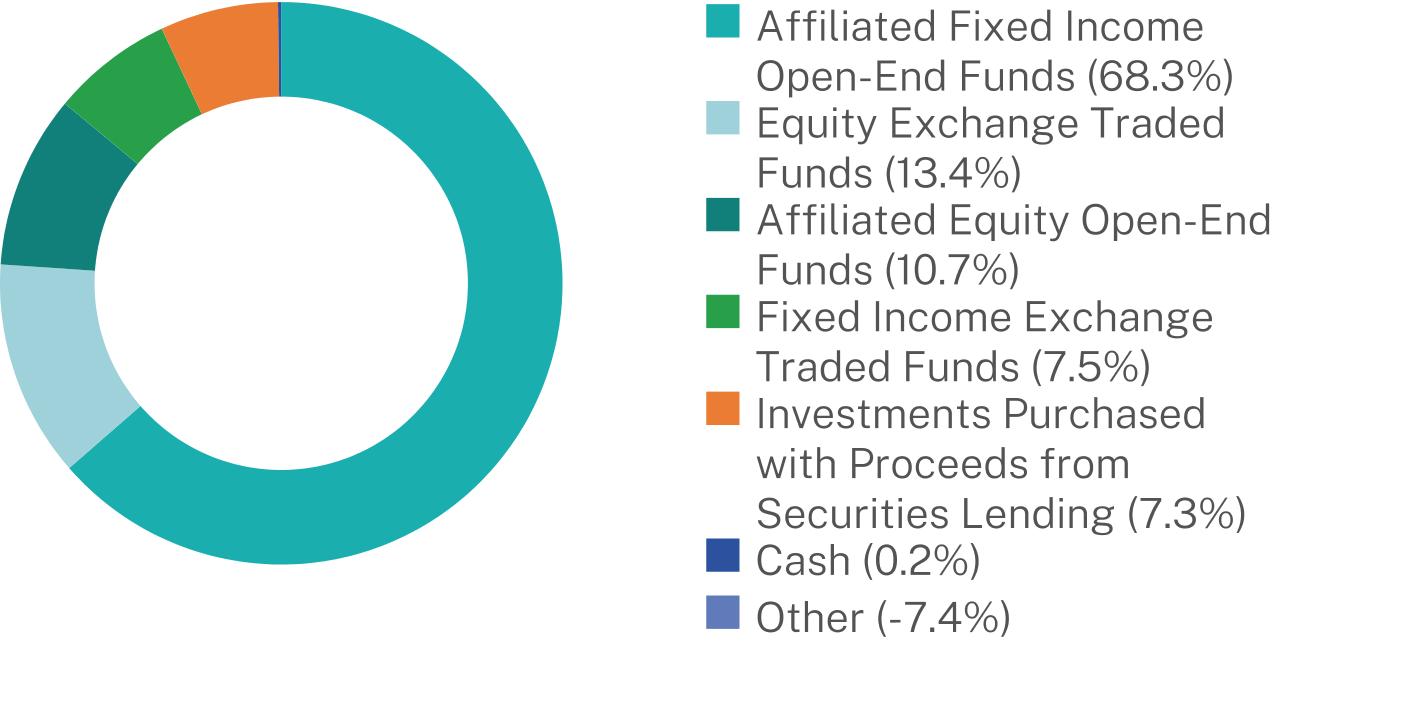
Changes to Fund’s Principal Risks:
In the Fund’s Principal Risks, Securities Lending Risk was added.
In the Fund’s Principal Risks from Holdings in Underlying Funds, Small-Capitalization Companies Risk, Warrants and Rights Risk, Information Technology Sector Risk, Industry Concentration Risk and Securities Lending Risk were added.
Changes to the Fund’s Principal Investment Strategy:
The Fund’s Principal Investment Strategies were revised to note that the Fund may lend its portfolio securities to generate additional income.
Changes to Fund’s Portfolio Manager or Portfolio Management Team:
Effective July 29, 2025, Howard T. Hirakawa was no longer a portfolio manager of the Fund.
This report describes changes to the Fund that occurred during the reporting period.
WHAT WERE THE FUND COSTS FOR THE PAST YEAR? (based on a hypothetical $10,000 investment)
|
Class Name
|
Costs of a $10,000 investment
|
Costs paid as a percentage of a $10,000 investment
|
|
Class A
|
$75
|
0.70%
|
HOW DID THE FUND PERFORM LAST YEAR AND WHAT AFFECTED ITS PERFORMANCE?
|
•
|
For the 12-month period ended March 31, 2026, the Fund outperformed the Aristotle Portfolio Optimization Growth Composite Benchmark1. The Fund is a “fund of funds” that seeks to achieve its investment goal by investing in a combination of underlying funds, including funds that are actively managed by an affiliate of the investment adviser and unaffiliated ETFs, including passively managed funds that seek to track the performance of a benchmark index.
|
|
•
|
For the 12-month period ending March 31, 2026, both equity and fixed income markets ended in positive territory.
|
|
•
|
Equities delivered double-digit positive returns despite sharp pullbacks in April 2025 amidst tariff worries, and in March 2026 due to the Iran war and energy price shock.
|
|
•
|
Both developed and emerging market international equities outperformed the U.S. over the period.
|
|
•
|
Fixed income had a strong 2025 but gave back some of the gains as interest rates rose in March 2026. Credit spreads remained near historically tight levels.
|
|
•
|
The Fund was positioned to be overweight U.S. equity and slightly underweight to international equity and fixed income.
|
|
•
|
Top contributors from asset allocation came from an overweight to international large-cap value equity and an underweight to U.S. core bond, while top detractors came from the underweight to U.S. small-cap growth equity and overweight to U.S. high yield bond.
|
|
•
|
Top contributors within manager research came from an outperformance by U.S. large-cap growth and U.S. large-cap value equity, while top detractors came from international large-cap value and growth equity.
|
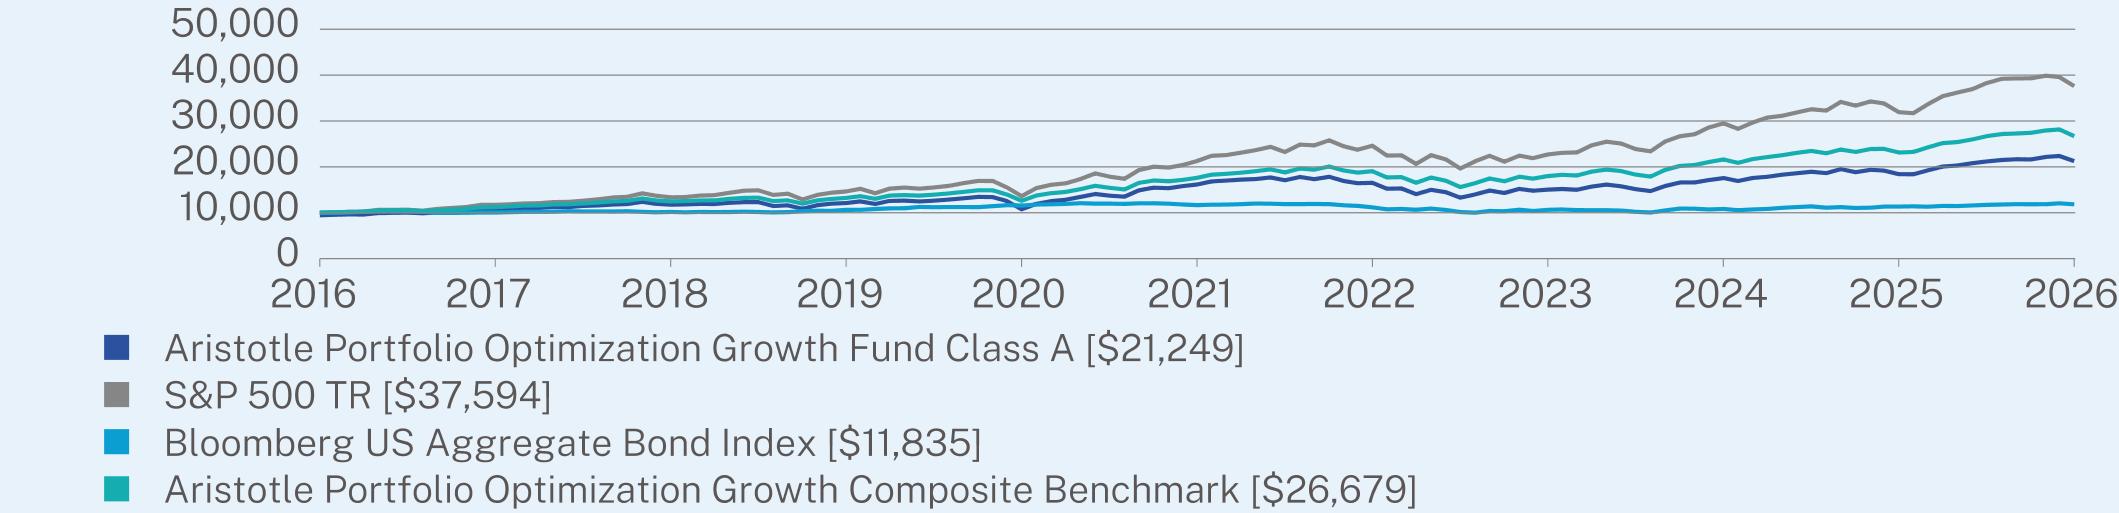
ANNUAL AVERAGE TOTAL RETURN (%)
|
|
1 Year
|
5 Year
|
10 Year
|
|
Class A (without sales charge)
|
15.52
|
5.64
|
8.44
|
|
Class A (with sales charge)
|
9.16
|
4.46
|
7.83
|
|
S&P 500 TR
|
17.80
|
12.06
|
14.16
|
|
Bloomberg US Aggregate Bond Index
|
4.35
|
0.31
|
1.70
|
|
Aristotle Portfolio Optimization Growth Composite Benchmark
|
15.40
|
8.67
|
10.31
|
Visit https://www.aristotlefunds.com/resources/prospectuses-reports for more recent performance information.
KEY FUND STATISTICS (as of March 31, 2026)
|
Net Assets
|
$615,972,448
|
|
Number of Holdings
|
21
|
|
Net Advisory Fee
|
$1,271,874
|
|
Portfolio Turnover Rate
|
41%
|
WHAT DID THE FUND INVEST IN? (as of March 31, 2026)*
|
Top 10 Issuers
|
(%)
|
|
Aristotle Core Equity Fund
|
19.3%
|
|
Aristotle Growth Equity Fund
|
12.9%
|
|
iShares Russell 1000 Value ETF
|
11.3%
|
|
Aristotle Core Bond Fund
|
7.9%
|
|
iShares Russell 2000 Value ETF
|
6.5%
|
|
iShares Russell Mid-Cap Value ETF
|
6.0%
|
|
Aristotle International Equity Fund
|
5.0%
|
|
iShares Russell Mid-Cap Growth ETF
|
5.0%
|
|
Aristotle Short Duration Income Fund
|
5.0%
|
|
iShares Russell 2000 Growth ETF
|
4.5%
|
Security Type Breakdown (%)

Changes to Fund’s Principal Risks:
In the Fund’s Principal Risks, Securities Lending Risk was added.
In the Fund’s Principal Risks from Holdings in Underlying Funds, Financial Sector Risk, Industrials Sector Risk, Industry Concentration Risk and Securities Lending Risk were added and Geographic Focus Risk and Geographic Risk Related to Europe were removed.
Changes to the Fund’s Principal Investment Strategy:
The Fund’s Principal Investment Strategies were revised to note that the Fund may lend its portfolio securities to generate additional income.
Changes to Fund’s Portfolio Manager or Portfolio Management Team:
Effective July 29, 2025, Howard T. Hirakawa was no longer a portfolio manager of the Fund.
This report describes changes to the Fund that occurred during the reporting period.
WHAT WERE THE FUND COSTS FOR THE PAST YEAR? (based on a hypothetical $10,000 investment)
|
Class Name
|
Costs of a $10,000 investment
|
Costs paid as a percentage of a $10,000 investment
|
|
Class C
|
$156
|
1.45%
|
HOW DID THE FUND PERFORM LAST YEAR AND WHAT AFFECTED ITS PERFORMANCE?
|
•
|
For the 12-month period ended March 31, 2026, the Fund underperformed the Aristotle Portfolio Optimization Growth Composite Benchmark1. The Fund is a “fund of funds” that seeks to achieve its investment goal by investing in a combination of underlying funds, including funds that are actively managed by an affiliate of the investment adviser and unaffiliated ETFs, including passively managed funds that seek to track the performance of a benchmark index.
|
|
•
|
For the 12-month period ending March 31, 2026, both equity and fixed income markets ended in positive territory.
|
|
•
|
Equities delivered double-digit positive returns despite sharp pullbacks in April 2025 amidst tariff worries, and in March 2026 due to the Iran war and energy price shock.
|
|
•
|
Both developed and emerging market international equities outperformed the U.S. over the period.
|
|
•
|
Fixed income had a strong 2025 but gave back some of the gains as interest rates rose in March 2026. Credit spreads remained near historically tight levels.
|
|
•
|
The Fund was positioned to be overweight U.S. equity and slightly underweight to international equity and fixed income.
|
|
•
|
Top contributors from asset allocation came from an overweight to international large-cap value equity and an underweight to U.S. core bond, while top detractors came from the underweight to U.S. small-cap growth equity and overweight to U.S. high yield bond.
|
|
•
|
Top contributors within manager research came from an outperformance by U.S. large-cap growth and U.S. large-cap value equity, while top detractors came from international large-cap value and growth equity.
|
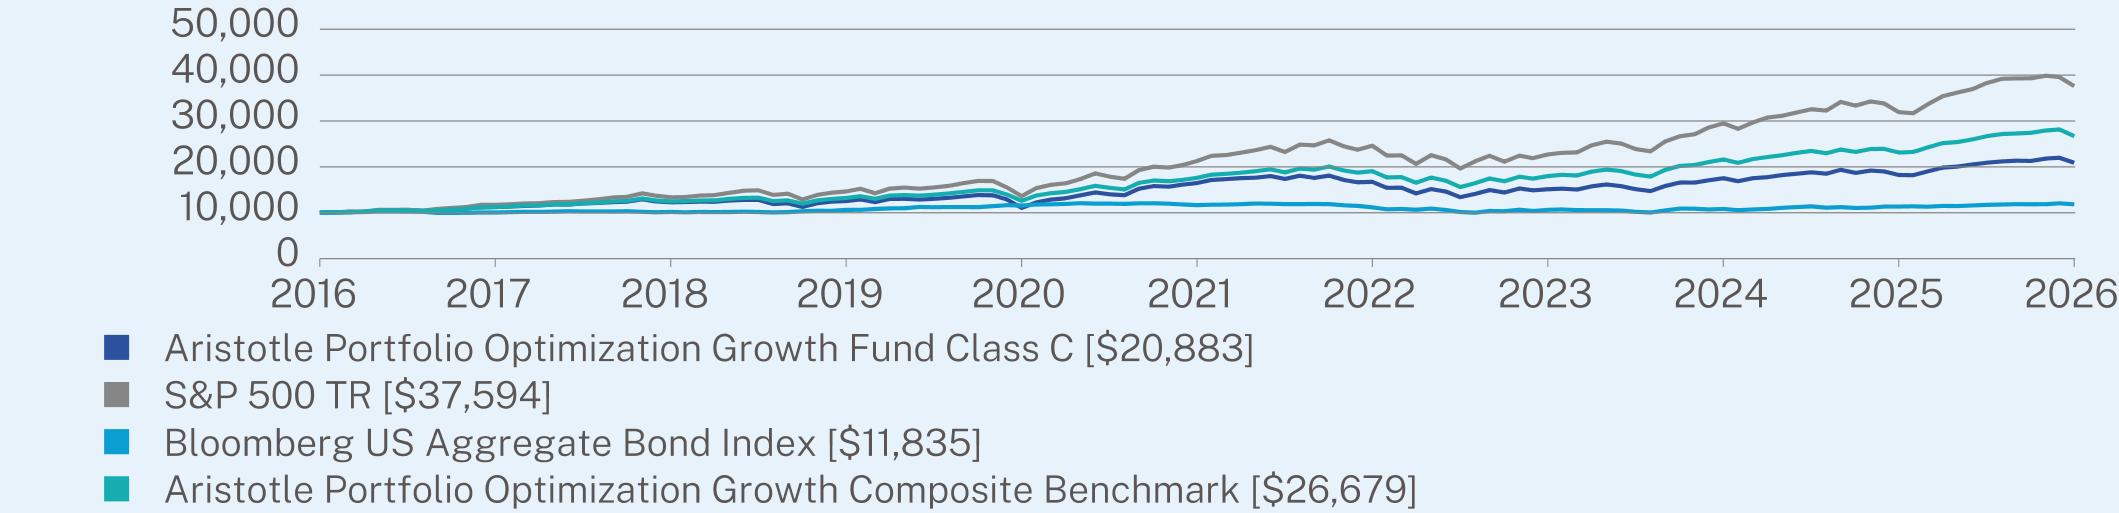
ANNUAL AVERAGE TOTAL RETURN (%)
|
|
1 Year
|
5 Year
|
10 Year
|
|
Class C (without sales charge)
|
14.65
|
4.86
|
7.64
|
|
Class C (with sales charge)
|
13.65
|
4.86
|
7.64
|
|
S&P 500 TR
|
17.80
|
12.06
|
14.16
|
|
Bloomberg US Aggregate Bond Index
|
4.35
|
0.31
|
1.70
|
|
Aristotle Portfolio Optimization Growth Composite Benchmark
|
15.40
|
8.67
|
10.31
|
Visit https://www.aristotlefunds.com/resources/prospectuses-reports for more recent performance information.
KEY FUND STATISTICS (as of March 31, 2026)
|
Net Assets
|
$615,972,448
|
|
Number of Holdings
|
21
|
|
Net Advisory Fee
|
$1,271,874
|
|
Portfolio Turnover Rate
|
41%
|
WHAT DID THE FUND INVEST IN? (as of March 31, 2026)*
|
Top 10 Issuers
|
(%)
|
|
Aristotle Core Equity Fund
|
19.3%
|
|
Aristotle Growth Equity Fund
|
12.9%
|
|
iShares Russell 1000 Value ETF
|
11.3%
|
|
Aristotle Core Bond Fund
|
7.9%
|
|
iShares Russell 2000 Value ETF
|
6.5%
|
|
iShares Russell Mid-Cap Value ETF
|
6.0%
|
|
Aristotle International Equity Fund
|
5.0%
|
|
iShares Russell Mid-Cap Growth ETF
|
5.0%
|
|
Aristotle Short Duration Income Fund
|
5.0%
|
|
iShares Russell 2000 Growth ETF
|
4.5%
|
Security Type Breakdown (%)

Changes to Fund’s Principal Risks:
In the Fund’s Principal Risks, Securities Lending Risk was added.
In the Fund’s Principal Risks from Holdings in Underlying Funds, Financial Sector Risk, Industrials Sector Risk, Industry Concentration Risk and Securities Lending Risk were added and Geographic Focus Risk and Geographic Risk Related to Europe were removed.
Changes to the Fund’s Principal Investment Strategy:
The Fund’s Principal Investment Strategies were revised to note that the Fund may lend its portfolio securities to generate additional income.
Changes to Fund’s Portfolio Manager or Portfolio Management Team:
Effective July 29, 2025, Howard T. Hirakawa was no longer a portfolio manager of the Fund.
This report describes changes to the Fund that occurred during the reporting period.
WHAT WERE THE FUND COSTS FOR THE PAST YEAR? (based on a hypothetical $10,000 investment)
|
Class Name
|
Costs of a $10,000 investment
|
Costs paid as a percentage of a $10,000 investment
|
|
Class I-2
|
$49
|
0.45%
|
HOW DID THE FUND PERFORM LAST YEAR AND WHAT AFFECTED ITS PERFORMANCE?
|
•
|
For the 12-month period ended March 31, 2026, the Fund outperformed the Aristotle Portfolio Optimization Growth Composite Benchmark1. The Fund is a “fund of funds” that seeks to achieve its investment goal by investing in a combination of underlying funds, including funds that are actively managed by an affiliate of the investment adviser and unaffiliated ETFs, including passively managed funds that seek to track the performance of a benchmark index.
|
|
•
|
For the 12-month period ending March 31, 2026, both equity and fixed income markets ended in positive territory.
|
|
•
|
Equities delivered double-digit positive returns despite sharp pullbacks in April 2025 amidst tariff worries, and in March 2026 due to the Iran war and energy price shock.
|
|
•
|
Both developed and emerging market international equities outperformed the U.S. over the period.
|
|
•
|
Fixed income had a strong 2025 but gave back some of the gains as interest rates rose in March 2026. Credit spreads remained near historically tight levels.
|
|
•
|
The Fund was positioned to be overweight U.S. equity and slightly underweight to international equity and fixed income.
|
|
•
|
Top contributors from asset allocation came from an overweight to international large-cap value equity and an underweight to U.S. core bond, while top detractors came from the underweight to U.S. small-cap growth equity and overweight to U.S. high yield bond.
|
|
•
|
Top contributors within manager research came from an outperformance by U.S. large-cap growth and U.S. large-cap value equity, while top detractors came from international large-cap value and growth equity.
|

ANNUAL AVERAGE TOTAL RETURN (%)
|
|
1 Year
|
5 Year
|
10 Year
|
|
Class I-2 (without sales charge)
|
15.85
|
5.91
|
8.71
|
|
S&P 500 TR
|
17.80
|
12.06
|
14.16
|
|
Bloomberg US Aggregate Bond Index
|
4.35
|
0.31
|
1.70
|
|
Aristotle Portfolio Optimization Growth Composite Benchmark
|
15.40
|
8.67
|
10.31
|
Visit https://www.aristotlefunds.com/resources/prospectuses-reports for more recent performance information.
KEY FUND STATISTICS (as of March 31, 2026)
|
Net Assets
|
$615,972,448
|
|
Number of Holdings
|
21
|
|
Net Advisory Fee
|
$1,271,874
|
|
Portfolio Turnover Rate
|
41%
|
WHAT DID THE FUND INVEST IN? (as of March 31, 2026)*
|
Top 10 Issuers
|
(%)
|
|
Aristotle Core Equity Fund
|
19.3%
|
|
Aristotle Growth Equity Fund
|
12.9%
|
|
iShares Russell 1000 Value ETF
|
11.3%
|
|
Aristotle Core Bond Fund
|
7.9%
|
|
iShares Russell 2000 Value ETF
|
6.5%
|
|
iShares Russell Mid-Cap Value ETF
|
6.0%
|
|
Aristotle International Equity Fund
|
5.0%
|
|
iShares Russell Mid-Cap Growth ETF
|
5.0%
|
|
Aristotle Short Duration Income Fund
|
5.0%
|
|
iShares Russell 2000 Growth ETF
|
4.5%
|
Security Type Breakdown (%)
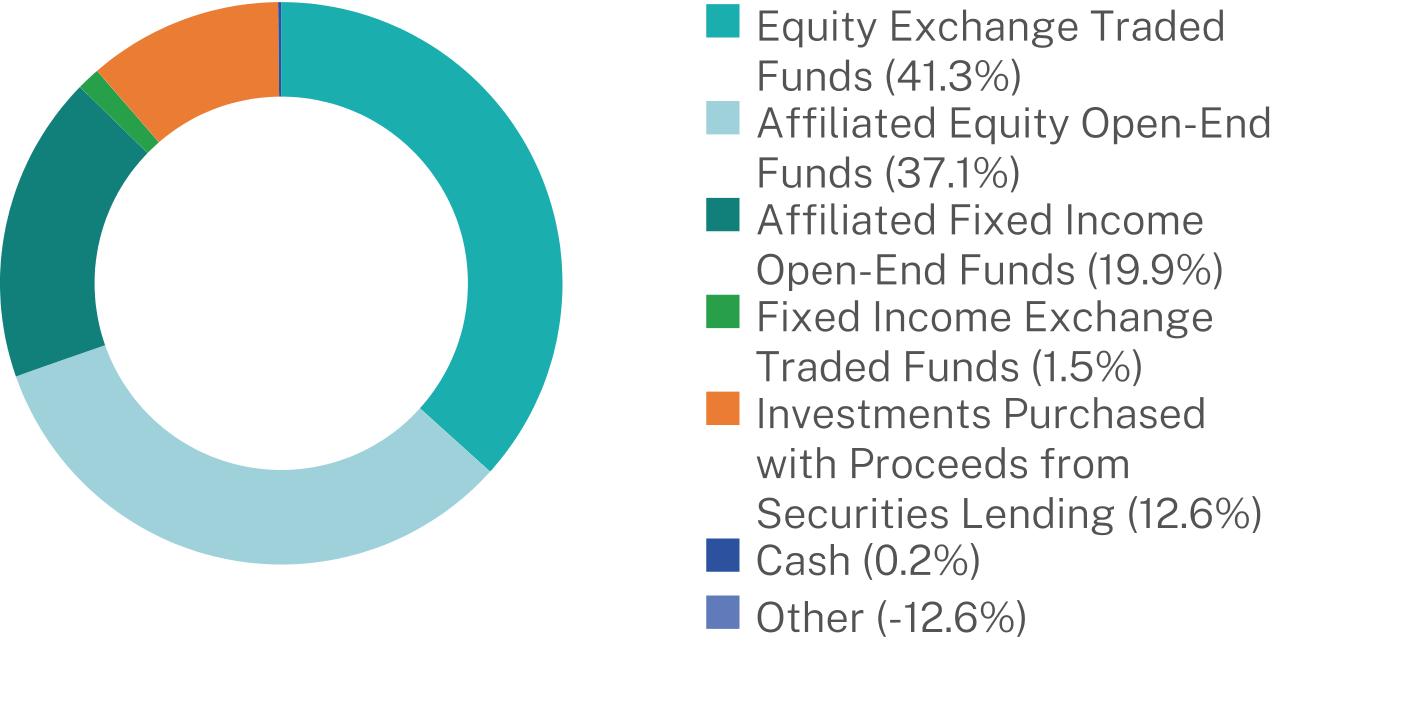
Changes to Fund’s Principal Risks:
In the Fund’s Principal Risks, Securities Lending Risk was added.
In the Fund’s Principal Risks from Holdings in Underlying Funds, Financial Sector Risk, Industrials Sector Risk, Industry Concentration Risk and Securities Lending Risk were added and Geographic Focus Risk and Geographic Risk Related to Europe were removed.
Changes to the Fund’s Principal Investment Strategy:
The Fund’s Principal Investment Strategies were revised to note that the Fund may lend its portfolio securities to generate additional income.
Changes to Fund’s Portfolio Manager or Portfolio Management Team:
Effective July 29, 2025, Howard T. Hirakawa was no longer a portfolio manager of the Fund.
This report describes changes to the Fund that occurred during the reporting period.
WHAT WERE THE FUND COSTS FOR THE PAST YEAR? (based on a hypothetical $10,000 investment)
|
Class Name
|
Costs of a $10,000 investment
|
Costs paid as a percentage of a $10,000 investment
|
|
Class A
|
$74
|
0.70%
|
HOW DID THE FUND PERFORM LAST YEAR AND WHAT AFFECTED ITS PERFORMANCE?
|
•
|
For the 12-month period ended March 31, 2026, the Fund outperformed the Aristotle Portfolio Optimization Moderate Conservative Composite Benchmark1. The Fund is a “fund of funds” that seeks to achieve its investment goal by investing in a combination of underlying funds, including funds that are actively managed by an affiliate of the investment adviser and unaffiliated ETFs, including passively managed funds that seek to track the performance of a benchmark index.
|
|
•
|
For the 12-month period ending March 31, 2026, both equity and fixed income markets ended in positive territory.
|
|
•
|
Equities delivered double-digit positive returns despite sharp pullbacks in April 2025 amidst tariff worries, and in March 2026 due to the Iran war and energy price shock.
|
|
•
|
Both developed and emerging market international equities outperformed the U.S. over the period.
|
|
•
|
Fixed income had a strong 2025 but gave back some of the gains as interest rates rose in March 2026. Credit spreads remained near historically tight levels.
|
|
•
|
The Fund was positioned to be overweight U.S. equity, slightly overweight to international equity, and slightly underweight to fixed income.
|
|
•
|
Top contributors from asset allocation came from an overweight to international large-cap value and international blend equity, while detractors came from the underweight to U.S. small-cap growth and emerging market equity.
|
|
•
|
Top contributors within manager research came from an outperformance by U.S. large-cap growth and U.S. large-cap value equity, while top detractors came from international large-cap value and growth equity.
|

ANNUAL AVERAGE TOTAL RETURN (%)
|
|
1 Year
|
5 Year
|
10 Year
|
|
Class A (without sales charge)
|
10.13
|
3.20
|
5.38
|
|
Class A (with sales charge)
|
4.08
|
2.04
|
4.79
|
|
S&P 500 TR
|
17.80
|
12.06
|
14.16
|
|
Bloomberg US Aggregate Bond Index
|
4.35
|
0.31
|
1.70
|
|
Aristotle Portfolio Optimization Moderate Conservative Composite Benchmark
|
10.02
|
4.84
|
6.26
|
Visit https://www.aristotlefunds.com/resources/prospectuses-reports for more recent performance information.
KEY FUND STATISTICS (as of March 31, 2026)
|
Net Assets
|
$178,691,535
|
|
Number of Holdings
|
21
|
|
Net Advisory Fee
|
$376,045
|
|
Portfolio Turnover Rate
|
56%
|
WHAT DID THE FUND INVEST IN? (as of March 31, 2026)*
|
Top 10 Issuers
|
(%)
|
|
Aristotle Core Bond Fund
|
25.1%
|
|
Aristotle Core Equity Fund
|
13.3%
|
|
Aristotle Core Income Fund
|
10.8%
|
|
Aristotle High Yield Bond Fund
|
8.4%
|
|
Aristotle Short Duration Income Fund
|
7.0%
|
|
iShares Russell 1000 Value ETF
|
6.8%
|
|
Aristotle Growth Equity Fund
|
5.9%
|
|
Aristotle International Equity Fund
|
4.0%
|
|
iShares J.P. Morgan USD Emerging Markets Bond ETF
|
3.0%
|
|
iShares Russell Mid-Cap Value ETF
|
2.5%
|
Security Type Breakdown (%)
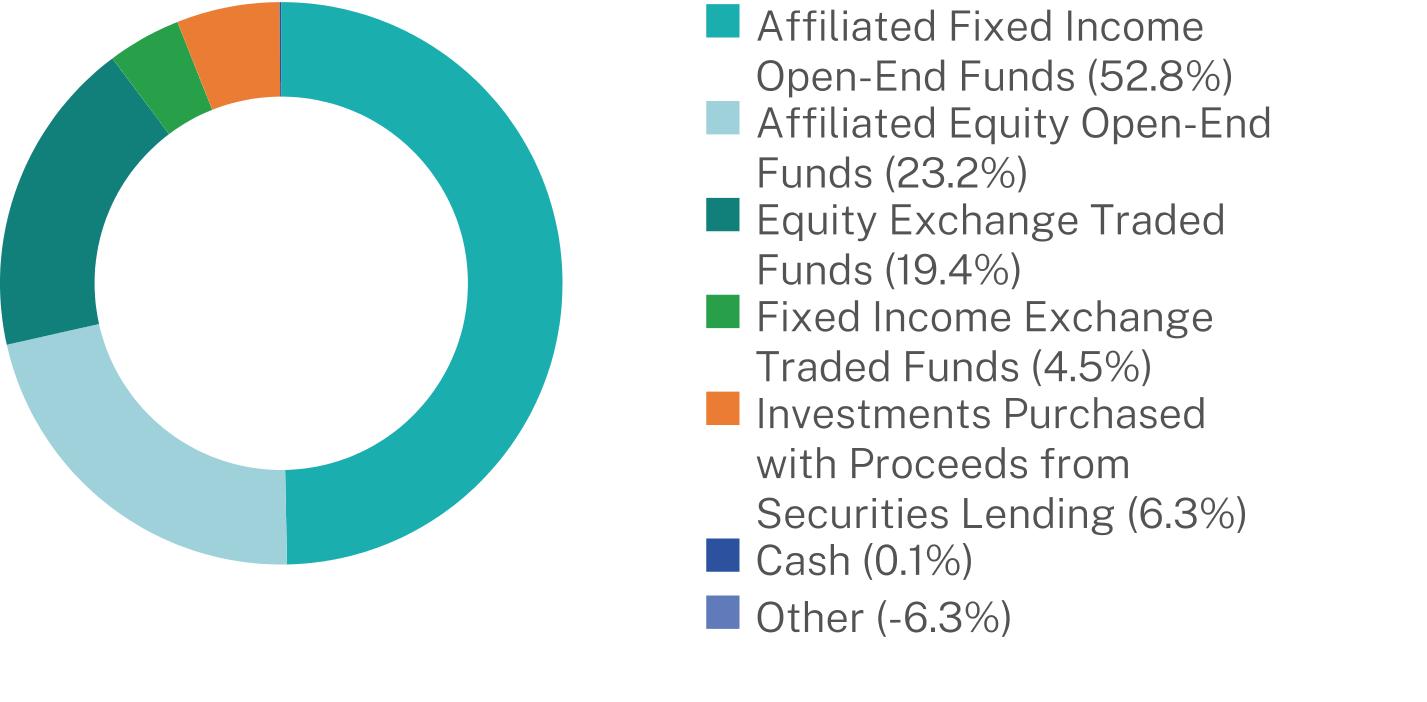
Changes to Fund’s Principal Risks:
In the Fund’s Principal Risks, Securities Lending Risk was added.
In the Fund’s Principal Risks from Holdings in Underlying Funds, Small-Capitalization Companies Risk, Preferred Stock Risk, Financial Sector Risk, Industrials Sector Risk, Industry Concentration Risk and Securities Lending Risk were added and Growth Companies Risk and Geographic Focus Risk were removed.
Changes to the Fund’s Principal Investment Strategy:
The Fund’s Principal Investment Strategies were revised to note that the Fund may lend its portfolio securities to generate additional income.
Changes to Fund’s Portfolio Manager or Portfolio Management Team:
Effective July 29, 2025, Howard T. Hirakawa was no longer a portfolio manager of the Fund.
This report describes changes to the Fund that occurred during the reporting period.
WHAT WERE THE FUND COSTS FOR THE PAST YEAR? (based on a hypothetical $10,000 investment)
|
Class Name
|
Costs of a $10,000 investment
|
Costs paid as a percentage of a $10,000 investment
|
|
Class C
|
$152
|
1.45%
|
HOW DID THE FUND PERFORM LAST YEAR AND WHAT AFFECTED ITS PERFORMANCE?
|
•
|
For the 12-month period ended March 31, 2026, the Fund underperformed the Aristotle Portfolio Optimization Moderate Conservative Composite Benchmark1. The Fund is a “fund of funds” that seeks to achieve its investment goal by investing in a combination of underlying funds, including funds that are actively managed by an affiliate of the investment adviser and unaffiliated ETFs, including passively managed funds that seek to track the performance of a benchmark index.
|
|
•
|
For the 12-month period ending March 31, 2026, both equity and fixed income markets ended in positive territory.
|
|
•
|
Equities delivered double-digit positive returns despite sharp pullbacks in April 2025 amidst tariff worries, and in March 2026 due to the Iran war and energy price shock.
|
|
•
|
Both developed and emerging market international equities outperformed the U.S. over the period.
|
|
•
|
Fixed income had a strong 2025 but gave back some of the gains as interest rates rose in March 2026. Credit spreads remained near historically tight levels.
|
|
•
|
The Fund was positioned to be overweight U.S. equity, slightly overweight to international equity, and slightly underweight to fixed income.
|
|
•
|
Top contributors from asset allocation came from an overweight to international large-cap value and international blend equity, while detractors came from the underweight to U.S. small-cap growth and emerging market equity.
|
|
•
|
Top contributors within manager research came from an outperformance by U.S. large-cap growth and U.S. large-cap value equity, while top detractors came from international large-cap value and growth equity.
|
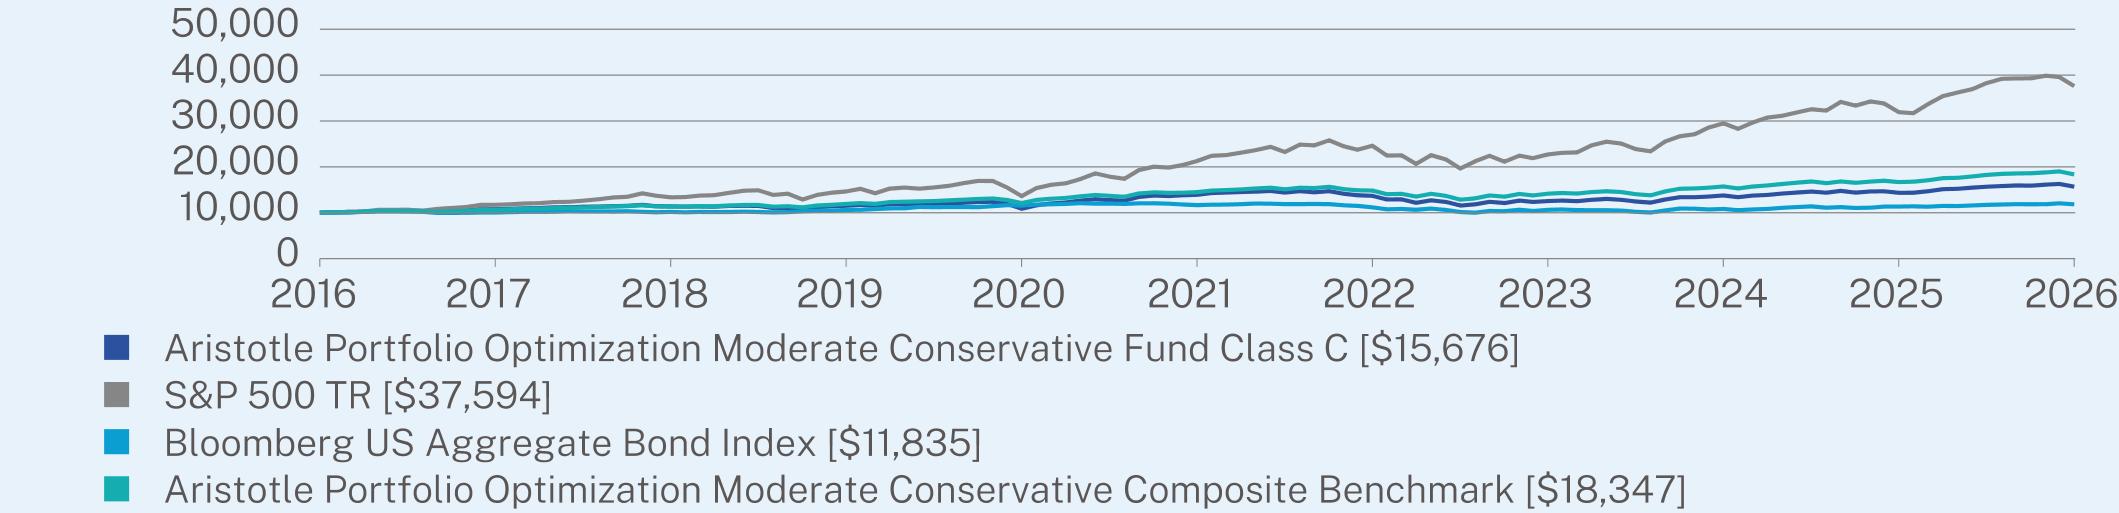
ANNUAL AVERAGE TOTAL RETURN (%)
|
|
1 Year
|
5 Year
|
10 Year
|
|
Class C (without sales charge)
|
9.36
|
2.43
|
4.60
|
|
Class C (with sales charge)
|
8.36
|
2.43
|
4.60
|
|
S&P 500 TR
|
17.80
|
12.06
|
14.16
|
|
Bloomberg US Aggregate Bond Index
|
4.35
|
0.31
|
1.70
|
|
Aristotle Portfolio Optimization Moderate Conservative Composite Benchmark
|
10.02
|
4.84
|
6.26
|
Visit https://www.aristotlefunds.com/resources/prospectuses-reports for more recent performance information.
KEY FUND STATISTICS (as of March 31, 2026)
|
Net Assets
|
$178,691,535
|
|
Number of Holdings
|
21
|
|
Net Advisory Fee
|
$376,045
|
|
Portfolio Turnover Rate
|
56%
|
WHAT DID THE FUND INVEST IN? (as of March 31, 2026)*
|
Top 10 Issuers
|
(%)
|
|
Aristotle Core Bond Fund
|
25.1%
|
|
Aristotle Core Equity Fund
|
13.3%
|
|
Aristotle Core Income Fund
|
10.8%
|
|
Aristotle High Yield Bond Fund
|
8.4%
|
|
Aristotle Short Duration Income Fund
|
7.0%
|
|
iShares Russell 1000 Value ETF
|
6.8%
|
|
Aristotle Growth Equity Fund
|
5.9%
|
|
Aristotle International Equity Fund
|
4.0%
|
|
iShares J.P. Morgan USD Emerging Markets Bond ETF
|
3.0%
|
|
iShares Russell Mid-Cap Value ETF
|
2.5%
|
Security Type Breakdown (%)

Changes to Fund’s Principal Risks:
In the Fund’s Principal Risks, Securities Lending Risk was added.
In the Fund’s Principal Risks from Holdings in Underlying Funds, Small-Capitalization Companies Risk, Preferred Stock Risk, Financial Sector Risk, Industrials Sector Risk, Industry Concentration Risk and Securities Lending Risk were added and Growth Companies Risk and Geographic Focus Risk were removed.
Changes to the Fund’s Principal Investment Strategy:
The Fund’s Principal Investment Strategies were revised to note that the Fund may lend its portfolio securities to generate additional income.
Changes to Fund’s Portfolio Manager or Portfolio Management Team:
Effective July 29, 2025, Howard T. Hirakawa was no longer a portfolio manager of the Fund.
This report describes changes to the Fund that occurred during the reporting period.
WHAT WERE THE FUND COSTS FOR THE PAST YEAR? (based on a hypothetical $10,000 investment)
|
Class Name
|
Costs of a $10,000 investment
|
Costs paid as a percentage of a $10,000 investment
|
|
Class I-2
|
$47
|
0.45%
|
HOW DID THE FUND PERFORM LAST YEAR AND WHAT AFFECTED ITS PERFORMANCE?
|
•
|
For the 12-month period ended March 31, 2026, the Fund outperformed the Aristotle Portfolio Optimization Moderate Conservative Composite Benchmark1. The Fund is a “fund of funds” that seeks to achieve its investment goal by investing in a combination of underlying funds, including funds that are actively managed by an affiliate of the investment adviser and unaffiliated ETFs, including passively managed funds that seek to track the performance of a benchmark index.
|
|
•
|
For the 12-month period ending March 31, 2026, both equity and fixed income markets ended in positive territory.
|
|
•
|
Equities delivered double-digit positive returns despite sharp pullbacks in April 2025 amidst tariff worries, and in March 2026 due to the Iran war and energy price shock.
|
|
•
|
Both developed and emerging market international equities outperformed the U.S. over the period.
|
|
•
|
Fixed income had a strong 2025 but gave back some of the gains as interest rates rose in March 2026. Credit spreads remained near historically tight levels.
|
|
•
|
The Fund was positioned to be overweight U.S. equity, slightly overweight to international equity, and slightly underweight to fixed income.
|
|
•
|
Top contributors from asset allocation came from an overweight to international large-cap value and international blend equity, while detractors came from the underweight to U.S. small-cap growth and emerging market equity.
|
|
•
|
Top contributors within manager research came from an outperformance by U.S. large-cap growth and U.S. large-cap value equity, while top detractors came from international large-cap value and growth equity.
|
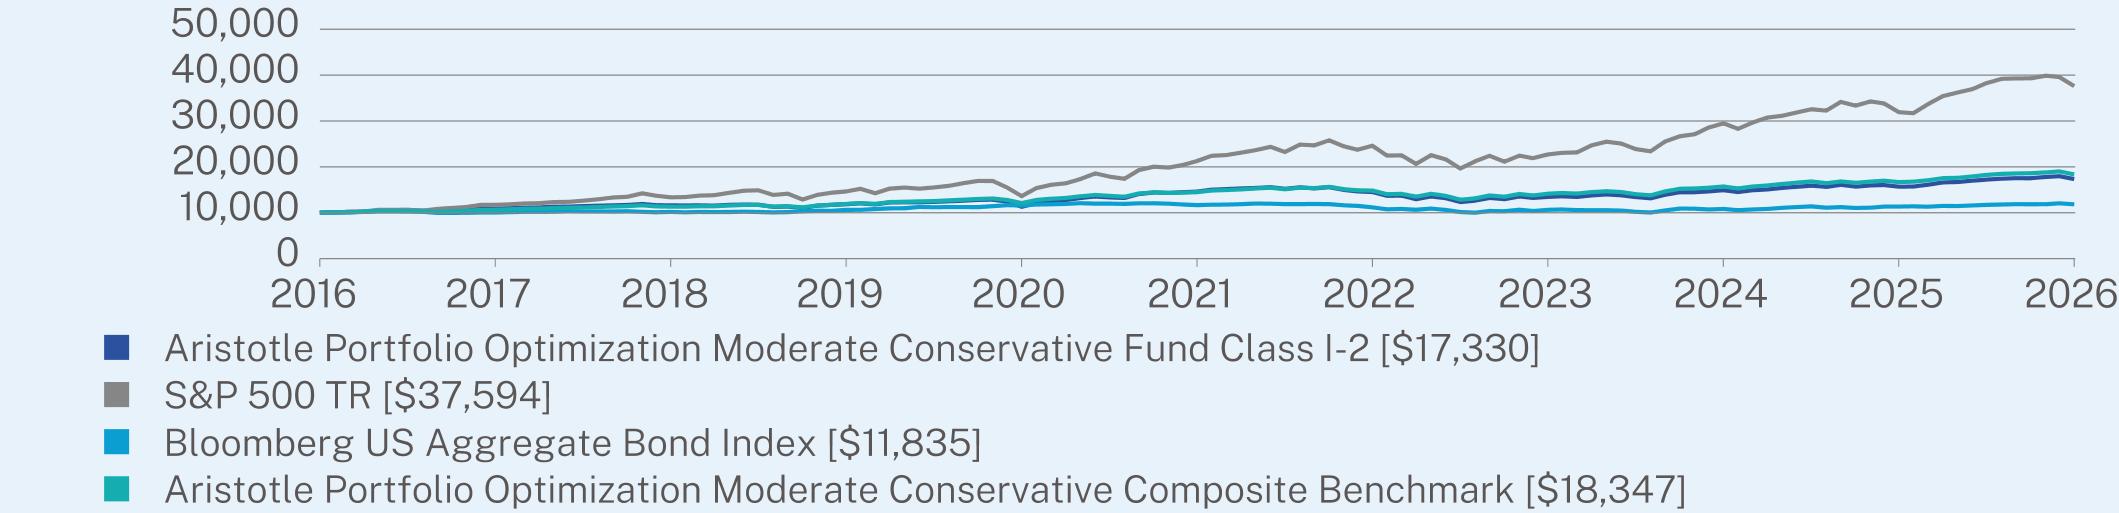
ANNUAL AVERAGE TOTAL RETURN (%)
|
|
1 Year
|
5 Year
|
10 Year
|
|
Class I-2 (without sales charge)
|
10.54
|
3.47
|
5.65
|
|
S&P 500 TR
|
17.80
|
12.06
|
14.16
|
|
Bloomberg US Aggregate Bond Index
|
4.35
|
0.31
|
1.70
|
|
Aristotle Portfolio Optimization Moderate Conservative Composite Benchmark
|
10.02
|
4.84
|
6.26
|
Visit https://www.aristotlefunds.com/resources/prospectuses-reports for more recent performance information.
KEY FUND STATISTICS (as of March 31, 2026)
|
Net Assets
|
$178,691,535
|
|
Number of Holdings
|
21
|
|
Net Advisory Fee
|
$376,045
|
|
Portfolio Turnover Rate
|
56%
|
WHAT DID THE FUND INVEST IN? (as of March 31, 2026)*
|
Top 10 Issuers
|
(%)
|
|
Aristotle Core Bond Fund
|
25.1%
|
|
Aristotle Core Equity Fund
|
13.3%
|
|
Aristotle Core Income Fund
|
10.8%
|
|
Aristotle High Yield Bond Fund
|
8.4%
|
|
Aristotle Short Duration Income Fund
|
7.0%
|
|
iShares Russell 1000 Value ETF
|
6.8%
|
|
Aristotle Growth Equity Fund
|
5.9%
|
|
Aristotle International Equity Fund
|
4.0%
|
|
iShares J.P. Morgan USD Emerging Markets Bond ETF
|
3.0%
|
|
iShares Russell Mid-Cap Value ETF
|
2.5%
|
Security Type Breakdown (%)

Changes to Fund’s Principal Risks:
In the Fund’s Principal Risks, Securities Lending Risk was added.
In the Fund’s Principal Risks from Holdings in Underlying Funds, Small-Capitalization Companies Risk, Preferred Stock Risk, Financial Sector Risk, Industrials Sector Risk, Industry Concentration Risk and Securities Lending Risk were added and Growth Companies Risk and Geographic Focus Risk were removed.
Changes to the Fund’s Principal Investment Strategy:
The Fund’s Principal Investment Strategies were revised to note that the Fund may lend its portfolio securities to generate additional income.
Changes to Fund’s Portfolio Manager or Portfolio Management Team:
Effective July 29, 2025, Howard T. Hirakawa was no longer a portfolio manager of the Fund.
This report describes changes to the Fund that occurred during the reporting period.
WHAT WERE THE FUND COSTS FOR THE PAST YEAR? (based on a hypothetical $10,000 investment)
|
Class Name
|
Costs of a $10,000 investment
|
Costs paid as a percentage of a $10,000 investment
|
|
Class A
|
$74
|
0.70%
|
HOW DID THE FUND PERFORM LAST YEAR AND WHAT AFFECTED ITS PERFORMANCE?
|
•
|
For the 12-month period ended March 31, 2026, the Fund underperformed the Aristotle Portfolio Optimization Moderate Composite Benchmark1. The Fund is a “fund of funds” that seeks to achieve its investment goal by investing in a combination of underlying funds, including funds that are actively managed by an affiliate of the investment adviser and unaffiliated ETFs, including passively managed funds that seek to track the performance of a benchmark index.
|
|
•
|
For the 12-month period ending March 31, 2026, both equity and fixed income markets ended in positive territory.
|
|
•
|
Equities delivered double-digit positive returns despite sharp pullbacks in April 2025 amidst tariff worries, and in March 2026 due to the Iran war and energy price shock.
|
|
•
|
Both developed and emerging market international equities outperformed the U.S. over the period.
|
|
•
|
Fixed income had a strong 2025 but gave back some of the gains as interest rates rose in March 2026. Credit spreads remained near historically tight levels.
|
|
•
|
The Fund was positioned to be overweight U.S. equity, slightly overweight to international equity, and slightly underweight to fixed income.
|
|
•
|
Top contributors from asset allocation came from an overweight to international large-cap value equity and an underweight to U.S. core bond, while detractors came from the underweight to U.S. small-cap growth and emerging market equity.
|
|
•
|
Top contributors within manager research came from an outperformance by U.S. large-cap growth and U.S. large-cap value equity, while top detractors came from international large-cap value and growth equity.
|
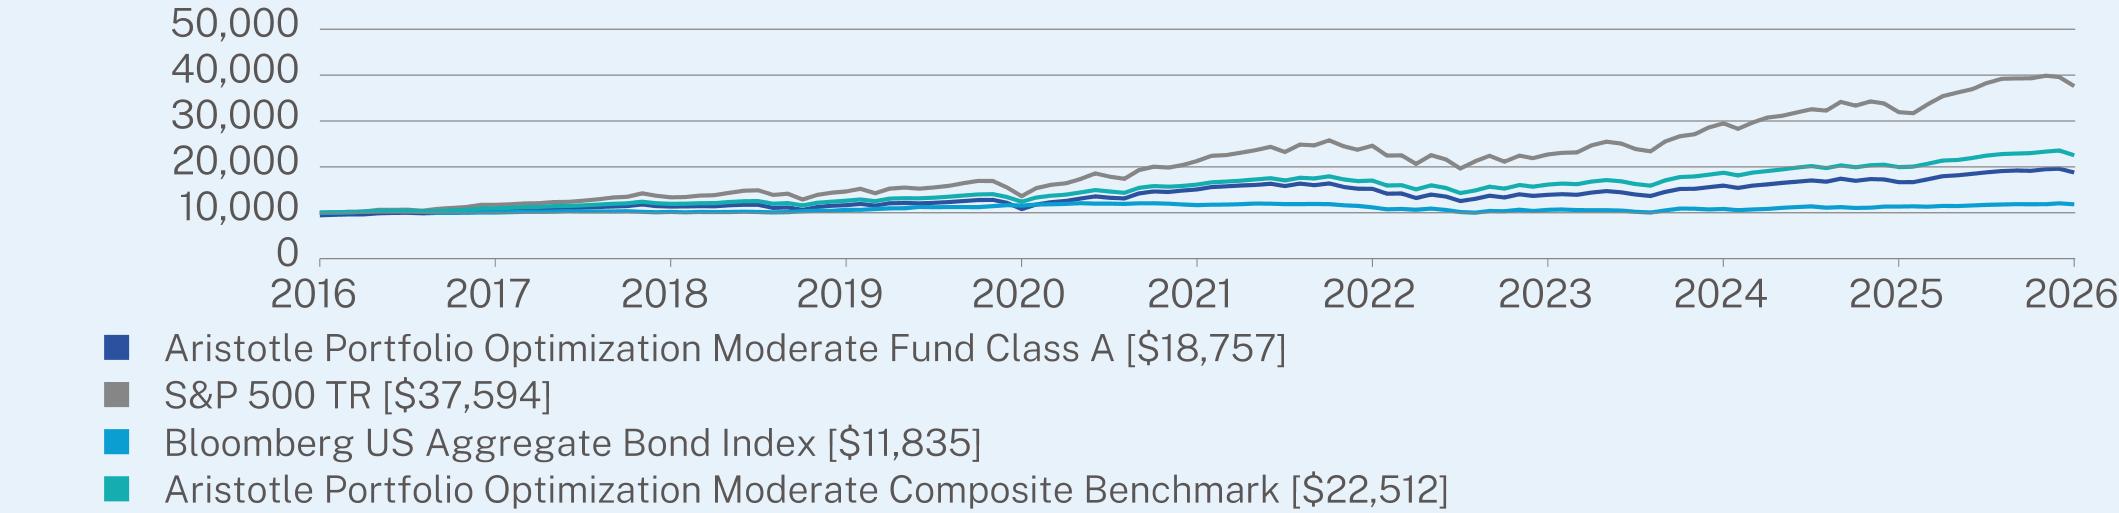
ANNUAL AVERAGE TOTAL RETURN (%)
|
|
1 Year
|
5 Year
|
10 Year
|
|
Class A (without sales charge)
|
12.64
|
4.47
|
7.10
|
|
Class A (with sales charge)
|
6.47
|
3.29
|
6.49
|
|
S&P 500 TR
|
17.80
|
12.06
|
14.16
|
|
Bloomberg US Aggregate Bond Index
|
4.35
|
0.31
|
1.70
|
|
Aristotle Portfolio Optimization Moderate Composite Benchmark
|
12.92
|
6.90
|
8.45
|
Visit https://www.aristotlefunds.com/resources/prospectuses-reports for more recent performance information.
KEY FUND STATISTICS (as of March 31, 2026)
|
Net Assets
|
$640,959,509
|
|
Number of Holdings
|
21
|
|
Net Advisory Fee
|
$1,351,444
|
|
Portfolio Turnover Rate
|
47%
|
WHAT DID THE FUND INVEST IN? (as of March 31, 2026)*
|
Top 10 Issuers
|
(%)
|
|
Aristotle Core Equity Fund
|
17.7%
|
|
Aristotle Core Bond Fund
|
17.0%
|
|
Aristotle Growth Equity Fund
|
13.2%
|
|
iShares Russell 1000 Value ETF
|
9.2%
|
|
Aristotle Core Income Fund
|
7.5%
|
|
Aristotle Short Duration Income Fund
|
7.0%
|
|
iShares Russell Mid-Cap Value ETF
|
4.0%
|
|
Aristotle International Equity Fund
|
4.0%
|
|
iShares Russell Mid-Cap Growth ETF
|
4.0%
|
|
Aristotle High Yield Bond Fund
|
3.5%
|
Security Type Breakdown (%)

Changes to Fund’s Principal Risks:
In the Fund’s Principal Risks, Securities Lending Risk was added.
In the Fund’s Principal Risks from Holdings in Underlying Funds, Financial Sector Risk, Industrials Sector Risk, Industry Concentration Risk and Securities Lending Risk were added and Geographic Focus Risk was removed.
Changes to the Fund’s Principal Investment Strategy:
The Fund’s Principal Investment Strategies were revised to note that the Fund may lend its portfolio securities to generate additional income.
Changes to Fund’s Portfolio Manager or Portfolio Management Team:
Effective July 29, 2025, Howard T. Hirakawa was no longer a portfolio manager of the Fund.
This report describes changes to the Fund that occurred during the reporting period.
WHAT WERE THE FUND COSTS FOR THE PAST YEAR? (based on a hypothetical $10,000 investment)
|
Class Name
|
Costs of a $10,000 investment
|
Costs paid as a percentage of a $10,000 investment
|
|
Class C
|
$154
|
1.45%
|
HOW DID THE FUND PERFORM LAST YEAR AND WHAT AFFECTED ITS PERFORMANCE?
|
•
|
For the 12-month period ended March 31, 2026, the Fund underperformed the Aristotle Portfolio Optimization Moderate Composite Benchmark1. The Fund is a “fund of funds” that seeks to achieve its investment goal by investing in a combination of underlying funds, including funds that are actively managed by an affiliate of the investment adviser and unaffiliated ETFs, including passively managed funds that seek to track the performance of a benchmark index.
|
|
•
|
For the 12-month period ending March 31, 2026, both equity and fixed income markets ended in positive territory.
|
|
•
|
Equities delivered double-digit positive returns despite sharp pullbacks in April 2025 amidst tariff worries, and in March 2026 due to the Iran war and energy price shock.
|
|
•
|
Both developed and emerging market international equities outperformed the U.S. over the period.
|
|
•
|
Fixed income had a strong 2025 but gave back some of the gains as interest rates rose in March 2026. Credit spreads remained near historically tight levels.
|
|
•
|
The Fund was positioned to be overweight U.S. equity, slightly overweight to international equity, and slightly underweight to fixed income.
|
|
•
|
Top contributors from asset allocation came from an overweight to international large-cap value equity and an underweight to U.S. core bond, while detractors came from the underweight to U.S. small-cap growth and emerging market equity.
|
|
•
|
Top contributors within manager research came from an outperformance by U.S. large-cap growth and U.S. large-cap value equity, while top detractors came from international large-cap value and growth equity.
|
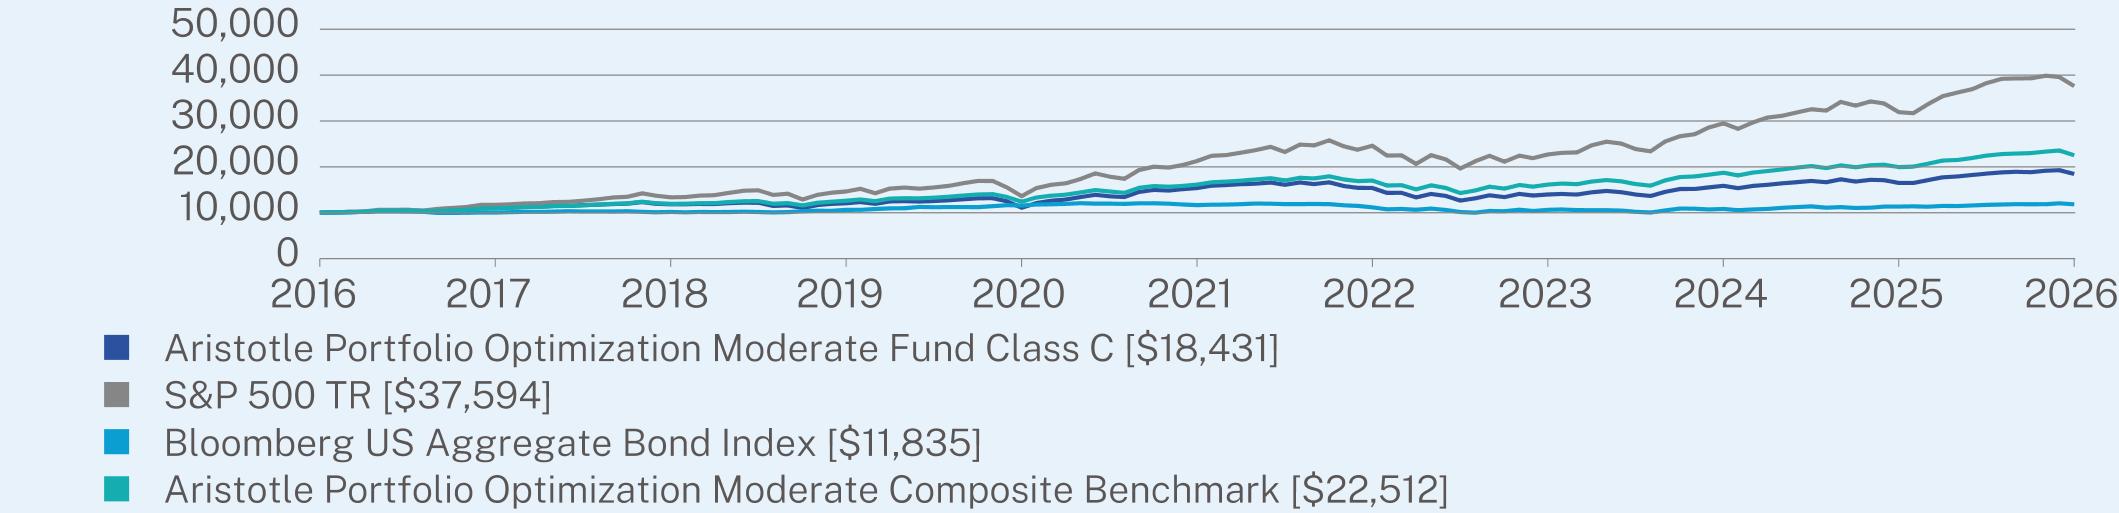
ANNUAL AVERAGE TOTAL RETURN (%)
|
|
1 Year
|
5 Year
|
10 Year
|
|
Class C (without sales charge)
|
11.80
|
3.70
|
6.31
|
|
Class C (with sales charge)
|
10.80
|
3.70
|
6.31
|
|
S&P 500 TR
|
17.80
|
12.06
|
14.16
|
|
Bloomberg US Aggregate Bond Index
|
4.35
|
0.31
|
1.70
|
|
Aristotle Portfolio Optimization Moderate Composite Benchmark
|
12.92
|
6.90
|
8.45
|
Visit https://www.aristotlefunds.com/resources/prospectuses-reports for more recent performance information.
KEY FUND STATISTICS (as of March 31, 2026)
|
Net Assets
|
$640,959,509
|
|
Number of Holdings
|
21
|
|
Net Advisory Fee
|
$1,351,444
|
|
Portfolio Turnover Rate
|
47%
|
WHAT DID THE FUND INVEST IN? (as of March 31, 2026)*
|
Top 10 Issuers
|
(%)
|
|
Aristotle Core Equity Fund
|
17.7%
|
|
Aristotle Core Bond Fund
|
17.0%
|
|
Aristotle Growth Equity Fund
|
13.2%
|
|
iShares Russell 1000 Value ETF
|
9.2%
|
|
Aristotle Core Income Fund
|
7.5%
|
|
Aristotle Short Duration Income Fund
|
7.0%
|
|
iShares Russell Mid-Cap Value ETF
|
4.0%
|
|
Aristotle International Equity Fund
|
4.0%
|
|
iShares Russell Mid-Cap Growth ETF
|
4.0%
|
|
Aristotle High Yield Bond Fund
|
3.5%
|
Security Type Breakdown (%)
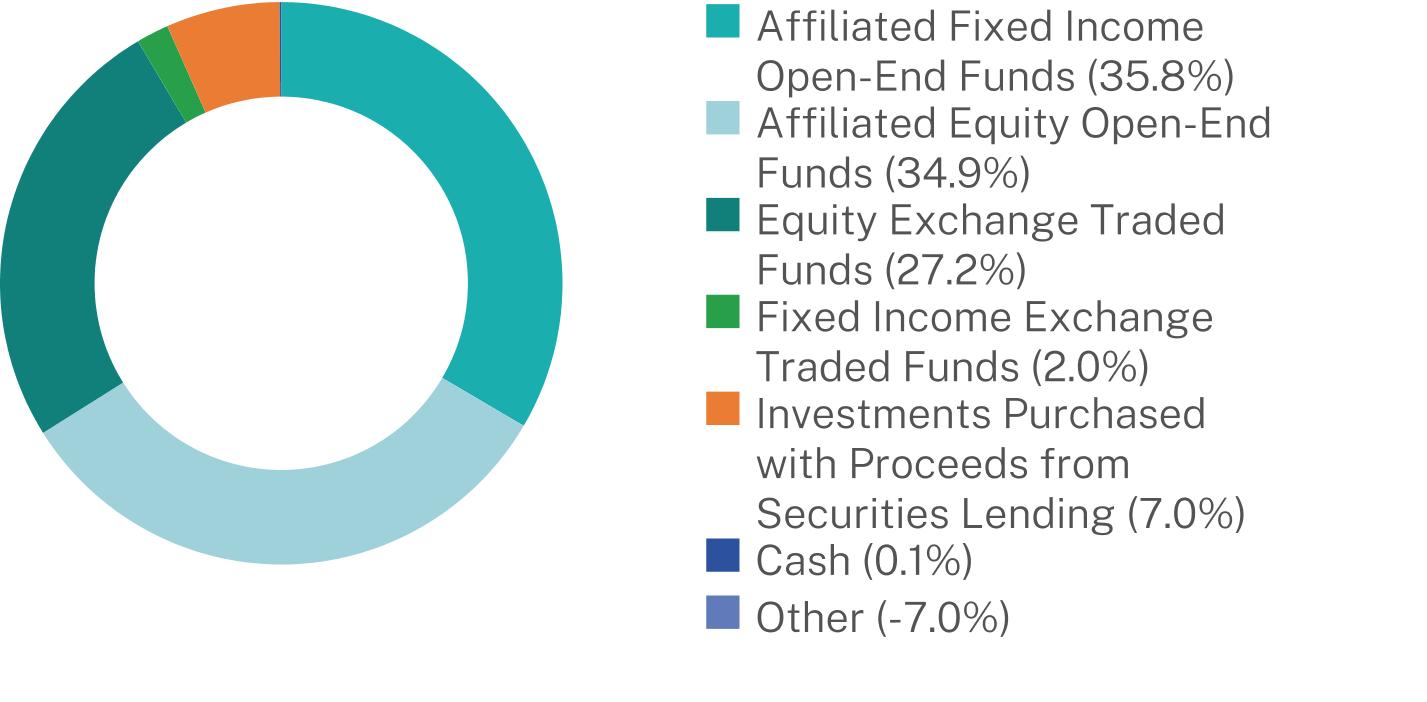
Changes to Fund’s Principal Risks:
In the Fund’s Principal Risks, Securities Lending Risk was added.
In the Fund’s Principal Risks from Holdings in Underlying Funds, Financial Sector Risk, Industrials Sector Risk, Industry Concentration Risk and Securities Lending Risk were added and Geographic Focus Risk was removed.
Changes to the Fund’s Principal Investment Strategy:
The Fund’s Principal Investment Strategies were revised to note that the Fund may lend its portfolio securities to generate additional income.
Changes to Fund’s Portfolio Manager or Portfolio Management Team:
Effective July 29, 2025, Howard T. Hirakawa was no longer a portfolio manager of the Fund.
This report describes changes to the Fund that occurred during the reporting period.
WHAT WERE THE FUND COSTS FOR THE PAST YEAR? (based on a hypothetical $10,000 investment)
|
Class Name
|
Costs of a $10,000 investment
|
Costs paid as a percentage of a $10,000 investment
|
|
Class I-2
|
$48
|
0.45%
|
HOW DID THE FUND PERFORM LAST YEAR AND WHAT AFFECTED ITS PERFORMANCE?
|
•
|
For the 12-month period ended March 31, 2026, the Fund marginally outperformed the Aristotle Portfolio Optimization Moderate Composite Benchmark1. The Fund is a “fund of funds” that seeks to achieve its investment goal by investing in a combination of underlying funds, including funds that are actively managed by an affiliate of the investment adviser and unaffiliated ETFs, including passively managed funds that seek to track the performance of a benchmark index.
|
|
•
|
For the 12-month period ending March 31, 2026, both equity and fixed income markets ended in positive territory.
|
|
•
|
Equities delivered double-digit positive returns despite sharp pullbacks in April 2025 amidst tariff worries, and in March 2026 due to the Iran war and energy price shock.
|
|
•
|
Both developed and emerging market international equities outperformed the U.S. over the period.
|
|
•
|
Fixed income had a strong 2025 but gave back some of the gains as interest rates rose in March 2026. Credit spreads remained near historically tight levels.
|
|
•
|
The Fund was positioned to be overweight U.S. equity, slightly overweight to international equity, and slightly underweight to fixed income.
|
|
•
|
Top contributors from asset allocation came from an overweight to international large-cap value equity and an underweight to U.S. core bond, while detractors came from the underweight to U.S. small-cap growth and emerging market equity.
|
|
•
|
Top contributors within manager research came from an outperformance by U.S. large-cap growth and U.S. large-cap value equity, while top detractors came from international large-cap value and growth equity.
|
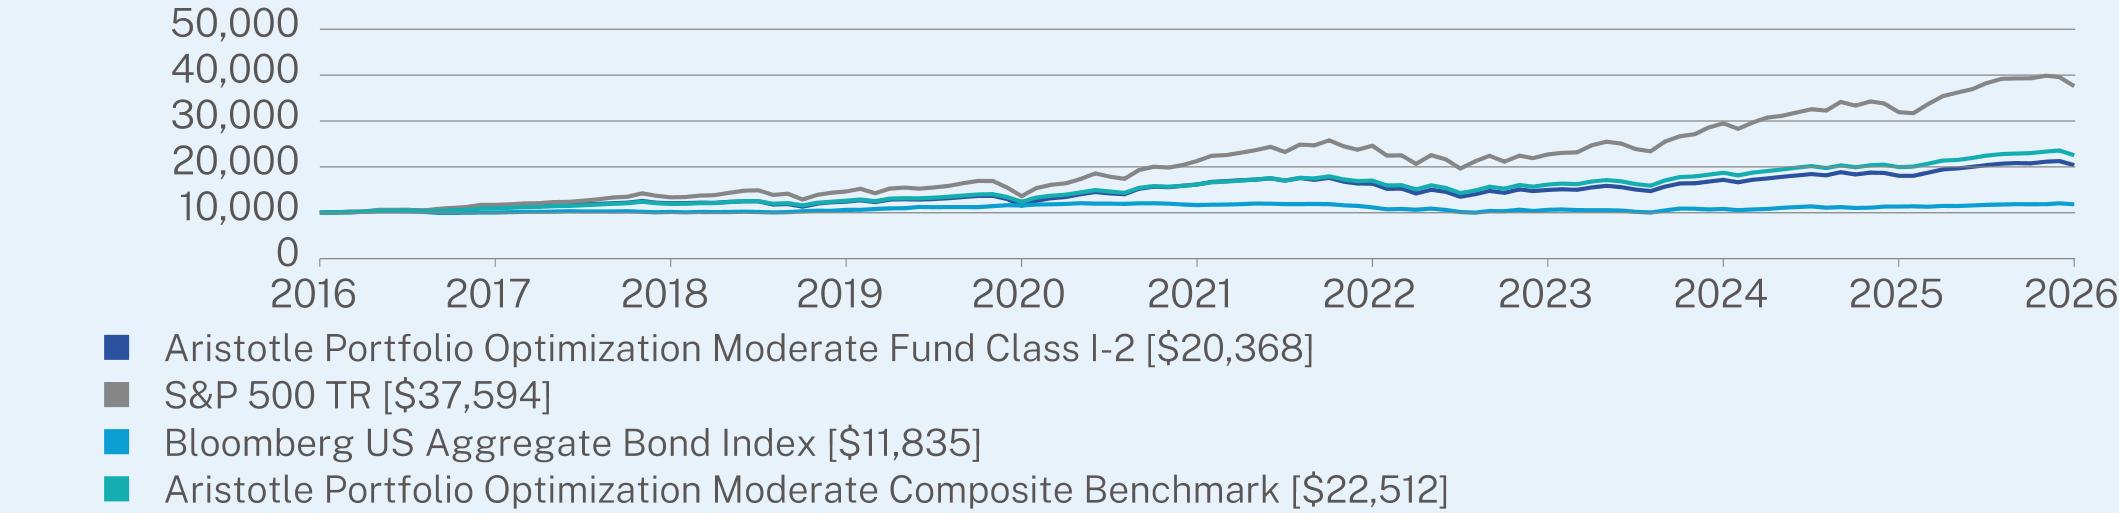
ANNUAL AVERAGE TOTAL RETURN (%)
|
|
1 Year
|
5 Year
|
10 Year
|
|
Class I-2 (without sales charge)
|
12.94
|
4.75
|
7.37
|
|
S&P 500 TR
|
17.80
|
12.06
|
14.16
|
|
Bloomberg US Aggregate Bond Index
|
4.35
|
0.31
|
1.70
|
|
Aristotle Portfolio Optimization Moderate Composite Benchmark
|
12.92
|
6.90
|
8.45
|
Visit https://www.aristotlefunds.com/resources/prospectuses-reports for more recent performance information.
KEY FUND STATISTICS (as of March 31, 2026)
|
Net Assets
|
$640,959,509
|
|
Number of Holdings
|
21
|
|
Net Advisory Fee
|
$1,351,444
|
|
Portfolio Turnover Rate
|
47%
|
WHAT DID THE FUND INVEST IN? (as of March 31, 2026)*
|
Top 10 Issuers
|
(%)
|
|
Aristotle Core Equity Fund
|
17.7%
|
|
Aristotle Core Bond Fund
|
17.0%
|
|
Aristotle Growth Equity Fund
|
13.2%
|
|
iShares Russell 1000 Value ETF
|
9.2%
|
|
Aristotle Core Income Fund
|
7.5%
|
|
Aristotle Short Duration Income Fund
|
7.0%
|
|
iShares Russell Mid-Cap Value ETF
|
4.0%
|
|
Aristotle International Equity Fund
|
4.0%
|
|
iShares Russell Mid-Cap Growth ETF
|
4.0%
|
|
Aristotle High Yield Bond Fund
|
3.5%
|
Security Type Breakdown (%)

Changes to Fund’s Principal Risks:
In the Fund’s Principal Risks, Securities Lending Risk was added.
In the Fund’s Principal Risks from Holdings in Underlying Funds, Financial Sector Risk, Industrials Sector Risk, Industry Concentration Risk and Securities Lending Risk were added and Geographic Focus Risk was removed.
Changes to the Fund’s Principal Investment Strategy:
The Fund’s Principal Investment Strategies were revised to note that the Fund may lend its portfolio securities to generate additional income.
Changes to Fund’s Portfolio Manager or Portfolio Management Team:
Effective July 29, 2025, Howard T. Hirakawa was no longer a portfolio manager of the Fund.
This report describes changes to the Fund that occurred during the reporting period.
WHAT WERE THE FUND COSTS FOR THE PAST YEAR? (based on a hypothetical $10,000 investment)
|
Class Name
|
Costs of a $10,000 investment
|
Costs paid as a percentage of a $10,000 investment
|
|
Class A
|
$76
|
0.75%
|
HOW DID THE FUND PERFORM LAST YEAR AND WHAT AFFECTED ITS PERFORMANCE?
|
•
|
For the 12-month period ended March 31, 2026, the Fund outperformed its performance benchmark, the Bloomberg 1-3 Year US Government/Credit Index. The Fund invests principally in income-producing debt instruments.
|
|
•
|
Over the past 12 months, the U.S. Treasury yield curve transitioned toward a more normalized, upward-sloping shape, reflecting easing monetary policy expectations and an improving growth outlook; yields remained elevated relative to recent history—supporting returns—while corporate spreads also provided a favorable backdrop.
|
|
•
|
Exposure to specific credit-sensitive sectors benefited performance for most of the period as credit remained broadly supported. The front-end positioning and historically elevated yield profile helped insulate from the full effect of episodic credit spread widening as compared to longer duration-based offerings.
|
|
•
|
By credit quality, BBB rated credits were most beneficial to performance followed by AAA rated credits. By asset class, investment grade corporate bonds were most beneficial to performance followed by asset backed securities.
|
|
•
|
Positive contributions to relative performance were led by credit selection and asset class rotation.
|
|
•
|
The Fund’s duration was marginally increased over the year seeking to capture additional yield compensation. On a year-over-year basis, we increased shorter duration investment grade rated corporate bond and asset backed exposures while reducing floating rate loan and government bond exposure.
|
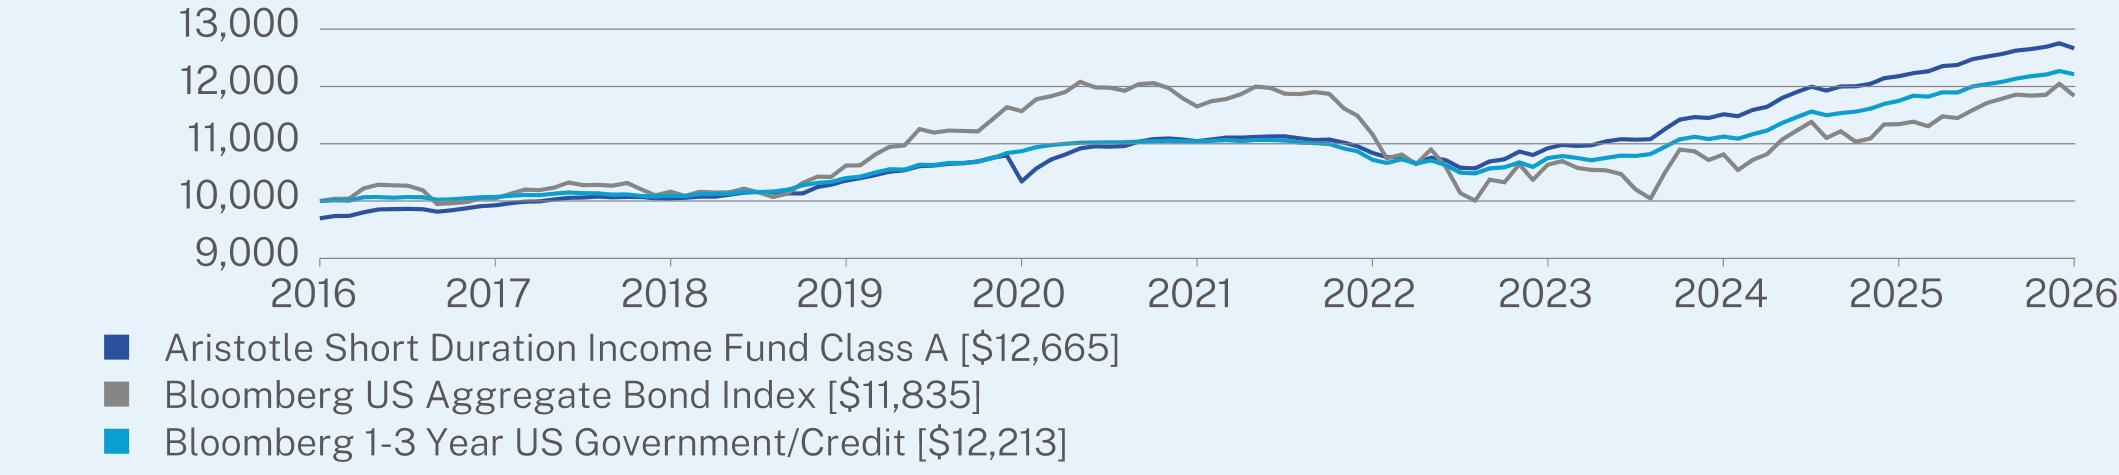
ANNUAL AVERAGE TOTAL RETURN (%)
|
|
1 Year
|
5 Year
|
10 Year
|
|
Class A (without sales charge)
|
3.98
|
2.78
|
2.71
|
|
Class A (with sales charge)
|
0.83
|
2.15
|
2.39
|
|
Bloomberg US Aggregate Bond Index
|
4.35
|
0.31
|
1.70
|
|
Bloomberg 1-3 Year US Government/Credit
|
3.96
|
2.04
|
2.02
|
Visit https://www.aristotlefunds.com/resources/prospectuses-reports for more recent performance information.
KEY FUND STATISTICS (as of March 31, 2026)
|
Net Assets
|
$999,441,552
|
|
Number of Holdings
|
320
|
|
Net Advisory Fee
|
$2,461,294
|
|
Portfolio Turnover Rate
|
86%
|
WHAT DID THE FUND INVEST IN? (as of March 31, 2026)*
|
Top 10 Issuers
|
(%)
|
|
United States Treasury Note/Bond
|
10.7%
|
|
JPMorgan Chase & Co.
|
2.6%
|
|
Morgan Stanley
|
2.2%
|
|
Wells Fargo & Co.
|
1.9%
|
|
Bank of America Corp.
|
1.8%
|
|
Goldman Sachs Group, Inc.
|
1.7%
|
|
Santander Consumer USA Holdings, Inc.
|
1.5%
|
|
Navient Student Loan Trust
|
1.1%
|
|
UBS AG
|
1.1%
|
|
Magnetite CLO Ltd.
|
1.0%
|
Sector Breakdown (%)

Changes to Fund’s Principal Risks:
In the Fund’s Principal Risks, Securities Lending Risk and Underlying Fund Risk were added.
Changes to the Fund’s Principal Investment Strategy:
The Fund’s Principal Investment Strategies were revised to note that the Fund may lend its portfolio securities to generate additional income.
This report describes changes to the Fund that occurred during the reporting period.
WHAT WERE THE FUND COSTS FOR THE PAST YEAR? (based on a hypothetical $10,000 investment)
|
Class Name
|
Costs of a $10,000 investment
|
Costs paid as a percentage of a $10,000 investment
|
|
Class C
|
$152
|
1.50%
|
HOW DID THE FUND PERFORM LAST YEAR AND WHAT AFFECTED ITS PERFORMANCE?
|
•
|
For the 12-month period ended March 31, 2026, the Fund underperformed its performance benchmark, the Bloomberg 1-3 Year US Government/Credit Index. The Fund invests principally in income-producing debt instruments.
|
|
•
|
Over the past 12 months, the U.S. Treasury yield curve transitioned toward a more normalized, upward-sloping shape, reflecting easing monetary policy expectations and an improving growth outlook; yields remained elevated relative to recent history—supporting returns—while corporate spreads also provided a favorable backdrop.
|
|
•
|
Exposure to specific credit-sensitive sectors benefited performance for most of the period as credit remained broadly supported. The front-end positioning and historically elevated yield profile helped insulate from the full effect of episodic credit spread widening as compared to longer duration-based offerings.
|
|
•
|
By credit quality, BBB rated credits were most beneficial to performance followed by AAA rated credits. By asset class, investment grade corporate bonds were most beneficial to performance followed by asset backed securities.
|
|
•
|
Positive contributions to relative performance were led by credit selection and asset class rotation.
|
|
•
|
The Fund’s duration was marginally increased over the year seeking to capture additional yield compensation. On a year-over-year basis, we increased shorter duration investment grade rated corporate bond and asset backed exposures while reducing floating rate loan and government bond exposure.
|
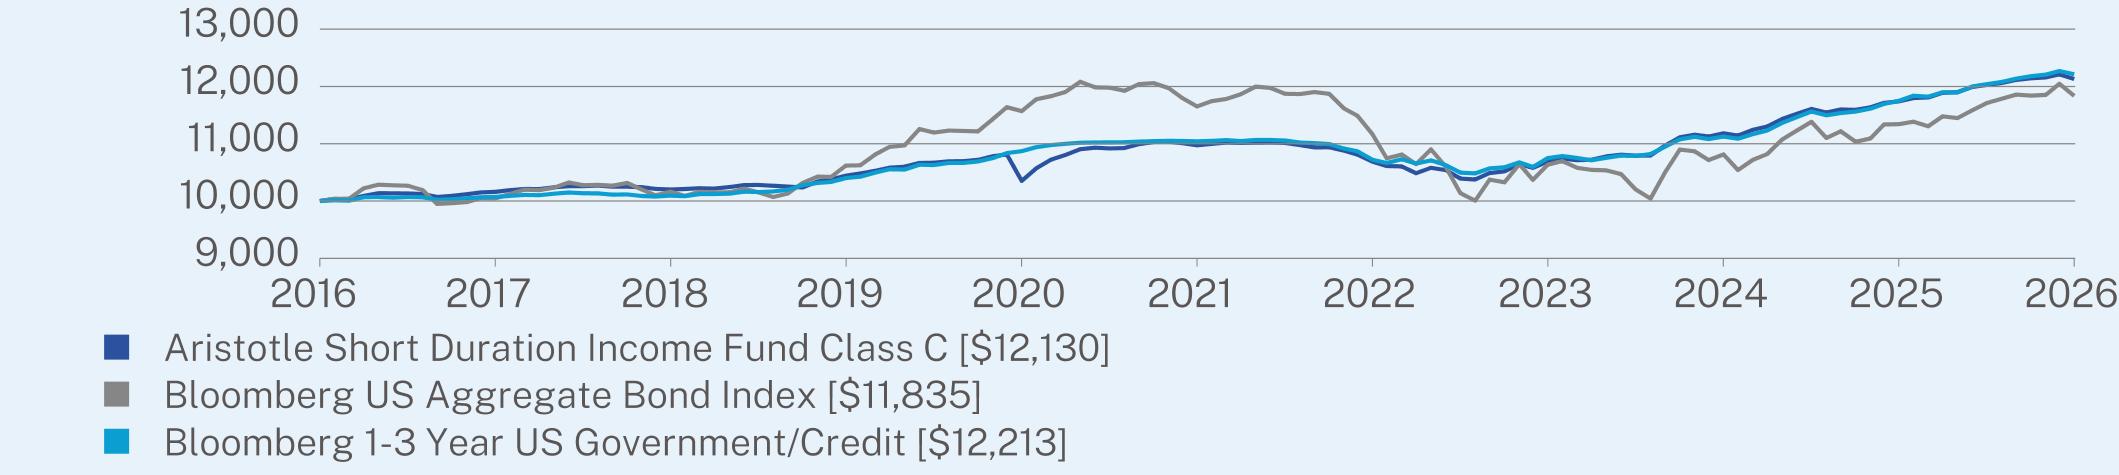
ANNUAL AVERAGE TOTAL RETURN (%)
|
|
1 Year
|
5 Year
|
10 Year
|
|
Class C (without sales charge)
|
3.31
|
2.02
|
1.95
|
|
Class C (with sales charge)
|
2.32
|
2.02
|
1.95
|
|
Bloomberg US Aggregate Bond Index
|
4.35
|
0.31
|
1.70
|
|
Bloomberg 1-3 Year US Government/Credit
|
3.96
|
2.04
|
2.02
|
Visit https://www.aristotlefunds.com/resources/prospectuses-reports for more recent performance information.
KEY FUND STATISTICS (as of March 31, 2026)
|
Net Assets
|
$999,441,552
|
|
Number of Holdings
|
320
|
|
Net Advisory Fee
|
$2,461,294
|
|
Portfolio Turnover Rate
|
86%
|
WHAT DID THE FUND INVEST IN? (as of March 31, 2026)*
|
Top 10 Issuers
|
(%)
|
|
United States Treasury Note/Bond
|
10.7%
|
|
JPMorgan Chase & Co.
|
2.6%
|
|
Morgan Stanley
|
2.2%
|
|
Wells Fargo & Co.
|
1.9%
|
|
Bank of America Corp.
|
1.8%
|
|
Goldman Sachs Group, Inc.
|
1.7%
|
|
Santander Consumer USA Holdings, Inc.
|
1.5%
|
|
Navient Student Loan Trust
|
1.1%
|
|
UBS AG
|
1.1%
|
|
Magnetite CLO Ltd.
|
1.0%
|
Sector Breakdown (%)

Changes to Fund’s Principal Risks:
In the Fund’s Principal Risks, Securities Lending Risk and Underlying Fund Risk were added.
Changes to the Fund’s Principal Investment Strategy:
The Fund’s Principal Investment Strategies were revised to note that the Fund may lend its portfolio securities to generate additional income.
This report describes changes to the Fund that occurred during the reporting period.
WHAT WERE THE FUND COSTS FOR THE PAST YEAR? (based on a hypothetical $10,000 investment)
|
Class Name
|
Costs of a $10,000 investment*
|
Costs paid as a percentage of a $10,000 investment**
|
|
Class H
|
$13
|
0.40%
|
HOW DID THE FUND PERFORM LAST YEAR AND WHAT AFFECTED ITS PERFORMANCE?
|
•
|
Since its inception on December 5, 2025, the Fund underperformed its performance benchmark, the Bloomberg 1-3 Year US Government/Credit Index. The Fund invests principally in income-producing debt instruments.
|
|
•
|
Over the past 12 months, the U.S. Treasury yield curve transitioned toward a more normalized, upward-sloping shape, reflecting easing monetary policy expectations and an improving growth outlook; yields remained elevated relative to recent history—supporting returns—while corporate spreads also provided a favorable backdrop.
|
|
•
|
Exposure to specific credit-sensitive sectors benefited performance for most of the period as credit remained broadly supported. The front-end positioning and historically elevated yield profile helped insulate from the full effect of episodic credit spread widening as compared to longer duration-based offerings.
|
|
•
|
By credit quality, BBB rated credits were most beneficial to performance followed by AAA rated credits. By asset class, investment grade corporate bonds were most beneficial to performance followed by asset backed securities.
|
|
•
|
Positive contributions to relative performance were led by credit selection and asset class rotation.
|
|
•
|
The Fund’s duration was marginally increased over the year seeking to capture additional yield compensation. On a year-over-year basis, we increased shorter duration investment grade rated corporate bond and asset backed exposures while reducing floating rate loan and government bond exposure.
|
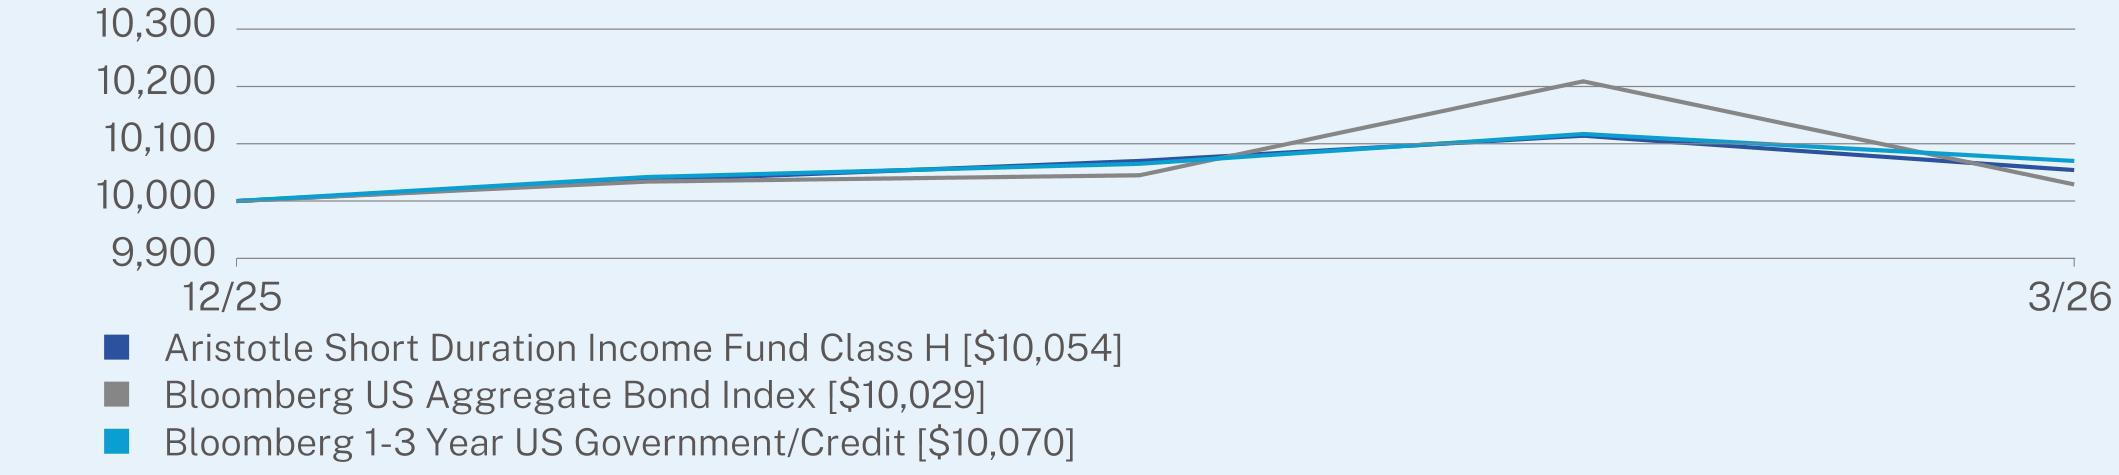
CUMULATIVE TOTAL RETURN (%)
|
|
Since Inception
(12/05/2025) |
|
Class H (without sales charge)
|
0.54
|
|
Bloomberg US Aggregate Bond Index
|
0.29
|
|
Bloomberg 1-3 Year US Government/Credit
|
0.70
|
Visit https://www.aristotlefunds.com/resources/prospectuses-reports for more recent performance information.
KEY FUND STATISTICS (as of March 31, 2026)
|
Net Assets
|
$999,441,552
|
|
Number of Holdings
|
320
|
|
Net Advisory Fee
|
$2,461,294
|
|
Portfolio Turnover Rate
|
86%
|
WHAT DID THE FUND INVEST IN? (as of March 31, 2026)*
|
Top 10 Issuers
|
(%)
|
|
United States Treasury Note/Bond
|
10.7%
|
|
JPMorgan Chase & Co.
|
2.6%
|
|
Morgan Stanley
|
2.2%
|
|
Wells Fargo & Co.
|
1.9%
|
|
Bank of America Corp.
|
1.8%
|
|
Goldman Sachs Group, Inc.
|
1.7%
|
|
Santander Consumer USA Holdings, Inc.
|
1.5%
|
|
Navient Student Loan Trust
|
1.1%
|
|
UBS AG
|
1.1%
|
|
Magnetite CLO Ltd.
|
1.0%
|
Sector Breakdown (%)
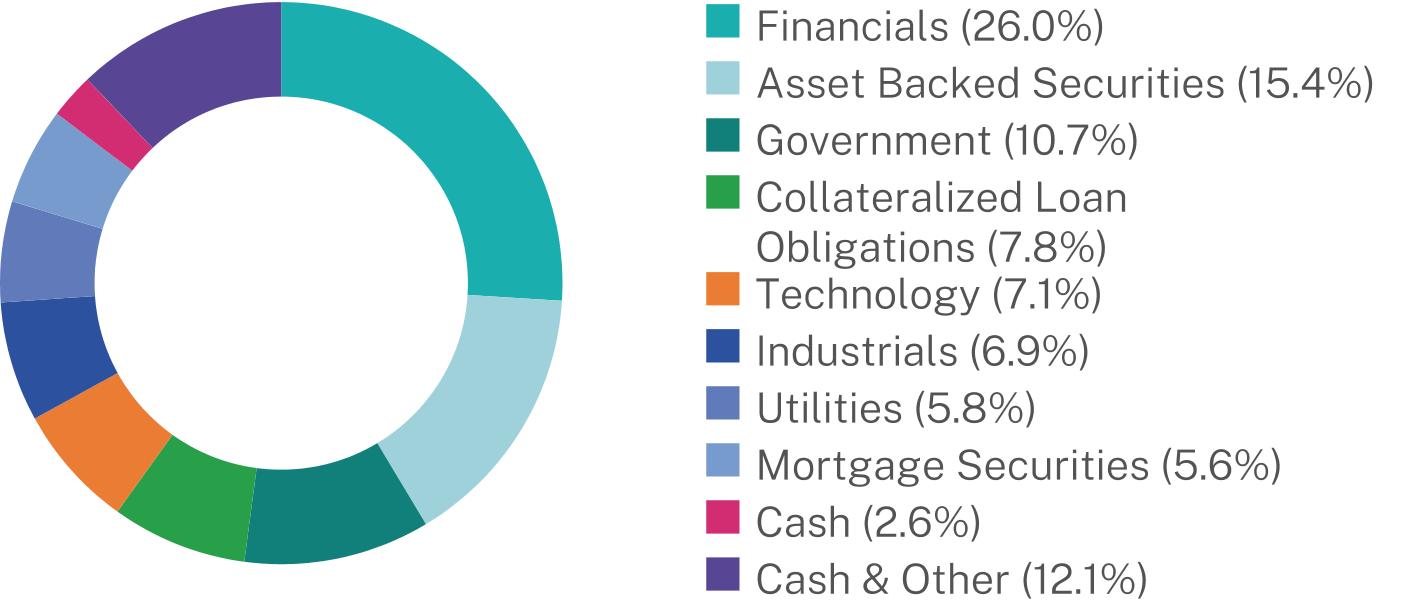
Changes to Fund’s Principal Risks:
In the Fund’s Principal Risks, Securities Lending Risk and Underlying Fund Risk were added.
Changes to the Fund’s Principal Investment Strategy:
The Fund’s Principal Investment Strategies were revised to note that the Fund may lend its portfolio securities to generate additional income.
This report describes changes to the Fund that occurred during the reporting period.
WHAT WERE THE FUND COSTS FOR THE PAST YEAR? (based on a hypothetical $10,000 investment)
|
Class Name
|
Costs of a $10,000 investment
|
Costs paid as a percentage of a $10,000 investment
|
|
Class I
|
$40
|
0.39%
|
HOW DID THE FUND PERFORM LAST YEAR AND WHAT AFFECTED ITS PERFORMANCE?
|
•
|
For the 12-month period ended March 31, 2026, the Fund outperformed its performance benchmark, the Bloomberg 1-3 Year US Government/Credit Index. The Fund invests principally in income-producing debt instruments.
|
|
•
|
Over the past 12 months, the U.S. Treasury yield curve transitioned toward a more normalized, upward-sloping shape, reflecting easing monetary policy expectations and an improving growth outlook; yields remained elevated relative to recent history—supporting returns—while corporate spreads also provided a favorable backdrop.
|
|
•
|
Exposure to specific credit-sensitive sectors benefited performance for most of the period as credit remained broadly supported. The front-end positioning and historically elevated yield profile helped insulate from the full effect of episodic credit spread widening as compared to longer duration-based offerings.
|
|
•
|
By credit quality, BBB rated credits were most beneficial to performance followed by AAA rated credits. By asset class, investment grade corporate bonds were most beneficial to performance followed by asset backed securities.
|
|
•
|
Positive contributions to relative performance were led by credit selection and asset class rotation.
|
|
•
|
The Fund’s duration was marginally increased over the year seeking to capture additional yield compensation. On a year-over-year basis, we increased shorter duration investment grade rated corporate bond and asset backed exposures while reducing floating rate loan and government bond exposure.
|
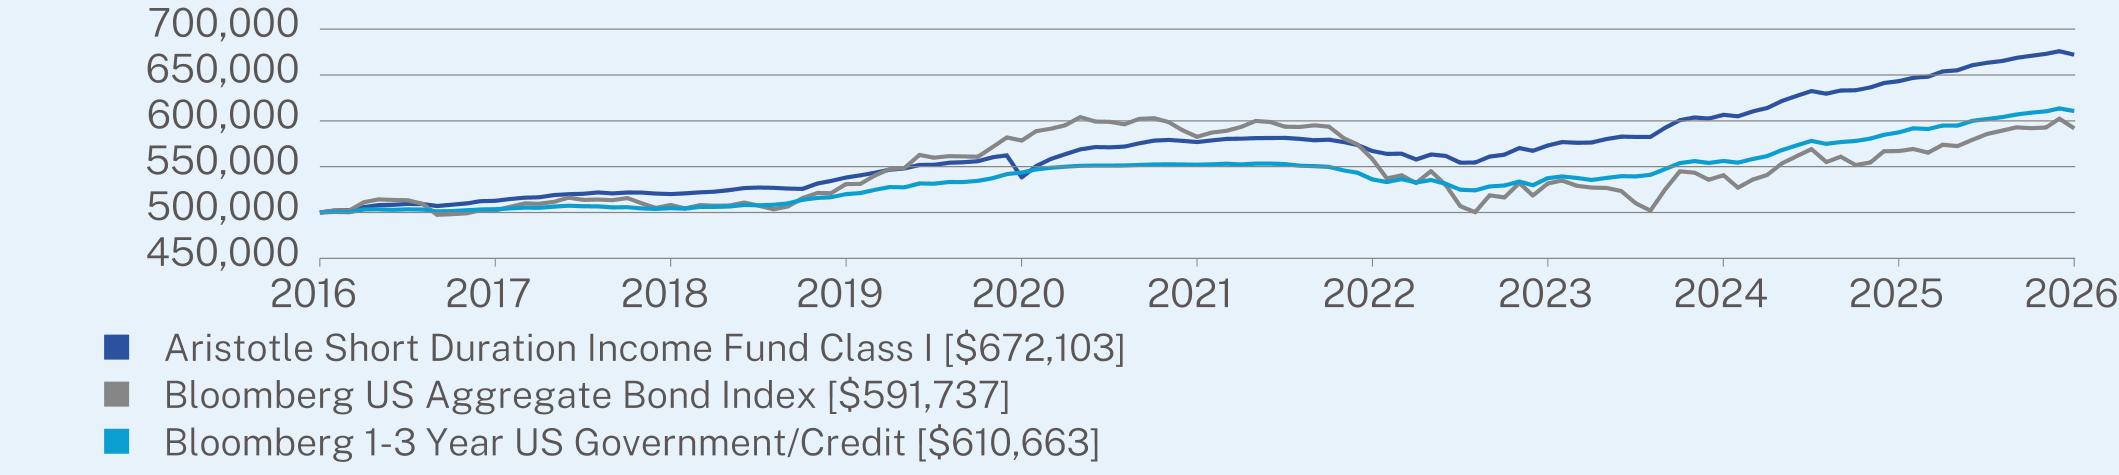
ANNUAL AVERAGE TOTAL RETURN (%)
|
|
1 Year
|
5 Year
|
10 Year
|
|
Class I (without sales charge)
|
4.47
|
3.11
|
3.00
|
|
Bloomberg US Aggregate Bond Index
|
4.35
|
0.31
|
1.70
|
|
Bloomberg 1-3 Year US Government/Credit
|
3.96
|
2.04
|
2.02
|
Visit https://www.aristotlefunds.com/resources/prospectuses-reports for more recent performance information.
KEY FUND STATISTICS (as of March 31, 2026)
|
Net Assets
|
$999,441,552
|
|
Number of Holdings
|
320
|
|
Net Advisory Fee
|
$2,461,294
|
|
Portfolio Turnover Rate
|
86%
|
WHAT DID THE FUND INVEST IN? (as of March 31, 2026)*
|
Top 10 Issuers
|
(%)
|
|
United States Treasury Note/Bond
|
10.7%
|
|
JPMorgan Chase & Co.
|
2.6%
|
|
Morgan Stanley
|
2.2%
|
|
Wells Fargo & Co.
|
1.9%
|
|
Bank of America Corp.
|
1.8%
|
|
Goldman Sachs Group, Inc.
|
1.7%
|
|
Santander Consumer USA Holdings, Inc.
|
1.5%
|
|
Navient Student Loan Trust
|
1.1%
|
|
UBS AG
|
1.1%
|
|
Magnetite CLO Ltd.
|
1.0%
|
Sector Breakdown (%)

Changes to Fund’s Principal Risks:
In the Fund’s Principal Risks, Securities Lending Risk and Underlying Fund Risk were added.
Changes to the Fund’s Principal Investment Strategy:
The Fund’s Principal Investment Strategies were revised to note that the Fund may lend its portfolio securities to generate additional income.
This report describes changes to the Fund that occurred during the reporting period.
WHAT WERE THE FUND COSTS FOR THE PAST YEAR? (based on a hypothetical $10,000 investment)
|
Class Name
|
Costs of a $10,000 investment
|
Costs paid as a percentage of a $10,000 investment
|
|
Class I-2
|
$50
|
0.49%
|
HOW DID THE FUND PERFORM LAST YEAR AND WHAT AFFECTED ITS PERFORMANCE?
|
•
|
For the 12-month period ended March 31, 2026, the Fund outperformed its performance benchmark, the Bloomberg 1-3 Year US Government/Credit Index. The Fund invests principally in income-producing debt instruments.
|
|
•
|
Over the past 12 months, the U.S. Treasury yield curve transitioned toward a more normalized, upward-sloping shape, reflecting easing monetary policy expectations and an improving growth outlook; yields remained elevated relative to recent history—supporting returns—while corporate spreads also provided a favorable backdrop.
|
|
•
|
Exposure to specific credit-sensitive sectors benefited performance for most of the period as credit remained broadly supported. The front-end positioning and historically elevated yield profile helped insulate from the full effect of episodic credit spread widening as compared to longer duration-based offerings.
|
|
•
|
By credit quality, BBB rated credits were most beneficial to performance followed by AAA rated credits. By asset class, investment grade corporate bonds were most beneficial to performance followed by asset backed securities.
|
|
•
|
Positive contributions to relative performance were led by credit selection and asset class rotation.
|
|
•
|
The Fund’s duration was marginally increased over the year seeking to capture additional yield compensation. On a year-over-year basis, we increased shorter duration investment grade rated corporate bond and asset backed exposures while reducing floating rate loan and government bond exposure.
|
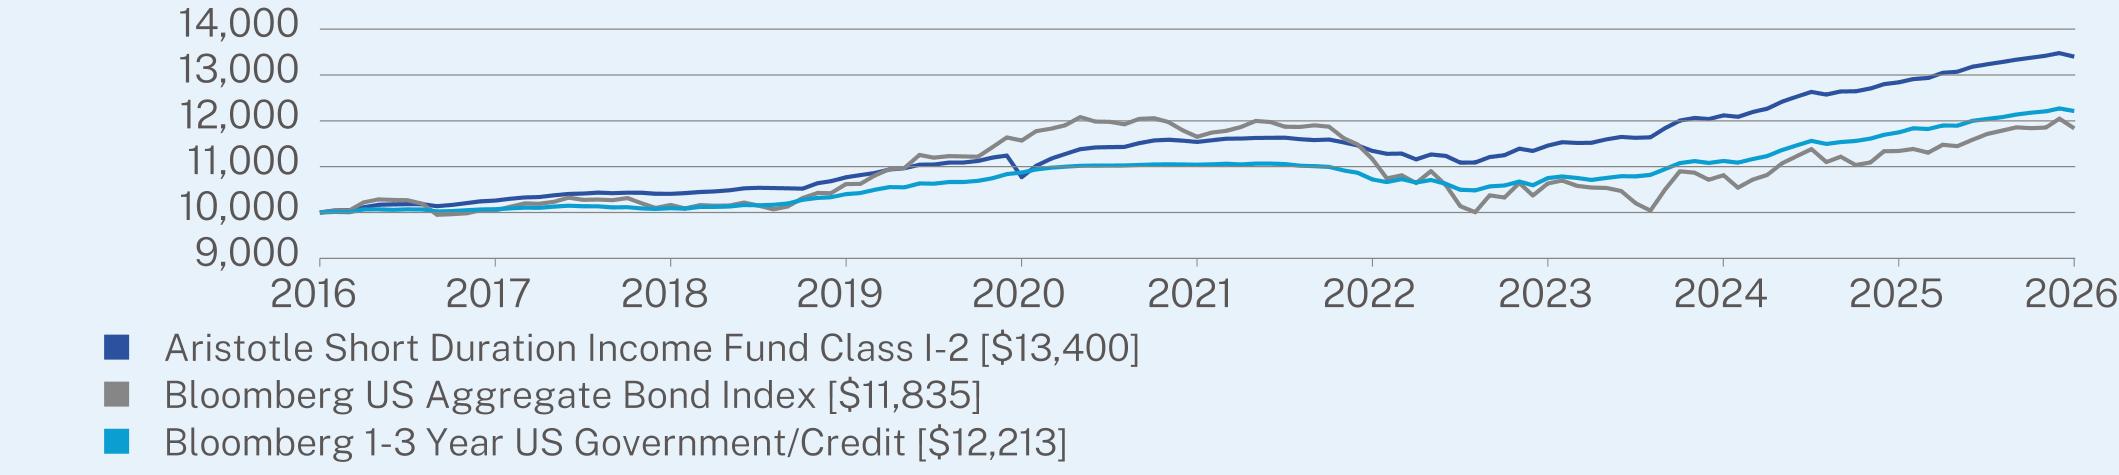
ANNUAL AVERAGE TOTAL RETURN (%)
|
|
1 Year
|
5 Year
|
10 Year
|
|
Class I-2 (without sales charge)
|
4.36
|
3.03
|
2.97
|
|
Bloomberg US Aggregate Bond Index
|
4.35
|
0.31
|
1.70
|
|
Bloomberg 1-3 Year US Government/Credit
|
3.96
|
2.04
|
2.02
|
Visit https://www.aristotlefunds.com/resources/prospectuses-reports for more recent performance information.
KEY FUND STATISTICS (as of March 31, 2026)
|
Net Assets
|
$999,441,552
|
|
Number of Holdings
|
320
|
|
Net Advisory Fee
|
$2,461,294
|
|
Portfolio Turnover Rate
|
86%
|
WHAT DID THE FUND INVEST IN? (as of March 31, 2026)*
|
Top 10 Issuers
|
(%)
|
|
United States Treasury Note/Bond
|
10.7%
|
|
JPMorgan Chase & Co.
|
2.6%
|
|
Morgan Stanley
|
2.2%
|
|
Wells Fargo & Co.
|
1.9%
|
|
Bank of America Corp.
|
1.8%
|
|
Goldman Sachs Group, Inc.
|
1.7%
|
|
Santander Consumer USA Holdings, Inc.
|
1.5%
|
|
Navient Student Loan Trust
|
1.1%
|
|
UBS AG
|
1.1%
|
|
Magnetite CLO Ltd.
|
1.0%
|
Sector Breakdown (%)

Changes to Fund’s Principal Risks:
In the Fund’s Principal Risks, Securities Lending Risk and Underlying Fund Risk were added.
Changes to the Fund’s Principal Investment Strategy:
The Fund’s Principal Investment Strategies were revised to note that the Fund may lend its portfolio securities to generate additional income.
This report describes changes to the Fund that occurred during the reporting period.
WHAT WERE THE FUND COSTS FOR THE PAST YEAR? (based on a hypothetical $10,000 investment)
|
Class Name
|
Costs of a $10,000 investment
|
Costs paid as a percentage of a $10,000 investment
|
|
Class A
|
$121
|
1.15%
|
HOW DID THE FUND PERFORM LAST YEAR AND WHAT AFFECTED ITS PERFORMANCE?
|
•
|
For the 12-month period ended March 31, 2026, the Fund underperformed its performance benchmark, the Russell 2000 Index. The Fund invests at least 80% of its assets in equity securities of small-capitalization companies.
|
|
•
|
U.S. small cap equities advanced over the past year, led by the Liberation Day rally from April through October of 2025, driven largely by optimism around artificial intelligence and expectations for further Federal Reserve rate easing. Ongoing uncertainty related to the administration’s trade policies, their implementation, the Iran conflict alongside broader geopolitical risks resulted in increased volatility throughout the year and weighed on market sentiment.
|
|
•
|
The majority of the Fund’s relative underperformance occurred during the Liberation Day rally, when the market rose 40%, driven largely by non-earning companies that increased over 80%, whereas the Fund’s focus on positive cash flow businesses, up approximately 34%, lagged in that environment. The underperformance was a function of what we did not own versus what we did own that hurt us.
|
|
•
|
Overall, security selection detracted while allocation was additive. Security selection within the healthcare—not owning biotechnology/pharmaceuticals accounted for half of the sector’s underperformance—and industrials sectors were the largest detractors to relative performance, while selections in communication services and utilities contributed.
|
|
•
|
On a relative basis, Advanced Energy Industries, Dycom Industries and an out-of-benchmark position in MACOM Technology Solutions were the largest contributors. In contrast, the largest detractors were Merit Medical Systems, ACI Worldwide, and an out-of-benchmark position in Chemed.
|
|
•
|
From a sector allocation standpoint, overweight allocations to industrials and information technology both added value, while an underweight position in energy and an overweight allocation in consumer staples detracted from relative performance.
|
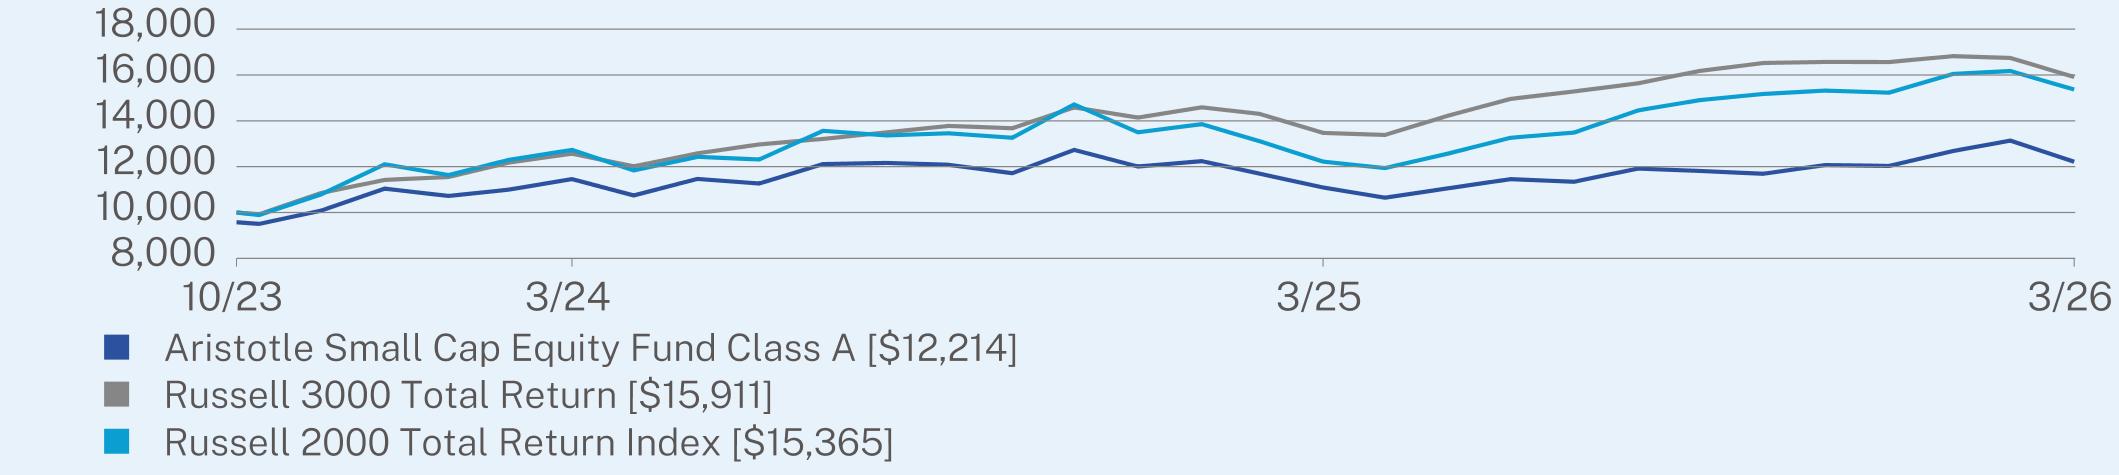
ANNUAL AVERAGE TOTAL RETURN (%)
|
|
1 Year
|
Since Inception
(10/20/2023) |
|
Class A (without sales charge)
|
10.13
|
10.46
|
|
Class A (with sales charge)
|
5.43
|
8.52
|
|
Russell 3000 Total Return
|
18.09
|
20.90
|
|
Russell 2000 Total Return Index
|
25.72
|
19.19
|
Visit https://www.aristotlefunds.com/resources/prospectuses-reports for more recent performance information.
KEY FUND STATISTICS (as of March 31, 2026)
|
Net Assets
|
$114,506,909
|
|
Number of Holdings
|
99
|
|
Net Advisory Fee
|
$879,160
|
|
Portfolio Turnover Rate
|
25%
|
WHAT DID THE FUND INVEST IN? (as of March 31, 2026)*
|
Top 10 Issuers
|
(%)
|
|
Advanced Energy Industries, Inc.
|
2.9%
|
|
MACOM Technology Solutions Holdings, Inc.
|
2.7%
|
|
HA Sustainable Infrastructure Capital, Inc.
|
2.3%
|
|
AerCap Holdings NV
|
2.2%
|
|
HealthEquity, Inc.
|
2.0%
|
|
Huron Consulting Group, Inc.
|
2.0%
|
|
Alamos Gold, Inc.
|
1.9%
|
|
Littelfuse, Inc.
|
1.8%
|
|
Mercury Systems, Inc.
|
1.7%
|
|
ACI Worldwide, Inc.
|
1.7%
|
Sector Breakdown (%)**

Changes to Fund’s Principal Risks:
In the Fund’s Principal Risks, Securities Lending Risk was added.
Changes to the Fund’s Principal Investment Strategy:
The Fund’s Principal Investment Strategies were revised to note that the Fund may lend its portfolio securities to generate additional income.
This report describes changes to the Fund that occurred during the reporting period.
WHAT WERE THE FUND COSTS FOR THE PAST YEAR? (based on a hypothetical $10,000 investment)
|
Class Name
|
Costs of a $10,000 investment
|
Costs paid as a percentage of a $10,000 investment
|
|
Class C
|
$199
|
1.90%
|
HOW DID THE FUND PERFORM LAST YEAR AND WHAT AFFECTED ITS PERFORMANCE?
|
•
|
For the 12-month period ended March 31, 2026, the Fund underperformed its performance benchmark, the Russell 2000 Index. The Fund invests at least 80% of its assets in equity securities of small-capitalization companies.
|
|
•
|
U.S. small cap equities advanced over the past year, led by the Liberation Day rally from April through October of 2025, driven largely by optimism around artificial intelligence and expectations for further Federal Reserve rate easing. Ongoing uncertainty related to the administration’s trade policies, their implementation, the Iran conflict alongside broader geopolitical risks resulted in increased volatility throughout the year and weighed on market sentiment.
|
|
•
|
The majority of the Fund’s relative underperformance occurred during the Liberation Day rally, when the market rose 40%, driven largely by non-earning companies that increased over 80%, whereas the Fund’s focus on positive cash flow businesses, up approximately 34%, lagged in that environment. The underperformance was a function of what we did not own versus what we did own that hurt us.
|
|
•
|
Overall, security selection detracted while allocation was additive. Security selection within the healthcare—not owning biotechnology/pharmaceuticals accounted for half of the sector’s underperformance—and industrials sectors were the largest detractors to relative performance, while selections in communication services and utilities contributed.
|
|
•
|
On a relative basis, Advanced Energy Industries, Dycom Industries and an out-of-benchmark position in MACOM Technology Solutions were the largest contributors. In contrast, the largest detractors were Merit Medical Systems, ACI Worldwide, and an out-of-benchmark position in Chemed.
|
|
•
|
From a sector allocation standpoint, overweight allocations to industrials and information technology both added value, while an underweight position in energy and an overweight allocation in consumer staples detracted from relative performance.
|
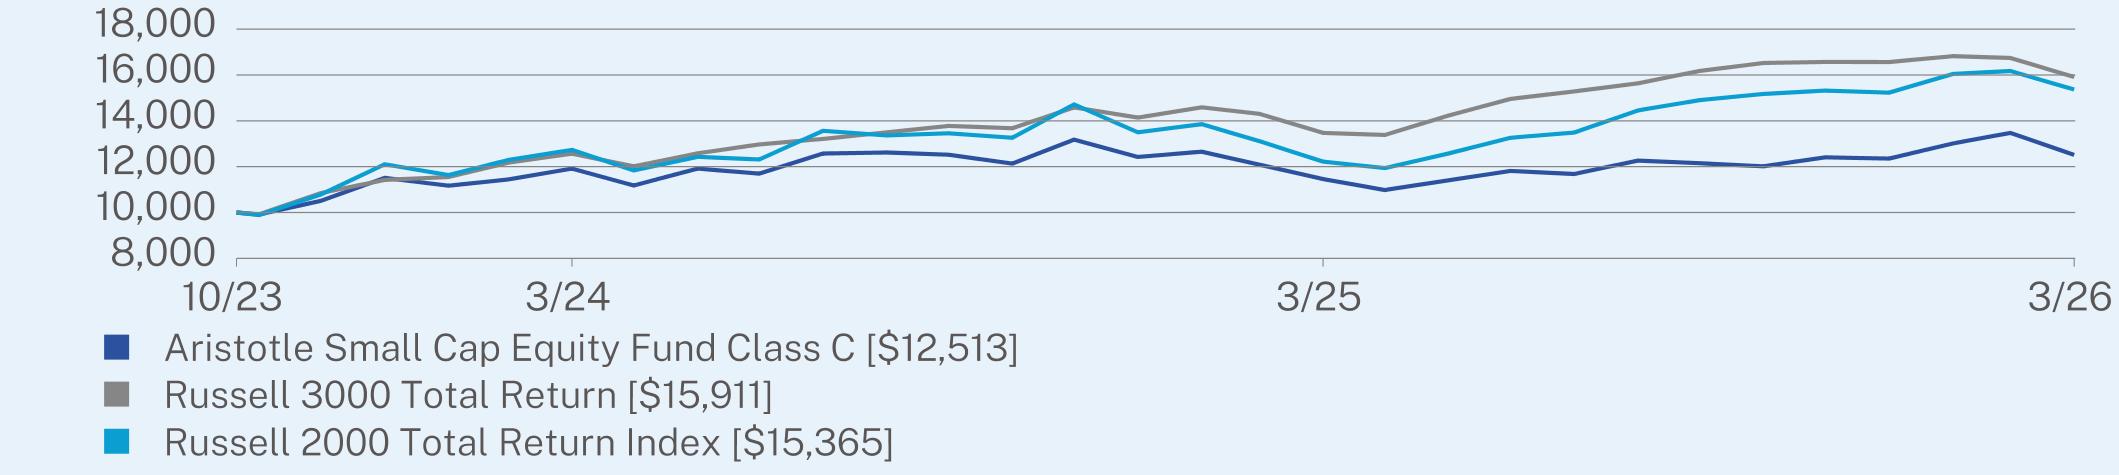
ANNUAL AVERAGE TOTAL RETURN (%)
|
|
1 Year
|
Since Inception
(10/20/2023) |
|
Class C (without sales charge)
|
9.20
|
9.60
|
|
Class C (with sales charge)
|
8.20
|
9.60
|
|
Russell 3000 Total Return
|
18.09
|
20.90
|
|
Russell 2000 Total Return Index
|
25.72
|
19.19
|
Visit https://www.aristotlefunds.com/resources/prospectuses-reports for more recent performance information.
KEY FUND STATISTICS (as of March 31, 2026)
|
Net Assets
|
$114,506,909
|
|
Number of Holdings
|
99
|
|
Net Advisory Fee
|
$879,160
|
|
Portfolio Turnover Rate
|
25%
|
WHAT DID THE FUND INVEST IN? (as of March 31, 2026)*
|
Top 10 Issuers
|
(%)
|
|
Advanced Energy Industries, Inc.
|
2.9%
|
|
MACOM Technology Solutions Holdings, Inc.
|
2.7%
|
|
HA Sustainable Infrastructure Capital, Inc.
|
2.3%
|
|
AerCap Holdings NV
|
2.2%
|
|
HealthEquity, Inc.
|
2.0%
|
|
Huron Consulting Group, Inc.
|
2.0%
|
|
Alamos Gold, Inc.
|
1.9%
|
|
Littelfuse, Inc.
|
1.8%
|
|
Mercury Systems, Inc.
|
1.7%
|
|
ACI Worldwide, Inc.
|
1.7%
|
Sector Breakdown (%)**

Changes to Fund’s Principal Risks:
In the Fund’s Principal Risks, Securities Lending Risk was added.
Changes to the Fund’s Principal Investment Strategy:
The Fund’s Principal Investment Strategies were revised to note that the Fund may lend its portfolio securities to generate additional income.
This report describes changes to the Fund that occurred during the reporting period.
WHAT WERE THE FUND COSTS FOR THE PAST YEAR? (based on a hypothetical $10,000 investment)
|
Class Name
|
Costs of a $10,000 investment
|
Costs paid as a percentage of a $10,000 investment
|
|
Class I
|
$95
|
0.90%
|
HOW DID THE FUND PERFORM LAST YEAR AND WHAT AFFECTED ITS PERFORMANCE?
|
•
|
For the 12-month period ended March 31, 2026, the Fund underperformed its performance benchmark, the Russell 2000 Index. The Fund invests at least 80% of its assets in equity securities of small-capitalization companies.
|
|
•
|
U.S. small cap equities advanced over the past year, led by the Liberation Day rally from April through October of 2025, driven largely by optimism around artificial intelligence and expectations for further Federal Reserve rate easing. Ongoing uncertainty related to the administration’s trade policies, their implementation, the Iran conflict alongside broader geopolitical risks resulted in increased volatility throughout the year and weighed on market sentiment.
|
|
•
|
The majority of the Fund’s relative underperformance occurred during the Liberation Day rally, when the market rose 40%, driven largely by non-earning companies that increased over 80%, whereas the Fund’s focus on positive cash flow businesses, up approximately 34%, lagged in that environment. The underperformance was a function of what we did not own versus what we did own that hurt us.
|
|
•
|
Overall, security selection detracted while allocation was additive. Security selection within the healthcare—not owning biotechnology/pharmaceuticals accounted for half of the sector’s underperformance—and industrials sectors were the largest detractors to relative performance, while selections in communication services and utilities contributed.
|
|
•
|
On a relative basis, Advanced Energy Industries, Dycom Industries and an out-of-benchmark position in MACOM Technology Solutions were the largest contributors. In contrast, the largest detractors were Merit Medical Systems, ACI Worldwide, and an out-of-benchmark position in Chemed.
|
|
•
|
From a sector allocation standpoint, overweight allocations to industrials and information technology both added value, while an underweight position in energy and an overweight allocation in consumer staples detracted from relative performance.
|
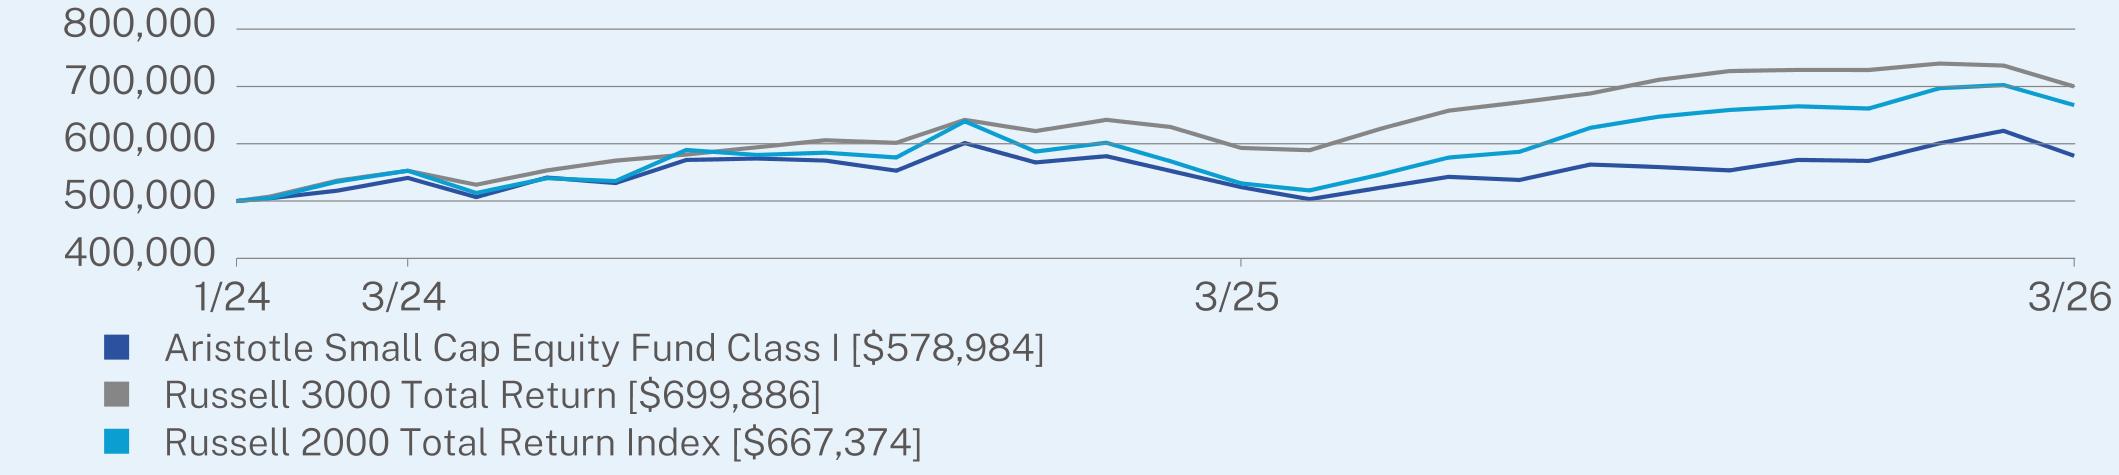
ANNUAL AVERAGE TOTAL RETURN (%)
|
|
1 Year
|
Since Inception
(01/16/2024) |
|
Class I (without sales charge)
|
10.43
|
6.88
|
|
Russell 3000 Total Return
|
18.09
|
16.47
|
|
Russell 2000 Total Return Index
|
25.72
|
13.99
|
Visit https://www.aristotlefunds.com/resources/prospectuses-reports for more recent performance information.
KEY FUND STATISTICS (as of March 31, 2026)
|
Net Assets
|
$114,506,909
|
|
Number of Holdings
|
99
|
|
Net Advisory Fee
|
$879,160
|
|
Portfolio Turnover Rate
|
25%
|
WHAT DID THE FUND INVEST IN? (as of March 31, 2026)*
|
Top 10 Issuers
|
(%)
|
|
Advanced Energy Industries, Inc.
|
2.9%
|
|
MACOM Technology Solutions Holdings, Inc.
|
2.7%
|
|
HA Sustainable Infrastructure Capital, Inc.
|
2.3%
|
|
AerCap Holdings NV
|
2.2%
|
|
HealthEquity, Inc.
|
2.0%
|
|
Huron Consulting Group, Inc.
|
2.0%
|
|
Alamos Gold, Inc.
|
1.9%
|
|
Littelfuse, Inc.
|
1.8%
|
|
Mercury Systems, Inc.
|
1.7%
|
|
ACI Worldwide, Inc.
|
1.7%
|
Sector Breakdown (%)**

Changes to Fund’s Principal Risks:
In the Fund’s Principal Risks, Securities Lending Risk was added.
Changes to the Fund’s Principal Investment Strategy:
The Fund’s Principal Investment Strategies were revised to note that the Fund may lend its portfolio securities to generate additional income.
This report describes changes to the Fund that occurred during the reporting period.
WHAT WERE THE FUND COSTS FOR THE PAST YEAR? (based on a hypothetical $10,000 investment)
|
Class Name
|
Costs of a $10,000 investment
|
Costs paid as a percentage of a $10,000 investment
|
|
Class I-2
|
$95
|
0.90%
|
HOW DID THE FUND PERFORM LAST YEAR AND WHAT AFFECTED ITS PERFORMANCE?
|
•
|
For the 12-month period ended March 31, 2026, the Fund underperformed its performance benchmark, the Russell 2000 Index. The Fund invests at least 80% of its assets in equity securities of small-capitalization companies.
|
|
•
|
U.S. small cap equities advanced over the past year, led by the Liberation Day rally from April through October of 2025, driven largely by optimism around artificial intelligence and expectations for further Federal Reserve rate easing. Ongoing uncertainty related to the administration’s trade policies, their implementation, the Iran conflict alongside broader geopolitical risks resulted in increased volatility throughout the year and weighed on market sentiment.
|
|
•
|
The majority of the Fund’s relative underperformance occurred during the Liberation Day rally, when the market rose 40%, driven largely by non-earning companies that increased over 80%, whereas the Fund’s focus on positive cash flow businesses, up approximately 34%, lagged in that environment. The underperformance was a function of what we did not own versus what we did own that hurt us.
|
|
•
|
Overall, security selection detracted while allocation was additive. Security selection within the healthcare—not owning biotechnology/pharmaceuticals accounted for half of the sector’s underperformance—and industrials sectors were the largest detractors to relative performance, while selections in communication services and utilities contributed.
|
|
•
|
On a relative basis, Advanced Energy Industries, Dycom Industries and an out-of-benchmark position in MACOM Technology Solutions were the largest contributors. In contrast, the largest detractors were Merit Medical Systems, ACI Worldwide, and an out-of-benchmark position in Chemed.
|
|
•
|
From a sector allocation standpoint, overweight allocations to industrials and information technology both added value, while an underweight position in energy and an overweight allocation in consumer staples detracted from relative performance.
|
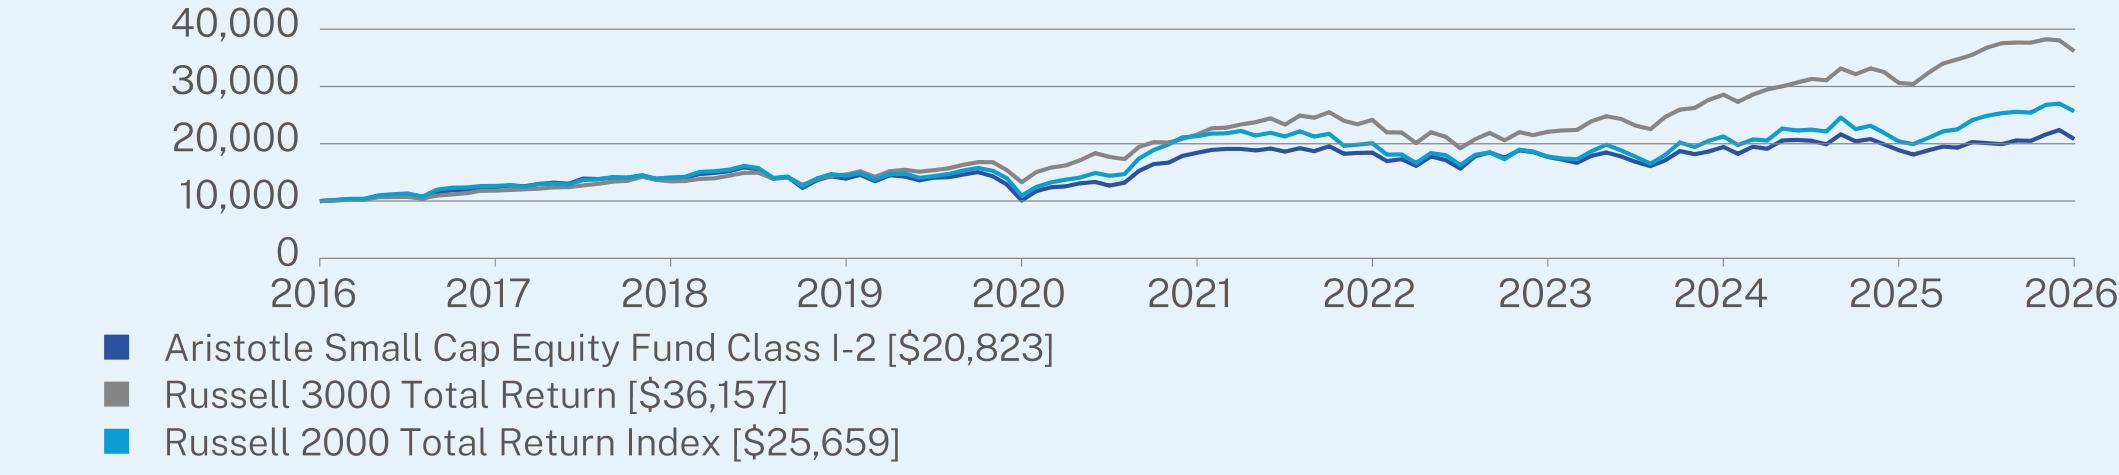
ANNUAL AVERAGE TOTAL RETURN (%)
|
|
1 Year
|
5 Year
|
10 Year
|
|
Class I-2 (without sales charge)
|
10.32
|
2.48
|
7.61
|
|
Russell 3000 Total Return
|
18.09
|
10.87
|
13.72
|
|
Russell 2000 Total Return Index
|
25.72
|
3.77
|
9.88
|
Visit https://www.aristotlefunds.com/resources/prospectuses-reports for more recent performance information.
KEY FUND STATISTICS (as of March 31, 2026)
|
Net Assets
|
$114,506,909
|
|
Number of Holdings
|
99
|
|
Net Advisory Fee
|
$879,160
|
|
Portfolio Turnover Rate
|
25%
|
WHAT DID THE FUND INVEST IN? (as of March 31, 2026)*
|
Top 10 Issuers
|
(%)
|
|
Advanced Energy Industries, Inc.
|
2.9%
|
|
MACOM Technology Solutions Holdings, Inc.
|
2.7%
|
|
HA Sustainable Infrastructure Capital, Inc.
|
2.3%
|
|
AerCap Holdings NV
|
2.2%
|
|
HealthEquity, Inc.
|
2.0%
|
|
Huron Consulting Group, Inc.
|
2.0%
|
|
Alamos Gold, Inc.
|
1.9%
|
|
Littelfuse, Inc.
|
1.8%
|
|
Mercury Systems, Inc.
|
1.7%
|
|
ACI Worldwide, Inc.
|
1.7%
|
Sector Breakdown (%)**

Changes to Fund’s Principal Risks:
In the Fund’s Principal Risks, Securities Lending Risk was added.
Changes to the Fund’s Principal Investment Strategy:
The Fund’s Principal Investment Strategies were revised to note that the Fund may lend its portfolio securities to generate additional income.
This report describes changes to the Fund that occurred during the reporting period.
WHAT WERE THE FUND COSTS FOR THE PAST YEAR? (based on a hypothetical $10,000 investment)
|
Class Name
|
Costs of a $10,000 investment
|
Costs paid as a percentage of a $10,000 investment
|
|
Class R6
|
$89
|
0.85%
|
HOW DID THE FUND PERFORM LAST YEAR AND WHAT AFFECTED ITS PERFORMANCE?
|
•
|
For the 12-month period ended March 31, 2026, the Fund underperformed its performance benchmark, the Russell 2000 Index. The Fund invests at least 80% of its assets in equity securities of small-capitalization companies.
|
|
•
|
U.S. small cap equities advanced over the past year, led by the Liberation Day rally from April through October of 2025, driven largely by optimism around artificial intelligence and expectations for further Federal Reserve rate easing. Ongoing uncertainty related to the administration’s trade policies, their implementation, the Iran conflict alongside broader geopolitical risks resulted in increased volatility throughout the year and weighed on market sentiment.
|
|
•
|
The majority of the Fund’s relative underperformance occurred during the Liberation Day rally, when the market rose 40%, driven largely by non-earning companies that increased over 80%, whereas the Fund’s focus on positive cash flow businesses, up approximately 34%, lagged in that environment. The underperformance was a function of what we did not own versus what we did own that hurt us.
|
|
•
|
Overall, security selection detracted while allocation was additive. Security selection within the healthcare—not owning biotechnology/pharmaceuticals accounted for half of the sector’s underperformance—and industrials sectors were the largest detractors to relative performance, while selections in communication services and utilities contributed.
|
|
•
|
On a relative basis, Advanced Energy Industries, Dycom Industries and an out-of-benchmark position in MACOM Technology Solutions were the largest contributors. In contrast, the largest detractors were Merit Medical Systems, ACI Worldwide, and an out-of-benchmark position in Chemed.
|
|
•
|
From a sector allocation standpoint, overweight allocations to industrials and information technology both added value, while an underweight position in energy and an overweight allocation in consumer staples detracted from relative performance.
|
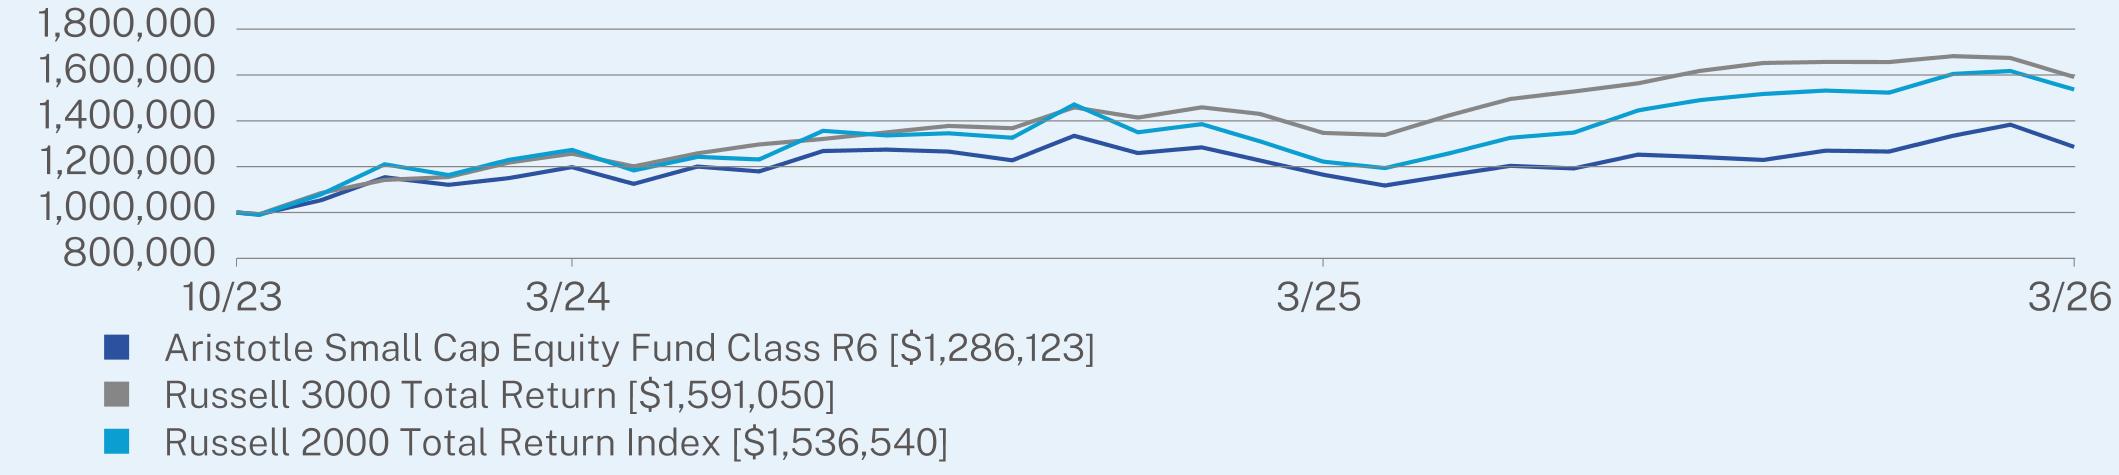
ANNUAL AVERAGE TOTAL RETURN (%)
|
|
1 Year
|
Since Inception
(10/20/2023) |
|
Class R6 (without sales charge)
|
10.40
|
10.83
|
|
Russell 3000 Total Return
|
18.09
|
20.90
|
|
Russell 2000 Total Return Index
|
25.72
|
19.19
|
Visit https://www.aristotlefunds.com/resources/prospectuses-reports for more recent performance information.
KEY FUND STATISTICS (as of March 31, 2026)
|
Net Assets
|
$114,506,909
|
|
Number of Holdings
|
99
|
|
Net Advisory Fee
|
$879,160
|
|
Portfolio Turnover Rate
|
25%
|
WHAT DID THE FUND INVEST IN? (as of March 31, 2026)*
|
Top 10 Issuers
|
(%)
|
|
Advanced Energy Industries, Inc.
|
2.9%
|
|
MACOM Technology Solutions Holdings, Inc.
|
2.7%
|
|
HA Sustainable Infrastructure Capital, Inc.
|
2.3%
|
|
AerCap Holdings NV
|
2.2%
|
|
HealthEquity, Inc.
|
2.0%
|
|
Huron Consulting Group, Inc.
|
2.0%
|
|
Alamos Gold, Inc.
|
1.9%
|
|
Littelfuse, Inc.
|
1.8%
|
|
Mercury Systems, Inc.
|
1.7%
|
|
ACI Worldwide, Inc.
|
1.7%
|
Sector Breakdown (%)**

Changes to Fund’s Principal Risks:
In the Fund’s Principal Risks, Securities Lending Risk was added.
Changes to the Fund’s Principal Investment Strategy:
The Fund’s Principal Investment Strategies were revised to note that the Fund may lend its portfolio securities to generate additional income.
This report describes changes to the Fund that occurred during the reporting period.
WHAT WERE THE FUND COSTS FOR THE PAST YEAR? (based on a hypothetical $10,000 investment)
|
Class Name
|
Costs of a $10,000 investment
|
Costs paid as a percentage of a $10,000 investment
|
|
Class A
|
$124
|
1.16%
|
HOW DID THE FUND PERFORM LAST YEAR AND WHAT AFFECTED ITS PERFORMANCE?
|
•
|
For the 12-month period ended March 31, 2026, the Fund underperformed its performance benchmark, the Russell 2500 Index. The Fund invests at least 80% of its assets in equity securities of small-capitalization and mid-capitalization companies.
|
|
•
|
U.S. small cap and mid cap equities advanced over the past year, led by the Liberation Day rally from April through October of 2025, driven largely by optimism around artificial intelligence and expectations for further Federal Reserve rate easing. Ongoing uncertainty related to the administration’s trade policies, their implementation, the Iran conflict alongside broader geopolitical risks resulted in increased volatility throughout the year and weighed on market sentiment.
|
|
•
|
The majority of the Fund’s relative underperformance occurred during the Liberation Day rally, when the market rose 40%, driven largely by non-earning companies that increased over 80%, whereas the Fund’s focus on positive cash flow businesses, up approximately 34%, lagged in that environment. The underperformance was a function of what we did not own versus what we did own that hurt us.
|
|
•
|
Overall, security selection detracted while allocation was additive. Security selection within the healthcare—not owning biotechnology/pharmaceuticals accounted for half of the sector’s underperformance—and industrials sectors were the largest detractors to relative performance, while selections in information technology and communication services contributed.
|
|
•
|
On a relative basis, Ciena, Advanced Energy Industries, and Dycom Industries were the largest contributors. In contrast, the largest detractors were not owning SanDisk alongside owning Merit Medical Systems and Chemed.
|
|
•
|
From a sector allocation standpoint, an overweight allocation to information technology and an underweight position in real estate positively contributed, while an overweight allocation to energy and an underweight position to utilities detracted from relative performance.
|
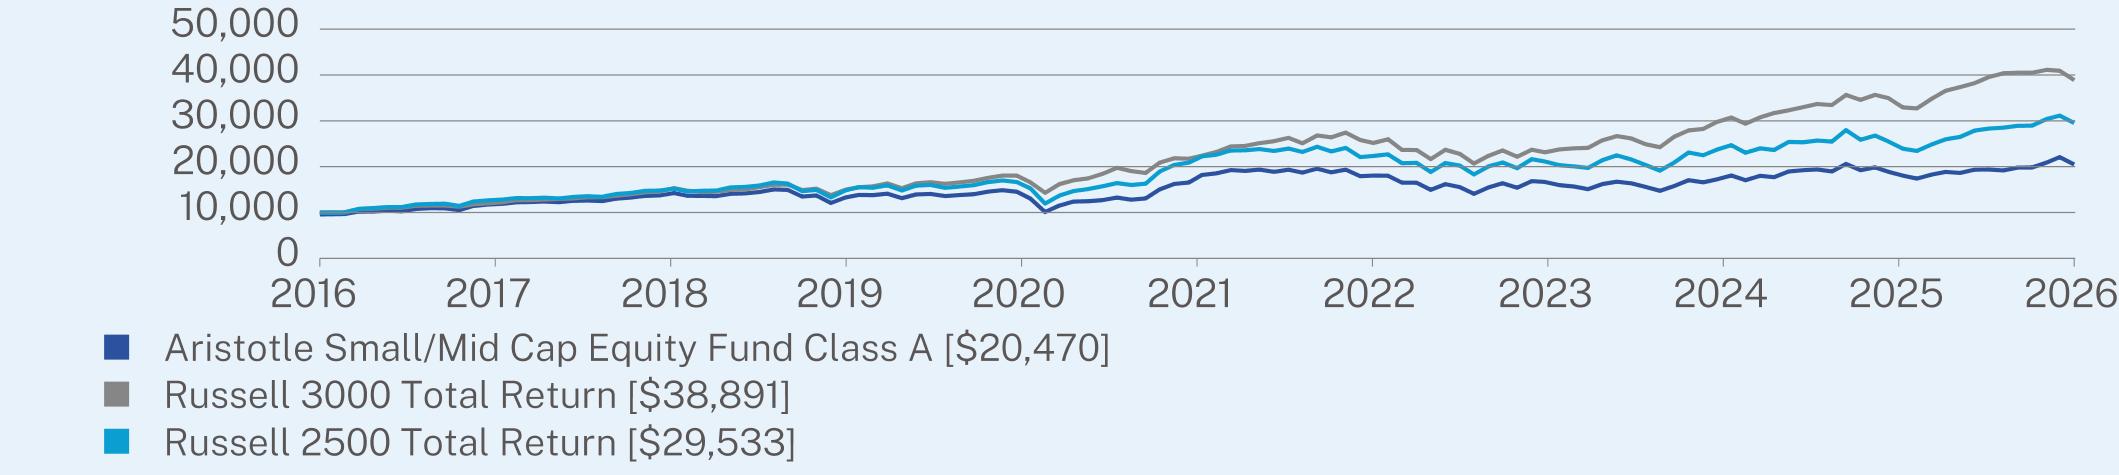
ANNUAL AVERAGE TOTAL RETURN (%)
|
|
1 Year
|
5 Year
|
10 Year
|
|
Class A (without sales charge)
|
13.46
|
1.99
|
7.22
|
|
Class A (with sales charge)
|
8.60
|
1.10
|
6.76
|
|
Russell 3000 Total Return
|
18.09
|
10.87
|
13.72
|
|
Russell 2500 Total Return
|
23.45
|
5.48
|
10.58
|
Visit https://www.aristotlefunds.com/resources/prospectuses-reports for more recent performance information.
KEY FUND STATISTICS (as of March 31, 2026)
|
Net Assets
|
$21,852,691
|
|
Number of Holdings
|
101
|
|
Net Advisory Fee
|
$175,860
|
|
Portfolio Turnover Rate
|
26%
|
WHAT DID THE FUND INVEST IN? (as of March 31, 2026)*
|
Top 10 Issuers
|
(%)
|
|
Advanced Energy Industries, Inc.
|
2.9%
|
|
MACOM Technology Solutions Holdings, Inc.
|
2.7%
|
|
Alamos Gold, Inc.
|
2.7%
|
|
Permian Resources Corp.
|
2.4%
|
|
HA Sustainable Infrastructure Capital, Inc.
|
2.3%
|
|
Range Resources Corp.
|
2.2%
|
|
AerCap Holdings NV
|
2.0%
|
|
BankUnited, Inc.
|
1.8%
|
|
FTAI Aviation Ltd.
|
1.8%
|
|
HealthEquity, Inc.
|
1.8%
|
Sector Breakdown (%)**
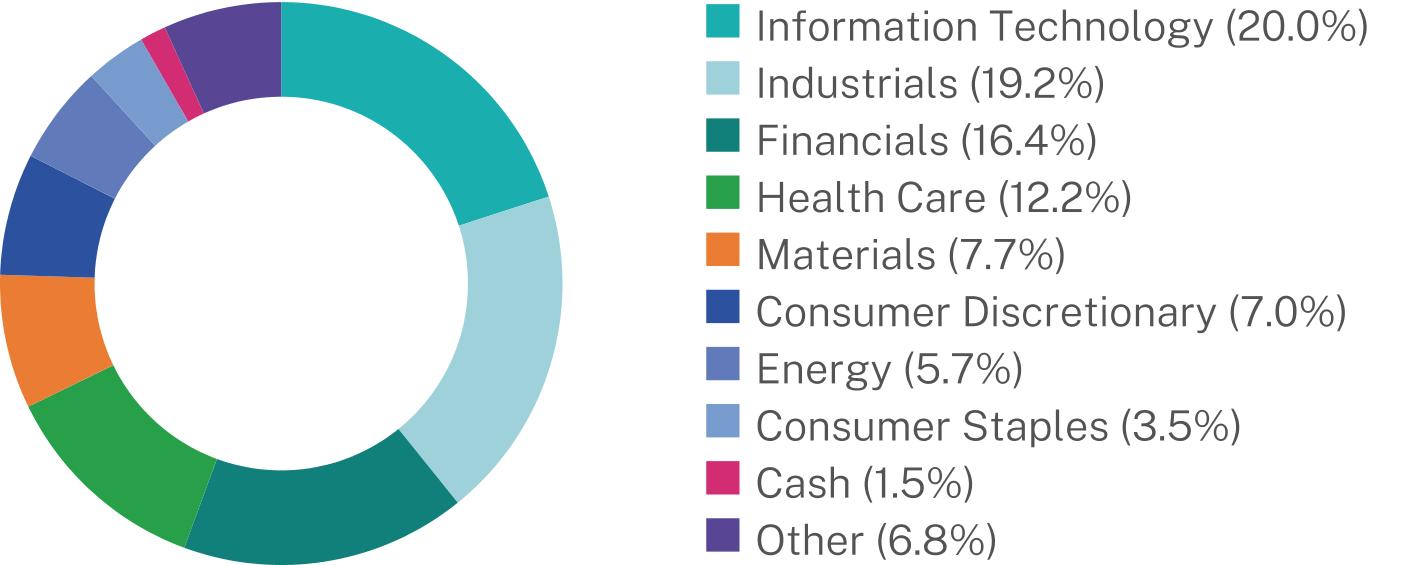
Changes to Fund’s Principal Risks:
In the Fund’s Principal Risks, Securities Lending Risk was added.
Changes to the Fund’s Principal Investment Strategy:
The Fund’s Principal Investment Strategies were revised to note that the Fund may lend its portfolio securities to generate additional income.
This report describes changes to the Fund that occurred during the reporting period.
WHAT WERE THE FUND COSTS FOR THE PAST YEAR? (based on a hypothetical $10,000 investment)
|
Class Name
|
Costs of a $10,000 investment
|
Costs paid as a percentage of a $10,000 investment
|
|
Class C
|
$203
|
1.91%
|
HOW DID THE FUND PERFORM LAST YEAR AND WHAT AFFECTED ITS PERFORMANCE?
|
•
|
For the 12-month period ended March 31, 2026, the Fund underperformed its performance benchmark, the Russell 2500 Index. The Fund invests at least 80% of its assets in equity securities of small-capitalization and mid-capitalization companies.
|
|
•
|
U.S. small cap and mid cap equities advanced over the past year, led by the Liberation Day rally from April through October of 2025, driven largely by optimism around artificial intelligence and expectations for further Federal Reserve rate easing. Ongoing uncertainty related to the administration’s trade policies, their implementation, the Iran conflict alongside broader geopolitical risks resulted in increased volatility throughout the year and weighed on market sentiment.
|
|
•
|
The majority of the Fund’s relative underperformance occurred during the Liberation Day rally, when the market rose 40%, driven largely by non-earning companies that increased over 80%, whereas the Fund’s focus on positive cash flow businesses, up approximately 34%, lagged in that environment. The underperformance was a function of what we did not own versus what we did own that hurt us.
|
|
•
|
Overall, security selection detracted while allocation was additive. Security selection within the healthcare—not owning biotechnology/pharmaceuticals accounted for half of the sector’s underperformance—and industrials sectors were the largest detractors to relative performance, while selections in information technology and communication services contributed.
|
|
•
|
On a relative basis, Ciena, Advanced Energy Industries, and Dycom Industries were the largest contributors. In contrast, the largest detractors were not owning SanDisk alongside owning Merit Medical Systems and Chemed.
|
|
•
|
From a sector allocation standpoint, an overweight allocation to information technology and an underweight position in real estate positively contributed, while an overweight allocation to energy and an underweight position to utilities detracted from relative performance.
|
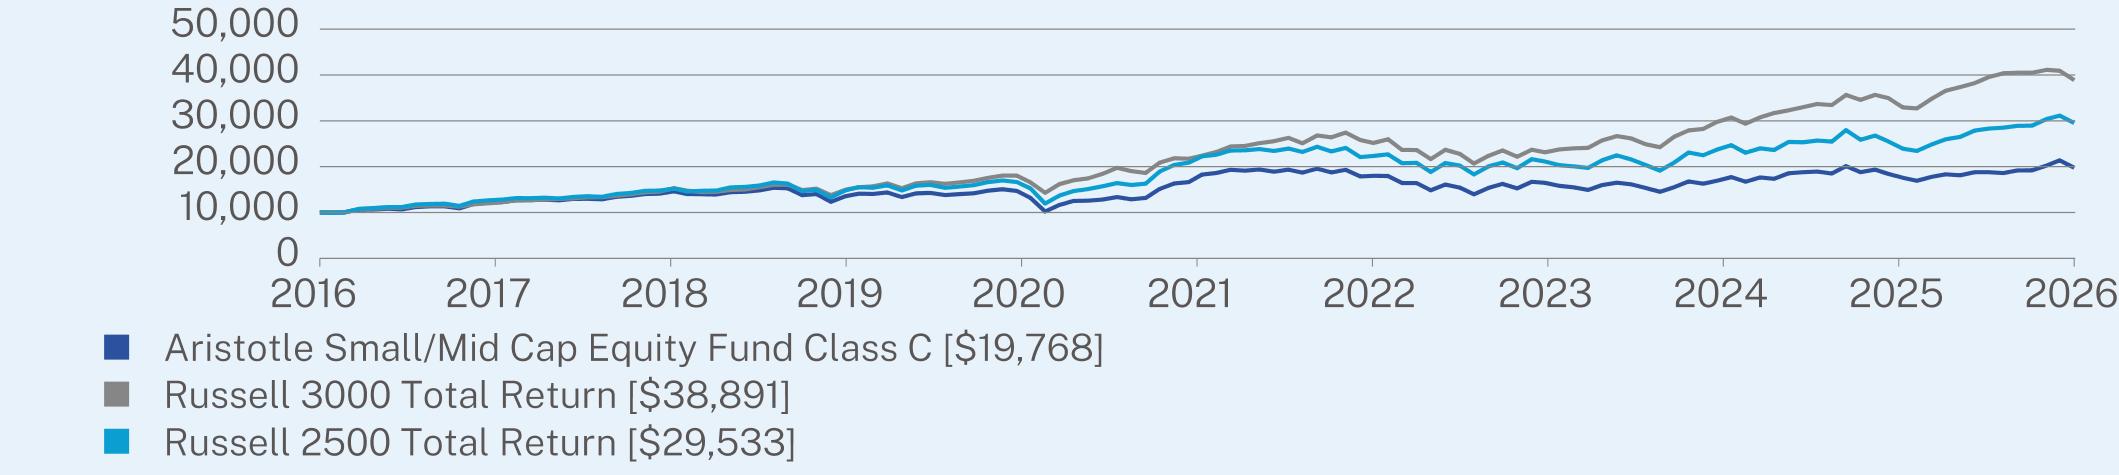
ANNUAL AVERAGE TOTAL RETURN (%)
|
|
1 Year
|
5 Year
|
10 Year
|
|
Class C (without sales charge)
|
12.42
|
1.20
|
6.41
|
|
Class C (with sales charge)
|
11.51
|
1.20
|
6.41
|
|
Russell 3000 Total Return
|
18.09
|
10.87
|
13.72
|
|
Russell 2500 Total Return
|
23.45
|
5.48
|
10.58
|
Visit https://www.aristotlefunds.com/resources/prospectuses-reports for more recent performance information.
KEY FUND STATISTICS (as of March 31, 2026)
|
Net Assets
|
$21,852,691
|
|
Number of Holdings
|
101
|
|
Net Advisory Fee
|
$175,860
|
|
Portfolio Turnover Rate
|
26%
|
WHAT DID THE FUND INVEST IN? (as of March 31, 2026)*
|
Top 10 Issuers
|
(%)
|
|
Advanced Energy Industries, Inc.
|
2.9%
|
|
MACOM Technology Solutions Holdings, Inc.
|
2.7%
|
|
Alamos Gold, Inc.
|
2.7%
|
|
Permian Resources Corp.
|
2.4%
|
|
HA Sustainable Infrastructure Capital, Inc.
|
2.3%
|
|
Range Resources Corp.
|
2.2%
|
|
AerCap Holdings NV
|
2.0%
|
|
BankUnited, Inc.
|
1.8%
|
|
FTAI Aviation Ltd.
|
1.8%
|
|
HealthEquity, Inc.
|
1.8%
|
Sector Breakdown (%)**

Changes to Fund’s Principal Risks:
In the Fund’s Principal Risks, Securities Lending Risk was added.
Changes to the Fund’s Principal Investment Strategy:
The Fund’s Principal Investment Strategies were revised to note that the Fund may lend its portfolio securities to generate additional income.
This report describes changes to the Fund that occurred during the reporting period.
WHAT WERE THE FUND COSTS FOR THE PAST YEAR? (based on a hypothetical $10,000 investment)
|
Class Name
|
Costs of a $10,000 investment
|
Costs paid as a percentage of a $10,000 investment
|
|
Class I
|
$92
|
0.86%
|
HOW DID THE FUND PERFORM LAST YEAR AND WHAT AFFECTED ITS PERFORMANCE?
|
•
|
For the 12-month period ended March 31, 2026, the Fund underperformed its performance benchmark, the Russell 2500 Index. The Fund invests at least 80% of its assets in equity securities of small-capitalization and mid-capitalization companies.
|
|
•
|
U.S. small cap and mid cap equities advanced over the past year, led by the Liberation Day rally from April through October of 2025, driven largely by optimism around artificial intelligence and expectations for further Federal Reserve rate easing. Ongoing uncertainty related to the administration’s trade policies, their implementation, the Iran conflict alongside broader geopolitical risks resulted in increased volatility throughout the year and weighed on market sentiment.
|
|
•
|
The majority of the Fund’s relative underperformance occurred during the Liberation Day rally, when the market rose 40%, driven largely by non-earning companies that increased over 80%, whereas the Fund’s focus on positive cash flow businesses, up approximately 34%, lagged in that environment. The underperformance was a function of what we did not own versus what we did own that hurt us.
|
|
•
|
Overall, security selection detracted while allocation was additive. Security selection within the healthcare—not owning biotechnology/pharmaceuticals accounted for half of the sector’s underperformance—and industrials sectors were the largest detractors to relative performance, while selections in information technology and communication services contributed.
|
|
•
|
On a relative basis, Ciena, Advanced Energy Industries, and Dycom Industries were the largest contributors. In contrast, the largest detractors were not owning SanDisk alongside owning Merit Medical Systems and Chemed.
|
|
•
|
From a sector allocation standpoint, an overweight allocation to information technology and an underweight position in real estate positively contributed, while an overweight allocation to energy and an underweight position to utilities detracted from relative performance.
|
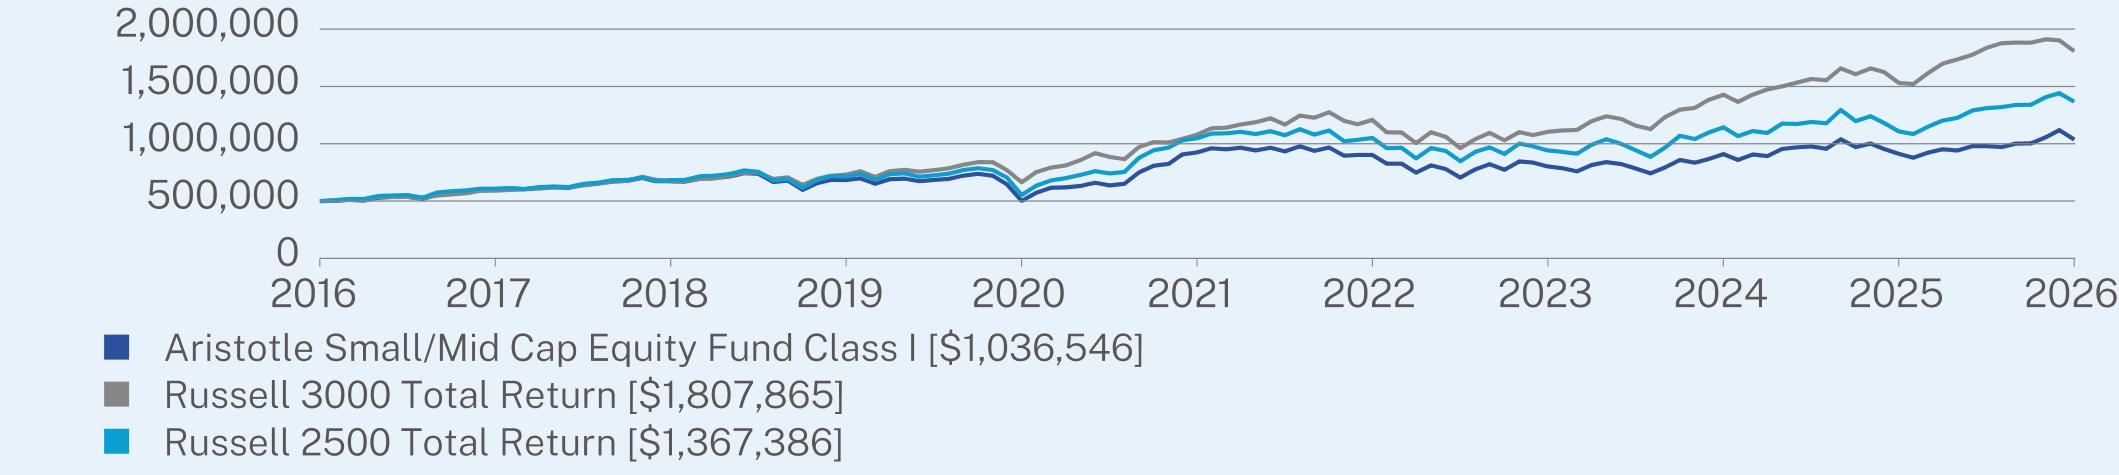
ANNUAL AVERAGE TOTAL RETURN (%)
|
|
1 Year
|
5 Year
|
10 Year
|
|
Class I (without sales charge)
|
13.73
|
2.31
|
7.56
|
|
Russell 3000 Total Return
|
18.09
|
10.87
|
13.72
|
|
Russell 2500 Total Return
|
23.45
|
5.48
|
10.58
|
Visit https://www.aristotlefunds.com/resources/prospectuses-reports for more recent performance information.
KEY FUND STATISTICS (as of March 31, 2026)
|
Net Assets
|
$21,852,691
|
|
Number of Holdings
|
101
|
|
Net Advisory Fee
|
$175,860
|
|
Portfolio Turnover Rate
|
26%
|
WHAT DID THE FUND INVEST IN? (as of March 31, 2026)*
|
Top 10 Issuers
|
(%)
|
|
Advanced Energy Industries, Inc.
|
2.9%
|
|
MACOM Technology Solutions Holdings, Inc.
|
2.7%
|
|
Alamos Gold, Inc.
|
2.7%
|
|
Permian Resources Corp.
|
2.4%
|
|
HA Sustainable Infrastructure Capital, Inc.
|
2.3%
|
|
Range Resources Corp.
|
2.2%
|
|
AerCap Holdings NV
|
2.0%
|
|
BankUnited, Inc.
|
1.8%
|
|
FTAI Aviation Ltd.
|
1.8%
|
|
HealthEquity, Inc.
|
1.8%
|
Sector Breakdown (%)**

Changes to Fund’s Principal Risks:
In the Fund’s Principal Risks, Securities Lending Risk was added.
Changes to the Fund’s Principal Investment Strategy:
The Fund’s Principal Investment Strategies were revised to note that the Fund may lend its portfolio securities to generate additional income.
This report describes changes to the Fund that occurred during the reporting period.
WHAT WERE THE FUND COSTS FOR THE PAST YEAR? (based on a hypothetical $10,000 investment)
|
Class Name
|
Costs of a $10,000 investment
|
Costs paid as a percentage of a $10,000 investment
|
|
Class I-2
|
$97
|
0.91%
|
HOW DID THE FUND PERFORM LAST YEAR AND WHAT AFFECTED ITS PERFORMANCE?
|
•
|
For the 12-month period ended March 31, 2026, the Fund underperformed its performance benchmark, the Russell 2500 Index. The Fund invests at least 80% of its assets in equity securities of small-capitalization and mid-capitalization companies.
|
|
•
|
U.S. small cap and mid cap equities advanced over the past year, led by the Liberation Day rally from April through October of 2025, driven largely by optimism around artificial intelligence and expectations for further Federal Reserve rate easing. Ongoing uncertainty related to the administration’s trade policies, their implementation, the Iran conflict alongside broader geopolitical risks resulted in increased volatility throughout the year and weighed on market sentiment.
|
|
•
|
The majority of the Fund’s relative underperformance occurred during the Liberation Day rally, when the market rose 40%, driven largely by non-earning companies that increased over 80%, whereas the Fund’s focus on positive cash flow businesses, up approximately 34%, lagged in that environment. The underperformance was a function of what we did not own versus what we did own that hurt us.
|
|
•
|
Overall, security selection detracted while allocation was additive. Security selection within the healthcare—not owning biotechnology/pharmaceuticals accounted for half of the sector’s underperformance—and industrials sectors were the largest detractors to relative performance, while selections in information technology and communication services contributed.
|
|
•
|
On a relative basis, Ciena, Advanced Energy Industries, and Dycom Industries were the largest contributors. In contrast, the largest detractors were not owning SanDisk alongside owning Merit Medical Systems and Chemed.
|
|
•
|
From a sector allocation standpoint, an overweight allocation to information technology and an underweight position in real estate positively contributed, while an overweight allocation to energy and an underweight position to utilities detracted from relative performance.
|
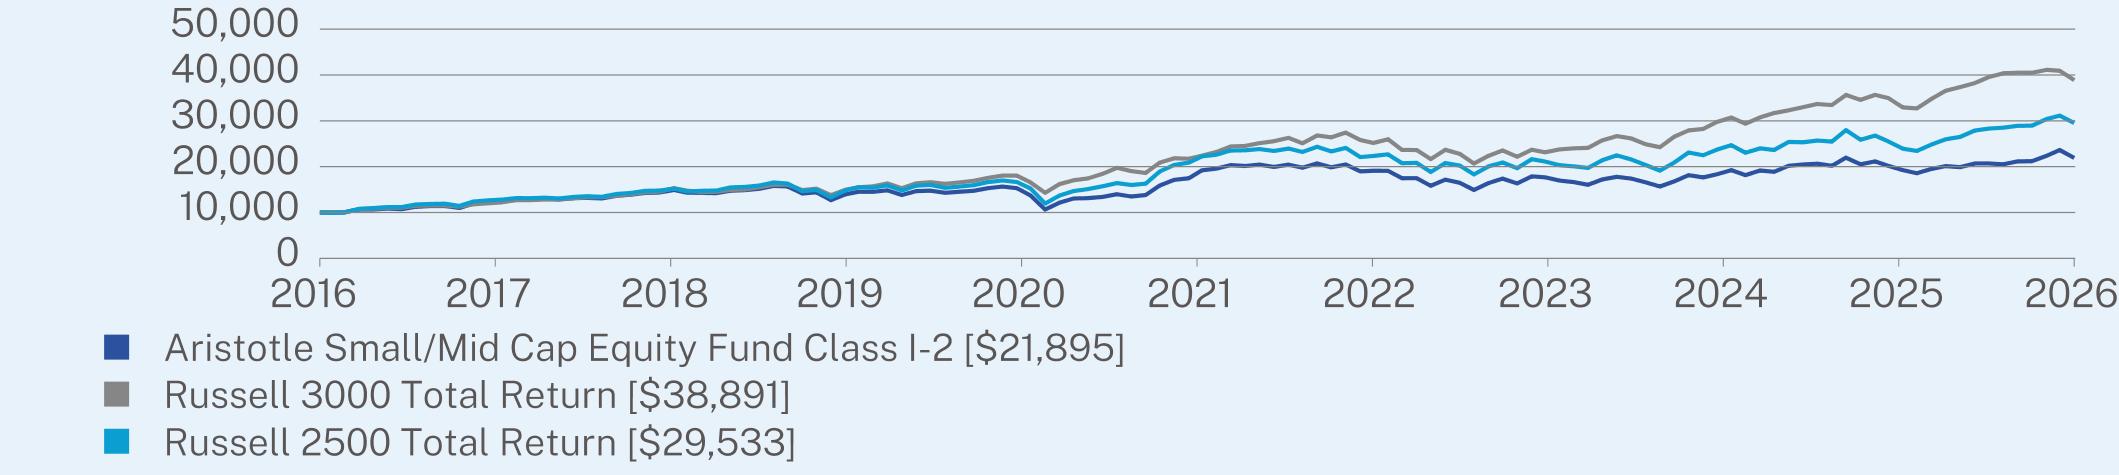
ANNUAL AVERAGE TOTAL RETURN (%)
|
|
1 Year
|
5 Year
|
10 Year
|
|
Class I-2 (without sales charge)
|
13.71
|
2.25
|
7.49
|
|
Russell 3000 Total Return
|
18.09
|
10.87
|
13.72
|
|
Russell 2500 Total Return
|
23.45
|
5.48
|
10.58
|
Visit https://www.aristotlefunds.com/resources/prospectuses-reports for more recent performance information.
KEY FUND STATISTICS (as of March 31, 2026)
|
Net Assets
|
$21,852,691
|
|
Number of Holdings
|
101
|
|
Net Advisory Fee
|
$175,860
|
|
Portfolio Turnover Rate
|
26%
|
WHAT DID THE FUND INVEST IN? (as of March 31, 2026)*
|
Top 10 Issuers
|
(%)
|
|
Advanced Energy Industries, Inc.
|
2.9%
|
|
MACOM Technology Solutions Holdings, Inc.
|
2.7%
|
|
Alamos Gold, Inc.
|
2.7%
|
|
Permian Resources Corp.
|
2.4%
|
|
HA Sustainable Infrastructure Capital, Inc.
|
2.3%
|
|
Range Resources Corp.
|
2.2%
|
|
AerCap Holdings NV
|
2.0%
|
|
BankUnited, Inc.
|
1.8%
|
|
FTAI Aviation Ltd.
|
1.8%
|
|
HealthEquity, Inc.
|
1.8%
|
Sector Breakdown (%)**

Changes to Fund’s Principal Risks:
In the Fund’s Principal Risks, Securities Lending Risk was added.
Changes to the Fund’s Principal Investment Strategy:
The Fund’s Principal Investment Strategies were revised to note that the Fund may lend its portfolio securities to generate additional income.
This report describes changes to the Fund that occurred during the reporting period.
WHAT WERE THE FUND COSTS FOR THE PAST YEAR? (based on a hypothetical $10,000 investment)
|
Class Name
|
Costs of a $10,000 investment
|
Costs paid as a percentage of a $10,000 investment
|
|
Class A
|
$97
|
0.94%
|
HOW DID THE FUND PERFORM LAST YEAR AND WHAT AFFECTED ITS PERFORMANCE?
|
•
|
For the 12-month period ended March 31, 2026, the Fund outperformed its performance benchmark, the Bloomberg US Aggregate Bond Index. The Fund invests principally in income-producing debt instruments.
|
|
•
|
Over the past 12 months, the U.S. Treasury yield curve transitioned toward a more normalized, upward-sloping shape, reflecting easing monetary policy expectations and an improving growth outlook; yields remained elevated relative to recent history—supporting returns—while corporate spreads also provided a favorable backdrop.
|
|
•
|
Exposure to specific credit-sensitive sectors benefited performance for most of the period as credit remained broadly supported. The intermediate positioning and historically elevated yield profile helped insulate from the full effect of episodic credit spread widening as compared to longer duration-based offerings.
|
|
•
|
The Fund benefited across the credit quality spectrum led by BBB and single B rated credit exposures. By asset class, investment grade corporate bonds, high yield bonds, and floating rate loans were most beneficial to performance. Non-US government (limited weighted exposure in the Fund) was a slight performance drag.
|
|
•
|
Positive contributions to relative performance were led by credit selection and active asset class allocation.
|
|
•
|
While the Fund increased its duration over the last twelve months but remains shorter duration than the benchmark’s duration. The Fund benefited from an elevated yield environment over the period. On a year-over-year basis, we reduced floating rate loan exposure while increasing exposure to investment grade bond, high yield bond, and government bond exposure.
|
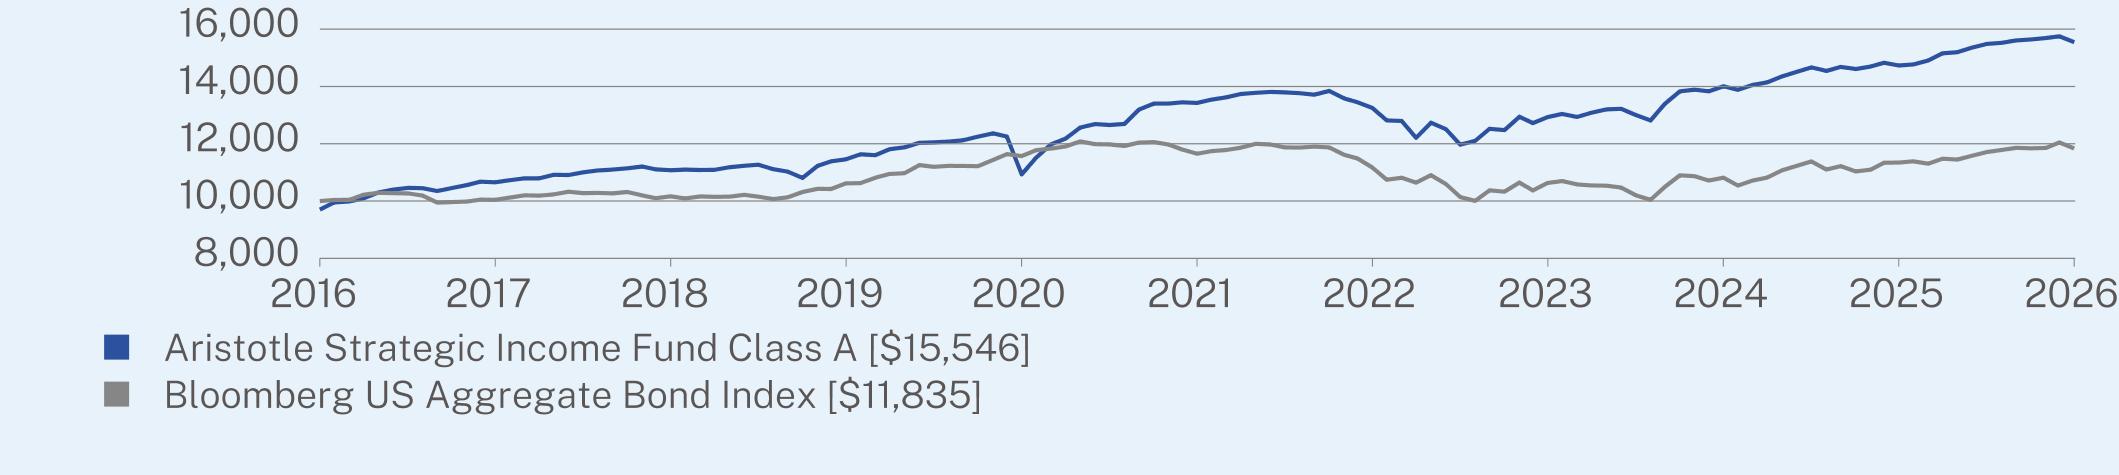
ANNUAL AVERAGE TOTAL RETURN (%)
|
|
1 Year
|
5 Year
|
10 Year
|
|
Class A (without sales charge)
|
5.53
|
2.98
|
4.83
|
|
Class A (with sales charge)
|
1.07
|
2.09
|
4.37
|
|
Bloomberg US Aggregate Bond Index
|
4.35
|
0.31
|
1.70
|
Visit https://www.aristotlefunds.com/resources/prospectuses-reports for more recent performance information.
KEY FUND STATISTICS (as of March 31, 2026)
|
Net Assets
|
$4,217,662,209
|
|
Number of Holdings
|
494
|
|
Net Advisory Fee
|
$20,079,060
|
|
Portfolio Turnover Rate
|
70%
|
WHAT DID THE FUND INVEST IN? (as of March 31, 2026)*
|
Top 10 Issuers
|
(%)
|
|
United States Treasury Note/Bond
|
4.3%
|
|
JPMorgan Chase & Co.
|
1.7%
|
|
Citigroup, Inc.
|
1.6%
|
|
Energy Transfer LP
|
1.6%
|
|
Bank of America Corp.
|
1.6%
|
|
Goldman Sachs Group, Inc.
|
1.5%
|
|
Alliant Holdings Intermediate LLC / Alliant Holdings Co.-Issuer
|
1.4%
|
|
Oracle Corp.
|
1.4%
|
|
Morgan Stanley
|
1.3%
|
|
GLP Capital LP / GLP Financing II, Inc.
|
1.2%
|
Sector Breakdown (%)

Changes to Fund’s Principal Risks:
In the Fund’s Principal Risks, Securities Lending Risk was added.
Changes to the Fund’s Principal Investment Strategy:
The Fund’s Principal Investment Strategies were revised to note that the Fund may lend its portfolio securities to generate additional income.
This report describes changes to the Fund that occurred during the reporting period.
WHAT WERE THE FUND COSTS FOR THE PAST YEAR? (based on a hypothetical $10,000 investment)
|
Class Name
|
Costs of a $10,000 investment
|
Costs paid as a percentage of a $10,000 investment
|
|
Class C
|
$173
|
1.69%
|
HOW DID THE FUND PERFORM LAST YEAR AND WHAT AFFECTED ITS PERFORMANCE?
|
•
|
For the 12-month period ended March 31, 2026, the Fund outperformed its performance benchmark, the Bloomberg US Aggregate Bond Index. The Fund invests principally in income-producing debt instruments.
|
|
•
|
Over the past 12 months, the U.S. Treasury yield curve transitioned toward a more normalized, upward-sloping shape, reflecting easing monetary policy expectations and an improving growth outlook; yields remained elevated relative to recent history—supporting returns—while corporate spreads also provided a favorable backdrop.
|
|
•
|
Exposure to specific credit-sensitive sectors benefited performance for most of the period as credit remained broadly supported. The intermediate positioning and historically elevated yield profile helped insulate from the full effect of episodic credit spread widening as compared to longer duration-based offerings.
|
|
•
|
The Fund benefited across the credit quality spectrum led by BBB and single B rated credit exposures. By asset class, investment grade corporate bonds, high yield bonds, and floating rate loans were most beneficial to performance. Non-US government (limited weighted exposure in the Fund) was a slight performance drag.
|
|
•
|
Positive contributions to relative performance were led by credit selection and active asset class allocation.
|
|
•
|
While the Fund increased its duration over the last twelve months but remains shorter duration than the benchmark’s duration. The Fund benefited from an elevated yield environment over the period. On a year-over-year basis, we reduced floating rate loan exposure while increasing exposure to investment grade bond, high yield bond, and government bond exposure.
|
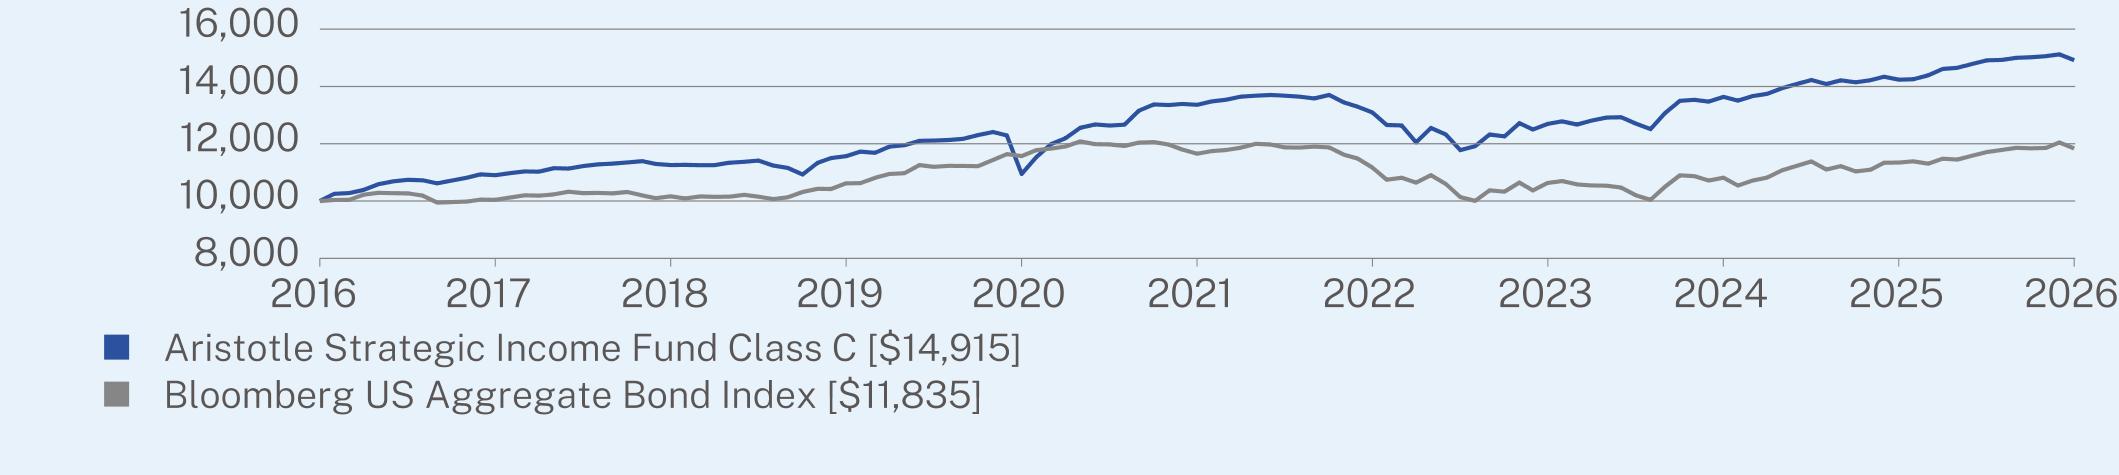
ANNUAL AVERAGE TOTAL RETURN (%)
|
|
1 Year
|
5 Year
|
10 Year
|
|
Class C (without sales charge)
|
4.76
|
2.23
|
4.08
|
|
Class C (with sales charge)
|
3.76
|
2.23
|
4.08
|
|
Bloomberg US Aggregate Bond Index
|
4.35
|
0.31
|
1.70
|
Visit https://www.aristotlefunds.com/resources/prospectuses-reports for more recent performance information.
KEY FUND STATISTICS (as of March 31, 2026)
|
Net Assets
|
$4,217,662,209
|
|
Number of Holdings
|
494
|
|
Net Advisory Fee
|
$20,079,060
|
|
Portfolio Turnover Rate
|
70%
|
WHAT DID THE FUND INVEST IN? (as of March 31, 2026)*
|
Top 10 Issuers
|
(%)
|
|
United States Treasury Note/Bond
|
4.3%
|
|
JPMorgan Chase & Co.
|
1.7%
|
|
Citigroup, Inc.
|
1.6%
|
|
Energy Transfer LP
|
1.6%
|
|
Bank of America Corp.
|
1.6%
|
|
Goldman Sachs Group, Inc.
|
1.5%
|
|
Alliant Holdings Intermediate LLC / Alliant Holdings Co.-Issuer
|
1.4%
|
|
Oracle Corp.
|
1.4%
|
|
Morgan Stanley
|
1.3%
|
|
GLP Capital LP / GLP Financing II, Inc.
|
1.2%
|
Sector Breakdown (%)
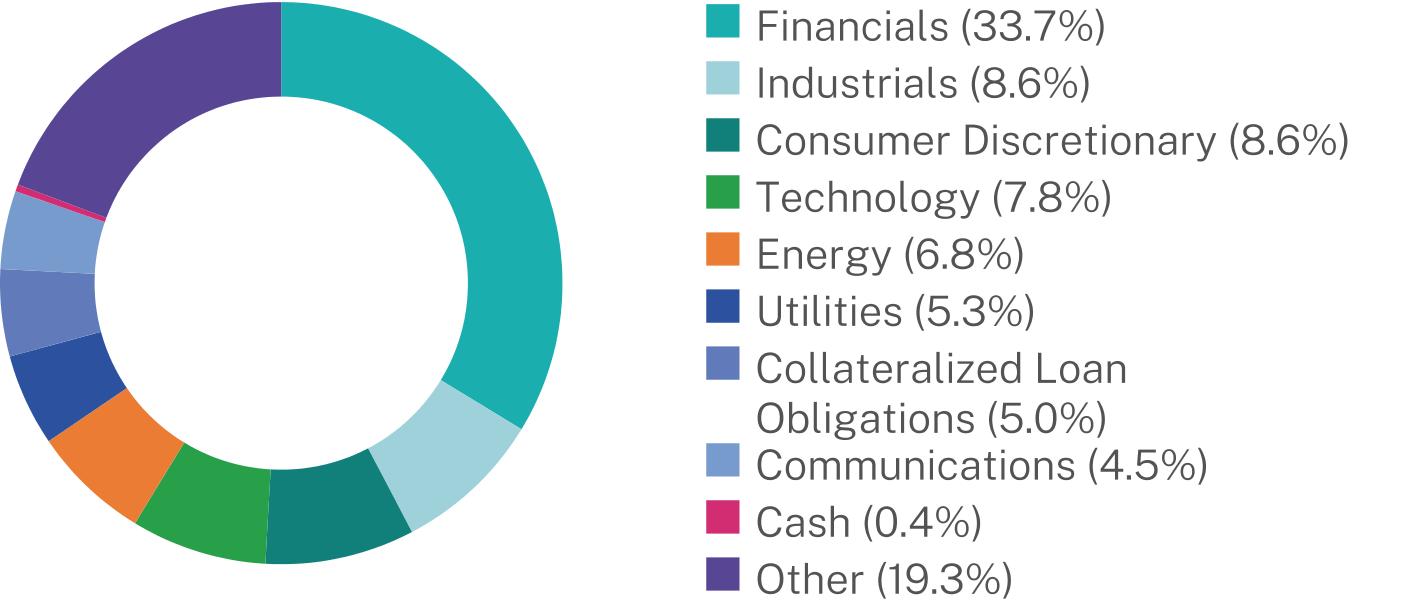
Changes to Fund’s Principal Risks:
In the Fund’s Principal Risks, Securities Lending Risk was added.
Changes to the Fund’s Principal Investment Strategy:
The Fund’s Principal Investment Strategies were revised to note that the Fund may lend its portfolio securities to generate additional income.
This report describes changes to the Fund that occurred during the reporting period.
WHAT WERE THE FUND COSTS FOR THE PAST YEAR? (based on a hypothetical $10,000 investment)
|
Class Name
|
Costs of a $10,000 investment*
|
Costs paid as a percentage of a $10,000 investment**
|
|
Class H
|
$19
|
0.60%
|
HOW DID THE FUND PERFORM LAST YEAR AND WHAT AFFECTED ITS PERFORMANCE?
|
•
|
Since its inception on December 5, 2025, the Fund underperformed its performance benchmark, the Bloomberg US Aggregate Bond Index. The Fund invests principally in income-producing debt instruments.
|
|
•
|
Over the past 12 months, the U.S. Treasury yield curve transitioned toward a more normalized, upward-sloping shape, reflecting easing monetary policy expectations and an improving growth outlook; yields remained elevated relative to recent history—supporting returns—while corporate spreads also provided a favorable backdrop.
|
|
•
|
Exposure to specific credit-sensitive sectors benefited performance for most of the period as credit remained broadly supported. The intermediate positioning and historically elevated yield profile helped insulate from the full effect of episodic credit spread widening as compared to longer duration-based offerings.
|
|
•
|
The Fund benefited across the credit quality spectrum led by BBB and single B rated credit exposures. By asset class, investment grade corporate bonds, high yield bonds, and floating rate loans were most beneficial to performance. Non-US government (limited weighted exposure in the Fund) was a slight performance drag.
|
|
•
|
Positive contributions to relative performance were led by credit selection and active asset class allocation.
|
|
•
|
While the Fund increased its duration over the last twelve months but remains shorter duration than the benchmark’s duration. The Fund benefited from an elevated yield environment over the period. On a year-over-year basis, we reduced floating rate loan exposure while increasing exposure to investment grade bond, high yield bond, and government bond exposure.
|
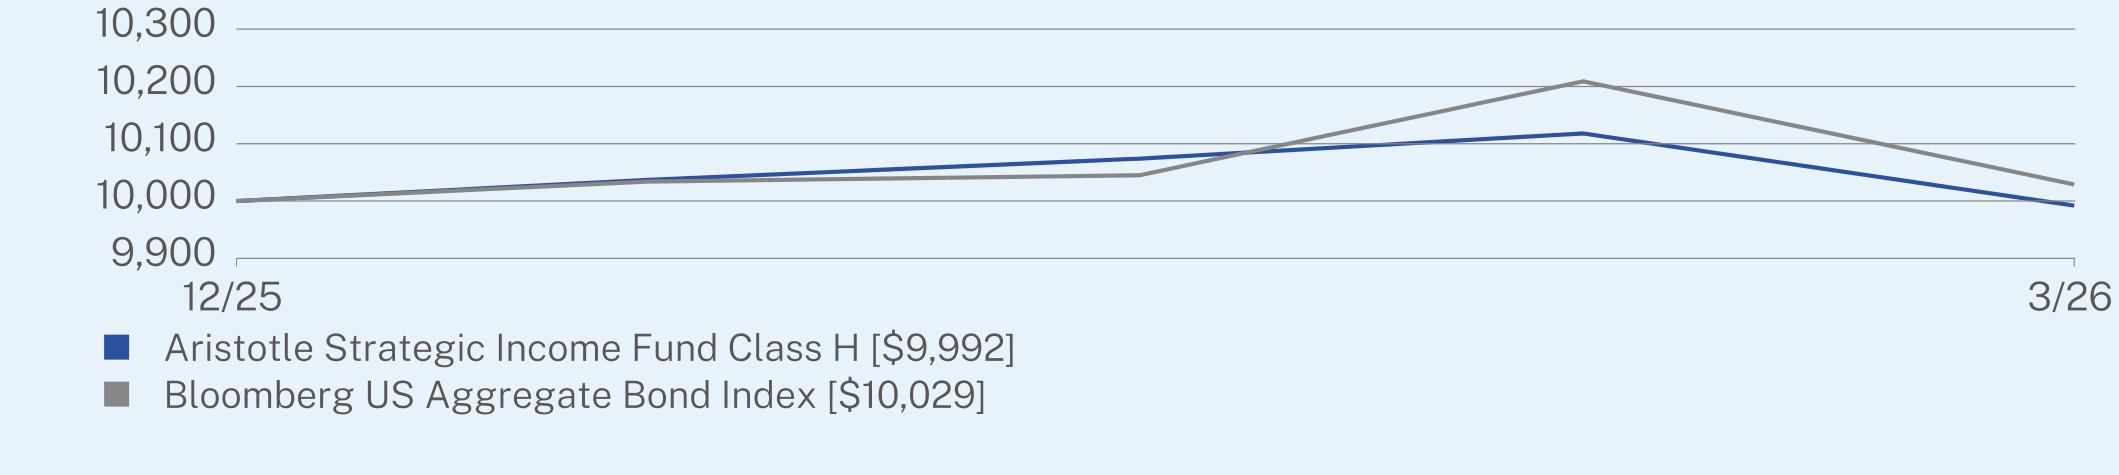
CUMULATIVE TOTAL RETURN (%)
|
|
Since Inception
(12/05/2025) |
|
Class H (without sales charge)
|
-0.08
|
|
Bloomberg US Aggregate Bond Index
|
0.29
|
Visit https://www.aristotlefunds.com/resources/prospectuses-reports for more recent performance information.
KEY FUND STATISTICS (as of March 31, 2026)
|
Net Assets
|
$4,217,662,209
|
|
Number of Holdings
|
494
|
|
Net Advisory Fee
|
$20,079,060
|
|
Portfolio Turnover Rate
|
70%
|
WHAT DID THE FUND INVEST IN? (as of March 31, 2026)*
|
Top 10 Issuers
|
(%)
|
|
United States Treasury Note/Bond
|
4.3%
|
|
JPMorgan Chase & Co.
|
1.7%
|
|
Citigroup, Inc.
|
1.6%
|
|
Energy Transfer LP
|
1.6%
|
|
Bank of America Corp.
|
1.6%
|
|
Goldman Sachs Group, Inc.
|
1.5%
|
|
Alliant Holdings Intermediate LLC / Alliant Holdings Co.-Issuer
|
1.4%
|
|
Oracle Corp.
|
1.4%
|
|
Morgan Stanley
|
1.3%
|
|
GLP Capital LP / GLP Financing II, Inc.
|
1.2%
|
Sector Breakdown (%)

Changes to Fund’s Principal Risks:
In the Fund’s Principal Risks, Securities Lending Risk was added.
Changes to the Fund’s Principal Investment Strategy:
The Fund’s Principal Investment Strategies were revised to note that the Fund may lend its portfolio securities to generate additional income.
This report describes changes to the Fund that occurred during the reporting period.
WHAT WERE THE FUND COSTS FOR THE PAST YEAR? (based on a hypothetical $10,000 investment)
|
Class Name
|
Costs of a $10,000 investment
|
Costs paid as a percentage of a $10,000 investment
|
|
Class I
|
$61
|
0.59%
|
HOW DID THE FUND PERFORM LAST YEAR AND WHAT AFFECTED ITS PERFORMANCE?
|
•
|
For the 12-month period ended March 31, 2026, the Fund outperformed its performance benchmark, the Bloomberg US Aggregate Bond Index. The Fund invests principally in income-producing debt instruments.
|
|
•
|
Over the past 12 months, the U.S. Treasury yield curve transitioned toward a more normalized, upward-sloping shape, reflecting easing monetary policy expectations and an improving growth outlook; yields remained elevated relative to recent history—supporting returns—while corporate spreads also provided a favorable backdrop.
|
|
•
|
Exposure to specific credit-sensitive sectors benefited performance for most of the period as credit remained broadly supported. The intermediate positioning and historically elevated yield profile helped insulate from the full effect of episodic credit spread widening as compared to longer duration-based offerings.
|
|
•
|
The Fund benefited across the credit quality spectrum led by BBB and single B rated credit exposures. By asset class, investment grade corporate bonds, high yield bonds, and floating rate loans were most beneficial to performance. Non-US government (limited weighted exposure in the Fund) was a slight performance drag.
|
|
•
|
Positive contributions to relative performance were led by credit selection and active asset class allocation.
|
|
•
|
While the Fund increased its duration over the last twelve months but remains shorter duration than the benchmark’s duration. The Fund benefited from an elevated yield environment over the period. On a year-over-year basis, we reduced floating rate loan exposure while increasing exposure to investment grade bond, high yield bond, and government bond exposure.
|
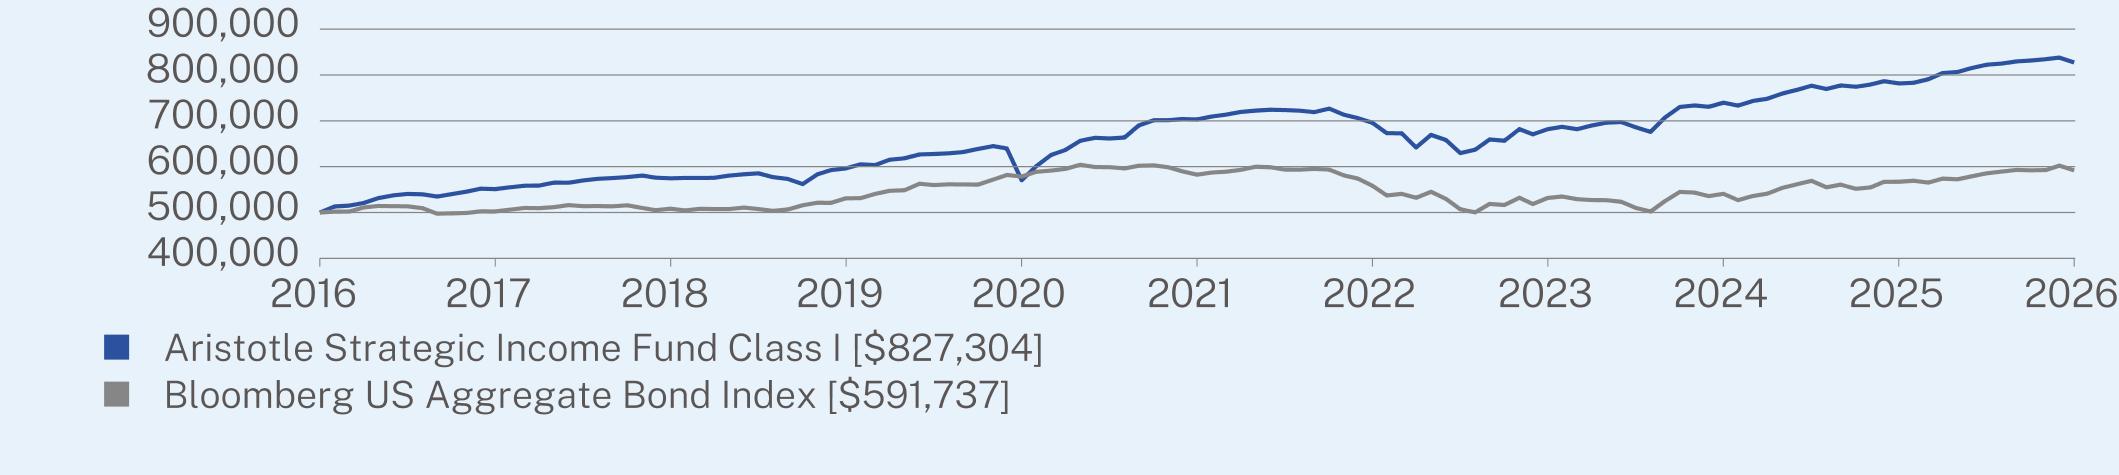
ANNUAL AVERAGE TOTAL RETURN (%)
|
|
1 Year
|
5 Year
|
10 Year
|
|
Class I (without sales charge)
|
5.85
|
3.31
|
5.16
|
|
Bloomberg US Aggregate Bond Index
|
4.35
|
0.31
|
1.70
|
Visit https://www.aristotlefunds.com/resources/prospectuses-reports for more recent performance information.
KEY FUND STATISTICS (as of March 31, 2026)
|
Net Assets
|
$4,217,662,209
|
|
Number of Holdings
|
494
|
|
Net Advisory Fee
|
$20,079,060
|
|
Portfolio Turnover Rate
|
70%
|
WHAT DID THE FUND INVEST IN? (as of March 31, 2026)*
|
Top 10 Issuers
|
(%)
|
|
United States Treasury Note/Bond
|
4.3%
|
|
JPMorgan Chase & Co.
|
1.7%
|
|
Citigroup, Inc.
|
1.6%
|
|
Energy Transfer LP
|
1.6%
|
|
Bank of America Corp.
|
1.6%
|
|
Goldman Sachs Group, Inc.
|
1.5%
|
|
Alliant Holdings Intermediate LLC / Alliant Holdings Co.-Issuer
|
1.4%
|
|
Oracle Corp.
|
1.4%
|
|
Morgan Stanley
|
1.3%
|
|
GLP Capital LP / GLP Financing II, Inc.
|
1.2%
|
Sector Breakdown (%)

Changes to Fund’s Principal Risks:
In the Fund’s Principal Risks, Securities Lending Risk was added.
Changes to the Fund’s Principal Investment Strategy:
The Fund’s Principal Investment Strategies were revised to note that the Fund may lend its portfolio securities to generate additional income.
This report describes changes to the Fund that occurred during the reporting period.
WHAT WERE THE FUND COSTS FOR THE PAST YEAR? (based on a hypothetical $10,000 investment)
|
Class Name
|
Costs of a $10,000 investment
|
Costs paid as a percentage of a $10,000 investment
|
|
Class I-2
|
$71
|
0.69%
|
HOW DID THE FUND PERFORM LAST YEAR AND WHAT AFFECTED ITS PERFORMANCE?
|
•
|
For the 12-month period ended March 31, 2026, the Fund outperformed its performance benchmark, the Bloomberg US Aggregate Bond Index. The Fund invests principally in income-producing debt instruments.
|
|
•
|
Over the past 12 months, the U.S. Treasury yield curve transitioned toward a more normalized, upward-sloping shape, reflecting easing monetary policy expectations and an improving growth outlook; yields remained elevated relative to recent history—supporting returns—while corporate spreads also provided a favorable backdrop.
|
|
•
|
Exposure to specific credit-sensitive sectors benefited performance for most of the period as credit remained broadly supported. The intermediate positioning and historically elevated yield profile helped insulate from the full effect of episodic credit spread widening as compared to longer duration-based offerings.
|
|
•
|
The Fund benefited across the credit quality spectrum led by BBB and single B rated credit exposures. By asset class, investment grade corporate bonds, high yield bonds, and floating rate loans were most beneficial to performance. Non-US government (limited weighted exposure in the Fund) was a slight performance drag.
|
|
•
|
Positive contributions to relative performance were led by credit selection and active asset class allocation.
|
|
•
|
While the Fund increased its duration over the last twelve months but remains shorter duration than the benchmark’s duration. The Fund benefited from an elevated yield environment over the period. On a year-over-year basis, we reduced floating rate loan exposure while increasing exposure to investment grade bond, high yield bond, and government bond exposure.
|
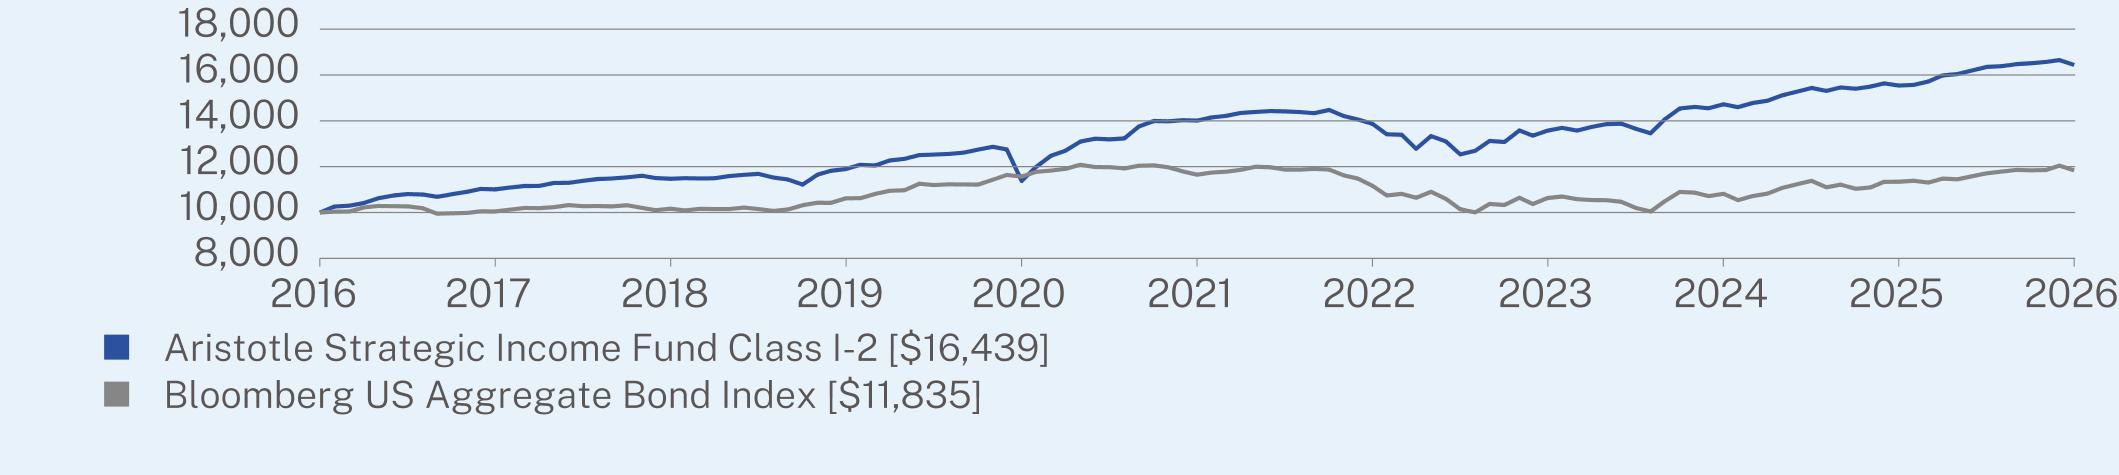
ANNUAL AVERAGE TOTAL RETURN (%)
|
|
1 Year
|
5 Year
|
10 Year
|
|
Class I-2 (without sales charge)
|
5.79
|
3.25
|
5.10
|
|
Bloomberg US Aggregate Bond Index
|
4.35
|
0.31
|
1.70
|
Visit https://www.aristotlefunds.com/resources/prospectuses-reports for more recent performance information.
KEY FUND STATISTICS (as of March 31, 2026)
|
Net Assets
|
$4,217,662,209
|
|
Number of Holdings
|
494
|
|
Net Advisory Fee
|
$20,079,060
|
|
Portfolio Turnover Rate
|
70%
|
WHAT DID THE FUND INVEST IN? (as of March 31, 2026)*
|
Top 10 Issuers
|
(%)
|
|
United States Treasury Note/Bond
|
4.3%
|
|
JPMorgan Chase & Co.
|
1.7%
|
|
Citigroup, Inc.
|
1.6%
|
|
Energy Transfer LP
|
1.6%
|
|
Bank of America Corp.
|
1.6%
|
|
Goldman Sachs Group, Inc.
|
1.5%
|
|
Alliant Holdings Intermediate LLC / Alliant Holdings Co.-Issuer
|
1.4%
|
|
Oracle Corp.
|
1.4%
|
|
Morgan Stanley
|
1.3%
|
|
GLP Capital LP / GLP Financing II, Inc.
|
1.2%
|
Sector Breakdown (%)

Changes to Fund’s Principal Risks:
In the Fund’s Principal Risks, Securities Lending Risk was added.
Changes to the Fund’s Principal Investment Strategy:
The Fund’s Principal Investment Strategies were revised to note that the Fund may lend its portfolio securities to generate additional income.
This report describes changes to the Fund that occurred during the reporting period.
WHAT WERE THE FUND COSTS FOR THE PAST YEAR? (based on a hypothetical $10,000 investment)
|
Class Name
|
Costs of a $10,000 investment
|
Costs paid as a percentage of a $10,000 investment
|
|
Class A
|
$58
|
0.57%
|
HOW DID THE FUND PERFORM LAST YEAR AND WHAT AFFECTED ITS PERFORMANCE?
|
•
|
For the 12-month period ended March 31, 2026, the Fund outperformed its performance benchmark, the Bloomberg Short Treasury Total Return Index. The Fund primarily invests in investment grade, U.S. dollar-denominated short-term fixed and floating rate debt securities, including corporate debt securities, mortgage-related securities, asset-backed securities, U.S. government securities and agency securities and money market instruments such as commercial paper, certificates of deposit, time deposits, deposit notes and bank notes.
|
|
•
|
Over the past 12 months, the U.S. Treasury yield curve transitioned toward a more normalized, upward-sloping shape, reflecting easing monetary policy expectations and an improving growth outlook; yields remained elevated relative to recent history—supporting returns—while corporate spreads also provided a favorable backdrop.
|
|
•
|
Exposure to specific credit-sensitive sectors benefited performance for most of the period as credit remained broadly supported. The front-end positioning and historically elevated yield profile helped insulate from the full effect of episodic credit spread widening as compared to longer duration-based offerings.
|
|
•
|
By credit quality, single A rated credits were most beneficial to performance followed by AAA rated credits. By asset class, investment grade corporate bonds were most beneficial to performance followed by asset backed securities.
|
|
•
|
Positive contributions to relative performance were led by credit selection and asset class rotation.
|
|
•
|
The Fund duration remained very front-end pinned, which benefited from an attractive rate curve. On a year-over-year basis, we increased investment grade corporate bond and government bonds exposures while reducing floating rate loan and high yield bond exposure. We decreased cash holdings.
|
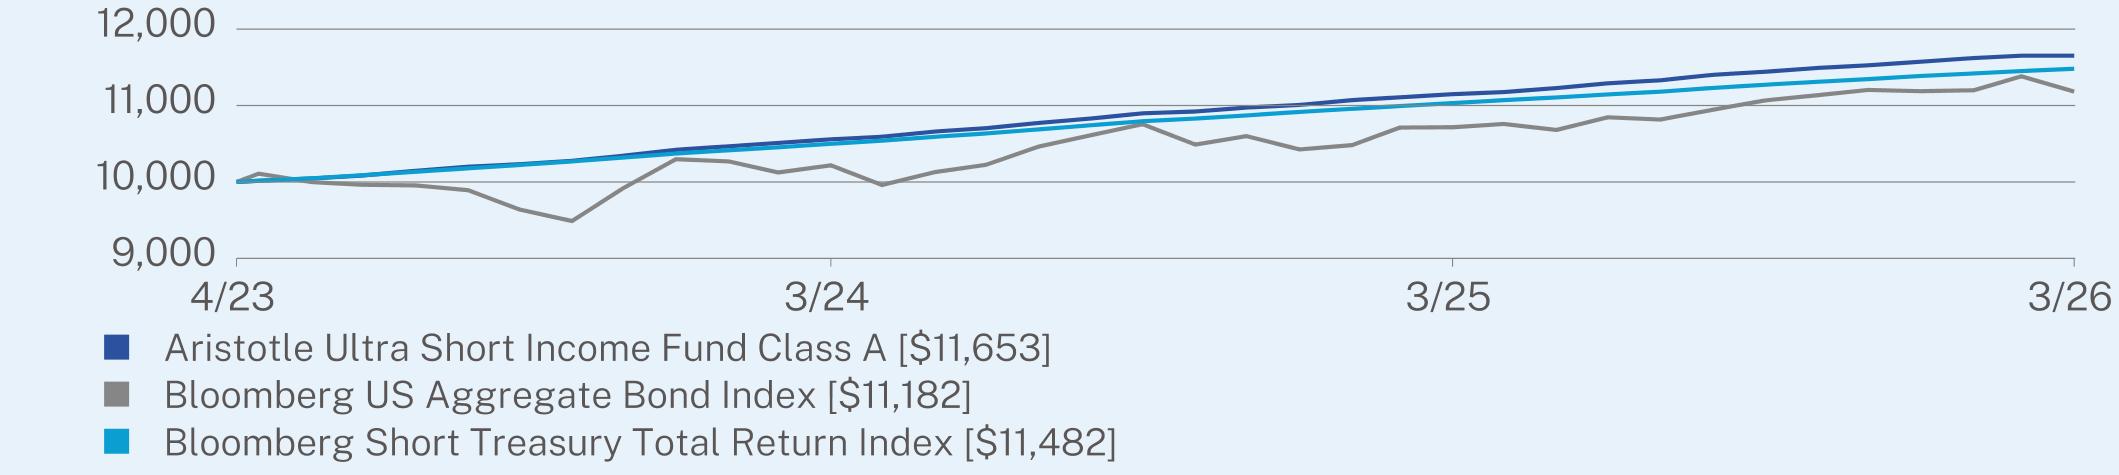
ANNUAL AVERAGE TOTAL RETURN (%)
|
|
1 Year
|
Since Inception
(04/17/2023) |
|
Class A (without sales charge)
|
4.52
|
5.31
|
|
Bloomberg US Aggregate Bond Index
|
4.35
|
3.85
|
|
Bloomberg Short Treasury Total Return Index
|
4.08
|
4.79
|
Visit https://www.aristotlefunds.com/resources/prospectuses-reports for more recent performance information.
KEY FUND STATISTICS (as of March 31, 2026)
|
Net Assets
|
$42,447,912
|
|
Number of Holdings
|
141
|
|
Net Advisory Fee
|
$80,450
|
|
Portfolio Turnover Rate
|
108%
|
WHAT DID THE FUND INVEST IN? (as of March 31, 2026)*
|
Top 10 Issuers
|
(%)
|
|
United States Treasury Bill
|
5.6%
|
|
JPMorgan Chase & Co.
|
5.0%
|
|
Bank of America Corp.
|
4.6%
|
|
Palmer Square Loan Funding Ltd.
|
3.5%
|
|
Goldman Sachs Group, Inc.
|
2.9%
|
|
New York Life Global Funding
|
2.8%
|
|
Morgan Stanley
|
2.8%
|
|
UBS Group AG
|
2.4%
|
|
Neuberger Berman CLO Ltd.
|
2.4%
|
|
Elmwood CLO Ltd.
|
2.3%
|
Sector Breakdown (%)

Changes to Fund’s Principal Risks:
In the Fund’s Principal Risks, Securities Lending Risk was added.
Changes to the Fund’s Principal Investment Strategy:
The Fund’s Principal Investment Strategies were revised to note that the Fund may lend its portfolio securities to generate additional income.
This report describes changes to the Fund that occurred during the reporting period.
WHAT WERE THE FUND COSTS FOR THE PAST YEAR? (based on a hypothetical $10,000 investment)
|
Class Name
|
Costs of a $10,000 investment*
|
Costs paid as a percentage of a $10,000 investment**
|
|
Class H
|
$10
|
0.32%
|
HOW DID THE FUND PERFORM LAST YEAR AND WHAT AFFECTED ITS PERFORMANCE?
|
•
|
Since its inception on December 5, 2025, the Fund slightly underperformed its performance benchmark, the Bloomberg Short Treasury Total Return Index. The Fund primarily invests in investment grade, U.S. dollar-denominated short-term fixed and floating rate debt securities, including corporate debt securities, mortgage-related securities, asset-backed securities, U.S. government securities and agency securities and money market instruments such as commercial paper, certificates of deposit, time deposits, deposit notes and bank notes.
|
|
•
|
Over the past 12 months, the U.S. Treasury yield curve transitioned toward a more normalized, upward-sloping shape, reflecting easing monetary policy expectations and an improving growth outlook; yields remained elevated relative to recent history—supporting returns—while corporate spreads also provided a favorable backdrop.
|
|
•
|
Exposure to specific credit-sensitive sectors benefited performance for most of the period as credit remained broadly supported. The front-end positioning and historically elevated yield profile helped insulate from the full effect of episodic credit spread widening as compared to longer duration-based offerings.
|
|
•
|
By credit quality, single A rated credits were most beneficial to performance followed by AAA rated credits. By asset class, investment grade corporate bonds were most beneficial to performance followed by asset backed securities.
|
|
•
|
Positive contributions to relative performance were led by credit selection and asset class rotation.
|
|
•
|
The Fund duration remained very front-end pinned, which benefited from an attractive rate curve. On a year-over-year basis, we increased investment grade corporate bond and government bonds exposures while reducing floating rate loan and high yield bond exposure. We decreased cash holdings.
|
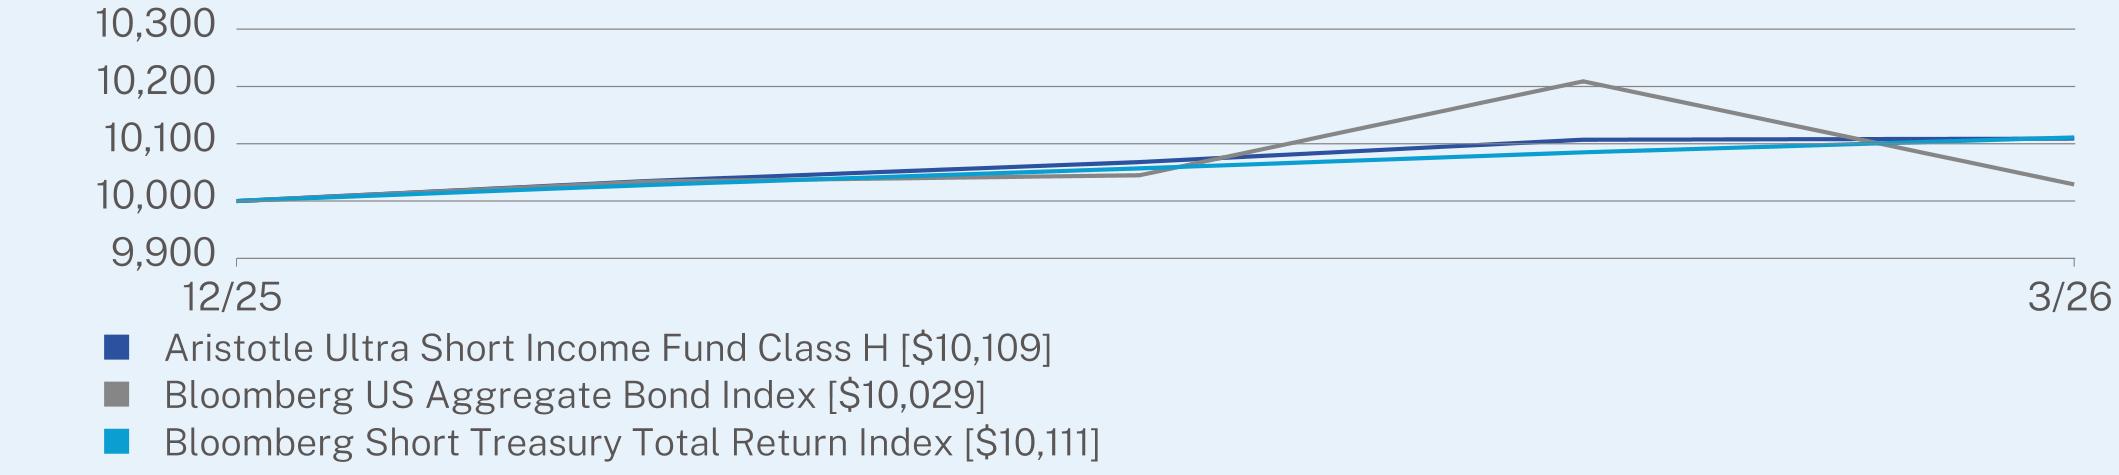
CUMULATIVE TOTAL RETURN (%)
|
|
Since Inception
(12/05/2025) |
|
Class H (without sales charge)
|
1.09
|
|
Bloomberg US Aggregate Bond Index
|
0.29
|
|
Bloomberg Short Treasury Total Return Index
|
1.11
|
Visit https://www.aristotlefunds.com/resources/prospectuses-reports for more recent performance information.
KEY FUND STATISTICS (as of March 31, 2026)
|
Net Assets
|
$42,447,912
|
|
Number of Holdings
|
141
|
|
Net Advisory Fee
|
$80,450
|
|
Portfolio Turnover Rate
|
108%
|
WHAT DID THE FUND INVEST IN? (as of March 31, 2026)*
|
Top 10 Issuers
|
(%)
|
|
United States Treasury Bill
|
5.6%
|
|
JPMorgan Chase & Co.
|
5.0%
|
|
Bank of America Corp.
|
4.6%
|
|
Palmer Square Loan Funding Ltd.
|
3.5%
|
|
Goldman Sachs Group, Inc.
|
2.9%
|
|
New York Life Global Funding
|
2.8%
|
|
Morgan Stanley
|
2.8%
|
|
UBS Group AG
|
2.4%
|
|
Neuberger Berman CLO Ltd.
|
2.4%
|
|
Elmwood CLO Ltd.
|
2.3%
|
Sector Breakdown (%)

Changes to Fund’s Principal Risks:
In the Fund’s Principal Risks, Securities Lending Risk was added.
Changes to the Fund’s Principal Investment Strategy:
The Fund’s Principal Investment Strategies were revised to note that the Fund may lend its portfolio securities to generate additional income.
This report describes changes to the Fund that occurred during the reporting period.
WHAT WERE THE FUND COSTS FOR THE PAST YEAR? (based on a hypothetical $10,000 investment)
|
Class Name
|
Costs of a $10,000 investment
|
Costs paid as a percentage of a $10,000 investment
|
|
Class I
|
$33
|
0.32%
|
HOW DID THE FUND PERFORM LAST YEAR AND WHAT AFFECTED ITS PERFORMANCE?
|
•
|
For the 12-month period ended March 31, 2026, the Fund outperformed its performance benchmark, the Bloomberg Short Treasury Total Return Index. The Fund primarily invests in investment grade, U.S. dollar-denominated short-term fixed and floating rate debt securities, including corporate debt securities, mortgage-related securities, asset-backed securities, U.S. government securities and agency securities and money market instruments such as commercial paper, certificates of deposit, time deposits, deposit notes and bank notes.
|
|
•
|
Over the past 12 months, the U.S. Treasury yield curve transitioned toward a more normalized, upward-sloping shape, reflecting easing monetary policy expectations and an improving growth outlook; yields remained elevated relative to recent history—supporting returns—while corporate spreads also provided a favorable backdrop.
|
|
•
|
Exposure to specific credit-sensitive sectors benefited performance for most of the period as credit remained broadly supported. The front-end positioning and historically elevated yield profile helped insulate from the full effect of episodic credit spread widening as compared to longer duration-based offerings.
|
|
•
|
By credit quality, single A rated credits were most beneficial to performance followed by AAA rated credits. By asset class, investment grade corporate bonds were most beneficial to performance followed by asset backed securities.
|
|
•
|
Positive contributions to relative performance were led by credit selection and asset class rotation.
|
|
•
|
The Fund duration remained very front-end pinned, which benefited from an attractive rate curve. On a year-over-year basis, we increased investment grade corporate bond and government bonds exposures while reducing floating rate loan and high yield bond exposure. We decreased cash holdings.
|
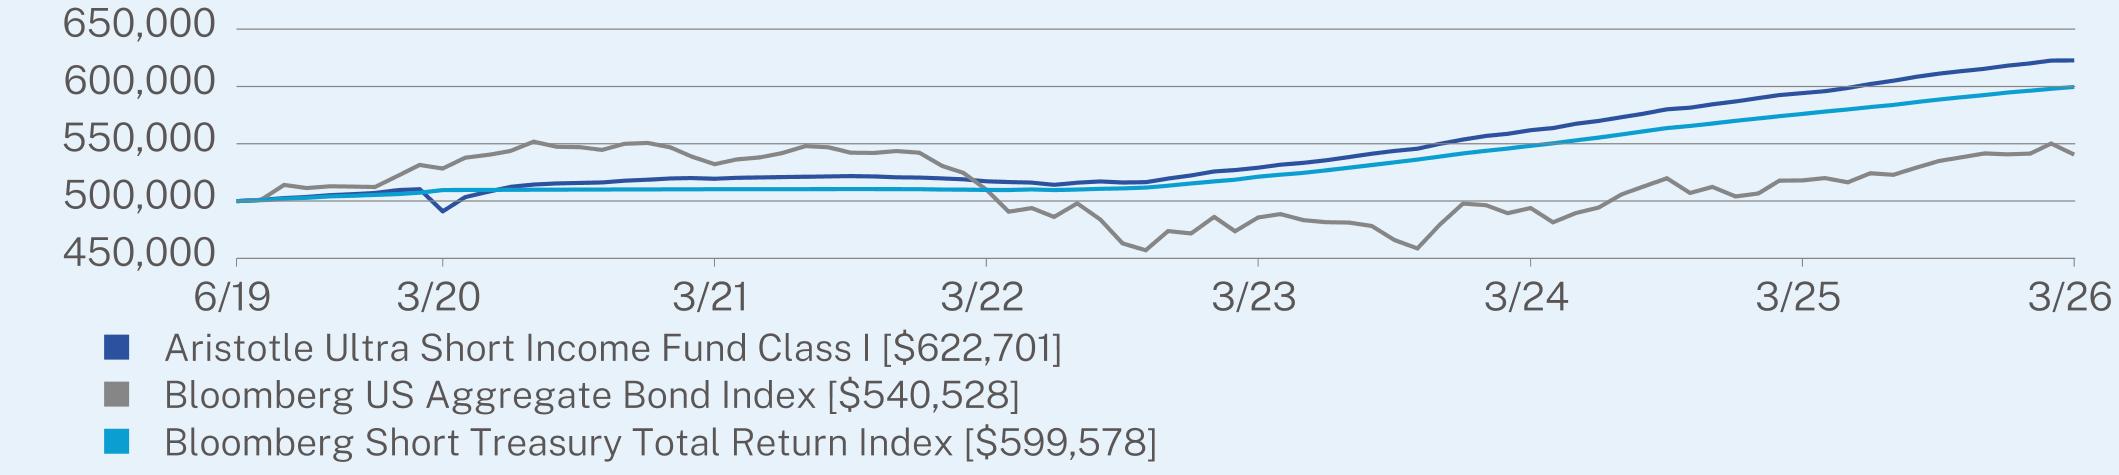
ANNUAL AVERAGE TOTAL RETURN (%)
|
|
1 Year
|
5 Year
|
Since Inception
(06/28/2019) |
|
Class I (without sales charge)
|
4.79
|
3.69
|
3.30
|
|
Bloomberg US Aggregate Bond Index
|
4.35
|
0.31
|
1.16
|
|
Bloomberg Short Treasury Total Return Index
|
4.08
|
3.28
|
2.72
|
Visit https://www.aristotlefunds.com/resources/prospectuses-reports for more recent performance information.
KEY FUND STATISTICS (as of March 31, 2026)
|
Net Assets
|
$42,447,912
|
|
Number of Holdings
|
141
|
|
Net Advisory Fee
|
$80,450
|
|
Portfolio Turnover Rate
|
108%
|
WHAT DID THE FUND INVEST IN? (as of March 31, 2026)*
|
Top 10 Issuers
|
(%)
|
|
United States Treasury Bill
|
5.6%
|
|
JPMorgan Chase & Co.
|
5.0%
|
|
Bank of America Corp.
|
4.6%
|
|
Palmer Square Loan Funding Ltd.
|
3.5%
|
|
Goldman Sachs Group, Inc.
|
2.9%
|
|
New York Life Global Funding
|
2.8%
|
|
Morgan Stanley
|
2.8%
|
|
UBS Group AG
|
2.4%
|
|
Neuberger Berman CLO Ltd.
|
2.4%
|
|
Elmwood CLO Ltd.
|
2.3%
|
Sector Breakdown (%)
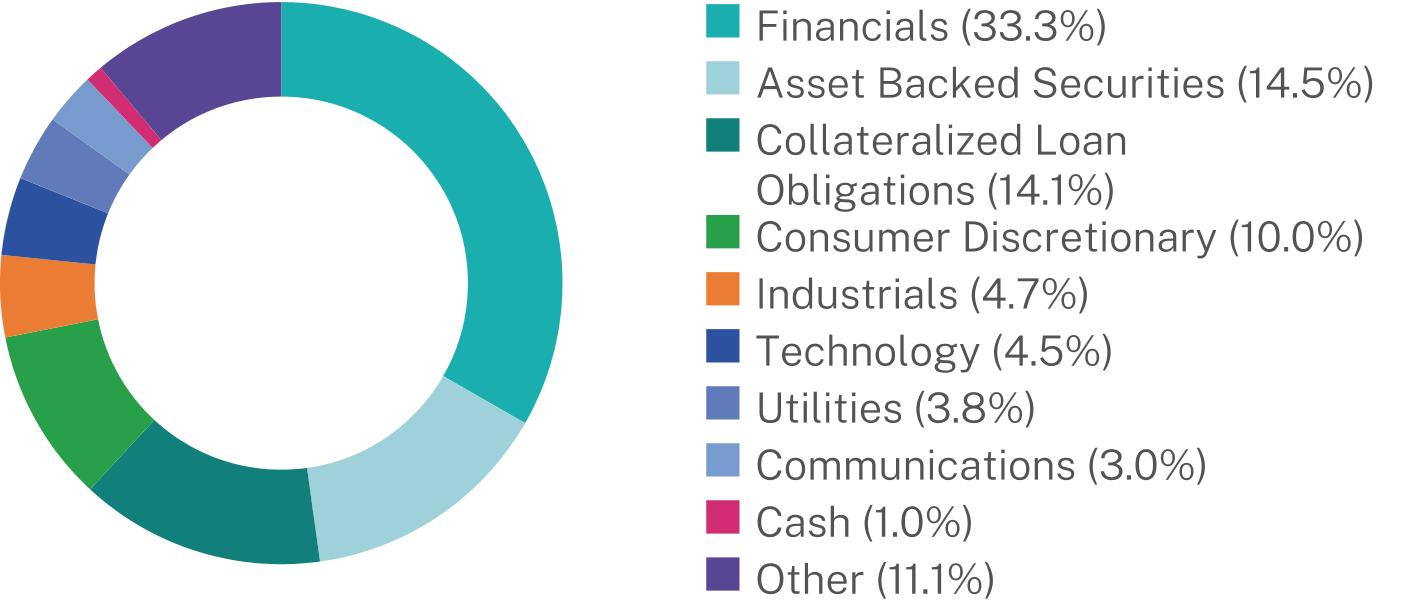
Changes to Fund’s Principal Risks:
In the Fund’s Principal Risks, Securities Lending Risk was added.
Changes to the Fund’s Principal Investment Strategy:
The Fund’s Principal Investment Strategies were revised to note that the Fund may lend its portfolio securities to generate additional income.
This report describes changes to the Fund that occurred during the reporting period.
WHAT WERE THE FUND COSTS FOR THE PAST YEAR? (based on a hypothetical $10,000 investment)
|
Class Name
|
Costs of a $10,000 investment
|
Costs paid as a percentage of a $10,000 investment
|
|
Class I-2
|
$33
|
0.32%
|
HOW DID THE FUND PERFORM LAST YEAR AND WHAT AFFECTED ITS PERFORMANCE?
|
•
|
For the 12-month period ended March 31, 2026, the Fund outperformed its performance benchmark, the Bloomberg Short Treasury Total Return Index. The Fund primarily invests in investment grade, U.S. dollar-denominated short-term fixed and floating rate debt securities, including corporate debt securities, mortgage-related securities, asset-backed securities, U.S. government securities and agency securities and money market instruments such as commercial paper, certificates of deposit, time deposits, deposit notes and bank notes.
|
|
•
|
Over the past 12 months, the U.S. Treasury yield curve transitioned toward a more normalized, upward-sloping shape, reflecting easing monetary policy expectations and an improving growth outlook; yields remained elevated relative to recent history—supporting returns—while corporate spreads also provided a favorable backdrop.
|
|
•
|
Exposure to specific credit-sensitive sectors benefited performance for most of the period as credit remained broadly supported. The front-end positioning and historically elevated yield profile helped insulate from the full effect of episodic credit spread widening as compared to longer duration-based offerings.
|
|
•
|
By credit quality, single A rated credits were most beneficial to performance followed by AAA rated credits. By asset class, investment grade corporate bonds were most beneficial to performance followed by asset backed securities.
|
|
•
|
Positive contributions to relative performance were led by credit selection and asset class rotation.
|
|
•
|
The Fund duration remained very front-end pinned, which benefited from an attractive rate curve. On a year-over-year basis, we increased investment grade corporate bond and government bonds exposures while reducing floating rate loan and high yield bond exposure. We decreased cash holdings.
|
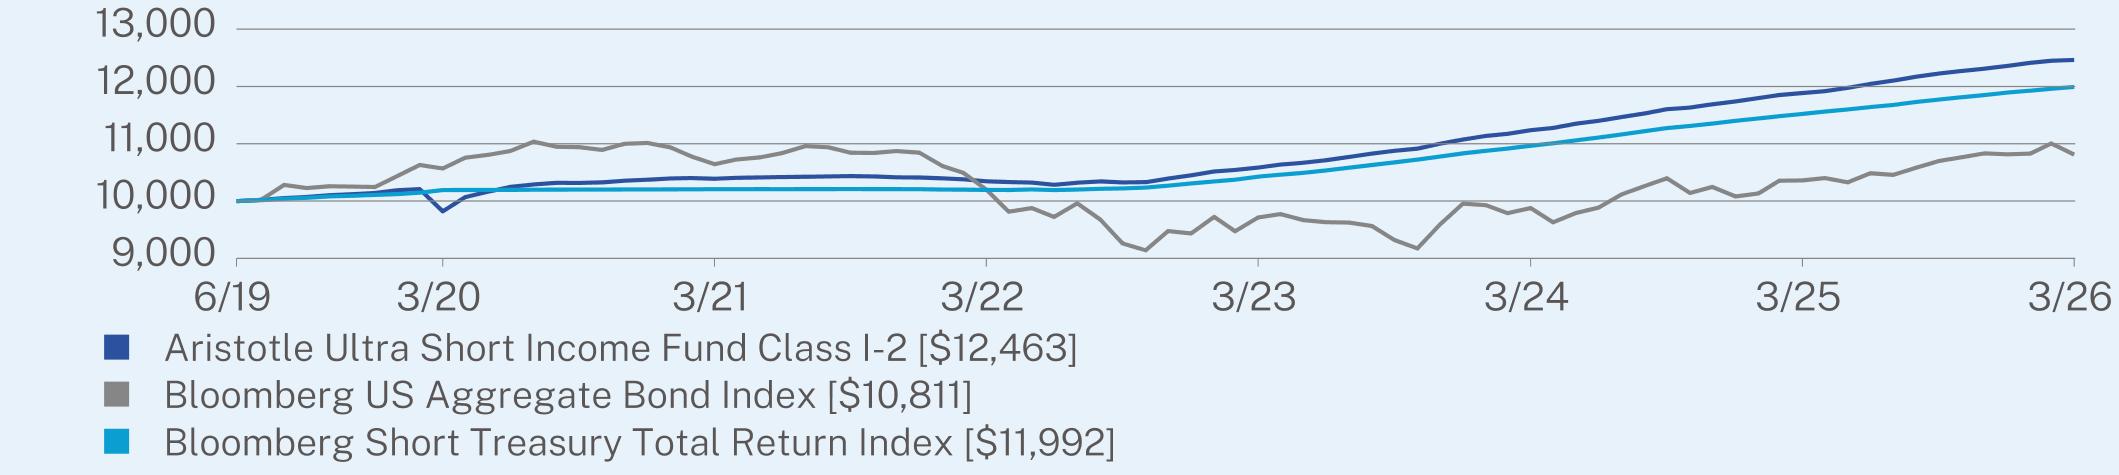
ANNUAL AVERAGE TOTAL RETURN (%)
|
|
1 Year
|
5 Year
|
Since Inception
(06/28/2019) |
|
Class I-2 (without sales charge)
|
4.86
|
3.71
|
3.31
|
|
Bloomberg US Aggregate Bond Index
|
4.35
|
0.31
|
1.16
|
|
Bloomberg Short Treasury Total Return Index
|
4.08
|
3.28
|
2.72
|
Visit https://www.aristotlefunds.com/resources/prospectuses-reports for more recent performance information.
KEY FUND STATISTICS (as of March 31, 2026)
|
Net Assets
|
$42,447,912
|
|
Number of Holdings
|
141
|
|
Net Advisory Fee
|
$80,450
|
|
Portfolio Turnover Rate
|
108%
|
WHAT DID THE FUND INVEST IN? (as of March 31, 2026)*
|
Top 10 Issuers
|
(%)
|
|
United States Treasury Bill
|
5.6%
|
|
JPMorgan Chase & Co.
|
5.0%
|
|
Bank of America Corp.
|
4.6%
|
|
Palmer Square Loan Funding Ltd.
|
3.5%
|
|
Goldman Sachs Group, Inc.
|
2.9%
|
|
New York Life Global Funding
|
2.8%
|
|
Morgan Stanley
|
2.8%
|
|
UBS Group AG
|
2.4%
|
|
Neuberger Berman CLO Ltd.
|
2.4%
|
|
Elmwood CLO Ltd.
|
2.3%
|
Sector Breakdown (%)

Changes to Fund’s Principal Risks:
In the Fund’s Principal Risks, Securities Lending Risk was added.
This report describes changes to the Fund that occurred during the reporting period.
WHAT WERE THE FUND COSTS FOR THE PAST YEAR? (based on a hypothetical $10,000 investment)
|
Class Name
|
Costs of a $10,000 investment
|
Costs paid as a percentage of a $10,000 investment
|
|
Class A
|
$98
|
0.94%
|
HOW DID THE FUND PERFORM LAST YEAR AND WHAT AFFECTED ITS PERFORMANCE?
|
•
|
For the 12-month period ended March 31, 2026, the Fund underperformed its primary and secondary performance benchmarks, the Russell 1000 Value Index and the S&P 500 Index, respectively. The Fund invests at least 80% of its assets in equity securities.
|
|
•
|
The performance explanation is provided relative to the primary benchmark, the Russell 1000 Value Index. The underperformance of the Fund relative to the Russell 1000 Value Index over the 1-year period came from security selection while sector allocation contributed.
|
|
•
|
Security selection in the information technology and consumer discretionary sectors detracted the most from relative performance. Conversely, security selection in the communication services and industrials sectors added the most value.
|
|
•
|
Top contributors Parker Hannifin, TotalEnergies and Corteva benefited from resilient industrial demand, supportive energy markets and stable agricultural fundamentals, respectively, while detractors including Lennar, Adobe and Sony were impacted by elevated interest rates and affordability pressures, moderating software growth expectations and softer consumer demand.
|
|
•
|
From a sector allocation standpoint, an underweight position in the industrials and energy sectors detracted from relative performance. An overweight exposure to the information technology and materials sectors added value.
|
|
•
|
During the 12-month period, a number of benchmark constituents, particularly within semiconductor and related industries, generated exceptionally strong returns, in some cases far exceeding broader market performance. The top detractor not owned in the portfolio was Micron Technologies, a leading manufacturer of semiconductor memory and storage solutions.
|
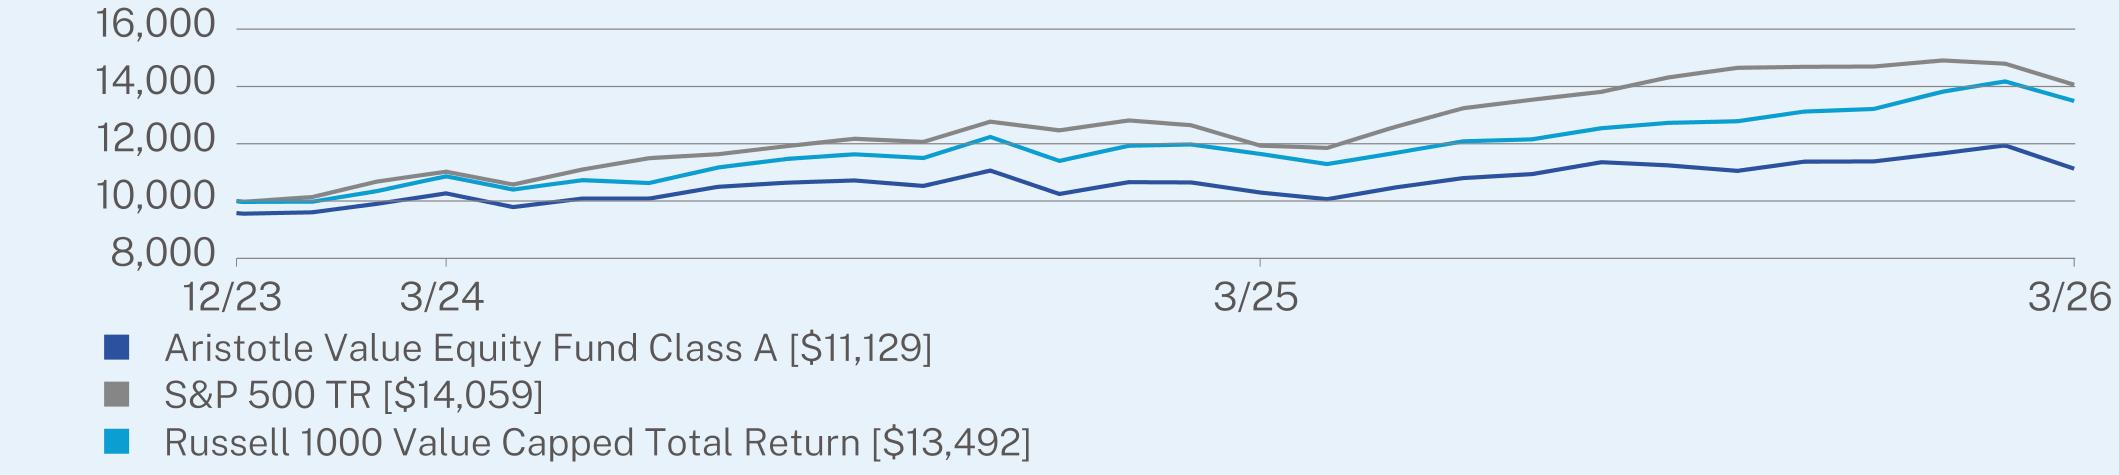
ANNUAL AVERAGE TOTAL RETURN (%)
|
|
1 Year
|
Since Inception
(12/28/2023) |
|
Class A (without sales charge)
|
8.09
|
6.87
|
|
Class A (with sales charge)
|
3.52
|
4.85
|
|
S&P 500 TR
|
17.80
|
16.29
|
|
Russell 1000 Value Capped Total Return
|
15.87
|
14.19
|
Visit https://www.aristotlefunds.com/resources/prospectuses-reports for more recent performance information.
KEY FUND STATISTICS (as of March 31, 2026)
|
Net Assets
|
$481,166,309
|
|
Number of Holdings
|
46
|
|
Net Advisory Fee
|
$2,905,467
|
|
Portfolio Turnover Rate
|
18%
|
WHAT DID THE FUND INVEST IN? (as of March 31, 2026)*
|
Top 10 Issuers
|
(%)
|
|
Parker-Hannifin Corp.
|
4.7%
|
|
Corteva, Inc.
|
3.9%
|
|
Alphabet, Inc.
|
3.6%
|
|
Microsoft Corp.
|
3.2%
|
|
Capital One Financial Corp.
|
3.1%
|
|
Martin Marietta Materials, Inc.
|
2.8%
|
|
Amgen, Inc.
|
2.6%
|
|
TotalEnergies SE
|
2.6%
|
|
Motorola Solutions, Inc.
|
2.6%
|
|
Ameriprise Financial, Inc.
|
2.5%
|
Sector Breakdown (%)**

Changes to Fund’s Principal Risks:
In the Fund’s Principal Risks, Liquidity Risk and Securities Lending Risk were added and Information Technology Sector Risk was removed.
Changes to the Fund’s Principal Investment Strategy:
The Fund’s Principal Investment Strategies were revised to note that the Fund may lend its portfolio securities to generate additional income.
This report describes changes to the Fund that occurred during the reporting period.
WHAT WERE THE FUND COSTS FOR THE PAST YEAR? (based on a hypothetical $10,000 investment)
|
Class Name
|
Costs of a $10,000 investment
|
Costs paid as a percentage of a $10,000 investment
|
|
Class I
|
$72
|
0.69%
|
HOW DID THE FUND PERFORM LAST YEAR AND WHAT AFFECTED ITS PERFORMANCE?
|
•
|
For the 12-month period ended March 31, 2026, the Fund underperformed its primary and secondary performance benchmarks, the Russell 1000 Value Index and the S&P 500 Index, respectively. The Fund invests at least 80% of its assets in equity securities.
|
|
•
|
The performance explanation is provided relative to the primary benchmark, the Russell 1000 Value Index. The underperformance of the Fund relative to the Russell 1000 Value Index over the 1-year period came from security selection while sector allocation contributed.
|
|
•
|
Security selection in the information technology and consumer discretionary sectors detracted the most from relative performance. Conversely, security selection in the communication services and industrials sectors added the most value.
|
|
•
|
Top contributors Parker Hannifin, TotalEnergies and Corteva benefited from resilient industrial demand, supportive energy markets and stable agricultural fundamentals, respectively, while detractors including Lennar, Adobe and Sony were impacted by elevated interest rates and affordability pressures, moderating software growth expectations and softer consumer demand.
|
|
•
|
From a sector allocation standpoint, an underweight position in the industrials and energy sectors detracted from relative performance. An overweight exposure to the information technology and materials sectors added value.
|
|
•
|
During the 12-month period, a number of benchmark constituents, particularly within semiconductor and related industries, generated exceptionally strong returns, in some cases far exceeding broader market performance. The top detractor not owned in the portfolio was Micron Technologies, a leading manufacturer of semiconductor memory and storage solutions.
|
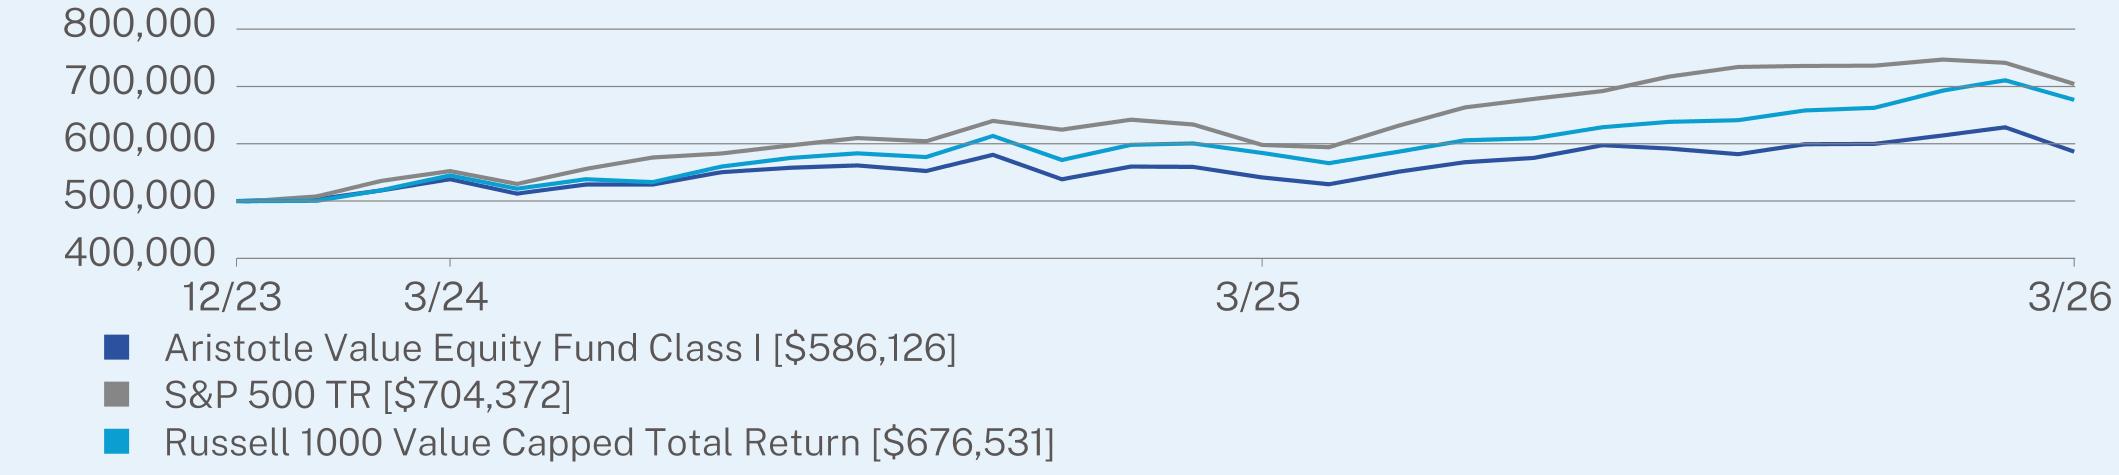
ANNUAL AVERAGE TOTAL RETURN (%)
|
|
1 Year
|
Since Inception
(12/26/2023) |
|
Class I (without sales charge)
|
8.30
|
7.28
|
|
S&P 500 TR
|
17.80
|
16.35
|
|
Russell 1000 Value Capped Total Return
|
15.87
|
14.30
|
Visit https://www.aristotlefunds.com/resources/prospectuses-reports for more recent performance information.
KEY FUND STATISTICS (as of March 31, 2026)
|
Net Assets
|
$481,166,309
|
|
Number of Holdings
|
46
|
|
Net Advisory Fee
|
$2,905,467
|
|
Portfolio Turnover Rate
|
18%
|
WHAT DID THE FUND INVEST IN? (as of March 31, 2026)*
|
Top 10 Issuers
|
(%)
|
|
Parker-Hannifin Corp.
|
4.7%
|
|
Corteva, Inc.
|
3.9%
|
|
Alphabet, Inc.
|
3.6%
|
|
Microsoft Corp.
|
3.2%
|
|
Capital One Financial Corp.
|
3.1%
|
|
Martin Marietta Materials, Inc.
|
2.8%
|
|
Amgen, Inc.
|
2.6%
|
|
TotalEnergies SE
|
2.6%
|
|
Motorola Solutions, Inc.
|
2.6%
|
|
Ameriprise Financial, Inc.
|
2.5%
|
Sector Breakdown (%)**
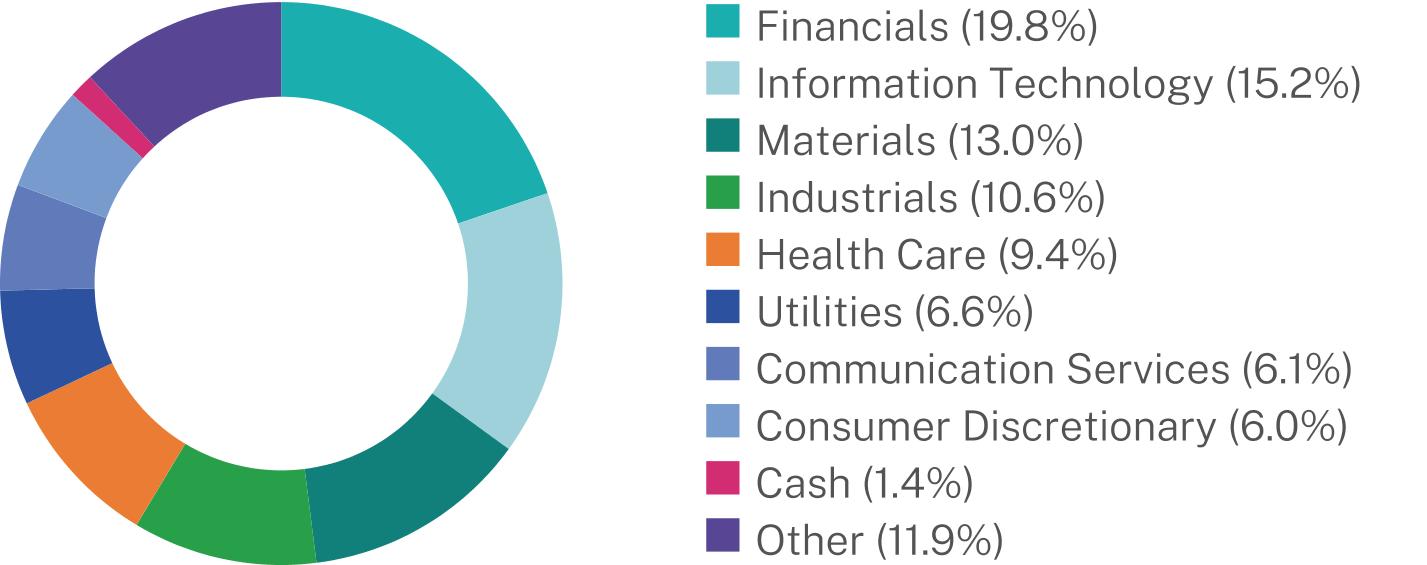
Changes to Fund’s Principal Risks:
In the Fund’s Principal Risks, Liquidity Risk and Securities Lending Risk were added and Information Technology Sector Risk was removed.
Changes to the Fund’s Principal Investment Strategy:
The Fund’s Principal Investment Strategies were revised to note that the Fund may lend its portfolio securities to generate additional income.
This report describes changes to the Fund that occurred during the reporting period.
WHAT WERE THE FUND COSTS FOR THE PAST YEAR? (based on a hypothetical $10,000 investment)
|
Class Name
|
Costs of a $10,000 investment
|
Costs paid as a percentage of a $10,000 investment
|
|
Class I-2
|
$72
|
0.69%
|
HOW DID THE FUND PERFORM LAST YEAR AND WHAT AFFECTED ITS PERFORMANCE?
|
•
|
For the 12-month period ended March 31, 2026, the Fund underperformed its primary and secondary performance benchmarks, the Russell 1000 Value Index and the S&P 500 Index, respectively. The Fund invests at least 80% of its assets in equity securities.
|
|
•
|
The performance explanation is provided relative to the primary benchmark, the Russell 1000 Value Index. The underperformance of the Fund relative to the Russell 1000 Value Index over the 1-year period came from security selection while sector allocation contributed.
|
|
•
|
Security selection in the information technology and consumer discretionary sectors detracted the most from relative performance. Conversely, security selection in the communication services and industrials sectors added the most value.
|
|
•
|
Top contributors Parker Hannifin, TotalEnergies and Corteva benefited from resilient industrial demand, supportive energy markets and stable agricultural fundamentals, respectively, while detractors including Lennar, Adobe and Sony were impacted by elevated interest rates and affordability pressures, moderating software growth expectations and softer consumer demand.
|
|
•
|
From a sector allocation standpoint, an underweight position in the industrials and energy sectors detracted from relative performance. An overweight exposure to the information technology and materials sectors added value.
|
|
•
|
During the 12-month period, a number of benchmark constituents, particularly within semiconductor and related industries, generated exceptionally strong returns, in some cases far exceeding broader market performance. The top detractor not owned in the portfolio was Micron Technologies, a leading manufacturer of semiconductor memory and storage solutions.
|
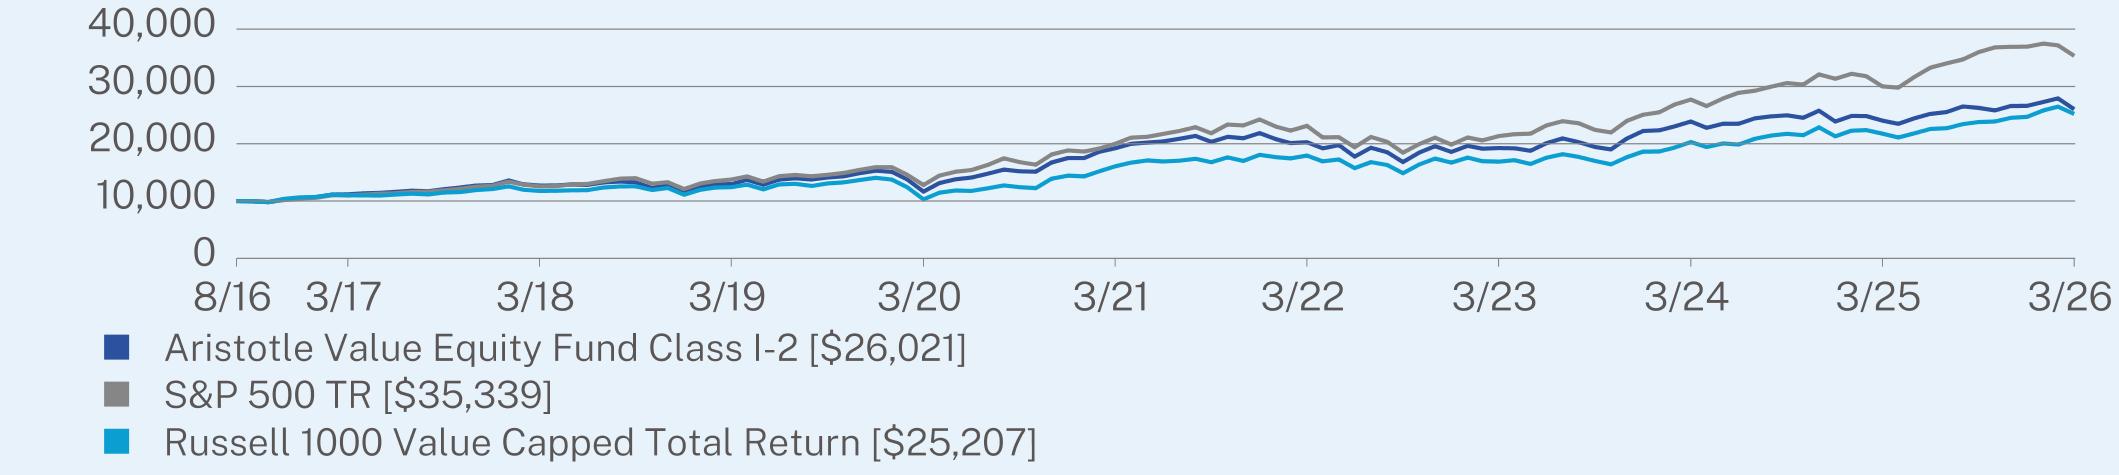
ANNUAL AVERAGE TOTAL RETURN (%)
|
|
1 Year
|
5 Year
|
Since Inception
(08/31/2016) |
|
Class I-2 (without sales charge)
|
8.29
|
6.24
|
10.50
|
|
S&P 500 TR
|
17.80
|
12.06
|
14.08
|
|
Russell 1000 Value Capped Total Return
|
15.87
|
9.43
|
10.13
|
Visit https://www.aristotlefunds.com/resources/prospectuses-reports for more recent performance information.
KEY FUND STATISTICS (as of March 31, 2026)
|
Net Assets
|
$481,166,309
|
|
Number of Holdings
|
46
|
|
Net Advisory Fee
|
$2,905,467
|
|
Portfolio Turnover Rate
|
18%
|
WHAT DID THE FUND INVEST IN? (as of March 31, 2026)*
|
Top 10 Issuers
|
(%)
|
|
Parker-Hannifin Corp.
|
4.7%
|
|
Corteva, Inc.
|
3.9%
|
|
Alphabet, Inc.
|
3.6%
|
|
Microsoft Corp.
|
3.2%
|
|
Capital One Financial Corp.
|
3.1%
|
|
Martin Marietta Materials, Inc.
|
2.8%
|
|
Amgen, Inc.
|
2.6%
|
|
TotalEnergies SE
|
2.6%
|
|
Motorola Solutions, Inc.
|
2.6%
|
|
Ameriprise Financial, Inc.
|
2.5%
|
Sector Breakdown (%)**

Changes to Fund’s Principal Risks:
In the Fund’s Principal Risks, Liquidity Risk and Securities Lending Risk were added and Information Technology Sector Risk was removed.
Changes to the Fund’s Principal Investment Strategy:
The Fund’s Principal Investment Strategies were revised to note that the Fund may lend its portfolio securities to generate additional income.
This report describes changes to the Fund that occurred during the reporting period.
WHAT WERE THE FUND COSTS FOR THE PAST YEAR? (based on a hypothetical $10,000 investment)
|
Class Name
|
Costs of a $10,000 investment
|
Costs paid as a percentage of a $10,000 investment
|
|
Class R6
|
$64
|
0.61%
|
HOW DID THE FUND PERFORM LAST YEAR AND WHAT AFFECTED ITS PERFORMANCE?
|
•
|
For the 12-month period ended March 31, 2026, the Fund underperformed its primary and secondary performance benchmarks, the Russell 1000 Value Index and the S&P 500 Index, respectively. The Fund invests at least 80% of its assets in equity securities.
|
|
•
|
The performance explanation is provided relative to the primary benchmark, the Russell 1000 Value Index. The underperformance of the Fund relative to the Russell 1000 Value Index over the 1-year period came from security selection while sector allocation contributed.
|
|
•
|
Security selection in the information technology and consumer discretionary sectors detracted the most from relative performance. Conversely, security selection in the communication services and industrials sectors added the most value.
|
|
•
|
Top contributors Parker Hannifin, TotalEnergies and Corteva benefited from resilient industrial demand, supportive energy markets and stable agricultural fundamentals, respectively, while detractors including Lennar, Adobe and Sony were impacted by elevated interest rates and affordability pressures, moderating software growth expectations and softer consumer demand.
|
|
•
|
From a sector allocation standpoint, an underweight position in the industrials and energy sectors detracted from relative performance. An overweight exposure to the information technology and materials sectors added value.
|
|
•
|
During the 12-month period, a number of benchmark constituents, particularly within semiconductor and related industries, generated exceptionally strong returns, in some cases far exceeding broader market performance. The top detractor not owned in the portfolio was Micron Technologies, a leading manufacturer of semiconductor memory and storage solutions.
|
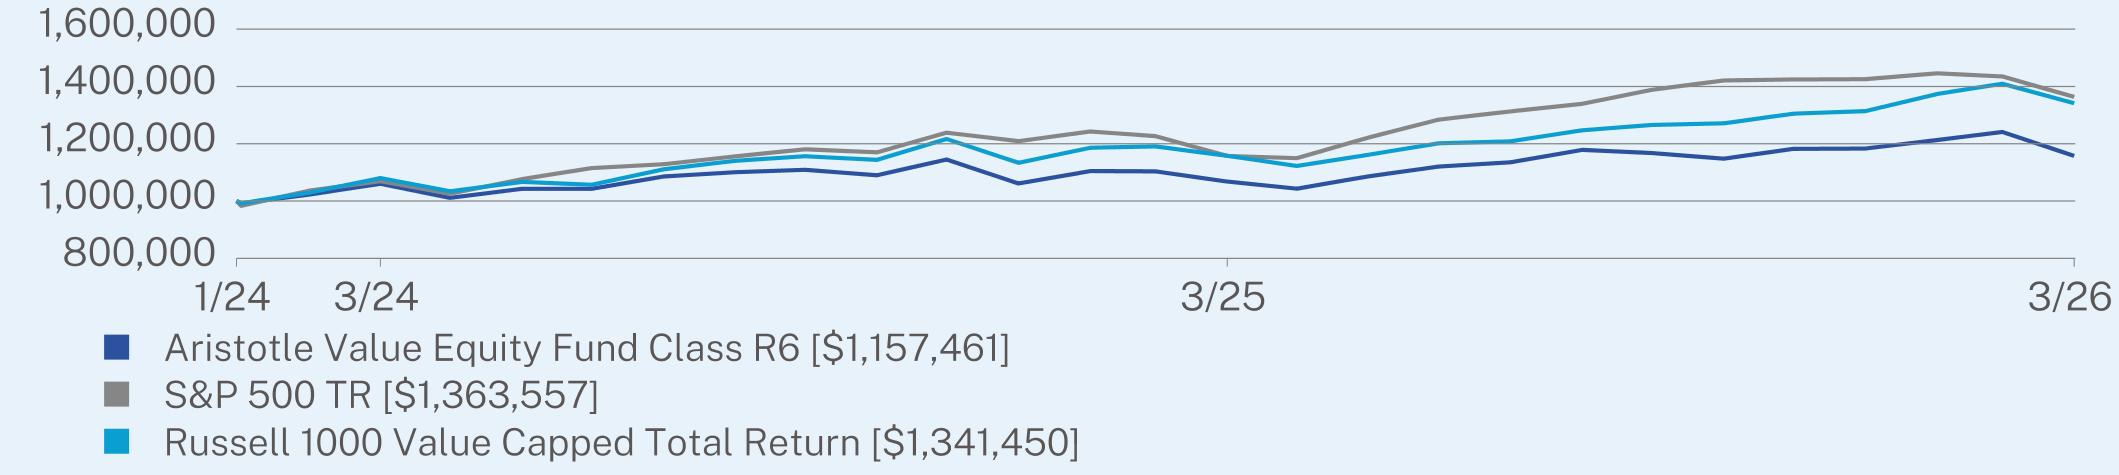
ANNUAL AVERAGE TOTAL RETURN (%)
|
|
1 Year
|
Since Inception
(01/29/2024) |
|
Class R6 (without sales charge)
|
8.39
|
6.97
|
|
S&P 500 TR
|
17.80
|
15.36
|
|
Russell 1000 Value Capped Total Return
|
15.87
|
14.50
|
Visit https://www.aristotlefunds.com/resources/prospectuses-reports for more recent performance information.
KEY FUND STATISTICS (as of March 31, 2026)
|
Net Assets
|
$481,166,309
|
|
Number of Holdings
|
46
|
|
Net Advisory Fee
|
$2,905,467
|
|
Portfolio Turnover Rate
|
18%
|
WHAT DID THE FUND INVEST IN? (as of March 31, 2026)*
|
Top 10 Issuers
|
(%)
|
|
Parker-Hannifin Corp.
|
4.7%
|
|
Corteva, Inc.
|
3.9%
|
|
Alphabet, Inc.
|
3.6%
|
|
Microsoft Corp.
|
3.2%
|
|
Capital One Financial Corp.
|
3.1%
|
|
Martin Marietta Materials, Inc.
|
2.8%
|
|
Amgen, Inc.
|
2.6%
|
|
TotalEnergies SE
|
2.6%
|
|
Motorola Solutions, Inc.
|
2.6%
|
|
Ameriprise Financial, Inc.
|
2.5%
|
Sector Breakdown (%)**

Changes to Fund’s Principal Risks:
In the Fund’s Principal Risks, Liquidity Risk and Securities Lending Risk were added and Information Technology Sector Risk was removed.
Changes to the Fund’s Principal Investment Strategy:
The Fund’s Principal Investment Strategies were revised to note that the Fund may lend its portfolio securities to generate additional income.
This report describes changes to the Fund that occurred during the reporting period.
WHAT WERE THE FUND COSTS FOR THE PAST YEAR? (based on a hypothetical $10,000 investment)
|
Class Name
|
Costs of a $10,000 investment
|
Costs paid as a percentage of a $10,000 investment
|
|
Class I-2
|
$85
|
0.79%
|
HOW DID THE FUND PERFORM LAST YEAR AND WHAT AFFECTED ITS PERFORMANCE?
|
•
|
For the 12-month period ended March 31, 2026, the Fund underperformed its primary and secondary performance benchmarks, the MSCI ACWI Index (net) and the MSCI World Index (net), respectively. The Fund invests at least 80% of its assets in equity securities that are listed on an exchange or that are otherwise publicly traded in the United States or in a foreign country.
|
|
•
|
The performance explanation is provided relative to the primary benchmark, the MSCI ACWI Index (net). The underperformance of the Fund relative to the MSCI ACWI Index (net) over the 1-year period came primarily from security selection, although sector allocation also detracted value.
|
|
•
|
Security selection in the information technology and materials sectors detracted the most. On the other hand, security selection in the financials and energy sectors added the most. Exposure to MonotaRO, Lennar and Nemetschek detracted from relative returns. Meanwhile, Cameco, Samsung Electronics and FirstCash Holdings were the top contributors to relative performance for the year.
|
|
•
|
Key large benchmark constituents not owned by the Fund benefitted from continued investment in artificial intelligence (AI) infrastructure. NVIDIA, Taiwan Semiconductor Manufacturing and Broadcom generated strong returns during the period, representing a meaningful headwind to relative performance. These companies accounted for a significant portion of index gains as demand for AI-related semiconductors and components remained strong.
|
|
•
|
From a sector allocation standpoint, an underweight position in the information technology sector and an overweight position in the healthcare sector detracted from relative performance. An overweight exposure to the energy and materials sectors added value.
|
|
•
|
By geography, selection in the U.S. and Japan detracted returns whereas selection in Canada and Asia ex-Japan contributed to returns.
|
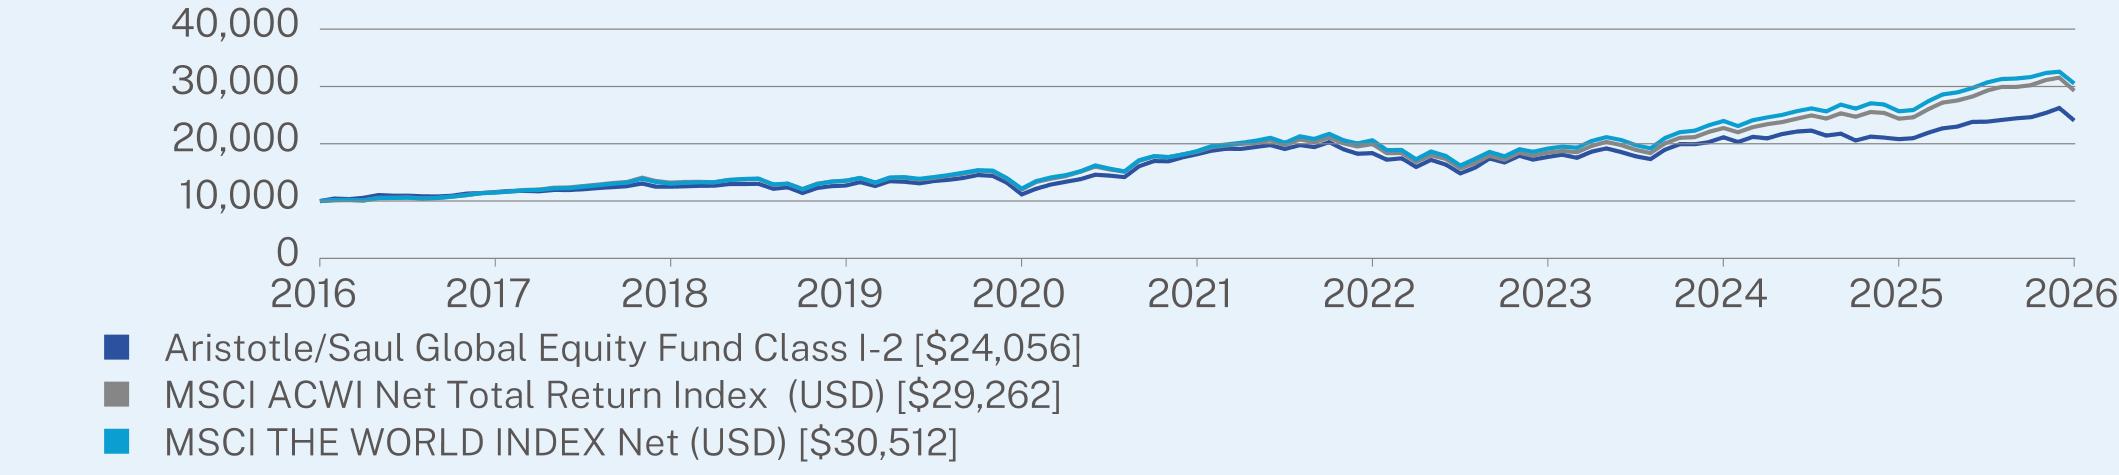
ANNUAL AVERAGE TOTAL RETURN (%)
|
|
1 Year
|
5 Year
|
10 Year
|
|
Class I-2 (without sales charge)
|
15.61
|
5.77
|
9.17
|
|
MSCI ACWI Net Total Return Index (USD)
|
20.01
|
9.49
|
11.33
|
|
MSCI THE WORLD INDEX Net (USD)
|
18.90
|
10.27
|
11.80
|
Visit https://www.aristotlefunds.com/resources/prospectuses-reports for more recent performance information.
KEY FUND STATISTICS (as of March 31, 2026)
|
Net Assets
|
$28,725,554
|
|
Number of Holdings
|
49
|
|
Net Advisory Fee
|
$183,834
|
|
Portfolio Turnover Rate
|
10%
|
WHAT DID THE FUND INVEST IN? (as of March 31, 2026)*
|
Top 10 Issuers
|
(%)
|
|
Samsung Electronics Co. Ltd.
|
3.6%
|
|
FirstCash Holdings, Inc.
|
3.5%
|
|
TotalEnergies SE
|
3.5%
|
|
Muenchener Rueckversicherungs-Gesellschaft AG in Muenchen
|
3.3%
|
|
DBS Group Holdings Ltd.
|
3.3%
|
|
Alphabet, Inc.
|
3.1%
|
|
Martin Marietta Materials, Inc.
|
2.9%
|
|
Microsoft Corp.
|
2.9%
|
|
Otsuka Holdings Co. Ltd.
|
2.9%
|
|
Amgen, Inc.
|
2.5%
|
Sector Breakdown (%)**
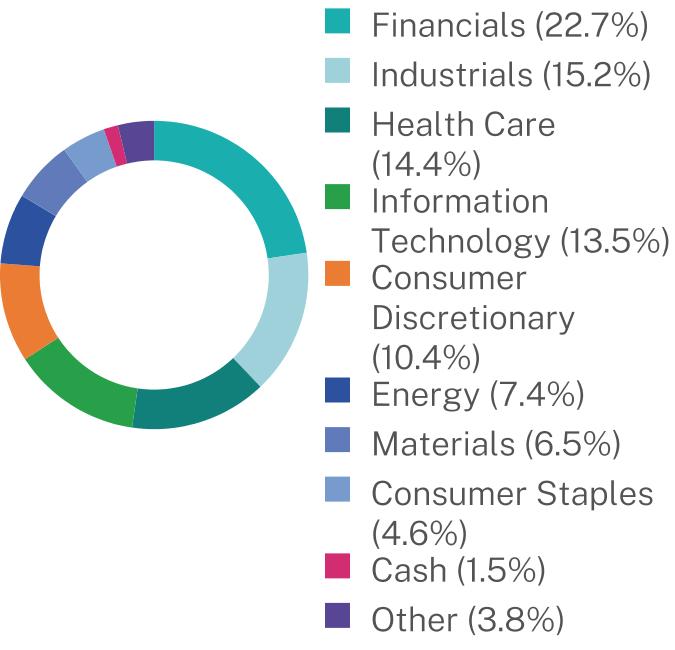
|
Top Ten Countries
|
(%)
|
|
United States
|
42.2%
|
|
Japan
|
17.3%
|
|
Germany
|
5.7%
|
|
France
|
4.6%
|
|
Canada
|
4.4%
|
|
United Kingdom
|
3.7%
|
|
Ireland
|
3.6%
|
|
South Korea
|
3.6%
|
|
Cash
|
1.5%
|
|
Other
|
13.4%
|
Changes to Fund’s Principal Risks:
In the Fund’s Principal Risks, Securities Lending Risk was added and Information Technology Sector Risk was removed.
Changes to the Fund’s Principal Investment Strategy:
The Fund’s Principal Investment Strategies were revised to note that the Fund may lend its portfolio securities to generate additional income.
| [1] |
|
||
| [2] |
|
||
| [3] |
|
||
| [4] |
|
||
| [5] |
|
||
| [6] |
|
||
| [7] |
|
||
| [8] |
|
||
| [9] |
|
||
| [10] |
|
||
| [11] |
|
||
| [12] |
|
||
| [13] |
|
||
| [14] |
|
||
| [15] |
|
||
| [16] |
|
||
| [17] |
|
||
| [18] |
|
||
| [19] |
|
||
| [20] |
|
||
| [21] |
|
||
| [22] |
|
||
| [23] |
|
||
| [24] |
|
||
| [25] |
|
||
| [26] |
|
||
| [27] |
|
||
| [28] |
|
||
| [29] |
|
||
| [30] |
|
||
| [31] |
|
||
| [32] |
|
||
| [33] |
|
||
| [34] |
|
||
| [35] |
|
||
| [36] |
|
||
| [37] |
|
||
| [38] |
|
||
| [39] |
|
||
| [40] |
|
||
| [41] |
|
||
| [42] |
|
||
| [43] |
|
||
| [44] |
|
||
| [45] |
|
||
| [46] |
|
||
| [47] |
|
||
| [48] |
|
||
| [49] |
|
||
| [50] |
|
||
| [51] |
|
||
| [52] |
|
||
| [53] |
|
||
| [54] |
|
||
| [55] |
|
||
| [56] |
|
||
| [57] |
|
||
| [58] |
|
||
| [59] |
|
||
| [60] |
|
||
| [61] |
|
||
| [62] |
|
||
| [63] |
|
||
| [64] |
|
||
| [65] |
|
||
| [66] |
|
||
| [67] |
|
||
| [68] |
|
||
| [69] |
|
||
| [70] |
|
||
| [71] |
|
||
| [72] |
|
||
| [73] |
|
||
| [74] |
|
||
| [75] |
|
||
| [76] |
|
||
| [77] |
|
||
| [78] |
|
||
| [79] |
|
||
| [80] |
|
||
| [81] |
|
||
| [82] |
|
||
| [83] |
|
||
| [84] |
|
||
| [85] |
|
||
| [86] |
|
||
| [87] |
|
||
| [88] |
|
||
| [89] |
|
||
| [90] |
|
||
| [91] |
|
||
| [92] |
|
||
| [93] |
|
||
| [94] |
|
||
| [95] |
|
||
| [96] |
|
||
| [97] |
|
||
| [98] |
|
||
| [99] |
|
||
| [100] |
|
||
| [101] |
|
||
| [102] |
|
||
| [103] |
|
||
| [104] |
|
||
| [105] |
|
||
| [106] |
|
||
| [107] |
|
||
| [108] |
|
||
| [109] |
|
||
| [110] |
|
||
| [111] |
|
||
| [112] |
|
||
| [113] |
|
||
| [114] |
|
||
| [115] |
|
||
| [116] |
|
||
| [117] |
|
||
| [118] |
|
||
| [119] |
|
||
| [120] |
|
||
| [121] |
|
||
| [122] |
|