Shareholder Report
|
6 Months Ended |
|
Mar. 31, 2026
USD ($)
Holding
|
|---|
| Shareholder Report [Line Items] |
|
|
| Document Type |
N-CSRS
|
|
| Amendment Flag |
false
|
|
| Registrant Name |
Northern Lights Fund Trust III
|
|
| Entity Central Index Key |
0001537140
|
|
| Entity Investment Company Type |
N-1A
|
|
| Document Period End Date |
Mar. 31, 2026
|
|
| Shareholder Report Annual or Semi-Annual |
Semi-Annual Shareholder Report
|
|
| C000161620 |
|
|
| Shareholder Report [Line Items] |
|
|
| Fund Name |
Counterpoint Tactical Equity Fund
|
|
| Class Name |
Class A
|
|
| Trading Symbol |
CPAEX
|
|
| Annual or Semi-Annual Statement [Text Block] |
This semi-annual shareholder report contains important information about Counterpoint Tactical Equity Fund for the period of October 1, 2025 to March 31, 2026.
|
|
| Additional Information [Text Block] |
You can find additional information about the Fund at https://counterpointfunds.com/resources/. You can also request this information by contacting us at 1-844-273-8637.
|
|
| Additional Information Phone Number |
1-844-273-8637
|
|
| Additional Information Website |
https://counterpointfunds.com/resources/
|
|
| Expenses [Text Block] |
What were the Fund’s costs for the last six months?(based on a hypothetical $10,000 investment) Table SummaryClass Name | Costs of a $10,000 investment | Costs paid as a percentage of a $10,000 investment |
|---|
Class A | $81 | 1.64%Footnote Reference* |
|---|
| Footnote | Description | Footnote* | Annualized |
|
|
| Expenses Paid, Amount |
$ 81
|
|
| Expense Ratio, Percent |
1.64%
|
[1] |
| AssetsNet |
$ 597,085,540
|
|
| Holdings Count | Holding |
295
|
|
| Advisory Fees Paid, Amount |
$ 3,212,201
|
|
| InvestmentCompanyPortfolioTurnover |
145.00%
|
|
| Additional Fund Statistics [Text Block] |
Table SummaryNet Assets | $597,085,540 |
|---|
Number of Portfolio Holdings | 295 |
|---|
Advisory Fee (net of waivers) | $3,212,201 |
|---|
Portfolio Turnover | 145% |
|---|
|
|
| Holdings [Text Block] |
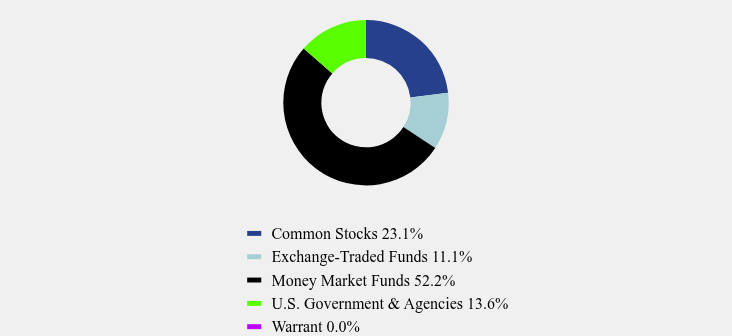
Asset Weighting (% of total investments)Table SummaryValue | Value |
|---|
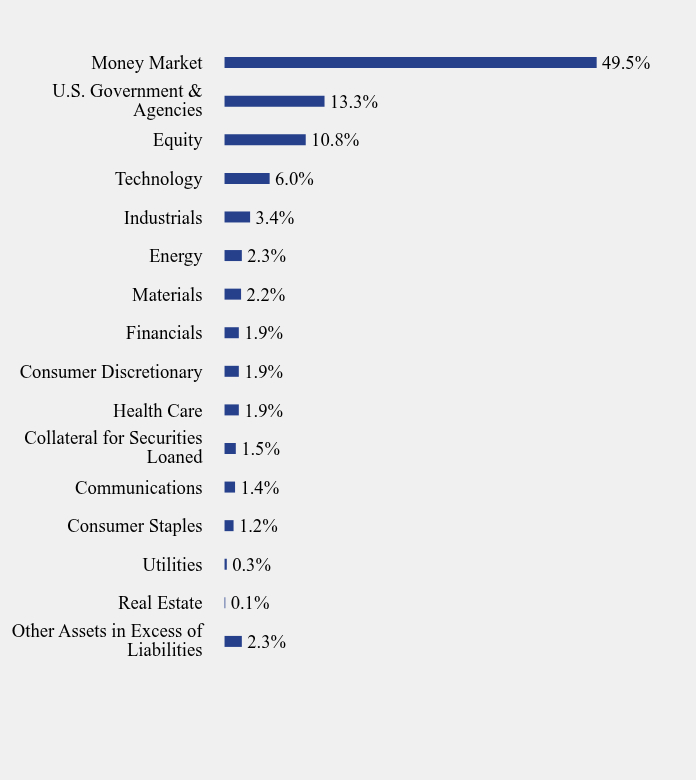
Common Stocks | 23.1% | Exchange-Traded Funds | 11.1% | Money Market Funds | 52.2% | U.S. Government & Agencies | 13.6% | Warrant | 0.0% | Sector Weighting (% of net assets)Table SummaryValue | Value |
|---|
Other Assets in Excess of Liabilities | 2.3% | Real Estate | 0.1% | Utilities | 0.3% | Consumer Staples | 1.2% | Communications | 1.4% | Collateral for Securities Loaned | 1.5% | Health Care | 1.9% | Consumer Discretionary | 1.9% | Financials | 1.9% | Materials | 2.2% | Energy | 2.3% | Industrials | 3.4% | Technology | 6.0% | Equity | 10.8% | U.S. Government & Agencies | 13.3% | Money Market | 49.5% | Top 10 Holdings (% of net assets)Table SummaryHolding Name | % of Net Assets |
|---|
Fidelity Treasury Portfolio, Class I | 49.5% |
|---|
Counterpoint Quantitative Equity ETF | 10.8% |
|---|
United States Treasury Bill, 3.610%, 06/04/26 | 8.3% |
|---|
United States Treasury Bill, 3.535%, 09/03/26 | 5.0% |
|---|
Dreyfus Treasury Obligations Cash Management Fund, Institutional Class | 1.5% |
|---|
JP Morgan International Long/Short Index Basket 2, 1/21/27 | 0.9% |
|---|
JP Morgan International Long/Short Index Basket 3, 1/21/27 | 0.5% |
|---|
JP Morgan International Long/Short Index Basket, 1/21/27 | 0.5% |
|---|
JP Morgan U.S. Short Index Basket, 1/21/27 | 0.3% |
|---|
Morgan Stanley U.S. Counterpoint Index, 4/8/27 | 0.3% |
|---|
|
|
| C000161621 |
|
|
| Shareholder Report [Line Items] |
|
|
| Fund Name |
Counterpoint Tactical Equity Fund
|
|
| Class Name |
Class C
|
|
| Trading Symbol |
CPCEX
|
|
| Annual or Semi-Annual Statement [Text Block] |
This semi-annual shareholder report contains important information about Counterpoint Tactical Equity Fund for the period of October 1, 2025 to March 31, 2026.
|
|
| Additional Information [Text Block] |
You can find additional information about the Fund at https://counterpointfunds.com/resources/. You can also request this information by contacting us at 1-844-273-8637.
|
|
| Additional Information Phone Number |
1-844-273-8637
|
|
| Additional Information Website |
https://counterpointfunds.com/resources/
|
|
| Expenses [Text Block] |
What were the Fund’s costs for the last six months?(based on a hypothetical $10,000 investment) Table SummaryClass Name | Costs of a $10,000 investment | Costs paid as a percentage of a $10,000 investment |
|---|
Class C | $118 | 2.39%Footnote Reference* |
|---|
| Footnote | Description | Footnote* | Annualized |
|
|
| Expenses Paid, Amount |
$ 118
|
|
| Expense Ratio, Percent |
2.39%
|
[2] |
| AssetsNet |
$ 597,085,540
|
|
| Holdings Count | Holding |
295
|
|
| Advisory Fees Paid, Amount |
$ 3,212,201
|
|
| InvestmentCompanyPortfolioTurnover |
145.00%
|
|
| Additional Fund Statistics [Text Block] |
Table SummaryNet Assets | $597,085,540 |
|---|
Number of Portfolio Holdings | 295 |
|---|
Advisory Fee (net of waivers) | $3,212,201 |
|---|
Portfolio Turnover | 145% |
|---|
|
|
| Holdings [Text Block] |
Asset Weighting (% of total investments)Table SummaryValue | Value |
|---|
Common Stocks | 23.1% | Exchange-Traded Funds | 11.1% | Money Market Funds | 52.2% | U.S. Government & Agencies | 13.6% | Warrant | 0.0% | Sector Weighting (% of net assets)Table SummaryValue | Value |
|---|
Other Assets in Excess of Liabilities | 2.3% | Real Estate | 0.1% | Utilities | 0.3% | Consumer Staples | 1.2% | Communications | 1.4% | Collateral for Securities Loaned | 1.5% | Health Care | 1.9% | Consumer Discretionary | 1.9% | Financials | 1.9% | Materials | 2.2% | Energy | 2.3% | Industrials | 3.4% | Technology | 6.0% | Equity | 10.8% | U.S. Government & Agencies | 13.3% | Money Market | 49.5% | Top 10 Holdings (% of net assets)Table SummaryHolding Name | % of Net Assets |
|---|
Fidelity Treasury Portfolio, Class I | 49.5% |
|---|
Counterpoint Quantitative Equity ETF | 10.8% |
|---|
United States Treasury Bill, 3.610%, 06/04/26 | 8.3% |
|---|
United States Treasury Bill, 3.535%, 09/03/26 | 5.0% |
|---|
Dreyfus Treasury Obligations Cash Management Fund, Institutional Class | 1.5% |
|---|
JP Morgan International Long/Short Index Basket 2, 1/21/27 | 0.9% |
|---|
JP Morgan International Long/Short Index Basket 3, 1/21/27 | 0.5% |
|---|
JP Morgan International Long/Short Index Basket, 1/21/27 | 0.5% |
|---|
JP Morgan U.S. Short Index Basket, 1/21/27 | 0.3% |
|---|
Morgan Stanley U.S. Counterpoint Index, 4/8/27 | 0.3% |
|---|
|
|
| C000161622 |
|
|
| Shareholder Report [Line Items] |
|
|
| Fund Name |
Counterpoint Tactical Equity Fund
|
|
| Class Name |
Class I
|
|
| Trading Symbol |
CPIEX
|
|
| Annual or Semi-Annual Statement [Text Block] |
This semi-annual shareholder report contains important information about Counterpoint Tactical Equity Fund for the period of October 1, 2025 to March 31, 2026.
|
|
| Additional Information [Text Block] |
You can find additional information about the Fund at https://counterpointfunds.com/resources/. You can also request this information by contacting us at 1-844-273-8637.
|
|
| Additional Information Phone Number |
1-844-273-8637
|
|
| Additional Information Website |
https://counterpointfunds.com/resources/
|
|
| Expenses [Text Block] |
What were the Fund’s costs for the last six months?(based on a hypothetical $10,000 investment) Table SummaryClass Name | Costs of a $10,000 investment | Costs paid as a percentage of a $10,000 investment |
|---|
Class I | $69 | 1.39%Footnote Reference* |
|---|
| Footnote | Description | Footnote* | Annualized |
|
|
| Expenses Paid, Amount |
$ 69
|
|
| Expense Ratio, Percent |
1.39%
|
[3] |
| AssetsNet |
$ 597,085,540
|
|
| Holdings Count | Holding |
295
|
|
| Advisory Fees Paid, Amount |
$ 3,212,201
|
|
| InvestmentCompanyPortfolioTurnover |
145.00%
|
|
| Additional Fund Statistics [Text Block] |
Table SummaryNet Assets | $597,085,540 |
|---|
Number of Portfolio Holdings | 295 |
|---|
Advisory Fee (net of waivers) | $3,212,201 |
|---|
Portfolio Turnover | 145% |
|---|
|
|
| Holdings [Text Block] |
Asset Weighting (% of total investments)Table SummaryValue | Value |
|---|
Common Stocks | 23.1% | Exchange-Traded Funds | 11.1% | Money Market Funds | 52.2% | U.S. Government & Agencies | 13.6% | Warrant | 0.0% | Sector Weighting (% of net assets)Table SummaryValue | Value |
|---|
Other Assets in Excess of Liabilities | 2.3% | Real Estate | 0.1% | Utilities | 0.3% | Consumer Staples | 1.2% | Communications | 1.4% | Collateral for Securities Loaned | 1.5% | Health Care | 1.9% | Consumer Discretionary | 1.9% | Financials | 1.9% | Materials | 2.2% | Energy | 2.3% | Industrials | 3.4% | Technology | 6.0% | Equity | 10.8% | U.S. Government & Agencies | 13.3% | Money Market | 49.5% | Top 10 Holdings (% of net assets)Table SummaryHolding Name | % of Net Assets |
|---|
Fidelity Treasury Portfolio, Class I | 49.5% |
|---|
Counterpoint Quantitative Equity ETF | 10.8% |
|---|
United States Treasury Bill, 3.610%, 06/04/26 | 8.3% |
|---|
United States Treasury Bill, 3.535%, 09/03/26 | 5.0% |
|---|
Dreyfus Treasury Obligations Cash Management Fund, Institutional Class | 1.5% |
|---|
JP Morgan International Long/Short Index Basket 2, 1/21/27 | 0.9% |
|---|
JP Morgan International Long/Short Index Basket 3, 1/21/27 | 0.5% |
|---|
JP Morgan International Long/Short Index Basket, 1/21/27 | 0.5% |
|---|
JP Morgan U.S. Short Index Basket, 1/21/27 | 0.3% |
|---|
Morgan Stanley U.S. Counterpoint Index, 4/8/27 | 0.3% |
|---|
|
|
| C000146567 |
|
|
| Shareholder Report [Line Items] |
|
|
| Fund Name |
Counterpoint Tactical Income Fund
|
|
| Class Name |
Class A
|
|
| Trading Symbol |
CPATX
|
|
| Annual or Semi-Annual Statement [Text Block] |
This semi-annual shareholder report contains important information about Counterpoint Tactical Income Fund for the period of October 1, 2025 to March 31, 2026.
|
|
| Additional Information [Text Block] |
You can find additional information about the Fund at https://counterpointfunds.com/resources/. You can also request this information by contacting us at 1-844-273-8637.
|
|
| Additional Information Phone Number |
1-844-273-8637
|
|
| Additional Information Website |
https://counterpointfunds.com/resources/
|
|
| Expenses [Text Block] |
What were the Fund’s costs for the last six months?(based on a hypothetical $10,000 investment) Table SummaryClass Name | Costs of a $10,000 investment | Costs paid as a percentage of a $10,000 investment |
|---|
Class A | $84 | 1.68%Footnote Reference* |
|---|
| Footnote | Description | Footnote* | Annualized |
|
|
| Expenses Paid, Amount |
$ 84
|
|
| Expense Ratio, Percent |
1.68%
|
[4] |
| AssetsNet |
$ 1,932,934,028
|
|
| Holdings Count | Holding |
33
|
|
| Advisory Fees Paid, Amount |
$ 12,648,622
|
|
| InvestmentCompanyPortfolioTurnover |
5.00%
|
|
| Additional Fund Statistics [Text Block] |
Table SummaryNet Assets | $1,932,934,028 |
|---|
Number of Portfolio Holdings | 33 |
|---|
Advisory Fee (net of waivers) | $12,648,622 |
|---|
Portfolio Turnover | 5% |
|---|
|
|
| Holdings [Text Block] |
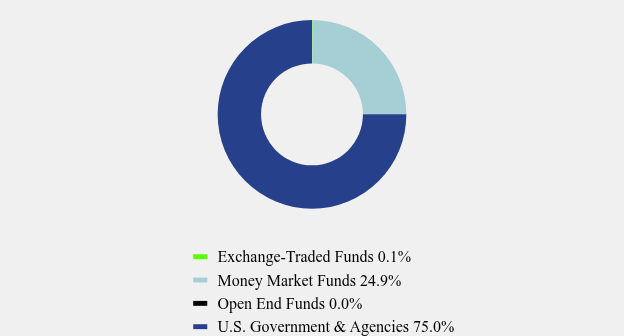
Asset Weighting (% of total investments)Table SummaryValue | Value |
|---|
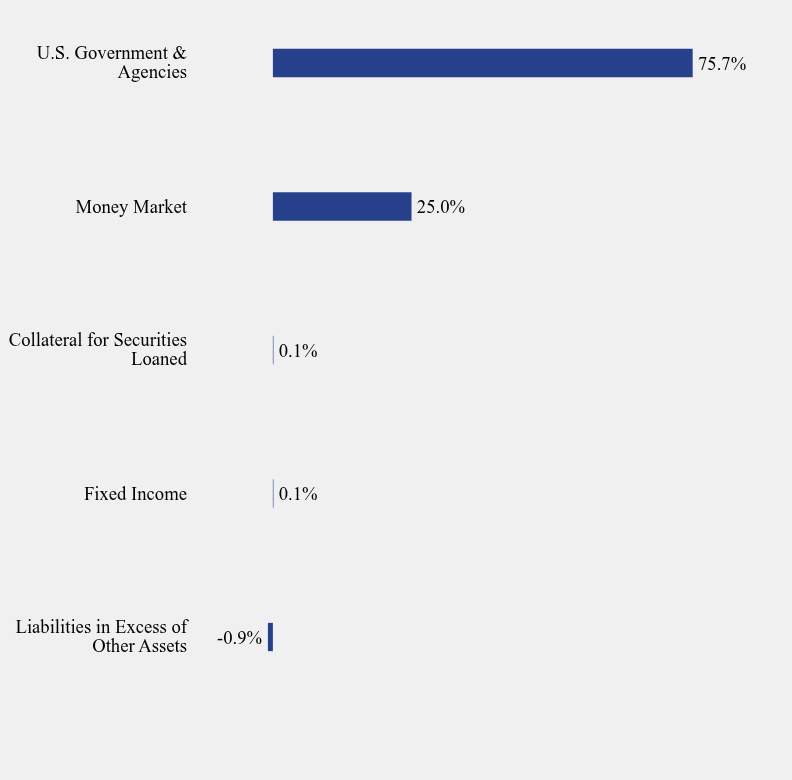
Exchange-Traded Funds | 0.1% | Money Market Funds | 24.9% | Open End Funds | 0.0% | U.S. Government & Agencies | 75.0% | Asset Weighting (% of net assets)Table SummaryValue | Value |
|---|
Liabilities in Excess of Other Assets | -0.9% | Fixed Income | 0.1% | Collateral for Securities Loaned | 0.1% | Money Market | 25.0% | U.S. Government & Agencies | 75.7% | Top 10 Holdings (% of net assets)Table SummaryHolding Name | % of Net Assets |
|---|
Goldman Sachs Financial Square Government Fund, Class FST | 24.7% |
|---|
United States Treasury Bill, 3.620%, 04/28/26 | 12.9% |
|---|
United States Treasury Bill, 3.630%, 05/26/26 | 12.9% |
|---|
United States Treasury Bill, 3.610%, 06/18/26 | 12.8% |
|---|
United States Treasury Bill, 3.610%, 07/21/26 | 12.8% |
|---|
United States Treasury Bill, 3.630%, 09/24/26 | 12.7% |
|---|
United States Treasury Note, 3.625%, 08/31/27 | 7.8% |
|---|
United States Treasury Bill, 3.535%, 09/03/26 | 3.8% |
|---|
Goldman Sachs Financial Square Treasury Instruments Fund, Capital Shares | 0.3% |
|---|
Counterpoint High Yield Trend ETF | 0.1% |
|---|
|
|
| C000146568 |
|
|
| Shareholder Report [Line Items] |
|
|
| Fund Name |
Counterpoint Tactical Income Fund
|
|
| Class Name |
Class C
|
|
| Trading Symbol |
CPCTX
|
|
| Annual or Semi-Annual Statement [Text Block] |
This semi-annual shareholder report contains important information about Counterpoint Tactical Income Fund for the period of October 1, 2025 to March 31, 2026.
|
|
| Additional Information [Text Block] |
You can find additional information about the Fund at https://counterpointfunds.com/resources/. You can also request this information by contacting us at 1-844-273-8637.
|
|
| Additional Information Phone Number |
1-844-273-8637
|
|
| Additional Information Website |
https://counterpointfunds.com/resources/
|
|
| Expenses [Text Block] |
What were the Fund’s costs for the last six months?(based on a hypothetical $10,000 investment) Table SummaryClass Name | Costs of a $10,000 investment | Costs paid as a percentage of a $10,000 investment |
|---|
Class C | $121 | 2.43%Footnote Reference* |
|---|
| Footnote | Description | Footnote* | Annualized |
|
|
| Expenses Paid, Amount |
$ 121
|
|
| Expense Ratio, Percent |
2.43%
|
[5] |
| AssetsNet |
$ 1,932,934,028
|
|
| Holdings Count | Holding |
33
|
|
| Advisory Fees Paid, Amount |
$ 12,648,622
|
|
| InvestmentCompanyPortfolioTurnover |
5.00%
|
|
| Additional Fund Statistics [Text Block] |
Table SummaryNet Assets | $1,932,934,028 |
|---|
Number of Portfolio Holdings | 33 |
|---|
Advisory Fee (net of waivers) | $12,648,622 |
|---|
Portfolio Turnover | 5% |
|---|
|
|
| Holdings [Text Block] |
Asset Weighting (% of total investments)Table SummaryValue | Value |
|---|
Exchange-Traded Funds | 0.1% | Money Market Funds | 24.9% | Open End Funds | 0.0% | U.S. Government & Agencies | 75.0% | Asset Weighting (% of net assets)Table SummaryValue | Value |
|---|
Liabilities in Excess of Other Assets | -0.9% | Fixed Income | 0.1% | Collateral for Securities Loaned | 0.1% | Money Market | 25.0% | U.S. Government & Agencies | 75.7% | Top 10 Holdings (% of net assets)Table SummaryHolding Name | % of Net Assets |
|---|
Goldman Sachs Financial Square Government Fund, Class FST | 24.7% |
|---|
United States Treasury Bill, 3.620%, 04/28/26 | 12.9% |
|---|
United States Treasury Bill, 3.630%, 05/26/26 | 12.9% |
|---|
United States Treasury Bill, 3.610%, 06/18/26 | 12.8% |
|---|
United States Treasury Bill, 3.610%, 07/21/26 | 12.8% |
|---|
United States Treasury Bill, 3.630%, 09/24/26 | 12.7% |
|---|
United States Treasury Note, 3.625%, 08/31/27 | 7.8% |
|---|
United States Treasury Bill, 3.535%, 09/03/26 | 3.8% |
|---|
Goldman Sachs Financial Square Treasury Instruments Fund, Capital Shares | 0.3% |
|---|
Counterpoint High Yield Trend ETF | 0.1% |
|---|
|
|
| C000146569 |
|
|
| Shareholder Report [Line Items] |
|
|
| Fund Name |
Counterpoint Tactical Income Fund
|
|
| Class Name |
Class I
|
|
| Trading Symbol |
CPITX
|
|
| Annual or Semi-Annual Statement [Text Block] |
This semi-annual shareholder report contains important information about Counterpoint Tactical Income Fund for the period of October 1, 2025 to March 31, 2026.
|
|
| Additional Information [Text Block] |
You can find additional information about the Fund at https://counterpointfunds.com/resources/. You can also request this information by contacting us at 1-844-273-8637.
|
|
| Additional Information Phone Number |
1-844-273-8637
|
|
| Additional Information Website |
https://counterpointfunds.com/resources/
|
|
| Expenses [Text Block] |
What were the Fund’s costs for the last six months?(based on a hypothetical $10,000 investment) Table SummaryClass Name | Costs of a $10,000 investment | Costs paid as a percentage of a $10,000 investment |
|---|
Class I | $71 | 1.43%Footnote Reference* |
|---|
| Footnote | Description | Footnote* | Annualized |
|
|
| Expenses Paid, Amount |
$ 71
|
|
| Expense Ratio, Percent |
1.43%
|
[6] |
| AssetsNet |
$ 1,932,934,028
|
|
| Holdings Count | Holding |
33
|
|
| Advisory Fees Paid, Amount |
$ 12,648,622
|
|
| InvestmentCompanyPortfolioTurnover |
5.00%
|
|
| Additional Fund Statistics [Text Block] |
Table SummaryNet Assets | $1,932,934,028 |
|---|
Number of Portfolio Holdings | 33 |
|---|
Advisory Fee (net of waivers) | $12,648,622 |
|---|
Portfolio Turnover | 5% |
|---|
|
|
| Holdings [Text Block] |
Asset Weighting (% of total investments)Table SummaryValue | Value |
|---|
Exchange-Traded Funds | 0.1% | Money Market Funds | 24.9% | Open End Funds | 0.0% | U.S. Government & Agencies | 75.0% | Asset Weighting (% of net assets)Table SummaryValue | Value |
|---|
Liabilities in Excess of Other Assets | -0.9% | Fixed Income | 0.1% | Collateral for Securities Loaned | 0.1% | Money Market | 25.0% | U.S. Government & Agencies | 75.7% | Top 10 Holdings (% of net assets)Table SummaryHolding Name | % of Net Assets |
|---|
Goldman Sachs Financial Square Government Fund, Class FST | 24.7% |
|---|
United States Treasury Bill, 3.620%, 04/28/26 | 12.9% |
|---|
United States Treasury Bill, 3.630%, 05/26/26 | 12.9% |
|---|
United States Treasury Bill, 3.610%, 06/18/26 | 12.8% |
|---|
United States Treasury Bill, 3.610%, 07/21/26 | 12.8% |
|---|
United States Treasury Bill, 3.630%, 09/24/26 | 12.7% |
|---|
United States Treasury Note, 3.625%, 08/31/27 | 7.8% |
|---|
United States Treasury Bill, 3.535%, 09/03/26 | 3.8% |
|---|
Goldman Sachs Financial Square Treasury Instruments Fund, Capital Shares | 0.3% |
|---|
Counterpoint High Yield Trend ETF | 0.1% |
|---|
|
|
| C000200261 |
|
|
| Shareholder Report [Line Items] |
|
|
| Fund Name |
Counterpoint Tactical Municipal Fund
|
|
| Class Name |
Class A
|
|
| Trading Symbol |
TMNAX
|
|
| Annual or Semi-Annual Statement [Text Block] |
This semi-annual shareholder report contains important information about Counterpoint Tactical Municipal Fund for the period of October 1, 2025 to March 31, 2026.
|
|
| Additional Information [Text Block] |
You can find additional information about the Fund at https://counterpointfunds.com/resources/. You can also request this information by contacting us at 1-844-273-8637.
|
|
| Additional Information Phone Number |
1-844-273-8637
|
|
| Additional Information Website |
https://counterpointfunds.com/resources/
|
|
| Expenses [Text Block] |
What were the Fund’s costs for the last six months?(based on a hypothetical $10,000 investment) Table SummaryClass Name | Costs of a $10,000 investment | Costs paid as a percentage of a $10,000 investment |
|---|
Class A | $59 | 1.19%Footnote Reference* |
|---|
| Footnote | Description | Footnote* | Annualized |
|
|
| Expenses Paid, Amount |
$ 59
|
|
| Expense Ratio, Percent |
1.19%
|
[7] |
| AssetsNet |
$ 287,914,083
|
|
| Holdings Count | Holding |
16
|
|
| Advisory Fees Paid, Amount |
$ 1,014,667
|
|
| InvestmentCompanyPortfolioTurnover |
5.00%
|
|
| Additional Fund Statistics [Text Block] |
Table SummaryNet Assets | $287,914,083 |
|---|
Number of Portfolio Holdings | 16 |
|---|
Advisory Fee | $1,014,667 |
|---|
Portfolio Turnover | 5% |
|---|
|
|
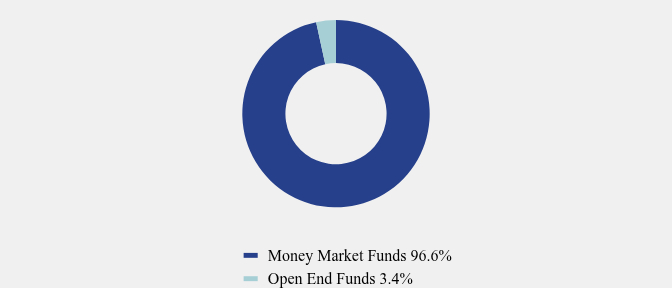
| Holdings [Text Block] |
Asset Weighting (% of total investments)Table SummaryValue | Value |
|---|
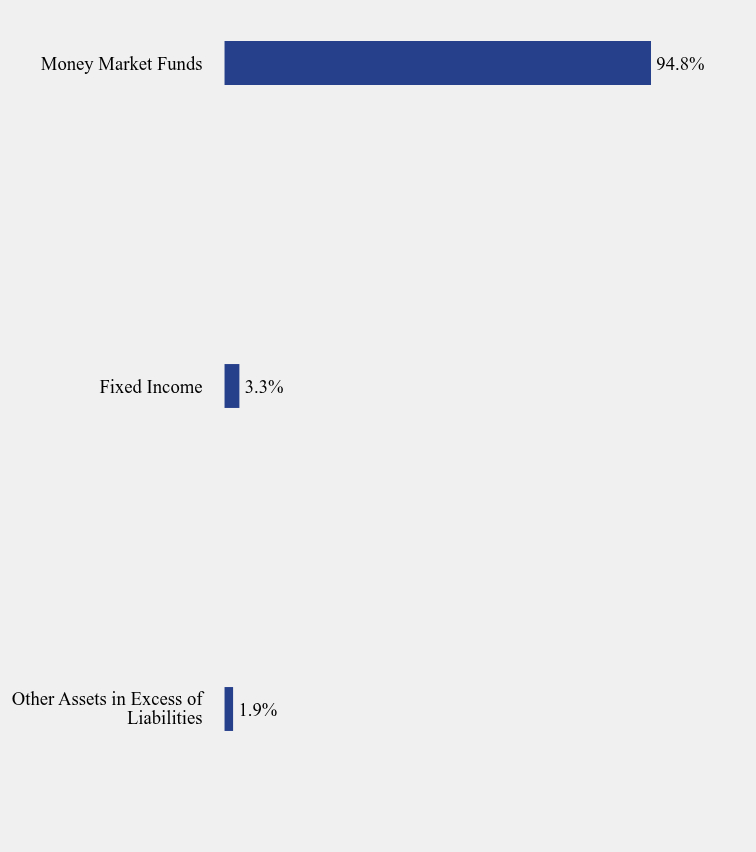
Money Market Funds | 96.6% | Open End Funds | 3.4% | Asset Weighting (% of net assets)Table SummaryValue | Value |
|---|
Other Assets in Excess of Liabilities | 1.9% | Fixed Income | 3.3% | Money Market Funds | 94.8% | Top 10 Holdings (% of net assets)Table SummaryHolding Name | % of Net Assets |
|---|
BlackRock Liquidity Funds MuniCash, Institutional Class | 94.8% |
|---|
Nuveen High Yield Municipal Bond Fund, Class I | 3.3% |
|---|
AB High Income Municipal Portfolio, Advisor Class | 0.0% |
|---|
Russell Tax Exempt High Yield Bond Fund, Class S | 0.0% |
|---|
Goldman Sachs High Yield Municipal Fund, Institutional Class | 0.0% |
|---|
PIMCO High Yield Municipal Bond Fund, Institutional Class | 0.0% |
|---|
Invesco High Yield Municipal Fund, Class Y | 0.0% |
|---|
Invesco Rochester Municipal Opportunities Fund, Class Y | 0.0% |
|---|
American High-Income Municipal Bond Fund, Class F-3 | 0.0% |
|---|
T Rowe Price Tax-Free High Yield Fund, Inc., Class I | 0.0% |
|---|
|
|
| C000200262 |
|
|
| Shareholder Report [Line Items] |
|
|
| Fund Name |
Counterpoint Tactical Municipal Fund
|
|
| Class Name |
Class C
|
|
| Trading Symbol |
TMNCX
|
|
| Annual or Semi-Annual Statement [Text Block] |
This semi-annual shareholder report contains important information about Counterpoint Tactical Municipal Fund for the period of October 1, 2025 to March 31, 2026.
|
|
| Additional Information [Text Block] |
You can find additional information about the Fund at https://counterpointfunds.com/resources/. You can also request this information by contacting us at 1-844-273-8637.
|
|
| Additional Information Phone Number |
1-844-273-8637
|
|
| Additional Information Website |
https://counterpointfunds.com/resources/
|
|
| Expenses [Text Block] |
What were the Fund’s costs for the last six months?(based on a hypothetical $10,000 investment) Table SummaryClass Name | Costs of a $10,000 investment | Costs paid as a percentage of a $10,000 investment |
|---|
Class C | $97 | 1.94%Footnote Reference* |
|---|
| Footnote | Description | Footnote* | Annualized |
|
|
| Expenses Paid, Amount |
$ 97
|
|
| Expense Ratio, Percent |
1.94%
|
[8] |
| AssetsNet |
$ 287,914,083
|
|
| Holdings Count | Holding |
16
|
|
| Advisory Fees Paid, Amount |
$ 1,014,667
|
|
| InvestmentCompanyPortfolioTurnover |
5.00%
|
|
| Additional Fund Statistics [Text Block] |
Table SummaryNet Assets | $287,914,083 |
|---|
Number of Portfolio Holdings | 16 |
|---|
Advisory Fee | $1,014,667 |
|---|
Portfolio Turnover | 5% |
|---|
|
|
| Holdings [Text Block] |
Asset Weighting (% of total investments)Table SummaryValue | Value |
|---|
Money Market Funds | 96.6% | Open End Funds | 3.4% | Asset Weighting (% of net assets)Table SummaryValue | Value |
|---|
Other Assets in Excess of Liabilities | 1.9% | Fixed Income | 3.3% | Money Market Funds | 94.8% | Top 10 Holdings (% of net assets)Table SummaryHolding Name | % of Net Assets |
|---|
BlackRock Liquidity Funds MuniCash, Institutional Class | 94.8% |
|---|
Nuveen High Yield Municipal Bond Fund, Class I | 3.3% |
|---|
AB High Income Municipal Portfolio, Advisor Class | 0.0% |
|---|
Russell Tax Exempt High Yield Bond Fund, Class S | 0.0% |
|---|
Goldman Sachs High Yield Municipal Fund, Institutional Class | 0.0% |
|---|
PIMCO High Yield Municipal Bond Fund, Institutional Class | 0.0% |
|---|
Invesco High Yield Municipal Fund, Class Y | 0.0% |
|---|
Invesco Rochester Municipal Opportunities Fund, Class Y | 0.0% |
|---|
American High-Income Municipal Bond Fund, Class F-3 | 0.0% |
|---|
T Rowe Price Tax-Free High Yield Fund, Inc., Class I | 0.0% |
|---|
|
|
| C000200263 |
|
|
| Shareholder Report [Line Items] |
|
|
| Fund Name |
Counterpoint Tactical Municipal Fund
|
|
| Class Name |
Class I
|
|
| Trading Symbol |
TMNIX
|
|
| Annual or Semi-Annual Statement [Text Block] |
This semi-annual shareholder report contains important information about Counterpoint Tactical Municipal Fund for the period of October 1, 2025 to March 31, 2026.
|
|
| Additional Information [Text Block] |
You can find additional information about the Fund at https://counterpointfunds.com/resources/. You can also request this information by contacting us at 1-844-273-8637.
|
|
| Additional Information Phone Number |
1-844-273-8637
|
|
| Additional Information Website |
https://counterpointfunds.com/resources/
|
|
| Expenses [Text Block] |
What were the Fund’s costs for the last six months?(based on a hypothetical $10,000 investment) Table SummaryClass Name | Costs of a $10,000 investment | Costs paid as a percentage of a $10,000 investment |
|---|
Class I | $47 | 0.94%Footnote Reference* |
|---|
| Footnote | Description | Footnote* | Annualized |
|
|
| Expenses Paid, Amount |
$ 47
|
|
| Expense Ratio, Percent |
0.94%
|
[9] |
| AssetsNet |
$ 287,914,083
|
|
| Holdings Count | Holding |
16
|
|
| Advisory Fees Paid, Amount |
$ 1,014,667
|
|
| InvestmentCompanyPortfolioTurnover |
5.00%
|
|
| Additional Fund Statistics [Text Block] |
Table SummaryNet Assets | $287,914,083 |
|---|
Number of Portfolio Holdings | 16 |
|---|
Advisory Fee | $1,014,667 |
|---|
Portfolio Turnover | 5% |
|---|
|
|
| Holdings [Text Block] |
Asset Weighting (% of total investments)Table SummaryValue | Value |
|---|
Money Market Funds | 96.6% | Open End Funds | 3.4% | Asset Weighting (% of net assets)Table SummaryValue | Value |
|---|
Other Assets in Excess of Liabilities | 1.9% | Fixed Income | 3.3% | Money Market Funds | 94.8% | Top 10 Holdings (% of net assets)Table SummaryHolding Name | % of Net Assets |
|---|
BlackRock Liquidity Funds MuniCash, Institutional Class | 94.8% |
|---|
Nuveen High Yield Municipal Bond Fund, Class I | 3.3% |
|---|
AB High Income Municipal Portfolio, Advisor Class | 0.0% |
|---|
Russell Tax Exempt High Yield Bond Fund, Class S | 0.0% |
|---|
Goldman Sachs High Yield Municipal Fund, Institutional Class | 0.0% |
|---|
PIMCO High Yield Municipal Bond Fund, Institutional Class | 0.0% |
|---|
Invesco High Yield Municipal Fund, Class Y | 0.0% |
|---|
Invesco Rochester Municipal Opportunities Fund, Class Y | 0.0% |
|---|
American High-Income Municipal Bond Fund, Class F-3 | 0.0% |
|---|
T Rowe Price Tax-Free High Yield Fund, Inc., Class I | 0.0% |
|---|
|
|
|
|