In accordance with rules adopted by the Securities and Exchange Commission pursuant to the Dodd-Frank Wall Street Reform and Consumer Protection Act of 2010, we provide the following information regarding the relationship between executive compensation actually paid (“CAP”) for our principal executive officer (“PEO”) and Non-PEO named executive officers (“NEOs”), and Company performance for the fiscal years listed below. The Compensation Committee did not consider the pay versus performance disclosure below in making its pay decisions for any of the years shown. The CAP amounts shown in the table below do not reflect the actual amount of compensation earned by or paid to our named executive officers during the applicable year.
|
Year |
Summary Compensation Table Total for First PEO(1) |
Summary Compensation Table Total for Second PEO (2) |
Compensation Actually Paid to First PEO(1) |
Compensation Actually Paid to Second PEO(2) |
Average Summary Compensation Table Total for Non-PEO NEOs (1) |
Average Compensation Actually Paid to Non-PEO NEOs (3) |
Value of Initial Fixed $100 Investment Based on Total Shareholder Return (4) |
Net Income (Loss) |
||||||||||||||||||||||||
|
2025 |
$ | — | $ | 1,483,567 | $ | — | $ | 2,051,858 | 172,701 | 220,305 | $ | 200 | $ | (908,002 | ) | |||||||||||||||||
|
2024 |
— | 429,702 | — | 319,702 | 148,654 | 133,471 | 100 | 8,574 | ||||||||||||||||||||||||
|
2023 |
378,625 | 367,319 | 474,084 | 627,319 | 159,253 | 185,275 | 133 | (869,016 | ) | |||||||||||||||||||||||
|
(1) |
The PEO for 2024 and 2025 was Shahe Bagerdjian. Both Steve Laflin (“First PEO”) and Shahe Bagerdjian (“Second PEO”) served as PEO in 2023. Our only non-PEO NEO for each year presented was Matthew Cox, our chief financial officer. |
|
(2) |
CAP reflects the exclusions and inclusions of certain amounts for the First PEO and Second PEO as set forth below. Equity values are calculated in accordance with FASB ASC Topic 718. Amounts in the Exclusion of Stock Awards column are the totals from the Stock Awards column set forth in the Summary Compensation Table. Amounts in the Inclusion of Equity Values are derived from the second table in this footnote. |
First PEO
|
Year |
Summary Compensation Table Total for First PEO |
Exclusion of Stock Awards for First PEO |
Inclusion of Equity Values for First PEO |
CAP to First PEO |
||||||||||||
|
2025 |
$ | — | $ | — | $ | — | $ | — | ||||||||
|
2024 |
— | — | — | — | ||||||||||||
|
2023 |
378,625 | 0 | 95,459 | 474,084 | ||||||||||||
|
Year |
Year-End Fair Value of Unvested Equity Awards Granted During the Year for First PEO |
Change in Fair Value of Unvested Equity Awards Granted in Prior Years for First PEO |
Change in Fair Value to Vesting Date of Equity Awards Granted and Vested During Year for First PEO |
Change in Fair Value to Vesting Date of Equity Awards Granted in Prior Years for First PEO |
Inclusion of Equity Values for First PEO |
|||||||||||||||
|
2025 |
$ | — | $ | — | $ | — | $ | — | $ | — | ||||||||||
|
2024 |
— | — | — | — | — | |||||||||||||||
|
2023 |
— | — | — | 95,459 | 95,459 | |||||||||||||||
Second PEO
|
Year |
Summary Compensation Table Total for Second PEO |
Exclusion of Stock Awards for Second PEO |
Inclusion of Equity Values for Second PEO |
CAP to Second PEO |
||||||||||||
|
2025 |
$ | 1,483,567 | $ | 1,119,238 | $ | 1,687,529 | $ | 2,051,858 | ||||||||
|
2024 |
429,702 | 70,500 | (39,500 | ) | 319,702 | |||||||||||
|
2023 |
367,319 | — | 260,000 | 627,319 | ||||||||||||
|
Year |
Year-End Fair Value of Unvested Equity Awards Granted During the Year for Second PEO |
Change in Fair Value of Unvested Equity Awards Granted in Prior Years for Second PEO |
Change in Fair Value to Vesting Date of Equity Awards Granted and Vested During Year for Second PEO |
Change in Fair Value to Vesting Date of Equity Awards Granted in Prior Years for Second PEO |
Inclusion of Equity Values for Second PEO |
|||||||||||||||
|
2025 |
$ | 1,617,529 | $ | 30,000 | $ | - | $ | 40,000 | $ | 1,687,529 | ||||||||||
|
2024 |
— | (110,000 | ) | 10,500 | 60,000 | (39,500 | ) | |||||||||||||
|
2023 |
260,000 | — | — | — | 260,000 | |||||||||||||||
|
(3) |
CAP reflects the exclusions and inclusions of certain amounts for the non-PEO NEO as set forth below. Equity values are calculated in accordance with FASB ASC Topic 718. Amounts in the Exclusion of Stock Awards for non-PEO NEO column are the totals from the Stock Awards column set forth in the Summary Compensation Table. Amounts in the Inclusion of Equity Values for non-PEO NEO are derived from the second table in this footnote. |
|
Year |
Summary Compensation Table Total for non-PEO NEO |
Exclusion of Stock Awards for non-PEO NEO |
Inclusion of Equity Values for non-PEO NEO |
CAP to non-PEO NEO |
||||||||||||
|
2025 |
$ | 172,701 | $ | - | $ | 47,604 | $ | 220,305 | ||||||||
|
2024 |
148,654 | 712 | (14,471 | ) | 133,471 | |||||||||||
|
2023 |
159,253 | 13,083 | 39,105 | 185,275 | ||||||||||||
|
Year |
Year-End Fair Value of Unvested Equity Awards Granted During the Year for non-PEO NEO |
Change in Fair Value of Unvested Equity Awards Granted in Prior Years for non-PEO NEO |
Change in Fair Value to Vesting Date of Equity Awards Granted and Vested During Year for non-PEO NEO |
Change in Fair Value to Vesting Date of Equity Awards Granted in Prior Years for non-PEO NEO |
Inclusion of Equity Values for non-PEO NEO |
|||||||||||||||
|
2025 |
$ | - | $ | 175 | $ | — | $ | 47,429 | $ | 47,604 | ||||||||||
|
2024 |
499 | (5,130 | ) | — | (9,840 | ) | (14,471 | ) | ||||||||||||
|
2023 |
10,570 | 12,982 | 2,513 | 13,040 | 39,105 | |||||||||||||||
|
(4) |
Assumes $100 was invested for the period starting December 31, 2022, through the end of the listed year in the Company. Historical stock performance is not necessarily indicative of future stock performance, |
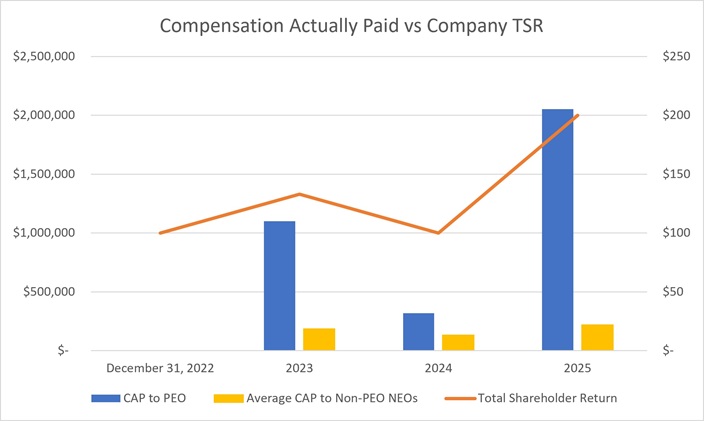
Compensation Actually Paid and TSR
As demonstrated by the following graph, the CAP to the Company’s PEOs and the average amount of CAP to the Company’s non-PEO NEOs are aligned with the Company’s cumulative TSR over the three years presented in the pay versus performance table above.
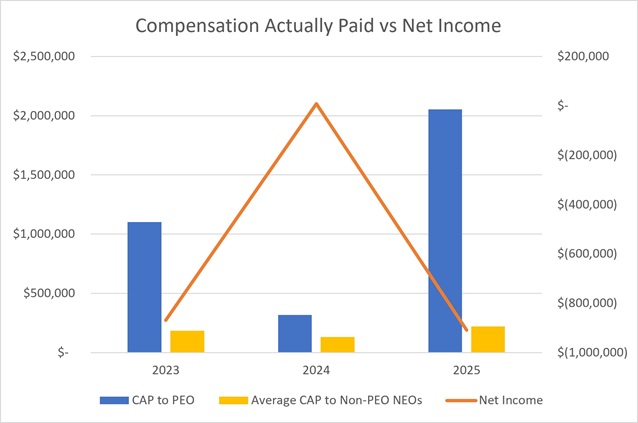
Compensation Actually Paid and Net Income (Loss)
As demonstrated by the following graph, the CAP to the Company’s PEOs and the average amount of CAP to the Company’s non-PEO NEOs are aligned with the Company’s net income (loss) over the three years presented in the pay versus performance table above.