Shareholder Report
Mar. 31, 2026
USD ($)
Holding
Fund Expenses
|
Class |
Costs of a $10,000 investment |
Costs paid as a percentage of a $10,000 investment |
||||
|
Institutional Class |
$95 | 0.86% | ||||
Management’s Discussion of Fund Performance
The Fund seeks long-term growth of capital. The Fund primarily invests in equity securities of non‑U.S. companies and generally focuses on larger, more established companies. The Fund selects investments based on an evaluation of a company’s sustainability and impact practices which considers environmental, social and governance (ESG) impacts and risks of a company, how well the company manages these impacts and risks, and ascertains the company’s willingness and ability to take a leadership position in implementing best practices.
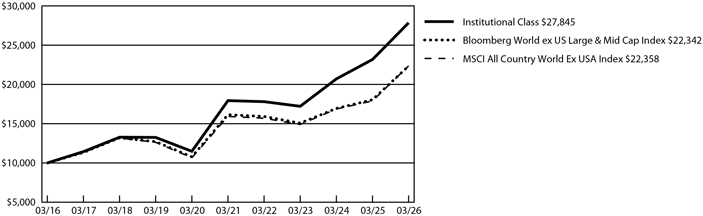
The Fund’s Institutional Class shares performance was 20.15% for the reporting period.
Over the 12 month period, global equities were driven by shifting macro headlines, from tariff changes to geopolitical tensions, resulting in uneven market leadership. Mega‑cap Technology and AI‑linked sectors outperformed on strong earnings and investment, while cyclicals like Industrials and some Financials benefited economically from resilient growth and easing inflation concerns. This trend began to reverse in March as geopolitical-driven energy price spikes weighed on European and Asian cyclical stocks.
The factors that contributed most to the Fund’s performance during the period were:
|
FACTOR |
PERFORMANCE
IMPACT |
OBSERVATIONS | ||
|
Information Technology Stocks |
Positive |
Information Technology was the top contributing sector during the reporting period as many of the Fund’s holdings, including Samsung Electronics Co. Ltd., Taiwan Semiconductor Manufacturing Company Limited, and ASML Holding N.V., which are levered to semiconductor and semiconductor component production, contributed positively to performance. | ||
|
Consumer Staples Underweight |
Positive |
The Fund’s lack of exposure to Consumer Staples stocks contributed positively to performance. | ||
|
Industrials Stocks |
Negative |
Despite a meaningful underweight to software, the Fund maintained selective exposure to data and information businesses. Rapid advances in large language models over the past year drove market concerns about AI disintermediation, weighing on Relx plc, a key detractor. The Fund retained the position, however, given accelerating growth in its LexisNexis legal segment driven by generative AI upselling. | ||
|
Metals and Mining Industry Underweight |
Negative |
The Fund’s lack of exposure to the Metals and Mining Industry detracted from performance as a weaker dollar and strong demand for commodities lifted gold and related equities. The Fund has historically underweighted this area given its reliance on commodity cycles rather than company- specific drivers. Mining stocks benefited from higher prices, improved cash flows, and rotation into real assets and value. | ||
Over the 12 month period, we repositioned the Fund to enhance defensiveness and align with evolving macro and technological risks. We added companies with less elastic demand, Ferrari N.V., Keyence Corp., Haleon plc, and KDDI Corp., while increasing exposure to German industrials and materials (Heidelberg Materials AG, Siemens Healthineers AG) and defense via Rolls-Royce Holdings plc amid rising fiscal and military spending. At the same time, we reassessed AI disintermediation risks, exiting select holdings where risks appeared underappreciated or less offset by AI benefits (Trip.com, Shopify Inc., London Stock Exchange Group plc). We also replaced BNP Paribas SA with Erste Group Bank AG following legal concerns, maintaining a constructive view of banks, and exited Novo Nordisk A/S due to concerns about the competitiveness of its weight loss data.
Fund Performance
The following graph compares the initial and subsequent account values at the end of each of the most recently completed 10 fiscal years or since inception of the Fund. The graph assumes a $10,000 initial investment in the Fund and an appropriate broad-based securities market index and any additional indexes and assumes maximum sales charges, if any.
GROWTH OF $10,000
|
AVERAGE ANNUAL TOTAL RETURNS |
1 Year | 5 Years | 10 Years | |||||||||
|
Institutional Class |
20.15% | 9.19% | 10.78% | |||||||||
|
Bloomberg World ex US Large & Mid Cap Index1 |
23.79% | 6.71% | 8.37% | |||||||||
|
MSCI All Country World Ex USA Index |
24.91% | 7.02% | 8.38% | |||||||||
| 1 |
The Fund changed its broad-based securities market index to the Bloomberg World ex US Large & Mid Cap Index which is similarly representative of the overall securities market applicable to the Fund. |
Visit touchstoneinvestments.com/mutual-funds for the most recent performance information.
Key Fund Statistics
|
Fund net assets |
$ | 1,325,550,464 | ||
|
Total number of portfolio holdings |
51 | |||
|
Total advisory fees paid |
$7,064,577 | |||
|
Portfolio turnover rate |
24% | |||
Graphical Representation of Holdings
| SECTOR ALLOCATION (% OF NET ASSETS) | ||||
|
Financials |
22.7% | |||
|
Industrials |
20.3% | |||
|
Information Technology |
15.5% | |||
|
Communication Services |
10.0% | |||
|
Consumer Discretionary |
7.6% | |||
|
Materials |
7.4% | |||
|
Energy |
7.1% | |||
|
Health Care |
6.4% | |||
|
Short-Term Investment Funds |
7.4% | |||
|
Other Assets/Liabilities (Net) |
(4.4)% | |||
|
Total |
100.0% | |||
| GEOGRAPHICAL ALLOCATION (% OF NET ASSETS) | ||||
|
Common Stocks |
||||
|
Japan |
17.3% | |||
|
Sweden |
9.2% | |||
|
United Kingdom |
8.7% | |||
|
France |
7.9% | |||
|
Netherlands |
7.2% | |||
|
Taiwan |
5.6% | |||
|
South Korea |
5.6% | |||
|
United States |
5.3% | |||
|
China |
5.3% | |||
|
Germany |
5.0% | |||
|
Singapore |
3.8% | |||
|
Ireland |
3.5% | |||
|
Italy |
3.1% | |||
|
Other Countries |
9.5% | |||
|
Short-Term Investment Funds |
7.4% | |||
|
Other Assets/Liabilities (Net) |
(4.4)% | |||
|
Total |
100.0% | |||
Fund Expenses
|
Class |
Costs of a $10,000 investment |
Costs paid as a percentage of a $10,000 investment |
||||
|
Class Y |
$99 | 0.90% | ||||
Management’s Discussion of Fund Performance
The Fund seeks long-term growth of capital. The Fund primarily invests in equity securities of non‑U.S. companies and generally focuses on larger, more established companies. The Fund selects investments based on an evaluation of a company’s sustainability and impact practices which considers environmental, social and governance (ESG) impacts and risks of a company, how well the company manages these impacts and risks, and ascertains the company’s willingness and ability to take a leadership position in implementing best practices.
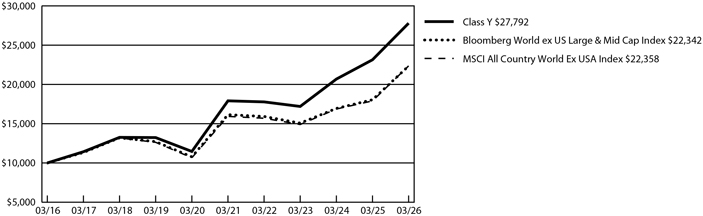
The Fund’s Class Y shares performance was 20.11% for the reporting period.
Over the 12 month period, global equities were driven by shifting macro headlines, from tariff changes to geopolitical tensions, resulting in uneven market leadership. Mega‑cap Technology and AI‑linked sectors outperformed on strong earnings and investment, while cyclicals like Industrials and some Financials benefited economically from resilient growth and easing inflation concerns. This trend began to reverse in March as geopolitical-driven energy price spikes weighed on European and Asian cyclical stocks.
The factors that contributed most to the Fund’s performance during the period were:
|
FACTOR |
PERFORMANCE
IMPACT |
OBSERVATIONS | ||
|
Information Technology Stocks |
Positive |
Information Technology was the top contributing sector during the reporting period as many of the Fund’s holdings, including Samsung Electronics Co. Ltd., Taiwan Semiconductor Manufacturing Company Limited, and ASML Holding N.V., which are levered to semiconductor and semiconductor component production, contributed positively to performance. | ||
|
Consumer Staples Underweight |
Positive |
The Fund’s lack of exposure to Consumer Staples stocks contributed positively to performance. | ||
|
Industrials Stocks |
Negative |
Despite a meaningful underweight to software, the Fund maintained selective exposure to data and information businesses. Rapid advances in large language models over the past year drove market concerns about AI disintermediation, weighing on Relx plc, a key detractor. The Fund retained the position, however, given accelerating growth in its LexisNexis legal segment driven by generative AI upselling. | ||
|
Metals and Mining Industry Underweight |
Negative |
The Fund’s lack of exposure to the Metals and Mining Industry detracted from performance as a weaker dollar and strong demand for commodities lifted gold and related equities. The Fund has historically underweighted this area given its reliance on commodity cycles rather than company- specific drivers. Mining stocks benefited from higher prices, improved cash flows, and rotation into real assets and value. | ||
Over the 12 month period, we repositioned the Fund to enhance defensiveness and align with evolving macro and technological risks. We added companies with less elastic demand, Ferrari N.V., Keyence Corp., Haleon plc, and KDDI Corp., while increasing exposure to German industrials and materials (Heidelberg Materials AG, Siemens Healthineers AG) and defense via Rolls-Royce Holdings plc amid rising fiscal and military spending. At the same time, we reassessed AI disintermediation risks, exiting select holdings where risks appeared underappreciated or less offset by AI benefits (Trip.com, Shopify Inc., London Stock Exchange Group plc). We also replaced BNP Paribas SA with Erste Group Bank AG following legal concerns, maintaining a constructive view of banks, and exited Novo Nordisk A/S due to concerns about the competitiveness of its weight loss data.
Fund Performance
The following graph compares the initial and subsequent account values at the end of each of the most recently completed 10 fiscal years or since inception of the Fund. The graph assumes a $10,000 initial investment in the Fund and an appropriate broad-based securities market index and any additional indexes and assumes maximum sales charges, if any.
GROWTH OF $10,000
|
AVERAGE ANNUAL TOTAL RETURNS |
1 Year | 5 Years | 10 Years | |||||||||
|
Class Y |
20.11% | 9.19% | 10.76% | |||||||||
|
Bloomberg World ex US Large & Mid Cap Index1 |
23.79% | 6.71% | 8.37% | |||||||||
|
MSCI All Country World Ex USA Index |
24.91% | 7.02% | 8.38% | |||||||||
| 1 |
The Fund changed its broad-based securities market index to the Bloomberg World ex US Large & Mid Cap Index which is similarly representative of the overall securities market applicable to the Fund. |
Visit touchstoneinvestments.com/mutual-funds for the most recent performance information.
Key Fund Statistics
|
Fund net assets |
$ | 1,325,550,464 | ||
|
Total number of portfolio holdings |
51 | |||
|
Total advisory fees paid |
$7,064,577 | |||
|
Portfolio turnover rate |
24% | |||
Graphical Representation of Holdings
| SECTOR ALLOCATION (% OF NET ASSETS) | ||||
|
Financials |
22.7% | |||
|
Industrials |
20.3% | |||
|
Information Technology |
15.5% | |||
|
Communication Services |
10.0% | |||
|
Consumer Discretionary |
7.6% | |||
|
Materials |
7.4% | |||
|
Energy |
7.1% | |||
|
Health Care |
6.4% | |||
|
Short-Term Investment Funds |
7.4% | |||
|
Other Assets/Liabilities (Net) |
(4.4)% | |||
|
Total |
100.0% | |||
| GEOGRAPHICAL ALLOCATION (% OF NET ASSETS) | ||||
|
Common Stocks |
||||
|
Japan |
17.3% | |||
|
Sweden |
9.2% | |||
|
United Kingdom |
8.7% | |||
|
France |
7.9% | |||
|
Netherlands |
7.2% | |||
|
Taiwan |
5.6% | |||
|
South Korea |
5.6% | |||
|
United States |
5.3% | |||
|
China |
5.3% | |||
|
Germany |
5.0% | |||
|
Singapore |
3.8% | |||
|
Ireland |
3.5% | |||
|
Italy |
3.1% | |||
|
Other Countries |
9.5% | |||
|
Short-Term Investment Funds |
7.4% | |||
|
Other Assets/Liabilities (Net) |
(4.4)% | |||
|
Total |
100.0% | |||
Fund Expenses
|
Class |
Costs of a $10,000 investment |
Costs paid as a percentage of a $10,000 investment |
||||
|
Class C |
$210 | 1.92% | ||||
Management’s Discussion of Fund Performance
The Fund seeks long-term growth of capital. The Fund primarily invests in equity securities of non‑U.S. companies and generally focuses on larger, more established companies. The Fund selects investments based on an evaluation of a company’s sustainability and impact practices which considers environmental, social and governance (ESG) impacts and risks of a company, how well the company manages these impacts and risks, and ascertains the company’s willingness and ability to take a leadership position in implementing best practices.
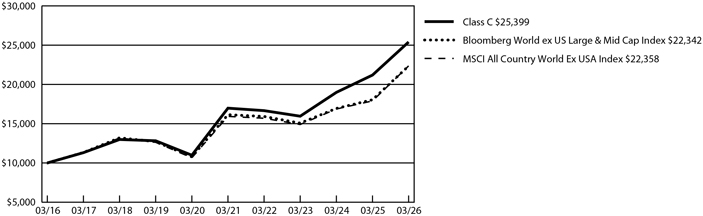
The Fund’s Class C shares performance was 18.86% (excluding sales loads) for the reporting period.
Over the 12 month period, global equities were driven by shifting macro headlines, from tariff changes to geopolitical tensions, resulting in uneven market leadership. Mega‑cap Technology and AI‑linked sectors outperformed on strong earnings and investment, while cyclicals like Industrials and some Financials benefited economically from resilient growth and easing inflation concerns. This trend began to reverse in March as geopolitical-driven energy price spikes weighed on European and Asian cyclical stocks.
The factors that contributed most to the Fund’s performance during the period were:
|
FACTOR |
PERFORMANCE IMPACT |
OBSERVATIONS | ||
|
Information
Technology Stocks |
Positive |
Information Technology was the top contributing sector during the reporting period as many of the Fund’s holdings, including Samsung Electronics Co. Ltd., Taiwan Semiconductor Manufacturing Company Limited, and ASML Holding N.V., which are levered to semiconductor and semiconductor component production, contributed positively to performance. | ||
|
Consumer Staples Underweight |
Positive |
The Fund’s lack of exposure to Consumer Staples stocks contributed positively to performance. | ||
|
Industrials Stocks |
Negative |
Despite a meaningful underweight to software, the Fund maintained selective exposure to data and information businesses. Rapid advances in large language models over the past year drove market concerns about AI disintermediation, weighing on Relx plc, a key detractor. The Fund retained the position, however, given accelerating growth in its LexisNexis legal segment driven by generative AI upselling. | ||
|
Metals and Mining
Industry Underweight |
Negative |
The Fund’s lack of exposure to the Metals and Mining Industry detracted from performance as a weaker dollar and strong demand for commodities lifted gold and related equities. The Fund has historically underweighted this area given its reliance on commodity cycles rather than company- specific drivers. Mining stocks benefited from higher prices, improved cash flows, and rotation into real assets and value. | ||
Over the 12 month period, we repositioned the Fund to enhance defensiveness and align with evolving macro and technological risks. We added companies with less elastic demand, Ferrari N.V., Keyence Corp., Haleon plc, and KDDI Corp., while increasing exposure to German industrials and materials (Heidelberg Materials AG, Siemens Healthineers AG) and defense via Rolls-Royce Holdings plc amid rising fiscal and military spending. At the same time, we reassessed AI disintermediation risks, exiting select holdings where risks appeared underappreciated or less offset by AI benefits (Trip.com, Shopify Inc., London Stock Exchange Group plc). We also replaced BNP Paribas SA with Erste Group Bank AG following legal concerns, maintaining a constructive view of banks, and exited Novo Nordisk A/S due to concerns about the competitiveness of its weight loss data.
Fund Performance
The following graph compares the initial and subsequent account values at the end of each of the most recently completed 10 fiscal years or since inception of the Fund. The graph assumes a $10,000 initial investment in the Fund and an appropriate broad-based securities market index and any additional indexes and assumes maximum sales charges, if any.
GROWTH OF $10,000
|
AVERAGE ANNUAL TOTAL RETURNS |
1 Year | 5 Years | 10 Years | |||||||||
|
Class C |
17.86% | 8.05% | 9.77% | |||||||||
|
Class C - excluding sales load |
18.86% | 8.05% | 9.77% | |||||||||
|
Bloomberg World ex US Large & Mid Cap Index1 |
23.79% | 6.71% | 8.37% | |||||||||
|
MSCI All Country World Ex USA Index |
24.91% | 7.02% | 8.38% | |||||||||
| 1 |
The Fund changed its broad-based securities market index to the Bloomberg World ex US Large & Mid Cap Index which is similarly representative of the overall securities market applicable to the Fund. |
Visit touchstoneinvestments.com/mutual-funds for the most recent performance information.
Key Fund Statistics
|
Fund net assets |
$ | 1,325,550,464 | ||
|
Total number of portfolio holdings |
51 | |||
|
Total advisory fees paid |
$7,064,577 | |||
|
Portfolio turnover rate |
24% | |||
Graphical Representation of Holdings
| SECTOR ALLOCATION (% OF NET ASSETS) | ||||
|
Financials |
22.7% | |||
|
Industrials |
20.3% | |||
|
Information Technology |
15.5% | |||
|
Communication Services |
10.0% | |||
|
Consumer Discretionary |
7.6% | |||
|
Materials |
7.4% | |||
|
Energy |
7.1% | |||
|
Health Care |
6.4% | |||
|
Short-Term Investment Funds |
7.4% | |||
|
Other Assets/Liabilities (Net) |
(4.4)% | |||
|
Total |
100.0% | |||
| GEOGRAPHICAL ALLOCATION (% OF NET ASSETS) | ||||
|
Common Stocks |
||||
|
Japan |
17.3% | |||
|
Sweden |
9.2% | |||
|
United Kingdom |
8.7% | |||
|
France |
7.9% | |||
|
Netherlands |
7.2% | |||
|
Taiwan |
5.6% | |||
|
South Korea |
5.6% | |||
|
United States |
5.3% | |||
|
China |
5.3% | |||
|
Germany |
5.0% | |||
|
Singapore |
3.8% | |||
|
Ireland |
3.5% | |||
|
Italy |
3.1% | |||
|
Other Countries |
9.5% | |||
|
Short-Term Investment Funds |
7.4% | |||
|
Other Assets/Liabilities (Net) |
(4.4)% | |||
|
Total |
100.0% | |||
Fund Expenses
|
Class |
Costs of a $10,000 investment |
Costs paid as a percentage of a $10,000 investment |
||||
|
Class A |
$124 | 1.13% | ||||
Management’s Discussion of Fund Performance
The Fund seeks long-term growth of capital. The Fund primarily invests in equity securities of non‑U.S. companies and generally focuses on larger, more established companies. The Fund selects investments based on an evaluation of a company’s sustainability and impact practices which considers environmental, social and governance (ESG) impacts and risks of a company, how well the company manages these impacts and risks, and ascertains the company’s willingness and ability to take a leadership position in implementing best practices.
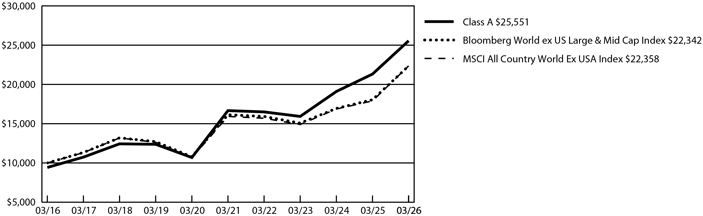
The Fund’s Class A shares performance was 19.86% (excluding sales loads) for the reporting period.
Over the 12 month period, global equities were driven by shifting macro headlines, from tariff changes to geopolitical tensions, resulting in uneven market leadership. Mega‑cap Technology and AI‑linked sectors outperformed on strong earnings and investment, while cyclicals like Industrials and some Financials benefited economically from resilient growth and easing inflation concerns. This trend began to reverse in March as geopolitical-driven energy price spikes weighed on European and Asian cyclical stocks.
The factors that contributed most to the Fund’s performance during the period were:
|
FACTOR |
PERFORMANCE
IMPACT |
OBSERVATIONS | ||
|
Information Technology Stocks |
Positive |
Information Technology was the top contributing sector during the reporting period as many of the Fund’s holdings, including Samsung Electronics Co. Ltd., Taiwan Semiconductor Manufacturing Company Limited, and ASML Holding N.V., which are levered to semiconductor and semiconductor component production, contributed positively to performance. | ||
|
Consumer Staples Underweight |
Positive |
The Fund’s lack of exposure to Consumer Staples stocks contributed positively to performance. | ||
|
Industrials Stocks |
Negative |
Despite a meaningful underweight to software, the Fund maintained selective exposure to data and information businesses. Rapid advances in large language models over the past year drove market concerns about AI disintermediation, weighing on Relx plc, a key detractor. The Fund retained the position, however, given accelerating growth in its LexisNexis legal segment driven by generative AI upselling. | ||
|
Metals and Mining Industry Underweight |
Negative |
The Fund’s lack of exposure to the Metals and Mining Industry detracted from performance as a weaker dollar and strong demand for commodities lifted gold and related equities. The Fund has historically underweighted this area given its reliance on commodity cycles rather than company- specific drivers. Mining stocks benefited from higher prices, improved cash flows, and rotation into real assets and value. | ||
Over the 12 month period, we repositioned the Fund to enhance defensiveness and align with evolving macro and technological risks. We added companies with less elastic demand, Ferrari N.V., Keyence Corp., Haleon plc, and KDDI Corp., while increasing exposure to German industrials and materials (Heidelberg Materials AG, Siemens Healthineers AG) and defense via Rolls-Royce Holdings plc amid rising fiscal and military spending. At the same time, we reassessed AI disintermediation risks, exiting select holdings where risks appeared underappreciated or less offset by AI benefits (Trip.com, Shopify Inc., London Stock Exchange Group plc). We also replaced BNP Paribas SA with Erste Group Bank AG following legal concerns, maintaining a constructive view of banks, and exited Novo Nordisk A/S due to concerns about the competitiveness of its weight loss data.
Fund Performance
The following graph compares the initial and subsequent account values at the end of each of the most recently completed 10 fiscal years or since inception of the Fund. The graph assumes a $10,000 initial investment in the Fund and an appropriate broad-based securities market index and any additional indexes and assumes maximum sales charges, if any.
GROWTH OF $10,000
|
AVERAGE ANNUAL TOTAL RETURNS |
1 Year | 5 Years | 10 Years | |||||||||
|
Class A |
13.84% | 7.81% | 9.83% | |||||||||
|
Class A - excluding sales load |
19.86% | 8.93% | 10.49% | |||||||||
|
Bloomberg World ex US Large & Mid Cap Index1 |
23.79% | 6.71% | 8.37% | |||||||||
|
MSCI All Country World Ex USA Index |
24.91% | 7.02% | 8.38% | |||||||||
| 1 |
The Fund changed its broad-based securities market index to the Bloomberg World ex US Large & Mid Cap Index which is similarly representative of the overall securities market applicable to the Fund. |
Visit touchstoneinvestments.com/mutual-funds for the most recent performance information.
Key Fund Statistics
|
Fund net assets |
$ | 1,325,550,464 | ||
|
Total number of portfolio holdings |
51 | |||
|
Total advisory fees paid |
$7,064,577 | |||
|
Portfolio turnover rate |
24% | |||
Graphical Representation of Holdings
| SECTOR ALLOCATION (% OF NET ASSETS) | ||||
|
Financials |
22.7% | |||
|
Industrials |
20.3% | |||
|
Information Technology |
15.5% | |||
|
Communication Services |
10.0% | |||
|
Consumer Discretionary |
7.6% | |||
|
Materials |
7.4% | |||
|
Energy |
7.1% | |||
|
Health Care |
6.4% | |||
|
Short-Term Investment Funds |
7.4% | |||
|
Other Assets/Liabilities (Net) |
(4.4)% | |||
|
Total |
100.0% | |||
| GEOGRAPHICAL ALLOCATION (% OF NET ASSETS) | ||||
|
Common Stocks |
||||
|
Japan |
17.3% | |||
|
Sweden |
9.2% | |||
|
United Kingdom |
8.7% | |||
|
France |
7.9% | |||
|
Netherlands |
7.2% | |||
|
Taiwan |
5.6% | |||
|
South Korea |
5.6% | |||
|
United States |
5.3% | |||
|
China |
5.3% | |||
|
Germany |
5.0% | |||
|
Singapore |
3.8% | |||
|
Ireland |
3.5% | |||
|
Italy |
3.1% | |||
|
Other Countries |
9.5% | |||
|
Short-Term Investment Funds |
7.4% | |||
|
Other Assets/Liabilities (Net) |
(4.4)% | |||
|
Total |
100.0% | |||
Fund Expenses
|
Class |
Costs of a $10,000 investment |
Costs paid as a percentage of a $10,000 investment |
||||
|
Class A |
$132 | 1.21% | ||||
Management’s Discussion of Fund Performance
The Fund seeks to increase the value of Fund shares by primarily investing in stocks of mid‑cap U.S. companies. The Fund’s portfolio managers place focus on companies that they believe to have a demonstrated record of achievement with excellent prospects for earnings growth over a 1‑to‑3‑year period. The Fund’s sub‑adviser, Westfield Capital Management Company, L.P., looks for companies that it believes are reasonably priced with high forecasted earnings potential.
The Fund’s Class A shares performance was 17.89% (excluding sales loads) for the reporting period.
The environment over the 12 month period ended March 31, 2026 was marked by strong equity market performance, as a powerful rebound in mid‑2025, driven by artificial intelligence (AI) momentum, resilient earnings, and easing tariff pressures, pushed major indices to record highs and supported a soft-landing narrative. While improving breadth and sector rotation signaled a healthier backdrop, market behavior grew increasingly speculative through the third quarter before leadership broadened later in the year toward cyclicals and small caps amid easing financial conditions. More recently, markets reversed as geopolitical shocks and energy supply disruptions contributed to a first calendar quarter decline, highlighting a shift toward greater volatility and dispersion.
The factors that contributed most to the Fund’s performance during the period were:
|
FACTOR |
PERFORMANCE IMPACT |
OBSERVATIONS | ||
|
Industrials Stocks |
Positive |
Stock selection was a leading contributor to the Fund’s relative outperformance during the 12‑month period. Industrial stock holding Vertiv Holdings Co. was a top contributor, driven by strong organic order growth and tailwinds from AI infrastructure buildout. | ||
|
Consumer Discretionary Stocks |
Positive |
Tapestry, Inc. was a top contributor driven by brand elevation and pricing power. | ||
|
Financials Stocks |
Positive |
Financials stocks contributed positively, driven by exposure to banks, (Fifth Third Bancorp) and trading platforms (Robinhood Markets, Inc.). | ||
|
Information Technology
(IT) Stocks |
Negative |
Software exposure (Atlassian Corp.) was the biggest detractor as AI displacement fears weighed heavily on the group. | ||
Over the past year, the Fund increased its exposure to Consumer Discretionary and Industrials while reducing its allocation to Information Technology.
Fund Performance
The following graph compares the initial and subsequent account values at the end of each of the most recently completed 10 fiscal years or since inception of the Fund. The graph assumes a $10,000 initial investment in the Fund and an appropriate broad-based securities market index and any additional indexes and assumes maximum sales charges, if any.
GROWTH OF $10,000
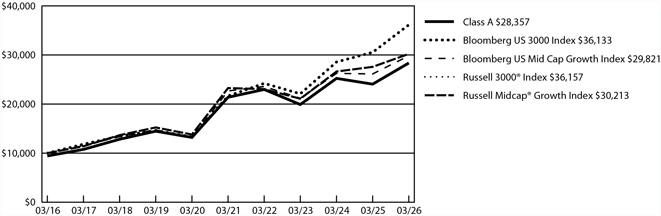
|
AVERAGE ANNUAL TOTAL RETURNS |
1 Year | 5 Years | 10 Years | |||||||||
|
Class A |
12.00% | 4.73% | 10.99% | |||||||||
|
Class A - excluding sales load |
17.89% | 5.81% | 11.64% | |||||||||
|
Bloomberg US 3000 Index1 |
18.30% | 10.78% | 13.71% | |||||||||
|
Bloomberg US Mid Cap Growth Index2 |
14.10% | 5.64% | 11.55% | |||||||||
|
Russell 3000® Index |
18.09% | 10.87% | 13.72% | |||||||||
|
Russell Midcap® Growth Index |
9.56% | 5.37% | 11.69% | |||||||||
| 1 |
The Fund changed its broad-based securities market index to the Bloomberg US 3000 Index which is similarly representative of the overall securities market applicable to the Fund. |
| 2 |
The Fund changed its additional index to the Bloomberg US Mid Cap Growth Index which has similar investment objectives to the Fund. |
Visit touchstoneinvestments.com/mutual-funds for the most recent performance information.
Key Fund Statistics
|
Fund net assets |
$ | 1,800,343,184 | ||
|
Total number of portfolio holdings |
55 | |||
|
Total advisory fees paid |
$10,313,147 | |||
|
Portfolio turnover rate |
85% | |||
Graphical Representation of Holdings
| SECTOR ALLOCATION (% OF NET ASSETS) | ||||
|
Industrials |
30.0% | |||
|
Consumer Discretionary |
17.1% | |||
|
Health Care |
15.8% | |||
|
Information Technology |
13.2% | |||
|
Financials |
12.7% | |||
|
Energy |
4.7% | |||
|
Communication Services |
2.7% | |||
|
Utilities |
1.8% | |||
|
Materials |
0.6% | |||
|
Short-Term Investment Fund |
1.3% | |||
|
Other Assets/Liabilities (Net) |
0.1% | |||
|
Total |
100.0% | |||
Fund Expenses
|
Class |
Costs of a $10,000 investment |
Costs paid as a percentage of a $10,000 investment |
||||
|
Class C |
$218 | 2.01% | ||||
Management’s Discussion of Fund Performance
The Fund seeks to increase the value of Fund shares by primarily investing in stocks of mid‑cap U.S. companies. The Fund’s portfolio managers place focus on companies that they believe to have a demonstrated record of achievement with excellent prospects for earnings growth over a 1‑to‑3‑year period. The Fund’s sub‑adviser, Westfield Capital Management Company, L.P., looks for companies that it believes are reasonably priced with high forecasted earnings potential.
The Fund’s Class C shares performance was 16.94% (excluding sales loads) for the reporting period.
The environment over the 12 month period ended March 31, 2026 was marked by strong equity market performance, as a powerful rebound in mid‑2025, driven by artificial intelligence (AI) momentum, resilient earnings, and easing tariff pressures, pushed major indices to record highs and supported a soft-landing narrative. While improving breadth and sector rotation signaled a healthier backdrop, market behavior grew increasingly speculative through the third quarter before leadership broadened later in the year toward cyclicals and small caps amid easing financial conditions. More recently, markets reversed as geopolitical shocks and energy supply disruptions contributed to a first calendar quarter decline, highlighting a shift toward greater volatility and dispersion.
The factors that contributed most to the Fund’s performance during the period were:
|
FACTOR |
PERFORMANCE IMPACT |
OBSERVATIONS | ||
|
Industrials Stocks |
Positive |
Stock selection was a leading contributor to the Fund’s relative outperformance during the 12‑month period. Industrial stock holding Vertiv Holdings Co. was a top contributor, driven by strong organic order growth and tailwinds from AI infrastructure buildout. | ||
|
Consumer Discretionary Stocks |
Positive |
Tapestry, Inc. was a top contributor driven by brand elevation and pricing power. | ||
|
Financials Stocks |
Positive |
Financials stocks contributed positively, driven by exposure to banks, (Fifth Third Bancorp) and trading platforms (Robinhood Markets, Inc.). | ||
|
Information Technology (IT) Stocks |
Negative |
Software exposure (Atlassian Corp.) was the biggest detractor as AI displacement fears weighed heavily on the group. | ||
Over the past year, the Fund increased its exposure to Consumer Discretionary and Industrials while reducing its allocation to Information Technology.
Fund Performance
The following graph compares the initial and subsequent account values at the end of each of the most recently completed 10 fiscal years or since inception of the Fund. The graph assumes a $10,000 initial investment in the Fund and an appropriate broad-based securities market index and any additional indexes and assumes maximum sales charges, if any.
GROWTH OF $10,000
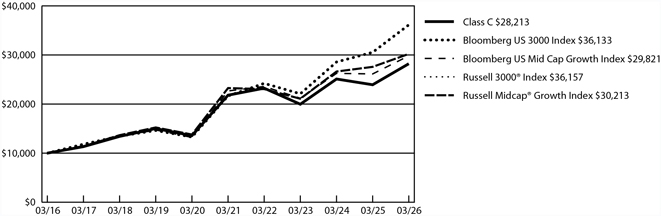
|
AVERAGE ANNUAL TOTAL RETURNS |
1 Year | 5 Years | 10 Years | |||||||||
|
Class C |
15.94% | 4.94% | 10.93% | |||||||||
|
Class C - excluding sales load |
16.94% | 4.94% | 10.93% | |||||||||
|
Bloomberg US 3000 Index1 |
18.30% | 10.78% | 13.71% | |||||||||
|
Bloomberg US Mid Cap Growth Index2 |
14.10% | 5.64% | 11.55% | |||||||||
|
Russell 3000® Index |
18.09% | 10.87% | 13.72% | |||||||||
|
Russell Midcap® Growth Index |
9.56% | 5.37% | 11.69% | |||||||||
| 1 |
The Fund changed its broad-based securities market index to the Bloomberg US 3000 Index which is similarly representative of the overall securities market applicable to the Fund. |
| 2 |
The Fund changed its additional index to the Bloomberg US Mid Cap Growth Index which has similar investment objectives to the Fund. |
Visit touchstoneinvestments.com/mutual-funds for the most recent performance information.
Key Fund Statistics
|
Fund net assets |
$ | 1,800,343,184 | ||
|
Total number of portfolio holdings |
55 | |||
|
Total advisory fees paid |
$10,313,147 | |||
|
Portfolio turnover rate |
85% | |||
Graphical Representation of Holdings
| SECTOR ALLOCATION (% OF NET ASSETS) | ||||
|
Industrials |
30.0% | |||
|
Consumer Discretionary |
17.1% | |||
|
Health Care |
15.8% | |||
|
Information Technology |
13.2% | |||
|
Financials |
12.7% | |||
|
Energy |
4.7% | |||
|
Communication Services |
2.7% | |||
|
Utilities |
1.8% | |||
|
Materials |
0.6% | |||
|
Short-Term Investment Fund |
1.3% | |||
|
Other Assets/Liabilities (Net) |
0.1% | |||
|
Total |
100.0% | |||
Fund Expenses
|
Class |
Costs of a $10,000 investment |
Costs paid as a percentage of a $10,000 investment |
||||
|
Class Y |
$107 | 0.98% | ||||
Management’s Discussion of Fund Performance
The Fund seeks to increase the value of Fund shares by primarily investing in stocks of mid‑cap U.S. companies. The Fund’s portfolio managers place focus on companies that they believe to have a demonstrated record of achievement with excellent prospects for earnings growth over a 1‑to‑3‑year period. The Fund’s sub‑adviser, Westfield Capital Management Company, L.P., looks for companies that it believes are reasonably priced with high forecasted earnings potential.
The Fund’s Class Y shares performance was 18.17% for the reporting period.
The environment over the 12 month period ended March 31, 2026 was marked by strong equity market performance, as a powerful rebound in mid‑2025, driven by artificial intelligence (AI) momentum, resilient earnings, and easing tariff pressures, pushed major indices to record highs and supported a soft-landing narrative. While improving breadth and sector rotation signaled a healthier backdrop, market behavior grew increasingly speculative through the third quarter before leadership broadened later in the year toward cyclicals and small caps amid easing financial conditions. More recently, markets reversed as geopolitical shocks and energy supply disruptions contributed to a first calendar quarter decline, highlighting a shift toward greater volatility and dispersion.
The factors that contributed most to the Fund’s performance during the period were:
|
FACTOR |
PERFORMANCE
IMPACT |
OBSERVATIONS | ||
|
Industrials Stocks |
Positive |
Stock selection was a leading contributor to the Fund’s relative outperformance during the 12‑month period. Industrial stock holding Vertiv Holdings Co. was a top contributor, driven by strong organic order growth and tailwinds from AI infrastructure buildout. | ||
|
Consumer Discretionary Stocks |
Positive |
Tapestry, Inc. was a top contributor driven by brand elevation and pricing power. | ||
|
Financials Stocks |
Positive |
Financials stocks contributed positively, driven by exposure to banks, (Fifth Third Bancorp) and trading platforms (Robinhood Markets, Inc.). | ||
|
Information Technology (IT) Stocks |
Negative |
Software exposure (Atlassian Corp.) was the biggest detractor as AI displacement fears weighed heavily on the group. | ||
Over the past year, the Fund increased its exposure to Consumer Discretionary and Industrials while reducing its allocation to Information Technology.
Fund Performance
The following graph compares the initial and subsequent account values at the end of each of the most recently completed 10 fiscal years or since inception of the Fund. The graph assumes a $10,000 initial investment in the Fund and an appropriate broad-based securities market index and any additional indexes and assumes maximum sales charges, if any.
GROWTH OF $10,000
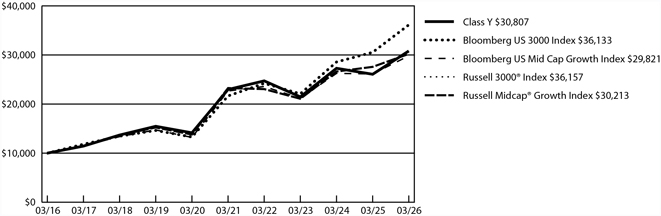
|
AVERAGE ANNUAL TOTAL RETURNS |
1 Year | 5 Years | 10 Years | |||||||||
|
Class Y |
18.17% | 6.05% | 11.91% | |||||||||
|
Bloomberg US 3000 Index1 |
18.30% | 10.78% | 13.71% | |||||||||
|
Bloomberg US Mid Cap Growth Index2 |
14.10% | 5.64% | 11.55% | |||||||||
|
Russell 3000® Index |
18.09% | 10.87% | 13.72% | |||||||||
|
Russell Midcap® Growth Index |
9.56% | 5.37% | 11.69% | |||||||||
| 1 |
The Fund changed its broad-based securities market index to the Bloomberg US 3000 Index which is similarly representative of the overall securities market applicable to the Fund. |
| 2 |
The Fund changed its additional index to the Bloomberg US Mid Cap Growth Index which has similar investment objectives to the Fund. |
Visit touchstoneinvestments.com/mutual-funds for the most recent performance information.
Key Fund Statistics
|
Fund net assets |
$1,800,343,184 | |||
|
Total number of portfolio holdings |
55 | |||
|
Total advisory fees paid |
$10,313,147 | |||
|
Portfolio turnover rate |
85% | |||
Graphical Representation of Holdings
| SECTOR ALLOCATION (% OF NET ASSETS) | ||||
|
Industrials |
30.0% | |||
|
Consumer Discretionary |
17.1% | |||
|
Health Care |
15.8% | |||
|
Information Technology |
13.2% | |||
|
Financials |
12.7% | |||
|
Energy |
4.7% | |||
|
Communication Services |
2.7% | |||
|
Utilities |
1.8% | |||
|
Materials |
0.6% | |||
|
Short-Term Investment Fund |
1.3% | |||
|
Other Assets/Liabilities (Net) |
0.1% | |||
|
Total |
100.0% | |||
Fund Expenses
|
Class |
Costs of a $10,000
investment |
Costs paid as a percentage
of a $10,000 investment |
||||
|
Institutional Class |
$96 | 0.88% | ||||
Management’s Discussion of Fund Performance
The Fund seeks to increase the value of Fund shares by primarily investing in stocks of mid‑cap U.S. companies. The Fund’s portfolio managers place focus on companies that they believe to have a demonstrated record of achievement with excellent prospects for earnings growth over a 1-to-3-year period. The Fund’s sub-adviser, Westfield Capital Management Company, L.P., looks for companies that it believes are reasonably priced with high forecasted earnings potential.
The Fund’s Institutional Class shares performance was 18.29% for the reporting period.
The environment over the 12 month period ended March 31, 2026 was marked by strong equity market performance, as a powerful rebound in mid‑2025, driven by artificial intelligence (AI) momentum, resilient earnings, and easing tariff pressures, pushed major indices to record highs and supported a soft-landing narrative. While improving breadth and sector rotation signaled a healthier backdrop, market behavior grew increasingly speculative through the third quarter before leadership broadened later in the year toward cyclicals and small caps amid easing financial conditions. More recently, markets reversed as geopolitical shocks and energy supply disruptions contributed to a first calendar quarter decline, highlighting a shift toward greater volatility and dispersion.
The factors that contributed most to the Fund’s performance during the period were:
|
FACTOR |
PERFORMANCE
IMPACT |
OBSERVATIONS | ||
|
Industrials Stocks |
Positive |
Stock selection was a leading contributor to the Fund’s relative outperformance during the 12-month period. Industrial stock holding Vertiv Holdings Co. was a top contributor, driven by strong organic order growth and tailwinds from AI infrastructure buildout. | ||
|
Consumer Discretionary Stocks |
Positive |
Tapestry, Inc. was a top contributor driven by brand elevation and pricing power. | ||
|
Financials Stocks |
Positive |
Financials stocks contributed positively, driven by exposure to banks, (Fifth Third Bancorp) and trading platforms (Robinhood Markets, Inc.). | ||
|
Information Technology (IT) Stocks |
Negative |
Software exposure (Atlassian Corp.) was the biggest detractor as AI displacement fears weighed heavily on the group. | ||
Over the past year, the Fund increased its exposure to Consumer Discretionary and Industrials while reducing its allocation to Information Technology.
Fund Performance
The following graph compares the initial and subsequent account values at the end of each of the most recently completed 10 fiscal years or since inception of the Fund. The graph assumes a $10,000 initial investment in the Fund and an appropriate broad-based securities market index and any additional indexes and assumes maximum sales charges, if any.
GROWTH OF $10,000
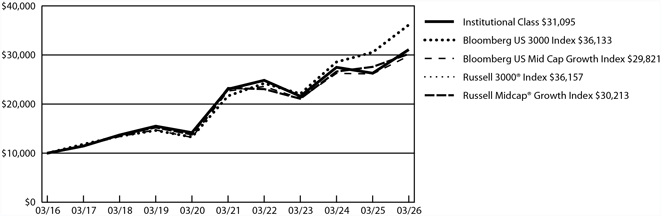
|
AVERAGE ANNUAL TOTAL RETURNS |
1 Year | 5 Years | 10 Years | |||||||||
|
Institutional Class |
18.29% | 6.18% | 12.01% | |||||||||
|
Bloomberg US 3000 Index1 |
18.30% | 10.78% | 13.71% | |||||||||
|
Bloomberg US Mid Cap Growth Index2 |
14.10% | 5.64% | 11.55% | |||||||||
|
Russell 3000® Index |
18.09% | 10.87% | 13.72% | |||||||||
|
Russell Midcap® Growth Index |
9.56% | 5.37% | 11.69% | |||||||||
| 1 |
The Fund changed its broad-based securities market index to the Bloomberg US 3000 Index which is similarly representative of the overall securities market applicable to the Fund. |
| 2 |
The Fund changed its additional index to the Bloomberg US Mid Cap Growth Index which has similar investment objectives to the Fund. |
Visit touchstoneinvestments.com/mutual-funds for the most recent performance information.
Key Fund Statistics
|
Fund net assets |
$1,800,343,184 | |||
|
Total number of portfolio holdings |
55 | |||
|
Total advisory fees paid |
$10,313,147 | |||
|
Portfolio turnover rate |
85% | |||
Graphical Representation of Holdings
| SECTOR ALLOCATION (% OF NET ASSETS) | ||||
|
Industrials |
30.0 | % | ||
|
Consumer Discretionary |
17.1 | % | ||
|
Health Care |
15.8 | % | ||
|
Information Technology |
13.2 | % | ||
|
Financials |
12.7 | % | ||
|
Energy |
4.7 | % | ||
|
Communication Services |
2.7 | % | ||
|
Utilities |
1.8 | % | ||
|
Materials |
0.6 | % | ||
|
Short-Term Investment Fund |
1.3 | % | ||
|
Other Assets/Liabilities (Net) |
0.1 | % | ||
|
Total |
100.0 | % | ||
Fund Expenses
|
Class |
Costs of a $10,000 investment |
Costs paid as a percentage of a $10,000 investment |
||||
|
Class R6 |
$86 | 0.79% | ||||
Management’s Discussion of Fund Performance
The Fund seeks to increase the value of Fund shares by primarily investing in stocks of mid‑cap U.S. companies. The Fund’s portfolio managers place focus on companies that they believe to have a demonstrated record of achievement with excellent prospects for earnings growth over a 1‑to‑3‑year period. The Fund’s sub‑adviser, Westfield Capital Management Company, L.P., looks for companies that it believes are reasonably priced with high forecasted earnings potential.
The Fund’s Class R6 shares performance was 18.39% for the reporting period.
The environment over the 12 month period ended March 31, 2026 was marked by strong equity market performance, as a powerful rebound in mid‑2025, driven by artificial intelligence (AI) momentum, resilient earnings, and easing tariff pressures, pushed major indices to record highs and supported a soft-landing narrative. While improving breadth and sector rotation signaled a healthier backdrop, market behavior grew increasingly speculative through the third quarter before leadership broadened later in the year toward cyclicals and small caps amid easing financial conditions. More recently, markets reversed as geopolitical shocks and energy supply disruptions contributed to a first calendar quarter decline, highlighting a shift toward greater volatility and dispersion.
The factors that contributed most to the Fund’s performance during the period were:
|
FACTOR |
PERFORMANCE IMPACT |
OBSERVATIONS | ||
|
Industrials Stocks |
Positive |
Stock selection was a leading contributor to the Fund’s relative outperformance during the 12‑month period. Industrial stock holding Vertiv Holdings Co. was a top contributor, driven by strong organic order growth and tailwinds from AI infrastructure buildout. | ||
|
Consumer Discretionary Stocks |
Positive |
Tapestry, Inc. was a top contributor driven by brand elevation and pricing power. | ||
|
Financials Stocks |
Positive |
Financials stocks contributed positively, driven by exposure to banks, (Fifth Third Bancorp) and trading platforms (Robinhood Markets, Inc.). | ||
|
Information Technology (IT) Stocks |
Negative |
Software exposure (Atlassian Corp.) was the biggest detractor as AI displacement fears weighed heavily on the group. | ||
Over the past year, the Fund increased its exposure to Consumer Discretionary and Industrials while reducing its allocation to Information Technology.
Fund Performance
The following graph compares the initial and subsequent account values at the end of each of the most recently completed 10 fiscal years or since inception of the Fund. The graph assumes a $10,000 initial investment in the Fund and an appropriate broad-based securities market index and any additional indexes and assumes maximum sales charges, if any.
GROWTH OF $10,000

|
AVERAGE ANNUAL TOTAL RETURNS |
1 Year | 5 Years | 10 Years | |||||||||
|
Class R61 |
18.39% | 6.29% | 11.94% | |||||||||
|
Bloomberg US 3000 Index2 |
18.30% | 10.78% | 13.71% | |||||||||
|
Bloomberg US Mid Cap Growth Index3 |
14.10% | 5.64% | 11.55% | |||||||||
|
Russell 3000® Index |
18.09% | 10.87% | 13.72% | |||||||||
|
Russell Midcap® Growth Index |
9.56% | 5.37% | 11.69% | |||||||||
| 1 |
The inception date was February 10, 2020. Performance information was calculated using the historical performance of Class A shares for the periods prior to February 10, 2020. |
| 2 |
The Fund changed its broad-based securities market index to the Bloomberg US 3000 Index which is similarly representative of the overall securities market applicable to the Fund. |
| 3 |
The Fund changed its additional index to the Bloomberg US Mid Cap Growth Index which has similar investment objectives to the Fund. |
Visit touchstoneinvestments.com/mutual-funds for the most recent performance information.
Key Fund Statistics
|
Fund net assets |
$ | 1,800,343,184 | ||
|
Total number of portfolio holdings |
55 | |||
|
Total advisory fees paid |
$10,313,147 | |||
|
Portfolio turnover rate |
85% | |||
Graphical Representation of Holdings
| SECTOR ALLOCATION (% OF NET ASSETS) | ||||
|
Industrials |
30.0 | % | ||
|
Consumer Discretionary |
17.1 | % | ||
|
Health Care |
15.8 | % | ||
|
Information Technology |
13.2 | % | ||
|
Financials |
12.7 | % | ||
|
Energy |
4.7 | % | ||
|
Communication Services |
2.7 | % | ||
|
Utilities |
1.8 | % | ||
|
Materials |
0.6 | % | ||
|
Short-Term Investment Fund |
1.3 | % | ||
|
Other Assets/Liabilities (Net) |
0.1 | % | ||
|
Total |
100.0 | % | ||
Fund Expenses
|
Class
|
Costs of a $10,000 investment |
Costs paid as a percentage of a $10,000 investment |
||||
|
Class R6
|
$621 | 0.57% | ||||
| 1 |
Based on operations for the period May 9, 2025 (commencement of operations) to March 31, 2026. Expenses for a full reporting period would be higher.
|
Management’s Discussion of Fund Performance
The Fund seeks long-term growth of capital by primarily investing in stocks of U.S. companies with any market capitalization. The Fund’s portfolio managers place focus on companies they believe to have demonstrated records of achievement with excellent prospects for earnings growth over a 1 to 3 year period. The Fund’s sub‑adviser, Westfield Capital Management Company, L.P., looks for companies that it believes are reasonably priced with high forecasted earnings potential.
The Fund’s Class R6 shares performance was 21.01% for the reporting period.
During the 9‑month period from April 1, 2025 to December 31, 2025, Technology was a dominant force within the U.S. Exceptional earnings growth in U.S. technology and accelerating innovation, particularly in artificial intelligence, reshaped investor expectations and fueled global momentum. Additionally, gold, silver, and platinum soared to record highs in the period, propelling mining shares significantly higher. Lastly, during the first quarter of 2026, the Energy sector rallied due to the U.S.-Israeli military campaign against Iran and the disruption of the Strait of Hormuz, which handles roughly 20% of global oil supply.
The factors that contributed most to the Fund’s performance during the period were:
|
FACTOR
|
PERFORMANCE
IMPACT
|
OBSERVATIONS | ||
|
Peer Momentum
|
Positive |
Securities in similar industries rallied in concert during the quarter.
|
||
|
Long Term Growth
|
Positive |
The Fund’s overweight to companies with robust long term growth prospects added to performance, as growth was rewarded.
|
||
|
Book to Price
|
Positive |
Additionally, the Fund’s tilt towards companies with favorable Book to Price valuations contributed to performance.
|
||
|
Analyst Insight
|
Positive |
Securities with positive revisions by the sell-side analyst community rallied during the year.
|
||
|
Communication Services
|
Negative |
Stock selection within the sector was the largest detractor to relative performance.
|
||
During the period, the Fund notably increased its weight towards the Information Technology sector due to its strong growth prospects and favorable valuations.
Fund Performance
The following graph compares the initial and subsequent account values at the end of each of the most recently completed 10 fiscal years or since inception of the Fund. The graph assumes a $10,000 initial investment in the Fund and an appropriate broad-based securities market index and any additional indexes and assumes maximum sales charges, if any.
GROWTH OF $10,000
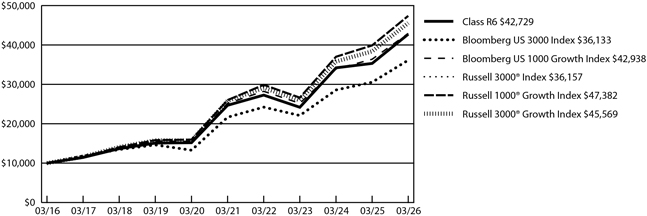
|
AVERAGE ANNUAL TOTAL RETURNS
|
1 Year | 5 Years | 10 Years | |||||||||
|
Class R61
|
21.01% | 11.60% | 15.63% | |||||||||
|
Bloomberg US 3000 Index2
|
18.30% | 10.78% | 13.71% | |||||||||
|
Bloomberg US 1000 Growth Index3
|
18.04% | 11.26% | 15.69% | |||||||||
|
Russell 3000® Index
|
18.09% | 10.87% | 13.72% | |||||||||
|
Russell 1000® Growth Index
|
18.81% | 12.76% | 16.83% | |||||||||
|
Russell 3000® Growth Index
|
18.75% | 12.05% | 16.38% | |||||||||
| 1 |
The inception date was May 9, 2025. Performance information was calculated using the historical performance of Class A shares for the periods prior to May 9, 2025.
|
| 2 |
The Fund changed its broad-based securities market index to the Bloomberg US 3000 Index which is similarly representative of the overall securities market applicable to the Fund.
|
| 3 |
The Fund changed its additional index to the Bloomberg US 1000 Growth Index which has similar investment objectives to the Fund.
|
Visit touchstoneinvestments.com/mutual-funds for the most recent performance information.
Key Fund Statistics
|
Fund net assets
|
$140,445,165 | |||
|
Total number of portfolio holdings
|
92 | |||
|
Total advisory fees paid
|
$820,556 | |||
|
Portfolio turnover rate
|
176% | |||
Graphical Representation of Holdings
| SECTOR ALLOCATION (% OF NET ASSETS) | ||||
|
Information Technology
|
51.8% | |||
|
Health Care
|
10.1% | |||
|
Communication Services
|
10.1% | |||
|
Consumer Discretionary
|
8.8% | |||
|
Financials
|
7.5% | |||
|
Industrials
|
6.5% | |||
|
Energy
|
2.0% | |||
|
Consumer Staples
|
1.4% | |||
|
Utilities
|
0.9% | |||
|
Materials
|
0.5% | |||
|
Short-Term Investment Fund
|
0.5% | |||
|
Other Assets/Liabilities (Net)
|
(0.1)% | |||
|
Total
|
100.0% | |||
Material Fund Changes
The following is a summary of certain changes made to the Fund effective May 9, 2025. For more complete information, you may review the Fund’s current prospectus, at touchstoneinvestments.com/mutual-funds or upon request at 800.543.0407. The Fund’s name was changed from the Touchstone Growth Opportunities Fund to the Touchstone Dynamic Large Cap Growth Fund. In connection with the name change, Los Angeles Capital Management LLC (“Los Angeles Capital”) was appointed as the Fund’s sub‑adviser, the Fund adopted an 80% investment policy and other changes were made to the Fund’s principal investment strategies to reflect Los Angeles Capital’s investment strategy. In connection with the changes in principal investment strategies, Quantitative Strategy Risk was added as a principal risk of the Fund.
Fund Expenses
|
Class
|
Costs of a $10,000 investment |
Costs paid as a percentage of a $10,000 investment |
||||
|
Institutional Class
|
$72 | 0.65% | ||||
Management’s Discussion of Fund Performance
The Fund seeks long-term growth of capital by primarily investing in stocks of U.S. companies with any market capitalization. The Fund’s portfolio managers place focus on companies they believe to have demonstrated records of achievement with excellent prospects for earnings growth over a 1 to 3 year period. The Fund’s sub‑adviser, Westfield Capital Management Company, L.P., looks for companies that it believes are reasonably priced with high forecasted earnings potential.
The Fund’s Institutional Class shares performance was 20.91% for the reporting period.
During the 9‑month period from April 1, 2025 to December 31, 2025, Technology was a dominant force within the U.S. Exceptional earnings growth in U.S. technology and accelerating innovation, particularly in artificial intelligence, reshaped investor expectations and fueled global momentum. Additionally, gold, silver, and platinum soared to record highs in the period, propelling mining shares significantly higher. Lastly, during the first quarter of 2026, the Energy sector rallied due to the U.S.-Israeli military campaign against Iran and the disruption of the Strait of Hormuz, which handles roughly 20% of global oil supply.
The factors that contributed most to the Fund’s performance during the period were:
|
FACTOR
|
PERFORMANCE IMPACT |
OBSERVATIONS | ||
|
Peer Momentum
|
Positive |
Securities in similar industries rallied in concert during the quarter.
|
||
|
Long Term Growth
|
Positive |
The Fund’s overweight to companies with robust long term growth prospects added to performance, as growth was rewarded.
|
||
|
Book to Price
|
Positive |
Additionally, the Fund’s tilt towards companies with favorable Book to Price valuations contributed to performance.
|
||
|
Analyst Insight
|
Positive |
Securities with positive revisions by the sell-side analyst community rallied during the year.
|
||
|
Communication Services
|
Negative |
Stock selection within the sector was the largest detractor to relative performance.
|
||
During the period, the Fund notably increased its weight towards the Information Technology sector due to its strong growth prospects and favorable valuations.
Fund Performance
The following graph compares the initial and subsequent account values at the end of each of the most recently completed 10 fiscal years or since inception of the Fund. The graph assumes a $10,000 initial investment in the Fund and an appropriate broad-based securities market index and any additional indexes and assumes maximum sales charges, if any.
GROWTH OF $10,000
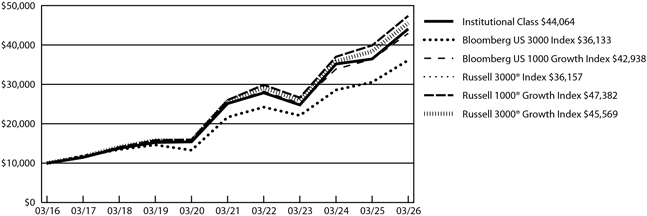
|
AVERAGE ANNUAL TOTAL RETURNS
|
1 Year | 5 Years | 10 Years | |||||||||
|
Institutional Class
|
20.91% | 11.89% | 15.99% | |||||||||
|
Bloomberg US 3000 Index1
|
18.30% | 10.78% | 13.71% | |||||||||
|
Bloomberg US 1000 Growth Index2
|
18.04% | 11.26% | 15.69% | |||||||||
|
Russell 3000® Index
|
18.09% | 10.87% | 13.72% | |||||||||
|
Russell 1000® Growth Index
|
18.81% | 12.76% | 16.83% | |||||||||
|
Russell 3000® Growth Index
|
18.75% | 12.05% | 16.38% | |||||||||
| 1 |
The Fund changed its broad-based securities market index to the Bloomberg US 3000 Index which is similarly representative of the overall securities market applicable to the Fund.
|
| 2 |
The Fund changed its additional index to the Bloomberg US 1000 Growth Index which has similar investment objectives to the Fund.
|
Visit touchstoneinvestments.com/mutual-funds for the most recent performance information.
Key Fund Statistics
|
Fund net assets
|
$ | 140,445,165 | ||
|
Total number of portfolio holdings
|
92 | |||
|
Total advisory fees paid
|
$820,556 | |||
|
Portfolio turnover rate
|
176% | |||
Graphical Representation of Holdings
| SECTOR ALLOCATION (% OF NET ASSETS) | ||||
|
Information Technology
|
51.8% | |||
|
Health Care
|
10.1% | |||
|
Communication Services
|
10.1% | |||
|
Consumer Discretionary
|
8.8% | |||
|
Financials
|
7.5% | |||
|
Industrials
|
6.5% | |||
|
Energy
|
2.0% | |||
|
Consumer Staples
|
1.4% | |||
|
Utilities
|
0.9% | |||
|
Materials
|
0.5% | |||
|
Short-Term Investment Fund
|
0.5% | |||
|
Other Assets/Liabilities (Net)
|
(0.1)% | |||
|
Total
|
100.0% | |||
Material Fund Changes
The following is a summary of certain changes made to the Fund effective May 9, 2025. For more complete information, you may review the Fund’s current prospectus, at touchstoneinvestments.com/mutual-funds or upon request at 800.543.0407. The Fund’s name was changed from the Touchstone Growth Opportunities Fund to the Touchstone Dynamic Large Cap Growth Fund. In connection with the name change, Los Angeles Capital Management LLC (“Los Angeles Capital”) was appointed as the Fund’s sub‑adviser, the Fund adopted an 80% investment policy and other changes were made to the Fund’s principal investment strategies to reflect Los Angeles Capital’s investment strategy. In connection with the changes in principal investment strategies, Quantitative Strategy Risk was added as a principal risk of the Fund. Additionally, the Fund will pay its investment adviser, Touchstone Advisors, Inc., an advisory fee at an annualized rate of 0.60% on the first $200 million and 0.40% on assets over $200 million and the Institutional Class expense limitation was reduced to 0.60% of average daily net assets.
Fund Expenses
|
Class
|
Costs of a $10,000 investment |
Costs paid as a percentage of a $10,000 investment |
||||
|
Class Y
|
$78 | 0.71% | ||||
Management’s Discussion of Fund Performance
The Fund seeks long-term growth of capital by primarily investing in stocks of U.S. companies with any market capitalization. The Fund’s portfolio managers place focus on companies they believe to have demonstrated records of achievement with excellent prospects for earnings growth over a 1 to 3 year period. The Fund’s sub‑adviser, Westfield Capital Management Company, L.P., looks for companies that it believes are reasonably priced with high forecasted earnings potential.
The Fund’s Class Y shares performance was 20.84% for the reporting period.
During the 9‑month period from April 1, 2025 to December 31, 2025, Technology was a dominant force within the U.S. Exceptional earnings growth in U.S. technology and accelerating innovation, particularly in artificial intelligence, reshaped investor expectations and fueled global momentum. Additionally, gold, silver, and platinum soared to record highs in the period, propelling mining shares significantly higher. Lastly, during the first quarter of 2026, the Energy sector rallied due to the U.S.-Israeli military campaign against Iran and the disruption of the Strait of Hormuz, which handles roughly 20% of global oil supply.
The factors that contributed most to the Fund’s performance during the period were:
|
FACTOR
|
PERFORMANCE
IMPACT
|
OBSERVATIONS | ||
|
Peer Momentum
|
Positive |
Securities in similar industries rallied in concert during the quarter.
|
||
|
Long Term Growth
|
Positive |
The Fund’s overweight to companies with robust long term growth prospects added to performance, as growth was rewarded.
|
||
|
Book to Price
|
Positive |
Additionally, the Fund’s tilt towards companies with favorable Book to Price valuations contributed to performance.
|
||
|
Analyst Insight
|
Positive |
Securities with positive revisions by the sell-side analyst community rallied during the year.
|
||
|
Communication Services
|
Negative |
Stock selection within the sector was the largest detractor to relative performance.
|
||
During the period, the Fund notably increased its weight towards the Information Technology sector due to its strong growth prospects and favorable valuations.
Fund Performance
The following graph compares the initial and subsequent account values at the end of each of the most recently completed 10 fiscal years or since inception of the Fund. The graph assumes a $10,000 initial investment in the Fund and an appropriate broad-based securities market index and any additional indexes and assumes maximum sales charges, if any.
GROWTH OF $10,000
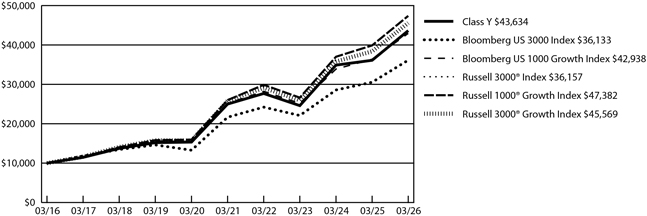
|
AVERAGE ANNUAL TOTAL RETURNS
|
1 Year | 5 Years | 10 Years | |||||||||
|
Class Y
|
20.84% | 11.79% | 15.87% | |||||||||
|
Bloomberg US 3000 Index1
|
18.30% | 10.78% | 13.71% | |||||||||
|
Bloomberg US 1000 Growth Index2
|
18.04% | 11.26% | 15.69% | |||||||||
|
Russell 3000® Index
|
18.09% | 10.87% | 13.72% | |||||||||
|
Russell 1000® Growth Index
|
18.81% | 12.76% | 16.83% | |||||||||
|
Russell 3000® Growth Index
|
18.75% | 12.05% | 16.38% | |||||||||
| 1 |
The Fund changed its broad-based securities market index to the Bloomberg US 3000 Index which is similarly representative of the overall securities market applicable to the Fund.
|
| 2 |
The Fund changed its additional index to the Bloomberg US 1000 Growth Index which has similar investment objectives to the Fund.
|
Visit touchstoneinvestments.com/mutual-funds for the most recent performance information.
Key Fund Statistics
|
Fund net assets
|
$140,445,165 | |||
|
Total number of portfolio holdings
|
92 | |||
|
Total advisory fees paid
|
$820,556 | |||
|
Portfolio turnover rate
|
176% | |||
Graphical Representation of Holdings
| SECTOR ALLOCATION (% OF NET ASSETS) | ||||
|
Information Technology
|
51.8% | |||
|
Health Care
|
10.1% | |||
|
Communication Services
|
10.1% | |||
|
Consumer Discretionary
|
8.8% | |||
|
Financials
|
7.5% | |||
|
Industrials
|
6.5% | |||
|
Energy
|
2.0% | |||
|
Consumer Staples
|
1.4% | |||
|
Utilities
|
0.9% | |||
|
Materials
|
0.5% | |||
|
Short-Term Investment Fund
|
0.5% | |||
|
Other Assets/Liabilities (Net)
|
(0.1)% | |||
|
Total
|
100.0% | |||
Material Fund Changes
The following is a summary of certain changes made to the Fund effective May 9, 2025. For more complete information, you may review the Fund’s current prospectus, at touchstoneinvestments.com/mutual-funds or upon request at 800.543.0407. The Fund’s name was changed from the Touchstone Growth Opportunities Fund to the Touchstone Dynamic Large Cap Growth Fund. In connection with the name change, Los Angeles Capital Management LLC (“Los Angeles Capital”) was appointed as the Fund’s sub‑adviser, the Fund adopted an 80% investment policy and other changes were made to the Fund’s principal investment strategies to reflect Los Angeles Capital’s investment strategy. In connection with the changes in principal investment strategies, Quantitative Strategy Risk was added as a principal risk of the Fund. Additionally, the Fund will pay its investment adviser, Touchstone Advisors, Inc., an advisory fee at an annualized rate of 0.60% on the first $200 million and 0.40% on assets over $200 million and the Class Y expense limitation was reduced to 0.66% of average daily net assets.
Fund Expenses
|
Class
|
Costs of a $10,000 investment |
Costs paid as a percentage of a $10,000 investment |
||||
|
Class C
|
$193 | 1.76% | ||||
Management’s Discussion of Fund Performance
The Fund seeks long-term growth of capital by primarily investing in stocks of U.S. companies with any market capitalization. The Fund’s portfolio managers place focus on companies they believe to have demonstrated records of achievement with excellent prospects for earnings growth over a 1 to 3 year period. The Fund’s sub‑adviser, Westfield Capital Management Company, L.P., looks for companies that it believes are reasonably priced with high forecasted earnings potential.
The Fund’s Class C shares performance was 19.58% (excluding sales loads) for the reporting period.
During the 9‑month period from April 1, 2025 to December 31, 2025, Technology was a dominant force within the U.S. Exceptional earnings growth in U.S. technology and accelerating innovation, particularly in artificial intelligence, reshaped investor expectations and fueled global momentum. Additionally, gold, silver, and platinum soared to record highs in the period, propelling mining shares significantly higher. Lastly, during the first quarter of 2026, the Energy sector rallied due to the U.S.-Israeli military campaign against Iran and the disruption of the Strait of Hormuz, which handles roughly 20% of global oil supply.
The factors that contributed most to the Fund’s performance during the period were:
|
FACTOR
|
PERFORMANCE IMPACT |
OBSERVATIONS | ||
|
Peer Momentum
|
Positive |
Securities in similar industries rallied in concert during the quarter.
|
||
|
Long Term Growth
|
Positive |
The Fund’s overweight to companies with robust long term growth prospects added to performance, as growth was rewarded.
|
||
|
Book to Price
|
Positive |
Additionally, the Fund’s tilt towards companies with favorable Book to Price valuations contributed to performance.
|
||
|
Analyst Insight
|
Positive |
Securities with positive revisions by the sell-side analyst community rallied during the year.
|
||
|
Communication Services
|
Negative |
Stock selection within the sector was the largest detractor to relative performance.
|
||
During the period, the Fund notably increased its weight towards the Information Technology sector due to its strong growth prospects and favorable valuations.
Fund Performance
The following graph compares the initial and subsequent account values at the end of each of the most recently completed 10 fiscal years or since inception of the Fund. The graph assumes a $10,000 initial investment in the Fund and an appropriate broad-based securities market index and any additional indexes and assumes maximum sales charges, if any.
GROWTH OF $10,000
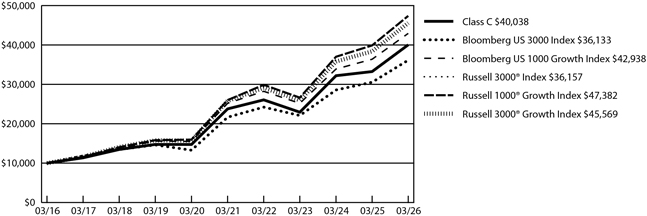
|
AVERAGE ANNUAL TOTAL RETURNS
|
1 Year | 5 Years | 10 Years | |||||||||
|
Class C
|
18.58% | 10.67% | 14.88% | |||||||||
|
Class C - excluding sales load
|
19.58% | 10.67% | 14.88% | |||||||||
|
Bloomberg US 3000 Index1
|
18.30% | 10.78% | 13.71% | |||||||||
|
Bloomberg US 1000 Growth Index2
|
18.04% | 11.26% | 15.69% | |||||||||
|
Russell 3000® Index
|
18.09% | 10.87% | 13.72% | |||||||||
|
Russell 1000® Growth Index
|
18.81% | 12.76% | 16.83% | |||||||||
|
Russell 3000® Growth Index
|
18.75% | 12.05% | 16.38% | |||||||||
| 1 |
The Fund changed its broad-based securities market index to the Bloomberg US 3000 Index which is similarly representative of the overall securities market applicable to the Fund.
|
| 2 |
The Fund changed its additional index to the Bloomberg US 1000 Growth Index which has similar investment objectives to the Fund.
|
Visit touchstoneinvestments.com/mutual-funds for the most recent performance information.
Key Fund Statistics
|
Fund net assets
|
$ | 140,445,165 | ||
|
Total number of portfolio holdings
|
92 | |||
|
Total advisory fees paid
|
$820,556 | |||
|
Portfolio turnover rate
|
176% | |||
Graphical Representation of Holdings
| SECTOR ALLOCATION (% OF NET ASSETS) | ||||
|
Information Technology
|
51.8% | |||
|
Health Care
|
10.1% | |||
|
Communication Services
|
10.1% | |||
|
Consumer Discretionary
|
8.8% | |||
|
Financials
|
7.5% | |||
|
Industrials
|
6.5% | |||
|
Energy
|
2.0% | |||
|
Consumer Staples
|
1.4% | |||
|
Utilities
|
0.9% | |||
|
Materials
|
0.5% | |||
|
Short-Term Investment Fund
|
0.5% | |||
|
Other Assets/Liabilities (Net)
|
(0.1)% | |||
|
Total
|
100.0% | |||
Material Fund Changes
The following is a summary of certain changes made to the Fund effective May 9, 2025. For more complete information, you may review the Fund’s current prospectus, at touchstoneinvestments.com/mutual-funds or upon request at 800.543.0407. The Fund’s name was changed from the Touchstone Growth Opportunities Fund to the Touchstone Dynamic Large Cap Growth Fund. In connection with the name change, Los Angeles Capital Management LLC (“Los Angeles Capital”) was appointed as the Fund’s sub-adviser, the Fund adopted an 80% investment policy and other changes were made to the Fund’s principal investment strategies to reflect Los Angeles Capital’s investment strategy. In connection with the changes in principal investment strategies, Quantitative Strategy Risk was added as a principal risk of the Fund. Additionally, the Fund will pay its investment adviser, Touchstone Advisors, Inc., an advisory fee at an annualized rate of 0.60% on the first $200 million and 0.40% on assets over $200 million and the Class C expense limitation was reduced to 1.71% of average daily net assets.
Fund Expenses
|
Class
|
Costs of a $10,000 investment |
Costs paid as a percentage of a $10,000 investment |
||||
|
Class A
|
$114 | 1.03% | ||||
Management’s Discussion of Fund Performance
The Fund seeks long-term growth of capital by primarily investing in stocks of U.S. companies with any market capitalization. The Fund’s portfolio managers place focus on companies they believe to have demonstrated records of achievement with excellent prospects for earnings growth over a 1 to 3 year period. The Fund’s sub‑adviser, Westfield Capital Management Company, L.P., looks for companies that it believes are reasonably priced with high forecasted earnings potential.
The Fund’s Class A shares performance was 20.44% (excluding sales loads) for the reporting period.
During the 9‑month period from April 1, 2025 to December 31, 2025, Technology was a dominant force within the U.S. Exceptional earnings growth in U.S. technology and accelerating innovation, particularly in artificial intelligence, reshaped investor expectations and fueled global momentum. Additionally, gold, silver, and platinum soared to record highs in the period, propelling mining shares significantly higher. Lastly, during the first quarter of 2026, the Energy sector rallied due to the U.S.-Israeli military campaign against Iran and the disruption of the Strait of Hormuz, which handles roughly 20% of global oil supply.
The factors that contributed most to the Fund’s performance during the period were:
|
FACTOR
|
PERFORMANCE IMPACT |
OBSERVATIONS | ||
|
Peer Momentum
|
Positive |
Securities in similar industries rallied in concert during the quarter.
|
||
|
Long Term Growth
|
Positive |
The Fund’s overweight to companies with robust long term growth prospects added to performance, as growth was rewarded.
|
||
|
Book to Price
|
Positive |
Additionally, the Fund’s tilt towards companies with favorable Book to Price valuations contributed to performance.
|
||
|
Analyst Insight
|
Positive |
Securities with positive revisions by the sell-side analyst community rallied during the year.
|
||
|
Communication
Services
|
Negative |
Stock selection within the sector was the largest detractor to relative performance.
|
||
During the period, the Fund notably increased its weight towards the Information Technology sector due to its strong growth prospects and favorable valuations.
Fund Performance
The following graph compares the initial and subsequent account values at the end of each of the most recently completed 10 fiscal years or since inception of the Fund. The graph assumes a $10,000 initial investment in the Fund and an appropriate broad-based securities market index and any additional indexes and assumes maximum sales charges, if any.
GROWTH OF $10,000
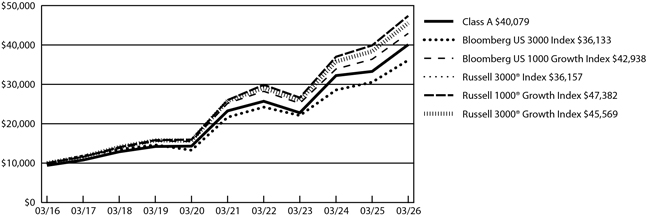
|
AVERAGE ANNUAL TOTAL RETURNS
|
1 Year | 5 Years | 10 Years | |||||||||
|
Class A
|
14.43% | 10.36% | 14.89% | |||||||||
|
Class A - excluding sales load
|
20.44% | 11.49% | 15.58% | |||||||||
|
Bloomberg US 3000 Index1
|
18.30% | 10.78% | 13.71% | |||||||||
|
Bloomberg US 1000 Growth Index2
|
18.04% | 11.26% | 15.69% | |||||||||
|
Russell 3000® Index
|
18.09% | 10.87% | 13.72% | |||||||||
|
Russell 1000® Growth Index
|
18.81% | 12.76% | 16.83% | |||||||||
|
Russell 3000® Growth Index
|
18.75% | 12.05% | 16.38% | |||||||||
| 1 |
The Fund changed its broad-based securities market index to the Bloomberg US 3000 Index which is similarly representative of the overall securities market applicable to the Fund.
|
| 2 |
The Fund changed its additional index to the Bloomberg US 1000 Growth Index which has similar investment objectives to the Fund.
|
Visit touchstoneinvestments.com/mutual-funds for the most recent performance information.
Key Fund Statistics
|
Fund net assets
|
$ | 140,445,165 | ||
|
Total number of portfolio holdings
|
92 | |||
|
Total advisory fees paid
|
$820,556 | |||
|
Portfolio turnover rate
|
176% | |||
Graphical Representation of Holdings
| SECTOR ALLOCATION (% OF NET ASSETS) | ||||
|
Information Technology
|
51.8% | |||
|
Health Care
|
10.1% | |||
|
Communication Services
|
10.1% | |||
|
Consumer Discretionary
|
8.8% | |||
|
Financials
|
7.5% | |||
|
Industrials
|
6.5% | |||
|
Energy
|
2.0% | |||
|
Consumer Staples
|
1.4% | |||
|
Utilities
|
0.9% | |||
|
Materials
|
0.5% | |||
|
Short-Term Investment Fund
|
0.5% | |||
|
Other Assets/Liabilities (Net)
|
(0.1)% | |||
|
Total
|
100.0% | |||
Material Fund Changes
The following is a summary of certain changes made to the Fund effective May 9, 2025. For more complete information, you may review the Fund’s current prospectus, at touchstoneinvestments.com/mutual-funds or upon request at 800.543.0407. The Fund’s name was changed from the Touchstone Growth Opportunities Fund to the Touchstone Dynamic Large Cap Growth Fund. In connection with the name change, Los Angeles Capital Management LLC (“Los Angeles Capital”) was appointed as the Fund’s sub‑adviser, the Fund adopted an 80% investment policy and other changes were made to the Fund’s principal investment strategies to reflect Los Angeles Capital’s investment strategy. In connection with the changes in principal investment strategies, Quantitative Strategy Risk was added as a principal risk of the Fund. Additionally, the Fund will pay its investment adviser, Touchstone Advisors, Inc., an advisory fee at an annualized rate of 0.60% on the first $200 million and 0.40% on assets over $200 million and the Class A expense limitation was reduced to 0.99% of average daily net assets.
Fund Expenses
|
Class |
Costs of a $10,000 investment |
Costs paid as a percentage of a $10,000 investment |
||||
|
Class A |
$123 | 1.16% | ||||
Management’s Discussion of Fund Performance
The Fund seeks to provide investors with capital appreciation by investing in companies of all capitalizations that are trading below what is believed to be the estimate of their intrinsic value and have a sustainable competitive advantage or a high barrier to entry in place. The barrier(s) to entry can be created through a cost advantage, economies of scale, high customer loyalty or a government barrier (e.g. license or subsidy). The Fund’s sub‑adviser, Fort Washington Investment Advisors, Inc., believes that the strongest barrier to entry is the combination of economies of scale and high customer loyalty.
The Fund’s Class A shares performance was 12.03% (excluding sales loads) for the reporting period.
The U.S. equity market experienced significant volatility at the forefront of the period as trade tensions and tariff policies became central market themes but remained resilient and maintained gains past the end of 2025. The Federal Reserve shifted towards monetary easing as the period progressed with the first of three rate cuts in September, helping push markets to new highs through January. Markets endured a pullback in the first quarter of 2026, triggered in part due to rising geopolitical tensions in the Middle East.
The factors that contributed most to the Fund’s performance during the period were:
|
FACTOR |
PERFORMANCE
IMPACT |
OBSERVATIONS | ||
|
International |
Positive |
Stock selection for international holdings was a large contributor to performance. | ||
|
Communication Services |
Positive |
The largest sector overweight, allocation to Communication Services was the largest contributor to performance. | ||
|
Capital Markets |
Positive |
Stock selection in the sector was a large contributor to performance. | ||
|
Information Technology |
Negative |
Stock selection in the sector was the largest detractor to performance. | ||
|
Industrials |
Negative |
The largest sector underweight, allocation to Industrials was a large detractor to performance. | ||
The decrease in weight period‑to‑period in the Health Care sector relative to the Russell 3000® Index was the largest sector related change in the Fund.
Fund Performance
The following graph compares the initial and subsequent account values at the end of each of the most recently completed 10 fiscal years or since inception of the Fund. The graph assumes a $10,000 initial investment in the Fund and an appropriate broad-based securities market index and any additional indexes and assumes maximum sales charges, if any.
GROWTH OF $10,000
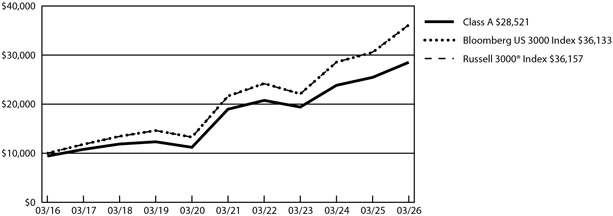
|
AVERAGE ANNUAL TOTAL RETURNS |
1 Year | 5 Years | 10 Years | |||||||||
|
Class A |
6.44% | 7.38% | 11.05% | |||||||||
|
Class A - excluding sales load |
12.03% | 8.49% | 11.71% | |||||||||
|
Bloomberg US 3000 Index1 |
18.30% | 10.78% | 13.71% | |||||||||
|
Russell 3000® Index |
18.09% | 10.87% | 13.72% | |||||||||
| 1 |
The Fund changed its broad-based securities market index to the Bloomberg US 3000 Index which is similarly representative of the overall securities market applicable to the Fund. |
Visit touchstoneinvestments.com/mutual-funds for the most recent performance information.
Key Fund Statistics
|
Fund net assets |
$1,305,490,358 | |||
|
Total number of portfolio holdings |
48 | |||
|
Total advisory fees paid |
$8,446,141 | |||
|
Portfolio turnover rate |
6% | |||
Graphical Representation of Holdings
| SECTOR ALLOCATION (% OF NET ASSETS) | ||||
|
Information Technology |
30.2% | |||
|
Communication Services |
16.1% | |||
|
Financials |
13.2% | |||
|
Consumer Discretionary |
10.0% | |||
|
Health Care |
9.2% | |||
|
Industrials |
8.1% | |||
|
Consumer Staples |
5.9% | |||
|
Energy |
3.3% | |||
|
Real Estate |
1.6% | |||
|
Materials |
0.8% | |||
|
Short-Term Investment Funds |
2.8% | |||
|
Other Assets/Liabilities (Net) |
(1.2)% | |||
|
Total |
100.0% | |||
Fund Expenses
|
Class |
Costs of a $10,000 investment |
Costs paid as a percentage of a $10,000 investment |
||||
|
Class C |
$201 | 1.90% | ||||
Management’s Discussion of Fund Performance
The Fund seeks to provide investors with capital appreciation by investing in companies of all capitalizations that are trading below what is believed to be the estimate of their intrinsic value and have a sustainable competitive advantage or a high barrier to entry in place. The barrier(s) to entry can be created through a cost advantage, economies of scale, high customer loyalty or a government barrier (e.g. license or subsidy). The Fund’s sub‑adviser, Fort Washington Investment Advisors, Inc., believes that the strongest barrier to entry is the combination of economies of scale and high customer loyalty.
The Fund’s Class C shares performance was 11.21% (excluding sales loads) for the reporting period.
The U.S. equity market experienced significant volatility at the forefront of the period as trade tensions and tariff policies became central market themes but remained resilient and maintained gains past the end of 2025. The Federal Reserve shifted towards monetary easing as the period progressed with the first of three rate cuts in September, helping push markets to new highs through January. Markets endured a pullback in the first quarter of 2026, triggered in part due to rising geopolitical tensions in the Middle East.
The factors that contributed most to the Fund’s performance during the period were:
|
FACTOR |
PERFORMANCE
IMPACT |
OBSERVATIONS | ||
|
International |
Positive |
Stock selection for international holdings was a large contributor to performance. | ||
|
Communication Services |
Positive |
The largest sector overweight, allocation to Communication Services was the largest contributor to performance. | ||
|
Capital Markets |
Positive |
Stock selection in the sector was a large contributor to performance. | ||
|
Information Technology |
Negative |
Stock selection in the sector was the largest detractor to performance. | ||
|
Industrials |
Negative |
The largest sector underweight, allocation to Industrials was a large detractor to performance. | ||
The decrease in weight period‑to‑period in the Health Care sector relative to the Russell 3000® Index was the largest sector related change in the Fund.
Fund Performance
The following graph compares the initial and subsequent account values at the end of each of the most recently completed 10 fiscal years or since inception of the Fund. The graph assumes a $10,000 initial investment in the Fund and an appropriate broad-based securities market index and any additional indexes and assumes maximum sales charges, if any.
GROWTH OF $10,000
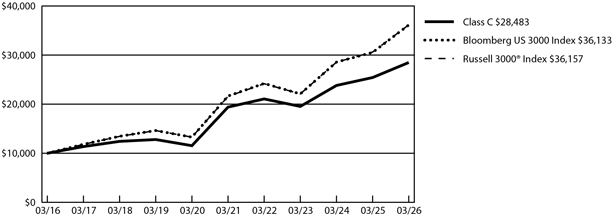
|
AVERAGE ANNUAL TOTAL RETURNS |
1 Year | 5 Years | 10 Years | |||||||||
|
Class C |
10.21% | 7.66% | 11.03% | |||||||||
|
Class C - excluding sales load |
11.21% | 7.66% | 11.03% | |||||||||
|
Bloomberg US 3000 Index1 |
18.30% | 10.78% | 13.71% | |||||||||
|
Russell 3000® Index |
18.09% | 10.87% | 13.72% | |||||||||
| 1 |
The Fund changed its broad-based securities market index to the Bloomberg US 3000 Index which is similarly representative of the overall securities market applicable to the Fund. |
Visit touchstoneinvestments.com/mutual-funds for the most recent performance information.
Key Fund Statistics
|
Fund net assets |
$ | 1,305,490,358 | ||
|
Total number of portfolio holdings |
48 | |||
|
Total advisory fees paid |
$8,446,141 | |||
|
Portfolio turnover rate |
6% | |||
Graphical Representation of Holdings
| SECTOR ALLOCATION (% OF NET ASSETS) | ||||
|
Information Technology |
30.2% | |||
|
Communication Services |
16.1% | |||
|
Financials |
13.2% | |||
|
Consumer Discretionary |
10.0% | |||
|
Health Care |
9.2% | |||
|
Industrials |
8.1% | |||
|
Consumer Staples |
5.9% | |||
|
Energy |
3.3% | |||
|
Real Estate |
1.6% | |||
|
Materials |
0.8% | |||
|
Short-Term Investment Funds |
2.8% | |||
|
Other Assets/Liabilities (Net) |
(1.2)% | |||
|
Total |
100.0% | |||
Fund Expenses
|
Class |
Costs of a $10,000 investment |
Costs paid as a percentage of a $10,000 investment |
||||
|
Class Y |
$91 | 0.86% | ||||
Management’s Discussion of Fund Performance
The Fund seeks to provide investors with capital appreciation by investing in companies of all capitalizations that are trading below what is believed to be the estimate of their intrinsic value and have a sustainable competitive advantage or a high barrier to entry in place. The barrier(s) to entry can be created through a cost advantage, economies of scale, high customer loyalty or a government barrier (e.g. license or subsidy). The Fund’s sub‑adviser, Fort Washington Investment Advisors, Inc., believes that the strongest barrier to entry is the combination of economies of scale and high customer loyalty.
The Fund’s Class Y shares performance was 12.36% for the reporting period.
The U.S. equity market experienced significant volatility at the forefront of the period as trade tensions and tariff policies became central market themes but remained resilient and maintained gains past the end of 2025. The Federal Reserve shifted towards monetary easing as the period progressed with the first of three rate cuts in September, helping push markets to new highs through January. Markets endured a pullback in the first quarter of 2026, triggered in part due to rising geopolitical tensions in the Middle East.
The factors that contributed most to the Fund’s performance during the period were:
|
FACTOR |
PERFORMANCE
IMPACT |
OBSERVATIONS | ||
|
International |
Positive |
Stock selection for international holdings was a large contributor to performance. | ||
|
Communication Services |
Positive |
The largest sector overweight, allocation to Communication Services was the largest contributor to performance. | ||
|
Capital Markets |
Positive |
Stock selection in the sector was a large contributor to performance. | ||
|
Information Technology |
Negative |
Stock selection in the sector was the largest detractor to performance. | ||
|
Industrials |
Negative |
The largest sector underweight, allocation to Industrials was a large detractor to performance. | ||
The decrease in weight period‑to‑period in the Health Care sector relative to the Russell 3000® Index was the largest sector related change in the Fund.
Fund Performance
The following graph compares the initial and subsequent account values at the end of each of the most recently completed 10 fiscal years or since inception of the Fund. The graph assumes a $10,000 initial investment in the Fund and an appropriate broad-based securities market index and any additional indexes and assumes maximum sales charges, if any.
GROWTH OF $10,000

|
AVERAGE ANNUAL TOTAL RETURNS |
1 Year | 5 Years | 10 Years | |||||||||
|
Class Y |
12.36% | 8.80% | 12.04% | |||||||||
|
Bloomberg US 3000 Index1 |
18.30% | 10.78% | 13.71% | |||||||||
|
Russell 3000® Index |
18.09% | 10.87% | 13.72% | |||||||||
| 1 |
The Fund changed its broad-based securities market index to the Bloomberg US 3000 Index which is similarly representative of the overall securities market applicable to the Fund. |
Visit touchstoneinvestments.com/mutual-funds for the most recent performance information.
Key Fund Statistics
|
Fund net assets |
$1,305,490,358 | |||
|
Total number of portfolio holdings |
48 | |||
|
Total advisory fees paid |
$8,446,141 | |||
|
Portfolio turnover rate |
6% | |||
Graphical Representation of Holdings
| SECTOR ALLOCATION (% OF NET ASSETS) | ||||
|
Information Technology |
30.2% | |||
|
Communication Services |
16.1% | |||
|
Financials |
13.2% | |||
|
Consumer Discretionary |
10.0% | |||
|
Health Care |
9.2% | |||
|
Industrials |
8.1% | |||
|
Consumer Staples |
5.9% | |||
|
Energy |
3.3% | |||
|
Real Estate |
1.6% | |||
|
Materials |
0.8% | |||
|
Short-Term Investment Funds |
2.8% | |||
|
Other Assets/Liabilities (Net) |
(1.2)% | |||
|
Total |
100.0% | |||
Fund Expenses
|
Class |
Costs of a $10,000 investment |
Costs paid as a percentage of a $10,000 investment |
||||
|
Institutional Class |
$89 | 0.84% | ||||
Management’s Discussion of Fund Performance
The Fund seeks to provide investors with capital appreciation by investing in companies of all capitalizations that are trading below what is believed to be the estimate of their intrinsic value and have a sustainable competitive advantage or a high barrier to entry in place. The barrier(s) to entry can be created through a cost advantage, economies of scale, high customer loyalty or a government barrier (e.g. license or subsidy). The Fund’s sub‑adviser, Fort Washington Investment Advisors, Inc., believes that the strongest barrier to entry is the combination of economies of scale and high customer loyalty.
The Fund’s Institutional Class shares performance was 12.39% for the reporting period.
The U.S. equity market experienced significant volatility at the forefront of the period as trade tensions and tariff policies became central market themes but remained resilient and maintained gains past the end of 2025. The Federal Reserve shifted towards monetary easing as the period progressed with the first of three rate cuts in September, helping push markets to new highs through January. Markets endured a pullback in the first quarter of 2026, triggered in part due to rising geopolitical tensions in the Middle East.
The factors that contributed most to the Fund’s performance during the period were:
|
FACTOR |
PERFORMANCE IMPACT |
OBSERVATIONS | ||
|
International |
Positive |
Stock selection for international holdings was a large contributor to performance. | ||
|
Communication Services |
Positive |
The largest sector overweight, allocation to Communication Services was the largest contributor to performance. | ||
|
Capital Markets |
Positive |
Stock selection in the sector was a large contributor to performance. | ||
|
Information Technology |
Negative |
Stock selection in the sector was the largest detractor to performance. | ||
|
Industrials |
Negative |
The largest sector underweight, allocation to Industrials was a large detractor to performance. | ||
The decrease in weight period‑to‑period in the Health Care sector relative to the Russell 3000® Index was the largest sector related change in the Fund.
Fund Performance
The following graph compares the initial and subsequent account values at the end of each of the most recently completed 10 fiscal years or since inception of the Fund. The graph assumes a $10,000 initial investment in the Fund and an appropriate broad-based securities market index and any additional indexes and assumes maximum sales charges, if any.
GROWTH OF $10,000
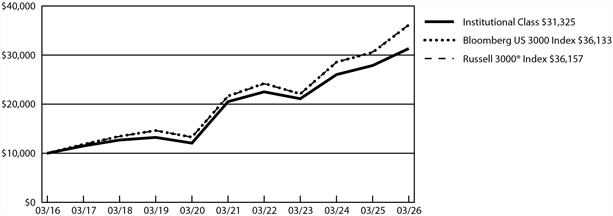
|
AVERAGE ANNUAL TOTAL RETURNS |
1 Year | 5 Years | 10 Years | |||||||||
|
Institutional Class |
12.39% | 8.84% | 12.10% | |||||||||
|
Bloomberg US 3000 Index1 |
18.30% | 10.78% | 13.71% | |||||||||
|
Russell 3000® Index |
18.09% | 10.87% | 13.72% | |||||||||
| 1 |
The Fund changed its broad-based securities market index to the Bloomberg US 3000 Index which is similarly representative of the overall securities market applicable to the Fund. |
Visit touchstoneinvestments.com/mutual-funds for the most recent performance information.
Key Fund Statistics
|
Fund net assets |
$1,305,490,358 | |||
|
Total number of portfolio holdings |
48 | |||
|
Total advisory fees paid |
$8,446,141 | |||
|
Portfolio turnover rate |
6% | |||
Graphical Representation of Holdings
| SECTOR ALLOCATION (% OF NET ASSETS) | ||||
|
Information Technology |
30.2% | |||
|
Communication Services |
16.1% | |||
|
Financials |
13.2% | |||
|
Consumer Discretionary |
10.0% | |||
|
Health Care |
9.2% | |||
|
Industrials |
8.1% | |||
|
Consumer Staples |
5.9% | |||
|
Energy |
3.3% | |||
|
Real Estate |
1.6% | |||
|
Materials |
0.8% | |||
|
Short-Term Investment Funds |
2.8% | |||
|
Other Assets/Liabilities (Net) |
(1.2)% | |||
|
Total |
100.0% | |||
Fund Expenses
|
Class |
Costs of a $10,000 investment |
Costs paid as a percentage of a $10,000 investment |
||||
|
Institutional Class |
$71 | 0.69% | ||||
Management’s Discussion of Fund Performance
The Fund seeks total return through a combination of income and capital appreciation by investing primarily in income producing securities. The Fund’s sub‑adviser, Bramshill Investments, LLC, implements a tactical fixed-income strategy, actively managing the portfolio by rotating among asset classes and tactically hedging during various interest rate and market environments. The sub‑adviser seeks to identify relative value across asset classes and capture opportunities primarily within the corporate, U.S. Treasury, municipal and preferred security markets. The Fund focuses on liquid securities with transparent pricing and actively-traded capital structures.
The Fund’s Institutional Class shares performance was 4.50% for the reporting period.
Over the 12 month period ended March 31, 2026, interest rates moved higher, with the 10‑year U.S. Treasury yield rising 11 basis points from 4.21% to 4.32%. The yield curve steepened meaningfully, as the 2‑year to 10‑year spread widened by 20 basis points from 32 to 52 basis points, and the 5‑year to 30‑year spread steepened by 35 basis points from 62 to 97 basis points.
The factors that contributed most to the Fund’s performance during the period were:
|
FACTOR |
PERFORMANCE
IMPACT |
OBSERVATIONS | ||
|
Credit Quality and Current Income |
Positive |
The Fund’s relative performance during the reporting period benefitted from high current income on strong credits with low probabilities of defaults. | ||
|
Credit Spreads |
Positive |
The Fund’s relative performance during the reporting period also benefitted from credit spread tightening across the Fund’s sectors. | ||
|
Long Duration U.S. Treasury |
Negative |
Long-term rates did not fall in line with short-term rates, creating a headwind for the Fund’s longer-than-benchmark duration. | ||
During the reporting period, the Fund made several notable allocation changes. Portfolio duration was extended from 5.8 years to 6.5 years. Exposure to investment-grade corporates increased from 20.6% to 28.3%, while investment grade structured product securities were modestly reduced from 30.9% to 27.7%. High yield corporate securities increased slightly from 2.5% to 3.2%, whereas high yield structured products declined from 15.0% to 12.5%. The Fund reduced its allocation to preferred securities from 12.3% to 7.3% and introduced a new allocation to municipal bonds, increasing from 0.0% to 1.1%. Additionally, the Fund added exposure to emerging markets sovereign debt, with local currency positions rising to 4.9% and U.S. dollar-denominated positions to 0.7%. U.S. Treasury exposure decreased from 12.3% to 10.6%, and the cash allocation was reduced from 6.5% to 3.8%.
Fund Performance
The following graph compares the initial and subsequent account values at the end of each of the most recently completed 10 fiscal years or since inception of the Fund. The graph assumes a $10,000 initial investment in the Fund and an appropriate broad-based securities market index and assumes maximum sales charges, if any.
GROWTH OF $10,000
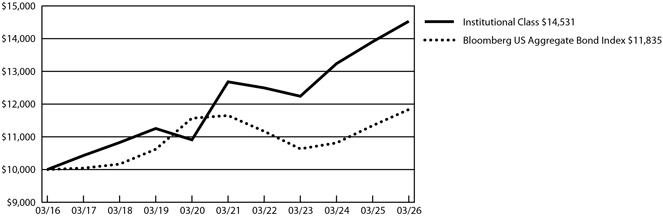
|
AVERAGE ANNUAL TOTAL RETURNS |
1 Year | 5 Years | 10 Years | |||||||||
|
Institutional Class |
4.50% | 2.76% | 3.81% | |||||||||
|
Bloomberg US Aggregate Bond Index |
4.35% | 0.31% | 1.70% | |||||||||
Visit touchstoneinvestments.com/mutual-funds for the most recent performance information.
Key Fund Statistics
|
Fund net assets |
$ | 1,677,665,583 | ||
|
Total number of portfolio holdings |
382 | |||
|
Total advisory fees paid |
$9,102,873 | |||
|
Portfolio turnover rate |
64% | |||
Graphical Representation of Holdings
| ASSET CATEGORY (% OF NET ASSETS) | ||||
|
Corporate Bonds |
32.9% | |||
|
Non‑Agency Collateralized Mortgage Obligations |
20.8% | |||
|
Agency Collateralized Mortgage Obligations |
12.8% | |||
|
U.S. Treasury Obligations |
10.5% | |||
|
Asset-Backed Securities |
6.2% | |||
|
Sovereign Government Obligations |
4.6% | |||
|
Exchange-Traded Funds |
4.4% | |||
|
Preferred Stocks |
3.3% | |||
|
Commercial Mortgage-Backed Securities |
0.0% | |||
|
Purchased Options |
0.1% | |||
|
Short-Term Investment Funds |
4.6% | |||
|
Other Assets/Liabilities (Net) |
(0.2)% | |||
|
Total |
100.0% | |||
| CREDIT QUALITY* (% OF FIXED INCOME SECURITIES) | ||||
|
AAA/Aaa |
32.0% | |||
|
AA/Aa |
9.9% | |||
|
A/A |
9.7% | |||
|
BBB/Baa |
21.9% | |||
|
BB/Ba |
2.4% | |||
|
B/B |
2.4% | |||
|
CCC |
0.2% | |||
|
CC |
0.1% | |||
|
Not Rated |
21.4% | |||
|
Total |
100.0% | |||
* Credit quality ratings are from S&P Global Ratings (“S&P”) and Moody’s Investor Service (“Moody’s”). If agency ratings differ, the higher ratings will be used. Where no rating has been assigned, it may be for reasons unrelated to the creditworthiness of the issuer.
Fund Expenses
|
Class |
Costs of a $10,000 investment |
Costs paid as a percentage of a $10,000 investment |
||||
|
Class Y |
$81 | 0.79% | ||||
Management’s Discussion of Fund Performance
The Fund seeks total return through a combination of income and capital appreciation by investing primarily in income producing securities. The Fund’s sub‑adviser, Bramshill Investments, LLC, implements a tactical fixed-income strategy, actively managing the portfolio by rotating among asset classes and tactically hedging during various interest rate and market environments. The sub‑adviser seeks to identify relative value across asset classes and capture opportunities primarily within the corporate, U.S. Treasury, municipal and preferred security markets. The Fund focuses on liquid securities with transparent pricing and actively-traded capital structures.
The Fund’s Class Y shares performance was 4.48% for the reporting period.
Over the 12 month period ended March 31, 2026, interest rates moved higher, with the 10‑year U.S. Treasury yield rising 11 basis points from 4.21% to 4.32%. The yield curve steepened meaningfully, as the 2‑year to 10‑year spread widened by 20 basis points from 32 to 52 basis points, and the 5‑year to
30‑year spread steepened by 35 basis points from 62 to 97 basis points.
The factors that contributed most to the Fund’s performance during the period were:
|
FACTOR |
PERFORMANCE
IMPACT |
OBSERVATIONS | ||
|
Credit Quality and Current Income |
Positive |
The Fund’s relative performance during the reporting period benefitted from high current income on strong credits with low probabilities of defaults. | ||
|
Credit Spreads |
Positive |
The Fund’s relative performance during the reporting period also benefitted from credit spread tightening across the Fund’s sectors. | ||
|
Long Duration U.S. Treasury |
Negative |
Long-term rates did not fall in line with short-term rates, creating a headwind for the Fund’s longer-than-benchmark duration. | ||
During the reporting period, the Fund made several notable allocation changes. Portfolio duration was extended from 5.8 years to 6.5 years. Exposure to investment-grade corporates increased from 20.6% to 28.3%, while investment grade structured product securities were modestly reduced from 30.9% to 27.7%. High yield corporate securities increased slightly from 2.5% to 3.2%, whereas high yield structured products declined from 15.0% to 12.5%. The Fund reduced its allocation to preferred securities from 12.3% to 7.3% and introduced a new allocation to municipal bonds, increasing from 0.0% to 1.1%. Additionally, the Fund added exposure to emerging markets sovereign debt, with local currency positions rising to 4.9% and U.S. dollar-denominated positions to 0.7%. U.S. Treasury exposure decreased from 12.3% to 10.6%, and the cash allocation was reduced from 6.5% to 3.8%.
Fund Performance
The following graph compares the initial and subsequent account values at the end of each of the most recently completed 10 fiscal years or since inception of the Fund. The graph assumes a $10,000 initial investment in the Fund and an appropriate broad-based securities market index and assumes maximum sales charges, if any.
GROWTH OF $10,000
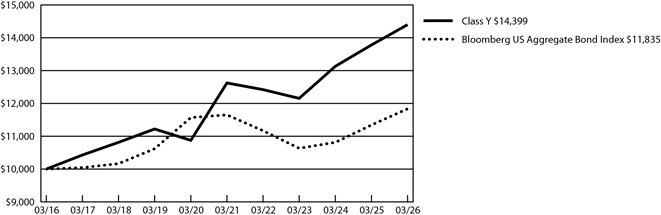
|
AVERAGE ANNUAL TOTAL RETURNS |
1 Year | 5 Years | 10 Years | |||||||||
|
Class Y |
4.48% | 2.67% | 3.71% | |||||||||
|
Bloomberg US Aggregate Bond Index |
4.35% | 0.31% | 1.70% | |||||||||
Visit touchstoneinvestments.com/mutual-funds for the most recent performance information.
Key Fund Statistics
|
Fund net assets |
$1,677,665,583 | |||
|
Total number of portfolio holdings |
382 | |||
|
Total advisory fees paid |
$9,102,873 | |||
|
Portfolio turnover rate |
64% | |||
Graphical Representation of Holdings
| ASSET CATEGORY (% OF NET ASSETS) | ||||
|
Corporate Bonds |
32.9% | |||
|
Non‑Agency Collateralized Mortgage Obligations |
20.8% | |||
|
Agency Collateralized Mortgage Obligations |
12.8% | |||
|
U.S. Treasury Obligations |
10.5% | |||
|
Asset-Backed Securities |
6.2% | |||
|
Sovereign Government Obligations |
4.6% | |||
|
Exchange-Traded Funds |
4.4% | |||
|
Preferred Stocks |
3.3% | |||
|
Commercial Mortgage-Backed Securities |
0.0% | |||
|
Purchased Options |
0.1% | |||
|
Short-Term Investment Funds |
4.6% | |||
|
Other Assets/Liabilities (Net) |
(0.2)% | |||
|
Total |
100.0% | |||
| CREDIT QUALITY* (% OF FIXED INCOME SECURITIES) | ||||
|
AAA/Aaa |
32.0% | |||
|
AA/Aa |
9.9% | |||
|
A/A |
9.7% | |||
|
BBB/Baa |
21.9% | |||
|
BB/Ba |
2.4% | |||
|
B/B |
2.4% | |||
|
CCC |
0.2% | |||
|
CC |
0.1% | |||
|
Not Rated |
21.4% | |||
|
Total |
100.0% | |||
* Credit quality ratings are from S&P Global Ratings (“S&P”) and Moody’s Investor Service (“Moody’s”). If agency ratings differ, the higher ratings will be used. Where no rating has been assigned, it may be for reasons unrelated to the creditworthiness of the issuer.
Fund Expenses
|
Class |
Costs of a $10,000 investment |
Costs paid as a percentage of a $10,000 investment |
||||
|
Class C |
$182 | 1.79% | ||||
Management’s Discussion of Fund Performance
The Fund seeks total return through a combination of income and capital appreciation by investing primarily in income producing securities. The Fund’s sub‑adviser, Bramshill Investments, LLC, implements a tactical fixed-income strategy, actively managing the portfolio by rotating among asset classes and tactically hedging during various interest rate and market environments. The sub‑adviser seeks to identify relative value across asset classes and capture opportunities primarily within the corporate, U.S. Treasury, municipal and preferred security markets. The Fund focuses on liquid securities with transparent pricing and actively-traded capital structures.
The Fund’s Class C shares performance was 3.45% (excluding sales loads) for the reporting period.
Over the 12 month period ended March 31, 2026, interest rates moved higher, with the 10‑year U.S. Treasury yield rising 11 basis points from 4.21% to 4.32%. The yield curve steepened meaningfully, as the 2‑year to 10‑year spread widened by 20 basis points from 32 to 52 basis points, and the 5‑year to 30‑year spread steepened by 35 basis points from 62 to 97 basis points.
The factors that contributed most to the Fund’s performance during the period were:
|
FACTOR |
PERFORMANCE IMPACT |
OBSERVATIONS | ||
|
Credit Quality and Current Income |
Positive |
The Fund’s relative performance during the reporting period benefitted from high current income on strong credits with low probabilities of defaults. | ||
|
Credit Spreads |
Positive |
The Fund’s relative performance during the reporting period also benefitted from credit spread tightening across the Fund’s sectors. | ||
|
Long Duration U.S. Treasury |
Negative |
Long-term rates did not fall in line with short-term rates, creating a headwind for the Fund’s longer-than-benchmark duration. | ||
During the reporting period, the Fund made several notable allocation changes. Portfolio duration was extended from 5.8 years to 6.5 years. Exposure to investment-grade corporates increased from 20.6% to 28.3%, while investment grade structured product securities were modestly reduced from 30.9% to 27.7%. High yield corporate securities increased slightly from 2.5% to 3.2%, whereas high yield structured products declined from 15.0% to 12.5%. The Fund reduced its allocation to preferred securities from 12.3% to 7.3% and introduced a new allocation to municipal bonds, increasing from 0.0% to 1.1%. Additionally, the Fund added exposure to emerging markets sovereign debt, with local currency positions rising to 4.9% and U.S. dollar-denominated positions to 0.7%. U.S. Treasury exposure decreased from 12.3% to 10.6%, and the cash allocation was reduced from 6.5% to 3.8%.
Fund Performance
The following graph compares the initial and subsequent account values at the end of each of the most recently completed 10 fiscal years or since inception of the Fund. The graph assumes a $10,000 initial investment in the Fund and an appropriate broad-based securities market index and assumes maximum sales charges, if any.
GROWTH OF $10,000
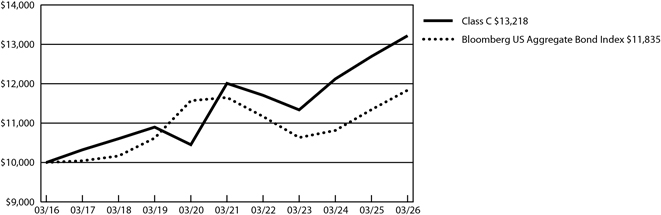
|
AVERAGE ANNUAL TOTAL RETURNS |
1 Year | 5 Years | 10 Years | |||||||||
|
Class C |
2.46% | 1.65% | 2.83% | |||||||||
|
Class C - excluding sales load |
3.45% | 1.65% | 2.83% | |||||||||
|
Bloomberg US Aggregate Bond Index |
4.35% | 0.31% | 1.70% | |||||||||
Visit touchstoneinvestments.com/mutual-funds for the most recent performance information.
Key Fund Statistics
|
Fund net assets |
$ | 1,677,665,583 | ||
|
Total number of portfolio holdings |
382 | |||
|
Total advisory fees paid |
$9,102,873 | |||
|
Portfolio turnover rate |
64% | |||
Graphical Representation of Holdings
| ASSET CATEGORY (% OF NET ASSETS) | ||||
|
Corporate Bonds |
32.9% | |||
|
Non‑Agency Collateralized Mortgage Obligations |
20.8% | |||
|
Agency Collateralized Mortgage Obligations |
12.8% | |||
|
U.S. Treasury Obligations |
10.5% | |||
|
Asset-Backed Securities |
6.2% | |||
|
Sovereign Government Obligations |
4.6% | |||
|
Exchange-Traded Funds |
4.4% | |||
|
Preferred Stocks |
3.3% | |||
|
Commercial Mortgage-Backed Securities |
0.0% | |||
|
Purchased Options |
0.1% | |||
|
Short-Term Investment Funds |
4.6% | |||
|
Other Assets/Liabilities (Net) |
(0.2)% | |||
|
Total |
100.0% | |||
| CREDIT QUALITY* (% OF FIXED INCOME SECURITIES) | ||||
|
AAA/Aaa |
32.0% | |||
|
AA/Aa |
9.9% | |||
|
A/A |
9.7% | |||
|
BBB/Baa |
21.9% | |||
|
BB/Ba |
2.4% | |||
|
B/B |
2.4% | |||
|
CCC |
0.2% | |||
|
CC |
0.1% | |||
|
Not Rated |
21.4% | |||
|
Total |
100.0% | |||
* Credit quality ratings are from S&P Global Ratings (“S&P”) and Moody’s Investor Service (“Moody’s”). If agency ratings differ, the higher ratings will be used. Where no rating has been assigned, it may be for reasons unrelated to the creditworthiness of the issuer.
Fund Expenses
|
Class |
Costs of a $10,000 investment |
Costs paid as a percentage of a $10,000 investment |
||||
|
Class A |
$106 | 1.04% | ||||
Management’s Discussion of Fund Performance
The Fund seeks total return through a combination of income and capital appreciation by investing primarily in income producing securities. The Fund’s sub‑adviser, Bramshill Investments, LLC, implements a tactical fixed-income strategy, actively managing the portfolio by rotating among asset classes and tactically hedging during various interest rate and market environments. The sub‑adviser seeks to identify relative value across asset classes and capture opportunities primarily within the corporate, U.S. Treasury, municipal and preferred security markets. The Fund focuses on liquid securities with transparent pricing and actively-traded capital structures.
The Fund’s Class A shares performance was 4.14% (excluding sales loads) for the reporting period.
Over the 12 month period ended March 31, 2026, interest rates moved higher, with the 10‑year U.S. Treasury yield rising 11 basis points from 4.21% to 4.32%. The yield curve steepened meaningfully, as the 2‑year to 10‑year spread widened by 20 basis points from 32 to 52 basis points, and the 5‑year to
30‑year spread steepened by 35 basis points from 62 to 97 basis points.
The factors that contributed most to the Fund’s performance during the period were:
|
FACTOR |
PERFORMANCE IMPACT |
OBSERVATIONS | ||
|
Credit Quality and Current Income |
Positive |
The Fund’s relative performance during the reporting period benefitted from high current income on strong credits with low probabilities of defaults. | ||
|
Credit Spreads |
Positive |
The Fund’s relative performance during the reporting period also benefitted from credit spread tightening across the Fund’s sectors. | ||
|
Long Duration U.S. Treasury |
Negative |
Long-term rates did not fall in line with short-term rates, creating a headwind for the Fund’s longer-than-benchmark duration. | ||
During the reporting period, the Fund made several notable allocation changes. Portfolio duration was extended from 5.8 years to 6.5 years. Exposure to investment-grade corporates increased from 20.6% to 28.3%, while investment grade structured product securities were modestly reduced from 30.9% to 27.7%. High yield corporate securities increased slightly from 2.5% to 3.2%, whereas high yield structured products declined from 15.0% to 12.5%. The Fund reduced its allocation to preferred securities from 12.3% to 7.3% and introduced a new allocation to municipal bonds, increasing from 0.0% to 1.1%. Additionally, the Fund added exposure to emerging markets sovereign debt, with local currency positions rising to 4.9% and U.S. dollar-denominated positions to 0.7%. U.S. Treasury exposure decreased from 12.3% to 10.6%, and the cash allocation was reduced from 6.5% to 3.8%.
Fund Performance
The following graph compares the initial and subsequent account values at the end of each of the most recently completed 10 fiscal years or since inception of the Fund. The graph assumes a $10,000 initial investment in the Fund and an appropriate broad-based securities market index and assumes maximum sales charges, if any.
GROWTH OF $10,000
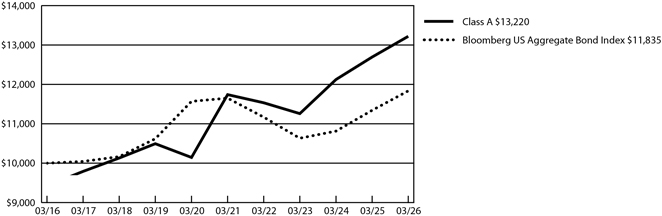
|
AVERAGE ANNUAL TOTAL RETURNS |
1 Year | 5 Years | 10 Years | |||||||||
|
Class A |
0.72% | 1.74% | 2.83% | |||||||||
|
Class A - excluding sales load |
4.14% | 2.40% | 3.45% | |||||||||
|
Bloomberg US Aggregate Bond Index |
4.35% | 0.31% | 1.70% | |||||||||
Visit touchstoneinvestments.com/mutual-funds for the most recent performance information.
Key Fund Statistics
|
Fund net assets |
$ | 1,677,665,583 | ||
|
Total number of portfolio holdings |
382 | |||
|
Total advisory fees paid |
$9,102,873 | |||
|
Portfolio turnover rate |
64% | |||
Graphical Representation of Holdings
| ASSET CATEGORY (% OF NET ASSETS) | ||||
|
Corporate Bonds |
32.9% | |||
|
Non‑Agency Collateralized Mortgage Obligations |
20.8% | |||
|
Agency Collateralized Mortgage Obligations |
12.8% | |||
|
U.S. Treasury Obligations |
10.5% | |||
|
Asset-Backed Securities |
6.2% | |||
|
Sovereign Government Obligations |
4.6% | |||
|
Exchange-Traded Funds |
4.4% | |||
|
Preferred Stocks |
3.3% | |||
|
Commercial Mortgage-Backed Securities |
0.0% | |||
|
Purchased Options |
0.1% | |||
|
Short-Term Investment Funds |
4.6% | |||
|
Other Assets/Liabilities (Net) |
(0.2)% | |||
|
Total |
100.0% | |||
| CREDIT QUALITY* (% OF FIXED INCOME SECURITIES) | ||||
|
AAA/Aaa |
32.0% | |||
|
AA/Aa |
9.9% | |||
|
A/A |
9.7% | |||
|
BBB/Baa |
21.9% | |||
|
BB/Ba |
2.4% | |||
|
B/B |
2.4% | |||
|
CCC |
0.2% | |||
|
CC |
0.1% | |||
|
Not Rated |
21.4% | |||
|
Total |
100.0% | |||
* Credit quality ratings are from S&P Global Ratings (“S&P”) and Moody’s Investor Service (“Moody’s”). If agency ratings differ, the higher ratings will be used. Where no rating has been assigned, it may be for reasons unrelated to the creditworthiness of the issuer.
Fund Expenses
|
Class |
Costs of a $10,000 investment |
Costs paid as a percentage
of a $10,000 investment |
||||
|
Class A |
$154 | 1.43% | ||||
Management’s Discussion of Fund Performance
The Fund seeks long-term capital appreciation. The Fund invests in equity and equity-related securities issued by companies located in emerging or frontier markets countries. The Fund’s sub‑adviser, Sands Capital Management, LLC (“Sands Capital”), uses a “bottom‑up” approach to investment selection, as opposed to sector or regional allocations that focuses on a company’s long-term business fundamentals. Sands Capital seeks companies that have: sustainable above-average earnings growth; a leadership position in a promising business space; significant competitive advantages such as profitability, superior quality or distribution relative to competitors or strong brand and consumer loyalty; a clear mission in an understandable business model; financial strength; and a rational valuation in relation to competitors, the market and business prospects.
The Fund’s Class A shares performance was 15.07% (excluding sales loads) for the reporting period.
The trailing 12‑month period ended March 31, 2026, was a strong but narrowly driven market for emerging market equities, as reflected by the MSCI Emerging Markets Index (MSCI EM). Just three companies—Taiwan Semiconductor Manufacturing Company Limited, Samsung Electronics Co. Ltd., and SK hynix Inc., accounted for over 70% of the index’s rise. Taiwan, South Korea, and China contributed most to the index’s return, while India, Indonesia, and Saudi Arabia were the top country detractors.
The factors that contributed most to the Fund’s performance during the period were:
|
FACTOR |
PERFORMANCE
IMPACT |
OBSERVATIONS | ||
|
Semiconductor Exposure |
Positive |
The Fund’s overweight to semiconductors, alongside security selection within the industry, positively contributed to relative results. | ||
|
Ecommerce |
Negative |
Several of the Fund’s high-conviction ecommerce businesses were meaningful detractors for the period, driven by concerns about competition and investment, and overall negative sentiment for internet businesses in the latter portion of the period. | ||
|
China stocks |
Negative |
Security selection within China was a notable relative detractor during the period, overwhelming the benefit from the Fund’s underweight relative to the MSCI EM. | ||
|
South Korean stocks |
Negative |
The Fund’s average underweight during the period, alongside underperformance within the country, pressured relative results. | ||
The Fund’s portfolio increased its exposure to AI infrastructure during the period, broadening its positioning across growth drivers. As a result, the Fund’s portfolio underweight to South Korea and Taiwan narrowed meaningfully, moving from a combined 14% underweight to 4%, while absolute exposure rose from 12% to 34%. This shift was primarily funded by a reduction in India exposure. India moved from a 7% overweight to a 2% overweight, with absolute exposure declining from 26% to 15%.
Fund Performance
The following graph compares the initial and subsequent account values at the end of each of the most recently completed 10 fiscal years or since inception of the Fund. The graph assumes a $10,000 initial investment in the Fund and an appropriate broad-based securities market index and any additional indexes and assumes maximum sales charges, if any.
GROWTH OF $10,000

|
AVERAGE ANNUAL TOTAL RETURNS |
1 Year | 5 Years | 10 Years | |||||||||
|
Class A1 |
9.30% | -5.51% | 5.44% | |||||||||
|
Class A - excluding sales load |
15.07% | -4.54% | 5.99% | |||||||||
|
Bloomberg World ex US Large & Mid Cap Index2 |
23.79% | 6.71% | 8.37% | |||||||||
|
Bloomberg Emerging Markets Large & Mid Cap Index3 |
26.30% | 3.38% | 8.11% | |||||||||
|
MSCI Emerging Markets Index |
29.55% | 3.69% | 7.80% | |||||||||
| 1 |
The inception date was November 16, 2018. Performance information was calculated using the historical performance of Institutional Class shares for the periods prior to November 16, 2018. |
| 2 |
The Fund changed its broad-based securities market index to the Bloomberg World ex US Large & Mid Cap Index which is similarly representative of the overall securities market applicable to the Fund. |
| 3 |
The Fund changed its additional index to the Bloomberg Emerging Markets Large & Mid Cap Index which has similar investment objectives to the Fund. |
Visit touchstoneinvestments.com/mutual-funds for the most recent performance information.
Key Fund Statistics
|
Fund net assets |
$1,999,941,629 | |||
|
Total number of portfolio holdings |
45 | |||
|
Total advisory fees paid |
$17,285,790 | |||
|
Portfolio turnover rate |
51% | |||
Graphical Representation of Holdings
| SECTOR ALLOCATION (% OF NET ASSETS) | ||||
|
Information Technology |
37.4% | |||
|
Consumer Discretionary |
21.3% | |||
|
Financials |
17.4% | |||
|
Industrials |
7.3% | |||
|
Communication Services |
7.3% | |||
|
Consumer Staples |
3.6% | |||
|
Real Estate |
1.6% | |||
|
Health Care |
1.1% | |||
|
Short-Term Investment Fund |
2.8% | |||
|
Other Assets/Liabilities (Net) |
0.2% | |||
|
Total |
100.0% | |||
| GEOGRAPHICAL ALLOCATION (% OF NET ASSETS) | ||||
|
Common Stocks |
||||
|
China |
22.5% | |||
|
Taiwan |
19.3% | |||
|
South Korea |
15.7% | |||
|
India |
14.8% | |||
|
Brazil |
10.2% | |||
|
Hong Kong |
3.3% | |||
|
Singapore |
3.1% | |||
|
Other Countries |
8.1% | |||
|
Short-Term Investment Fund |
2.8% | |||
|
Other Assets/Liabilities (Net) |
0.2% | |||
|
Total |
100.0% | |||
Fund Expenses
|
Class |
Costs of a $10,000 investment |
Costs paid as a percentage of a $10,000 investment |
||||
|
Class C |
$228 | 2.13% | ||||
Management’s Discussion of Fund Performance
The Fund seeks long-term capital appreciation. The Fund invests in equity and equity-related securities issued by companies located in emerging or frontier markets countries. The Fund’s sub‑adviser, Sands Capital Management, LLC (“Sands Capital”), uses a “bottom‑up” approach to investment selection, as opposed to sector or regional allocations that focuses on a company’s long-term business fundamentals. Sands Capital seeks companies that have: sustainable above-average earnings growth; a leadership position in a promising business space; significant competitive advantages such as profitability, superior quality or distribution relative to competitors or strong brand and consumer loyalty; a clear mission in an understandable business model; financial strength; and a rational valuation in relation to competitors, the market and business prospects.
The Fund’s Class C shares performance was 14.32% (excluding sales loads) for the reporting period.
The trailing 12‑month period ended March 31, 2026, was a strong but narrowly driven market for emerging market equities, as reflected by the MSCI Emerging Markets Index (MSCI EM). Just three companies—Taiwan Semiconductor Manufacturing Company Limited, Samsung Electronics Co. Ltd., and SK hynix Inc., accounted for over 70% of the index’s rise. Taiwan, South Korea, and China contributed most to the index’s return, while India, Indonesia, and Saudi Arabia were the top country detractors.
The factors that contributed most to the Fund’s performance during the period were:
|
FACTOR |
PERFORMANCE IMPACT |
OBSERVATIONS | ||
|
Semiconductor Exposure |
Positive |
The Fund’s overweight to semiconductors, alongside security selection within the industry, positively contributed to relative results. | ||
|
Ecommerce |
Negative |
Several of the Fund’s high-conviction ecommerce businesses were meaningful detractors for the period, driven by concerns about competition and investment, and overall negative sentiment for internet businesses in the latter portion of the period. | ||
|
China stocks |
Negative |
Security selection within China was a notable relative detractor during the period, overwhelming the benefit from the Fund’s underweight relative to the MSCI EM. | ||
|
South Korean stocks |
Negative |
The Fund’s average underweight during the period, alongside underperformance within the country, pressured relative results. | ||
The Fund’s portfolio increased its exposure to AI infrastructure during the period, broadening its positioning across growth drivers. As a result, the Fund’s portfolio underweight to South Korea and Taiwan narrowed meaningfully, moving from a combined 14% underweight to 4%, while absolute exposure rose from 12% to 34%. This shift was primarily funded by a reduction in India exposure. India moved from a 7% overweight to a 2% overweight, with absolute exposure declining from 26% to 15%.
Fund Performance
The following graph compares the initial and subsequent account values at the end of each of the most recently completed 10 fiscal years or since inception of the Fund. The graph assumes a $10,000 initial investment in the Fund and an appropriate broad-based securities market index and any additional indexes and assumes maximum sales charges, if any.
GROWTH OF $10,000
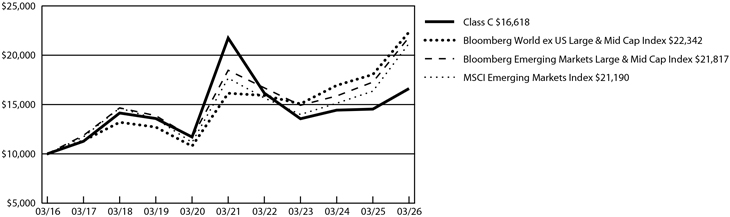
|
AVERAGE ANNUAL TOTAL RETURNS |
1 Year | 5 Years | 10 Years | |||||||||
|
Class C1 |
13.32% | -5.23% | 5.21% | |||||||||
|
Class C - excluding sales load |
14.32% | -5.23% | 5.21% | |||||||||
|
Bloomberg World ex US Large & Mid Cap Index2 |
23.79% | 6.71% | 8.37% | |||||||||
|
Bloomberg Emerging Markets Large & Mid Cap Index3 |
26.30% | 3.38% | 8.11% | |||||||||
|
MSCI Emerging Markets Index |
29.55% | 3.69% | 7.80% | |||||||||
| 1 |
The inception date was November 16, 2018. Performance information was calculated using the historical performance of Institutional Class shares for the periods prior to November 16, 2018. |
| 2 |
The Fund changed its broad-based securities market index to the Bloomberg World ex US Large & Mid Cap Index which is similarly representative of the overall securities market applicable to the Fund. |
| 3 |
The Fund changed its additional index to the Bloomberg Emerging Markets Large & Mid Cap Index which has similar investment objectives to the Fund. |
Visit touchstoneinvestments.com/mutual-funds for the most recent performance information.
Key Fund Statistics
|
Fund net assets |
$1,999,941,629 | |||
|
Total number of portfolio holdings |
45 | |||
|
Total advisory fees paid |
$17,285,790 | |||
|
Portfolio turnover rate |
51% | |||
Graphical Representation of Holdings
| SECTOR ALLOCATION (% OF NET ASSETS) | ||||
|
Information Technology |
37.4% | |||
|
Consumer Discretionary |
21.3% | |||
|
Financials |
17.4% | |||
|
Industrials |
7.3% | |||
|
Communication Services |
7.3% | |||
|
Consumer Staples |
3.6% | |||
|
Real Estate |
1.6% | |||
|
Health Care |
1.1% | |||
|
Short-Term Investment Fund |
2.8% | |||
|
Other Assets/Liabilities (Net) |
0.2% | |||
|
Total |
100.0% | |||
| GEOGRAPHICAL ALLOCATION (% OF NET ASSETS) | ||||
|
Common Stocks |
||||
|
China |
22.5% | |||
|
Taiwan |
19.3% | |||
|
South Korea |
15.7% | |||
|
India |
14.8% | |||
|
Brazil |
10.2% | |||
|
Hong Kong |
3.3% | |||
|
Singapore |
3.1% | |||
|
Other Countries |
8.1% | |||
|
Short-Term Investment Fund |
2.8% | |||
|
Other Assets/Liabilities (Net) |
0.2% | |||
|
Total |
100.0% | |||
Fund Expenses
|
Class |
Costs of a $10,000 investment |
Costs paid as a percentage of a $10,000 investment |
||||
|
Class Y |
$124 | 1.15% | ||||
Management’s Discussion of Fund Performance
The Fund seeks long-term capital appreciation. The Fund invests in equity and equity-related securities issued by companies located in emerging or frontier markets countries. The Fund’s sub‑adviser, Sands Capital Management, LLC (“Sands Capital”), uses a “bottom‑up” approach to investment selection, as opposed to sector or regional allocations that focuses on a company’s long-term business fundamentals. Sands Capital seeks companies that have: sustainable above-average earnings growth; a leadership position in a promising business space; significant competitive advantages such as profitability, superior quality or distribution relative to competitors or strong brand and consumer loyalty; a clear mission in an understandable business model; financial strength; and a rational valuation in relation to competitors, the market and business prospects.
The Fund’s Class Y shares performance was 15.41% for the reporting period.
The trailing 12‑month period ended March 31, 2026, was a strong but narrowly driven market for emerging market equities, as reflected by the MSCI Emerging Markets Index (MSCI EM). Just three companies—Taiwan Semiconductor Manufacturing Company Limited, Samsung Electronics Co. Ltd., and SK hynix Inc., accounted for over 70% of the index’s rise. Taiwan, South Korea, and China contributed most to the index’s return, while India, Indonesia, and Saudi Arabia were the top country detractors.
The factors that contributed most to the Fund’s performance during the period were:
|
FACTOR |
PERFORMANCE IMPACT |
OBSERVATIONS | ||
|
Semiconductor Exposure |
Positive |
The Fund’s overweight to semiconductors, alongside security selection within the industry, positively contributed to relative results. | ||
|
Ecommerce |
Negative |
Several of the Fund’s high-conviction ecommerce businesses were meaningful detractors for the period, driven by concerns about competition and investment, and overall negative sentiment for internet businesses in the latter portion of the period. | ||
|
China stocks |
Negative |
Security selection within China was a notable relative detractor during the period, overwhelming the benefit from the Fund’s underweight relative to the MSCI EM. | ||
|
South Korean stocks |
Negative |
The Fund’s average underweight during the period, alongside underperformance within the country, pressured relative results. | ||
The Fund’s portfolio increased its exposure to AI infrastructure during the period, broadening its positioning across growth drivers. As a result, the Fund’s portfolio underweight to South Korea and Taiwan narrowed meaningfully, moving from a combined 14% underweight to 4%, while absolute exposure rose from 12% to 34%. This shift was primarily funded by a reduction in India exposure. India moved from a 7% overweight to a 2% overweight, with absolute exposure declining from 26% to 15%.
Fund Performance
The following graph compares the initial and subsequent account values at the end of each of the most recently completed 10 fiscal years or since inception of the Fund. The graph assumes a $10,000 initial investment in the Fund and an appropriate broad-based securities market index and any additional indexes and assumes maximum sales charges, if any.
GROWTH OF $10,000
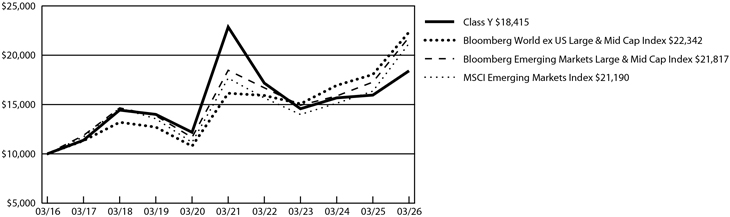
|
AVERAGE ANNUAL TOTAL RETURNS |
1 Year | 5 Years | 10 Years | |||||||||
|
Class Y |
15.41% | -4.23% | 6.30% | |||||||||
|
Bloomberg World ex US Large & Mid Cap Index1 |
23.79% | 6.71% | 8.37% | |||||||||
|
Bloomberg Emerging Markets Large & Mid Cap Index2 |
26.30% | 3.38% | 8.11% | |||||||||
|
MSCI Emerging Markets Index |
29.55% | 3.69% | 7.80% | |||||||||
| 1 |
The Fund changed its broad-based securities market index to the Bloomberg World ex US Large & Mid Cap Index which is similarly representative of the overall securities market applicable to the Fund. |
| 2 |
The Fund changed its additional index to the Bloomberg Emerging Markets Large & Mid Cap Index which has similar investment objectives to the Fund. |
Visit touchstoneinvestments.com/mutual-funds for the most recent performance information.
Key Fund Statistics
|
Fund net assets |
$ | 1,999,941,629 | ||
|
Total number of portfolio holdings |
45 | |||
|
Total advisory fees paid |
$17,285,790 | |||
|
Portfolio turnover rate |
51% | |||
Graphical Representation of Holdings
| SECTOR ALLOCATION (% OF NET ASSETS) | ||||
|
Information Technology |
37.4% | |||
|
Consumer Discretionary |
21.3% | |||
|
Financials |
17.4% | |||
|
Industrials |
7.3% | |||
|
Communication Services |
7.3% | |||
|
Consumer Staples |
3.6% | |||
|
Real Estate |
1.6% | |||
|
Health Care |
1.1% | |||
|
Short-Term Investment Fund |
2.8% | |||
|
Other Assets/Liabilities (Net) |
0.2% | |||
|
Total |
100.0% | |||
| GEOGRAPHICAL ALLOCATION (% OF NET ASSETS) | ||||
|
Common Stocks |
||||
|
China |
22.5% | |||
|
Taiwan |
19.3% | |||
|
South Korea |
15.7% | |||
|
India |
14.8% | |||
|
Brazil |
10.2% | |||
|
Hong Kong |
3.3% | |||
|
Singapore |
3.1% | |||
|
Other Countries |
8.1% | |||
|
Short-Term Investment Fund |
2.8% | |||
|
Other Assets/Liabilities (Net) |
0.2% | |||
|
Total |
100.0% | |||
Fund Expenses
|
Class |
Costs of a $10,000 investment |
Costs paid as a percentage of a $10,000 investment |
||||
|
Institutional Class |
$112 | 1.04% | ||||
Management’s Discussion of Fund Performance
The Fund seeks long-term capital appreciation. The Fund invests in equity and equity-related securities issued by companies located in emerging or frontier markets countries. The Fund’s sub‑adviser, Sands Capital Management, LLC (“Sands Capital”), uses a “bottom‑up” approach to investment selection, as opposed to sector or regional allocations that focuses on a company’s long-term business fundamentals. Sands Capital seeks companies that have: sustainable above-average earnings growth; a leadership position in a promising business space; significant competitive advantages such as profitability, superior quality or distribution relative to competitors or strong brand and consumer loyalty; a clear mission in an understandable business model; financial strength; and a rational valuation in relation to competitors, the market and business prospects.
The Fund’s Institutional Class shares performance was 15.50% for the reporting period.
The trailing 12‑month period ended March 31, 2026, was a strong but narrowly driven market for emerging market equities, as reflected by the MSCI Emerging Markets Index (MSCI EM). Just three companies—Taiwan Semiconductor Manufacturing Company Limited, Samsung Electronics Co. Ltd., and SK hynix Inc., accounted for over 70% of the index’s rise. Taiwan, South Korea, and China contributed most to the index’s return, while India, Indonesia, and Saudi Arabia were the top country detractors.
The factors that contributed most to the Fund’s performance during the period were:
|
FACTOR |
PERFORMANCE IMPACT |
OBSERVATIONS | ||
|
Semiconductor Exposure |
Positive |
The Fund’s overweight to semiconductors, alongside security selection within the industry, positively contributed to relative results. | ||
|
Ecommerce |
Negative |
Several of the Fund’s high-conviction ecommerce businesses were meaningful detractors for the period, driven by concerns about competition and investment, and overall negative sentiment for internet businesses in the latter portion of the period. | ||
|
China stocks |
Negative |
Security selection within China was a notable relative detractor during the period, overwhelming the benefit from the Fund’s underweight relative to the MSCI EM. | ||
|
South Korean stocks |
Negative |
The Fund’s average underweight during the period, alongside underperformance within the country, pressured relative results. | ||
The Fund’s portfolio increased its exposure to AI infrastructure during the period, broadening its positioning across growth drivers. As a result, the Fund’s portfolio underweight to South Korea and Taiwan narrowed meaningfully, moving from a combined 14% underweight to 4%, while absolute exposure rose from 12% to 34%. This shift was primarily funded by a reduction in India exposure. India moved from a 7% overweight to a 2% overweight, with absolute exposure declining from 26% to 15%.
Fund Performance
The following graph compares the initial and subsequent account values at the end of each of the most recently completed 10 fiscal years or since inception of the Fund. The graph assumes a $10,000 initial investment in the Fund and an appropriate broad-based securities market index and any additional indexes and assumes maximum sales charges, if any.
GROWTH OF $10,000

|
AVERAGE ANNUAL TOTAL RETURNS |
1 Year | 5 Years | 10 Years | |||||||||
|
Institutional Class |
15.50% | -4.16% | 6.38% | |||||||||
|
Bloomberg World ex US Large & Mid Cap Index1 |
23.79% | 6.71% | 8.37% | |||||||||
|
Bloomberg Emerging Markets Large & Mid Cap Index2 |
26.30% | 3.38% | 8.11% | |||||||||
|
MSCI Emerging Markets Index |
29.55% | 3.69% | 7.80% | |||||||||
| 1 |
The Fund changed its broad-based securities market index to the Bloomberg World ex US Large & Mid Cap Index which is similarly representative of the overall securities market applicable to the Fund. |
| 2 |
The Fund changed its additional index to the Bloomberg Emerging Markets Large & Mid Cap Index which has similar investment objectives to the Fund. |
Visit touchstoneinvestments.com/mutual-funds for the most recent performance information.
Key Fund Statistics
|
Fund net assets |
$ | 1,999,941,629 | ||
|
Total number of portfolio holdings |
45 | |||
|
Total advisory fees paid |
$17,285,790 | |||
|
Portfolio turnover rate |
51% | |||
Graphical Representation of Holdings
| SECTOR ALLOCATION (% OF NET ASSETS) | ||||
|
Information Technology |
37.4% | |||
|
Consumer Discretionary |
21.3% | |||
|
Financials |
17.4% | |||
|
Industrials |
7.3% | |||
|
Communication Services |
7.3% | |||
|
Consumer Staples |
3.6% | |||
|
Real Estate |
1.6% | |||
|
Health Care |
1.1% | |||
|
Short-Term Investment Fund |
2.8% | |||
|
Other Assets/Liabilities (Net) |
0.2% | |||
|
Total |
100.0% | |||
| GEOGRAPHICAL ALLOCATION (% OF NET ASSETS) | ||||
|
Common Stocks |
||||
|
China |
22.5% | |||
|
Taiwan |
19.3% | |||
|
South Korea |
15.7% | |||
|
India |
14.8% | |||
|
Brazil |
10.2% | |||
|
Hong Kong |
3.3% | |||
|
Singapore |
3.1% | |||
|
Other Countries |
8.1% | |||
|
Short-Term Investment Fund |
2.8% | |||
|
Other Assets/Liabilities (Net) |
0.2% | |||
|
Total |
100.0% | |||
Fund Expenses
|
Class |
Costs of a $10,000 investment |
Costs paid as a percentage of a $10,000 investment |
||||
|
Class R6 |
$108 | 1.00% | ||||
Management’s Discussion of Fund Performance
The Fund seeks long-term capital appreciation. The Fund invests in equity and equity-related securities issued by companies located in emerging or frontier markets countries. The Fund’s sub‑adviser, Sands Capital Management, LLC (“Sands Capital”), uses a “bottom‑up” approach to investment selection, as opposed to sector or regional allocations that focuses on a company’s long-term business fundamentals. Sands Capital seeks companies that have: sustainable above-average earnings growth; a leadership position in a promising business space; significant competitive advantages such as profitability, superior quality or distribution relative to competitors or strong brand and consumer loyalty; a clear mission in an understandable business model; financial strength; and a rational valuation in relation to competitors, the market and business prospects.
The Fund’s Class R6 shares performance was 15.60% for the reporting period.
The trailing 12‑month period ended March 31, 2026, was a strong but narrowly driven market for emerging market equities, as reflected by the MSCI Emerging Markets Index (MSCI EM). Just three companies—Taiwan Semiconductor Manufacturing Company Limited, Samsung Electronics Co. Ltd., and SK hynix Inc., accounted for over 70% of the index’s rise. Taiwan, South Korea, and China contributed most to the index’s return, while India, Indonesia, and Saudi Arabia were the top country detractors.
The factors that contributed most to the Fund’s performance during the period were:
|
FACTOR |
PERFORMANCE
IMPACT |
OBSERVATIONS | ||
|
Semiconductor Exposure |
Positive |
The Fund’s overweight to semiconductors, alongside security selection within the industry, positively contributed to relative results. | ||
|
Ecommerce |
Negative |
Several of the Fund’s high-conviction ecommerce businesses were meaningful detractors for the period, driven by concerns about competition and investment, and overall negative sentiment for internet businesses in the latter portion of the period. | ||
|
China stocks |
Negative |
Security selection within China was a notable relative detractor during the period, overwhelming the benefit from the Fund’s underweight relative to the MSCI EM. | ||
|
South Korean stocks |
Negative |
The Fund’s average underweight during the period, alongside underperformance within the country, pressured relative results. | ||
The Fund’s portfolio increased its exposure to AI infrastructure during the period, broadening its positioning across growth drivers. As a result, the Fund’s portfolio underweight to South Korea and Taiwan narrowed meaningfully, moving from a combined 14% underweight to 4%, while absolute exposure rose from 12% to 34%. This shift was primarily funded by a reduction in India exposure. India moved from a 7% overweight to a 2% overweight, with absolute exposure declining from 26% to 15%.
Fund Performance
The following graph compares the initial and subsequent account values at the end of each of the most recently completed 10 fiscal years or since inception of the Fund. The graph assumes a $10,000 initial investment in the Fund and an appropriate broad-based securities market index and any additional indexes and assumes maximum sales charges, if any.
GROWTH OF $10,000
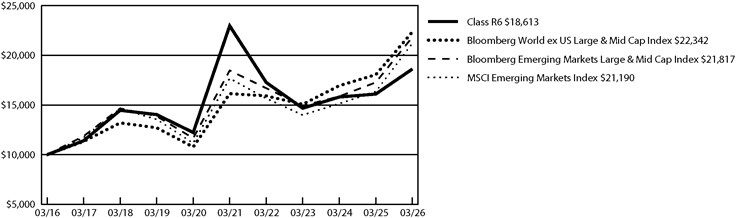
|
AVERAGE ANNUAL TOTAL RETURNS |
1 Year | 5 Years | 10 Years | |||||||||
|
Class R61 |
15.60% | -4.12% | 6.41% | |||||||||
|
Bloomberg World ex US Large & Mid Cap Index2 |
23.79% | 6.71% | 8.37% | |||||||||
|
Bloomberg Emerging Markets Large & Mid Cap Index3 |
26.30% | 3.38% | 8.11% | |||||||||
|
MSCI Emerging Markets Index |
29.55% | 3.69% | 7.80% | |||||||||
| 1 |
The inception date was April 26, 2021. Performance information was calculated using the historical performance of Institutional Class shares for the periods prior to April 26, 2021. |
| 2 |
The Fund changed its broad-based securities market index to the Bloomberg World ex US Large & Mid Cap Index which is similarly representative of the overall securities market applicable to the Fund. |
| 3 |
The Fund changed its additional index to the Bloomberg Emerging Markets Large & Mid Cap Index which has similar investment objectives to the Fund. |
Visit touchstoneinvestments.com/mutual-funds for the most recent performance information.
Key Fund Statistics
|
Fund net assets |
$ | 1,999,941,629 | ||
|
Total number of portfolio holdings |
45 | |||
|
Total advisory fees paid |
$17,285,790 | |||
|
Portfolio turnover rate |
51% | |||
Graphical Representation of Holdings
| SECTOR ALLOCATION (% OF NET ASSETS) | ||||
|
Information Technology |
37.4% | |||
|
Consumer Discretionary |
21.3% | |||
|
Financials |
17.4% | |||
|
Industrials |
7.3% | |||
|
Communication Services |
7.3% | |||
|
Consumer Staples |
3.6% | |||
|
Real Estate |
1.6% | |||
|
Health Care |
1.1% | |||
|
Short-Term Investment Fund |
2.8% | |||
|
Other Assets/Liabilities (Net) |
0.2% | |||
|
Total |
100.0% | |||
| GEOGRAPHICAL ALLOCATION (% OF NET ASSETS) | ||||
|
Common Stocks |
||||
|
China |
22.5% | |||
|
Taiwan |
19.3% | |||
|
South Korea |
15.7% | |||
|
India |
14.8% | |||
|
Brazil |
10.2% | |||
|
Hong Kong |
3.3% | |||
|
Singapore |
3.1% | |||
|
Other Countries |
8.1% | |||
|
Short-Term Investment Fund |
2.8% | |||
|
Other Assets/Liabilities (Net) |
0.2% | |||
|
Total |
100.0% | |||
Fund Expenses
|
Class |
Costs of a $10,000 investment |
Costs paid as a percentage of a $10,000 investment |
||||
|
Institutional Class |
$66 | 0.64% | ||||
Management’s Discussion of Fund Performance
The Fund seeks a high level of current income with a focus on capital preservation by investing primarily in income producing fixed income securities. The Fund’s sub‑adviser, Fort Washington Investment Advisors, Inc., employs a high conviction, yield-oriented investment approach with a relatively focused number of issuers, coupled with sector diversification and diligent risk management that is intended to result in attractive risk-adjusted returns via high levels of income.
The Fund’s Institutional Class shares performance was 7.10% for the reporting period.
Over the 12 month period ended March 31, 2026, financial market volatility was elevated in the face of uncertainty related to changing monetary policy, mixed economic indicators, increased geopolitical risks, and shifting U.S. trade policy. The curve steepened meaningfully as the Federal Reserve cut rates in the final three meetings of 2025 and investors adjusted their expectations for inflation. Credit spreads were largely range-bound over the 12‑month period, spending most of the period at levels tight relative to history. However, valuations cheapened briefly following tariff announcements (“Liberation Day”) in April 2025 and, more modestly, in March 2026 amid the conflict with Iran.
The factors that contributed most to the Fund’s performance during the period were:
|
FACTOR |
PERFORMANCE
IMPACT |
OBSERVATIONS | ||
|
Interest Rate Management |
Positive |
Interest rates were volatile and as a result the Fund tactically adjusted duration positioning over the reporting period. The aggregate impact from interest rate management contributed to relative performance. | ||
|
Sector Allocation |
Positive |
Over the reporting period, the Fund maintained an overweight allocation to high yield corporates, emerging market debt, and non‑credit sectors which all contributed to relative outperformance. | ||
|
Security Selection |
Positive |
Security selection within investment grade corporates, high yield, and securitized contributed to relative outperformance. | ||
|
Security Selection – Emerging Market Debt |
Negative |
While security selection overall was positive for the Fund, selection within emerging market debt was negative and offset some of that outperformance. | ||
The Fund increased its allocation to high yield corporates amid tariff-driven volatility. As volatility eased in the second half of the year, the Fund reduced exposure to high yield and collateralized loan obligations due to rich valuations, while increasing allocations to investment grade corporates and non-agency securitized sectors. Positioning shifted up in quality given historically tight spreads and asymmetric downside risk, with only modest sector changes otherwise.
Fund Performance
The following graph compares the initial and subsequent account values at the end of each of the most recently completed 10 fiscal years or since inception of the Fund. The graph assumes a $10,000 initial investment in the Fund and an appropriate broad-based securities market index and assumes maximum sales charges, if any.
GROWTH OF $10,000
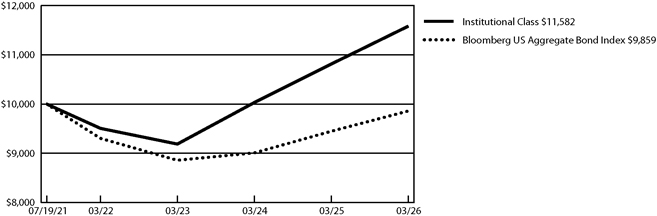
|
AVERAGE ANNUAL TOTAL RETURNS |
1 Year | Since Inception1 | ||||||||||
|
Institutional Class |
7.10% | 3.18% | ||||||||||
|
Bloomberg US Aggregate Bond Index |
4.35% | -0.30% | ||||||||||
| 1 |
The inception date was July 19, 2021. The returns of the index listed above is based on the inception date of the Class. |
Visit touchstoneinvestments.com/mutual-funds for the most recent performance information.
Key Fund Statistics
|
Fund net assets |
$302,545,068 | |||
|
Total number of portfolio holdings |
209 | |||
|
Total advisory fees paid |
$1,607,481 | |||
|
Portfolio turnover rate |
193% | |||
Graphical Representation of Holdings
| ASSET CATEGORY (% OF NET ASSETS) | ||||
|
Corporate Bonds |
48.0% | |||
|
U.S. Treasury Obligations |
21.4% | |||
|
Asset-Backed Securities |
10.0% | |||
|
Commercial Mortgage-Backed Securities |
8.5% | |||
|
Non‑Agency Collateralized Mortgage Obligations |
6.7% | |||
|
Common Stocks |
1.9% | |||
|
U.S. Government Mortgage-Backed Obligations |
0.8% | |||
|
Sovereign Government Obligations |
0.7% | |||
|
Rights |
0.0% | |||
|
Short-Term Investment Funds |
2.9% | |||
|
Other Assets/Liabilities (Net) |
(0.9)% | |||
|
Total |
100.0% | |||
| CREDIT QUALITY* (% OF FIXED INCOME SECURITIES) | ||||
|
AAA/Aaa |
30.4% | |||
|
AA/Aa |
6.0% | |||
|
A/A |
13.1% | |||
|
BBB/Baa |
34.5% | |||
|
BB/Ba |
9.0% | |||
|
B/B |
6.4% | |||
|
CCC |
0.6% | |||
|
Total |
100.0% | |||
* Credit quality ratings are from S&P Global Ratings (“S&P”) and Moody’s Investor Service (“Moody’s”). If agency ratings differ, the higher ratings will be used. Where no rating has been assigned, it may be for reasons unrelated to the creditworthiness of the issuer.
Fund Expenses
|
Class |
Costs of a $10,000 investment |
Costs paid as a percentage of a $10,000 investment |
||||
|
Class Y |
$76 | 0.73% | ||||
Management’s Discussion of Fund Performance
The Fund seeks a high level of current income with a focus on capital preservation by investing primarily in income producing fixed income securities. The Fund’s sub‑adviser, Fort Washington Investment Advisors, Inc., employs a high conviction, yield-oriented investment approach with a relatively focused number of issuers, coupled with sector diversification and diligent risk management that is intended to result in attractive risk-adjusted returns via high levels of income.
The Fund’s Class Y shares performance was 7.00% for the reporting period.
Over the 12 month period ended March 31, 2026, financial market volatility was elevated in the face of uncertainty related to changing monetary policy, mixed economic indicators, increased geopolitical risks, and shifting U.S. trade policy. The curve steepened meaningfully as the Federal Reserve cut rates in the final three meetings of 2025 and investors adjusted their expectations for inflation. Credit spreads were largely range-bound over the 12‑month period, spending most of the period at levels tight relative to history. However, valuations cheapened briefly following tariff announcements (“Liberation Day”) in April 2025 and, more modestly, in March 2026 amid the conflict with Iran.
The factors that contributed most to the Fund’s performance during the period were:
|
FACTOR |
PERFORMANCE IMPACT |
OBSERVATIONS | ||
|
Interest Rate Management |
Positive |
Interest rates were volatile and as a result the Fund tactically adjusted duration positioning over the reporting period. The aggregate impact from interest rate management contributed to relative performance. | ||
|
Sector Allocation |
Positive |
Over the reporting period, the Fund maintained an overweight allocation to high yield corporates, emerging market debt, and non‑credit sectors which all contributed to relative outperformance. | ||
|
Security Selection |
Positive |
Security selection within investment grade corporates, high yield, and securitized contributed to relative outperformance. | ||
|
Security Selection – Emerging Market Debt |
Negative |
While security selection overall was positive for the Fund, selection within emerging market debt was negative and offset some of that outperformance. | ||
The Fund increased its allocation to high yield corporates amid tariff-driven volatility. As volatility eased in the second half of the year, the Fund reduced exposure to high yield and collateralized loan obligations due to rich valuations, while increasing allocations to investment grade corporates and non-agency securitized sectors. Positioning shifted up in quality given historically tight spreads and asymmetric downside risk, with only modest sector changes otherwise.
Fund Performance
The following graph compares the initial and subsequent account values at the end of each of the most recently completed 10 fiscal years or since inception of the Fund. The graph assumes a $10,000 initial investment in the Fund and an appropriate broad-based securities market index and assumes maximum sales charges, if any.
GROWTH OF $10,000
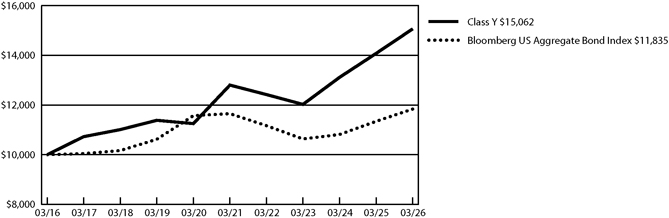
|
AVERAGE ANNUAL TOTAL RETURNS |
1 Year | 5 Years | 10 Years | |||||||||
|
Class Y |
7.00% | 3.31% | 4.18% | |||||||||
|
Bloomberg US Aggregate Bond Index |
4.35% | 0.31% | 1.70% | |||||||||
Visit touchstoneinvestments.com/mutual-funds for the most recent performance information.
Key Fund Statistics
|
Fund net assets |
$ | 302,545,068 | ||
|
Total number of portfolio holdings |
209 | |||
|
Total advisory fees paid |
$1,607,481 | |||
|
Portfolio turnover rate |
193% | |||
Graphical Representation of Holdings
| ASSET CATEGORY (% OF NET ASSETS) | ||||
|
Corporate Bonds |
48.0% | |||
|
U.S. Treasury Obligations |
21.4% | |||
|
Asset-Backed Securities |
10.0% | |||
|
Commercial Mortgage-Backed Securities |
8.5% | |||
|
Non‑Agency Collateralized Mortgage Obligations |
6.7% | |||
|
Common Stocks |
1.9% | |||
|
U.S. Government Mortgage-Backed Obligations |
0.8% | |||
|
Sovereign Government Obligations |
0.7% | |||
|
Rights |
0.0% | |||
|
Short-Term Investment Funds |
2.9% | |||
|
Other Assets/Liabilities (Net) |
(0.9)% | |||
|
Total |
100.0% | |||
| CREDIT QUALITY* (% OF FIXED INCOME SECURITIES) | ||||
|
AAA/Aaa |
30.4% | |||
|
AA/Aa |
6.0% | |||
|
A/A |
13.1% | |||
|
BBB/Baa |
34.5% | |||
|
BB/Ba |
9.0% | |||
|
B/B |
6.4% | |||
|
CCC |
0.6% | |||
|
Total |
100.0% | |||
* Credit quality ratings are from S&P Global Ratings (“S&P”) and Moody’s Investor Service (“Moody’s”). If agency ratings differ, the higher ratings will be used. Where no rating has been assigned, it may be for reasons unrelated to the creditworthiness of the issuer.
Fund Expenses
|
Class |
Costs of a $10,000 investment |
Costs paid as a percentage of a $10,000 investment |
||||
|
Class C |
$175 | 1.70% | ||||
Management’s Discussion of Fund Performance
The Fund seeks a high level of current income with a focus on capital preservation by investing primarily in income producing fixed income securities. The Fund’s sub‑adviser, Fort Washington Investment Advisors, Inc., employs a high conviction, yield-oriented investment approach with a relatively focused number of issuers, coupled with sector diversification and diligent risk management that is intended to result in attractive risk-adjusted returns via high levels of income.
The Fund’s Class C shares performance was 5.89% (excluding sales loads) for the reporting period.
Over the 12 month period ended March 31, 2026, financial market volatility was elevated in the face of uncertainty related to changing monetary policy, mixed economic indicators, increased geopolitical risks, and shifting U.S. trade policy. The curve steepened meaningfully as the Federal Reserve cut rates in the final three meetings of 2025 and investors adjusted their expectations for inflation. Credit spreads were largely range-bound over the 12‑month period, spending most of the period at levels tight relative to history. However, valuations cheapened briefly following tariff announcements (“Liberation Day”) in April 2025 and, more modestly, in March 2026 amid the conflict with Iran.
The factors that contributed most to the Fund’s performance during the period were:
|
FACTOR |
PERFORMANCE IMPACT |
OBSERVATIONS | ||
|
Interest Rate Management |
Positive |
Interest rates were volatile and as a result the Fund tactically adjusted duration positioning over the reporting period. The aggregate impact from interest rate management contributed to relative performance. | ||
|
Sector Allocation |
Positive |
Over the reporting period, the Fund maintained an overweight allocation to high yield corporates, emerging market debt, and non‑credit sectors which all contributed to relative outperformance. | ||
|
Security Selection |
Positive |
Security selection within investment grade corporates, high yield, and securitized contributed to relative outperformance. | ||
|
Security Selection – Emerging Market Debt |
Negative |
While security selection overall was positive for the Fund, selection within emerging market debt was negative and offset some of that outperformance. | ||
The Fund increased its allocation to high yield corporates amid tariff-driven volatility. As volatility eased in the second half of the year, the Fund reduced exposure to high yield and collateralized loan obligations due to rich valuations, while increasing allocations to investment grade corporates and non-agency securitized sectors. Positioning shifted up in quality given historically tight spreads and asymmetric downside risk, with only modest sector changes otherwise.
Fund Performance
The following graph compares the initial and subsequent account values at the end of each of the most recently completed 10 fiscal years or since inception of the Fund. The graph assumes a $10,000 initial investment in the Fund and an appropriate broad-based securities market index and assumes maximum sales charges, if any.
GROWTH OF $10,000
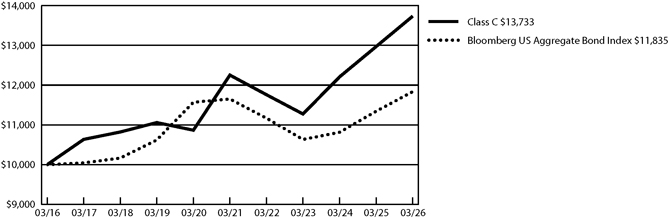
|
AVERAGE ANNUAL TOTAL RETURNS |
1 Year | 5 Years | 10 Years | |||||||||
|
Class C |
4.89% | 2.31% | 3.22% | |||||||||
|
Class C - excluding sales load |
5.89% | 2.31% | 3.22% | |||||||||
|
Bloomberg US Aggregate Bond Index |
4.35% | 0.31% | 1.70% | |||||||||
Visit touchstoneinvestments.com/mutual-funds for the most recent performance information.
Key Fund Statistics
|
Fund net assets |
$ | 302,545,068 | ||
|
Total number of portfolio holdings |
209 | |||
|
Total advisory fees paid |
$1,607,481 | |||
|
Portfolio turnover rate |
193% | |||
Graphical Representation of Holdings
| ASSET CATEGORY (% OF NET ASSETS) | ||||
|
Corporate Bonds |
48.0% | |||
|
U.S. Treasury Obligations |
21.4% | |||
|
Asset-Backed Securities |
10.0% | |||
|
Commercial Mortgage-Backed Securities |
8.5% | |||
|
Non‑Agency Collateralized Mortgage Obligations |
6.7% | |||
|
Common Stocks |
1.9% | |||
|
U.S. Government Mortgage-Backed Obligations |
0.8% | |||
|
Sovereign Government Obligations |
0.7% | |||
|
Rights |
0.0% | |||
|
Short-Term Investment Funds |
2.9% | |||
|
Other Assets/Liabilities (Net) |
(0.9)% | |||
|
Total |
100.0% | |||
| CREDIT QUALITY* (% OF FIXED INCOME SECURITIES) | ||||
|
AAA/Aaa |
30.4% | |||
|
AA/Aa |
6.0% | |||
|
A/A |
13.1% | |||
|
BBB/Baa |
34.5% | |||
|
BB/Ba |
9.0% | |||
|
B/B |
6.4% | |||
|
CCC |
0.6% | |||
|
Total |
100.0% | |||
* Credit quality ratings are from S&P Global Ratings (“S&P”) and Moody’s Investor Service (“Moody’s”). If agency ratings differ, the higher ratings will be used. Where no rating has been assigned, it may be for reasons unrelated to the creditworthiness of the issuer.
Fund Expenses
|
Class |
Costs of a $10,000 investment |
Costs paid as a percentage of a $10,000 investment |
||||
|
Class A |
$102 | 0.99% | ||||
Management’s Discussion of Fund Performance
The Fund seeks a high level of current income with a focus on capital preservation by investing primarily in income producing fixed income securities. The Fund’s sub‑adviser, Fort Washington Investment Advisors, Inc., employs a high conviction, yield-oriented investment approach with a relatively focused number of issuers, coupled with sector diversification and diligent risk management that is intended to result in attractive risk-adjusted returns via high levels of income.
The Fund’s Class A shares performance was 6.70% (excluding sales loads) for the reporting period.
Over the 12 month period ended March 31, 2026, financial market volatility was elevated in the face of uncertainty related to changing monetary policy, mixed economic indicators, increased geopolitical risks, and shifting U.S. trade policy. The curve steepened meaningfully as the Federal Reserve cut rates in the final three meetings of 2025 and investors adjusted their expectations for inflation. Credit spreads were largely range-bound over the 12‑month period, spending most of the period at levels tight relative to history. However, valuations cheapened briefly following tariff announcements (“Liberation Day”) in April 2025 and, more modestly, in March 2026 amid the conflict with Iran.
The factors that contributed most to the Fund’s performance during the period were:
|
FACTOR |
PERFORMANCE
IMPACT |
OBSERVATIONS | ||
|
Interest Rate Management |
Positive |
Interest rates were volatile and as a result the Fund tactically adjusted duration positioning over the reporting period. The aggregate impact from interest rate management contributed to relative performance. | ||
|
Sector Allocation |
Positive |
Over the reporting period, the Fund maintained an overweight allocation to high yield corporates, emerging market debt, and non‑credit sectors which all contributed to relative outperformance. | ||
|
Security Selection |
Positive |
Security selection within investment grade corporates, high yield, and securitized contributed to relative outperformance. | ||
|
Security Selection – Emerging Market Debt |
Negative |
While security selection overall was positive for the Fund, selection within emerging market debt was negative and offset some of that outperformance. | ||
The Fund increased its allocation to high yield corporates amid tariff-driven volatility. As volatility eased in the second half of the year, the Fund reduced exposure to high yield and collateralized loan obligations due to rich valuations, while increasing allocations to investment grade corporates and non-agency securitized sectors. Positioning shifted up in quality given historically tight spreads and asymmetric downside risk, with only modest sector changes otherwise.
Fund Performance
The following graph compares the initial and subsequent account values at the end of each of the most recently completed 10 fiscal years or since inception of the Fund. The graph assumes a $10,000 initial investment in the Fund and an appropriate broad-based securities market index and assumes maximum sales charges, if any.
GROWTH OF $10,000
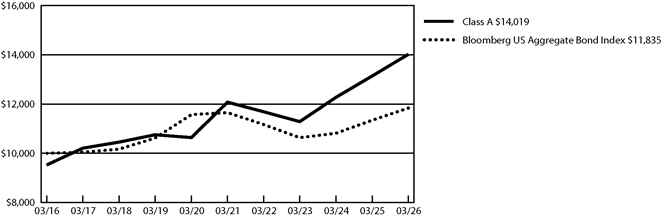
|
AVERAGE ANNUAL TOTAL RETURNS |
1 Year | 5 Years | 10 Years | |||||||||
|
Class A |
3.15% | 2.05% | 3.44% | |||||||||
|
Class A - excluding sales load |
6.70% | 3.03% | 3.93% | |||||||||
|
Bloomberg US Aggregate Bond Index |
4.35% | 0.31% | 1.70% | |||||||||
Visit touchstoneinvestments.com/mutual-funds for the most recent performance information.
Key Fund Statistics
|
Fund net assets |
$302,545,068 | |||
|
Total number of portfolio holdings |
209 | |||
|
Total advisory fees paid |
$1,607,481 | |||
|
Portfolio turnover rate |
193% | |||
Graphical Representation of Holdings
| ASSET CATEGORY (% OF NET ASSETS) | ||||
|
Corporate Bonds |
48.0% | |||
|
U.S. Treasury Obligations |
21.4% | |||
|
Asset-Backed Securities |
10.0% | |||
|
Commercial Mortgage-Backed Securities |
8.5% | |||
|
Non‑Agency Collateralized Mortgage Obligations |
6.7% | |||
|
Common Stocks |
1.9% | |||
|
U.S. Government Mortgage-Backed Obligations |
0.8% | |||
|
Sovereign Government Obligations |
0.7% | |||
|
Rights |
0.0% | |||
|
Short-Term Investment Funds |
2.9% | |||
|
Other Assets/Liabilities (Net) |
(0.9)% | |||
|
Total |
100.0% | |||
| CREDIT QUALITY* (% OF FIXED INCOME SECURITIES) | ||||
|
AAA/Aaa |
30.4% | |||
|
AA/Aa |
6.0% | |||
|
A/A |
13.1% | |||
|
BBB/Baa |
34.5% | |||
|
BB/Ba |
9.0% | |||
|
B/B |
6.4% | |||
|
CCC |
0.6% | |||
|
Total |
100.0% | |||
* Credit quality ratings are from S&P Global Ratings (“S&P”) and Moody’s Investor Service (“Moody’s”). If agency ratings differ, the higher ratings will be used. Where no rating has been assigned, it may be for reasons unrelated to the creditworthiness of the issuer.