Shareholder Report
|
12 Months Ended |
|
Mar. 31, 2026
USD ($)
Holding
|
|---|
| Shareholder Report [Line Items] |
|
| Document Type |
N-CSR
|
| Amendment Flag |
false
|
| Registrant Name |
Columbia Funds Series Trust
|
| Entity Central Index Key |
0001097519
|
| Entity Investment Company Type |
N-1A
|
| Document Period End Date |
Mar. 31, 2026
|
| Shareholder Report Annual or Semi-Annual |
Annual Shareholder Report
|
| C000029788 |
|
| Shareholder Report [Line Items] |
|
| Fund Name |
Columbia Short Term Bond Fund
|
| Class Name |
Class A
|
| Trading Symbol |
NSTRX
|
| Annual or Semi-Annual Statement [Text Block] |
This annual shareholder report contains important information about Columbia Short Term Bond Fund (the Fund) for the period of April 1, 2025 to March 31, 2026.
|
| Additional Information [Text Block] |
You can find additional information about the Fund at columbiathreadneedleus.com/resources/literature. You can also request more information by contacting us at 1-800-345-6611.
|
| Additional Information Phone Number |
1-800-345-6611
|
| Additional Information Website |
columbiathreadneedleus.com/resources/literature
|
| Expenses [Text Block] |
What were the Fund costs for the reporting period? (Based on a hypothetical $10,000 investment)
Table Summary
Class |
Cost of a $10,000 investment |
Cost paid as a percentage of a $10,000 investment |
Class A |
$72 |
0.70% | |
| Expenses Paid, Amount |
$ 72
|
| Expense Ratio, Percent |
0.70%
|
| Factors Affecting Performance [Text Block] |
Management's Discussion of Fund Performance The performance of Class A shares for the period presented is shown in the Average Annual Total Returns table. Top Performance ContributorsAllocations | The Fund benefited most on a relative basis from having exposure to residential mortgage-backed securities, investment-grade corporates, asset-backed securities and commercial mortgage-backed securities. Structured asset sectors are all out-of-benchmark sectors, which contributed to the Fund’s relative performance during the annual period. High-yield corporates also contributed to the Fund’s relative performance as an out-of-benchmark allocation. Security selection | Security selection within the investment-grade corporate bond sector was additive to the Fund’s performance. Selection within the industrials and financials sub-sectors also contributed to the Fund’s relative performance. Top Performance DetractorsAllocations | An underweight allocation to the investment-grade corporate bond sector detracted modestly from the Fund’s relative performance, as the sector outperformed the benchmark during the annual period. Investment-grade corporate bonds represented the Fund’s largest sector underweight, excluding U.S. Treasuries. Duration and curve positioning | The combination of duration and yield curve positioning had a negative impact on the Fund’s relative performance during the annual period. The U.S. Federal Reserve continued easing monetary policy during the period with three 25 basis point cuts resulting in a flattening of the yield curve. However, market volatility and the conflict in Iran have the Fed cautious on future reductions in the fed funds target rate in 2026 due to economic uncertainty and the long-term impact of a potential prolonged war. |
| Performance Past Does Not Indicate Future [Text] |
The Fund's past performance is not a good predictor of the Fund's future performance.
|
| Line Graph [Table Text Block] |
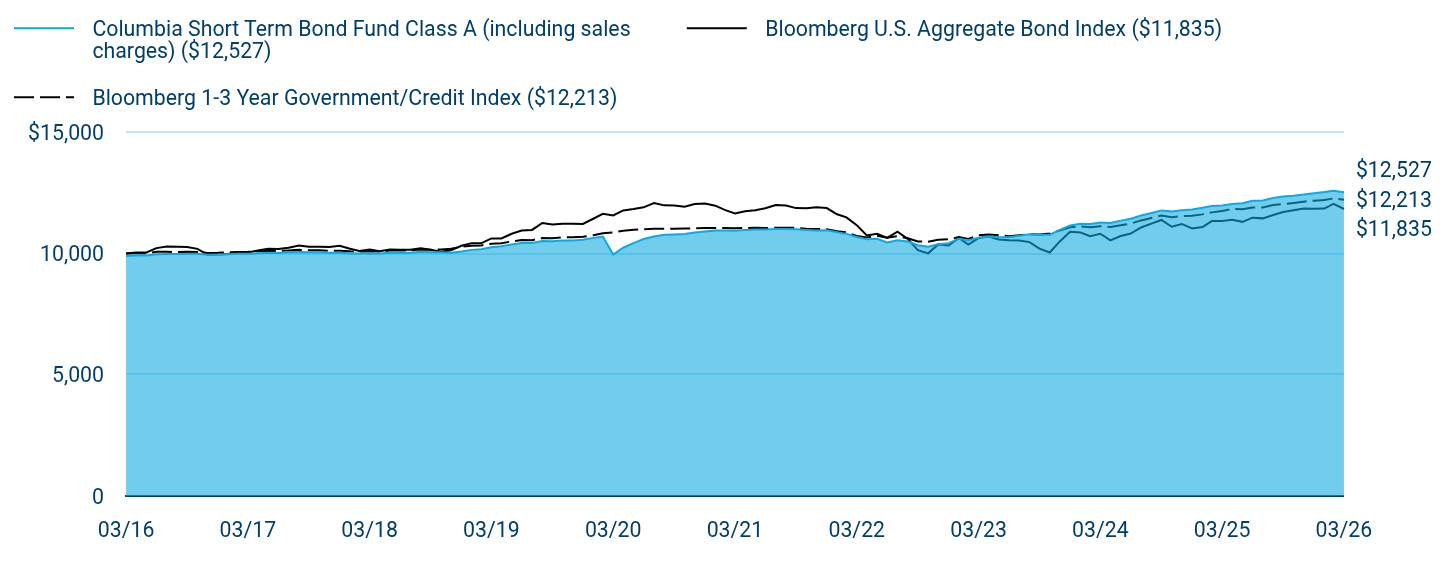
Table Summary
|
Columbia Short Term Bond Fund Class A (including sales charges) ($12,527) |
Bloomberg U.S. Aggregate Bond Index ($11,835) |
Bloomberg 1-3 Year Government/Credit Index ($12,213) |
03/16 |
$9,901 |
$10,000 |
$10,000 |
04/16 |
$9,924 |
$10,038 |
$10,014 |
05/16 |
$9,918 |
$10,041 |
$10,007 |
06/16 |
$9,973 |
$10,221 |
$10,067 |
07/16 |
$9,979 |
$10,286 |
$10,069 |
08/16 |
$9,976 |
$10,274 |
$10,058 |
09/16 |
$9,993 |
$10,268 |
$10,069 |
10/16 |
$9,990 |
$10,190 |
$10,066 |
11/16 |
$9,947 |
$9,949 |
$10,024 |
12/16 |
$9,955 |
$9,963 |
$10,030 |
01/17 |
$9,973 |
$9,982 |
$10,049 |
02/17 |
$9,991 |
$10,049 |
$10,066 |
03/17 |
$9,990 |
$10,044 |
$10,071 |
04/17 |
$10,010 |
$10,122 |
$10,090 |
05/17 |
$10,030 |
$10,199 |
$10,106 |
06/17 |
$10,021 |
$10,189 |
$10,102 |
07/17 |
$10,052 |
$10,233 |
$10,128 |
08/17 |
$10,063 |
$10,325 |
$10,149 |
09/17 |
$10,054 |
$10,276 |
$10,136 |
10/17 |
$10,054 |
$10,282 |
$10,134 |
11/17 |
$10,034 |
$10,268 |
$10,112 |
12/17 |
$10,033 |
$10,316 |
$10,115 |
01/18 |
$10,011 |
$10,197 |
$10,088 |
02/18 |
$9,998 |
$10,100 |
$10,079 |
03/18 |
$10,005 |
$10,165 |
$10,095 |
04/18 |
$10,002 |
$10,089 |
$10,084 |
05/18 |
$10,030 |
$10,161 |
$10,122 |
06/18 |
$10,028 |
$10,149 |
$10,123 |
07/18 |
$10,027 |
$10,151 |
$10,129 |
08/18 |
$10,067 |
$10,216 |
$10,164 |
09/18 |
$10,048 |
$10,151 |
$10,157 |
10/18 |
$10,051 |
$10,070 |
$10,168 |
11/18 |
$10,034 |
$10,131 |
$10,197 |
12/18 |
$10,080 |
$10,317 |
$10,277 |
01/19 |
$10,149 |
$10,426 |
$10,317 |
02/19 |
$10,178 |
$10,420 |
$10,333 |
03/19 |
$10,261 |
$10,620 |
$10,401 |
04/19 |
$10,295 |
$10,623 |
$10,425 |
05/19 |
$10,368 |
$10,812 |
$10,497 |
06/19 |
$10,432 |
$10,947 |
$10,555 |
07/19 |
$10,435 |
$10,971 |
$10,549 |
08/19 |
$10,511 |
$11,256 |
$10,634 |
09/19 |
$10,501 |
$11,196 |
$10,628 |
10/19 |
$10,532 |
$11,230 |
$10,665 |
11/19 |
$10,539 |
$11,224 |
$10,665 |
12/19 |
$10,566 |
$11,216 |
$10,691 |
01/20 |
$10,644 |
$11,432 |
$10,750 |
02/20 |
$10,700 |
$11,638 |
$10,838 |
03/20 |
$9,960 |
$11,569 |
$10,871 |
04/20 |
$10,237 |
$11,775 |
$10,940 |
05/20 |
$10,428 |
$11,830 |
$10,977 |
06/20 |
$10,597 |
$11,904 |
$10,999 |
07/20 |
$10,701 |
$12,082 |
$11,019 |
08/20 |
$10,770 |
$11,984 |
$11,023 |
09/20 |
$10,785 |
$11,978 |
$11,024 |
10/20 |
$10,799 |
$11,924 |
$11,026 |
11/20 |
$10,866 |
$12,041 |
$11,037 |
12/20 |
$10,910 |
$12,058 |
$11,047 |
01/21 |
$10,944 |
$11,971 |
$11,051 |
02/21 |
$10,944 |
$11,799 |
$11,048 |
03/21 |
$10,933 |
$11,651 |
$11,043 |
04/21 |
$10,965 |
$11,743 |
$11,051 |
05/21 |
$10,986 |
$11,782 |
$11,064 |
06/21 |
$10,986 |
$11,864 |
$11,047 |
07/21 |
$11,009 |
$11,997 |
$11,066 |
08/21 |
$11,011 |
$11,974 |
$11,066 |
09/21 |
$11,002 |
$11,871 |
$11,057 |
10/21 |
$10,972 |
$11,867 |
$11,021 |
11/21 |
$10,951 |
$11,902 |
$11,012 |
12/21 |
$10,962 |
$11,872 |
$10,995 |
01/22 |
$10,875 |
$11,616 |
$10,916 |
02/22 |
$10,809 |
$11,487 |
$10,869 |
03/22 |
$10,679 |
$11,168 |
$10,721 |
04/22 |
$10,592 |
$10,744 |
$10,664 |
05/22 |
$10,604 |
$10,813 |
$10,729 |
06/22 |
$10,453 |
$10,643 |
$10,654 |
07/22 |
$10,546 |
$10,903 |
$10,710 |
08/22 |
$10,498 |
$10,595 |
$10,626 |
09/22 |
$10,342 |
$10,138 |
$10,496 |
10/22 |
$10,276 |
$10,006 |
$10,483 |
11/22 |
$10,381 |
$10,374 |
$10,570 |
12/22 |
$10,422 |
$10,327 |
$10,590 |
01/23 |
$10,610 |
$10,645 |
$10,675 |
02/23 |
$10,544 |
$10,370 |
$10,595 |
03/23 |
$10,645 |
$10,633 |
$10,750 |
04/23 |
$10,703 |
$10,698 |
$10,786 |
05/23 |
$10,681 |
$10,581 |
$10,753 |
06/23 |
$10,673 |
$10,544 |
$10,710 |
07/23 |
$10,732 |
$10,536 |
$10,755 |
08/23 |
$10,789 |
$10,469 |
$10,793 |
09/23 |
$10,777 |
$10,203 |
$10,788 |
10/23 |
$10,776 |
$10,042 |
$10,821 |
11/23 |
$10,971 |
$10,497 |
$10,947 |
12/23 |
$11,155 |
$10,898 |
$11,078 |
01/24 |
$11,225 |
$10,868 |
$11,121 |
02/24 |
$11,215 |
$10,715 |
$11,081 |
03/24 |
$11,276 |
$10,814 |
$11,125 |
04/24 |
$11,257 |
$10,541 |
$11,088 |
05/24 |
$11,355 |
$10,719 |
$11,168 |
06/24 |
$11,432 |
$10,821 |
$11,231 |
07/24 |
$11,569 |
$11,074 |
$11,364 |
08/24 |
$11,672 |
$11,233 |
$11,467 |
09/24 |
$11,777 |
$11,383 |
$11,563 |
10/24 |
$11,727 |
$11,101 |
$11,497 |
11/24 |
$11,784 |
$11,218 |
$11,536 |
12/24 |
$11,818 |
$11,035 |
$11,561 |
01/25 |
$11,888 |
$11,093 |
$11,613 |
02/25 |
$11,958 |
$11,337 |
$11,695 |
03/25 |
$11,979 |
$11,342 |
$11,749 |
04/25 |
$12,037 |
$11,386 |
$11,838 |
05/25 |
$12,069 |
$11,305 |
$11,822 |
06/25 |
$12,176 |
$11,478 |
$11,898 |
07/25 |
$12,185 |
$11,448 |
$11,895 |
08/25 |
$12,293 |
$11,585 |
$12,000 |
09/25 |
$12,351 |
$11,711 |
$12,040 |
10/25 |
$12,385 |
$11,785 |
$12,080 |
11/25 |
$12,429 |
$11,858 |
$12,137 |
12/25 |
$12,487 |
$11,840 |
$12,179 |
01/26 |
$12,531 |
$11,853 |
$12,207 |
02/26 |
$12,587 |
$12,047 |
$12,270 |
03/26 |
$12,527 |
$11,835 |
$12,213 |
|
| Average Annual Return [Table Text Block] |
Table Summary
Average Annual Total Returns (%) |
1 year |
5 years |
10 years |
Class A (excluding sales charges) |
4.58 |
2.76 |
2.38 |
Class A (including sales charges) |
3.52 |
2.56 |
2.28 |
Bloomberg U.S. Aggregate Bond Index |
4.35 |
0.31 |
1.70 |
Bloomberg 1-3 Year Government/Credit Index |
3.96 |
2.04 |
2.02 | |
| No Deduction of Taxes [Text Block] |
Performance does not reflect the deduction of taxes that a shareholder may pay on fund distributions or on the redemptions of fund shares.
|
| Updated Performance Information Location [Text Block] |
columbiathreadneedleus.com/investment-products/mutual-funds
|
| AssetsNet |
$ 1,665,882,158
|
| Holdings Count | Holding |
601
|
| Advisory Fees Paid, Amount |
$ 6,737,672
|
| InvestmentCompanyPortfolioTurnover |
76.00%
|
| Additional Fund Statistics [Text Block] |
Table Summary
Fund net assets |
$1,665,882,158 |
Total number of portfolio holdings |
601 |
Management services fees (represents 0.42% of Fund average net assets) |
$6,737,672 |
Portfolio turnover for the reporting period |
76% | |
| Holdings [Text Block] |
Table Summary
Corporate Bonds & Notes |
34.0% |
Residential Mortgage-Backed Securities - Non-Agency |
28.6% |
Asset-Backed Securities - Non-Agency |
20.7% |
Commercial Mortgage-Backed Securities - Non-Agency |
12.7% |
Residential Mortgage-Backed Securities - Agency |
2.1% |
Money Market Funds |
1.6% |
Other |
1.0% | |
| Largest Holdings [Text Block] |
Table Summary
Vista Point Securitization Trust, Series 2025-CES2, Class A1 5.601% 08/25/2055 |
1.6% |
Extended Stay America Trust, Series 2025-ESH, Class A 4.973% 10/15/2042 |
1.1% |
Morgan Stanley Residential Mortgage Loan Trust, Series 2025-NQM1, Class A1 5.738% 11/25/2069 |
1.1% |
U.S Treasury Bills 3.700% 04/23/2026 |
1.0% |
Affirm Master Trust, Series 2025-1A, Class A 4.990% 02/15/2033 |
1.0% |
Aimco CLO Ltd., Series 2020-11A, Class A1R2 5.008% 07/17/2037 |
1.0% |
Progress Residential Trust, Series 2022-SFR6, Class A 4.451% 07/20/2039 |
0.9% |
Magnetite XXXVI Ltd., Series 2025-36A, Class AR 4.988% 07/25/2038 |
0.9% |
Elmwood CLO Ltd., Series 2025-3A, Class A 4.908% 03/22/2038 |
0.9% |
Wells Fargo Commercial Mortgage Trust, Series 2017-SMP, Class A 4.595% 12/15/2034 |
0.9% | |
| Material Fund Change [Text Block] |
|
| C000029790 |
|
| Shareholder Report [Line Items] |
|
| Fund Name |
Columbia Short Term Bond Fund
|
| Class Name |
Class C
|
| Trading Symbol |
NSTIX
|
| Annual or Semi-Annual Statement [Text Block] |
This annual shareholder report contains important information about Columbia Short Term Bond Fund (the Fund) for the period of April 1, 2025 to March 31, 2026.
|
| Additional Information [Text Block] |
You can find additional information about the Fund at columbiathreadneedleus.com/resources/literature. You can also request more information by contacting us at 1-800-345-6611.
|
| Additional Information Phone Number |
1-800-345-6611
|
| Additional Information Website |
columbiathreadneedleus.com/resources/literature
|
| Expenses [Text Block] |
What were the Fund costs for the reporting period? (Based on a hypothetical $10,000 investment)
Table Summary
Class |
Cost of a $10,000 investment |
Cost paid as a percentage of a $10,000 investment |
Class C |
$128 |
1.25% | |
| Expenses Paid, Amount |
$ 128
|
| Expense Ratio, Percent |
1.25%
|
| Factors Affecting Performance [Text Block] |
Management's Discussion of Fund Performance The performance of Class C shares for the period presented is shown in the Average Annual Total Returns table. Top Performance ContributorsAllocations | The Fund benefited most on a relative basis from having exposure to residential mortgage-backed securities, investment-grade corporates, asset-backed securities and commercial mortgage-backed securities. Structured asset sectors are all out-of-benchmark sectors, which contributed to the Fund’s relative performance during the annual period. High-yield corporates also contributed to the Fund’s relative performance as an out-of-benchmark allocation. Security selection | Security selection within the investment-grade corporate bond sector was additive to the Fund’s performance. Selection within the industrials and financials sub-sectors also contributed to the Fund’s relative performance. Top Performance DetractorsAllocations | An underweight allocation to the investment-grade corporate bond sector detracted modestly from the Fund’s relative performance, as the sector outperformed the benchmark during the annual period. Investment-grade corporate bonds represented the Fund’s largest sector underweight, excluding U.S. Treasuries. Duration and curve positioning | The combination of duration and yield curve positioning had a negative impact on the Fund’s relative performance during the annual period. The U.S. Federal Reserve continued easing monetary policy during the period with three 25 basis point cuts resulting in a flattening of the yield curve. However, market volatility and the conflict in Iran have the Fed cautious on future reductions in the fed funds target rate in 2026 due to economic uncertainty and the long-term impact of a potential prolonged war. |
| Performance Past Does Not Indicate Future [Text] |
The Fund's past performance is not a good predictor of the Fund's future performance.
|
| Line Graph [Table Text Block] |
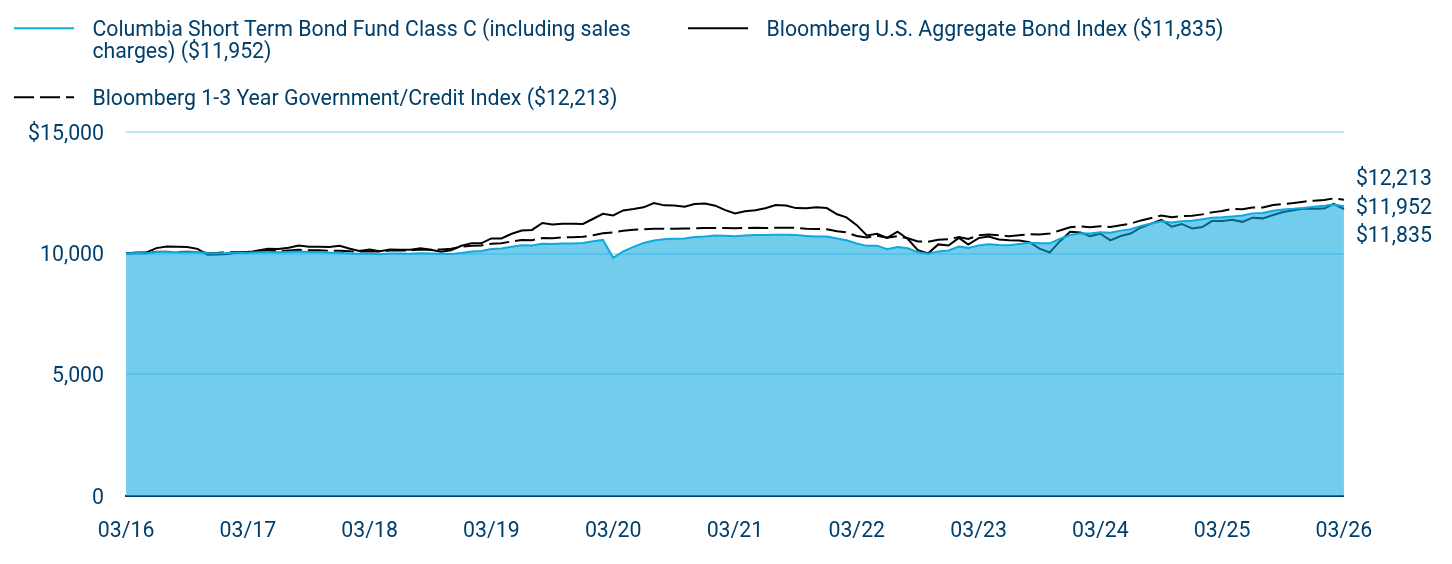
Table Summary
|
Columbia Short Term Bond Fund Class C (including sales charges) ($11,952) |
Bloomberg U.S. Aggregate Bond Index ($11,835) |
Bloomberg 1-3 Year Government/Credit Index ($12,213) |
03/16 |
$10,000 |
$10,000 |
$10,000 |
04/16 |
$10,020 |
$10,038 |
$10,014 |
05/16 |
$10,010 |
$10,041 |
$10,007 |
06/16 |
$10,061 |
$10,221 |
$10,067 |
07/16 |
$10,062 |
$10,286 |
$10,069 |
08/16 |
$10,053 |
$10,274 |
$10,058 |
09/16 |
$10,055 |
$10,268 |
$10,069 |
10/16 |
$10,057 |
$10,190 |
$10,066 |
11/16 |
$10,009 |
$9,949 |
$10,024 |
12/16 |
$10,012 |
$9,963 |
$10,030 |
01/17 |
$10,025 |
$9,982 |
$10,049 |
02/17 |
$10,039 |
$10,049 |
$10,066 |
03/17 |
$10,033 |
$10,044 |
$10,071 |
04/17 |
$10,047 |
$10,122 |
$10,090 |
05/17 |
$10,062 |
$10,199 |
$10,106 |
06/17 |
$10,048 |
$10,189 |
$10,102 |
07/17 |
$10,064 |
$10,233 |
$10,128 |
08/17 |
$10,080 |
$10,325 |
$10,149 |
09/17 |
$10,066 |
$10,276 |
$10,136 |
10/17 |
$10,062 |
$10,282 |
$10,134 |
11/17 |
$10,037 |
$10,268 |
$10,112 |
12/17 |
$10,030 |
$10,316 |
$10,115 |
01/18 |
$10,003 |
$10,197 |
$10,088 |
02/18 |
$9,986 |
$10,100 |
$10,079 |
03/18 |
$9,988 |
$10,165 |
$10,095 |
04/18 |
$9,969 |
$10,089 |
$10,084 |
05/18 |
$10,002 |
$10,161 |
$10,122 |
06/18 |
$9,995 |
$10,149 |
$10,123 |
07/18 |
$9,989 |
$10,151 |
$10,129 |
08/18 |
$10,014 |
$10,216 |
$10,164 |
09/18 |
$10,000 |
$10,151 |
$10,157 |
10/18 |
$9,987 |
$10,070 |
$10,168 |
11/18 |
$9,976 |
$10,131 |
$10,197 |
12/18 |
$10,017 |
$10,317 |
$10,277 |
01/19 |
$10,080 |
$10,426 |
$10,317 |
02/19 |
$10,104 |
$10,420 |
$10,333 |
03/19 |
$10,181 |
$10,620 |
$10,401 |
04/19 |
$10,210 |
$10,623 |
$10,425 |
05/19 |
$10,277 |
$10,812 |
$10,497 |
06/19 |
$10,336 |
$10,947 |
$10,555 |
07/19 |
$10,333 |
$10,971 |
$10,549 |
08/19 |
$10,403 |
$11,256 |
$10,634 |
09/19 |
$10,389 |
$11,196 |
$10,628 |
10/19 |
$10,414 |
$11,230 |
$10,665 |
11/19 |
$10,416 |
$11,224 |
$10,665 |
12/19 |
$10,437 |
$11,216 |
$10,691 |
01/20 |
$10,509 |
$11,432 |
$10,750 |
02/20 |
$10,559 |
$11,638 |
$10,838 |
03/20 |
$9,822 |
$11,569 |
$10,871 |
04/20 |
$10,091 |
$11,775 |
$10,940 |
05/20 |
$10,275 |
$11,830 |
$10,977 |
06/20 |
$10,436 |
$11,904 |
$10,999 |
07/20 |
$10,533 |
$12,082 |
$11,019 |
08/20 |
$10,585 |
$11,984 |
$11,023 |
09/20 |
$10,606 |
$11,978 |
$11,024 |
10/20 |
$10,615 |
$11,924 |
$11,026 |
11/20 |
$10,676 |
$12,041 |
$11,037 |
12/20 |
$10,704 |
$12,058 |
$11,047 |
01/21 |
$10,743 |
$11,971 |
$11,051 |
02/21 |
$10,728 |
$11,799 |
$11,048 |
03/21 |
$10,712 |
$11,651 |
$11,043 |
04/21 |
$10,738 |
$11,743 |
$11,051 |
05/21 |
$10,765 |
$11,782 |
$11,064 |
06/21 |
$10,760 |
$11,864 |
$11,047 |
07/21 |
$10,777 |
$11,997 |
$11,066 |
08/21 |
$10,774 |
$11,974 |
$11,066 |
09/21 |
$10,760 |
$11,871 |
$11,057 |
10/21 |
$10,726 |
$11,867 |
$11,021 |
11/21 |
$10,701 |
$11,902 |
$11,012 |
12/21 |
$10,696 |
$11,872 |
$10,995 |
01/22 |
$10,616 |
$11,616 |
$10,916 |
02/22 |
$10,547 |
$11,487 |
$10,869 |
03/22 |
$10,415 |
$11,168 |
$10,721 |
04/22 |
$10,315 |
$10,744 |
$10,664 |
05/22 |
$10,322 |
$10,813 |
$10,729 |
06/22 |
$10,180 |
$10,643 |
$10,654 |
07/22 |
$10,266 |
$10,903 |
$10,710 |
08/22 |
$10,214 |
$10,595 |
$10,626 |
09/22 |
$10,047 |
$10,138 |
$10,496 |
10/22 |
$9,989 |
$10,006 |
$10,483 |
11/22 |
$10,086 |
$10,374 |
$10,570 |
12/22 |
$10,121 |
$10,327 |
$10,590 |
01/23 |
$10,289 |
$10,645 |
$10,675 |
02/23 |
$10,232 |
$10,370 |
$10,595 |
03/23 |
$10,325 |
$10,633 |
$10,750 |
04/23 |
$10,376 |
$10,698 |
$10,786 |
05/23 |
$10,350 |
$10,581 |
$10,753 |
06/23 |
$10,338 |
$10,544 |
$10,710 |
07/23 |
$10,389 |
$10,536 |
$10,755 |
08/23 |
$10,440 |
$10,469 |
$10,793 |
09/23 |
$10,424 |
$10,203 |
$10,788 |
10/23 |
$10,418 |
$10,042 |
$10,821 |
11/23 |
$10,602 |
$10,497 |
$10,947 |
12/23 |
$10,764 |
$10,898 |
$11,078 |
01/24 |
$10,838 |
$10,868 |
$11,121 |
02/24 |
$10,823 |
$10,715 |
$11,081 |
03/24 |
$10,877 |
$10,814 |
$11,125 |
04/24 |
$10,853 |
$10,541 |
$11,088 |
05/24 |
$10,943 |
$10,719 |
$11,168 |
06/24 |
$11,001 |
$10,821 |
$11,231 |
07/24 |
$11,139 |
$11,074 |
$11,364 |
08/24 |
$11,233 |
$11,233 |
$11,467 |
09/24 |
$11,329 |
$11,383 |
$11,563 |
10/24 |
$11,275 |
$11,101 |
$11,497 |
11/24 |
$11,326 |
$11,218 |
$11,536 |
12/24 |
$11,353 |
$11,035 |
$11,561 |
01/25 |
$11,415 |
$11,093 |
$11,613 |
02/25 |
$11,477 |
$11,337 |
$11,695 |
03/25 |
$11,491 |
$11,342 |
$11,749 |
04/25 |
$11,530 |
$11,386 |
$11,838 |
05/25 |
$11,568 |
$11,305 |
$11,822 |
06/25 |
$11,654 |
$11,478 |
$11,898 |
07/25 |
$11,668 |
$11,448 |
$11,895 |
08/25 |
$11,766 |
$11,585 |
$12,000 |
09/25 |
$11,817 |
$11,711 |
$12,040 |
10/25 |
$11,843 |
$11,785 |
$12,080 |
11/25 |
$11,880 |
$11,858 |
$12,137 |
12/25 |
$11,930 |
$11,840 |
$12,179 |
01/26 |
$11,967 |
$11,853 |
$12,207 |
02/26 |
$12,015 |
$12,047 |
$12,270 |
03/26 |
$11,952 |
$11,835 |
$12,213 |
|
| Average Annual Return [Table Text Block] |
Table Summary
Average Annual Total Returns (%) |
1 year |
5 years |
10 years |
Class C (excluding sales charges) |
4.01 |
2.21 |
1.80 |
Class C (including sales charges) |
3.01 |
2.21 |
1.80 |
Bloomberg U.S. Aggregate Bond Index |
4.35 |
0.31 |
1.70 |
Bloomberg 1-3 Year Government/Credit Index |
3.96 |
2.04 |
2.02 | |
| No Deduction of Taxes [Text Block] |
Performance does not reflect the deduction of taxes that a shareholder may pay on fund distributions or on the redemptions of fund shares.
|
| Updated Performance Information Location [Text Block] |
columbiathreadneedleus.com/investment-products/mutual-funds
|
| AssetsNet |
$ 1,665,882,158
|
| Holdings Count | Holding |
601
|
| Advisory Fees Paid, Amount |
$ 6,737,672
|
| InvestmentCompanyPortfolioTurnover |
76.00%
|
| Additional Fund Statistics [Text Block] |
Table Summary
Fund net assets |
$1,665,882,158 |
Total number of portfolio holdings |
601 |
Management services fees (represents 0.42% of Fund average net assets) |
$6,737,672 |
Portfolio turnover for the reporting period |
76% | |
| Holdings [Text Block] |
Table Summary
Corporate Bonds & Notes |
34.0% |
Residential Mortgage-Backed Securities - Non-Agency |
28.6% |
Asset-Backed Securities - Non-Agency |
20.7% |
Commercial Mortgage-Backed Securities - Non-Agency |
12.7% |
Residential Mortgage-Backed Securities - Agency |
2.1% |
Money Market Funds |
1.6% |
Other |
1.0% | |
| Largest Holdings [Text Block] |
Table Summary
Vista Point Securitization Trust, Series 2025-CES2, Class A1 5.601% 08/25/2055 |
1.6% |
Extended Stay America Trust, Series 2025-ESH, Class A 4.973% 10/15/2042 |
1.1% |
Morgan Stanley Residential Mortgage Loan Trust, Series 2025-NQM1, Class A1 5.738% 11/25/2069 |
1.1% |
U.S Treasury Bills 3.700% 04/23/2026 |
1.0% |
Affirm Master Trust, Series 2025-1A, Class A 4.990% 02/15/2033 |
1.0% |
Aimco CLO Ltd., Series 2020-11A, Class A1R2 5.008% 07/17/2037 |
1.0% |
Progress Residential Trust, Series 2022-SFR6, Class A 4.451% 07/20/2039 |
0.9% |
Magnetite XXXVI Ltd., Series 2025-36A, Class AR 4.988% 07/25/2038 |
0.9% |
Elmwood CLO Ltd., Series 2025-3A, Class A 4.908% 03/22/2038 |
0.9% |
Wells Fargo Commercial Mortgage Trust, Series 2017-SMP, Class A 4.595% 12/15/2034 |
0.9% | |
| Material Fund Change [Text Block] |
|
| C000254316 |
|
| Shareholder Report [Line Items] |
|
| Fund Name |
Columbia Short Term Bond Fund
|
| Class Name |
Class S
|
| Trading Symbol |
NSTDX
|
| Annual or Semi-Annual Statement [Text Block] |
This annual shareholder report contains important information about Columbia Short Term Bond Fund (the Fund) for the period of April 1, 2025 to March 31, 2026.
|
| Additional Information [Text Block] |
You can find additional information about the Fund at columbiathreadneedleus.com/resources/literature. You can also request more information by contacting us at 1-800-345-6611.
|
| Additional Information Phone Number |
1-800-345-6611
|
| Additional Information Website |
columbiathreadneedleus.com/resources/literature
|
| Expenses [Text Block] |
What were the Fund costs for the reporting period? (Based on a hypothetical $10,000 investment)
Table Summary
Class |
Cost of a $10,000 investment |
Cost paid as a percentage of a $10,000 investment |
Class S |
$45 |
0.44% | |
| Expenses Paid, Amount |
$ 45
|
| Expense Ratio, Percent |
0.44%
|
| Factors Affecting Performance [Text Block] |
Management's Discussion of Fund Performance The performance of Class S shares for the period presented is shown in the Average Annual Total Returns table. Top Performance ContributorsAllocations | The Fund benefited most on a relative basis from having exposure to residential mortgage-backed securities, investment-grade corporates, asset-backed securities and commercial mortgage-backed securities. Structured asset sectors are all out-of-benchmark sectors, which contributed to the Fund’s relative performance during the annual period. High-yield corporates also contributed to the Fund’s relative performance as an out-of-benchmark allocation. Security selection | Security selection within the investment-grade corporate bond sector was additive to the Fund’s performance. Selection within the industrials and financials sub-sectors also contributed to the Fund’s relative performance. Top Performance DetractorsAllocations | An underweight allocation to the investment-grade corporate bond sector detracted modestly from the Fund’s relative performance, as the sector outperformed the benchmark during the annual period. Investment-grade corporate bonds represented the Fund’s largest sector underweight, excluding U.S. Treasuries. Duration and curve positioning | The combination of duration and yield curve positioning had a negative impact on the Fund’s relative performance during the annual period. The U.S. Federal Reserve continued easing monetary policy during the period with three 25 basis point cuts resulting in a flattening of the yield curve. However, market volatility and the conflict in Iran have the Fed cautious on future reductions in the fed funds target rate in 2026 due to economic uncertainty and the long-term impact of a potential prolonged war. |
| Performance Past Does Not Indicate Future [Text] |
The Fund's past performance is not a good predictor of the Fund's future performance.
|
| Line Graph [Table Text Block] |
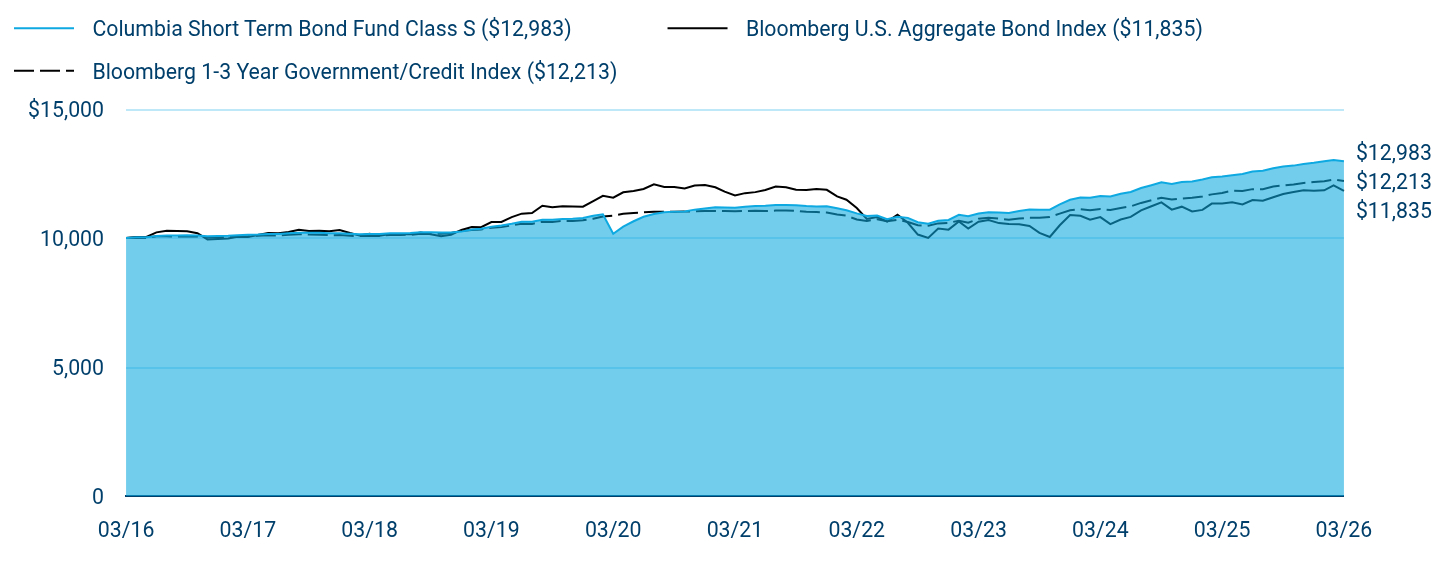
Table Summary
|
Columbia Short Term Bond Fund Class S ($12,983) |
Bloomberg U.S. Aggregate Bond Index ($11,835) |
Bloomberg 1-3 Year Government/Credit Index ($12,213) |
03/16 |
$10,000 |
$10,000 |
$10,000 |
04/16 |
$10,035 |
$10,038 |
$10,014 |
05/16 |
$10,032 |
$10,041 |
$10,007 |
06/16 |
$10,080 |
$10,221 |
$10,067 |
07/16 |
$10,098 |
$10,286 |
$10,069 |
08/16 |
$10,097 |
$10,274 |
$10,058 |
09/16 |
$10,106 |
$10,268 |
$10,069 |
10/16 |
$10,105 |
$10,190 |
$10,066 |
11/16 |
$10,074 |
$9,949 |
$10,024 |
12/16 |
$10,084 |
$9,963 |
$10,030 |
01/17 |
$10,094 |
$9,982 |
$10,049 |
02/17 |
$10,114 |
$10,049 |
$10,066 |
03/17 |
$10,126 |
$10,044 |
$10,071 |
04/17 |
$10,138 |
$10,122 |
$10,090 |
05/17 |
$10,160 |
$10,199 |
$10,106 |
06/17 |
$10,163 |
$10,189 |
$10,102 |
07/17 |
$10,187 |
$10,233 |
$10,128 |
08/17 |
$10,210 |
$10,325 |
$10,149 |
09/17 |
$10,203 |
$10,276 |
$10,136 |
10/17 |
$10,205 |
$10,282 |
$10,134 |
11/17 |
$10,187 |
$10,268 |
$10,112 |
12/17 |
$10,188 |
$10,316 |
$10,115 |
01/18 |
$10,168 |
$10,197 |
$10,088 |
02/18 |
$10,146 |
$10,100 |
$10,079 |
03/18 |
$10,156 |
$10,165 |
$10,095 |
04/18 |
$10,154 |
$10,089 |
$10,084 |
05/18 |
$10,185 |
$10,161 |
$10,122 |
06/18 |
$10,185 |
$10,149 |
$10,123 |
07/18 |
$10,196 |
$10,151 |
$10,129 |
08/18 |
$10,229 |
$10,216 |
$10,164 |
09/18 |
$10,222 |
$10,151 |
$10,157 |
10/18 |
$10,217 |
$10,070 |
$10,168 |
11/18 |
$10,212 |
$10,131 |
$10,197 |
12/18 |
$10,251 |
$10,317 |
$10,277 |
01/19 |
$10,333 |
$10,426 |
$10,317 |
02/19 |
$10,365 |
$10,420 |
$10,333 |
03/19 |
$10,441 |
$10,620 |
$10,401 |
04/19 |
$10,489 |
$10,623 |
$10,425 |
05/19 |
$10,555 |
$10,812 |
$10,497 |
06/19 |
$10,632 |
$10,947 |
$10,555 |
07/19 |
$10,638 |
$10,971 |
$10,549 |
08/19 |
$10,707 |
$11,256 |
$10,634 |
09/19 |
$10,710 |
$11,196 |
$10,628 |
10/19 |
$10,744 |
$11,230 |
$10,665 |
11/19 |
$10,753 |
$11,224 |
$10,665 |
12/19 |
$10,783 |
$11,216 |
$10,691 |
01/20 |
$10,865 |
$11,432 |
$10,750 |
02/20 |
$10,924 |
$11,638 |
$10,838 |
03/20 |
$10,170 |
$11,569 |
$10,871 |
04/20 |
$10,444 |
$11,775 |
$10,940 |
05/20 |
$10,653 |
$11,830 |
$10,977 |
06/20 |
$10,828 |
$11,904 |
$10,999 |
07/20 |
$10,936 |
$12,082 |
$11,019 |
08/20 |
$10,998 |
$11,984 |
$11,023 |
09/20 |
$11,026 |
$11,978 |
$11,024 |
10/20 |
$11,032 |
$11,924 |
$11,026 |
11/20 |
$11,103 |
$12,041 |
$11,037 |
12/20 |
$11,151 |
$12,058 |
$11,047 |
01/21 |
$11,199 |
$11,971 |
$11,051 |
02/21 |
$11,190 |
$11,799 |
$11,048 |
03/21 |
$11,181 |
$11,651 |
$11,043 |
04/21 |
$11,216 |
$11,743 |
$11,051 |
05/21 |
$11,241 |
$11,782 |
$11,064 |
06/21 |
$11,254 |
$11,864 |
$11,047 |
07/21 |
$11,279 |
$11,997 |
$11,066 |
08/21 |
$11,283 |
$11,974 |
$11,066 |
09/21 |
$11,277 |
$11,871 |
$11,057 |
10/21 |
$11,248 |
$11,867 |
$11,021 |
11/21 |
$11,229 |
$11,902 |
$11,012 |
12/21 |
$11,232 |
$11,872 |
$10,995 |
01/22 |
$11,156 |
$11,616 |
$10,916 |
02/22 |
$11,079 |
$11,487 |
$10,869 |
03/22 |
$10,959 |
$11,168 |
$10,721 |
04/22 |
$10,861 |
$10,744 |
$10,664 |
05/22 |
$10,876 |
$10,813 |
$10,729 |
06/22 |
$10,734 |
$10,643 |
$10,654 |
07/22 |
$10,831 |
$10,903 |
$10,710 |
08/22 |
$10,784 |
$10,595 |
$10,626 |
09/22 |
$10,614 |
$10,138 |
$10,496 |
10/22 |
$10,561 |
$10,006 |
$10,483 |
11/22 |
$10,670 |
$10,374 |
$10,570 |
12/22 |
$10,703 |
$10,327 |
$10,590 |
01/23 |
$10,900 |
$10,645 |
$10,675 |
02/23 |
$10,845 |
$10,370 |
$10,595 |
03/23 |
$10,952 |
$10,633 |
$10,750 |
04/23 |
$11,001 |
$10,698 |
$10,786 |
05/23 |
$10,993 |
$10,581 |
$10,753 |
06/23 |
$10,976 |
$10,544 |
$10,710 |
07/23 |
$11,050 |
$10,536 |
$10,755 |
08/23 |
$11,111 |
$10,469 |
$10,793 |
09/23 |
$11,101 |
$10,203 |
$10,788 |
10/23 |
$11,102 |
$10,042 |
$10,821 |
11/23 |
$11,306 |
$10,497 |
$10,947 |
12/23 |
$11,486 |
$10,898 |
$11,078 |
01/24 |
$11,573 |
$10,868 |
$11,121 |
02/24 |
$11,565 |
$10,715 |
$11,081 |
03/24 |
$11,630 |
$10,814 |
$11,125 |
04/24 |
$11,612 |
$10,541 |
$11,088 |
05/24 |
$11,716 |
$10,719 |
$11,168 |
06/24 |
$11,785 |
$10,821 |
$11,231 |
07/24 |
$11,942 |
$11,074 |
$11,364 |
08/24 |
$12,051 |
$11,233 |
$11,467 |
09/24 |
$12,162 |
$11,383 |
$11,563 |
10/24 |
$12,099 |
$11,101 |
$11,497 |
11/24 |
$12,173 |
$11,218 |
$11,536 |
12/24 |
$12,198 |
$11,035 |
$11,561 |
01/25 |
$12,273 |
$11,093 |
$11,613 |
02/25 |
$12,360 |
$11,337 |
$11,695 |
03/25 |
$12,384 |
$11,342 |
$11,749 |
04/25 |
$12,434 |
$11,386 |
$11,838 |
05/25 |
$12,483 |
$11,305 |
$11,822 |
06/25 |
$12,584 |
$11,478 |
$11,898 |
07/25 |
$12,608 |
$11,448 |
$11,895 |
08/25 |
$12,709 |
$11,585 |
$12,000 |
09/25 |
$12,773 |
$11,711 |
$12,040 |
10/25 |
$12,810 |
$11,785 |
$12,080 |
11/25 |
$12,871 |
$11,858 |
$12,137 |
12/25 |
$12,921 |
$11,840 |
$12,179 |
01/26 |
$12,983 |
$11,853 |
$12,207 |
02/26 |
$13,030 |
$12,047 |
$12,270 |
03/26 |
$12,983 |
$11,835 |
$12,213 |
|
| Average Annual Return [Table Text Block] |
Table Summary
Average Annual Total Returns (%) |
1 year |
5 years |
10 years |
Class SFootnote Reference(a) |
4.84 |
3.03 |
2.64 |
Bloomberg U.S. Aggregate Bond Index |
4.35 |
0.31 |
1.70 |
Bloomberg 1-3 Year Government/Credit Index |
3.96 |
2.04 |
2.02 | |
| No Deduction of Taxes [Text Block] |
Performance does not reflect the deduction of taxes that a shareholder may pay on fund distributions or on the redemptions of fund shares.
|
| Updated Performance Information Location [Text Block] |
columbiathreadneedleus.com/investment-products/mutual-funds
|
| AssetsNet |
$ 1,665,882,158
|
| Holdings Count | Holding |
601
|
| Advisory Fees Paid, Amount |
$ 6,737,672
|
| InvestmentCompanyPortfolioTurnover |
76.00%
|
| Additional Fund Statistics [Text Block] |
Table Summary
Fund net assets |
$1,665,882,158 |
Total number of portfolio holdings |
601 |
Management services fees (represents 0.42% of Fund average net assets) |
$6,737,672 |
Portfolio turnover for the reporting period |
76% | |
| Holdings [Text Block] |
Table Summary
Corporate Bonds & Notes |
34.0% |
Residential Mortgage-Backed Securities - Non-Agency |
28.6% |
Asset-Backed Securities - Non-Agency |
20.7% |
Commercial Mortgage-Backed Securities - Non-Agency |
12.7% |
Residential Mortgage-Backed Securities - Agency |
2.1% |
Money Market Funds |
1.6% |
Other |
1.0% | |
| Largest Holdings [Text Block] |
Table Summary
Vista Point Securitization Trust, Series 2025-CES2, Class A1 5.601% 08/25/2055 |
1.6% |
Extended Stay America Trust, Series 2025-ESH, Class A 4.973% 10/15/2042 |
1.1% |
Morgan Stanley Residential Mortgage Loan Trust, Series 2025-NQM1, Class A1 5.738% 11/25/2069 |
1.1% |
U.S Treasury Bills 3.700% 04/23/2026 |
1.0% |
Affirm Master Trust, Series 2025-1A, Class A 4.990% 02/15/2033 |
1.0% |
Aimco CLO Ltd., Series 2020-11A, Class A1R2 5.008% 07/17/2037 |
1.0% |
Progress Residential Trust, Series 2022-SFR6, Class A 4.451% 07/20/2039 |
0.9% |
Magnetite XXXVI Ltd., Series 2025-36A, Class AR 4.988% 07/25/2038 |
0.9% |
Elmwood CLO Ltd., Series 2025-3A, Class A 4.908% 03/22/2038 |
0.9% |
Wells Fargo Commercial Mortgage Trust, Series 2017-SMP, Class A 4.595% 12/15/2034 |
0.9% | |
| Material Fund Change [Text Block] |
|
| C000122569 |
|
| Shareholder Report [Line Items] |
|
| Fund Name |
Columbia Short Term Bond Fund
|
| Class Name |
Institutional 2 Class
|
| Trading Symbol |
CCBRX
|
| Annual or Semi-Annual Statement [Text Block] |
This annual shareholder report contains important information about Columbia Short Term Bond Fund (the Fund) for the period of April 1, 2025 to March 31, 2026.
|
| Additional Information [Text Block] |
You can find additional information about the Fund at columbiathreadneedleus.com/resources/literature. You can also request more information by contacting us at 1-800-345-6611.
|
| Additional Information Phone Number |
1-800-345-6611
|
| Additional Information Website |
columbiathreadneedleus.com/resources/literature
|
| Expenses [Text Block] |
What were the Fund costs for the reporting period? (Based on a hypothetical $10,000 investment)
Table Summary
Class |
Cost of a $10,000 investment |
Cost paid as a percentage of a $10,000 investment |
Institutional 2 Class |
$38 |
0.37% | |
| Expenses Paid, Amount |
$ 38
|
| Expense Ratio, Percent |
0.37%
|
| Factors Affecting Performance [Text Block] |
Management's Discussion of Fund Performance The performance of Institutional 2 Class shares for the period presented is shown in the Average Annual Total Returns table. Top Performance ContributorsAllocations | The Fund benefited most on a relative basis from having exposure to residential mortgage-backed securities, investment-grade corporates, asset-backed securities and commercial mortgage-backed securities. Structured asset sectors are all out-of-benchmark sectors, which contributed to the Fund’s relative performance during the annual period. High-yield corporates also contributed to the Fund’s relative performance as an out-of-benchmark allocation. Security selection | Security selection within the investment-grade corporate bond sector was additive to the Fund’s performance. Selection within the industrials and financials sub-sectors also contributed to the Fund’s relative performance. Top Performance DetractorsAllocations | An underweight allocation to the investment-grade corporate bond sector detracted modestly from the Fund’s relative performance, as the sector outperformed the benchmark during the annual period. Investment-grade corporate bonds represented the Fund’s largest sector underweight, excluding U.S. Treasuries. Duration and curve positioning | The combination of duration and yield curve positioning had a negative impact on the Fund’s relative performance during the annual period. The U.S. Federal Reserve continued easing monetary policy during the period with three 25 basis point cuts resulting in a flattening of the yield curve. However, market volatility and the conflict in Iran have the Fed cautious on future reductions in the fed funds target rate in 2026 due to economic uncertainty and the long-term impact of a potential prolonged war. |
| Performance Past Does Not Indicate Future [Text] |
The Fund's past performance is not a good predictor of the Fund's future performance.
|
| Line Graph [Table Text Block] |
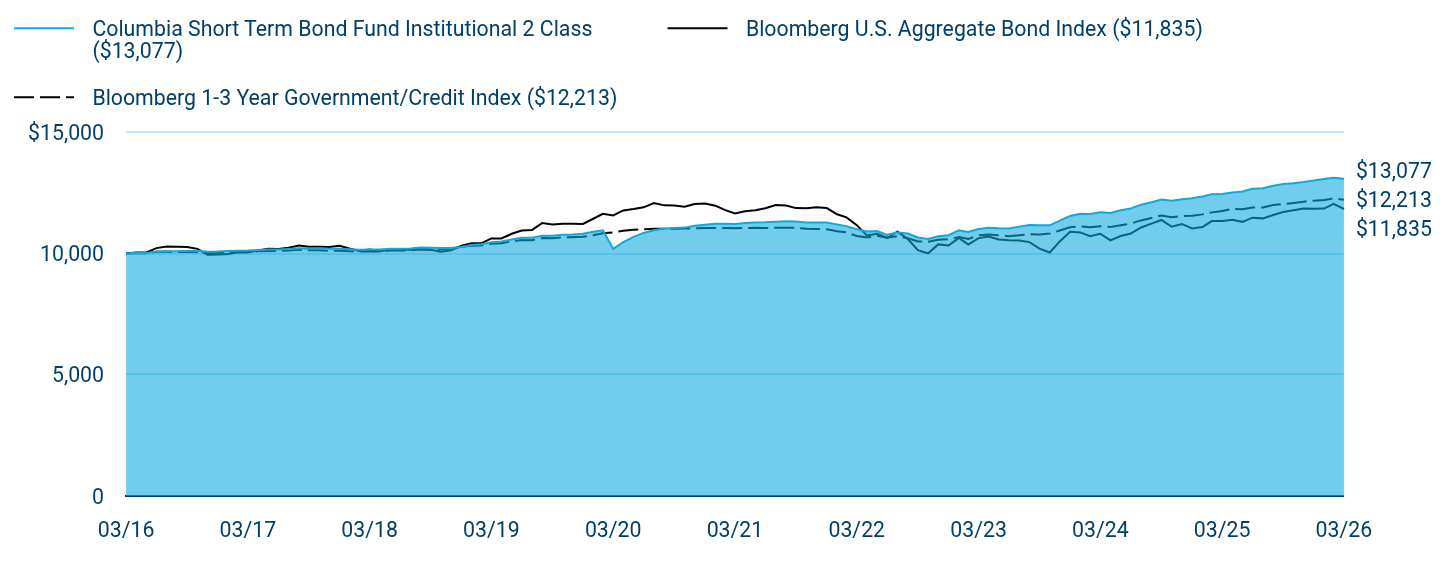
Table Summary
|
Columbia Short Term Bond Fund Institutional 2 Class ($13,077) |
Bloomberg U.S. Aggregate Bond Index ($11,835) |
Bloomberg 1-3 Year Government/Credit Index ($12,213) |
03/16 |
$10,000 |
$10,000 |
$10,000 |
04/16 |
$10,026 |
$10,038 |
$10,014 |
05/16 |
$10,024 |
$10,041 |
$10,007 |
06/16 |
$10,083 |
$10,221 |
$10,067 |
07/16 |
$10,092 |
$10,286 |
$10,069 |
08/16 |
$10,091 |
$10,274 |
$10,058 |
09/16 |
$10,101 |
$10,268 |
$10,069 |
10/16 |
$10,111 |
$10,190 |
$10,066 |
11/16 |
$10,070 |
$9,949 |
$10,024 |
12/16 |
$10,081 |
$9,963 |
$10,030 |
01/17 |
$10,102 |
$9,982 |
$10,049 |
02/17 |
$10,113 |
$10,049 |
$10,066 |
03/17 |
$10,125 |
$10,044 |
$10,071 |
04/17 |
$10,148 |
$10,122 |
$10,090 |
05/17 |
$10,161 |
$10,199 |
$10,106 |
06/17 |
$10,165 |
$10,189 |
$10,102 |
07/17 |
$10,189 |
$10,233 |
$10,128 |
08/17 |
$10,214 |
$10,325 |
$10,149 |
09/17 |
$10,207 |
$10,276 |
$10,136 |
10/17 |
$10,211 |
$10,282 |
$10,134 |
11/17 |
$10,193 |
$10,268 |
$10,112 |
12/17 |
$10,195 |
$10,316 |
$10,115 |
01/18 |
$10,175 |
$10,197 |
$10,088 |
02/18 |
$10,155 |
$10,100 |
$10,079 |
03/18 |
$10,165 |
$10,165 |
$10,095 |
04/18 |
$10,164 |
$10,089 |
$10,084 |
05/18 |
$10,195 |
$10,161 |
$10,122 |
06/18 |
$10,196 |
$10,149 |
$10,123 |
07/18 |
$10,208 |
$10,151 |
$10,129 |
08/18 |
$10,242 |
$10,216 |
$10,164 |
09/18 |
$10,236 |
$10,151 |
$10,157 |
10/18 |
$10,231 |
$10,070 |
$10,168 |
11/18 |
$10,227 |
$10,131 |
$10,197 |
12/18 |
$10,267 |
$10,317 |
$10,277 |
01/19 |
$10,351 |
$10,426 |
$10,317 |
02/19 |
$10,383 |
$10,420 |
$10,333 |
03/19 |
$10,460 |
$10,620 |
$10,401 |
04/19 |
$10,498 |
$10,623 |
$10,425 |
05/19 |
$10,576 |
$10,812 |
$10,497 |
06/19 |
$10,644 |
$10,947 |
$10,555 |
07/19 |
$10,650 |
$10,971 |
$10,549 |
08/19 |
$10,731 |
$11,256 |
$10,634 |
09/19 |
$10,735 |
$11,196 |
$10,628 |
10/19 |
$10,769 |
$11,230 |
$10,665 |
11/19 |
$10,780 |
$11,224 |
$10,665 |
12/19 |
$10,810 |
$11,216 |
$10,691 |
01/20 |
$10,893 |
$11,432 |
$10,750 |
02/20 |
$10,953 |
$11,638 |
$10,838 |
03/20 |
$10,196 |
$11,569 |
$10,871 |
04/20 |
$10,473 |
$11,775 |
$10,940 |
05/20 |
$10,683 |
$11,830 |
$10,977 |
06/20 |
$10,848 |
$11,904 |
$10,999 |
07/20 |
$10,958 |
$12,082 |
$11,019 |
08/20 |
$11,032 |
$11,984 |
$11,023 |
09/20 |
$11,050 |
$11,978 |
$11,024 |
10/20 |
$11,067 |
$11,924 |
$11,026 |
11/20 |
$11,139 |
$12,041 |
$11,037 |
12/20 |
$11,188 |
$12,058 |
$11,047 |
01/21 |
$11,226 |
$11,971 |
$11,051 |
02/21 |
$11,229 |
$11,799 |
$11,048 |
03/21 |
$11,220 |
$11,651 |
$11,043 |
04/21 |
$11,256 |
$11,743 |
$11,051 |
05/21 |
$11,281 |
$11,782 |
$11,064 |
06/21 |
$11,284 |
$11,864 |
$11,047 |
07/21 |
$11,310 |
$11,997 |
$11,066 |
08/21 |
$11,326 |
$11,974 |
$11,066 |
09/21 |
$11,320 |
$11,871 |
$11,057 |
10/21 |
$11,280 |
$11,867 |
$11,021 |
11/21 |
$11,273 |
$11,902 |
$11,012 |
12/21 |
$11,277 |
$11,872 |
$10,995 |
01/22 |
$11,201 |
$11,616 |
$10,916 |
02/22 |
$11,125 |
$11,487 |
$10,869 |
03/22 |
$11,005 |
$11,168 |
$10,721 |
04/22 |
$10,907 |
$10,744 |
$10,664 |
05/22 |
$10,922 |
$10,813 |
$10,729 |
06/22 |
$10,769 |
$10,643 |
$10,654 |
07/22 |
$10,867 |
$10,903 |
$10,710 |
08/22 |
$10,821 |
$10,595 |
$10,626 |
09/22 |
$10,662 |
$10,138 |
$10,496 |
10/22 |
$10,598 |
$10,006 |
$10,483 |
11/22 |
$10,708 |
$10,374 |
$10,570 |
12/22 |
$10,754 |
$10,327 |
$10,590 |
01/23 |
$10,952 |
$10,645 |
$10,675 |
02/23 |
$10,887 |
$10,370 |
$10,595 |
03/23 |
$11,006 |
$10,633 |
$10,750 |
04/23 |
$11,057 |
$10,698 |
$10,786 |
05/23 |
$11,037 |
$10,581 |
$10,753 |
06/23 |
$11,032 |
$10,544 |
$10,710 |
07/23 |
$11,108 |
$10,536 |
$10,755 |
08/23 |
$11,170 |
$10,469 |
$10,793 |
09/23 |
$11,161 |
$10,203 |
$10,788 |
10/23 |
$11,163 |
$10,042 |
$10,821 |
11/23 |
$11,356 |
$10,497 |
$10,947 |
12/23 |
$11,550 |
$10,898 |
$11,078 |
01/24 |
$11,638 |
$10,868 |
$11,121 |
02/24 |
$11,631 |
$10,715 |
$11,081 |
03/24 |
$11,697 |
$10,814 |
$11,125 |
04/24 |
$11,667 |
$10,541 |
$11,088 |
05/24 |
$11,785 |
$10,719 |
$11,168 |
06/24 |
$11,855 |
$10,821 |
$11,231 |
07/24 |
$12,013 |
$11,074 |
$11,364 |
08/24 |
$12,111 |
$11,233 |
$11,467 |
09/24 |
$12,224 |
$11,383 |
$11,563 |
10/24 |
$12,174 |
$11,101 |
$11,497 |
11/24 |
$12,237 |
$11,218 |
$11,536 |
12/24 |
$12,276 |
$11,035 |
$11,561 |
01/25 |
$12,352 |
$11,093 |
$11,613 |
02/25 |
$12,440 |
$11,337 |
$11,695 |
03/25 |
$12,452 |
$11,342 |
$11,749 |
04/25 |
$12,516 |
$11,386 |
$11,838 |
05/25 |
$12,553 |
$11,305 |
$11,822 |
06/25 |
$12,668 |
$11,478 |
$11,898 |
07/25 |
$12,693 |
$11,448 |
$11,895 |
08/25 |
$12,796 |
$11,585 |
$12,000 |
09/25 |
$12,861 |
$11,711 |
$12,040 |
10/25 |
$12,899 |
$11,785 |
$12,080 |
11/25 |
$12,948 |
$11,858 |
$12,137 |
12/25 |
$13,012 |
$11,840 |
$12,179 |
01/26 |
$13,075 |
$11,853 |
$12,207 |
02/26 |
$13,124 |
$12,047 |
$12,270 |
03/26 |
$13,077 |
$11,835 |
$12,213 |
|
| Average Annual Return [Table Text Block] |
Table Summary
Average Annual Total Returns (%) |
1 year |
5 years |
10 years |
Institutional 2 Class |
5.02 |
3.11 |
2.72 |
Bloomberg U.S. Aggregate Bond Index |
4.35 |
0.31 |
1.70 |
Bloomberg 1-3 Year Government/Credit Index |
3.96 |
2.04 |
2.02 | |
| No Deduction of Taxes [Text Block] |
Performance does not reflect the deduction of taxes that a shareholder may pay on fund distributions or on the redemptions of fund shares.
|
| Updated Performance Information Location [Text Block] |
columbiathreadneedleus.com/investment-products/mutual-funds
|
| AssetsNet |
$ 1,665,882,158
|
| Holdings Count | Holding |
601
|
| Advisory Fees Paid, Amount |
$ 6,737,672
|
| InvestmentCompanyPortfolioTurnover |
76.00%
|
| Additional Fund Statistics [Text Block] |
Table Summary
Fund net assets |
$1,665,882,158 |
Total number of portfolio holdings |
601 |
Management services fees (represents 0.42% of Fund average net assets) |
$6,737,672 |
Portfolio turnover for the reporting period |
76% | |
| Holdings [Text Block] |
Table Summary
Corporate Bonds & Notes |
34.0% |
Residential Mortgage-Backed Securities - Non-Agency |
28.6% |
Asset-Backed Securities - Non-Agency |
20.7% |
Commercial Mortgage-Backed Securities - Non-Agency |
12.7% |
Residential Mortgage-Backed Securities - Agency |
2.1% |
Money Market Funds |
1.6% |
Other |
1.0% | |
| Largest Holdings [Text Block] |
Table Summary
Vista Point Securitization Trust, Series 2025-CES2, Class A1 5.601% 08/25/2055 |
1.6% |
Extended Stay America Trust, Series 2025-ESH, Class A 4.973% 10/15/2042 |
1.1% |
Morgan Stanley Residential Mortgage Loan Trust, Series 2025-NQM1, Class A1 5.738% 11/25/2069 |
1.1% |
U.S Treasury Bills 3.700% 04/23/2026 |
1.0% |
Affirm Master Trust, Series 2025-1A, Class A 4.990% 02/15/2033 |
1.0% |
Aimco CLO Ltd., Series 2020-11A, Class A1R2 5.008% 07/17/2037 |
1.0% |
Progress Residential Trust, Series 2022-SFR6, Class A 4.451% 07/20/2039 |
0.9% |
Magnetite XXXVI Ltd., Series 2025-36A, Class AR 4.988% 07/25/2038 |
0.9% |
Elmwood CLO Ltd., Series 2025-3A, Class A 4.908% 03/22/2038 |
0.9% |
Wells Fargo Commercial Mortgage Trust, Series 2017-SMP, Class A 4.595% 12/15/2034 |
0.9% | |
| Material Fund Change [Text Block] |
|
| C000079024 |
|
| Shareholder Report [Line Items] |
|
| Fund Name |
Columbia Short Term Bond Fund
|
| Class Name |
Institutional 3 Class
|
| Trading Symbol |
CSBYX
|
| Annual or Semi-Annual Statement [Text Block] |
This annual shareholder report contains important information about Columbia Short Term Bond Fund (the Fund) for the period of April 1, 2025 to March 31, 2026.
|
| Additional Information [Text Block] |
You can find additional information about the Fund at columbiathreadneedleus.com/resources/literature. You can also request more information by contacting us at 1-800-345-6611.
|
| Additional Information Phone Number |
1-800-345-6611
|
| Additional Information Website |
columbiathreadneedleus.com/resources/literature
|
| Expenses [Text Block] |
What were the Fund costs for the reporting period? (Based on a hypothetical $10,000 investment)
Table Summary
Class |
Cost of a $10,000 investment |
Cost paid as a percentage of a $10,000 investment |
Institutional 3 Class |
$37 |
0.36% | |
| Expenses Paid, Amount |
$ 37
|
| Expense Ratio, Percent |
0.36%
|
| Factors Affecting Performance [Text Block] |
Management's Discussion of Fund Performance The performance of Institutional 3 Class shares for the period presented is shown in the Average Annual Total Returns table. Top Performance ContributorsAllocations | The Fund benefited most on a relative basis from having exposure to residential mortgage-backed securities, investment-grade corporates, asset-backed securities and commercial mortgage-backed securities. Structured asset sectors are all out-of-benchmark sectors, which contributed to the Fund’s relative performance during the annual period. High-yield corporates also contributed to the Fund’s relative performance as an out-of-benchmark allocation. Security selection | Security selection within the investment-grade corporate bond sector was additive to the Fund’s performance. Selection within the industrials and financials sub-sectors also contributed to the Fund’s relative performance. Top Performance DetractorsAllocations | An underweight allocation to the investment-grade corporate bond sector detracted modestly from the Fund’s relative performance, as the sector outperformed the benchmark during the annual period. Investment-grade corporate bonds represented the Fund’s largest sector underweight, excluding U.S. Treasuries. Duration and curve positioning | The combination of duration and yield curve positioning had a negative impact on the Fund’s relative performance during the annual period. The U.S. Federal Reserve continued easing monetary policy during the period with three 25 basis point cuts resulting in a flattening of the yield curve. However, market volatility and the conflict in Iran have the Fed cautious on future reductions in the fed funds target rate in 2026 due to economic uncertainty and the long-term impact of a potential prolonged war. |
| Performance Past Does Not Indicate Future [Text] |
The Fund's past performance is not a good predictor of the Fund's future performance.
|
| Line Graph [Table Text Block] |

Table Summary
|
Columbia Short Term Bond Fund Institutional 3 Class ($13,134) |
Bloomberg U.S. Aggregate Bond Index ($11,835) |
Bloomberg 1-3 Year Government/Credit Index ($12,213) |
03/16 |
$10,000 |
$10,000 |
$10,000 |
04/16 |
$10,037 |
$10,038 |
$10,014 |
05/16 |
$10,025 |
$10,041 |
$10,007 |
06/16 |
$10,084 |
$10,221 |
$10,067 |
07/16 |
$10,093 |
$10,286 |
$10,069 |
08/16 |
$10,103 |
$10,274 |
$10,058 |
09/16 |
$10,114 |
$10,268 |
$10,069 |
10/16 |
$10,114 |
$10,190 |
$10,066 |
11/16 |
$10,074 |
$9,949 |
$10,024 |
12/16 |
$10,095 |
$9,963 |
$10,030 |
01/17 |
$10,106 |
$9,982 |
$10,049 |
02/17 |
$10,128 |
$10,049 |
$10,066 |
03/17 |
$10,130 |
$10,044 |
$10,071 |
04/17 |
$10,154 |
$10,122 |
$10,090 |
05/17 |
$10,177 |
$10,199 |
$10,106 |
06/17 |
$10,171 |
$10,189 |
$10,102 |
07/17 |
$10,196 |
$10,233 |
$10,128 |
08/17 |
$10,221 |
$10,325 |
$10,149 |
09/17 |
$10,215 |
$10,276 |
$10,136 |
10/17 |
$10,219 |
$10,282 |
$10,134 |
11/17 |
$10,212 |
$10,268 |
$10,112 |
12/17 |
$10,214 |
$10,316 |
$10,115 |
01/18 |
$10,185 |
$10,197 |
$10,088 |
02/18 |
$10,175 |
$10,100 |
$10,079 |
03/18 |
$10,185 |
$10,165 |
$10,095 |
04/18 |
$10,185 |
$10,089 |
$10,084 |
05/18 |
$10,217 |
$10,161 |
$10,122 |
06/18 |
$10,218 |
$10,149 |
$10,123 |
07/18 |
$10,230 |
$10,151 |
$10,129 |
08/18 |
$10,265 |
$10,216 |
$10,164 |
09/18 |
$10,259 |
$10,151 |
$10,157 |
10/18 |
$10,255 |
$10,070 |
$10,168 |
11/18 |
$10,251 |
$10,131 |
$10,197 |
12/18 |
$10,292 |
$10,317 |
$10,277 |
01/19 |
$10,365 |
$10,426 |
$10,317 |
02/19 |
$10,409 |
$10,420 |
$10,333 |
03/19 |
$10,486 |
$10,620 |
$10,401 |
04/19 |
$10,525 |
$10,623 |
$10,425 |
05/19 |
$10,603 |
$10,812 |
$10,497 |
06/19 |
$10,672 |
$10,947 |
$10,555 |
07/19 |
$10,678 |
$10,971 |
$10,549 |
08/19 |
$10,760 |
$11,256 |
$10,634 |
09/19 |
$10,753 |
$11,196 |
$10,628 |
10/19 |
$10,789 |
$11,230 |
$10,665 |
11/19 |
$10,799 |
$11,224 |
$10,665 |
12/19 |
$10,830 |
$11,216 |
$10,691 |
01/20 |
$10,913 |
$11,432 |
$10,750 |
02/20 |
$10,974 |
$11,638 |
$10,838 |
03/20 |
$10,228 |
$11,569 |
$10,871 |
04/20 |
$10,505 |
$11,775 |
$10,940 |
05/20 |
$10,706 |
$11,830 |
$10,977 |
06/20 |
$10,882 |
$11,904 |
$10,999 |
07/20 |
$10,992 |
$12,082 |
$11,019 |
08/20 |
$11,067 |
$11,984 |
$11,023 |
09/20 |
$11,086 |
$11,978 |
$11,024 |
10/20 |
$11,104 |
$11,924 |
$11,026 |
11/20 |
$11,176 |
$12,041 |
$11,037 |
12/20 |
$11,226 |
$12,058 |
$11,047 |
01/21 |
$11,264 |
$11,971 |
$11,051 |
02/21 |
$11,267 |
$11,799 |
$11,048 |
03/21 |
$11,259 |
$11,651 |
$11,043 |
04/21 |
$11,296 |
$11,743 |
$11,051 |
05/21 |
$11,321 |
$11,782 |
$11,064 |
06/21 |
$11,325 |
$11,864 |
$11,047 |
07/21 |
$11,352 |
$11,997 |
$11,066 |
08/21 |
$11,357 |
$11,974 |
$11,066 |
09/21 |
$11,351 |
$11,871 |
$11,057 |
10/21 |
$11,323 |
$11,867 |
$11,021 |
11/21 |
$11,306 |
$11,902 |
$11,012 |
12/21 |
$11,321 |
$11,872 |
$10,995 |
01/22 |
$11,234 |
$11,616 |
$10,916 |
02/22 |
$11,170 |
$11,487 |
$10,869 |
03/22 |
$11,038 |
$11,168 |
$10,721 |
04/22 |
$10,951 |
$10,744 |
$10,664 |
05/22 |
$10,967 |
$10,813 |
$10,729 |
06/22 |
$10,814 |
$10,643 |
$10,654 |
07/22 |
$10,913 |
$10,903 |
$10,710 |
08/22 |
$10,867 |
$10,595 |
$10,626 |
09/22 |
$10,709 |
$10,138 |
$10,496 |
10/22 |
$10,644 |
$10,006 |
$10,483 |
11/22 |
$10,756 |
$10,374 |
$10,570 |
12/22 |
$10,802 |
$10,327 |
$10,590 |
01/23 |
$11,001 |
$10,645 |
$10,675 |
02/23 |
$10,936 |
$10,370 |
$10,595 |
03/23 |
$11,044 |
$10,633 |
$10,750 |
04/23 |
$11,108 |
$10,698 |
$10,786 |
05/23 |
$11,089 |
$10,581 |
$10,753 |
06/23 |
$11,084 |
$10,544 |
$10,710 |
07/23 |
$11,148 |
$10,536 |
$10,755 |
08/23 |
$11,211 |
$10,469 |
$10,793 |
09/23 |
$11,215 |
$10,203 |
$10,788 |
10/23 |
$11,205 |
$10,042 |
$10,821 |
11/23 |
$11,412 |
$10,497 |
$10,947 |
12/23 |
$11,607 |
$10,898 |
$11,078 |
01/24 |
$11,684 |
$10,868 |
$11,121 |
02/24 |
$11,689 |
$10,715 |
$11,081 |
03/24 |
$11,756 |
$10,814 |
$11,125 |
04/24 |
$11,727 |
$10,541 |
$11,088 |
05/24 |
$11,845 |
$10,719 |
$11,168 |
06/24 |
$11,916 |
$10,821 |
$11,231 |
07/24 |
$12,063 |
$11,074 |
$11,364 |
08/24 |
$12,175 |
$11,233 |
$11,467 |
09/24 |
$12,287 |
$11,383 |
$11,563 |
10/24 |
$12,238 |
$11,101 |
$11,497 |
11/24 |
$12,302 |
$11,218 |
$11,536 |
12/24 |
$12,341 |
$11,035 |
$11,561 |
01/25 |
$12,417 |
$11,093 |
$11,613 |
02/25 |
$12,493 |
$11,337 |
$11,695 |
03/25 |
$12,518 |
$11,342 |
$11,749 |
04/25 |
$12,583 |
$11,386 |
$11,838 |
05/25 |
$12,620 |
$11,305 |
$11,822 |
06/25 |
$12,736 |
$11,478 |
$11,898 |
07/25 |
$12,748 |
$11,448 |
$11,895 |
08/25 |
$12,865 |
$11,585 |
$12,000 |
09/25 |
$12,930 |
$11,711 |
$12,040 |
10/25 |
$12,968 |
$11,785 |
$12,080 |
11/25 |
$13,018 |
$11,858 |
$12,137 |
12/25 |
$13,082 |
$11,840 |
$12,179 |
01/26 |
$13,132 |
$11,853 |
$12,207 |
02/26 |
$13,194 |
$12,047 |
$12,270 |
03/26 |
$13,134 |
$11,835 |
$12,213 |
|
| Average Annual Return [Table Text Block] |
Table Summary
Average Annual Total Returns (%) |
1 year |
5 years |
10 years |
Institutional 3 Class |
4.92 |
3.13 |
2.76 |
Bloomberg U.S. Aggregate Bond Index |
4.35 |
0.31 |
1.70 |
Bloomberg 1-3 Year Government/Credit Index |
3.96 |
2.04 |
2.02 | |
| No Deduction of Taxes [Text Block] |
Performance does not reflect the deduction of taxes that a shareholder may pay on fund distributions or on the redemptions of fund shares.
|
| Updated Performance Information Location [Text Block] |
columbiathreadneedleus.com/investment-products/mutual-funds
|
| AssetsNet |
$ 1,665,882,158
|
| Holdings Count | Holding |
601
|
| Advisory Fees Paid, Amount |
$ 6,737,672
|
| InvestmentCompanyPortfolioTurnover |
76.00%
|
| Additional Fund Statistics [Text Block] |
Table Summary
Fund net assets |
$1,665,882,158 |
Total number of portfolio holdings |
601 |
Management services fees (represents 0.42% of Fund average net assets) |
$6,737,672 |
Portfolio turnover for the reporting period |
76% | |
| Holdings [Text Block] |
Table Summary
Corporate Bonds & Notes |
34.0% |
Residential Mortgage-Backed Securities - Non-Agency |
28.6% |
Asset-Backed Securities - Non-Agency |
20.7% |
Commercial Mortgage-Backed Securities - Non-Agency |
12.7% |
Residential Mortgage-Backed Securities - Agency |
2.1% |
Money Market Funds |
1.6% |
Other |
1.0% | |
| Largest Holdings [Text Block] |
Table Summary
Vista Point Securitization Trust, Series 2025-CES2, Class A1 5.601% 08/25/2055 |
1.6% |
Extended Stay America Trust, Series 2025-ESH, Class A 4.973% 10/15/2042 |
1.1% |
Morgan Stanley Residential Mortgage Loan Trust, Series 2025-NQM1, Class A1 5.738% 11/25/2069 |
1.1% |
U.S Treasury Bills 3.700% 04/23/2026 |
1.0% |
Affirm Master Trust, Series 2025-1A, Class A 4.990% 02/15/2033 |
1.0% |
Aimco CLO Ltd., Series 2020-11A, Class A1R2 5.008% 07/17/2037 |
1.0% |
Progress Residential Trust, Series 2022-SFR6, Class A 4.451% 07/20/2039 |
0.9% |
Magnetite XXXVI Ltd., Series 2025-36A, Class AR 4.988% 07/25/2038 |
0.9% |
Elmwood CLO Ltd., Series 2025-3A, Class A 4.908% 03/22/2038 |
0.9% |
Wells Fargo Commercial Mortgage Trust, Series 2017-SMP, Class A 4.595% 12/15/2034 |
0.9% | |
| Material Fund Change [Text Block] |
|
| C000029791 |
|
| Shareholder Report [Line Items] |
|
| Fund Name |
Columbia Short Term Bond Fund
|
| Class Name |
Institutional Class
|
| Trading Symbol |
NSTMX
|
| Annual or Semi-Annual Statement [Text Block] |
This annual shareholder report contains important information about Columbia Short Term Bond Fund (the Fund) for the period of April 1, 2025 to March 31, 2026.
|
| Additional Information [Text Block] |
You can find additional information about the Fund at columbiathreadneedleus.com/resources/literature. You can also request more information by contacting us at 1-800-345-6611.
|
| Additional Information Phone Number |
1-800-345-6611
|
| Additional Information Website |
columbiathreadneedleus.com/resources/literature
|
| Expenses [Text Block] |
What were the Fund costs for the reporting period? (Based on a hypothetical $10,000 investment)
Table Summary
Class |
Cost of a $10,000 investment |
Cost paid as a percentage of a $10,000 investment |
Institutional Class |
$46 |
0.45% | |
| Expenses Paid, Amount |
$ 46
|
| Expense Ratio, Percent |
0.45%
|
| Factors Affecting Performance [Text Block] |
Management's Discussion of Fund Performance The performance of Institutional Class shares for the period presented is shown in the Average Annual Total Returns table. Top Performance ContributorsAllocations | The Fund benefited most on a relative basis from having exposure to residential mortgage-backed securities, investment-grade corporates, asset-backed securities and commercial mortgage-backed securities. Structured asset sectors are all out-of-benchmark sectors, which contributed to the Fund’s relative performance during the annual period. High-yield corporates also contributed to the Fund’s relative performance as an out-of-benchmark allocation. Security selection | Security selection within the investment-grade corporate bond sector was additive to the Fund’s performance. Selection within the industrials and financials sub-sectors also contributed to the Fund’s relative performance. Top Performance DetractorsAllocations | An underweight allocation to the investment-grade corporate bond sector detracted modestly from the Fund’s relative performance, as the sector outperformed the benchmark during the annual period. Investment-grade corporate bonds represented the Fund’s largest sector underweight, excluding U.S. Treasuries. Duration and curve positioning | The combination of duration and yield curve positioning had a negative impact on the Fund’s relative performance during the annual period. The U.S. Federal Reserve continued easing monetary policy during the period with three 25 basis point cuts resulting in a flattening of the yield curve. However, market volatility and the conflict in Iran have the Fed cautious on future reductions in the fed funds target rate in 2026 due to economic uncertainty and the long-term impact of a potential prolonged war. |
| Performance Past Does Not Indicate Future [Text] |
The Fund's past performance is not a good predictor of the Fund's future performance.
|
| Line Graph [Table Text Block] |
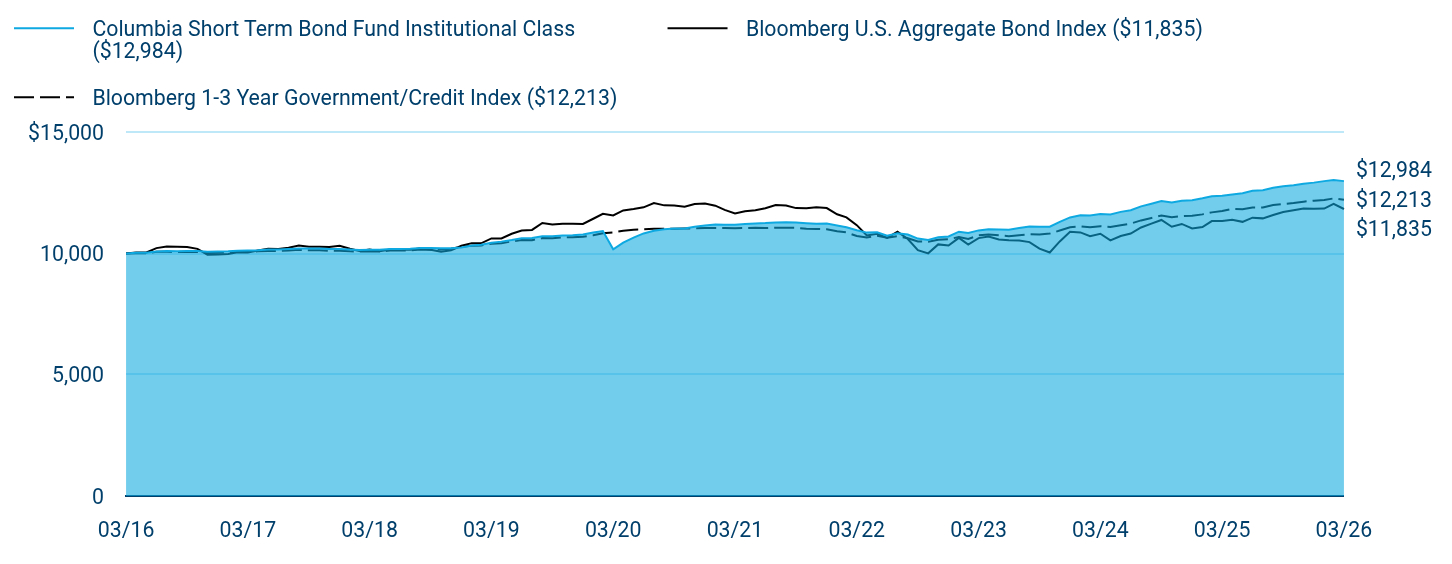
Table Summary
|
Columbia Short Term Bond Fund Institutional Class ($12,984) |
Bloomberg U.S. Aggregate Bond Index ($11,835) |
Bloomberg 1-3 Year Government/Credit Index ($12,213) |
03/16 |
$10,000 |
$10,000 |
$10,000 |
04/16 |
$10,035 |
$10,038 |
$10,014 |
05/16 |
$10,032 |
$10,041 |
$10,007 |
06/16 |
$10,080 |
$10,221 |
$10,067 |
07/16 |
$10,098 |
$10,286 |
$10,069 |
08/16 |
$10,097 |
$10,274 |
$10,058 |
09/16 |
$10,106 |
$10,268 |
$10,069 |
10/16 |
$10,105 |
$10,190 |
$10,066 |
11/16 |
$10,074 |
$9,949 |
$10,024 |
12/16 |
$10,084 |
$9,963 |
$10,030 |
01/17 |
$10,094 |
$9,982 |
$10,049 |
02/17 |
$10,114 |
$10,049 |
$10,066 |
03/17 |
$10,126 |
$10,044 |
$10,071 |
04/17 |
$10,138 |
$10,122 |
$10,090 |
05/17 |
$10,160 |
$10,199 |
$10,106 |
06/17 |
$10,163 |
$10,189 |
$10,102 |
07/17 |
$10,187 |
$10,233 |
$10,128 |
08/17 |
$10,210 |
$10,325 |
$10,149 |
09/17 |
$10,203 |
$10,276 |
$10,136 |
10/17 |
$10,205 |
$10,282 |
$10,134 |
11/17 |
$10,187 |
$10,268 |
$10,112 |
12/17 |
$10,188 |
$10,316 |
$10,115 |
01/18 |
$10,168 |
$10,197 |
$10,088 |
02/18 |
$10,146 |
$10,100 |
$10,079 |
03/18 |
$10,156 |
$10,165 |
$10,095 |
04/18 |
$10,154 |
$10,089 |
$10,084 |
05/18 |
$10,185 |
$10,161 |
$10,122 |
06/18 |
$10,185 |
$10,149 |
$10,123 |
07/18 |
$10,196 |
$10,151 |
$10,129 |
08/18 |
$10,229 |
$10,216 |
$10,164 |
09/18 |
$10,222 |
$10,151 |
$10,157 |
10/18 |
$10,217 |
$10,070 |
$10,168 |
11/18 |
$10,212 |
$10,131 |
$10,197 |
12/18 |
$10,251 |
$10,317 |
$10,277 |
01/19 |
$10,333 |
$10,426 |
$10,317 |
02/19 |
$10,365 |
$10,420 |
$10,333 |
03/19 |
$10,441 |
$10,620 |
$10,401 |
04/19 |
$10,489 |
$10,623 |
$10,425 |
05/19 |
$10,555 |
$10,812 |
$10,497 |
06/19 |
$10,632 |
$10,947 |
$10,555 |
07/19 |
$10,638 |
$10,971 |
$10,549 |
08/19 |
$10,707 |
$11,256 |
$10,634 |
09/19 |
$10,710 |
$11,196 |
$10,628 |
10/19 |
$10,744 |
$11,230 |
$10,665 |
11/19 |
$10,753 |
$11,224 |
$10,665 |
12/19 |
$10,783 |
$11,216 |
$10,691 |
01/20 |
$10,865 |
$11,432 |
$10,750 |
02/20 |
$10,924 |
$11,638 |
$10,838 |
03/20 |
$10,170 |
$11,569 |
$10,871 |
04/20 |
$10,444 |
$11,775 |
$10,940 |
05/20 |
$10,653 |
$11,830 |
$10,977 |
06/20 |
$10,828 |
$11,904 |
$10,999 |
07/20 |
$10,936 |
$12,082 |
$11,019 |
08/20 |
$10,998 |
$11,984 |
$11,023 |
09/20 |
$11,026 |
$11,978 |
$11,024 |
10/20 |
$11,032 |
$11,924 |
$11,026 |
11/20 |
$11,103 |
$12,041 |
$11,037 |
12/20 |
$11,151 |
$12,058 |
$11,047 |
01/21 |
$11,199 |
$11,971 |
$11,051 |
02/21 |
$11,190 |
$11,799 |
$11,048 |
03/21 |
$11,181 |
$11,651 |
$11,043 |
04/21 |
$11,216 |
$11,743 |
$11,051 |
05/21 |
$11,241 |
$11,782 |
$11,064 |
06/21 |
$11,254 |
$11,864 |
$11,047 |
07/21 |
$11,279 |
$11,997 |
$11,066 |
08/21 |
$11,283 |
$11,974 |
$11,066 |
09/21 |
$11,277 |
$11,871 |
$11,057 |
10/21 |
$11,248 |
$11,867 |
$11,021 |
11/21 |
$11,229 |
$11,902 |
$11,012 |
12/21 |
$11,232 |
$11,872 |
$10,995 |
01/22 |
$11,156 |
$11,616 |
$10,916 |
02/22 |
$11,079 |
$11,487 |
$10,869 |
03/22 |
$10,959 |
$11,168 |
$10,721 |
04/22 |
$10,861 |
$10,744 |
$10,664 |
05/22 |
$10,876 |
$10,813 |
$10,729 |
06/22 |
$10,734 |
$10,643 |
$10,654 |
07/22 |
$10,831 |
$10,903 |
$10,710 |
08/22 |
$10,784 |
$10,595 |
$10,626 |
09/22 |
$10,614 |
$10,138 |
$10,496 |
10/22 |
$10,561 |
$10,006 |
$10,483 |
11/22 |
$10,670 |
$10,374 |
$10,570 |
12/22 |
$10,703 |
$10,327 |
$10,590 |
01/23 |
$10,900 |
$10,645 |
$10,675 |
02/23 |
$10,845 |
$10,370 |
$10,595 |
03/23 |
$10,952 |
$10,633 |
$10,750 |
04/23 |
$11,001 |
$10,698 |
$10,786 |
05/23 |
$10,993 |
$10,581 |
$10,753 |
06/23 |
$10,976 |
$10,544 |
$10,710 |
07/23 |
$11,050 |
$10,536 |
$10,755 |
08/23 |
$11,111 |
$10,469 |
$10,793 |
09/23 |
$11,101 |
$10,203 |
$10,788 |
10/23 |
$11,102 |
$10,042 |
$10,821 |
11/23 |
$11,306 |
$10,497 |
$10,947 |
12/23 |
$11,486 |
$10,898 |
$11,078 |
01/24 |
$11,573 |
$10,868 |
$11,121 |
02/24 |
$11,565 |
$10,715 |
$11,081 |
03/24 |
$11,630 |
$10,814 |
$11,125 |
04/24 |
$11,612 |
$10,541 |
$11,088 |
05/24 |
$11,716 |
$10,719 |
$11,168 |
06/24 |
$11,785 |
$10,821 |
$11,231 |
07/24 |
$11,942 |
$11,074 |
$11,364 |
08/24 |
$12,051 |
$11,233 |
$11,467 |
09/24 |
$12,162 |
$11,383 |
$11,563 |
10/24 |
$12,100 |
$11,101 |
$11,497 |
11/24 |
$12,174 |
$11,218 |
$11,536 |
12/24 |
$12,199 |
$11,035 |
$11,561 |
01/25 |
$12,274 |
$11,093 |
$11,613 |
02/25 |
$12,361 |
$11,337 |
$11,695 |
03/25 |
$12,385 |
$11,342 |
$11,749 |
04/25 |
$12,435 |
$11,386 |
$11,838 |
05/25 |
$12,484 |
$11,305 |
$11,822 |
06/25 |
$12,585 |
$11,478 |
$11,898 |
07/25 |
$12,609 |
$11,448 |
$11,895 |
08/25 |
$12,711 |
$11,585 |
$12,000 |
09/25 |
$12,774 |
$11,711 |
$12,040 |
10/25 |
$12,811 |
$11,785 |
$12,080 |
11/25 |
$12,873 |
$11,858 |
$12,137 |
12/25 |
$12,922 |
$11,840 |
$12,179 |
01/26 |
$12,984 |
$11,853 |
$12,207 |
02/26 |
$13,031 |
$12,047 |
$12,270 |
03/26 |
$12,984 |
$11,835 |
$12,213 |
|
| Average Annual Return [Table Text Block] |
Table Summary
Average Annual Total Returns (%) |
1 year |
5 years |
10 years |
Institutional Class |
4.84 |
3.04 |
2.65 |
Bloomberg U.S. Aggregate Bond Index |
4.35 |
0.31 |
1.70 |
Bloomberg 1-3 Year Government/Credit Index |
3.96 |
2.04 |
2.02 | |
| No Deduction of Taxes [Text Block] |
Performance does not reflect the deduction of taxes that a shareholder may pay on fund distributions or on the redemptions of fund shares.
|
| Updated Performance Information Location [Text Block] |
columbiathreadneedleus.com/investment-products/mutual-funds
|
| AssetsNet |
$ 1,665,882,158
|
| Holdings Count | Holding |
601
|
| Advisory Fees Paid, Amount |
$ 6,737,672
|
| InvestmentCompanyPortfolioTurnover |
76.00%
|
| Additional Fund Statistics [Text Block] |
Table Summary
Fund net assets |
$1,665,882,158 |
Total number of portfolio holdings |
601 |
Management services fees (represents 0.42% of Fund average net assets) |
$6,737,672 |
Portfolio turnover for the reporting period |
76% | |
| Holdings [Text Block] |
Table Summary
Corporate Bonds & Notes |
34.0% |
Residential Mortgage-Backed Securities - Non-Agency |
28.6% |
Asset-Backed Securities - Non-Agency |
20.7% |
Commercial Mortgage-Backed Securities - Non-Agency |
12.7% |
Residential Mortgage-Backed Securities - Agency |
2.1% |
Money Market Funds |
1.6% |
Other |
1.0% | |
| Largest Holdings [Text Block] |
Table Summary
Vista Point Securitization Trust, Series 2025-CES2, Class A1 5.601% 08/25/2055 |
1.6% |
Extended Stay America Trust, Series 2025-ESH, Class A 4.973% 10/15/2042 |
1.1% |
Morgan Stanley Residential Mortgage Loan Trust, Series 2025-NQM1, Class A1 5.738% 11/25/2069 |
1.1% |
U.S Treasury Bills 3.700% 04/23/2026 |
1.0% |
Affirm Master Trust, Series 2025-1A, Class A 4.990% 02/15/2033 |
1.0% |
Aimco CLO Ltd., Series 2020-11A, Class A1R2 5.008% 07/17/2037 |
1.0% |
Progress Residential Trust, Series 2022-SFR6, Class A 4.451% 07/20/2039 |
0.9% |
Magnetite XXXVI Ltd., Series 2025-36A, Class AR 4.988% 07/25/2038 |
0.9% |
Elmwood CLO Ltd., Series 2025-3A, Class A 4.908% 03/22/2038 |
0.9% |
Wells Fargo Commercial Mortgage Trust, Series 2017-SMP, Class A 4.595% 12/15/2034 |
0.9% | |
| Material Fund Change [Text Block] |
|