Shareholder Report
|
12 Months Ended |
|
Mar. 31, 2026
USD ($)
Holding
|
Mar. 31, 2025 |
| Shareholder Report [Line Items] |
|
|
|
| Document Type |
|
N-CSR
|
|
| Amendment Flag |
|
false
|
|
| Registrant Name |
|
iShares Trust
|
|
| Entity Central Index Key |
|
0001100663
|
|
| Entity Investment Company Type |
|
N-1A
|
|
| Document Period End Date |
|
Mar. 31, 2026
|
|
| Shareholder Report Annual or Semi-Annual |
|
Annual Shareholder Report
|
|
| C000241778 |
|
|
|
| Shareholder Report [Line Items] |
|
|
|
| Fund Name |
|
iShares Copper and Metals Mining ETF
|
|
| Trading Symbol |
|
ICOP
|
|
| Security Exchange Name |
|
NASDAQ
|
|
| Annual or Semi-Annual Statement [Text Block] |
|
This annual shareholder report contains important information about iShares Copper and Metals Mining ETF (the “Fund”) for the period of April 1, 2025 to March 31, 2026
|
|
| Additional Information [Text Block] |
|
You can find additional information about the Fund at blackrock.com/fundreports. You can also request this information by contacting us at 1-800-iShares (1-800-474-2737).
|
|
| Additional Information Phone Number |
|
1-800-474-2737
|
|
| Additional Information Website |
|
blackrock.com/fundreports
|
|
| Expenses [Text Block] |
|
What were the Fund costs for the last year?(based on a hypothetical $10,000 investment) Table SummaryFund name | Costs of a $10,000
investment | Costs paid as a percentage of a
$10,000 investment |
|---|
iShares Copper and Metals Mining ETF | $68 | 0.47% |
|---|
|
|
| Expenses Paid, Amount |
|
$ 68
|
|
| Expense Ratio, Percent |
|
0.47%
|
|
| Performance Past Does Not Indicate Future [Text] |
|
Past performance is not an indication of future results.
|
|
| Line Graph [Table Text Block] |
|
Cumulative performance: June 21, 2023 through March 31, 2026 Initial investment of $10,000  Table Summary | Fund | STOXX Emerging Markets All Cap Index (Net) | STOXX Global Copper and Metals Mining Index (Net) |
|---|
May 23 | $10,000 | $10,000 | $10,000 |
|---|
Jun 23 | $9,768 | $9,890 | $9,766 |
|---|
Jul 23 | $10,782 | $10,477 | $10,814 |
|---|
Aug 23 | $9,795 | $9,937 | $9,850 |
|---|
Sep 23 | $9,528 | $9,704 | $9,614 |
|---|
Oct 23 | $8,655 | $9,305 | $8,692 |
|---|
Nov 23 | $9,293 | $10,080 | $9,350 |
|---|
Dec 23 | $10,460 | $10,480 | $10,536 |
|---|
Jan 24 | $10,002 | $10,071 | $10,121 |
|---|
Feb 24 | $9,946 | $10,516 | $10,001 |
|---|
Mar 24 | $11,533 | $10,735 | $11,600 |
|---|
Apr 24 | $12,554 | $10,810 | $12,709 |
|---|
May 24 | $13,122 | $10,858 | $13,175 |
|---|
Jun 24 | $12,310 | $11,224 | $12,415 |
|---|
Jul 24 | $11,981 | $11,195 | $12,047 |
|---|
Aug 24 | $11,920 | $11,482 | $12,023 |
|---|
Sep 24 | $13,083 | $12,192 | $13,256 |
|---|
Oct 24 | $12,033 | $11,664 | $12,135 |
|---|
Nov 24 | $11,647 | $11,298 | $11,724 |
|---|
Dec 24 | $10,594 | $11,245 | $10,709 |
|---|
Jan 25 | $10,631 | $11,318 | $10,795 |
|---|
Feb 25 | $10,549 | $11,295 | $10,648 |
|---|
Mar 25 | $10,770 | $11,350 | $10,833 |
|---|
Apr 25 | $10,826 | $11,500 | $10,934 |
|---|
May 25 | $11,566 | $12,059 | $11,664 |
|---|
Jun 25 | $12,497 | $12,762 | $12,579 |
|---|
Jul 25 | $12,148 | $12,998 | $12,314 |
|---|
Aug 25 | $13,510 | $13,187 | $13,657 |
|---|
Sep 25 | $15,747 | $13,991 | $15,941 |
|---|
Oct 25 | $16,122 | $14,572 | $16,326 |
|---|
Nov 25 | $16,769 | $14,218 | $16,992 |
|---|
Dec 25 | $18,844 | $14,592 | $19,120 |
|---|
Jan 26 | $21,839 | $15,836 | $22,365 |
|---|
Feb 26 | $24,299 | $16,686 | $24,664 |
|---|
Mar 26 | $20,184 | $14,537 | $20,181 |
|---|
See “Average annual total returns” for additional information on fund performance. |
|
| No Deduction of Taxes [Text Block] |
|
Performance results do not reflect the deduction of taxes that a shareholder would pay on fund distributions or on the redemption or sale of fund shares.
|
|
| AssetsNet |
|
$ 402,758,081
|
|
| Holdings Count | Holding |
|
49
|
|
| Advisory Fees Paid, Amount |
|
$ 717,413
|
|
| InvestmentCompanyPortfolioTurnover |
|
24.00%
|
|
| Additional Fund Statistics [Text Block] |
|
Table SummaryNet Assets........................................................................................................................................................................................................................................................................................................................................................................................................................................................................................................................................................................................................................................................................................................................................................................................................................................................................................................................................................................................................................................ | $402,758,081 |
|---|
Number of Portfolio Holdings........................................................................................................................................................................................................................................................................................................................................................................................................................................................................................................................................................................................................................................................................................................................................................................................................................................................................................................................................................................................................................................ | 49 |
|---|
Net Investment Advisory Fees........................................................................................................................................................................................................................................................................................................................................................................................................................................................................................................................................................................................................................................................................................................................................................................................................................................................................................................................................................................................................................................ | $717,413 |
|---|
Portfolio Turnover Rate........................................................................................................................................................................................................................................................................................................................................................................................................................................................................................................................................................................................................................................................................................................................................................................................................................................................................................................................................................................................................................................ | 24% |
|---|
|
|
| C000238488 |
|
|
|
| Shareholder Report [Line Items] |
|
|
|
| Fund Name |
|
iShares Environmental Infrastructure and Industrials ETF
|
|
| Trading Symbol |
|
EFRA
|
|
| Security Exchange Name |
|
NASDAQ
|
|
| Annual or Semi-Annual Statement [Text Block] |
|
This annual shareholder report contains important information about iShares Environmental Infrastructure and Industrials ETF (the “Fund”) for the period of April 1, 2025 to March 31, 2026
|
|
| Additional Information [Text Block] |
|
You can find additional information about the Fund at blackrock.com/fundreports. You can also request this information by contacting us at 1-800-iShares (1-800-474-2737).
|
|
| Additional Information Phone Number |
|
1-800-474-2737
|
|
| Additional Information Website |
|
blackrock.com/fundreports
|
|
| Expenses [Text Block] |
|
What were the Fund costs for the last year?(based on a hypothetical $10,000 investment) Table SummaryFund name | Costs of a $10,000
investment | Costs paid as a percentage of a
$10,000 investment |
|---|
iShares Environmental Infrastructure and Industrials ETF | $51 | 0.47% |
|---|
|
|
| Expenses Paid, Amount |
|
$ 51
|
|
| Expense Ratio, Percent |
|
0.47%
|
|
| Performance Past Does Not Indicate Future [Text] |
|
Past performance is not an indication of future results.
|
|
| Line Graph [Table Text Block] |
|
Cumulative performance: November 1, 2022 through March 31, 2026 Initial investment of $10,000 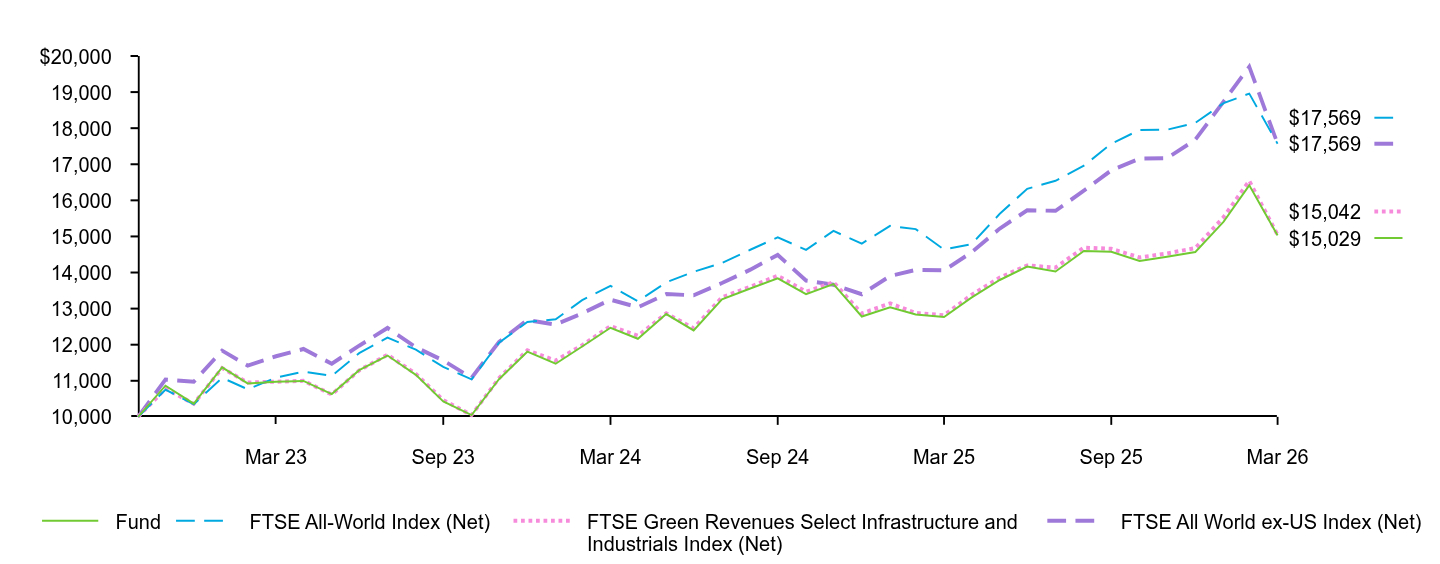 Table Summary | Fund | FTSE All-World Index (Net) | FTSE Green Revenues Select Infrastructure and Industrials Index (Net) | FTSE All World ex-US Index (Net) |
|---|
Oct 22 | $10,000 | $10,000 | $10,000 | $10,000 |
|---|
Nov 22 | $10,865 | $10,754 | $10,780 | $11,034 |
|---|
Dec 22 | $10,368 | $10,351 | $10,364 | $10,972 |
|---|
Jan 23 | $11,371 | $11,083 | $11,353 | $11,836 |
|---|
Feb 23 | $10,926 | $10,764 | $10,950 | $11,420 |
|---|
Mar 23 | $10,976 | $11,089 | $10,975 | $11,679 |
|---|
Apr 23 | $10,997 | $11,255 | $11,000 | $11,882 |
|---|
May 23 | $10,630 | $11,134 | $10,620 | $11,471 |
|---|
Jun 23 | $11,293 | $11,766 | $11,289 | $11,973 |
|---|
Jul 23 | $11,700 | $12,196 | $11,722 | $12,465 |
|---|
Aug 23 | $11,166 | $11,863 | $11,192 | $11,927 |
|---|
Sep 23 | $10,427 | $11,383 | $10,465 | $11,564 |
|---|
Oct 23 | $10,048 | $11,041 | $10,050 | $11,081 |
|---|
Nov 23 | $11,043 | $12,054 | $11,072 | $12,076 |
|---|
Dec 23 | $11,807 | $12,629 | $11,846 | $12,685 |
|---|
Jan 24 | $11,472 | $12,702 | $11,560 | $12,558 |
|---|
Feb 24 | $11,950 | $13,236 | $11,985 | $12,870 |
|---|
Mar 24 | $12,469 | $13,633 | $12,516 | $13,247 |
|---|
Apr 24 | $12,164 | $13,201 | $12,249 | $13,037 |
|---|
May 24 | $12,849 | $13,729 | $12,868 | $13,402 |
|---|
Jun 24 | $12,396 | $14,021 | $12,455 | $13,369 |
|---|
Jul 24 | $13,258 | $14,265 | $13,315 | $13,710 |
|---|
Aug 24 | $13,556 | $14,631 | $13,605 | $14,079 |
|---|
Sep 24 | $13,839 | $14,976 | $13,912 | $14,488 |
|---|
Oct 24 | $13,402 | $14,626 | $13,468 | $13,776 |
|---|
Nov 24 | $13,680 | $15,153 | $13,735 | $13,660 |
|---|
Dec 24 | $12,781 | $14,801 | $12,865 | $13,399 |
|---|
Jan 25 | $13,036 | $15,292 | $13,144 | $13,905 |
|---|
Feb 25 | $12,835 | $15,203 | $12,879 | $14,071 |
|---|
Mar 25 | $12,766 | $14,636 | $12,815 | $14,059 |
|---|
Apr 25 | $13,304 | $14,785 | $13,380 | $14,558 |
|---|
May 25 | $13,793 | $15,626 | $13,861 | $15,219 |
|---|
Jun 25 | $14,167 | $16,320 | $14,196 | $15,725 |
|---|
Jul 25 | $14,028 | $16,541 | $14,138 | $15,710 |
|---|
Aug 25 | $14,599 | $16,960 | $14,690 | $16,270 |
|---|
Sep 25 | $14,576 | $17,569 | $14,658 | $16,831 |
|---|
Oct 25 | $14,321 | $17,950 | $14,416 | $17,157 |
|---|
Nov 25 | $14,434 | $17,957 | $14,527 | $17,167 |
|---|
Dec 25 | $14,568 | $18,148 | $14,679 | $17,680 |
|---|
Jan 26 | $15,408 | $18,693 | $15,539 | $18,742 |
|---|
Feb 26 | $16,416 | $18,958 | $16,545 | $19,703 |
|---|
Mar 26 | $15,029 | $17,569 | $15,042 | $17,569 |
|---|
See “Average annual total returns” for additional information on fund performance. |
|
| Performance Inception Date |
|
Nov. 01, 2022
|
|
| No Deduction of Taxes [Text Block] |
|
Performance results do not reflect the deduction of taxes that a shareholder would pay on fund distributions or on the redemption or sale of fund shares.
|
|
| AssetsNet |
|
$ 5,483,931
|
|
| Holdings Count | Holding |
|
81
|
|
| Advisory Fees Paid, Amount |
|
$ 25,360
|
|
| InvestmentCompanyPortfolioTurnover |
|
24.00%
|
|
| Additional Fund Statistics [Text Block] |
|
Table SummaryNet Assets........................................................................................................................................................................................................................................................................................................................................................................................................................................................................................................................................................................................................................................................................................................................................................................................................................................................................................................................................................................................................................................ | $5,483,931 |
|---|
Number of Portfolio Holdings........................................................................................................................................................................................................................................................................................................................................................................................................................................................................................................................................................................................................................................................................................................................................................................................................................................................................................................................................................................................................................................ | 81 |
|---|
Net Investment Advisory Fees........................................................................................................................................................................................................................................................................................................................................................................................................................................................................................................................................................................................................................................................................................................................................................................................................................................................................................................................................................................................................................................ | $25,360 |
|---|
Portfolio Turnover Rate........................................................................................................................................................................................................................................................................................................................................................................................................................................................................................................................................................................................................................................................................................................................................................................................................................................................................................................................................................................................................................................ | 24% |
|---|
|
|
| C000012056 |
|
|
|
| Shareholder Report [Line Items] |
|
|
|
| Fund Name |
|
iShares Global 100 ETF
|
|
| Trading Symbol |
|
IOO
|
|
| Security Exchange Name |
|
NYSEArca
|
|
| Annual or Semi-Annual Statement [Text Block] |
|
This annual shareholder report contains important information about iShares Global 100 ETF (the “Fund”) for the period of April 1, 2025 to March 31, 2026
|
|
| Additional Information [Text Block] |
|
You can find additional information about the Fund at blackrock.com/fundreports. You can also request this information by contacting us at 1-800-iShares (1-800-474-2737).
|
|
| Additional Information Phone Number |
|
1-800-474-2737
|
|
| Additional Information Website |
|
blackrock.com/fundreports
|
|
| Expenses [Text Block] |
|
What were the Fund costs for the last year?(based on a hypothetical $10,000 investment) Table SummaryFund name | Costs of a $10,000
investment | Costs paid as a percentage of a
$10,000 investment |
|---|
iShares Global 100 ETF | $45 | 0.40% |
|---|
|
|
| Expenses Paid, Amount |
|
$ 45
|
|
| Expense Ratio, Percent |
|
0.40%
|
|
| Performance Past Does Not Indicate Future [Text] |
|
Past performance is not an indication of future results.
|
|
| Line Graph [Table Text Block] |
|
Cumulative performance: April 1, 2016 through March 31, 2026 Initial investment of $10,000 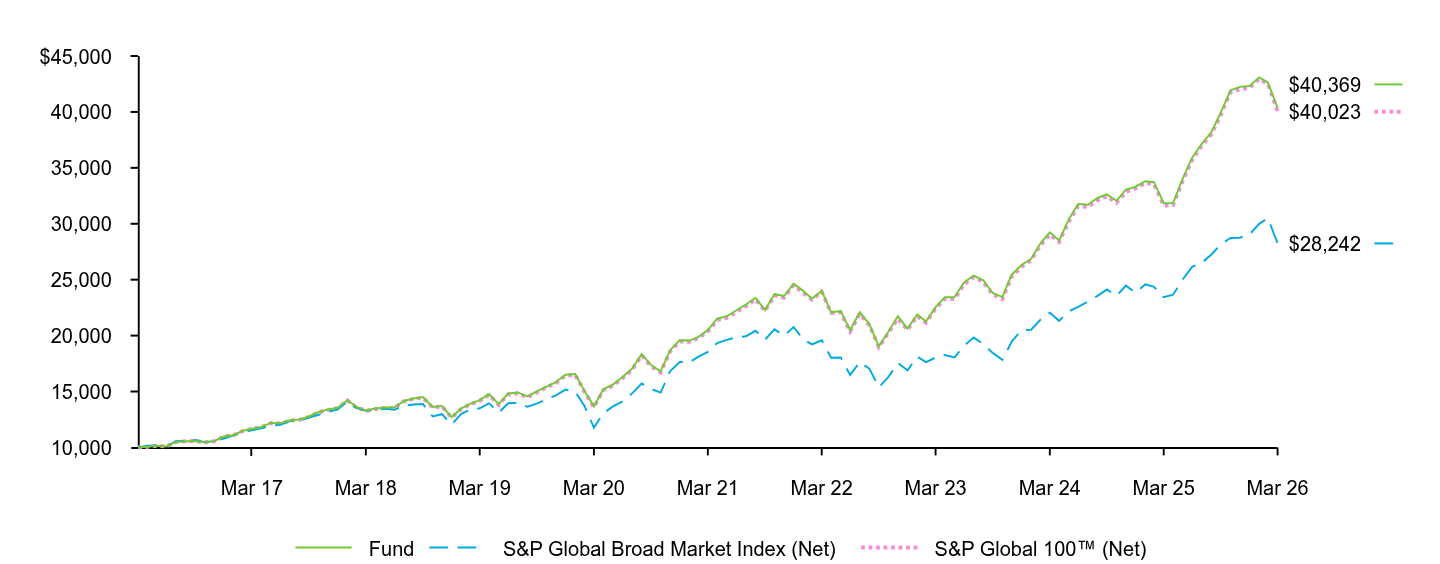 Table Summary | Fund | S&P Global Broad Market Index (Net) | S&P Global 100™ (Net) |
|---|
Mar 16 | $10,000 | $10,000 | $10,000 |
|---|
Apr 16 | $10,054 | $10,161 | $10,055 |
|---|
May 16 | $10,159 | $10,176 | $10,154 |
|---|
Jun 16 | $10,095 | $10,102 | $10,088 |
|---|
Jul 16 | $10,493 | $10,554 | $10,488 |
|---|
Aug 16 | $10,552 | $10,592 | $10,545 |
|---|
Sep 16 | $10,580 | $10,669 | $10,570 |
|---|
Oct 16 | $10,466 | $10,466 | $10,460 |
|---|
Nov 16 | $10,563 | $10,573 | $10,557 |
|---|
Dec 16 | $10,979 | $10,800 | $10,967 |
|---|
Jan 17 | $11,091 | $11,095 | $11,082 |
|---|
Feb 17 | $11,471 | $11,400 | $11,458 |
|---|
Mar 17 | $11,666 | $11,535 | $11,655 |
|---|
Apr 17 | $11,833 | $11,720 | $11,818 |
|---|
May 17 | $12,195 | $11,959 | $12,177 |
|---|
Jun 17 | $12,159 | $12,032 | $12,138 |
|---|
Jul 17 | $12,422 | $12,362 | $12,400 |
|---|
Aug 17 | $12,492 | $12,406 | $12,467 |
|---|
Sep 17 | $12,765 | $12,670 | $12,737 |
|---|
Oct 17 | $13,173 | $12,928 | $13,150 |
|---|
Nov 17 | $13,388 | $13,182 | $13,358 |
|---|
Dec 17 | $13,547 | $13,398 | $13,518 |
|---|
Jan 18 | $14,230 | $14,119 | $14,201 |
|---|
Feb 18 | $13,646 | $13,533 | $13,613 |
|---|
Mar 18 | $13,296 | $13,271 | $13,264 |
|---|
Apr 18 | $13,477 | $13,402 | $13,445 |
|---|
May 18 | $13,560 | $13,453 | $13,518 |
|---|
Jun 18 | $13,573 | $13,364 | $13,537 |
|---|
Jul 18 | $14,157 | $13,728 | $14,129 |
|---|
Aug 18 | $14,376 | $13,849 | $14,343 |
|---|
Sep 18 | $14,500 | $13,873 | $14,459 |
|---|
Oct 18 | $13,618 | $12,779 | $13,576 |
|---|
Nov 18 | $13,709 | $12,976 | $13,665 |
|---|
Dec 18 | $12,707 | $12,038 | $12,664 |
|---|
Jan 19 | $13,485 | $13,007 | $13,447 |
|---|
Feb 19 | $13,895 | $13,364 | $13,847 |
|---|
Mar 19 | $14,227 | $13,499 | $14,172 |
|---|
Apr 19 | $14,768 | $13,941 | $14,705 |
|---|
May 19 | $13,868 | $13,118 | $13,796 |
|---|
Jun 19 | $14,826 | $13,954 | $14,739 |
|---|
Jul 19 | $14,920 | $13,986 | $14,842 |
|---|
Aug 19 | $14,559 | $13,638 | $14,478 |
|---|
Sep 19 | $15,005 | $13,920 | $14,924 |
|---|
Oct 19 | $15,435 | $14,308 | $15,361 |
|---|
Nov 19 | $15,839 | $14,658 | $15,757 |
|---|
Dec 19 | $16,497 | $15,176 | $16,416 |
|---|
Jan 20 | $16,570 | $14,971 | $16,491 |
|---|
Feb 20 | $15,091 | $13,749 | $15,014 |
|---|
Mar 20 | $13,670 | $11,771 | $13,598 |
|---|
Apr 20 | $15,195 | $13,056 | $15,111 |
|---|
May 20 | $15,617 | $13,664 | $15,526 |
|---|
Jun 20 | $16,273 | $14,100 | $16,180 |
|---|
Jul 20 | $17,036 | $14,812 | $16,941 |
|---|
Aug 20 | $18,347 | $15,713 | $18,233 |
|---|
Sep 20 | $17,363 | $15,227 | $17,267 |
|---|
Oct 20 | $16,801 | $14,902 | $16,710 |
|---|
Nov 20 | $18,687 | $16,802 | $18,582 |
|---|
Dec 20 | $19,577 | $17,637 | $19,482 |
|---|
Jan 21 | $19,553 | $17,609 | $19,447 |
|---|
Feb 21 | $19,867 | $18,091 | $19,757 |
|---|
Mar 21 | $20,488 | $18,540 | $20,372 |
|---|
Apr 21 | $21,517 | $19,333 | $21,393 |
|---|
May 21 | $21,728 | $19,618 | $21,596 |
|---|
Jun 21 | $22,244 | $19,854 | $22,107 |
|---|
Jul 21 | $22,767 | $19,937 | $22,634 |
|---|
Aug 21 | $23,382 | $20,432 | $23,257 |
|---|
Sep 21 | $22,281 | $19,630 | $22,196 |
|---|
Oct 21 | $23,711 | $20,556 | $23,592 |
|---|
Nov 21 | $23,533 | $19,979 | $23,392 |
|---|
Dec 21 | $24,630 | $20,759 | $24,512 |
|---|
Jan 22 | $23,995 | $19,665 | $23,810 |
|---|
Feb 22 | $23,296 | $19,217 | $23,206 |
|---|
Mar 22 | $23,995 | $19,586 | $23,933 |
|---|
Apr 22 | $22,088 | $18,025 | $22,038 |
|---|
May 22 | $22,187 | $18,033 | $22,067 |
|---|
Jun 22 | $20,490 | $16,485 | $20,361 |
|---|
Jul 22 | $22,085 | $17,643 | $21,944 |
|---|
Aug 22 | $21,003 | $17,032 | $20,921 |
|---|
Sep 22 | $19,030 | $15,382 | $18,967 |
|---|
Oct 22 | $20,365 | $16,305 | $20,268 |
|---|
Nov 22 | $21,726 | $17,550 | $21,517 |
|---|
Dec 22 | $20,621 | $16,891 | $20,508 |
|---|
Jan 23 | $21,889 | $18,127 | $21,744 |
|---|
Feb 23 | $21,246 | $17,621 | $21,160 |
|---|
Mar 23 | $22,549 | $18,040 | $22,418 |
|---|
Apr 23 | $23,422 | $18,266 | $23,292 |
|---|
May 23 | $23,449 | $18,045 | $23,279 |
|---|
Jun 23 | $24,758 | $19,093 | $24,590 |
|---|
Jul 23 | $25,369 | $19,825 | $25,228 |
|---|
Aug 23 | $24,936 | $19,247 | $24,793 |
|---|
Sep 23 | $23,805 | $18,449 | $23,683 |
|---|
Oct 23 | $23,445 | $17,826 | $23,271 |
|---|
Nov 23 | $25,446 | $19,467 | $25,292 |
|---|
Dec 23 | $26,314 | $20,492 | $26,155 |
|---|
Jan 24 | $26,839 | $20,530 | $26,740 |
|---|
Feb 24 | $28,196 | $21,398 | $28,035 |
|---|
Mar 24 | $29,225 | $22,051 | $29,045 |
|---|
Apr 24 | $28,499 | $21,322 | $28,371 |
|---|
May 24 | $30,414 | $22,172 | $30,190 |
|---|
Jun 24 | $31,757 | $22,562 | $31,575 |
|---|
Jul 24 | $31,696 | $23,036 | $31,511 |
|---|
Aug 24 | $32,302 | $23,561 | $32,100 |
|---|
Sep 24 | $32,629 | $24,119 | $32,456 |
|---|
Oct 24 | $32,058 | $23,562 | $31,877 |
|---|
Nov 24 | $33,062 | $24,472 | $32,862 |
|---|
Dec 24 | $33,314 | $23,820 | $33,153 |
|---|
Jan 25 | $33,803 | $24,581 | $33,653 |
|---|
Feb 25 | $33,720 | $24,360 | $33,517 |
|---|
Mar 25 | $31,843 | $23,428 | $31,629 |
|---|
Apr 25 | $31,846 | $23,653 | $31,675 |
|---|
May 25 | $34,031 | $25,016 | $33,842 |
|---|
Jun 25 | $35,901 | $26,146 | $35,682 |
|---|
Jul 25 | $37,144 | $26,502 | $37,005 |
|---|
Aug 25 | $38,195 | $27,248 | $38,003 |
|---|
Sep 25 | $39,946 | $28,166 | $39,723 |
|---|
Oct 25 | $41,940 | $28,727 | $41,745 |
|---|
Nov 25 | $42,239 | $28,753 | $42,035 |
|---|
Dec 25 | $42,324 | $29,050 | $42,157 |
|---|
Jan 26 | $43,091 | $29,995 | $42,955 |
|---|
Feb 26 | $42,627 | $30,491 | $42,486 |
|---|
Mar 26 | $40,369 | $28,242 | $40,023 |
|---|
See “Average annual total returns” for additional information on fund performance. |
|
| No Deduction of Taxes [Text Block] |
|
Performance results do not reflect the deduction of taxes that a shareholder would pay on fund distributions or on the redemption or sale of fund shares.
|
|
| AssetsNet |
|
$ 7,586,191,393
|
|
| Holdings Count | Holding |
|
105
|
|
| Advisory Fees Paid, Amount |
|
$ 28,790,465
|
|
| InvestmentCompanyPortfolioTurnover |
|
2.00%
|
|
| Additional Fund Statistics [Text Block] |
|
Table SummaryNet Assets........................................................................................................................................................................................................................................................................................................................................................................................................................................................................................................................................................................................................................................................................................................................................................................................................................................................................................................................................................................................................................................ | $7,586,191,393 |
|---|
Number of Portfolio Holdings........................................................................................................................................................................................................................................................................................................................................................................................................................................................................................................................................................................................................................................................................................................................................................................................................................................................................................................................................................................................................................................ | 105 |
|---|
Net Investment Advisory Fees........................................................................................................................................................................................................................................................................................................................................................................................................................................................................................................................................................................................................................................................................................................................................................................................................................................................................................................................................................................................................................................ | $28,790,465 |
|---|
Portfolio Turnover Rate........................................................................................................................................................................................................................................................................................................................................................................................................................................................................................................................................................................................................................................................................................................................................................................................................................................................................................................................................................................................................................................ | 2% |
|---|
|
|
| C000053784 |
|
|
|
| Shareholder Report [Line Items] |
|
|
|
| Fund Name |
|
iShares Global Infrastructure ETF
|
|
| Trading Symbol |
|
IGF
|
|
| Security Exchange Name |
|
NASDAQ
|
|
| Annual or Semi-Annual Statement [Text Block] |
|
This annual shareholder report contains important information about iShares Global Infrastructure ETF (the “Fund”) for the period of April 1, 2025 to March 31, 2026
|
|
| Additional Information [Text Block] |
|
You can find additional information about the Fund at blackrock.com/fundreports. You can also request this information by contacting us at 1-800-iShares (1-800-474-2737).
|
|
| Additional Information Phone Number |
|
1-800-474-2737
|
|
| Additional Information Website |
|
blackrock.com/fundreports
|
|
| Expenses [Text Block] |
|
What were the Fund costs for the last year?(based on a hypothetical $10,000 investment) Table SummaryFund name | Costs of a $10,000
investment | Costs paid as a percentage of a
$10,000 investment |
|---|
iShares Global Infrastructure ETF | $42 | 0.37% |
|---|
|
|
| Expenses Paid, Amount |
|
$ 42
|
|
| Expense Ratio, Percent |
|
0.37%
|
|
| Performance Past Does Not Indicate Future [Text] |
|
Past performance is not an indication of future results.
|
|
| Line Graph [Table Text Block] |
|
Cumulative performance: April 1, 2016 through March 31, 2026 Initial investment of $10,000 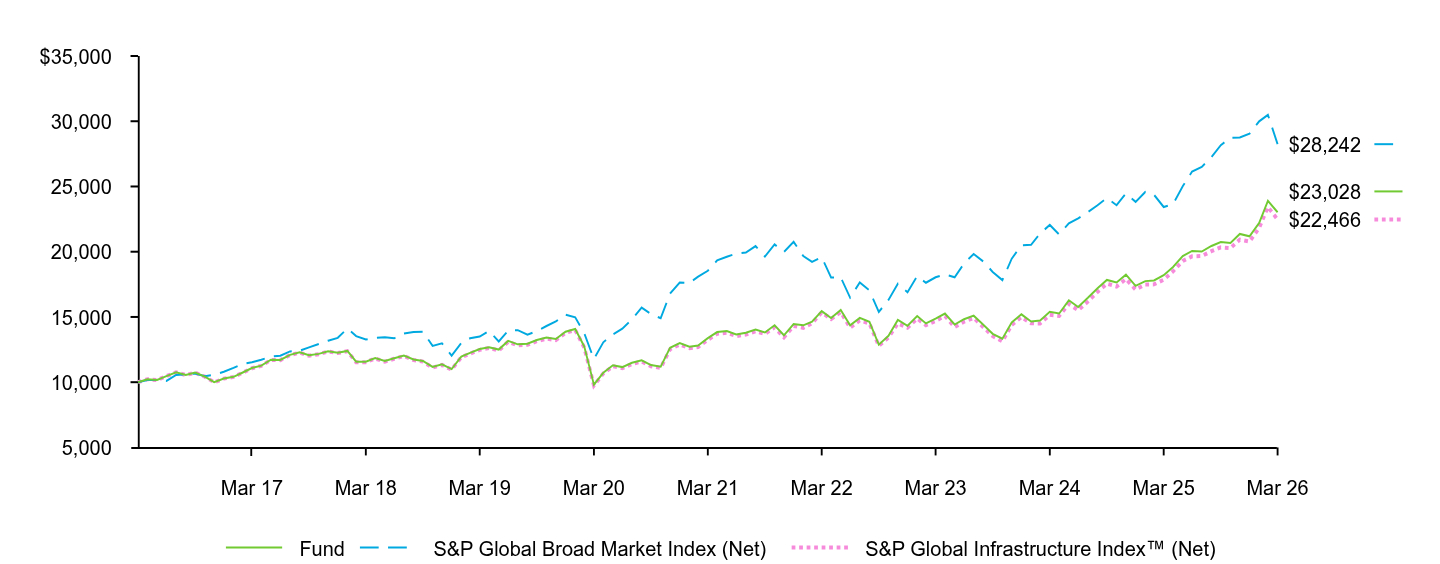 Table Summary | Fund | S&P Global Broad Market Index (Net) | S&P Global Infrastructure Index™ (Net) |
|---|
Mar 16 | $10,000 | $10,000 | $10,000 |
|---|
Apr 16 | $10,225 | $10,161 | $10,228 |
|---|
May 16 | $10,168 | $10,176 | $10,166 |
|---|
Jun 16 | $10,466 | $10,102 | $10,464 |
|---|
Jul 16 | $10,751 | $10,554 | $10,753 |
|---|
Aug 16 | $10,557 | $10,592 | $10,547 |
|---|
Sep 16 | $10,741 | $10,669 | $10,731 |
|---|
Oct 16 | $10,432 | $10,466 | $10,426 |
|---|
Nov 16 | $10,004 | $10,573 | $9,993 |
|---|
Dec 16 | $10,278 | $10,800 | $10,272 |
|---|
Jan 17 | $10,412 | $11,095 | $10,408 |
|---|
Feb 17 | $10,725 | $11,400 | $10,711 |
|---|
Mar 17 | $11,085 | $11,535 | $11,069 |
|---|
Apr 17 | $11,266 | $11,720 | $11,253 |
|---|
May 17 | $11,729 | $11,959 | $11,711 |
|---|
Jun 17 | $11,708 | $12,032 | $11,692 |
|---|
Jul 17 | $12,093 | $12,362 | $12,077 |
|---|
Aug 17 | $12,285 | $12,406 | $12,263 |
|---|
Sep 17 | $12,063 | $12,670 | $12,036 |
|---|
Oct 17 | $12,170 | $12,928 | $12,148 |
|---|
Nov 17 | $12,376 | $13,182 | $12,350 |
|---|
Dec 17 | $12,257 | $13,398 | $12,231 |
|---|
Jan 18 | $12,398 | $14,119 | $12,369 |
|---|
Feb 18 | $11,567 | $13,533 | $11,532 |
|---|
Mar 18 | $11,569 | $13,271 | $11,534 |
|---|
Apr 18 | $11,848 | $13,402 | $11,813 |
|---|
May 18 | $11,621 | $13,453 | $11,581 |
|---|
Jun 18 | $11,829 | $13,364 | $11,793 |
|---|
Jul 18 | $12,038 | $13,728 | $12,000 |
|---|
Aug 18 | $11,746 | $13,849 | $11,700 |
|---|
Sep 18 | $11,628 | $13,873 | $11,581 |
|---|
Oct 18 | $11,166 | $12,779 | $11,121 |
|---|
Nov 18 | $11,372 | $12,976 | $11,324 |
|---|
Dec 18 | $11,007 | $12,038 | $10,962 |
|---|
Jan 19 | $11,962 | $13,007 | $11,915 |
|---|
Feb 19 | $12,245 | $13,364 | $12,187 |
|---|
Mar 19 | $12,542 | $13,499 | $12,479 |
|---|
Apr 19 | $12,684 | $13,941 | $12,624 |
|---|
May 19 | $12,502 | $13,118 | $12,431 |
|---|
Jun 19 | $13,167 | $13,954 | $13,095 |
|---|
Jul 19 | $12,902 | $13,986 | $12,830 |
|---|
Aug 19 | $12,953 | $13,638 | $12,869 |
|---|
Sep 19 | $13,229 | $13,920 | $13,141 |
|---|
Oct 19 | $13,423 | $14,308 | $13,339 |
|---|
Nov 19 | $13,312 | $14,658 | $13,224 |
|---|
Dec 19 | $13,870 | $15,176 | $13,785 |
|---|
Jan 20 | $14,082 | $14,971 | $14,002 |
|---|
Feb 20 | $12,741 | $13,749 | $12,657 |
|---|
Mar 20 | $9,813 | $11,771 | $9,745 |
|---|
Apr 20 | $10,720 | $13,056 | $10,661 |
|---|
May 20 | $11,299 | $13,664 | $11,222 |
|---|
Jun 20 | $11,157 | $14,100 | $11,072 |
|---|
Jul 20 | $11,485 | $14,812 | $11,398 |
|---|
Aug 20 | $11,672 | $15,713 | $11,579 |
|---|
Sep 20 | $11,315 | $15,227 | $11,224 |
|---|
Oct 20 | $11,189 | $14,902 | $11,099 |
|---|
Nov 20 | $12,630 | $16,802 | $12,523 |
|---|
Dec 20 | $12,999 | $17,637 | $12,890 |
|---|
Jan 21 | $12,720 | $17,609 | $12,612 |
|---|
Feb 21 | $12,815 | $18,091 | $12,701 |
|---|
Mar 21 | $13,373 | $18,540 | $13,251 |
|---|
Apr 21 | $13,842 | $19,333 | $13,716 |
|---|
May 21 | $13,919 | $19,618 | $13,785 |
|---|
Jun 21 | $13,658 | $19,854 | $13,533 |
|---|
Jul 21 | $13,794 | $19,937 | $13,657 |
|---|
Aug 21 | $14,035 | $20,432 | $13,896 |
|---|
Sep 21 | $13,809 | $19,630 | $13,707 |
|---|
Oct 21 | $14,363 | $20,556 | $14,199 |
|---|
Nov 21 | $13,592 | $19,979 | $13,433 |
|---|
Dec 21 | $14,457 | $20,759 | $14,313 |
|---|
Jan 22 | $14,359 | $19,665 | $14,163 |
|---|
Feb 22 | $14,645 | $19,217 | $14,508 |
|---|
Mar 22 | $15,452 | $19,586 | $15,354 |
|---|
Apr 22 | $14,912 | $18,025 | $14,845 |
|---|
May 22 | $15,542 | $18,033 | $15,376 |
|---|
Jun 22 | $14,360 | $16,485 | $14,178 |
|---|
Jul 22 | $14,926 | $17,643 | $14,737 |
|---|
Aug 22 | $14,624 | $17,032 | $14,504 |
|---|
Sep 22 | $12,876 | $15,382 | $12,787 |
|---|
Oct 22 | $13,562 | $16,305 | $13,429 |
|---|
Nov 22 | $14,770 | $17,550 | $14,503 |
|---|
Dec 22 | $14,320 | $16,891 | $14,172 |
|---|
Jan 23 | $15,070 | $18,127 | $14,878 |
|---|
Feb 23 | $14,502 | $17,621 | $14,369 |
|---|
Mar 23 | $14,874 | $18,040 | $14,700 |
|---|
Apr 23 | $15,259 | $18,266 | $15,078 |
|---|
May 23 | $14,421 | $18,045 | $14,222 |
|---|
Jun 23 | $14,829 | $19,093 | $14,639 |
|---|
Jul 23 | $15,098 | $19,825 | $14,927 |
|---|
Aug 23 | $14,397 | $19,247 | $14,217 |
|---|
Sep 23 | $13,706 | $18,449 | $13,541 |
|---|
Oct 23 | $13,336 | $17,826 | $13,129 |
|---|
Nov 23 | $14,582 | $19,467 | $14,393 |
|---|
Dec 23 | $15,201 | $20,492 | $14,991 |
|---|
Jan 24 | $14,651 | $20,530 | $14,512 |
|---|
Feb 24 | $14,721 | $21,398 | $14,502 |
|---|
Mar 24 | $15,395 | $22,051 | $15,161 |
|---|
Apr 24 | $15,264 | $21,322 | $15,073 |
|---|
May 24 | $16,279 | $22,172 | $15,998 |
|---|
Jun 24 | $15,762 | $22,562 | $15,512 |
|---|
Jul 24 | $16,464 | $23,036 | $16,187 |
|---|
Aug 24 | $17,203 | $23,561 | $16,924 |
|---|
Sep 24 | $17,837 | $24,119 | $17,559 |
|---|
Oct 24 | $17,643 | $23,562 | $17,332 |
|---|
Nov 24 | $18,243 | $24,472 | $17,911 |
|---|
Dec 24 | $17,381 | $23,820 | $17,097 |
|---|
Jan 25 | $17,746 | $24,581 | $17,485 |
|---|
Feb 25 | $17,801 | $24,360 | $17,497 |
|---|
Mar 25 | $18,201 | $23,428 | $17,852 |
|---|
Apr 25 | $18,835 | $23,653 | $18,499 |
|---|
May 25 | $19,661 | $25,016 | $19,291 |
|---|
Jun 25 | $20,057 | $26,146 | $19,645 |
|---|
Jul 25 | $20,015 | $26,502 | $19,667 |
|---|
Aug 25 | $20,439 | $27,248 | $20,040 |
|---|
Sep 25 | $20,740 | $28,166 | $20,333 |
|---|
Oct 25 | $20,670 | $28,727 | $20,276 |
|---|
Nov 25 | $21,362 | $28,753 | $20,933 |
|---|
Dec 25 | $21,180 | $29,050 | $20,780 |
|---|
Jan 26 | $22,210 | $29,995 | $21,825 |
|---|
Feb 26 | $23,905 | $30,491 | $23,433 |
|---|
Mar 26 | $23,028 | $28,242 | $22,466 |
|---|
See “Average annual total returns” for additional information on fund performance. |
|
| No Deduction of Taxes [Text Block] |
|
Performance results do not reflect the deduction of taxes that a shareholder would pay on fund distributions or on the redemption or sale of fund shares.
|
|
| AssetsNet |
|
$ 10,132,857,289
|
|
| Holdings Count | Holding |
|
82
|
|
| Advisory Fees Paid, Amount |
|
$ 30,773,902
|
|
| InvestmentCompanyPortfolioTurnover |
|
11.00%
|
|
| Additional Fund Statistics [Text Block] |
|
Table SummaryNet Assets........................................................................................................................................................................................................................................................................................................................................................................................................................................................................................................................................................................................................................................................................................................................................................................................................................................................................................................................................................................................................................................ | $10,132,857,289 |
|---|
Number of Portfolio Holdings........................................................................................................................................................................................................................................................................................................................................................................................................................................................................................................................................................................................................................................................................................................................................................................................................................................................................................................................................................................................................................................ | 82 |
|---|
Net Investment Advisory Fees........................................................................................................................................................................................................................................................................................................................................................................................................................................................................................................................................................................................................................................................................................................................................................................................................................................................................................................................................................................................................................................ | $30,773,902 |
|---|
Portfolio Turnover Rate........................................................................................................................................................................................................................................................................................................................................................................................................................................................................................................................................................................................................................................................................................................................................................................................................................................................................................................................................................................................................................................ | 11% |
|---|
|
|
| C000065076 |
|
|
|
| Shareholder Report [Line Items] |
|
|
|
| Fund Name |
|
iShares Global Timber & Forestry ETF
|
|
| Trading Symbol |
|
WOOD
|
|
| Security Exchange Name |
|
NASDAQ
|
|
| Annual or Semi-Annual Statement [Text Block] |
|
This annual shareholder report contains important information about iShares Global Timber & Forestry ETF (the “Fund”) for the period of April 1, 2025 to March 31, 2026
|
|
| Additional Information [Text Block] |
|
You can find additional information about the Fund at blackrock.com/fundreports. You can also request this information by contacting us at 1-800-iShares (1-800-474-2737).
|
|
| Additional Information Phone Number |
|
1-800-474-2737
|
|
| Additional Information Website |
|
blackrock.com/fundreports
|
|
| Expenses [Text Block] |
|
What were the Fund costs for the last year?(based on a hypothetical $10,000 investment) Table SummaryFund name | Costs of a $10,000
investment | Costs paid as a percentage of a
$10,000 investment |
|---|
iShares Global Timber & Forestry ETF | $39 | 0.40% |
|---|
|
|
| Expenses Paid, Amount |
|
$ 39
|
|
| Expense Ratio, Percent |
|
0.40%
|
|
| Performance Past Does Not Indicate Future [Text] |
|
Past performance is not an indication of future results.
|
|
| Line Graph [Table Text Block] |
|
Cumulative performance: April 1, 2016 through March 31, 2026 Initial investment of $10,000 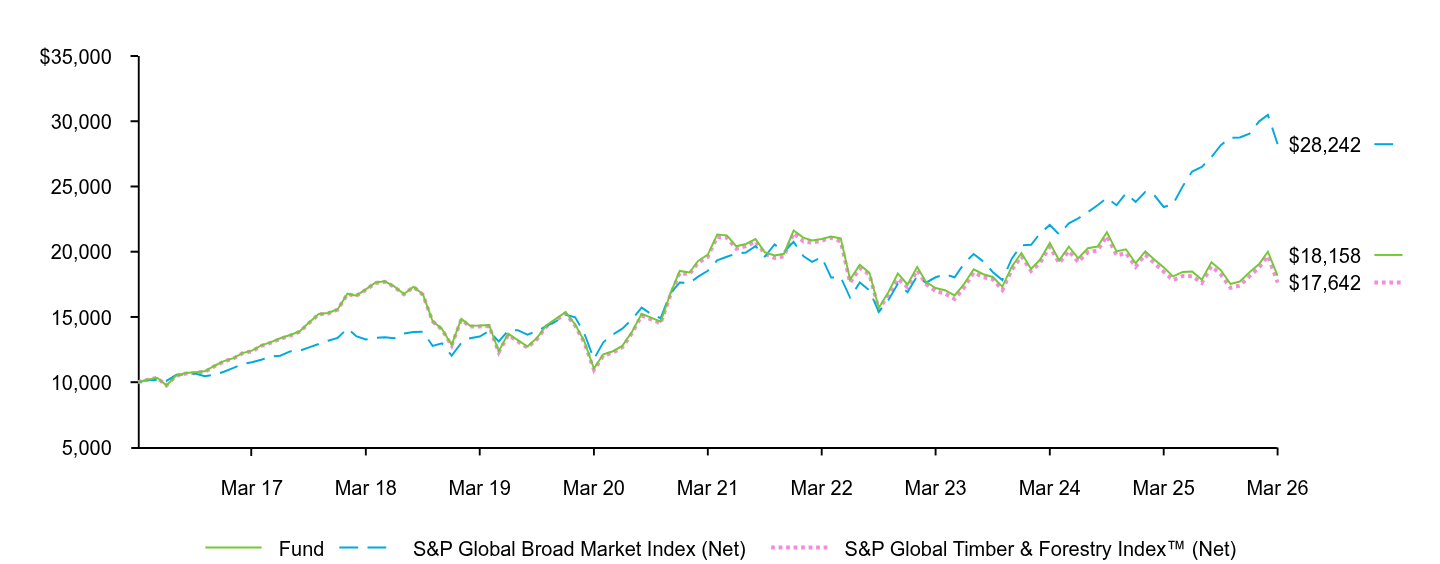 Table Summary | Fund | S&P Global Broad Market Index (Net) | S&P Global Timber & Forestry Index™ (Net) |
|---|
Mar 16 | $10,000 | $10,000 | $10,000 |
|---|
Apr 16 | $10,183 | $10,161 | $10,178 |
|---|
May 16 | $10,336 | $10,176 | $10,331 |
|---|
Jun 16 | $9,757 | $10,102 | $9,746 |
|---|
Jul 16 | $10,506 | $10,554 | $10,499 |
|---|
Aug 16 | $10,706 | $10,592 | $10,667 |
|---|
Sep 16 | $10,758 | $10,669 | $10,712 |
|---|
Oct 16 | $10,831 | $10,466 | $10,792 |
|---|
Nov 16 | $11,242 | $10,573 | $11,207 |
|---|
Dec 16 | $11,614 | $10,800 | $11,582 |
|---|
Jan 17 | $11,845 | $11,095 | $11,816 |
|---|
Feb 17 | $12,232 | $11,400 | $12,204 |
|---|
Mar 17 | $12,418 | $11,535 | $12,376 |
|---|
Apr 17 | $12,821 | $11,720 | $12,777 |
|---|
May 17 | $13,072 | $11,959 | $13,028 |
|---|
Jun 17 | $13,370 | $12,032 | $13,324 |
|---|
Jul 17 | $13,611 | $12,362 | $13,567 |
|---|
Aug 17 | $13,900 | $12,406 | $13,858 |
|---|
Sep 17 | $14,578 | $12,670 | $14,531 |
|---|
Oct 17 | $15,228 | $12,928 | $15,196 |
|---|
Nov 17 | $15,304 | $13,182 | $15,271 |
|---|
Dec 17 | $15,595 | $13,398 | $15,563 |
|---|
Jan 18 | $16,784 | $14,119 | $16,757 |
|---|
Feb 18 | $16,634 | $13,533 | $16,611 |
|---|
Mar 18 | $17,112 | $13,271 | $17,077 |
|---|
Apr 18 | $17,632 | $13,402 | $17,598 |
|---|
May 18 | $17,729 | $13,453 | $17,700 |
|---|
Jun 18 | $17,341 | $13,364 | $17,308 |
|---|
Jul 18 | $16,763 | $13,728 | $16,735 |
|---|
Aug 18 | $17,319 | $13,849 | $17,295 |
|---|
Sep 18 | $16,734 | $13,873 | $16,705 |
|---|
Oct 18 | $14,689 | $12,779 | $14,661 |
|---|
Nov 18 | $14,080 | $12,976 | $14,043 |
|---|
Dec 18 | $12,855 | $12,038 | $12,810 |
|---|
Jan 19 | $14,850 | $13,007 | $14,805 |
|---|
Feb 19 | $14,320 | $13,364 | $14,270 |
|---|
Mar 19 | $14,337 | $13,499 | $14,276 |
|---|
Apr 19 | $14,376 | $13,941 | $14,297 |
|---|
May 19 | $12,370 | $13,118 | $12,284 |
|---|
Jun 19 | $13,715 | $13,954 | $13,621 |
|---|
Jul 19 | $13,218 | $13,986 | $13,131 |
|---|
Aug 19 | $12,737 | $13,638 | $12,650 |
|---|
Sep 19 | $13,385 | $13,920 | $13,287 |
|---|
Oct 19 | $14,367 | $14,308 | $14,270 |
|---|
Nov 19 | $14,853 | $14,658 | $14,754 |
|---|
Dec 19 | $15,372 | $15,176 | $15,264 |
|---|
Jan 20 | $14,416 | $14,971 | $14,320 |
|---|
Feb 20 | $13,143 | $13,749 | $13,051 |
|---|
Mar 20 | $11,035 | $11,771 | $10,941 |
|---|
Apr 20 | $12,140 | $13,056 | $12,037 |
|---|
May 20 | $12,372 | $13,664 | $12,270 |
|---|
Jun 20 | $12,785 | $14,100 | $12,674 |
|---|
Jul 20 | $13,866 | $14,812 | $13,751 |
|---|
Aug 20 | $15,238 | $15,713 | $15,109 |
|---|
Sep 20 | $14,949 | $15,227 | $14,820 |
|---|
Oct 20 | $14,629 | $14,902 | $14,510 |
|---|
Nov 20 | $16,735 | $16,802 | $16,600 |
|---|
Dec 20 | $18,526 | $17,637 | $18,376 |
|---|
Jan 21 | $18,405 | $17,609 | $18,263 |
|---|
Feb 21 | $19,297 | $18,091 | $19,154 |
|---|
Mar 21 | $19,778 | $18,540 | $19,613 |
|---|
Apr 21 | $21,320 | $19,333 | $21,138 |
|---|
May 21 | $21,255 | $19,618 | $21,083 |
|---|
Jun 21 | $20,416 | $19,854 | $20,227 |
|---|
Jul 21 | $20,594 | $19,937 | $20,426 |
|---|
Aug 21 | $20,967 | $20,432 | $20,801 |
|---|
Sep 21 | $19,956 | $19,630 | $19,827 |
|---|
Oct 21 | $19,705 | $20,556 | $19,523 |
|---|
Nov 21 | $19,843 | $19,979 | $19,635 |
|---|
Dec 21 | $21,625 | $20,759 | $21,439 |
|---|
Jan 22 | $21,082 | $19,665 | $20,796 |
|---|
Feb 22 | $20,859 | $19,217 | $20,701 |
|---|
Mar 22 | $20,972 | $19,586 | $20,846 |
|---|
Apr 22 | $21,167 | $18,025 | $21,060 |
|---|
May 22 | $21,016 | $18,033 | $20,785 |
|---|
Jun 22 | $17,867 | $16,485 | $17,616 |
|---|
Jul 22 | $19,004 | $17,643 | $18,742 |
|---|
Aug 22 | $18,381 | $17,032 | $18,249 |
|---|
Sep 22 | $15,694 | $15,382 | $15,578 |
|---|
Oct 22 | $16,907 | $16,305 | $16,706 |
|---|
Nov 22 | $18,329 | $17,550 | $17,924 |
|---|
Dec 22 | $17,487 | $16,891 | $17,281 |
|---|
Jan 23 | $18,826 | $18,127 | $18,586 |
|---|
Feb 23 | $17,694 | $17,621 | $17,528 |
|---|
Mar 23 | $17,217 | $18,040 | $16,972 |
|---|
Apr 23 | $17,053 | $18,266 | $16,795 |
|---|
May 23 | $16,650 | $18,045 | $16,370 |
|---|
Jun 23 | $17,520 | $19,093 | $17,240 |
|---|
Jul 23 | $18,658 | $19,825 | $18,412 |
|---|
Aug 23 | $18,278 | $19,247 | $18,046 |
|---|
Sep 23 | $18,065 | $18,449 | $17,887 |
|---|
Oct 23 | $17,323 | $17,826 | $17,059 |
|---|
Nov 23 | $18,851 | $19,467 | $18,597 |
|---|
Dec 23 | $19,906 | $20,492 | $19,660 |
|---|
Jan 24 | $18,675 | $20,530 | $18,518 |
|---|
Feb 24 | $19,403 | $21,398 | $19,145 |
|---|
Mar 24 | $20,670 | $22,051 | $20,387 |
|---|
Apr 24 | $19,341 | $21,322 | $19,124 |
|---|
May 24 | $20,394 | $22,172 | $20,057 |
|---|
Jun 24 | $19,495 | $22,562 | $19,214 |
|---|
Jul 24 | $20,267 | $23,036 | $19,961 |
|---|
Aug 24 | $20,399 | $23,561 | $20,092 |
|---|
Sep 24 | $21,495 | $24,119 | $21,203 |
|---|
Oct 24 | $20,021 | $23,562 | $19,718 |
|---|
Nov 24 | $20,187 | $24,472 | $19,891 |
|---|
Dec 24 | $19,119 | $23,820 | $18,845 |
|---|
Jan 25 | $20,025 | $24,581 | $19,772 |
|---|
Feb 25 | $19,416 | $24,360 | $19,141 |
|---|
Mar 25 | $18,801 | $23,428 | $18,468 |
|---|
Apr 25 | $18,110 | $23,653 | $17,821 |
|---|
May 25 | $18,455 | $25,016 | $18,145 |
|---|
Jun 25 | $18,483 | $26,146 | $18,126 |
|---|
Jul 25 | $17,859 | $26,502 | $17,610 |
|---|
Aug 25 | $19,194 | $27,248 | $18,886 |
|---|
Sep 25 | $18,578 | $28,166 | $18,248 |
|---|
Oct 25 | $17,529 | $28,727 | $17,230 |
|---|
Nov 25 | $17,717 | $28,753 | $17,397 |
|---|
Dec 25 | $18,419 | $29,050 | $18,123 |
|---|
Jan 26 | $19,063 | $29,995 | $18,788 |
|---|
Feb 26 | $20,008 | $30,491 | $19,679 |
|---|
Mar 26 | $18,158 | $28,242 | $17,642 |
|---|
See “Average annual total returns” for additional information on fund performance. |
|
| No Deduction of Taxes [Text Block] |
|
Performance results do not reflect the deduction of taxes that a shareholder would pay on fund distributions or on the redemption or sale of fund shares.
|
|
| AssetsNet |
|
$ 263,973,111
|
|
| Holdings Count | Holding |
|
28
|
|
| Advisory Fees Paid, Amount |
|
$ 890,138
|
|
| InvestmentCompanyPortfolioTurnover |
|
65.00%
|
|
| Additional Fund Statistics [Text Block] |
|
Table SummaryNet Assets........................................................................................................................................................................................................................................................................................................................................................................................................................................................................................................................................................................................................................................................................................................................................................................................................................................................................................................................................................................................................................................ | $263,973,111 |
|---|
Number of Portfolio Holdings........................................................................................................................................................................................................................................................................................................................................................................................................................................................................................................................................................................................................................................................................................................................................................................................................................................................................................................................................................................................................................................ | 28 |
|---|
Net Investment Advisory Fees........................................................................................................................................................................................................................................................................................................................................................................................................................................................................................................................................................................................................................................................................................................................................................................................................................................................................................................................................................................................................................................ | $890,138 |
|---|
Portfolio Turnover Rate........................................................................................................................................................................................................................................................................................................................................................................................................................................................................................................................................................................................................................................................................................................................................................................................................................................................................................................................................................................................................................................ | 65% |
|---|
|
|
| C000241780 |
|
|
|
| Shareholder Report [Line Items] |
|
|
|
| Fund Name |
|
iShares Lithium Miners and Producers ETF
|
|
| Trading Symbol |
|
ILIT
|
|
| Security Exchange Name |
|
NASDAQ
|
|
| Annual or Semi-Annual Statement [Text Block] |
|
This annual shareholder report contains important information about iShares Lithium Miners and Producers ETF (the “Fund”) for the period of April 1, 2025 to March 31, 2026
|
|
| Additional Information [Text Block] |
|
You can find additional information about the Fund at blackrock.com/fundreports. You can also request this information by contacting us at 1-800-iShares (1-800-474-2737).
|
|
| Additional Information Phone Number |
|
1-800-474-2737
|
|
| Additional Information Website |
|
blackrock.com/fundreports
|
|
| Expenses [Text Block] |
|
What were the Fund costs for the last year?(based on a hypothetical $10,000 investment) Table SummaryFund name | Costs of a $10,000
investment | Costs paid as a percentage of a
$10,000 investment |
|---|
iShares Lithium Miners and Producers ETF | $75 | 0.47% |
|---|
|
|
| Expenses Paid, Amount |
|
$ 75
|
|
| Expense Ratio, Percent |
|
0.47%
|
|
| Performance Past Does Not Indicate Future [Text] |
|
Past performance is not an indication of future results.
|
|
| Line Graph [Table Text Block] |
|
Cumulative performance: June 21, 2023 through March 31, 2026 Initial investment of $10,000 Table Summary | Fund | STOXX Emerging Markets All Cap Index (Net) | STOXX Global Lithium Miners and Producers Index (Net) |
|---|
May 23 | $10,000 | $10,000 | $10,000 |
|---|
Jun 23 | $9,920 | $9,890 | $9,873 |
|---|
Jul 23 | $9,486 | $10,477 | $9,481 |
|---|
Aug 23 | $8,106 | $9,937 | $8,133 |
|---|
Sep 23 | $7,359 | $9,704 | $7,396 |
|---|
Oct 23 | $6,208 | $9,305 | $6,117 |
|---|
Nov 23 | $6,190 | $10,080 | $6,134 |
|---|
Dec 23 | $6,862 | $10,480 | $6,804 |
|---|
Jan 24 | $5,089 | $10,071 | $5,065 |
|---|
Feb 24 | $5,819 | $10,516 | $5,753 |
|---|
Mar 24 | $5,481 | $10,735 | $5,421 |
|---|
Apr 24 | $5,231 | $10,810 | $5,209 |
|---|
May 24 | $5,242 | $10,858 | $5,151 |
|---|
Jun 24 | $4,338 | $11,224 | $4,286 |
|---|
Jul 24 | $4,158 | $11,195 | $4,072 |
|---|
Aug 24 | $3,941 | $11,482 | $3,877 |
|---|
Sep 24 | $4,623 | $12,192 | $4,570 |
|---|
Oct 24 | $4,609 | $11,664 | $4,542 |
|---|
Nov 24 | $4,464 | $11,298 | $4,363 |
|---|
Dec 24 | $3,764 | $11,245 | $3,701 |
|---|
Jan 25 | $3,848 | $11,318 | $3,787 |
|---|
Feb 25 | $3,739 | $11,295 | $3,639 |
|---|
Mar 25 | $3,483 | $11,350 | $3,385 |
|---|
Apr 25 | $3,227 | $11,500 | $3,147 |
|---|
May 25 | $3,070 | $12,059 | $2,993 |
|---|
Jun 25 | $3,376 | $12,762 | $3,279 |
|---|
Jul 25 | $3,714 | $12,998 | $3,637 |
|---|
Aug 25 | $4,476 | $13,187 | $4,360 |
|---|
Sep 25 | $5,190 | $13,991 | $5,049 |
|---|
Oct 25 | $5,968 | $14,572 | $5,817 |
|---|
Nov 25 | $6,624 | $14,218 | $6,431 |
|---|
Dec 25 | $6,842 | $14,592 | $6,663 |
|---|
Jan 26 | $7,379 | $15,836 | $7,238 |
|---|
Feb 26 | $7,954 | $16,686 | $7,761 |
|---|
Mar 26 | $7,610 | $14,537 | $7,281 |
|---|
See “Average annual total returns” for additional information on fund performance. |
|
| No Deduction of Taxes [Text Block] |
|
Performance results do not reflect the deduction of taxes that a shareholder would pay on fund distributions or on the redemption or sale of fund shares.
|
|
| AssetsNet |
|
$ 20,743,473
|
|
| Holdings Count | Holding |
|
37
|
|
| Advisory Fees Paid, Amount |
|
$ 46,791
|
|
| InvestmentCompanyPortfolioTurnover |
|
47.00%
|
|
| Additional Fund Statistics [Text Block] |
|
Table SummaryNet Assets........................................................................................................................................................................................................................................................................................................................................................................................................................................................................................................................................................................................................................................................................................................................................................................................................................................................................................................................................................................................................................................ | $20,743,473 |
|---|
Number of Portfolio Holdings........................................................................................................................................................................................................................................................................................................................................................................................................................................................................................................................................................................................................................................................................................................................................................................................................................................................................................................................................................................................................................................ | 37 |
|---|
Net Investment Advisory Fees........................................................................................................................................................................................................................................................................................................................................................................................................................................................................................................................................................................................................................................................................................................................................................................................................................................................................................................................................................................................................................................ | $46,791 |
|---|
Portfolio Turnover Rate........................................................................................................................................................................................................................................................................................................................................................................................................................................................................................................................................................................................................................................................................................................................................................................................................................................................................................................................................................................................................................................ | 47% |
|---|
|
|
| C000012103 |
|
|
|
| Shareholder Report [Line Items] |
|
|
|
| Fund Name |
|
iShares Global Comm Services ETF
|
|
| Trading Symbol |
|
IXP
|
|
| Security Exchange Name |
|
NYSEArca
|
|
| Annual or Semi-Annual Statement [Text Block] |
|
This annual shareholder report contains important information about iShares Global Comm Services ETF (the “Fund”) for the period of April 1, 2025 to March 31, 2026
|
|
| Additional Information [Text Block] |
|
You can find additional information about the Fund at blackrock.com/fundreports. You can also request this information by contacting us at 1-800-iShares (1-800-474-2737).
|
|
| Additional Information Phone Number |
|
1-800-474-2737
|
|
| Additional Information Website |
|
blackrock.com/fundreports
|
|
| Expenses [Text Block] |
|
What were the Fund costs for the last year?(based on a hypothetical $10,000 investment) Table SummaryFund name | Costs of a $10,000
investment | Costs paid as a percentage of a
$10,000 investment |
|---|
iShares Global Comm Services ETF | $42 | 0.38% |
|---|
|
|
| Expenses Paid, Amount |
|
$ 42
|
|
| Expense Ratio, Percent |
|
0.38%
|
|
| Performance Past Does Not Indicate Future [Text] |
|
Past performance is not an indication of future results.
|
|
| Line Graph [Table Text Block] |
|
Cumulative performance: April 1, 2016 through March 31, 2026 Initial investment of $10,000 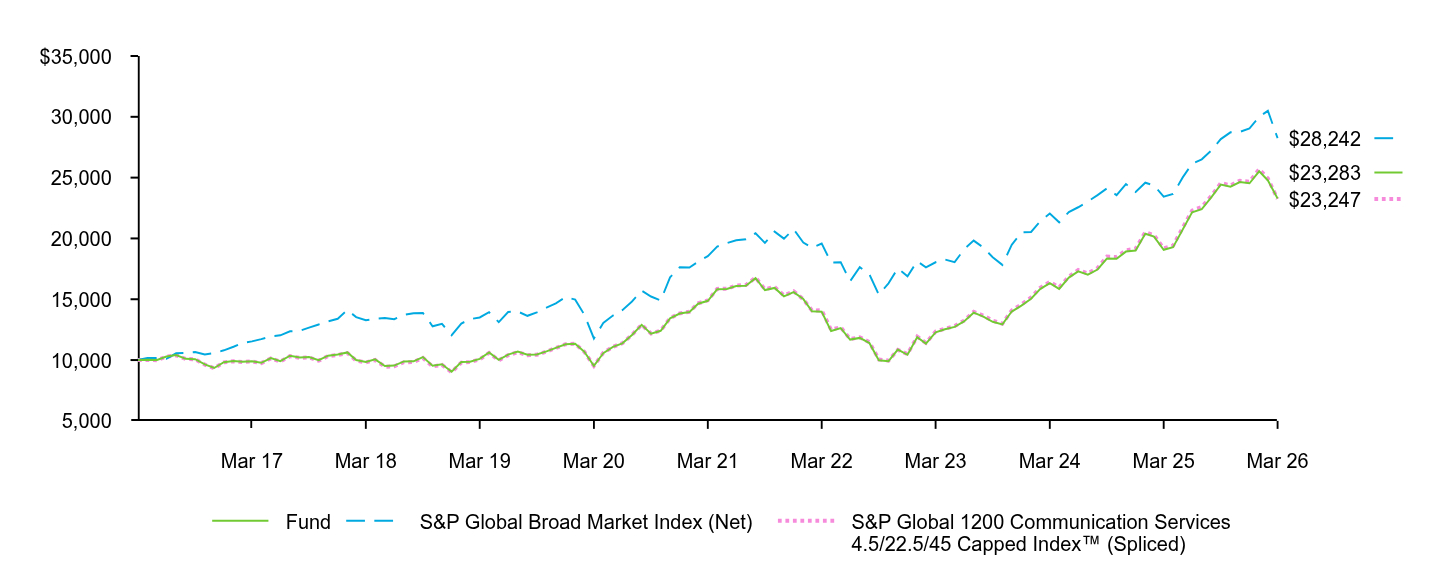 Table Summary | Fund | S&P Global Broad Market Index (Net) | S&P Global 1200 Communication Services 4.5/22.5/45 Capped Index™ (Spliced) |
|---|
Mar 16 | $10,000 | $10,000 | $10,000 |
|---|
Apr 16 | $10,016 | $10,161 | $10,005 |
|---|
May 16 | $10,005 | $10,176 | $9,994 |
|---|
Jun 16 | $10,287 | $10,102 | $10,280 |
|---|
Jul 16 | $10,411 | $10,554 | $10,395 |
|---|
Aug 16 | $10,099 | $10,592 | $10,087 |
|---|
Sep 16 | $10,073 | $10,669 | $10,064 |
|---|
Oct 16 | $9,644 | $10,466 | $9,623 |
|---|
Nov 16 | $9,346 | $10,573 | $9,329 |
|---|
Dec 16 | $9,828 | $10,800 | $9,813 |
|---|
Jan 17 | $9,918 | $11,095 | $9,898 |
|---|
Feb 17 | $9,864 | $11,400 | $9,845 |
|---|
Mar 17 | $9,909 | $11,535 | $9,888 |
|---|
Apr 17 | $9,776 | $11,720 | $9,746 |
|---|
May 17 | $10,171 | $11,959 | $10,143 |
|---|
Jun 17 | $9,906 | $12,032 | $9,875 |
|---|
Jul 17 | $10,360 | $12,362 | $10,322 |
|---|
Aug 17 | $10,206 | $12,406 | $10,175 |
|---|
Sep 17 | $10,243 | $12,670 | $10,212 |
|---|
Oct 17 | $9,993 | $12,928 | $9,950 |
|---|
Nov 17 | $10,362 | $13,182 | $10,322 |
|---|
Dec 17 | $10,455 | $13,398 | $10,417 |
|---|
Jan 18 | $10,627 | $14,119 | $10,579 |
|---|
Feb 18 | $9,996 | $13,533 | $9,952 |
|---|
Mar 18 | $9,850 | $13,271 | $9,803 |
|---|
Apr 18 | $10,062 | $13,402 | $10,007 |
|---|
May 18 | $9,508 | $13,453 | $9,453 |
|---|
Jun 18 | $9,545 | $13,364 | $9,490 |
|---|
Jul 18 | $9,888 | $13,728 | $9,819 |
|---|
Aug 18 | $9,898 | $13,849 | $9,833 |
|---|
Sep 18 | $10,246 | $13,873 | $10,176 |
|---|
Oct 18 | $9,538 | $12,779 | $9,474 |
|---|
Nov 18 | $9,655 | $12,976 | $9,605 |
|---|
Dec 18 | $9,039 | $12,038 | $8,996 |
|---|
Jan 19 | $9,838 | $13,007 | $9,790 |
|---|
Feb 19 | $9,870 | $13,364 | $9,831 |
|---|
Mar 19 | $10,097 | $13,499 | $10,057 |
|---|
Apr 19 | $10,632 | $13,941 | $10,592 |
|---|
May 19 | $10,014 | $13,118 | $9,976 |
|---|
Jun 19 | $10,444 | $13,954 | $10,397 |
|---|
Jul 19 | $10,696 | $13,986 | $10,646 |
|---|
Aug 19 | $10,437 | $13,638 | $10,404 |
|---|
Sep 19 | $10,457 | $13,920 | $10,434 |
|---|
Oct 19 | $10,716 | $14,308 | $10,695 |
|---|
Nov 19 | $11,004 | $14,658 | $10,992 |
|---|
Dec 19 | $11,305 | $15,176 | $11,303 |
|---|
Jan 20 | $11,342 | $14,971 | $11,334 |
|---|
Feb 20 | $10,695 | $13,749 | $10,693 |
|---|
Mar 20 | $9,521 | $11,771 | $9,523 |
|---|
Apr 20 | $10,568 | $13,056 | $10,594 |
|---|
May 20 | $11,088 | $13,664 | $11,092 |
|---|
Jun 20 | $11,373 | $14,100 | $11,379 |
|---|
Jul 20 | $12,068 | $14,812 | $12,074 |
|---|
Aug 20 | $12,893 | $15,713 | $12,903 |
|---|
Sep 20 | $12,165 | $15,227 | $12,179 |
|---|
Oct 20 | $12,407 | $14,902 | $12,419 |
|---|
Nov 20 | $13,430 | $16,802 | $13,446 |
|---|
Dec 20 | $13,822 | $17,637 | $13,840 |
|---|
Jan 21 | $13,945 | $17,609 | $13,972 |
|---|
Feb 21 | $14,630 | $18,091 | $14,662 |
|---|
Mar 21 | $14,871 | $18,540 | $14,908 |
|---|
Apr 21 | $15,820 | $19,333 | $15,853 |
|---|
May 21 | $15,839 | $19,618 | $15,863 |
|---|
Jun 21 | $16,095 | $19,854 | $16,137 |
|---|
Jul 21 | $16,108 | $19,937 | $16,165 |
|---|
Aug 21 | $16,738 | $20,432 | $16,781 |
|---|
Sep 21 | $15,755 | $19,630 | $15,829 |
|---|
Oct 21 | $15,931 | $20,556 | $16,010 |
|---|
Nov 21 | $15,241 | $19,979 | $15,309 |
|---|
Dec 21 | $15,587 | $20,759 | $15,656 |
|---|
Jan 22 | $15,017 | $19,665 | $15,002 |
|---|
Feb 22 | $14,011 | $19,217 | $14,069 |
|---|
Mar 22 | $13,975 | $19,586 | $14,103 |
|---|
Apr 22 | $12,385 | $18,025 | $12,491 |
|---|
May 22 | $12,630 | $18,033 | $12,705 |
|---|
Jun 22 | $11,683 | $16,485 | $11,723 |
|---|
Jul 22 | $11,822 | $17,643 | $11,870 |
|---|
Aug 22 | $11,392 | $17,032 | $11,472 |
|---|
Sep 22 | $9,985 | $15,382 | $10,051 |
|---|
Oct 22 | $9,904 | $16,305 | $9,951 |
|---|
Nov 22 | $10,863 | $17,550 | $10,843 |
|---|
Dec 22 | $10,434 | $16,891 | $10,496 |
|---|
Jan 23 | $11,874 | $18,127 | $11,924 |
|---|
Feb 23 | $11,349 | $17,621 | $11,413 |
|---|
Mar 23 | $12,275 | $18,040 | $12,341 |
|---|
Apr 23 | $12,536 | $18,266 | $12,581 |
|---|
May 23 | $12,729 | $18,045 | $12,790 |
|---|
Jun 23 | $13,177 | $19,093 | $13,239 |
|---|
Jul 23 | $13,896 | $19,825 | $13,965 |
|---|
Aug 23 | $13,571 | $19,247 | $13,651 |
|---|
Sep 23 | $13,147 | $18,449 | $13,242 |
|---|
Oct 23 | $12,932 | $17,826 | $12,989 |
|---|
Nov 23 | $13,992 | $19,467 | $14,082 |
|---|
Dec 23 | $14,474 | $20,492 | $14,562 |
|---|
Jan 24 | $15,035 | $20,530 | $15,153 |
|---|
Feb 24 | $15,835 | $21,398 | $15,943 |
|---|
Mar 24 | $16,330 | $22,051 | $16,428 |
|---|
Apr 24 | $15,844 | $21,322 | $15,977 |
|---|
May 24 | $16,778 | $22,172 | $16,862 |
|---|
Jun 24 | $17,288 | $22,562 | $17,405 |
|---|
Jul 24 | $17,016 | $23,036 | $17,126 |
|---|
Aug 24 | $17,443 | $23,561 | $17,565 |
|---|
Sep 24 | $18,344 | $24,119 | $18,508 |
|---|
Oct 24 | $18,333 | $23,562 | $18,466 |
|---|
Nov 24 | $18,920 | $24,472 | $19,027 |
|---|
Dec 24 | $19,006 | $23,820 | $19,160 |
|---|
Jan 25 | $20,384 | $24,581 | $20,515 |
|---|
Feb 25 | $20,148 | $24,360 | $20,276 |
|---|
Mar 25 | $19,067 | $23,428 | $19,183 |
|---|
Apr 25 | $19,276 | $23,653 | $19,405 |
|---|
May 25 | $20,731 | $25,016 | $20,886 |
|---|
Jun 25 | $22,154 | $26,146 | $22,286 |
|---|
Jul 25 | $22,400 | $26,502 | $22,586 |
|---|
Aug 25 | $23,394 | $27,248 | $23,509 |
|---|
Sep 25 | $24,423 | $28,166 | $24,549 |
|---|
Oct 25 | $24,258 | $28,727 | $24,364 |
|---|
Nov 25 | $24,634 | $28,753 | $24,745 |
|---|
Dec 25 | $24,534 | $29,050 | $24,662 |
|---|
Jan 26 | $25,522 | $29,995 | $25,696 |
|---|
Feb 26 | $24,768 | $30,491 | $24,927 |
|---|
Mar 26 | $23,283 | $28,242 | $23,247 |
|---|
See “Average annual total returns” for additional information on fund performance. |
|
| No Deduction of Taxes [Text Block] |
|
Performance results do not reflect the deduction of taxes that a shareholder would pay on fund distributions or on the redemption or sale of fund shares.
|
|
| AssetsNet |
|
$ 568,801,890
|
|
| Holdings Count | Holding |
|
72
|
|
| Advisory Fees Paid, Amount |
|
$ 2,322,221
|
|
| InvestmentCompanyPortfolioTurnover |
|
28.00%
|
|
| Additional Fund Statistics [Text Block] |
|
Table SummaryNet Assets........................................................................................................................................................................................................................................................................................................................................................................................................................................................................................................................................................................................................................................................................................................................................................................................................................................................................................................................................................................................................................................ | $568,801,890 |
|---|
Number of Portfolio Holdings........................................................................................................................................................................................................................................................................................................................................................................................................................................................................................................................................................................................................................................................................................................................................................................................................................................................................................................................................................................................................................................ | 72 |
|---|
Net Investment Advisory Fees........................................................................................................................................................................................................................................................................................................................................................................................................................................................................................................................................................................................................................................................................................................................................................................................................................................................................................................................................................................................................................................ | $2,322,221 |
|---|
Portfolio Turnover Rate........................................................................................................................................................................................................................................................................................................................................................................................................................................................................................................................................................................................................................................................................................................................................................................................................................................................................................................................................................................................................................................ | 28% |
|---|
|
|
| C000024194 |
|
|
|
| Shareholder Report [Line Items] |
|
|
|
| Fund Name |
|
iShares Global Consumer Discretionary ETF
|
|
| Trading Symbol |
|
RXI
|
|
| Security Exchange Name |
|
NYSEArca
|
|
| Annual or Semi-Annual Statement [Text Block] |
|
This annual shareholder report contains important information about iShares Global Consumer Discretionary ETF (the “Fund”) for the period of April 1, 2025 to March 31, 2026
|
|
| Additional Information [Text Block] |
|
You can find additional information about the Fund at blackrock.com/fundreports. You can also request this information by contacting us at 1-800-iShares (1-800-474-2737).
|
|
| Additional Information Phone Number |
|
1-800-474-2737
|
|
| Additional Information Website |
|
blackrock.com/fundreports
|
|
| Expenses [Text Block] |
|
What were the Fund costs for the last year?(based on a hypothetical $10,000 investment) Table SummaryFund name | Costs of a $10,000
investment | Costs paid as a percentage of a
$10,000 investment |
|---|
iShares Global Consumer Discretionary ETF | $39 | 0.38% |
|---|
|
|
| Expenses Paid, Amount |
|
$ 39
|
|
| Expense Ratio, Percent |
|
0.38%
|
|
| Performance Past Does Not Indicate Future [Text] |
|
Past performance is not an indication of future results.
|
|
| Line Graph [Table Text Block] |
|
Cumulative performance: April 1, 2016 through March 31, 2026 Initial investment of $10,000 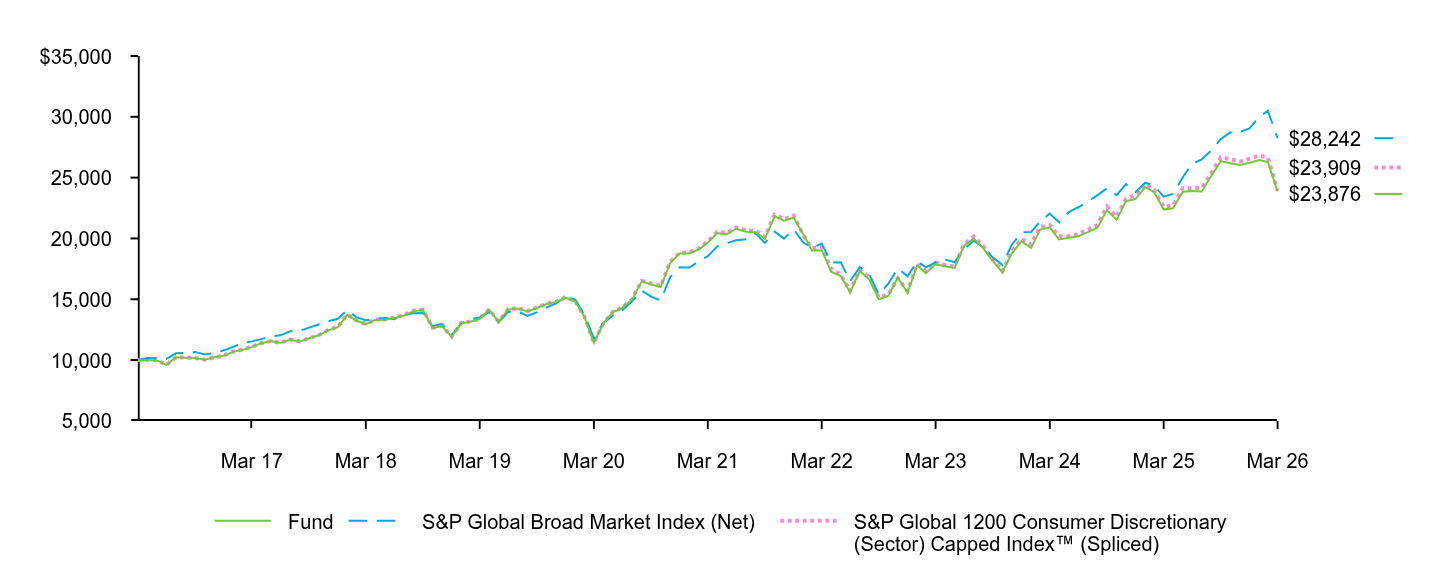 Table Summary | Fund | S&P Global Broad Market Index (Net) | S&P Global 1200 Consumer Discretionary (Sector) Capped Index™ (Spliced) |
|---|
Mar 16 | $10,000 | $10,000 | $10,000 |
|---|
Apr 16 | $9,995 | $10,161 | $10,003 |
|---|
May 16 | $9,972 | $10,176 | $9,973 |
|---|
Jun 16 | $9,610 | $10,102 | $9,616 |
|---|
Jul 16 | $10,229 | $10,554 | $10,228 |
|---|
Aug 16 | $10,198 | $10,592 | $10,200 |
|---|
Sep 16 | $10,174 | $10,669 | $10,171 |
|---|
Oct 16 | $10,026 | $10,466 | $10,024 |
|---|
Nov 16 | $10,227 | $10,573 | $10,225 |
|---|
Dec 16 | $10,364 | $10,800 | $10,367 |
|---|
Jan 17 | $10,695 | $11,095 | $10,700 |
|---|
Feb 17 | $10,831 | $11,400 | $10,843 |
|---|
Mar 17 | $11,086 | $11,535 | $11,096 |
|---|
Apr 17 | $11,383 | $11,720 | $11,389 |
|---|
May 17 | $11,542 | $11,959 | $11,560 |
|---|
Jun 17 | $11,415 | $12,032 | $11,423 |
|---|
Jul 17 | $11,669 | $12,362 | $11,683 |
|---|
Aug 17 | $11,519 | $12,406 | $11,534 |
|---|
Sep 17 | $11,789 | $12,670 | $11,805 |
|---|
Oct 17 | $12,034 | $12,928 | $12,056 |
|---|
Nov 17 | $12,441 | $13,182 | $12,466 |
|---|
Dec 17 | $12,708 | $13,398 | $12,735 |
|---|
Jan 18 | $13,719 | $14,119 | $13,749 |
|---|
Feb 18 | $13,255 | $13,533 | $13,284 |
|---|
Mar 18 | $12,950 | $13,271 | $12,979 |
|---|
Apr 18 | $13,300 | $13,402 | $13,329 |
|---|
May 18 | $13,316 | $13,453 | $13,341 |
|---|
Jun 18 | $13,452 | $13,364 | $13,480 |
|---|
Jul 18 | $13,664 | $13,728 | $13,696 |
|---|
Aug 18 | $14,023 | $13,849 | $14,056 |
|---|
Sep 18 | $14,112 | $13,873 | $14,144 |
|---|
Oct 18 | $12,652 | $12,779 | $12,661 |
|---|
Nov 18 | $12,783 | $12,976 | $12,797 |
|---|
Dec 18 | $11,920 | $12,038 | $11,940 |
|---|
Jan 19 | $13,021 | $13,007 | $13,053 |
|---|
Feb 19 | $13,147 | $13,364 | $13,178 |
|---|
Mar 19 | $13,380 | $13,499 | $13,409 |
|---|
Apr 19 | $14,135 | $13,941 | $14,167 |
|---|
May 19 | $13,139 | $13,118 | $13,164 |
|---|
Jun 19 | $14,159 | $13,954 | $14,191 |
|---|
Jul 19 | $14,227 | $13,986 | $14,262 |
|---|
Aug 19 | $13,989 | $13,638 | $14,027 |
|---|
Sep 19 | $14,279 | $13,920 | $14,313 |
|---|
Oct 19 | $14,609 | $14,308 | $14,640 |
|---|
Nov 19 | $14,764 | $14,658 | $14,794 |
|---|
Dec 19 | $15,140 | $15,176 | $15,176 |
|---|
Jan 20 | $14,818 | $14,971 | $14,852 |
|---|
Feb 20 | $13,575 | $13,749 | $13,606 |
|---|
Mar 20 | $11,412 | $11,771 | $11,429 |
|---|
Apr 20 | $12,991 | $13,056 | $13,018 |
|---|
May 20 | $13,941 | $13,664 | $13,968 |
|---|
Jun 20 | $14,289 | $14,100 | $14,318 |
|---|
Jul 20 | $14,954 | $14,812 | $14,995 |
|---|
Aug 20 | $16,469 | $15,713 | $16,518 |
|---|
Sep 20 | $16,223 | $15,227 | $16,292 |
|---|
Oct 20 | $16,007 | $14,902 | $16,076 |
|---|
Nov 20 | $17,976 | $16,802 | $18,047 |
|---|
Dec 20 | $18,757 | $17,637 | $18,836 |
|---|
Jan 21 | $18,791 | $17,609 | $18,859 |
|---|
Feb 21 | $19,070 | $18,091 | $19,156 |
|---|
Mar 21 | $19,652 | $18,540 | $19,743 |
|---|
Apr 21 | $20,446 | $19,333 | $20,545 |
|---|
May 21 | $20,354 | $19,618 | $20,446 |
|---|
Jun 21 | $20,798 | $19,854 | $20,899 |
|---|
Jul 21 | $20,555 | $19,937 | $20,648 |
|---|
Aug 21 | $20,515 | $20,432 | $20,648 |
|---|
Sep 21 | $19,965 | $19,630 | $20,106 |
|---|
Oct 21 | $21,816 | $20,556 | $21,962 |
|---|
Nov 21 | $21,457 | $19,979 | $21,589 |
|---|
Dec 21 | $21,707 | $20,759 | $21,868 |
|---|
Jan 22 | $20,338 | $19,665 | $20,286 |
|---|
Feb 22 | $19,017 | $19,217 | $19,188 |
|---|
Mar 22 | $19,037 | $19,586 | $19,298 |
|---|
Apr 22 | $17,266 | $18,025 | $17,516 |
|---|
May 22 | $16,914 | $18,033 | $17,030 |
|---|
Jun 22 | $15,586 | $16,485 | $15,667 |
|---|
Jul 22 | $17,307 | $17,643 | $17,423 |
|---|
Aug 22 | $16,602 | $17,032 | $16,768 |
|---|
Sep 22 | $14,994 | $15,382 | $15,132 |
|---|
Oct 22 | $15,288 | $16,305 | $15,409 |
|---|
Nov 22 | $16,792 | $17,550 | $16,735 |
|---|
Dec 22 | $15,536 | $16,891 | $15,669 |
|---|
Jan 23 | $17,789 | $18,127 | $17,892 |
|---|
Feb 23 | $17,148 | $17,621 | $17,307 |
|---|
Mar 23 | $17,873 | $18,040 | $18,013 |
|---|
Apr 23 | $17,713 | $18,266 | $17,843 |
|---|
May 23 | $17,569 | $18,045 | $17,688 |
|---|
Jun 23 | $19,385 | $19,093 | $19,514 |
|---|
Jul 23 | $19,999 | $19,825 | $20,162 |
|---|
Aug 23 | $19,185 | $19,247 | $19,357 |
|---|
Sep 23 | $18,153 | $18,449 | $18,341 |
|---|
Oct 23 | $17,217 | $17,826 | $17,309 |
|---|
Nov 23 | $18,761 | $19,467 | $18,933 |
|---|
Dec 23 | $19,765 | $20,492 | $19,955 |
|---|
Jan 24 | $19,226 | $20,530 | $19,507 |
|---|
Feb 24 | $20,727 | $21,398 | $20,940 |
|---|
Mar 24 | $20,890 | $22,051 | $21,084 |
|---|
Apr 24 | $19,909 | $21,322 | $20,174 |
|---|
May 24 | $20,053 | $22,172 | $20,183 |
|---|
Jun 24 | $20,172 | $22,562 | $20,353 |
|---|
Jul 24 | $20,513 | $23,036 | $20,744 |
|---|
Aug 24 | $20,909 | $23,561 | $21,108 |
|---|
Sep 24 | $22,315 | $24,119 | $22,622 |
|---|
Oct 24 | $21,541 | $23,562 | $21,774 |
|---|
Nov 24 | $23,052 | $24,472 | $23,254 |
|---|
Dec 24 | $23,256 | $23,820 | $23,575 |
|---|
Jan 25 | $24,216 | $24,581 | $24,470 |
|---|
Feb 25 | $23,817 | $24,360 | $24,023 |
|---|
Mar 25 | $22,391 | $23,428 | $22,569 |
|---|
Apr 25 | $22,481 | $23,653 | $22,737 |
|---|
May 25 | $23,846 | $25,016 | $24,129 |
|---|
Jun 25 | $23,896 | $26,146 | $24,112 |
|---|
Jul 25 | $23,863 | $26,502 | $24,165 |
|---|
Aug 25 | $25,169 | $27,248 | $25,380 |
|---|
Sep 25 | $26,359 | $28,166 | $26,680 |
|---|
Oct 25 | $26,187 | $28,727 | $26,499 |
|---|
Nov 25 | $26,035 | $28,753 | $26,321 |
|---|
Dec 25 | $26,231 | $29,050 | $26,557 |
|---|
Jan 26 | $26,438 | $29,995 | $26,818 |
|---|
Feb 26 | $26,266 | $30,491 | $26,647 |
|---|
Mar 26 | $23,876 | $28,242 | $23,909 |
|---|
See “Average annual total returns” for additional information on fund performance. |
|
| No Deduction of Taxes [Text Block] |
|
Performance results do not reflect the deduction of taxes that a shareholder would pay on fund distributions or on the redemption or sale of fund shares.
|
|
| AssetsNet |
|
$ 251,912,828
|
|
| Holdings Count | Holding |
|
139
|
|
| Advisory Fees Paid, Amount |
|
$ 1,144,026
|
|
| InvestmentCompanyPortfolioTurnover |
|
17.00%
|
|
| Additional Fund Statistics [Text Block] |
|
Table SummaryNet Assets........................................................................................................................................................................................................................................................................................................................................................................................................................................................................................................................................................................................................................................................................................................................................................................................................................................................................................................................................................................................................................................ | $251,912,828 |
|---|
Number of Portfolio Holdings........................................................................................................................................................................................................................................................................................................................................................................................................................................................................................................................................................................................................................................................................................................................................................................................................................................................................................................................................................................................................................................ | 139 |
|---|
Net Investment Advisory Fees........................................................................................................................................................................................................................................................................................................................................................................................................................................................................................................................................................................................................................................................................................................................................................................................................................................................................................................................................................................................................................................ | $1,144,026 |
|---|
Portfolio Turnover Rate........................................................................................................................................................................................................................................................................................................................................................................................................................................................................................................................................................................................................................................................................................................................................................................................................................................................................................................................................................................................................................................ | 17% |
|---|
|
|
| C000024195 |
|
|
|
| Shareholder Report [Line Items] |
|
|
|
| Fund Name |
|
iShares Global Consumer Staples ETF
|
|
| Trading Symbol |
|
KXI
|
|
| Security Exchange Name |
|
NYSEArca
|
|
| Annual or Semi-Annual Statement [Text Block] |
|
This annual shareholder report contains important information about iShares Global Consumer Staples ETF (the “Fund”) for the period of April 1, 2025 to March 31, 2026
|
|
| Additional Information [Text Block] |
|
You can find additional information about the Fund at blackrock.com/fundreports. You can also request this information by contacting us at 1-800-iShares (1-800-474-2737).
|
|
| Additional Information Phone Number |
|
1-800-474-2737
|
|
| Additional Information Website |
|
blackrock.com/fundreports
|
|
| Expenses [Text Block] |
|
What were the Fund costs for the last year?(based on a hypothetical $10,000 investment) Table SummaryFund name | Costs of a $10,000
investment | Costs paid as a percentage of a
$10,000 investment |
|---|
iShares Global Consumer Staples ETF | $39 | 0.38% |
|---|
|
|
| Expenses Paid, Amount |
|
$ 39
|
|
| Expense Ratio, Percent |
|
0.38%
|
|
| Performance Past Does Not Indicate Future [Text] |
|
Past performance is not an indication of future results.
|
|
| Line Graph [Table Text Block] |
|
Cumulative performance: April 1, 2016 through March 31, 2026 Initial investment of $10,000 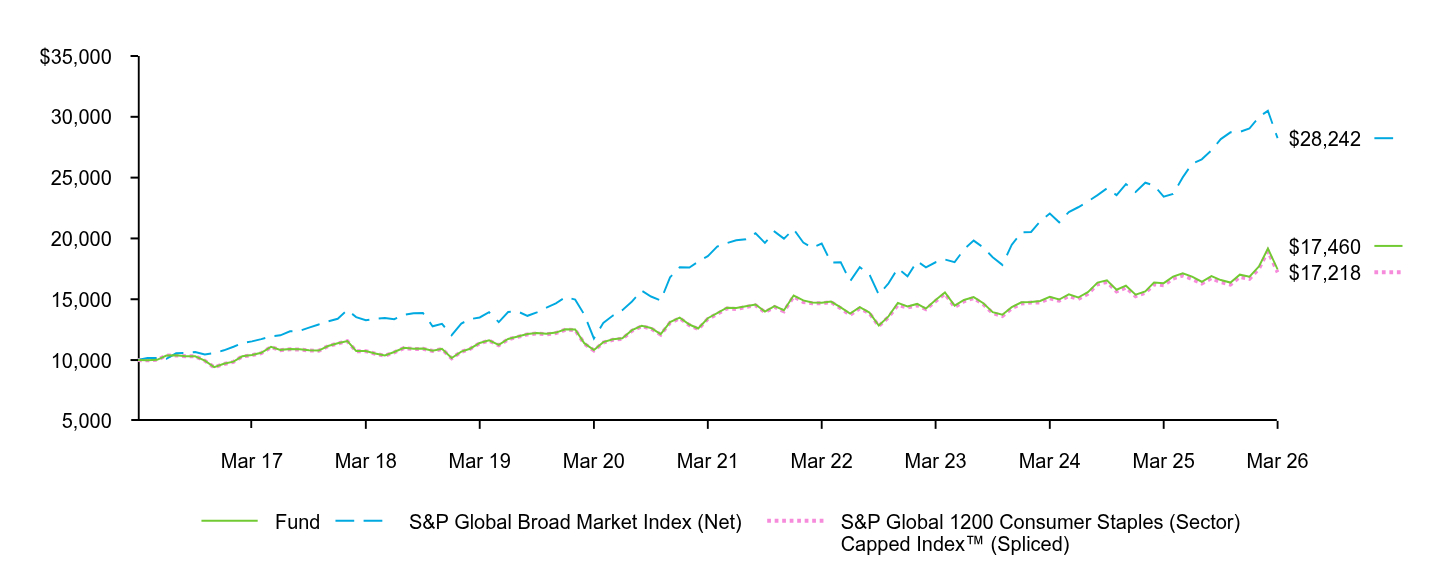 Table Summary | Fund | S&P Global Broad Market Index (Net) | S&P Global 1200 Consumer Staples (Sector) Capped Index™ (Spliced) |
|---|
Mar 16 | $10,000 | $10,000 | $10,000 |
|---|
Apr 16 | $9,978 | $10,161 | $9,978 |
|---|
May 16 | $10,021 | $10,176 | $10,022 |
|---|
Jun 16 | $10,371 | $10,102 | $10,375 |
|---|
Jul 16 | $10,388 | $10,554 | $10,385 |
|---|
Aug 16 | $10,306 | $10,592 | $10,304 |
|---|
Sep 16 | $10,310 | $10,669 | $10,308 |
|---|
Oct 16 | $9,957 | $10,466 | $9,948 |
|---|
Nov 16 | $9,414 | $10,573 | $9,402 |
|---|
Dec 16 | $9,691 | $10,800 | $9,675 |
|---|
Jan 17 | $9,867 | $11,095 | $9,853 |
|---|
Feb 17 | $10,310 | $11,400 | $10,296 |
|---|
Mar 17 | $10,418 | $11,535 | $10,397 |
|---|
Apr 17 | $10,595 | $11,720 | $10,571 |
|---|
May 17 | $11,086 | $11,959 | $11,064 |
|---|
Jun 17 | $10,838 | $12,032 | $10,815 |
|---|
Jul 17 | $10,908 | $12,362 | $10,886 |
|---|
Aug 17 | $10,891 | $12,406 | $10,871 |
|---|
Sep 17 | $10,807 | $12,670 | $10,786 |
|---|
Oct 17 | $10,781 | $12,928 | $10,765 |
|---|
Nov 17 | $11,157 | $13,182 | $11,146 |
|---|
Dec 17 | $11,375 | $13,398 | $11,363 |
|---|
Jan 18 | $11,561 | $14,119 | $11,547 |
|---|
Feb 18 | $10,742 | $13,533 | $10,727 |
|---|
Mar 18 | $10,750 | $13,271 | $10,734 |
|---|
Apr 18 | $10,540 | $13,402 | $10,523 |
|---|
May 18 | $10,372 | $13,453 | $10,352 |
|---|
Jun 18 | $10,660 | $13,364 | $10,640 |
|---|
Jul 18 | $11,005 | $13,728 | $10,988 |
|---|
Aug 18 | $10,923 | $13,849 | $10,903 |
|---|
Sep 18 | $10,951 | $13,873 | $10,930 |
|---|
Oct 18 | $10,775 | $12,779 | $10,753 |
|---|
Nov 18 | $10,923 | $12,976 | $10,901 |
|---|
Dec 18 | $10,169 | $12,038 | $10,144 |
|---|
Jan 19 | $10,699 | $13,007 | $10,677 |
|---|
Feb 19 | $10,933 | $13,364 | $10,917 |
|---|
Mar 19 | $11,403 | $13,499 | $11,382 |
|---|
Apr 19 | $11,621 | $13,941 | $11,593 |
|---|
May 19 | $11,255 | $13,118 | $11,226 |
|---|
Jun 19 | $11,736 | $13,954 | $11,703 |
|---|
Jul 19 | $11,941 | $13,986 | $11,909 |
|---|
Aug 19 | $12,142 | $13,638 | $12,109 |
|---|
Sep 19 | $12,223 | $13,920 | $12,186 |
|---|
Oct 19 | $12,158 | $14,308 | $12,121 |
|---|
Nov 19 | $12,258 | $14,658 | $12,218 |
|---|
Dec 19 | $12,539 | $15,176 | $12,494 |
|---|
Jan 20 | $12,519 | $14,971 | $12,474 |
|---|
Feb 20 | $11,388 | $13,749 | $11,354 |
|---|
Mar 20 | $10,822 | $11,771 | $10,784 |
|---|
Apr 20 | $11,474 | $13,056 | $11,432 |
|---|
May 20 | $11,704 | $13,664 | $11,662 |
|---|
Jun 20 | $11,789 | $14,100 | $11,744 |
|---|
Jul 20 | $12,456 | $14,812 | $12,407 |
|---|
Aug 20 | $12,821 | $15,713 | $12,771 |
|---|
Sep 20 | $12,636 | $15,227 | $12,593 |
|---|
Oct 20 | $12,129 | $14,902 | $12,086 |
|---|
Nov 20 | $13,120 | $16,802 | $13,067 |
|---|
Dec 20 | $13,493 | $17,637 | $13,435 |
|---|
Jan 21 | $12,924 | $17,609 | $12,870 |
|---|
Feb 21 | $12,596 | $18,091 | $12,543 |
|---|
Mar 21 | $13,442 | $18,540 | $13,383 |
|---|
Apr 21 | $13,861 | $19,333 | $13,793 |
|---|
May 21 | $14,305 | $19,618 | $14,236 |
|---|
Jun 21 | $14,277 | $19,854 | $14,201 |
|---|
Jul 21 | $14,431 | $19,937 | $14,359 |
|---|
Aug 21 | $14,572 | $20,432 | $14,506 |
|---|
Sep 21 | $13,989 | $19,630 | $13,937 |
|---|
Oct 21 | $14,431 | $20,556 | $14,363 |
|---|
Nov 21 | $14,099 | $19,979 | $14,008 |
|---|
Dec 21 | $15,309 | $20,759 | $15,229 |
|---|
Jan 22 | $14,904 | $19,665 | $14,774 |
|---|
Feb 22 | $14,729 | $19,217 | $14,672 |
|---|
Mar 22 | $14,708 | $19,586 | $14,670 |
|---|
Apr 22 | $14,809 | $18,025 | $14,769 |
|---|
May 22 | $14,339 | $18,033 | $14,254 |
|---|
Jun 22 | $13,822 | $16,485 | $13,714 |
|---|
Jul 22 | $14,349 | $17,643 | $14,247 |
|---|
Aug 22 | $13,901 | $17,032 | $13,851 |
|---|
Sep 22 | $12,834 | $15,382 | $12,792 |
|---|
Oct 22 | $13,592 | $16,305 | $13,525 |
|---|
Nov 22 | $14,705 | $17,550 | $14,525 |
|---|
Dec 22 | $14,408 | $16,891 | $14,319 |
|---|
Jan 23 | $14,615 | $18,127 | $14,499 |
|---|
Feb 23 | $14,230 | $17,621 | $14,174 |
|---|
Mar 23 | $14,937 | $18,040 | $14,843 |
|---|
Apr 23 | $15,556 | $18,266 | $15,453 |
|---|
May 23 | $14,475 | $18,045 | $14,360 |
|---|
Jun 23 | $14,938 | $19,093 | $14,828 |
|---|
Jul 23 | $15,183 | $19,825 | $15,100 |
|---|
Aug 23 | $14,670 | $19,247 | $14,583 |
|---|
Sep 23 | $13,937 | $18,449 | $13,857 |
|---|
Oct 23 | $13,725 | $17,826 | $13,615 |
|---|
Nov 23 | $14,347 | $19,467 | $14,250 |
|---|
Dec 23 | $14,750 | $20,492 | $14,646 |
|---|
Jan 24 | $14,782 | $20,530 | $14,727 |
|---|
Feb 24 | $14,853 | $21,398 | $14,735 |
|---|
Mar 24 | $15,194 | $22,051 | $15,080 |
|---|
Apr 24 | $14,975 | $21,322 | $14,876 |
|---|
May 24 | $15,404 | $22,172 | $15,258 |
|---|
Jun 24 | $15,140 | $22,562 | $15,015 |
|---|
Jul 24 | $15,585 | $23,036 | $15,454 |
|---|
Aug 24 | $16,371 | $23,561 | $16,230 |
|---|
Sep 24 | $16,552 | $24,119 | $16,421 |
|---|
Oct 24 | $15,782 | $23,562 | $15,634 |
|---|
Nov 24 | $16,114 | $24,472 | $15,962 |
|---|
Dec 24 | $15,370 | $23,820 | $15,245 |
|---|
Jan 25 | $15,639 | $24,581 | $15,523 |
|---|
Feb 25 | $16,376 | $24,360 | $16,227 |
|---|
Mar 25 | $16,319 | $23,428 | $16,158 |
|---|
Apr 25 | $16,865 | $23,653 | $16,701 |
|---|
May 25 | $17,127 | $25,016 | $16,959 |
|---|
Jun 25 | $16,857 | $26,146 | $16,657 |
|---|
Jul 25 | $16,437 | $26,502 | $16,296 |
|---|
Aug 25 | $16,906 | $27,248 | $16,729 |
|---|
Sep 25 | $16,577 | $28,166 | $16,404 |
|---|
Oct 25 | $16,371 | $28,727 | $16,207 |
|---|
Nov 25 | $17,020 | $28,753 | $16,843 |
|---|
Dec 25 | $16,850 | $29,050 | $16,671 |
|---|
Jan 26 | $17,727 | $29,995 | $17,534 |
|---|
Feb 26 | $19,173 | $30,491 | $18,960 |
|---|
Mar 26 | $17,460 | $28,242 | $17,218 |
|---|
See “Average annual total returns” for additional information on fund performance. |
|
| No Deduction of Taxes [Text Block] |
|
Performance results do not reflect the deduction of taxes that a shareholder would pay on fund distributions or on the redemption or sale of fund shares.
|
|
| AssetsNet |
|
$ 977,024,218
|
|
| Holdings Count | Holding |
|
98
|
|
| Advisory Fees Paid, Amount |
|
$ 3,322,247
|
|
| InvestmentCompanyPortfolioTurnover |
|
17.00%
|
|
| Additional Fund Statistics [Text Block] |
|
Table SummaryNet Assets........................................................................................................................................................................................................................................................................................................................................................................................................................................................................................................................................................................................................................................................................................................................................................................................................................................................................................................................................................................................................................................ | $977,024,218 |
|---|
Number of Portfolio Holdings........................................................................................................................................................................................................................................................................................................................................................................................................................................................................................................................................................................................................................................................................................................................................................................................................................................................................................................................................................................................................................................ | 98 |
|---|
Net Investment Advisory Fees........................................................................................................................................................................................................................................................................................................................................................................................................................................................................................................................................................................................................................................................................................................................................................................................................................................................................................................................................................................................................................................ | $3,322,247 |
|---|
Portfolio Turnover Rate........................................................................................................................................................................................................................................................................................................................................................................................................................................................................................................................................................................................................................................................................................................................................................................................................................................................................................................................................................................................................................................ | 17% |
|---|
|
|
| C000012089 |
|
|
|
| Shareholder Report [Line Items] |
|
|
|
| Fund Name |
|
iShares Global Energy ETF
|
|
| Trading Symbol |
|
IXC
|
|
| Security Exchange Name |
|
NYSEArca
|
|
| Annual or Semi-Annual Statement [Text Block] |
|
This annual shareholder report contains important information about iShares Global Energy ETF (the “Fund”) for the period of April 1, 2025 to March 31, 2026
|
|
| Additional Information [Text Block] |
|
You can find additional information about the Fund at blackrock.com/fundreports. You can also request this information by contacting us at 1-800-iShares (1-800-474-2737).
|
|
| Additional Information Phone Number |
|
1-800-474-2737
|
|
| Additional Information Website |
|
blackrock.com/fundreports
|
|
| Expenses [Text Block] |
|
What were the Fund costs for the last year?(based on a hypothetical $10,000 investment) Table SummaryFund name | Costs of a $10,000
investment | Costs paid as a percentage of a
$10,000 investment |
|---|
iShares Global Energy ETF | $46 | 0.38% |
|---|
|
|
| Expenses Paid, Amount |
|
$ 46
|
|
| Expense Ratio, Percent |
|
0.38%
|
|
| Performance Past Does Not Indicate Future [Text] |
|
Past performance is not an indication of future results.
|
|
| Line Graph [Table Text Block] |
|
Cumulative performance: April 1, 2016 through March 31, 2026 Initial investment of $10,000 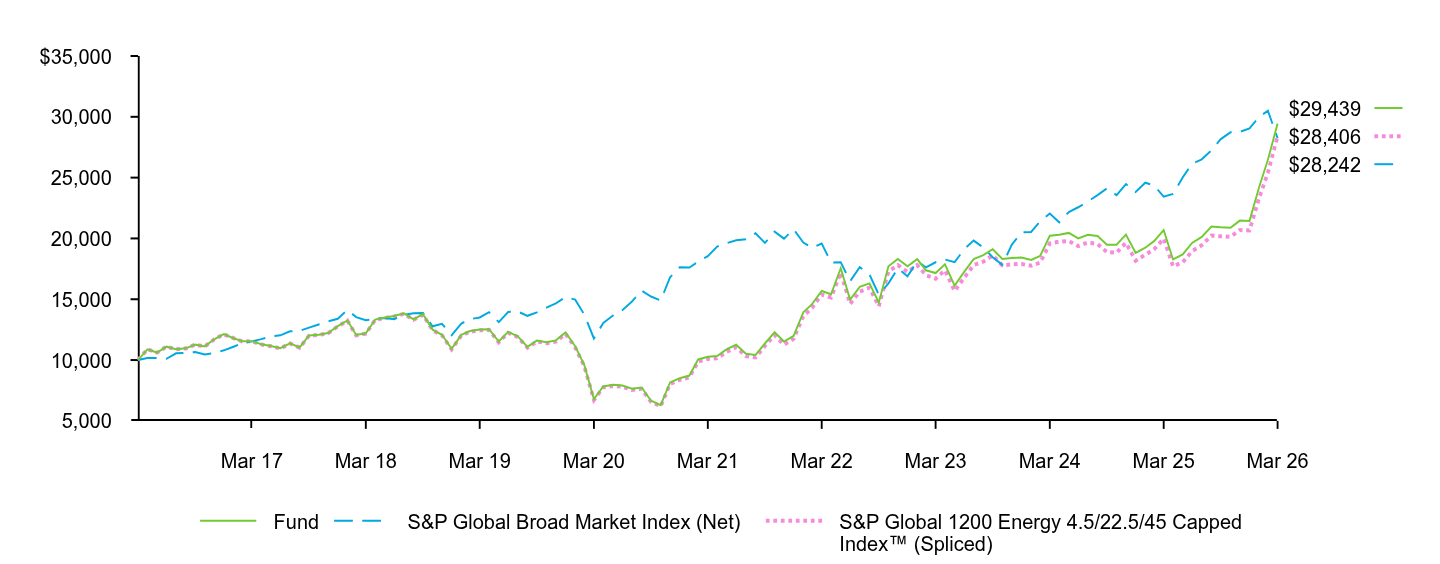 Table Summary | Fund | S&P Global Broad Market Index (Net) | S&P Global 1200 Energy 4.5/22.5/45 Capped Index™ (Spliced) |
|---|
Mar 16 | $10,000 | $10,000 | $10,000 |
|---|
Apr 16 | $10,882 | $10,161 | $10,884 |
|---|
May 16 | $10,615 | $10,176 | $10,609 |
|---|
Jun 16 | $11,102 | $10,102 | $11,099 |
|---|
Jul 16 | $10,889 | $10,554 | $10,888 |
|---|
Aug 16 | $10,961 | $10,592 | $10,956 |
|---|
Sep 16 | $11,267 | $10,669 | $11,262 |
|---|
Oct 16 | $11,122 | $10,466 | $11,120 |
|---|
Nov 16 | $11,706 | $10,573 | $11,702 |
|---|
Dec 16 | $12,128 | $10,800 | $12,124 |
|---|
Jan 17 | $11,798 | $11,095 | $11,796 |
|---|
Feb 17 | $11,547 | $11,400 | $11,532 |
|---|
Mar 17 | $11,554 | $11,535 | $11,542 |
|---|
Apr 17 | $11,300 | $11,720 | $11,289 |
|---|
May 17 | $11,150 | $11,959 | $11,133 |
|---|
Jun 17 | $10,974 | $12,032 | $10,953 |
|---|
Jul 17 | $11,378 | $12,362 | $11,359 |
|---|
Aug 17 | $11,038 | $12,406 | $11,014 |
|---|
Sep 17 | $12,022 | $12,670 | $11,998 |
|---|
Oct 17 | $12,079 | $12,928 | $12,064 |
|---|
Nov 17 | $12,228 | $13,182 | $12,202 |
|---|
Dec 17 | $12,789 | $13,398 | $12,766 |
|---|
Jan 18 | $13,253 | $14,119 | $13,232 |
|---|
Feb 18 | $12,063 | $13,533 | $12,035 |
|---|
Mar 18 | $12,196 | $13,271 | $12,171 |
|---|
Apr 18 | $13,325 | $13,402 | $13,297 |
|---|
May 18 | $13,498 | $13,453 | $13,457 |
|---|
Jun 18 | $13,617 | $13,364 | $13,580 |
|---|
Jul 18 | $13,836 | $13,728 | $13,799 |
|---|
Aug 18 | $13,351 | $13,849 | $13,309 |
|---|
Sep 18 | $13,774 | $13,873 | $13,731 |
|---|
Oct 18 | $12,498 | $12,779 | $12,460 |
|---|
Nov 18 | $12,082 | $12,976 | $12,035 |
|---|
Dec 18 | $10,923 | $12,038 | $10,875 |
|---|
Jan 19 | $12,066 | $13,007 | $12,018 |
|---|
Feb 19 | $12,386 | $13,364 | $12,330 |
|---|
Mar 19 | $12,508 | $13,499 | $12,449 |
|---|
Apr 19 | $12,538 | $13,941 | $12,482 |
|---|
May 19 | $11,521 | $13,118 | $11,453 |
|---|
Jun 19 | $12,317 | $13,954 | $12,247 |
|---|
Jul 19 | $11,960 | $13,986 | $11,892 |
|---|
Aug 19 | $11,081 | $13,638 | $11,012 |
|---|
Sep 19 | $11,604 | $13,920 | $11,530 |
|---|
Oct 19 | $11,464 | $14,308 | $11,389 |
|---|
Nov 19 | $11,619 | $14,658 | $11,508 |
|---|
Dec 19 | $12,270 | $15,176 | $12,153 |
|---|
Jan 20 | $11,140 | $14,971 | $11,036 |
|---|
Feb 20 | $9,596 | $13,749 | $9,498 |
|---|
Mar 20 | $6,787 | $11,771 | $6,717 |
|---|
Apr 20 | $7,834 | $13,056 | $7,752 |
|---|
May 20 | $7,965 | $13,664 | $7,865 |
|---|
Jun 20 | $7,909 | $14,100 | $7,809 |
|---|
Jul 20 | $7,641 | $14,812 | $7,542 |
|---|
Aug 20 | $7,742 | $15,713 | $7,633 |
|---|
Sep 20 | $6,655 | $15,227 | $6,558 |
|---|
Oct 20 | $6,294 | $14,902 | $6,200 |
|---|
Nov 20 | $8,160 | $16,802 | $8,033 |
|---|
Dec 20 | $8,501 | $17,637 | $8,367 |
|---|
Jan 21 | $8,726 | $17,609 | $8,585 |
|---|
Feb 21 | $10,053 | $18,091 | $9,877 |
|---|
Mar 21 | $10,274 | $18,540 | $10,096 |
|---|
Apr 21 | $10,324 | $19,333 | $10,143 |
|---|
May 21 | $10,891 | $19,618 | $10,677 |
|---|
Jun 21 | $11,265 | $19,854 | $11,051 |
|---|
Jul 21 | $10,511 | $19,937 | $10,317 |
|---|
Aug 21 | $10,418 | $20,432 | $10,214 |
|---|
Sep 21 | $11,363 | $19,630 | $11,157 |
|---|
Oct 21 | $12,286 | $20,556 | $12,056 |
|---|
Nov 21 | $11,520 | $19,979 | $11,265 |
|---|
Dec 21 | $11,981 | $20,759 | $11,740 |
|---|
Jan 22 | $13,931 | $19,665 | $13,606 |
|---|
Feb 22 | $14,597 | $19,217 | $14,295 |
|---|
Mar 22 | $15,679 | $19,586 | $15,388 |
|---|
Apr 22 | $15,405 | $18,025 | $15,145 |
|---|
May 22 | $17,559 | $18,033 | $17,204 |
|---|
Jun 22 | $14,967 | $16,485 | $14,616 |
|---|
Jul 22 | $16,019 | $17,643 | $15,626 |
|---|
Aug 22 | $16,303 | $17,032 | $15,949 |
|---|
Sep 22 | $14,730 | $15,382 | $14,412 |
|---|
Oct 22 | $17,708 | $16,305 | $17,280 |
|---|
Nov 22 | $18,316 | $17,550 | $17,809 |
|---|
Dec 22 | $17,711 | $16,891 | $17,239 |
|---|
Jan 23 | $18,294 | $18,127 | $17,802 |
|---|
Feb 23 | $17,384 | $17,621 | $16,985 |
|---|
Mar 23 | $17,151 | $18,040 | $16,691 |
|---|
Apr 23 | $17,869 | $18,266 | $17,385 |
|---|
May 23 | $16,125 | $18,045 | $15,677 |
|---|
Jun 23 | $17,231 | $19,093 | $16,744 |
|---|
Jul 23 | $18,308 | $19,825 | $17,810 |
|---|
Aug 23 | $18,623 | $19,247 | $18,097 |
|---|
Sep 23 | $19,115 | $18,449 | $18,603 |
|---|
Oct 23 | $18,319 | $17,826 | $17,786 |
|---|
Nov 23 | $18,394 | $19,467 | $17,865 |
|---|
Dec 23 | $18,430 | $20,492 | $17,904 |
|---|
Jan 24 | $18,235 | $20,530 | $17,752 |
|---|
Feb 24 | $18,554 | $21,398 | $18,006 |
|---|
Mar 24 | $20,218 | $22,051 | $19,591 |
|---|
Apr 24 | $20,299 | $21,322 | $19,739 |
|---|
May 24 | $20,455 | $22,172 | $19,785 |
|---|
Jun 24 | $19,998 | $22,562 | $19,369 |
|---|
Jul 24 | $20,307 | $23,036 | $19,677 |
|---|
Aug 24 | $20,195 | $23,561 | $19,543 |
|---|
Sep 24 | $19,489 | $24,119 | $18,883 |
|---|
Oct 24 | $19,477 | $23,562 | $18,823 |
|---|
Nov 24 | $20,316 | $24,472 | $19,642 |
|---|
Dec 24 | $18,814 | $23,820 | $18,171 |
|---|
Jan 25 | $19,233 | $24,581 | $18,663 |
|---|
Feb 25 | $19,779 | $24,360 | $19,100 |
|---|
Mar 25 | $20,685 | $23,428 | $19,985 |
|---|
Apr 25 | $18,272 | $23,653 | $17,701 |
|---|
May 25 | $18,690 | $25,016 | $18,035 |
|---|
Jun 25 | $19,632 | $26,146 | $18,949 |
|---|
Jul 25 | $20,128 | $26,502 | $19,441 |
|---|
Aug 25 | $20,982 | $27,248 | $20,230 |
|---|
Sep 25 | $20,920 | $28,166 | $20,172 |
|---|
Oct 25 | $20,882 | $28,727 | $20,128 |
|---|
Nov 25 | $21,466 | $28,753 | $20,691 |
|---|
Dec 25 | $21,441 | $29,050 | $20,656 |
|---|
Jan 26 | $24,225 | $29,995 | $23,344 |
|---|
Feb 26 | $26,465 | $30,491 | $25,408 |
|---|
Mar 26 | $29,439 | $28,242 | $28,406 |
|---|
See “Average annual total returns” for additional information on fund performance. |
|
| No Deduction of Taxes [Text Block] |
|
Performance results do not reflect the deduction of taxes that a shareholder would pay on fund distributions or on the redemption or sale of fund shares.
|
|
| AssetsNet |
|
$ 2,920,464,636
|
|
| Holdings Count | Holding |
|
55
|
|
| Advisory Fees Paid, Amount |
|
$ 7,086,878
|
|
| InvestmentCompanyPortfolioTurnover |
|
3.00%
|
|
| Additional Fund Statistics [Text Block] |
|
Table SummaryNet Assets........................................................................................................................................................................................................................................................................................................................................................................................................................................................................................................................................................................................................................................................................................................................................................................................................................................................................................................................................................................................................................................ | $2,920,464,636 |
|---|
Number of Portfolio Holdings........................................................................................................................................................................................................................................................................................................................................................................................................................................................................................................................................................................................................................................................................................................................................................................................................................................................................................................................................................................................................................................ | 55 |
|---|
Net Investment Advisory Fees........................................................................................................................................................................................................................................................................................................................................................................................................................................................................................................................................................................................................................................................................................................................................................................................................................................................................................................................................................................................................................................ | $7,086,878 |
|---|
Portfolio Turnover Rate........................................................................................................................................................................................................................................................................................................................................................................................................................................................................................................................................................................................................................................................................................................................................................................................................................................................................................................................................................................................................................................ | 3% |
|---|
|
|
| C000012100 |
|
|
|
| Shareholder Report [Line Items] |
|
|
|
| Fund Name |
|
iShares Global Financials ETF
|
|
| Trading Symbol |
|
IXG
|
|
| Security Exchange Name |
|
NYSEArca
|
|
| Annual or Semi-Annual Statement [Text Block] |
|
This annual shareholder report contains important information about iShares Global Financials ETF (the “Fund”) for the period of April 1, 2025 to March 31, 2026
|
|
| Additional Information [Text Block] |
|
You can find additional information about the Fund at blackrock.com/fundreports. You can also request this information by contacting us at 1-800-iShares (1-800-474-2737).
|
|
| Additional Information Phone Number |
|
1-800-474-2737
|
|
| Additional Information Website |
|
blackrock.com/fundreports
|
|
| Expenses [Text Block] |
|
What were the Fund costs for the last year?(based on a hypothetical $10,000 investment) Table SummaryFund name | Costs of a $10,000
investment | Costs paid as a percentage of a
$10,000 investment |
|---|
iShares Global Financials ETF | $41 | 0.38% |
|---|
|
|
| Expenses Paid, Amount |
|
$ 41
|
|
| Expense Ratio, Percent |
|
0.38%
|
|
| Performance Past Does Not Indicate Future [Text] |
|
Past performance is not an indication of future results.
|
|
| Line Graph [Table Text Block] |
|
Cumulative performance: April 1, 2016 through March 31, 2026 Initial investment of $10,000 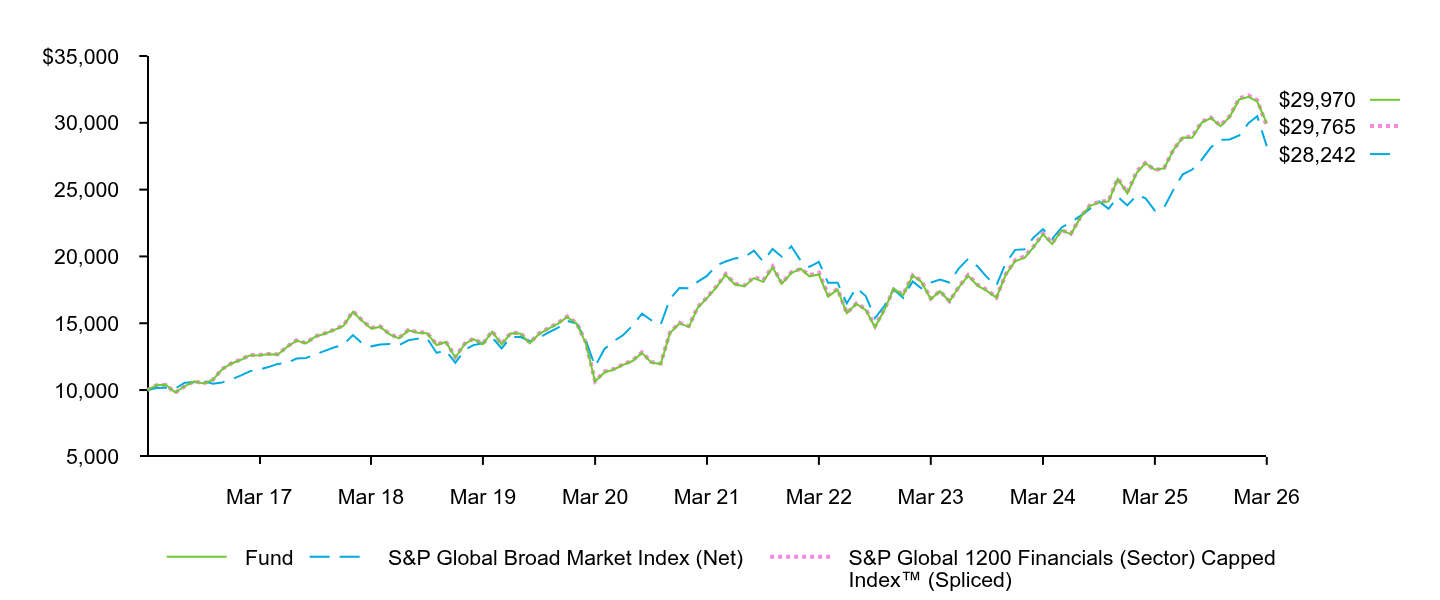 Table Summary | Fund | S&P Global Broad Market Index (Net) | S&P Global 1200 Financials (Sector) Capped Index™ (Spliced) |
|---|
Mar 16 | $10,000 | $10,000 | $10,000 |
|---|
Apr 16 | $10,360 | $10,161 | $10,359 |
|---|
May 16 | $10,390 | $10,176 | $10,389 |
|---|
Jun 16 | $9,811 | $10,102 | $9,807 |
|---|
Jul 16 | $10,285 | $10,554 | $10,284 |
|---|
Aug 16 | $10,657 | $10,592 | $10,659 |
|---|
Sep 16 | $10,492 | $10,669 | $10,497 |
|---|
Oct 16 | $10,762 | $10,466 | $10,768 |
|---|
Nov 16 | $11,552 | $10,573 | $11,568 |
|---|
Dec 16 | $11,990 | $10,800 | $12,010 |
|---|
Jan 17 | $12,265 | $11,095 | $12,289 |
|---|
Feb 17 | $12,593 | $11,400 | $12,621 |
|---|
Mar 17 | $12,603 | $11,535 | $12,628 |
|---|
Apr 17 | $12,680 | $11,720 | $12,704 |
|---|
May 17 | $12,661 | $11,959 | $12,674 |
|---|
Jun 17 | $13,227 | $12,032 | $13,245 |
|---|
Jul 17 | $13,700 | $12,362 | $13,722 |
|---|
Aug 17 | $13,496 | $12,406 | $13,518 |
|---|
Sep 17 | $13,998 | $12,670 | $14,024 |
|---|
Oct 17 | $14,214 | $12,928 | $14,240 |
|---|
Nov 17 | $14,491 | $13,182 | $14,522 |
|---|
Dec 17 | $14,799 | $13,398 | $14,832 |
|---|
Jan 18 | $15,854 | $14,119 | $15,899 |
|---|
Feb 18 | $15,218 | $13,533 | $15,265 |
|---|
Mar 18 | $14,608 | $13,271 | $14,649 |
|---|
Apr 18 | $14,727 | $13,402 | $14,769 |
|---|
May 18 | $14,161 | $13,453 | $14,191 |
|---|
Jun 18 | $13,863 | $13,364 | $13,898 |
|---|
Jul 18 | $14,467 | $13,728 | $14,505 |
|---|
Aug 18 | $14,295 | $13,849 | $14,332 |
|---|
Sep 18 | $14,249 | $13,873 | $14,293 |
|---|
Oct 18 | $13,369 | $12,779 | $13,409 |
|---|
Nov 18 | $13,598 | $12,976 | $13,637 |
|---|
Dec 18 | $12,435 | $12,038 | $12,470 |
|---|
Jan 19 | $13,447 | $13,007 | $13,482 |
|---|
Feb 19 | $13,807 | $13,364 | $13,843 |
|---|
Mar 19 | $13,436 | $13,499 | $13,468 |
|---|
Apr 19 | $14,371 | $13,941 | $14,409 |
|---|
May 19 | $13,421 | $13,118 | $13,446 |
|---|
Jun 19 | $14,252 | $13,954 | $14,281 |
|---|
Jul 19 | $14,238 | $13,986 | $14,279 |
|---|
Aug 19 | $13,499 | $13,638 | $13,540 |
|---|
Sep 19 | $14,189 | $13,920 | $14,235 |
|---|
Oct 19 | $14,596 | $14,308 | $14,649 |
|---|
Nov 19 | $14,951 | $14,658 | $15,005 |
|---|
Dec 19 | $15,463 | $15,176 | $15,513 |
|---|
Jan 20 | $14,959 | $14,971 | $15,012 |
|---|
Feb 20 | $13,557 | $13,749 | $13,611 |
|---|
Mar 20 | $10,634 | $11,771 | $10,671 |
|---|
Apr 20 | $11,318 | $13,056 | $11,380 |
|---|
May 20 | $11,538 | $13,664 | $11,578 |
|---|
Jun 20 | $11,880 | $14,100 | $11,925 |
|---|
Jul 20 | $12,172 | $14,812 | $12,217 |
|---|
Aug 20 | $12,779 | $15,713 | $12,826 |
|---|
Sep 20 | $12,063 | $15,227 | $12,108 |
|---|
Oct 20 | $11,944 | $14,902 | $11,988 |
|---|
Nov 20 | $14,262 | $16,802 | $14,311 |
|---|
Dec 20 | $14,986 | $17,637 | $15,041 |
|---|
Jan 21 | $14,730 | $17,609 | $14,787 |
|---|
Feb 21 | $16,140 | $18,091 | $16,203 |
|---|
Mar 21 | $16,879 | $18,540 | $16,937 |
|---|
Apr 21 | $17,688 | $19,333 | $17,744 |
|---|
May 21 | $18,632 | $19,618 | $18,682 |
|---|
Jun 21 | $17,900 | $19,854 | $17,958 |
|---|
Jul 21 | $17,766 | $19,937 | $17,831 |
|---|
Aug 21 | $18,379 | $20,432 | $18,453 |
|---|
Sep 21 | $18,101 | $19,630 | $18,214 |
|---|
Oct 21 | $19,183 | $20,556 | $19,250 |
|---|
Nov 21 | $17,951 | $19,979 | $17,996 |
|---|
Dec 21 | $18,754 | $20,759 | $18,824 |
|---|
Jan 22 | $19,082 | $19,665 | $19,075 |
|---|
Feb 22 | $18,513 | $19,217 | $18,604 |
|---|
Mar 22 | $18,648 | $19,586 | $18,788 |
|---|
Apr 22 | $16,991 | $18,025 | $17,126 |
|---|
May 22 | $17,516 | $18,033 | $17,557 |
|---|
Jun 22 | $15,752 | $16,485 | $15,762 |
|---|
Jul 22 | $16,463 | $17,643 | $16,473 |
|---|
Aug 22 | $15,980 | $17,032 | $16,065 |
|---|
Sep 22 | $14,698 | $15,382 | $14,780 |
|---|
Oct 22 | $16,007 | $16,305 | $16,052 |
|---|
Nov 22 | $17,594 | $17,550 | $17,524 |
|---|
Dec 22 | $17,099 | $16,891 | $17,155 |
|---|
Jan 23 | $18,573 | $18,127 | $18,592 |
|---|
Feb 23 | $18,110 | $17,621 | $18,191 |
|---|
Mar 23 | $16,809 | $18,040 | $16,843 |
|---|
Apr 23 | $17,395 | $18,266 | $17,412 |
|---|
May 23 | $16,634 | $18,045 | $16,640 |
|---|
Jun 23 | $17,690 | $19,093 | $17,714 |
|---|
Jul 23 | $18,557 | $19,825 | $18,609 |
|---|
Aug 23 | $17,818 | $19,247 | $17,875 |
|---|
Sep 23 | $17,419 | $18,449 | $17,505 |
|---|
Oct 23 | $16,909 | $17,826 | $16,922 |
|---|
Nov 23 | $18,601 | $19,467 | $18,652 |
|---|
Dec 23 | $19,652 | $20,492 | $19,706 |
|---|
Jan 24 | $19,891 | $20,530 | $20,017 |
|---|
Feb 24 | $20,672 | $21,398 | $20,724 |
|---|
Mar 24 | $21,658 | $22,051 | $21,712 |
|---|
Apr 24 | $20,914 | $21,322 | $21,012 |
|---|
May 24 | $21,967 | $22,172 | $21,974 |
|---|
Jun 24 | $21,655 | $22,562 | $21,693 |
|---|
Jul 24 | $22,903 | $23,036 | $22,943 |
|---|
Aug 24 | $23,783 | $23,561 | $23,815 |
|---|
Sep 24 | $24,027 | $24,119 | $24,088 |
|---|
Oct 24 | $24,119 | $23,562 | $24,170 |
|---|
Nov 24 | $25,811 | $24,472 | $25,834 |
|---|
Dec 24 | $24,713 | $23,820 | $24,778 |
|---|
Jan 25 | $26,265 | $24,581 | $26,377 |
|---|
Feb 25 | $26,972 | $24,360 | $27,000 |
|---|
Mar 25 | $26,485 | $23,428 | $26,463 |
|---|
Apr 25 | $26,586 | $23,653 | $26,611 |
|---|
May 25 | $27,986 | $25,016 | $28,021 |
|---|
Jun 25 | $28,900 | $26,146 | $28,899 |
|---|
Jul 25 | $28,882 | $26,502 | $28,996 |
|---|
Aug 25 | $30,016 | $27,248 | $30,077 |
|---|
Sep 25 | $30,360 | $28,166 | $30,392 |
|---|
Oct 25 | $29,751 | $28,727 | $29,803 |
|---|
Nov 25 | $30,447 | $28,753 | $30,497 |
|---|
Dec 25 | $31,747 | $29,050 | $31,834 |
|---|
Jan 26 | $31,940 | $29,995 | $32,054 |
|---|
Feb 26 | $31,576 | $30,491 | $31,699 |
|---|
Mar 26 | $29,970 | $28,242 | $29,765 |
|---|
See “Average annual total returns” for additional information on fund performance. |
|
| No Deduction of Taxes [Text Block] |
|
Performance results do not reflect the deduction of taxes that a shareholder would pay on fund distributions or on the redemption or sale of fund shares.
|
|
| AssetsNet |
|
$ 518,985,752
|
|
| Holdings Count | Holding |
|
223
|
|
| Advisory Fees Paid, Amount |
|
$ 2,144,233
|
|
| InvestmentCompanyPortfolioTurnover |
|
6.00%
|
|
| Additional Fund Statistics [Text Block] |
|
Table SummaryNet Assets........................................................................................................................................................................................................................................................................................................................................................................................................................................................................................................................................................................................................................................................................................................................................................................................................................................................................................................................................................................................................................................ | $518,985,752 |
|---|
Number of Portfolio Holdings........................................................................................................................................................................................................................................................................................................................................................................................................................................................................................................................................................................................................................................................................................................................................................................................................................................................................................................................................................................................................................................ | 223 |
|---|
Net Investment Advisory Fees........................................................................................................................................................................................................................................................................................................................................................................................................................................................................................................................................................................................................................................................................................................................................................................................................................................................................................................................................................................................................................................ | $2,144,233 |
|---|
Portfolio Turnover Rate........................................................................................................................................................................................................................................................................................................................................................................................................................................................................................................................................................................................................................................................................................................................................................................................................................................................................................................................................................................................................................................ | 6% |
|---|
|
|
| C000012102 |
|
|
|
| Shareholder Report [Line Items] |
|
|
|
| Fund Name |
|
iShares Global Healthcare ETF
|
|
| Trading Symbol |
|
IXJ
|
|
| Security Exchange Name |
|
NYSEArca
|
|
| Annual or Semi-Annual Statement [Text Block] |
|
This annual shareholder report contains important information about iShares Global Healthcare ETF (the “Fund”) for the period of April 1, 2025 to March 31, 2026
|
|
| Additional Information [Text Block] |
|
You can find additional information about the Fund at blackrock.com/fundreports. You can also request this information by contacting us at 1-800-iShares (1-800-474-2737).
|
|
| Additional Information Phone Number |
|
1-800-474-2737
|
|
| Additional Information Website |
|
blackrock.com/fundreports
|
|
| Expenses [Text Block] |
|
What were the Fund costs for the last year?(based on a hypothetical $10,000 investment) Table SummaryFund name | Costs of a $10,000
investment | Costs paid as a percentage of a
$10,000 investment |
|---|
iShares Global Healthcare ETF | $39 | 0.38% |
|---|
|
|
| Expenses Paid, Amount |
|
$ 39
|
|
| Expense Ratio, Percent |
|
0.38%
|
|
| Performance Past Does Not Indicate Future [Text] |
|
Past performance is not an indication of future results.
|
|
| Line Graph [Table Text Block] |
|
Cumulative performance: April 1, 2016 through March 31, 2026 Initial investment of $10,000 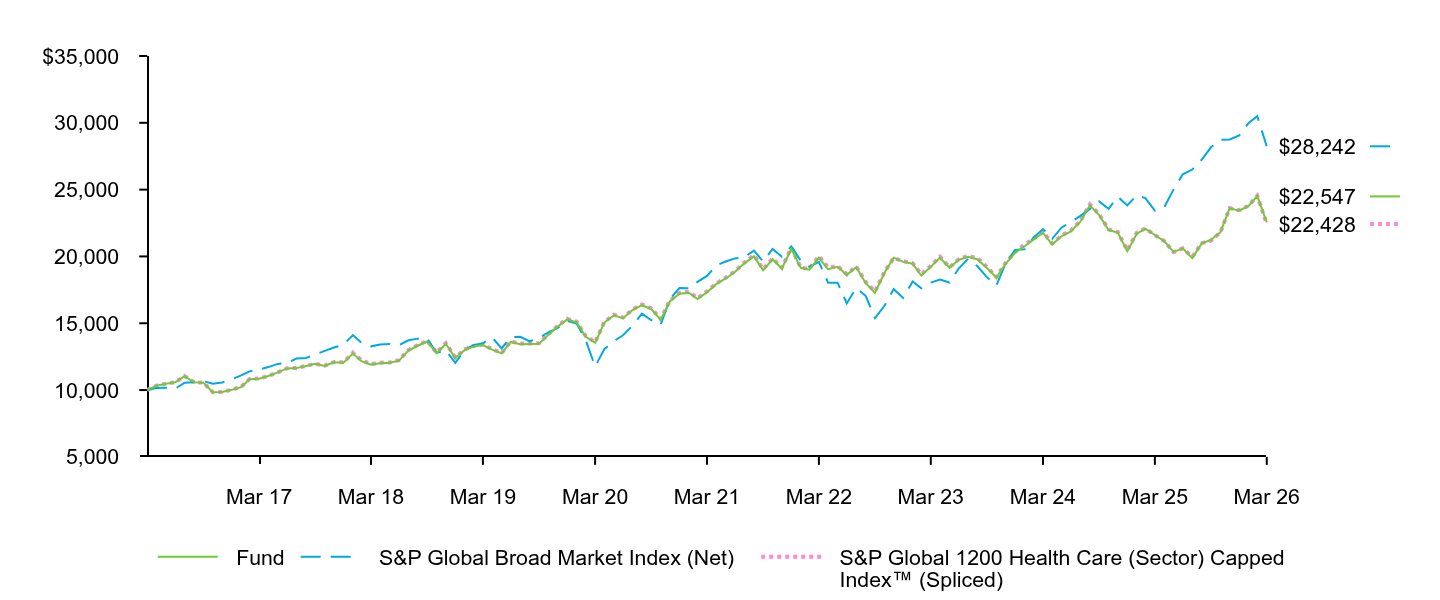 Table Summary | Fund | S&P Global Broad Market Index (Net) | S&P Global 1200 Health Care (Sector) Capped Index™ (Spliced) |
|---|
Mar 16 | $10,000 | $10,000 | $10,000 |
|---|
Apr 16 | $10,321 | $10,161 | $10,326 |
|---|
May 16 | $10,469 | $10,176 | $10,474 |
|---|
Jun 16 | $10,577 | $10,102 | $10,582 |
|---|
Jul 16 | $11,036 | $10,554 | $11,044 |
|---|
Aug 16 | $10,578 | $10,592 | $10,585 |
|---|
Sep 16 | $10,555 | $10,669 | $10,561 |
|---|
Oct 16 | $9,836 | $10,466 | $9,842 |
|---|
Nov 16 | $9,851 | $10,573 | $9,857 |
|---|
Dec 16 | $10,016 | $10,800 | $10,024 |
|---|
Jan 17 | $10,222 | $11,095 | $10,233 |
|---|
Feb 17 | $10,811 | $11,400 | $10,825 |
|---|
Mar 17 | $10,852 | $11,535 | $10,859 |
|---|
Apr 17 | $11,055 | $11,720 | $11,059 |
|---|
May 17 | $11,320 | $11,959 | $11,325 |
|---|
Jun 17 | $11,619 | $12,032 | $11,628 |
|---|
Jul 17 | $11,643 | $12,362 | $11,655 |
|---|
Aug 17 | $11,796 | $12,406 | $11,808 |
|---|
Sep 17 | $11,959 | $12,670 | $11,972 |
|---|
Oct 17 | $11,805 | $12,928 | $11,827 |
|---|
Nov 17 | $12,077 | $13,182 | $12,098 |
|---|
Dec 17 | $12,053 | $13,398 | $12,079 |
|---|
Jan 18 | $12,733 | $14,119 | $12,785 |
|---|
Feb 18 | $12,165 | $13,533 | $12,222 |
|---|
Mar 18 | $11,905 | $13,271 | $11,948 |
|---|
Apr 18 | $12,012 | $13,402 | $12,047 |
|---|
May 18 | $12,038 | $13,453 | $12,067 |
|---|
Jun 18 | $12,198 | $13,364 | $12,238 |
|---|
Jul 18 | $12,956 | $13,728 | $12,997 |
|---|
Aug 18 | $13,334 | $13,849 | $13,371 |
|---|
Sep 18 | $13,635 | $13,873 | $13,685 |
|---|
Oct 18 | $12,753 | $12,779 | $12,801 |
|---|
Nov 18 | $13,462 | $12,976 | $13,512 |
|---|
Dec 18 | $12,397 | $12,038 | $12,442 |
|---|
Jan 19 | $12,999 | $13,007 | $13,046 |
|---|
Feb 19 | $13,250 | $13,364 | $13,300 |
|---|
Mar 19 | $13,368 | $13,499 | $13,413 |
|---|
Apr 19 | $13,027 | $13,941 | $13,070 |
|---|
May 19 | $12,743 | $13,118 | $12,776 |
|---|
Jun 19 | $13,601 | $13,954 | $13,642 |
|---|
Jul 19 | $13,436 | $13,986 | $13,479 |
|---|
Aug 19 | $13,447 | $13,638 | $13,489 |
|---|
Sep 19 | $13,460 | $13,920 | $13,502 |
|---|
Oct 19 | $14,148 | $14,308 | $14,193 |
|---|
Nov 19 | $14,757 | $14,658 | $14,803 |
|---|
Dec 19 | $15,293 | $15,176 | $15,343 |
|---|
Jan 20 | $15,060 | $14,971 | $15,111 |
|---|
Feb 20 | $14,006 | $13,749 | $14,052 |
|---|
Mar 20 | $13,533 | $11,771 | $13,575 |
|---|
Apr 20 | $15,054 | $13,056 | $15,101 |
|---|
May 20 | $15,587 | $13,664 | $15,633 |
|---|
Jun 20 | $15,375 | $14,100 | $15,421 |
|---|
Jul 20 | $15,986 | $14,812 | $16,034 |
|---|
Aug 20 | $16,349 | $15,713 | $16,400 |
|---|
Sep 20 | $16,062 | $15,227 | $16,120 |
|---|
Oct 20 | $15,263 | $14,902 | $15,319 |
|---|
Nov 20 | $16,631 | $16,802 | $16,692 |
|---|
Dec 20 | $17,202 | $17,637 | $17,265 |
|---|
Jan 21 | $17,287 | $17,609 | $17,350 |
|---|
Feb 21 | $16,810 | $18,091 | $16,873 |
|---|
Mar 21 | $17,325 | $18,540 | $17,382 |
|---|
Apr 21 | $17,924 | $19,333 | $17,983 |
|---|
May 21 | $18,350 | $19,618 | $18,413 |
|---|
Jun 21 | $18,830 | $19,854 | $18,892 |
|---|
Jul 21 | $19,483 | $19,937 | $19,541 |
|---|
Aug 21 | $20,024 | $20,432 | $20,101 |
|---|
Sep 21 | $18,961 | $19,630 | $19,055 |
|---|
Oct 21 | $19,784 | $20,556 | $19,847 |
|---|
Nov 21 | $19,100 | $19,979 | $19,156 |
|---|
Dec 21 | $20,554 | $20,759 | $20,645 |
|---|
Jan 22 | $19,146 | $19,665 | $19,166 |
|---|
Feb 22 | $19,009 | $19,217 | $19,076 |
|---|
Mar 22 | $19,914 | $19,586 | $20,029 |
|---|
Apr 22 | $19,050 | $18,025 | $19,162 |
|---|
May 22 | $19,229 | $18,033 | $19,287 |
|---|
Jun 22 | $18,622 | $16,485 | $18,662 |
|---|
Jul 22 | $19,197 | $17,643 | $19,249 |
|---|
Aug 22 | $17,998 | $17,032 | $18,085 |
|---|
Sep 22 | $17,282 | $15,382 | $17,380 |
|---|
Oct 22 | $18,774 | $16,305 | $18,851 |
|---|
Nov 22 | $19,906 | $17,550 | $19,877 |
|---|
Dec 22 | $19,590 | $16,891 | $19,650 |
|---|
Jan 23 | $19,452 | $18,127 | $19,491 |
|---|
Feb 23 | $18,575 | $17,621 | $18,671 |
|---|
Mar 23 | $19,230 | $18,040 | $19,282 |
|---|
Apr 23 | $19,910 | $18,266 | $19,986 |
|---|
May 23 | $19,151 | $18,045 | $19,178 |
|---|
Jun 23 | $19,744 | $19,093 | $19,792 |
|---|
Jul 23 | $19,976 | $19,825 | $20,053 |
|---|
Aug 23 | $19,774 | $19,247 | $19,864 |
|---|
Sep 23 | $19,137 | $18,449 | $19,222 |
|---|
Oct 23 | $18,427 | $17,826 | $18,457 |
|---|
Nov 23 | $19,443 | $19,467 | $19,509 |
|---|
Dec 23 | $20,275 | $20,492 | $20,340 |
|---|
Jan 24 | $20,766 | $20,530 | $20,875 |
|---|
Feb 24 | $21,255 | $21,398 | $21,340 |
|---|
Mar 24 | $21,772 | $22,051 | $21,835 |
|---|
Apr 24 | $20,892 | $21,322 | $20,989 |
|---|
May 24 | $21,521 | $22,172 | $21,564 |
|---|
Jun 24 | $21,868 | $22,562 | $21,944 |
|---|
Jul 24 | $22,595 | $23,036 | $22,659 |
|---|
Aug 24 | $23,828 | $23,561 | $23,883 |
|---|
Sep 24 | $23,115 | $24,119 | $23,165 |
|---|
Oct 24 | $21,972 | $23,562 | $22,023 |
|---|
Nov 24 | $21,790 | $24,472 | $21,829 |
|---|
Dec 24 | $20,396 | $23,820 | $20,466 |
|---|
Jan 25 | $21,701 | $24,581 | $21,778 |
|---|
Feb 25 | $22,082 | $24,360 | $22,099 |
|---|
Mar 25 | $21,601 | $23,428 | $21,595 |
|---|
Apr 25 | $21,147 | $23,653 | $21,167 |
|---|
May 25 | $20,341 | $25,016 | $20,329 |
|---|
Jun 25 | $20,604 | $26,146 | $20,602 |
|---|
Jul 25 | $19,872 | $26,502 | $19,981 |
|---|
Aug 25 | $20,976 | $27,248 | $20,993 |
|---|
Sep 25 | $21,243 | $28,166 | $21,176 |
|---|
Oct 25 | $21,812 | $28,727 | $21,817 |
|---|
Nov 25 | $23,606 | $28,753 | $23,616 |
|---|
Dec 25 | $23,425 | $29,050 | $23,466 |
|---|
Jan 26 | $23,775 | $29,995 | $23,798 |
|---|
Feb 26 | $24,520 | $30,491 | $24,538 |
|---|
Mar 26 | $22,547 | $28,242 | $22,428 |
|---|
See “Average annual total returns” for additional information on fund performance. |
|
| No Deduction of Taxes [Text Block] |
|
Performance results do not reflect the deduction of taxes that a shareholder would pay on fund distributions or on the redemption or sale of fund shares.
|
|
| AssetsNet |
|
$ 3,591,275,317
|
|
| Holdings Count | Holding |
|
116
|
|
| Advisory Fees Paid, Amount |
|
$ 15,095,256
|
|
| InvestmentCompanyPortfolioTurnover |
|
2.00%
|
|
| Additional Fund Statistics [Text Block] |
|
Table SummaryNet Assets........................................................................................................................................................................................................................................................................................................................................................................................................................................................................................................................................................................................................................................................................................................................................................................................................................................................................................................................................................................................................................................ | $3,591,275,317 |
|---|
Number of Portfolio Holdings........................................................................................................................................................................................................................................................................................................................................................................................................................................................................................................................................................................................................................................................................................................................................................................................................................................................................................................................................................................................................................................ | 116 |
|---|
Net Investment Advisory Fees........................................................................................................................................................................................................................................................................................................................................................................................................................................................................................................................................................................................................................................................................................................................................................................................................................................................................................................................................................................................................................................ | $15,095,256 |
|---|
Portfolio Turnover Rate........................................................................................................................................................................................................................................................................................................................................................................................................................................................................................................................................................................................................................................................................................................................................................................................................................................................................................................................................................................................................................................ | 2% |
|---|
|
|
| C000024196 |
|
|
|
| Shareholder Report [Line Items] |
|
|
|
| Fund Name |
|
iShares Global Industrials ETF
|
|
| Trading Symbol |
|
EXI
|
|
| Security Exchange Name |
|
NYSEArca
|
|
| Annual or Semi-Annual Statement [Text Block] |
|
This annual shareholder report contains important information about iShares Global Industrials ETF (the “Fund”) for the period of April 1, 2025 to March 31, 2026
|
|
| Additional Information [Text Block] |
|
You can find additional information about the Fund at blackrock.com/fundreports. You can also request this information by contacting us at 1-800-iShares (1-800-474-2737).
|
|
| Additional Information Phone Number |
|
1-800-474-2737
|
|
| Additional Information Website |
|
blackrock.com/fundreports
|
|
| Expenses [Text Block] |
|
What were the Fund costs for the last year?(based on a hypothetical $10,000 investment) Table SummaryFund name | Costs of a $10,000
investment | Costs paid as a percentage of a
$10,000 investment |
|---|
iShares Global Industrials ETF | $43 | 0.38% |
|---|
|
|
| Expenses Paid, Amount |
|
$ 43
|
|
| Expense Ratio, Percent |
|
0.38%
|
|
| Performance Past Does Not Indicate Future [Text] |
|
Past performance is not an indication of future results.
|
|
| Line Graph [Table Text Block] |
|
Cumulative performance: April 1, 2016 through March 31, 2026 Initial investment of $10,000 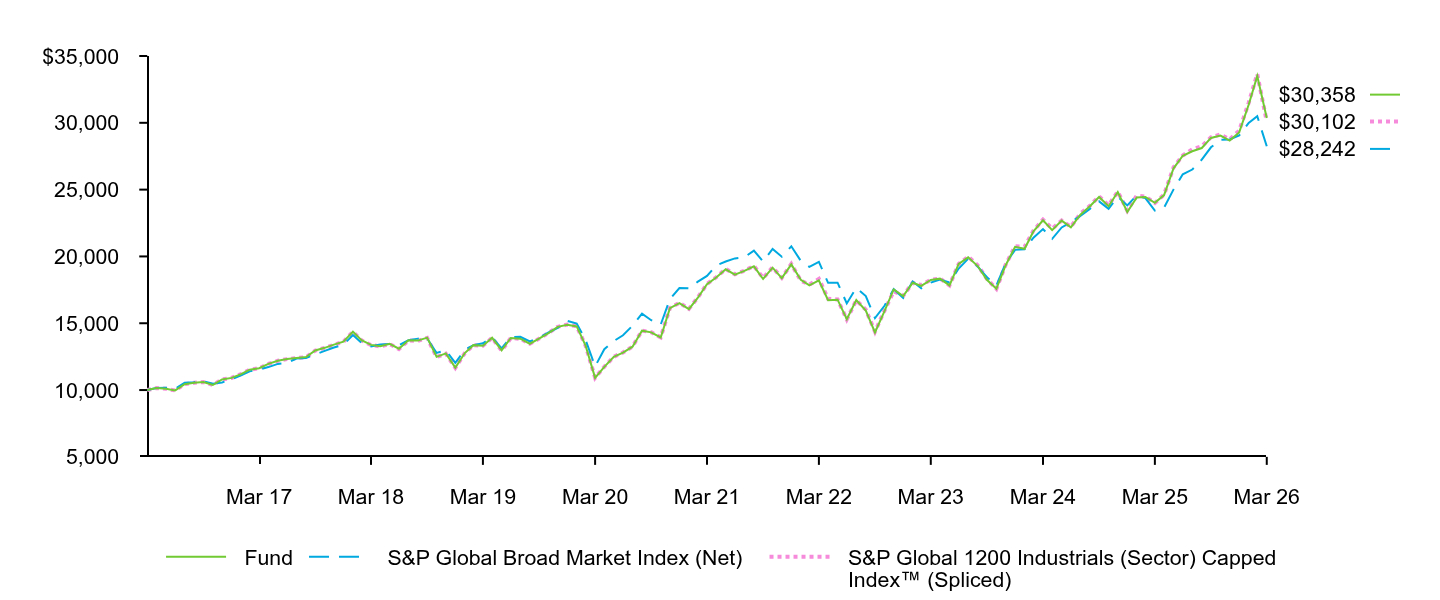 Table Summary | Fund | S&P Global Broad Market Index (Net) | S&P Global 1200 Industrials (Sector) Capped Index™ (Spliced) |
|---|
Mar 16 | $10,000 | $10,000 | $10,000 |
|---|
Apr 16 | $10,153 | $10,161 | $10,152 |
|---|
May 16 | $10,099 | $10,176 | $10,090 |
|---|
Jun 16 | $9,977 | $10,102 | $9,972 |
|---|
Jul 16 | $10,437 | $10,554 | $10,439 |
|---|
Aug 16 | $10,546 | $10,592 | $10,547 |
|---|
Sep 16 | $10,600 | $10,669 | $10,600 |
|---|
Oct 16 | $10,378 | $10,466 | $10,383 |
|---|
Nov 16 | $10,797 | $10,573 | $10,791 |
|---|
Dec 16 | $10,912 | $10,800 | $10,907 |
|---|
Jan 17 | $11,197 | $11,095 | $11,195 |
|---|
Feb 17 | $11,522 | $11,400 | $11,517 |
|---|
Mar 17 | $11,638 | $11,535 | $11,633 |
|---|
Apr 17 | $11,960 | $11,720 | $11,954 |
|---|
May 17 | $12,198 | $11,959 | $12,189 |
|---|
Jun 17 | $12,320 | $12,032 | $12,316 |
|---|
Jul 17 | $12,399 | $12,362 | $12,395 |
|---|
Aug 17 | $12,468 | $12,406 | $12,459 |
|---|
Sep 17 | $12,964 | $12,670 | $12,953 |
|---|
Oct 17 | $13,161 | $12,928 | $13,160 |
|---|
Nov 17 | $13,402 | $13,182 | $13,394 |
|---|
Dec 17 | $13,627 | $13,398 | $13,618 |
|---|
Jan 18 | $14,363 | $14,119 | $14,360 |
|---|
Feb 18 | $13,732 | $13,533 | $13,717 |
|---|
Mar 18 | $13,382 | $13,271 | $13,371 |
|---|
Apr 18 | $13,279 | $13,402 | $13,268 |
|---|
May 18 | $13,463 | $13,453 | $13,443 |
|---|
Jun 18 | $13,093 | $13,364 | $13,071 |
|---|
Jul 18 | $13,725 | $13,728 | $13,709 |
|---|
Aug 18 | $13,700 | $13,849 | $13,682 |
|---|
Sep 18 | $13,922 | $13,873 | $13,905 |
|---|
Oct 18 | $12,488 | $12,779 | $12,475 |
|---|
Nov 18 | $12,744 | $12,976 | $12,729 |
|---|
Dec 18 | $11,676 | $12,038 | $11,663 |
|---|
Jan 19 | $12,770 | $13,007 | $12,766 |
|---|
Feb 19 | $13,361 | $13,364 | $13,355 |
|---|
Mar 19 | $13,320 | $13,499 | $13,312 |
|---|
Apr 19 | $13,911 | $13,941 | $13,905 |
|---|
May 19 | $12,967 | $13,118 | $12,952 |
|---|
Jun 19 | $13,898 | $13,954 | $13,890 |
|---|
Jul 19 | $13,841 | $13,986 | $13,838 |
|---|
Aug 19 | $13,466 | $13,638 | $13,460 |
|---|
Sep 19 | $13,848 | $13,920 | $13,848 |
|---|
Oct 19 | $14,264 | $14,308 | $14,270 |
|---|
Nov 19 | $14,733 | $14,658 | $14,735 |
|---|
Dec 19 | $14,892 | $15,176 | $14,901 |
|---|
Jan 20 | $14,761 | $14,971 | $14,775 |
|---|
Feb 20 | $13,322 | $13,749 | $13,329 |
|---|
Mar 20 | $10,912 | $11,771 | $10,918 |
|---|
Apr 20 | $11,736 | $13,056 | $11,746 |
|---|
May 20 | $12,488 | $13,664 | $12,491 |
|---|
Jun 20 | $12,807 | $14,100 | $12,812 |
|---|
Jul 20 | $13,247 | $14,812 | $13,253 |
|---|
Aug 20 | $14,442 | $15,713 | $14,450 |
|---|
Sep 20 | $14,316 | $15,227 | $14,325 |
|---|
Oct 20 | $13,933 | $14,902 | $13,945 |
|---|
Nov 20 | $16,130 | $16,802 | $16,143 |
|---|
Dec 20 | $16,511 | $17,637 | $16,529 |
|---|
Jan 21 | $16,054 | $17,609 | $16,076 |
|---|
Feb 21 | $16,875 | $18,091 | $16,896 |
|---|
Mar 21 | $17,925 | $18,540 | $17,943 |
|---|
Apr 21 | $18,423 | $19,333 | $18,442 |
|---|
May 21 | $19,036 | $19,618 | $19,066 |
|---|
Jun 21 | $18,636 | $19,854 | $18,657 |
|---|
Jul 21 | $18,922 | $19,937 | $18,934 |
|---|
Aug 21 | $19,257 | $20,432 | $19,294 |
|---|
Sep 21 | $18,313 | $19,630 | $18,389 |
|---|
Oct 21 | $19,157 | $20,556 | $19,181 |
|---|
Nov 21 | $18,383 | $19,979 | $18,400 |
|---|
Dec 21 | $19,403 | $20,759 | $19,440 |
|---|
Jan 22 | $18,247 | $19,665 | $18,194 |
|---|
Feb 22 | $17,831 | $19,217 | $17,886 |
|---|
Mar 22 | $18,201 | $19,586 | $18,323 |
|---|
Apr 22 | $16,726 | $18,025 | $16,830 |
|---|
May 22 | $16,765 | $18,033 | $16,780 |
|---|
Jun 22 | $15,301 | $16,485 | $15,286 |
|---|
Jul 22 | $16,743 | $17,643 | $16,718 |
|---|
Aug 22 | $15,953 | $17,032 | $16,020 |
|---|
Sep 22 | $14,313 | $15,382 | $14,374 |
|---|
Oct 22 | $15,910 | $16,305 | $15,948 |
|---|
Nov 22 | $17,529 | $17,550 | $17,388 |
|---|
Dec 22 | $17,026 | $16,891 | $17,059 |
|---|
Jan 23 | $18,034 | $18,127 | $18,025 |
|---|
Feb 23 | $17,798 | $17,621 | $17,859 |
|---|
Mar 23 | $18,241 | $18,040 | $18,253 |
|---|
Apr 23 | $18,337 | $18,266 | $18,351 |
|---|
May 23 | $17,834 | $18,045 | $17,835 |
|---|
Jun 23 | $19,434 | $19,093 | $19,436 |
|---|
Jul 23 | $19,933 | $19,825 | $19,984 |
|---|
Aug 23 | $19,281 | $19,247 | $19,339 |
|---|
Sep 23 | $18,251 | $18,449 | $18,324 |
|---|
Oct 23 | $17,586 | $17,826 | $17,573 |
|---|
Nov 23 | $19,322 | $19,467 | $19,366 |
|---|
Dec 23 | $20,717 | $20,492 | $20,767 |
|---|
Jan 24 | $20,572 | $20,530 | $20,727 |
|---|
Feb 24 | $21,885 | $21,398 | $21,933 |
|---|
Mar 24 | $22,701 | $22,051 | $22,746 |
|---|
Apr 24 | $21,969 | $21,322 | $22,087 |
|---|
May 24 | $22,680 | $22,172 | $22,683 |
|---|
Jun 24 | $22,178 | $22,562 | $22,219 |
|---|
Jul 24 | $23,121 | $23,036 | $23,202 |
|---|
Aug 24 | $23,756 | $23,561 | $23,790 |
|---|
Sep 24 | $24,450 | $24,119 | $24,501 |
|---|
Oct 24 | $23,759 | $23,562 | $23,828 |
|---|
Nov 24 | $24,824 | $24,472 | $24,854 |
|---|
Dec 24 | $23,322 | $23,820 | $23,431 |
|---|
Jan 25 | $24,415 | $24,581 | $24,556 |
|---|
Feb 25 | $24,452 | $24,360 | $24,466 |
|---|
Mar 25 | $24,011 | $23,428 | $24,001 |
|---|
Apr 25 | $24,591 | $23,653 | $24,629 |
|---|
May 25 | $26,597 | $25,016 | $26,673 |
|---|
Jun 25 | $27,533 | $26,146 | $27,554 |
|---|
Jul 25 | $27,869 | $26,502 | $28,018 |
|---|
Aug 25 | $28,112 | $27,248 | $28,246 |
|---|
Sep 25 | $28,869 | $28,166 | $28,919 |
|---|
Oct 25 | $29,044 | $28,727 | $29,127 |
|---|
Nov 25 | $28,675 | $28,753 | $28,758 |
|---|
Dec 25 | $29,283 | $29,050 | $29,412 |
|---|
Jan 26 | $31,355 | $29,995 | $31,496 |
|---|
Feb 26 | $33,506 | $30,491 | $33,653 |
|---|
Mar 26 | $30,358 | $28,242 | $30,102 |
|---|
See “Average annual total returns” for additional information on fund performance. |
|
| No Deduction of Taxes [Text Block] |
|
Performance results do not reflect the deduction of taxes that a shareholder would pay on fund distributions or on the redemption or sale of fund shares.
|
|
| AssetsNet |
|
$ 1,177,242,085
|
|
| Holdings Count | Holding |
|
216
|
|
| Advisory Fees Paid, Amount |
|
$ 3,789,863
|
|
| InvestmentCompanyPortfolioTurnover |
|
6.00%
|
|
| Additional Fund Statistics [Text Block] |
|
Table SummaryNet Assets........................................................................................................................................................................................................................................................................................................................................................................................................................................................................................................................................................................................................................................................................................................................................................................................................................................................................................................................................................................................................................................ | $1,177,242,085 |
|---|
Number of Portfolio Holdings........................................................................................................................................................................................................................................................................................................................................................................................................................................................................................................................................................................................................................................................................................................................................................................................................................................................................................................................................................................................................................................ | 216 |
|---|
Net Investment Advisory Fees........................................................................................................................................................................................................................................................................................................................................................................................................................................................................................................................................................................................................................................................................................................................................................................................................................................................................................................................................................................................................................................ | $3,789,863 |
|---|
Portfolio Turnover Rate........................................................................................................................................................................................................................................................................................................................................................................................................................................................................................................................................................................................................................................................................................................................................................................................................................................................................................................................................................................................................................................ | 6% |
|---|
|
|
| C000024198 |
|
|
|
| Shareholder Report [Line Items] |
|
|
|
| Fund Name |
|
iShares Global Materials ETF
|
|
| Trading Symbol |
|
MXI
|
|
| Security Exchange Name |
|
NYSEArca
|
|
| Annual or Semi-Annual Statement [Text Block] |
|
This annual shareholder report contains important information about iShares Global Materials ETF (the “Fund”) for the period of April 1, 2025 to March 31, 2026
|
|
| Additional Information [Text Block] |
|
You can find additional information about the Fund at blackrock.com/fundreports. You can also request this information by contacting us at 1-800-iShares (1-800-474-2737).
|
|
| Additional Information Phone Number |
|
1-800-474-2737
|
|
| Additional Information Website |
|
blackrock.com/fundreports
|
|
| Expenses [Text Block] |
|
What were the Fund costs for the last year?(based on a hypothetical $10,000 investment) Table SummaryFund name | Costs of a $10,000
investment | Costs paid as a percentage of a
$10,000 investment |
|---|
iShares Global Materials ETF | $44 | 0.38% |
|---|
|
|
| Expenses Paid, Amount |
|
$ 44
|
|
| Expense Ratio, Percent |
|
0.38%
|
|
| Performance Past Does Not Indicate Future [Text] |
|
Past performance is not an indication of future results.
|
|
| Line Graph [Table Text Block] |
|
Cumulative performance: April 1, 2016 through March 31, 2026 Initial investment of $10,000 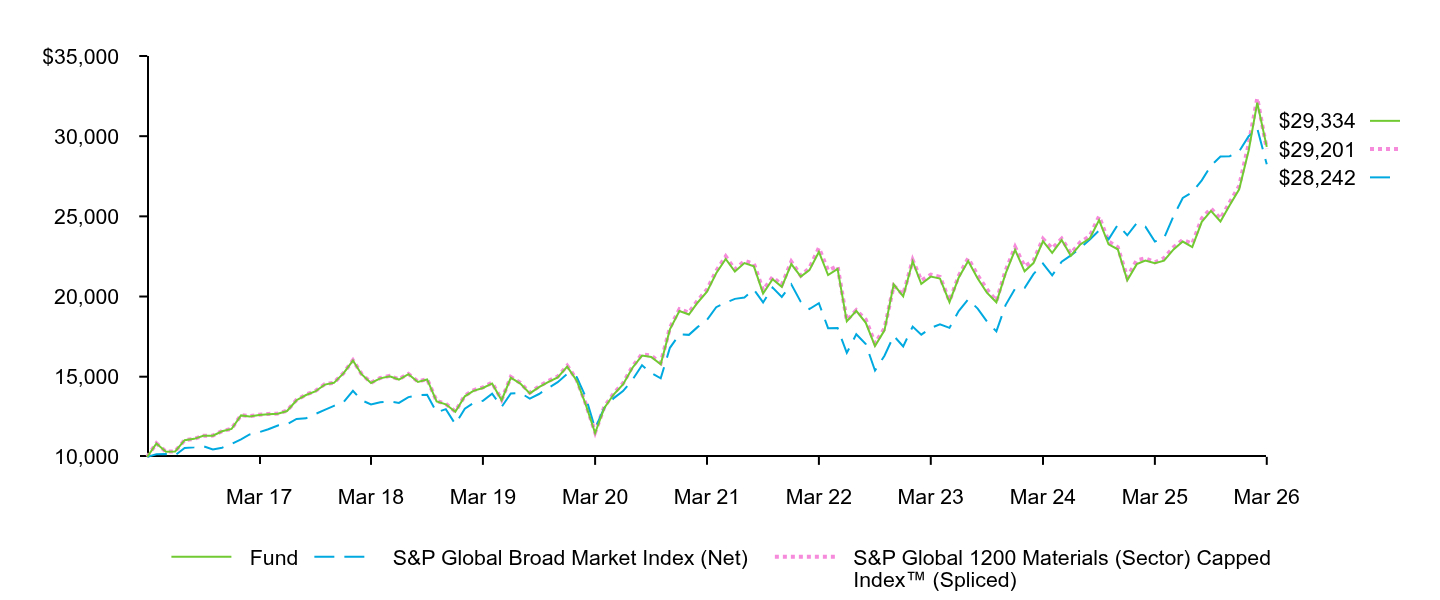 Table Summary | Fund | S&P Global Broad Market Index (Net) | S&P Global 1200 Materials (Sector) Capped Index™ (Spliced) |
|---|
Mar 16 | $10,000 | $10,000 | $10,000 |
|---|
Apr 16 | $10,840 | $10,161 | $10,847 |
|---|
May 16 | $10,321 | $10,176 | $10,323 |
|---|
Jun 16 | $10,338 | $10,102 | $10,343 |
|---|
Jul 16 | $11,039 | $10,554 | $11,045 |
|---|
Aug 16 | $11,124 | $10,592 | $11,127 |
|---|
Sep 16 | $11,310 | $10,669 | $11,311 |
|---|
Oct 16 | $11,321 | $10,466 | $11,328 |
|---|
Nov 16 | $11,596 | $10,573 | $11,608 |
|---|
Dec 16 | $11,740 | $10,800 | $11,752 |
|---|
Jan 17 | $12,587 | $11,095 | $12,604 |
|---|
Feb 17 | $12,517 | $11,400 | $12,536 |
|---|
Mar 17 | $12,613 | $11,535 | $12,632 |
|---|
Apr 17 | $12,657 | $11,720 | $12,680 |
|---|
May 17 | $12,691 | $11,959 | $12,706 |
|---|
Jun 17 | $12,859 | $12,032 | $12,877 |
|---|
Jul 17 | $13,532 | $12,362 | $13,554 |
|---|
Aug 17 | $13,858 | $12,406 | $13,886 |
|---|
Sep 17 | $14,080 | $12,670 | $14,102 |
|---|
Oct 17 | $14,507 | $12,928 | $14,534 |
|---|
Nov 17 | $14,617 | $13,182 | $14,625 |
|---|
Dec 17 | $15,209 | $13,398 | $15,223 |
|---|
Jan 18 | $16,008 | $14,119 | $16,026 |
|---|
Feb 18 | $15,157 | $13,533 | $15,177 |
|---|
Mar 18 | $14,610 | $13,271 | $14,625 |
|---|
Apr 18 | $14,896 | $13,402 | $14,919 |
|---|
May 18 | $15,031 | $13,453 | $15,050 |
|---|
Jun 18 | $14,822 | $13,364 | $14,844 |
|---|
Jul 18 | $15,154 | $13,728 | $15,179 |
|---|
Aug 18 | $14,674 | $13,849 | $14,697 |
|---|
Sep 18 | $14,828 | $13,873 | $14,854 |
|---|
Oct 18 | $13,459 | $12,779 | $13,485 |
|---|
Nov 18 | $13,280 | $12,976 | $13,309 |
|---|
Dec 18 | $12,806 | $12,038 | $12,833 |
|---|
Jan 19 | $13,777 | $13,007 | $13,815 |
|---|
Feb 19 | $14,113 | $13,364 | $14,156 |
|---|
Mar 19 | $14,298 | $13,499 | $14,339 |
|---|
Apr 19 | $14,578 | $13,941 | $14,625 |
|---|
May 19 | $13,532 | $13,118 | $13,566 |
|---|
Jun 19 | $14,933 | $13,954 | $14,978 |
|---|
Jul 19 | $14,569 | $13,986 | $14,613 |
|---|
Aug 19 | $13,956 | $13,638 | $13,998 |
|---|
Sep 19 | $14,350 | $13,920 | $14,394 |
|---|
Oct 19 | $14,683 | $14,308 | $14,733 |
|---|
Nov 19 | $14,958 | $14,658 | $15,009 |
|---|
Dec 19 | $15,631 | $15,176 | $15,686 |
|---|
Jan 20 | $14,754 | $14,971 | $14,813 |
|---|
Feb 20 | $13,288 | $13,749 | $13,340 |
|---|
Mar 20 | $11,487 | $11,771 | $11,533 |
|---|
Apr 20 | $13,057 | $13,056 | $13,117 |
|---|
May 20 | $13,903 | $13,664 | $13,969 |
|---|
Jun 20 | $14,518 | $14,100 | $14,584 |
|---|
Jul 20 | $15,559 | $14,812 | $15,635 |
|---|
Aug 20 | $16,318 | $15,713 | $16,399 |
|---|
Sep 20 | $16,224 | $15,227 | $16,311 |
|---|
Oct 20 | $15,771 | $14,902 | $15,860 |
|---|
Nov 20 | $17,949 | $16,802 | $18,054 |
|---|
Dec 20 | $19,094 | $17,637 | $19,210 |
|---|
Jan 21 | $18,876 | $17,609 | $18,993 |
|---|
Feb 21 | $19,612 | $18,091 | $19,734 |
|---|
Mar 21 | $20,306 | $18,540 | $20,430 |
|---|
Apr 21 | $21,455 | $19,333 | $21,593 |
|---|
May 21 | $22,346 | $19,618 | $22,502 |
|---|
Jun 21 | $21,559 | $19,854 | $21,686 |
|---|
Jul 21 | $22,083 | $19,937 | $22,219 |
|---|
Aug 21 | $21,879 | $20,432 | $22,044 |
|---|
Sep 21 | $20,192 | $19,630 | $20,392 |
|---|
Oct 21 | $21,075 | $20,556 | $21,220 |
|---|
Nov 21 | $20,605 | $19,979 | $20,720 |
|---|
Dec 21 | $22,026 | $20,759 | $22,178 |
|---|
Jan 22 | $21,244 | $19,665 | $21,302 |
|---|
Feb 22 | $21,644 | $19,217 | $21,775 |
|---|
Mar 22 | $22,781 | $19,586 | $23,034 |
|---|
Apr 22 | $21,338 | $18,025 | $21,630 |
|---|
May 22 | $21,726 | $18,033 | $21,894 |
|---|
Jun 22 | $18,450 | $16,485 | $18,514 |
|---|
Jul 22 | $19,109 | $17,643 | $19,148 |
|---|
Aug 22 | $18,360 | $17,032 | $18,556 |
|---|
Sep 22 | $16,913 | $15,382 | $17,077 |
|---|
Oct 22 | $17,888 | $16,305 | $18,006 |
|---|
Nov 22 | $20,759 | $17,550 | $20,672 |
|---|
Dec 22 | $20,007 | $16,891 | $20,120 |
|---|
Jan 23 | $22,189 | $18,127 | $22,270 |
|---|
Feb 23 | $20,784 | $17,621 | $20,995 |
|---|
Mar 23 | $21,240 | $18,040 | $21,365 |
|---|
Apr 23 | $21,124 | $18,266 | $21,226 |
|---|
May 23 | $19,647 | $18,045 | $19,730 |
|---|
Jun 23 | $21,178 | $19,093 | $21,279 |
|---|
Jul 23 | $22,219 | $19,825 | $22,380 |
|---|
Aug 23 | $21,129 | $19,247 | $21,319 |
|---|
Sep 23 | $20,242 | $18,449 | $20,447 |
|---|
Oct 23 | $19,641 | $17,826 | $19,722 |
|---|
Nov 23 | $21,431 | $19,467 | $21,605 |
|---|
Dec 23 | $22,907 | $20,492 | $23,089 |
|---|
Jan 24 | $21,570 | $20,530 | $21,878 |
|---|
Feb 24 | $22,086 | $21,398 | $22,235 |
|---|
Mar 24 | $23,448 | $22,051 | $23,599 |
|---|
Apr 24 | $22,727 | $21,322 | $23,000 |
|---|
May 24 | $23,519 | $22,172 | $23,599 |
|---|
Jun 24 | $22,544 | $22,562 | $22,694 |
|---|
Jul 24 | $23,250 | $23,036 | $23,386 |
|---|
Aug 24 | $23,631 | $23,561 | $23,785 |
|---|
Sep 24 | $24,763 | $24,119 | $24,999 |
|---|
Oct 24 | $23,259 | $23,562 | $23,437 |
|---|
Nov 24 | $22,946 | $24,472 | $23,072 |
|---|
Dec 24 | $21,016 | $23,820 | $21,190 |
|---|
Jan 25 | $22,018 | $24,581 | $22,265 |
|---|
Feb 25 | $22,245 | $24,360 | $22,386 |
|---|
Mar 25 | $22,084 | $23,428 | $22,137 |
|---|
Apr 25 | $22,236 | $23,653 | $22,392 |
|---|
May 25 | $22,934 | $25,016 | $23,070 |
|---|
Jun 25 | $23,428 | $26,146 | $23,532 |
|---|
Jul 25 | $23,082 | $26,502 | $23,293 |
|---|
Aug 25 | $24,661 | $27,248 | $24,863 |
|---|
Sep 25 | $25,340 | $28,166 | $25,495 |
|---|
Oct 25 | $24,683 | $28,727 | $24,851 |
|---|
Nov 25 | $25,688 | $28,753 | $25,861 |
|---|
Dec 25 | $26,684 | $29,050 | $26,901 |
|---|
Jan 26 | $29,106 | $29,995 | $29,505 |
|---|
Feb 26 | $32,089 | $30,491 | $32,367 |
|---|
Mar 26 | $29,334 | $28,242 | $29,201 |
|---|
See “Average annual total returns” for additional information on fund performance. |
|
| No Deduction of Taxes [Text Block] |
|
Performance results do not reflect the deduction of taxes that a shareholder would pay on fund distributions or on the redemption or sale of fund shares.
|
|
| AssetsNet |
|
$ 318,902,953
|
|
| Holdings Count | Holding |
|
92
|
|
| Advisory Fees Paid, Amount |
|
$ 931,833
|
|
| InvestmentCompanyPortfolioTurnover |
|
11.00%
|
|
| Additional Fund Statistics [Text Block] |
|
Table SummaryNet Assets........................................................................................................................................................................................................................................................................................................................................................................................................................................................................................................................................................................................................................................................................................................................................................................................................................................................................................................................................................................................................................................ | $318,902,953 |
|---|
Number of Portfolio Holdings........................................................................................................................................................................................................................................................................................................................................................................................................................................................................................................................................................................................................................................................................................................................................................................................................................................................................................................................................................................................................................................ | 92 |
|---|
Net Investment Advisory Fees........................................................................................................................................................................................................................................................................................................................................................................................................................................................................................................................................................................................................................................................................................................................................................................................................................................................................................................................................................................................................................................ | $931,833 |
|---|
Portfolio Turnover Rate........................................................................................................................................................................................................................................................................................................................................................................................................................................................................................................................................................................................................................................................................................................................................................................................................................................................................................................................................................................................................................................ | 11% |
|---|
|
|
| C000012035 |
|
|
|
| Shareholder Report [Line Items] |
|
|
|
| Fund Name |
|
iShares Global Tech ETF
|
|
| Trading Symbol |
|
IXN
|
|
| Security Exchange Name |
|
NYSEArca
|
|
| Annual or Semi-Annual Statement [Text Block] |
|
This annual shareholder report contains important information about iShares Global Tech ETF (the “Fund”) for the period of April 1, 2025 to March 31, 2026
|
|
| Additional Information [Text Block] |
|
You can find additional information about the Fund at blackrock.com/fundreports. You can also request this information by contacting us at 1-800-iShares (1-800-474-2737).
|
|
| Additional Information Phone Number |
|
1-800-474-2737
|
|
| Additional Information Website |
|
blackrock.com/fundreports
|
|
| Expenses [Text Block] |
|
What were the Fund costs for the last year?(based on a hypothetical $10,000 investment) Table SummaryFund name | Costs of a $10,000
investment | Costs paid as a percentage of a
$10,000 investment |
|---|
iShares Global Tech ETF | $44 | 0.38% |
|---|
|
|
| Expenses Paid, Amount |
|
$ 44
|
|
| Expense Ratio, Percent |
|
0.38%
|
|
| Performance Past Does Not Indicate Future [Text] |
|
Past performance is not an indication of future results.
|
|
| Line Graph [Table Text Block] |
|
Cumulative performance: April 1, 2016 through March 31, 2026 Initial investment of $10,000 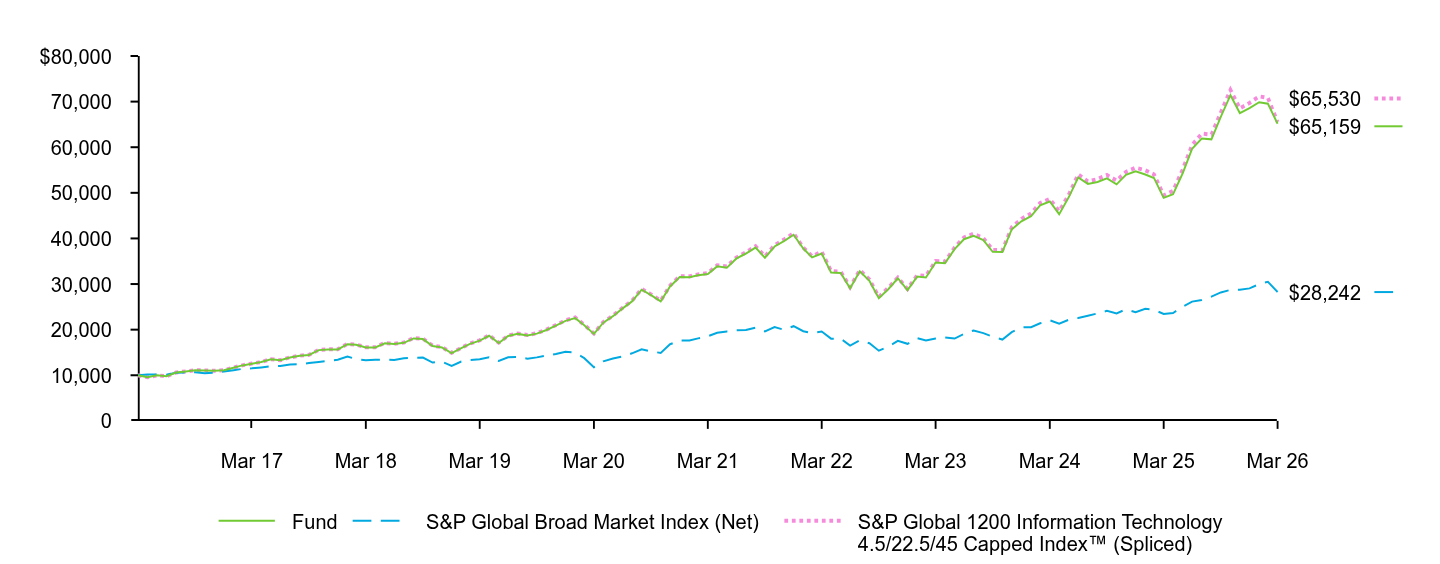 Table Summary | Fund | S&P Global Broad Market Index (Net) | S&P Global 1200 Information Technology 4.5/22.5/45 Capped Index™ (Spliced) |
|---|
Mar 16 | $10,000 | $10,000 | $10,000 |
|---|
Apr 16 | $9,542 | $10,161 | $9,546 |
|---|
May 16 | $9,979 | $10,176 | $9,980 |
|---|
Jun 16 | $9,792 | $10,102 | $9,795 |
|---|
Jul 16 | $10,602 | $10,554 | $10,609 |
|---|
Aug 16 | $10,837 | $10,592 | $10,843 |
|---|
Sep 16 | $11,107 | $10,669 | $11,116 |
|---|
Oct 16 | $11,046 | $10,466 | $11,059 |
|---|
Nov 16 | $10,967 | $10,573 | $10,977 |
|---|
Dec 16 | $11,122 | $10,800 | $11,130 |
|---|
Jan 17 | $11,651 | $11,095 | $11,663 |
|---|
Feb 17 | $12,164 | $11,400 | $12,175 |
|---|
Mar 17 | $12,540 | $11,535 | $12,559 |
|---|
Apr 17 | $12,890 | $11,720 | $12,914 |
|---|
May 17 | $13,503 | $11,959 | $13,527 |
|---|
Jun 17 | $13,287 | $12,032 | $13,313 |
|---|
Jul 17 | $13,883 | $12,362 | $13,914 |
|---|
Aug 17 | $14,261 | $12,406 | $14,295 |
|---|
Sep 17 | $14,438 | $12,670 | $14,474 |
|---|
Oct 17 | $15,513 | $12,928 | $15,555 |
|---|
Nov 17 | $15,655 | $13,182 | $15,696 |
|---|
Dec 17 | $15,657 | $13,398 | $15,700 |
|---|
Jan 18 | $16,813 | $14,119 | $16,866 |
|---|
Feb 18 | $16,665 | $13,533 | $16,714 |
|---|
Mar 18 | $16,095 | $13,271 | $16,161 |
|---|
Apr 18 | $16,099 | $13,402 | $16,154 |
|---|
May 18 | $17,012 | $13,453 | $17,074 |
|---|
Jun 18 | $16,831 | $13,364 | $16,895 |
|---|
Jul 18 | $17,103 | $13,728 | $17,175 |
|---|
Aug 18 | $18,083 | $13,849 | $18,163 |
|---|
Sep 18 | $17,940 | $13,873 | $18,017 |
|---|
Oct 18 | $16,416 | $12,779 | $16,485 |
|---|
Nov 18 | $16,107 | $12,976 | $16,173 |
|---|
Dec 18 | $14,853 | $12,038 | $14,914 |
|---|
Jan 19 | $15,944 | $13,007 | $16,015 |
|---|
Feb 19 | $16,887 | $13,364 | $16,958 |
|---|
Mar 19 | $17,594 | $13,499 | $17,669 |
|---|
Apr 19 | $18,665 | $13,941 | $18,750 |
|---|
May 19 | $17,081 | $13,118 | $17,155 |
|---|
Jun 19 | $18,611 | $13,954 | $18,691 |
|---|
Jul 19 | $19,071 | $13,986 | $19,159 |
|---|
Aug 19 | $18,719 | $13,638 | $18,808 |
|---|
Sep 19 | $19,124 | $13,920 | $19,216 |
|---|
Oct 19 | $19,920 | $14,308 | $20,019 |
|---|
Nov 19 | $20,888 | $14,658 | $20,994 |
|---|
Dec 19 | $21,927 | $15,176 | $22,043 |
|---|
Jan 20 | $22,537 | $14,971 | $22,663 |
|---|
Feb 20 | $20,955 | $13,749 | $21,068 |
|---|
Mar 20 | $19,059 | $11,771 | $19,158 |
|---|
Apr 20 | $21,529 | $13,056 | $21,646 |
|---|
May 20 | $22,947 | $13,664 | $23,071 |
|---|
Jun 20 | $24,611 | $14,100 | $24,745 |
|---|
Jul 20 | $26,192 | $14,812 | $26,342 |
|---|
Aug 20 | $28,762 | $15,713 | $28,929 |
|---|
Sep 20 | $27,572 | $15,227 | $27,736 |
|---|
Oct 20 | $26,204 | $14,902 | $26,365 |
|---|
Nov 20 | $29,481 | $16,802 | $29,666 |
|---|
Dec 20 | $31,523 | $17,637 | $31,731 |
|---|
Jan 21 | $31,491 | $17,609 | $31,681 |
|---|
Feb 21 | $31,906 | $18,091 | $32,098 |
|---|
Mar 21 | $32,205 | $18,540 | $32,405 |
|---|
Apr 21 | $33,877 | $19,333 | $34,113 |
|---|
May 21 | $33,591 | $19,618 | $33,853 |
|---|
Jun 21 | $35,564 | $19,854 | $35,808 |
|---|
Jul 21 | $36,696 | $19,937 | $36,930 |
|---|
Aug 21 | $37,992 | $20,432 | $38,296 |
|---|
Sep 21 | $35,766 | $19,630 | $36,083 |
|---|
Oct 21 | $38,238 | $20,556 | $38,532 |
|---|
Nov 21 | $39,427 | $19,979 | $39,740 |
|---|
Dec 21 | $40,805 | $20,759 | $41,152 |
|---|
Jan 22 | $37,775 | $19,665 | $37,967 |
|---|
Feb 22 | $35,839 | $19,217 | $36,123 |
|---|
Mar 22 | $36,678 | $19,586 | $37,069 |
|---|
Apr 22 | $32,518 | $18,025 | $32,871 |
|---|
May 22 | $32,407 | $18,033 | $32,711 |
|---|
Jun 22 | $29,065 | $16,485 | $29,312 |
|---|
Jul 22 | $32,788 | $17,643 | $33,048 |
|---|
Aug 22 | $30,693 | $17,032 | $31,014 |
|---|
Sep 22 | $26,881 | $15,382 | $27,171 |
|---|
Oct 22 | $28,910 | $16,305 | $29,208 |
|---|
Nov 22 | $31,279 | $17,550 | $31,420 |
|---|
Dec 22 | $28,649 | $16,891 | $28,914 |
|---|
Jan 23 | $31,648 | $18,127 | $31,936 |
|---|
Feb 23 | $31,436 | $17,621 | $31,795 |
|---|
Mar 23 | $34,718 | $18,040 | $35,052 |
|---|
Apr 23 | $34,582 | $18,266 | $34,913 |
|---|
May 23 | $37,652 | $18,045 | $38,028 |
|---|
Jun 23 | $39,834 | $19,093 | $40,218 |
|---|
Jul 23 | $40,593 | $19,825 | $41,019 |
|---|
Aug 23 | $39,657 | $19,247 | $40,088 |
|---|
Sep 23 | $37,058 | $18,449 | $37,467 |
|---|
Oct 23 | $37,039 | $17,826 | $37,402 |
|---|
Nov 23 | $41,972 | $19,467 | $42,452 |
|---|
Dec 23 | $43,770 | $20,492 | $44,286 |
|---|
Jan 24 | $44,888 | $20,530 | $45,463 |
|---|
Feb 24 | $47,262 | $21,398 | $47,775 |
|---|
Mar 24 | $48,105 | $22,051 | $48,659 |
|---|
Apr 24 | $45,315 | $21,322 | $45,969 |
|---|
May 24 | $49,058 | $22,172 | $49,595 |
|---|
Jun 24 | $53,359 | $22,562 | $54,063 |
|---|
Jul 24 | $51,961 | $23,036 | $52,487 |
|---|
Aug 24 | $52,367 | $23,561 | $53,006 |
|---|
Sep 24 | $53,188 | $24,119 | $53,891 |
|---|
Oct 24 | $51,857 | $23,562 | $52,676 |
|---|
Nov 24 | $53,958 | $24,472 | $54,585 |
|---|
Dec 24 | $54,713 | $23,820 | $55,509 |
|---|
Jan 25 | $54,020 | $24,581 | $54,945 |
|---|
Feb 25 | $53,240 | $24,360 | $54,032 |
|---|
Mar 25 | $48,898 | $23,428 | $49,439 |
|---|
Apr 25 | $49,724 | $23,653 | $50,423 |
|---|
May 25 | $54,299 | $25,016 | $55,155 |
|---|
Jun 25 | $59,635 | $26,146 | $60,470 |
|---|
Jul 25 | $61,909 | $26,502 | $62,984 |
|---|
Aug 25 | $61,731 | $27,248 | $62,750 |
|---|
Sep 25 | $66,656 | $28,166 | $67,619 |
|---|
Oct 25 | $71,413 | $28,727 | $72,571 |
|---|
Nov 25 | $67,479 | $28,753 | $68,504 |
|---|
Dec 25 | $68,587 | $29,050 | $69,706 |
|---|
Jan 26 | $69,864 | $29,995 | $71,150 |
|---|
Feb 26 | $69,536 | $30,491 | $70,789 |
|---|
Mar 26 | $65,159 | $28,242 | $65,530 |
|---|
See “Average annual total returns” for additional information on fund performance. |
|
| No Deduction of Taxes [Text Block] |
|
Performance results do not reflect the deduction of taxes that a shareholder would pay on fund distributions or on the redemption or sale of fund shares.
|
|
| AssetsNet |
|
$ 6,258,609,900
|
|
| Holdings Count | Holding |
|
130
|
|
| Advisory Fees Paid, Amount |
|
$ 22,035,065
|
|
| InvestmentCompanyPortfolioTurnover |
|
32.00%
|
|
| Additional Fund Statistics [Text Block] |
|
Table SummaryNet Assets........................................................................................................................................................................................................................................................................................................................................................................................................................................................................................................................................................................................................................................................................................................................................................................................................................................................................................................................................................................................................................................ | $6,258,609,900 |
|---|
Number of Portfolio Holdings........................................................................................................................................................................................................................................................................................................................................................................................................................................................................................................................................................................................................................................................................................................................................................................................................................................................................................................................................................................................................................................ | 130 |
|---|
Net Investment Advisory Fees........................................................................................................................................................................................................................................................................................................................................................................................................................................................................................................................................................................................................................................................................................................................................................................................................................................................................................................................................................................................................................................ | $22,035,065 |
|---|
Portfolio Turnover Rate........................................................................................................................................................................................................................................................................................................................................................................................................................................................................................................................................................................................................................................................................................................................................................................................................................................................................................................................................................................................................................................ | 32% |
|---|
|
|
| C000024197 |
|
|
|
| Shareholder Report [Line Items] |
|
|
|
| Fund Name |
|
iShares Global Utilities ETF
|
|
| Trading Symbol |
|
JXI
|
|
| Security Exchange Name |
|
NYSEArca
|
|
| Annual or Semi-Annual Statement [Text Block] |
|
This annual shareholder report contains important information about iShares Global Utilities ETF (the “Fund”) for the period of April 1, 2025 to March 31, 2026
|
|
| Additional Information [Text Block] |
|
You can find additional information about the Fund at blackrock.com/fundreports. You can also request this information by contacting us at 1-800-iShares (1-800-474-2737).
|
|
| Additional Information Phone Number |
|
1-800-474-2737
|
|
| Additional Information Website |
|
blackrock.com/fundreports
|
|
| Expenses [Text Block] |
|
What were the Fund costs for the last year?(based on a hypothetical $10,000 investment) Table SummaryFund name | Costs of a $10,000
investment | Costs paid as a percentage of a
$10,000 investment |
|---|
iShares Global Utilities ETF | $45 | 0.39% |
|---|
|
|
| Expenses Paid, Amount |
|
$ 45
|
|
| Expense Ratio, Percent |
|
0.39%
|
|
| Performance Past Does Not Indicate Future [Text] |
|
Past performance is not an indication of future results.
|
|
| Line Graph [Table Text Block] |
|
Cumulative performance: April 1, 2016 through March 31, 2026 Initial investment of $10,000 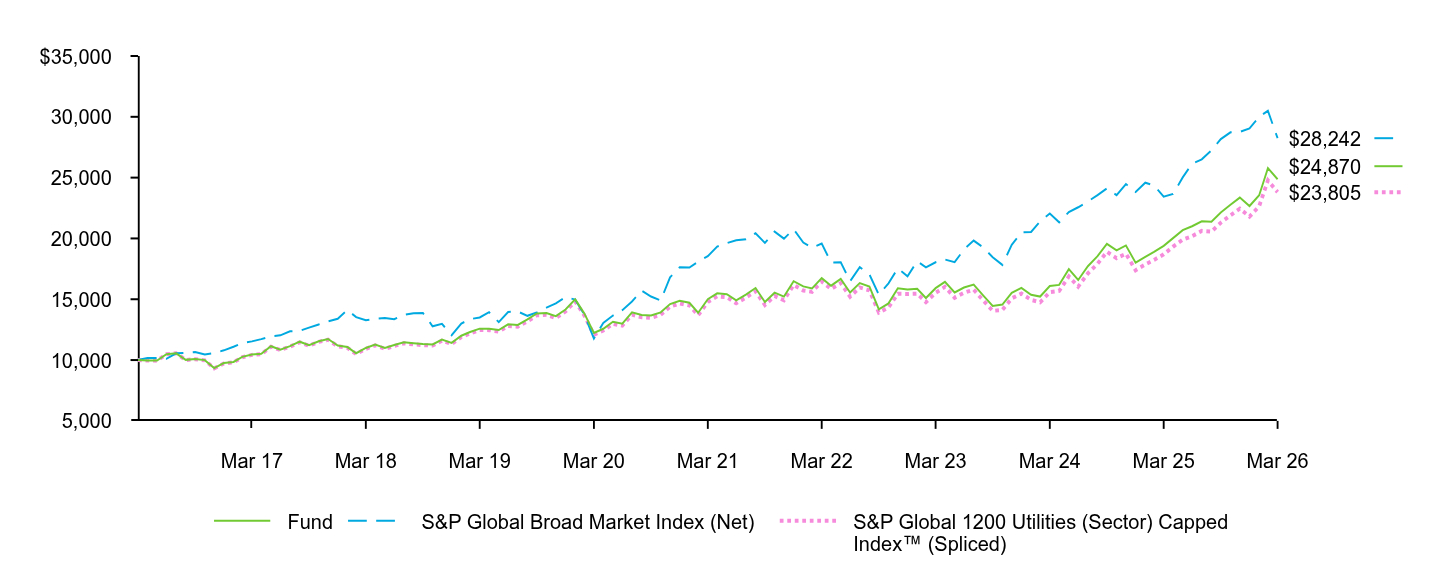 Table Summary | Fund | S&P Global Broad Market Index (Net) | S&P Global 1200 Utilities (Sector) Capped Index™ (Spliced) |
|---|
Mar 16 | $10,000 | $10,000 | $10,000 |
|---|
Apr 16 | $9,965 | $10,161 | $9,966 |
|---|
May 16 | $9,954 | $10,176 | $9,949 |
|---|
Jun 16 | $10,483 | $10,102 | $10,479 |
|---|
Jul 16 | $10,557 | $10,554 | $10,554 |
|---|
Aug 16 | $10,017 | $10,592 | $10,002 |
|---|
Sep 16 | $10,092 | $10,669 | $10,075 |
|---|
Oct 16 | $9,994 | $10,466 | $9,979 |
|---|
Nov 16 | $9,337 | $10,573 | $9,316 |
|---|
Dec 16 | $9,752 | $10,800 | $9,723 |
|---|
Jan 17 | $9,845 | $11,095 | $9,813 |
|---|
Feb 17 | $10,265 | $11,400 | $10,232 |
|---|
Mar 17 | $10,461 | $11,535 | $10,425 |
|---|
Apr 17 | $10,515 | $11,720 | $10,480 |
|---|
May 17 | $11,137 | $11,959 | $11,099 |
|---|
Jun 17 | $10,862 | $12,032 | $10,821 |
|---|
Jul 17 | $11,148 | $12,362 | $11,105 |
|---|
Aug 17 | $11,511 | $12,406 | $11,462 |
|---|
Sep 17 | $11,232 | $12,670 | $11,181 |
|---|
Oct 17 | $11,542 | $12,928 | $11,493 |
|---|
Nov 17 | $11,731 | $13,182 | $11,673 |
|---|
Dec 17 | $11,189 | $13,398 | $11,130 |
|---|
Jan 18 | $11,067 | $14,119 | $11,006 |
|---|
Feb 18 | $10,560 | $13,533 | $10,494 |
|---|
Mar 18 | $10,997 | $13,271 | $10,923 |
|---|
Apr 18 | $11,275 | $13,402 | $11,204 |
|---|
May 18 | $11,004 | $13,453 | $10,925 |
|---|
Jun 18 | $11,237 | $13,364 | $11,156 |
|---|
Jul 18 | $11,455 | $13,728 | $11,374 |
|---|
Aug 18 | $11,379 | $13,849 | $11,291 |
|---|
Sep 18 | $11,319 | $13,873 | $11,229 |
|---|
Oct 18 | $11,283 | $12,779 | $11,193 |
|---|
Nov 18 | $11,684 | $12,976 | $11,588 |
|---|
Dec 18 | $11,415 | $12,038 | $11,318 |
|---|
Jan 19 | $11,999 | $13,007 | $11,898 |
|---|
Feb 19 | $12,304 | $13,364 | $12,190 |
|---|
Mar 19 | $12,581 | $13,499 | $12,466 |
|---|
Apr 19 | $12,574 | $13,941 | $12,461 |
|---|
May 19 | $12,467 | $13,118 | $12,343 |
|---|
Jun 19 | $12,935 | $13,954 | $12,804 |
|---|
Jul 19 | $12,888 | $13,986 | $12,751 |
|---|
Aug 19 | $13,338 | $13,638 | $13,189 |
|---|
Sep 19 | $13,829 | $13,920 | $13,675 |
|---|
Oct 19 | $13,865 | $14,308 | $13,715 |
|---|
Nov 19 | $13,606 | $14,658 | $13,452 |
|---|
Dec 19 | $14,157 | $15,176 | $13,996 |
|---|
Jan 20 | $14,994 | $14,971 | $14,826 |
|---|
Feb 20 | $13,841 | $13,749 | $13,679 |
|---|
Mar 20 | $12,224 | $11,771 | $12,075 |
|---|
Apr 20 | $12,571 | $13,056 | $12,434 |
|---|
May 20 | $13,147 | $13,664 | $12,981 |
|---|
Jun 20 | $12,995 | $14,100 | $12,829 |
|---|
Jul 20 | $13,928 | $14,812 | $13,738 |
|---|
Aug 20 | $13,711 | $15,713 | $13,519 |
|---|
Sep 20 | $13,665 | $15,227 | $13,470 |
|---|
Oct 20 | $13,921 | $14,902 | $13,725 |
|---|
Nov 20 | $14,603 | $16,802 | $14,391 |
|---|
Dec 20 | $14,875 | $17,637 | $14,661 |
|---|
Jan 21 | $14,714 | $17,609 | $14,499 |
|---|
Feb 21 | $13,891 | $18,091 | $13,683 |
|---|
Mar 21 | $14,999 | $18,540 | $14,765 |
|---|
Apr 21 | $15,484 | $19,333 | $15,243 |
|---|
May 21 | $15,418 | $19,618 | $15,165 |
|---|
Jun 21 | $14,913 | $19,854 | $14,666 |
|---|
Jul 21 | $15,388 | $19,937 | $15,139 |
|---|
Aug 21 | $15,923 | $20,432 | $15,650 |
|---|
Sep 21 | $14,772 | $19,630 | $14,526 |
|---|
Oct 21 | $15,543 | $20,556 | $15,271 |
|---|
Nov 21 | $15,214 | $19,979 | $14,919 |
|---|
Dec 21 | $16,484 | $20,759 | $16,177 |
|---|
Jan 22 | $16,058 | $19,665 | $15,718 |
|---|
Feb 22 | $15,888 | $19,217 | $15,613 |
|---|
Mar 22 | $16,737 | $19,586 | $16,456 |
|---|
Apr 22 | $16,116 | $18,025 | $15,850 |
|---|
May 22 | $16,671 | $18,033 | $16,329 |
|---|
Jun 22 | $15,549 | $16,485 | $15,210 |
|---|
Jul 22 | $16,325 | $17,643 | $15,972 |
|---|
Aug 22 | $16,044 | $17,032 | $15,728 |
|---|
Sep 22 | $14,177 | $15,382 | $13,903 |
|---|
Oct 22 | $14,659 | $16,305 | $14,326 |
|---|
Nov 22 | $15,908 | $17,550 | $15,451 |
|---|
Dec 22 | $15,808 | $16,891 | $15,436 |
|---|
Jan 23 | $15,860 | $18,127 | $15,462 |
|---|
Feb 23 | $15,097 | $17,621 | $14,761 |
|---|
Mar 23 | $15,912 | $18,040 | $15,529 |
|---|
Apr 23 | $16,430 | $18,266 | $16,021 |
|---|
May 23 | $15,559 | $18,045 | $15,125 |
|---|
Jun 23 | $15,962 | $19,093 | $15,532 |
|---|
Jul 23 | $16,205 | $19,825 | $15,788 |
|---|
Aug 23 | $15,296 | $19,247 | $14,890 |
|---|
Sep 23 | $14,452 | $18,449 | $14,044 |
|---|
Oct 23 | $14,562 | $17,826 | $14,124 |
|---|
Nov 23 | $15,527 | $19,467 | $15,071 |
|---|
Dec 23 | $15,941 | $20,492 | $15,466 |
|---|
Jan 24 | $15,366 | $20,530 | $14,950 |
|---|
Feb 24 | $15,220 | $21,398 | $14,748 |
|---|
Mar 24 | $16,094 | $22,051 | $15,582 |
|---|
Apr 24 | $16,181 | $21,322 | $15,688 |
|---|
May 24 | $17,472 | $22,172 | $16,876 |
|---|
Jun 24 | $16,583 | $22,562 | $16,039 |
|---|
Jul 24 | $17,712 | $23,036 | $17,121 |
|---|
Aug 24 | $18,541 | $23,561 | $17,911 |
|---|
Sep 24 | $19,555 | $24,119 | $18,902 |
|---|
Oct 24 | $19,022 | $23,562 | $18,371 |
|---|
Nov 24 | $19,422 | $24,472 | $18,744 |
|---|
Dec 24 | $18,006 | $23,820 | $17,386 |
|---|
Jan 25 | $18,478 | $24,581 | $17,857 |
|---|
Feb 25 | $18,889 | $24,360 | $18,229 |
|---|
Mar 25 | $19,386 | $23,428 | $18,690 |
|---|
Apr 25 | $20,025 | $23,653 | $19,318 |
|---|
May 25 | $20,678 | $25,016 | $19,895 |
|---|
Jun 25 | $21,001 | $26,146 | $20,185 |
|---|
Jul 25 | $21,414 | $26,502 | $20,621 |
|---|
Aug 25 | $21,365 | $27,248 | $20,556 |
|---|
Sep 25 | $22,137 | $28,166 | $21,294 |
|---|
Oct 25 | $22,766 | $28,727 | $21,901 |
|---|
Nov 25 | $23,359 | $28,753 | $22,452 |
|---|
Dec 25 | $22,662 | $29,050 | $21,794 |
|---|
Jan 26 | $23,547 | $29,995 | $22,649 |
|---|
Feb 26 | $25,782 | $30,491 | $24,773 |
|---|
Mar 26 | $24,870 | $28,242 | $23,805 |
|---|
See “Average annual total returns” for additional information on fund performance. |
|
| No Deduction of Taxes [Text Block] |
|
Performance results do not reflect the deduction of taxes that a shareholder would pay on fund distributions or on the redemption or sale of fund shares.
|
|
| AssetsNet |
|
$ 318,886,379
|
|
| Holdings Count | Holding |
|
69
|
|
| Advisory Fees Paid, Amount |
|
$ 846,371
|
|
| InvestmentCompanyPortfolioTurnover |
|
6.00%
|
|
| Additional Fund Statistics [Text Block] |
|
Table SummaryNet Assets........................................................................................................................................................................................................................................................................................................................................................................................................................................................................................................................................................................................................................................................................................................................................................................................................................................................................................................................................................................................................................................ | $318,886,379 |
|---|
Number of Portfolio Holdings........................................................................................................................................................................................................................................................................................................................................................................................................................................................................................................................................................................................................................................................................................................................................................................................................................................................................................................................................................................................................................................ | 69 |
|---|
Net Investment Advisory Fees........................................................................................................................................................................................................................................................................................................................................................................................................................................................................................................................................................................................................................................................................................................................................................................................................................................................................................................................................................................................................................................ | $846,371 |
|---|
Portfolio Turnover Rate........................................................................................................................................................................................................................................................................................................................................................................................................................................................................................................................................................................................................................................................................................................................................................................................................................................................................................................................................................................................................................................ | 6% |
|---|
|
|
| C000049095 |
|
|
|
| Shareholder Report [Line Items] |
|
|
|
| Fund Name |
|
iShares Asia 50 ETF
|
|
| Trading Symbol |
|
AIA
|
|
| Security Exchange Name |
|
NASDAQ
|
|
| Annual or Semi-Annual Statement [Text Block] |
|
This annual shareholder report contains important information about iShares Asia 50 ETF (the “Fund”) for the period of April 1, 2025 to March 31, 2026
|
|
| Additional Information [Text Block] |
|
You can find additional information about the Fund at blackrock.com/fundreports. You can also request this information by contacting us at 1-800-iShares (1-800-474-2737).
|
|
| Additional Information Phone Number |
|
1-800-474-2737
|
|
| Additional Information Website |
|
blackrock.com/fundreports
|
|
| Expenses [Text Block] |
|
What were the Fund costs for the last year?(based on a hypothetical $10,000 investment) Table SummaryFund name | Costs of a $10,000
investment | Costs paid as a percentage of a
$10,000 investment |
|---|
iShares Asia 50 ETF | $63 | 0.50% |
|---|
|
|
| Expenses Paid, Amount |
|
$ 63
|
|
| Expense Ratio, Percent |
|
0.50%
|
|
| Performance Past Does Not Indicate Future [Text] |
|
Past performance is not an indication of future results.
|
|
| Line Graph [Table Text Block] |
|
Cumulative performance: April 1, 2016 through March 31, 2026 Initial investment of $10,000 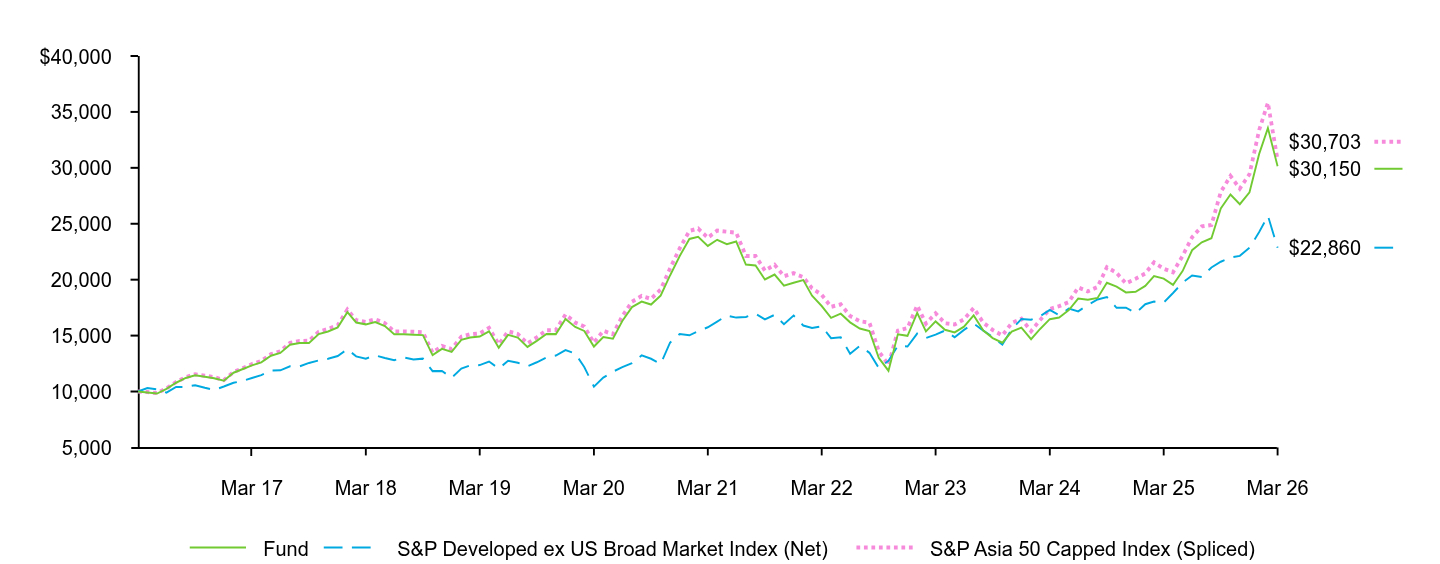 Table Summary | Fund | S&P Developed ex US Broad Market Index (Net) | S&P Asia 50 Capped Index (Spliced) |
|---|
Mar 16 | $10,000 | $10,000 | $10,000 |
|---|
Apr 16 | $9,920 | $10,310 | $9,954 |
|---|
May 16 | $9,816 | $10,202 | $9,857 |
|---|
Jun 16 | $10,231 | $9,904 | $10,280 |
|---|
Jul 16 | $10,785 | $10,409 | $10,844 |
|---|
Aug 16 | $11,212 | $10,414 | $11,282 |
|---|
Sep 16 | $11,461 | $10,563 | $11,540 |
|---|
Oct 16 | $11,329 | $10,330 | $11,414 |
|---|
Nov 16 | $11,189 | $10,142 | $11,283 |
|---|
Dec 16 | $10,962 | $10,444 | $11,016 |
|---|
Jan 17 | $11,680 | $10,783 | $11,746 |
|---|
Feb 17 | $11,990 | $10,935 | $12,061 |
|---|
Mar 17 | $12,338 | $11,209 | $12,451 |
|---|
Apr 17 | $12,605 | $11,461 | $12,730 |
|---|
May 17 | $13,197 | $11,870 | $13,336 |
|---|
Jun 17 | $13,448 | $11,892 | $13,595 |
|---|
Jul 17 | $14,186 | $12,251 | $14,356 |
|---|
Aug 17 | $14,337 | $12,249 | $14,524 |
|---|
Sep 17 | $14,341 | $12,557 | $14,530 |
|---|
Oct 17 | $15,135 | $12,779 | $15,347 |
|---|
Nov 17 | $15,371 | $12,923 | $15,596 |
|---|
Dec 17 | $15,731 | $13,173 | $15,933 |
|---|
Jan 18 | $17,102 | $13,785 | $17,326 |
|---|
Feb 18 | $16,175 | $13,143 | $16,386 |
|---|
Mar 18 | $16,005 | $12,932 | $16,224 |
|---|
Apr 18 | $16,206 | $13,234 | $16,450 |
|---|
May 18 | $15,853 | $13,000 | $16,113 |
|---|
Jun 18 | $15,117 | $12,801 | $15,354 |
|---|
Jul 18 | $15,120 | $13,048 | $15,364 |
|---|
Aug 18 | $15,084 | $12,857 | $15,346 |
|---|
Sep 18 | $15,043 | $12,938 | $15,298 |
|---|
Oct 18 | $13,253 | $11,824 | $13,476 |
|---|
Nov 18 | $13,816 | $11,841 | $14,070 |
|---|
Dec 18 | $13,538 | $11,220 | $13,794 |
|---|
Jan 19 | $14,615 | $12,050 | $14,897 |
|---|
Feb 19 | $14,828 | $12,328 | $15,121 |
|---|
Mar 19 | $14,911 | $12,361 | $15,195 |
|---|
Apr 19 | $15,385 | $12,683 | $15,689 |
|---|
May 19 | $13,919 | $12,052 | $14,209 |
|---|
Jun 19 | $15,071 | $12,747 | $15,382 |
|---|
Jul 19 | $14,827 | $12,578 | $15,142 |
|---|
Aug 19 | $13,986 | $12,260 | $14,297 |
|---|
Sep 19 | $14,522 | $12,614 | $14,841 |
|---|
Oct 19 | $15,142 | $13,053 | $15,485 |
|---|
Nov 19 | $15,132 | $13,219 | $15,494 |
|---|
Dec 19 | $16,495 | $13,700 | $16,891 |
|---|
Jan 20 | $15,772 | $13,398 | $16,158 |
|---|
Feb 20 | $15,417 | $12,194 | $15,803 |
|---|
Mar 20 | $14,017 | $10,438 | $14,357 |
|---|
Apr 20 | $14,865 | $11,245 | $15,437 |
|---|
May 20 | $14,727 | $11,776 | $15,114 |
|---|
Jun 20 | $16,304 | $12,175 | $16,735 |
|---|
Jul 20 | $17,554 | $12,542 | $18,035 |
|---|
Aug 20 | $18,042 | $13,227 | $18,558 |
|---|
Sep 20 | $17,778 | $12,927 | $18,278 |
|---|
Oct 20 | $18,582 | $12,465 | $19,127 |
|---|
Nov 20 | $20,382 | $14,365 | $21,008 |
|---|
Dec 20 | $22,109 | $15,149 | $22,803 |
|---|
Jan 21 | $23,641 | $15,023 | $24,365 |
|---|
Feb 21 | $23,839 | $15,396 | $24,574 |
|---|
Mar 21 | $23,018 | $15,741 | $23,747 |
|---|
Apr 21 | $23,570 | $16,256 | $24,387 |
|---|
May 21 | $23,180 | $16,790 | $24,291 |
|---|
Jun 21 | $23,411 | $16,608 | $24,200 |
|---|
Jul 21 | $21,350 | $16,672 | $22,126 |
|---|
Aug 21 | $21,271 | $16,962 | $22,123 |
|---|
Sep 21 | $20,016 | $16,446 | $20,806 |
|---|
Oct 21 | $20,457 | $16,854 | $21,334 |
|---|
Nov 21 | $19,459 | $16,018 | $20,306 |
|---|
Dec 21 | $19,732 | $16,796 | $20,585 |
|---|
Jan 22 | $19,968 | $15,899 | $20,225 |
|---|
Feb 22 | $18,568 | $15,683 | $19,233 |
|---|
Mar 22 | $17,642 | $15,838 | $18,649 |
|---|
Apr 22 | $16,588 | $14,764 | $17,567 |
|---|
May 22 | $16,963 | $14,854 | $17,795 |
|---|
Jun 22 | $16,185 | $13,373 | $16,759 |
|---|
Jul 22 | $15,630 | $14,082 | $16,289 |
|---|
Aug 22 | $15,412 | $13,462 | $16,156 |
|---|
Sep 22 | $13,002 | $12,098 | $13,593 |
|---|
Oct 22 | $11,857 | $12,740 | $12,368 |
|---|
Nov 22 | $15,112 | $14,092 | $15,436 |
|---|
Dec 22 | $14,983 | $14,022 | $15,678 |
|---|
Jan 23 | $17,037 | $15,180 | $17,687 |
|---|
Feb 23 | $15,372 | $14,785 | $16,067 |
|---|
Mar 23 | $16,271 | $15,090 | $16,997 |
|---|
Apr 23 | $15,525 | $15,446 | $16,100 |
|---|
May 23 | $15,290 | $14,856 | $15,990 |
|---|
Jun 23 | $15,799 | $15,513 | $16,456 |
|---|
Jul 23 | $16,811 | $16,072 | $17,462 |
|---|
Aug 23 | $15,445 | $15,439 | $16,151 |
|---|
Sep 23 | $14,773 | $14,883 | $15,502 |
|---|
Oct 23 | $14,365 | $14,193 | $15,005 |
|---|
Nov 23 | $15,351 | $15,574 | $16,131 |
|---|
Dec 23 | $15,709 | $16,473 | $16,508 |
|---|
Jan 24 | $14,677 | $16,419 | $15,393 |
|---|
Feb 24 | $15,598 | $16,728 | $16,396 |
|---|
Mar 24 | $16,471 | $17,291 | $17,373 |
|---|
Apr 24 | $16,612 | $16,824 | $17,631 |
|---|
May 24 | $17,278 | $17,415 | $18,007 |
|---|
Jun 24 | $18,313 | $17,165 | $19,313 |
|---|
Jul 24 | $18,205 | $17,740 | $18,949 |
|---|
Aug 24 | $18,366 | $18,231 | $19,343 |
|---|
Sep 24 | $19,729 | $18,449 | $21,116 |
|---|
Oct 24 | $19,381 | $17,483 | $20,601 |
|---|
Nov 24 | $18,863 | $17,499 | $19,662 |
|---|
Dec 24 | $18,917 | $17,008 | $20,084 |
|---|
Jan 25 | $19,448 | $17,807 | $20,558 |
|---|
Feb 25 | $20,324 | $18,037 | $21,546 |
|---|
Mar 25 | $20,097 | $17,951 | $20,983 |
|---|
Apr 25 | $19,528 | $18,806 | $20,661 |
|---|
May 25 | $20,790 | $19,744 | $22,151 |
|---|
Jun 25 | $22,635 | $20,378 | $23,793 |
|---|
Jul 25 | $23,343 | $20,229 | $24,766 |
|---|
Aug 25 | $23,709 | $21,093 | $24,894 |
|---|
Sep 25 | $26,376 | $21,607 | $27,842 |
|---|
Oct 25 | $27,622 | $21,970 | $29,274 |
|---|
Nov 25 | $26,742 | $22,127 | $28,144 |
|---|
Dec 25 | $27,809 | $22,851 | $29,434 |
|---|
Jan 26 | $31,246 | $24,255 | $33,386 |
|---|
Feb 26 | $33,555 | $25,712 | $35,823 |
|---|
Mar 26 | $30,150 | $22,860 | $30,703 |
|---|
See “Average annual total returns” for additional information on fund performance. |
|
| No Deduction of Taxes [Text Block] |
|
Performance results do not reflect the deduction of taxes that a shareholder would pay on fund distributions or on the redemption or sale of fund shares.
|
|
| AssetsNet |
|
$ 3,337,159,616
|
|
| Holdings Count | Holding |
|
58
|
|
| Advisory Fees Paid, Amount |
|
$ 6,991,864
|
|
| InvestmentCompanyPortfolioTurnover |
|
33.00%
|
|
| Additional Fund Statistics [Text Block] |
|
Table SummaryNet Assets........................................................................................................................................................................................................................................................................................................................................................................................................................................................................................................................................................................................................................................................................................................................................................................................................................................................................................................................................................................................................................................ | $3,337,159,616 |
|---|
Number of Portfolio Holdings........................................................................................................................................................................................................................................................................................................................................................................................................................................................................................................................................................................................................................................................................................................................................................................................................................................................................................................................................................................................................................................ | 58 |
|---|
Net Investment Advisory Fees........................................................................................................................................................................................................................................................................................................................................................................................................................................................................................................................................................................................................................................................................................................................................................................................................................................................................................................................................................................................................................................ | $6,991,864 |
|---|
Portfolio Turnover Rate........................................................................................................................................................................................................................................................................................................................................................................................................................................................................................................................................................................................................................................................................................................................................................................................................................................................................................................................................................................................................................................ | 33% |
|---|
|
|
| C000235105 |
|
|
|
| Shareholder Report [Line Items] |
|
|
|
| Fund Name |
|
iShares Blockchain and Tech ETF
|
|
| Trading Symbol |
|
IBLC
|
|
| Security Exchange Name |
|
NYSEArca
|
|
| Annual or Semi-Annual Statement [Text Block] |
|
This annual shareholder report contains important information about iShares Blockchain and Tech ETF (the “Fund”) for the period of April 1, 2025 to March 31, 2026
|
|
| Additional Information [Text Block] |
|
You can find additional information about the Fund at blackrock.com/fundreports. You can also request this information by contacting us at 1-800-iShares (1-800-474-2737).
|
|
| Additional Information Phone Number |
|
1-800-474-2737
|
|
| Additional Information Website |
|
blackrock.com/fundreports
|
|
| Expenses [Text Block] |
|
What were the Fund costs for the last year?(based on a hypothetical $10,000 investment) Table SummaryFund name | Costs of a $10,000
investment | Costs paid as a percentage of a
$10,000 investment |
|---|
iShares Blockchain and Tech ETF | $60 | 0.47% |
|---|
|
|
| Expenses Paid, Amount |
|
$ 60
|
|
| Expense Ratio, Percent |
|
0.47%
|
|
| Performance Past Does Not Indicate Future [Text] |
|
Past performance is not an indication of future results.
|
|
| Line Graph [Table Text Block] |
|
Cumulative performance: April 25, 2022 through March 31, 2026 Initial investment of $10,000 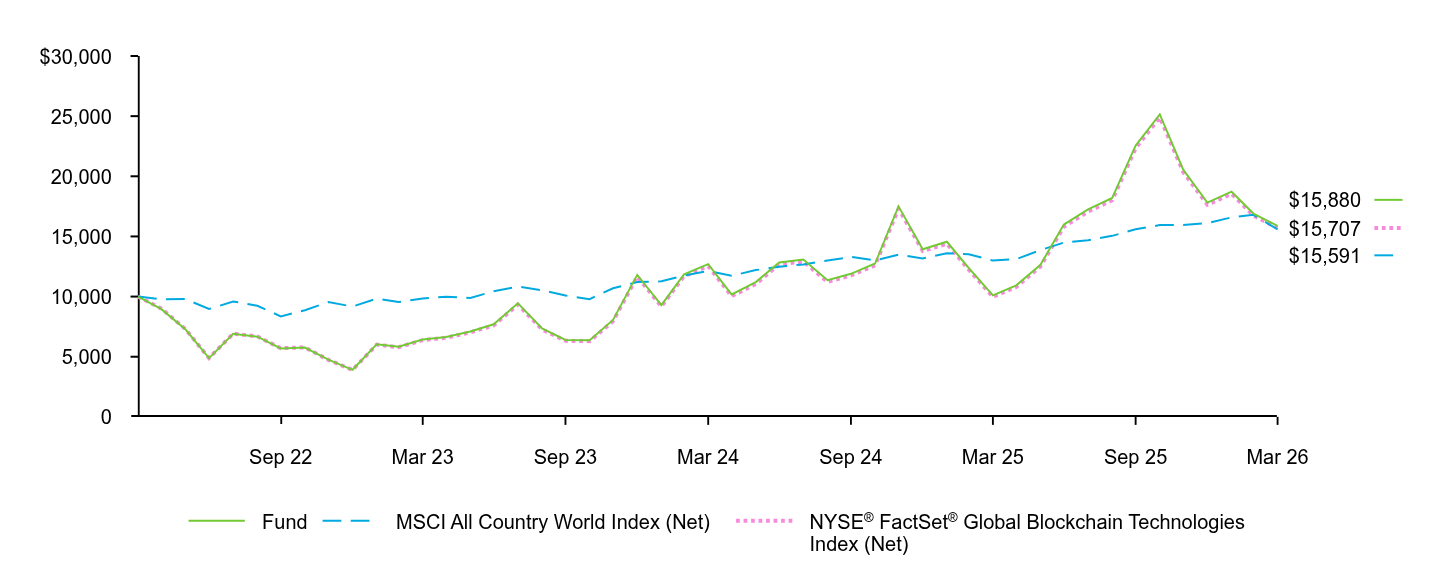 Table Summary | Fund | MSCI All Country World Index (Net) | NYSE® FactSet® Global Blockchain Technologies Index (Net) |
|---|
Mar 22 | $10,000 | $10,000 | $10,000 |
|---|
Apr 22 | $8,956 | $9,780 | $8,998 |
|---|
May 22 | $7,261 | $9,792 | $7,281 |
|---|
Jun 22 | $4,881 | $8,966 | $4,890 |
|---|
Jul 22 | $6,902 | $9,592 | $6,917 |
|---|
Aug 22 | $6,666 | $9,239 | $6,686 |
|---|
Sep 22 | $5,685 | $8,355 | $5,705 |
|---|
Oct 22 | $5,762 | $8,859 | $5,772 |
|---|
Nov 22 | $4,762 | $9,546 | $4,740 |
|---|
Dec 22 | $3,912 | $9,170 | $3,901 |
|---|
Jan 23 | $6,027 | $9,828 | $6,005 |
|---|
Feb 23 | $5,823 | $9,546 | $5,788 |
|---|
Mar 23 | $6,429 | $9,840 | $6,380 |
|---|
Apr 23 | $6,642 | $9,982 | $6,578 |
|---|
May 23 | $7,098 | $9,875 | $7,024 |
|---|
Jun 23 | $7,699 | $10,448 | $7,606 |
|---|
Jul 23 | $9,448 | $10,830 | $9,335 |
|---|
Aug 23 | $7,356 | $10,528 | $7,264 |
|---|
Sep 23 | $6,400 | $10,092 | $6,324 |
|---|
Oct 23 | $6,377 | $9,789 | $6,295 |
|---|
Nov 23 | $8,059 | $10,693 | $7,959 |
|---|
Dec 23 | $11,805 | $11,206 | $11,662 |
|---|
Jan 24 | $9,296 | $11,272 | $9,178 |
|---|
Feb 24 | $11,854 | $11,756 | $11,694 |
|---|
Mar 24 | $12,702 | $12,125 | $12,534 |
|---|
Apr 24 | $10,176 | $11,725 | $10,033 |
|---|
May 24 | $11,207 | $12,201 | $11,046 |
|---|
Jun 24 | $12,834 | $12,473 | $12,662 |
|---|
Jul 24 | $13,083 | $12,674 | $12,917 |
|---|
Aug 24 | $11,364 | $12,996 | $11,218 |
|---|
Sep 24 | $11,892 | $13,297 | $11,761 |
|---|
Oct 24 | $12,747 | $12,999 | $12,596 |
|---|
Nov 24 | $17,502 | $13,485 | $17,303 |
|---|
Dec 24 | $13,938 | $13,166 | $13,787 |
|---|
Jan 25 | $14,560 | $13,608 | $14,390 |
|---|
Feb 25 | $12,377 | $13,526 | $12,237 |
|---|
Mar 25 | $10,098 | $12,992 | $9,974 |
|---|
Apr 25 | $10,929 | $13,113 | $10,798 |
|---|
May 25 | $12,644 | $13,867 | $12,496 |
|---|
Jun 25 | $15,991 | $14,489 | $15,803 |
|---|
Jul 25 | $17,245 | $14,686 | $17,066 |
|---|
Aug 25 | $18,199 | $15,048 | $18,001 |
|---|
Sep 25 | $22,546 | $15,594 | $22,325 |
|---|
Oct 25 | $25,149 | $15,943 | $24,901 |
|---|
Nov 25 | $20,555 | $15,941 | $20,335 |
|---|
Dec 25 | $17,809 | $16,107 | $17,630 |
|---|
Jan 26 | $18,719 | $16,584 | $18,542 |
|---|
Feb 26 | $16,903 | $16,798 | $16,742 |
|---|
Mar 26 | $15,880 | $15,591 | $15,707 |
|---|
See “Average annual total returns” for additional information on fund performance. |
|
| No Deduction of Taxes [Text Block] |
|
Performance results do not reflect the deduction of taxes that a shareholder would pay on fund distributions or on the redemption or sale of fund shares.
|
|
| AssetsNet |
|
$ 67,745,096
|
|
| Holdings Count | Holding |
|
45
|
|
| Advisory Fees Paid, Amount |
|
$ 306,096
|
|
| InvestmentCompanyPortfolioTurnover |
|
69.00%
|
|
| Additional Fund Statistics [Text Block] |
|
Table SummaryNet Assets........................................................................................................................................................................................................................................................................................................................................................................................................................................................................................................................................................................................................................................................................................................................................................................................................................................................................................................................................................................................................................................ | $67,745,096 |
|---|
Number of Portfolio Holdings........................................................................................................................................................................................................................................................................................................................................................................................................................................................................................................................................................................................................................................................................................................................................................................................................................................................................................................................................................................................................................................ | 45 |
|---|
Net Investment Advisory Fees........................................................................................................................................................................................................................................................................................................................................................................................................................................................................................................................................................................................................................................................................................................................................................................................................................................................................................................................................................................................................................................ | $306,096 |
|---|
Portfolio Turnover Rate........................................................................................................................................................................................................................................................................................................................................................................................................................................................................................................................................................................................................................................................................................................................................................................................................................................................................................................................................................................................................................................ | 69% |
|---|
|
|
| C000065073 |
|
|
|
| Shareholder Report [Line Items] |
|
|
|
| Fund Name |
|
iShares Emerging Markets Infrastructure ETF
|
|
| Trading Symbol |
|
EMIF
|
|
| Security Exchange Name |
|
NASDAQ
|
|
| Annual or Semi-Annual Statement [Text Block] |
|
This annual shareholder report contains important information about iShares Emerging Markets Infrastructure ETF (the “Fund”) for the period of April 1, 2025 to March 31, 2026
|
|
| Additional Information [Text Block] |
|
You can find additional information about the Fund at blackrock.com/fundreports. You can also request this information by contacting us at 1-800-iShares (1-800-474-2737).
|
|
| Additional Information Phone Number |
|
1-800-474-2737
|
|
| Additional Information Website |
|
blackrock.com/fundreports
|
|
| Expenses [Text Block] |
|
What were the Fund costs for the last year?(based on a hypothetical $10,000 investment) Table SummaryFund name | Costs of a $10,000
investment | Costs paid as a percentage of a
$10,000 investment |
|---|
iShares Emerging Markets Infrastructure ETF | $72 | 0.60% |
|---|
|
|
| Expenses Paid, Amount |
|
$ 72
|
|
| Expense Ratio, Percent |
|
0.60%
|
|
| Performance Past Does Not Indicate Future [Text] |
|
Past performance is not an indication of future results.
|
|
| Line Graph [Table Text Block] |
|
Cumulative performance: April 1, 2016 through March 31, 2026 Initial investment of $10,000 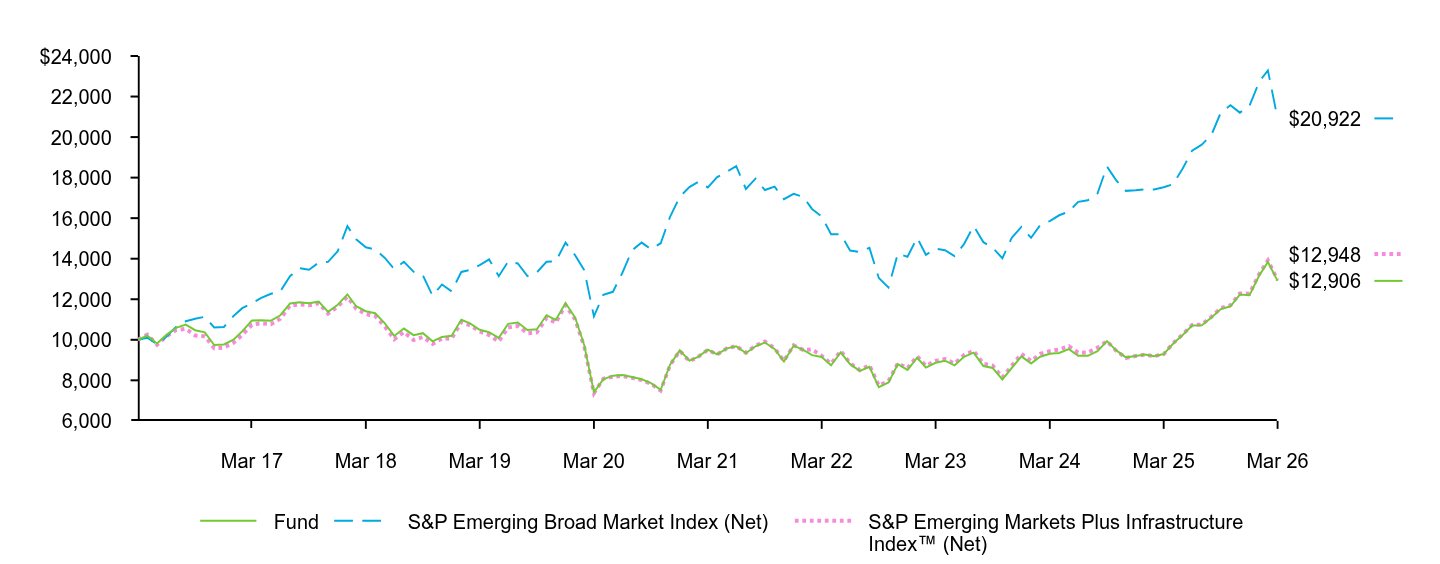 Table Summary | Fund | S&P Emerging Broad Market Index (Net) | S&P Emerging Markets Plus Infrastructure Index™ (Net) |
|---|
Mar 16 | $10,000 | $10,000 | $10,000 |
|---|
Apr 16 | $10,206 | $10,103 | $10,257 |
|---|
May 16 | $9,815 | $9,776 | $9,749 |
|---|
Jun 16 | $10,241 | $10,152 | $10,178 |
|---|
Jul 16 | $10,588 | $10,636 | $10,480 |
|---|
Aug 16 | $10,746 | $10,914 | $10,541 |
|---|
Sep 16 | $10,471 | $11,037 | $10,213 |
|---|
Oct 16 | $10,368 | $11,135 | $10,174 |
|---|
Nov 16 | $9,739 | $10,606 | $9,580 |
|---|
Dec 16 | $9,767 | $10,629 | $9,617 |
|---|
Jan 17 | $10,004 | $11,174 | $9,855 |
|---|
Feb 17 | $10,424 | $11,560 | $10,236 |
|---|
Mar 17 | $10,946 | $11,805 | $10,742 |
|---|
Apr 17 | $10,959 | $12,070 | $10,819 |
|---|
May 17 | $10,942 | $12,269 | $10,768 |
|---|
Jun 17 | $11,210 | $12,387 | $11,035 |
|---|
Jul 17 | $11,790 | $13,139 | $11,687 |
|---|
Aug 17 | $11,850 | $13,534 | $11,750 |
|---|
Sep 17 | $11,804 | $13,457 | $11,700 |
|---|
Oct 17 | $11,881 | $13,806 | $11,803 |
|---|
Nov 17 | $11,378 | $13,843 | $11,293 |
|---|
Dec 17 | $11,726 | $14,371 | $11,641 |
|---|
Jan 18 | $12,239 | $15,605 | $12,118 |
|---|
Feb 18 | $11,654 | $14,961 | $11,540 |
|---|
Mar 18 | $11,408 | $14,564 | $11,264 |
|---|
Apr 18 | $11,308 | $14,458 | $11,170 |
|---|
May 18 | $10,809 | $14,038 | $10,650 |
|---|
Jun 18 | $10,189 | $13,484 | $10,021 |
|---|
Jul 18 | $10,554 | $13,848 | $10,385 |
|---|
Aug 18 | $10,226 | $13,358 | $9,983 |
|---|
Sep 18 | $10,327 | $13,172 | $10,135 |
|---|
Oct 18 | $9,922 | $12,170 | $9,796 |
|---|
Nov 18 | $10,142 | $12,730 | $10,063 |
|---|
Dec 18 | $10,202 | $12,387 | $10,055 |
|---|
Jan 19 | $10,989 | $13,348 | $10,872 |
|---|
Feb 19 | $10,814 | $13,446 | $10,718 |
|---|
Mar 19 | $10,491 | $13,678 | $10,410 |
|---|
Apr 19 | $10,374 | $13,968 | $10,229 |
|---|
May 19 | $10,096 | $13,137 | $9,916 |
|---|
Jun 19 | $10,785 | $13,860 | $10,606 |
|---|
Jul 19 | $10,855 | $13,768 | $10,683 |
|---|
Aug 19 | $10,484 | $13,145 | $10,323 |
|---|
Sep 19 | $10,521 | $13,323 | $10,364 |
|---|
Oct 19 | $11,216 | $13,847 | $11,070 |
|---|
Nov 19 | $10,982 | $13,865 | $10,844 |
|---|
Dec 19 | $11,815 | $14,797 | $11,706 |
|---|
Jan 20 | $11,088 | $14,160 | $10,995 |
|---|
Feb 20 | $9,733 | $13,433 | $9,655 |
|---|
Mar 20 | $7,415 | $11,151 | $7,359 |
|---|
Apr 20 | $8,051 | $12,215 | $8,078 |
|---|
May 20 | $8,231 | $12,366 | $8,181 |
|---|
Jun 20 | $8,262 | $13,297 | $8,218 |
|---|
Jul 20 | $8,167 | $14,409 | $8,123 |
|---|
Aug 20 | $8,050 | $14,797 | $8,009 |
|---|
Sep 20 | $7,864 | $14,469 | $7,830 |
|---|
Oct 20 | $7,530 | $14,763 | $7,496 |
|---|
Nov 20 | $8,771 | $16,068 | $8,748 |
|---|
Dec 20 | $9,477 | $17,044 | $9,454 |
|---|
Jan 21 | $8,969 | $17,531 | $8,948 |
|---|
Feb 21 | $9,154 | $17,794 | $9,157 |
|---|
Mar 21 | $9,515 | $17,514 | $9,505 |
|---|
Apr 21 | $9,281 | $18,024 | $9,275 |
|---|
May 21 | $9,577 | $18,296 | $9,576 |
|---|
Jun 21 | $9,684 | $18,564 | $9,690 |
|---|
Jul 21 | $9,345 | $17,443 | $9,359 |
|---|
Aug 21 | $9,680 | $17,950 | $9,708 |
|---|
Sep 21 | $9,866 | $17,386 | $9,915 |
|---|
Oct 21 | $9,546 | $17,557 | $9,579 |
|---|
Nov 21 | $8,922 | $16,936 | $8,959 |
|---|
Dec 21 | $9,709 | $17,204 | $9,728 |
|---|
Jan 22 | $9,502 | $17,041 | $9,492 |
|---|
Feb 22 | $9,244 | $16,455 | $9,531 |
|---|
Mar 22 | $9,151 | $16,077 | $9,210 |
|---|
Apr 22 | $8,742 | $15,205 | $8,823 |
|---|
May 22 | $9,385 | $15,206 | $9,451 |
|---|
Jun 22 | $8,798 | $14,405 | $8,842 |
|---|
Jul 22 | $8,463 | $14,333 | $8,504 |
|---|
Aug 22 | $8,666 | $14,537 | $8,745 |
|---|
Sep 22 | $7,662 | $13,046 | $7,742 |
|---|
Oct 22 | $7,896 | $12,584 | $7,963 |
|---|
Nov 22 | $8,802 | $14,251 | $8,839 |
|---|
Dec 22 | $8,516 | $14,096 | $8,599 |
|---|
Jan 23 | $9,115 | $15,033 | $9,187 |
|---|
Feb 23 | $8,631 | $14,194 | $8,714 |
|---|
Mar 23 | $8,866 | $14,497 | $8,956 |
|---|
Apr 23 | $8,968 | $14,420 | $9,049 |
|---|
May 23 | $8,738 | $14,122 | $8,829 |
|---|
Jun 23 | $9,161 | $14,721 | $9,252 |
|---|
Jul 23 | $9,365 | $15,615 | $9,458 |
|---|
Aug 23 | $8,708 | $14,817 | $8,813 |
|---|
Sep 23 | $8,610 | $14,538 | $8,726 |
|---|
Oct 23 | $8,041 | $14,020 | $8,139 |
|---|
Nov 23 | $8,607 | $15,027 | $8,719 |
|---|
Dec 23 | $9,182 | $15,570 | $9,304 |
|---|
Jan 24 | $8,833 | $15,030 | $8,956 |
|---|
Feb 24 | $9,162 | $15,656 | $9,302 |
|---|
Mar 24 | $9,306 | $15,856 | $9,442 |
|---|
Apr 24 | $9,353 | $16,143 | $9,518 |
|---|
May 24 | $9,543 | $16,328 | $9,685 |
|---|
Jun 24 | $9,212 | $16,805 | $9,363 |
|---|
Jul 24 | $9,207 | $16,887 | $9,368 |
|---|
Aug 24 | $9,440 | $17,221 | $9,612 |
|---|
Sep 24 | $9,934 | $18,546 | $9,931 |
|---|
Oct 24 | $9,466 | $17,843 | $9,443 |
|---|
Nov 24 | $9,134 | $17,347 | $9,103 |
|---|
Dec 24 | $9,203 | $17,377 | $9,201 |
|---|
Jan 25 | $9,272 | $17,427 | $9,265 |
|---|
Feb 25 | $9,190 | $17,418 | $9,188 |
|---|
Mar 25 | $9,295 | $17,527 | $9,296 |
|---|
Apr 25 | $9,806 | $17,675 | $9,829 |
|---|
May 25 | $10,240 | $18,453 | $10,272 |
|---|
Jun 25 | $10,706 | $19,327 | $10,726 |
|---|
Jul 25 | $10,713 | $19,629 | $10,751 |
|---|
Aug 25 | $11,102 | $20,110 | $11,131 |
|---|
Sep 25 | $11,516 | $21,210 | $11,564 |
|---|
Oct 25 | $11,651 | $21,570 | $11,703 |
|---|
Nov 25 | $12,230 | $21,204 | $12,288 |
|---|
Dec 25 | $12,201 | $21,544 | $12,276 |
|---|
Jan 26 | $13,165 | $22,727 | $13,246 |
|---|
Feb 26 | $13,838 | $23,287 | $13,922 |
|---|
Mar 26 | $12,906 | $20,922 | $12,948 |
|---|
See “Average annual total returns” for additional information on fund performance. |
|
| No Deduction of Taxes [Text Block] |
|
Performance results do not reflect the deduction of taxes that a shareholder would pay on fund distributions or on the redemption or sale of fund shares.
|
|
| AssetsNet |
|
$ 13,948,804
|
|
| Holdings Count | Holding |
|
32
|
|
| Advisory Fees Paid, Amount |
|
$ 51,823
|
|
| InvestmentCompanyPortfolioTurnover |
|
28.00%
|
|
| Additional Fund Statistics [Text Block] |
|
Table SummaryNet Assets........................................................................................................................................................................................................................................................................................................................................................................................................................................................................................................................................................................................................................................................................................................................................................................................................................................................................................................................................................................................................................................ | $13,948,804 |
|---|
Number of Portfolio Holdings........................................................................................................................................................................................................................................................................................................................................................................................................................................................................................................................................................................................................................................................................................................................................................................................................................................................................................................................................................................................................................................ | 32 |
|---|
Net Investment Advisory Fees........................................................................................................................................................................................................................................................................................................................................................................................................................................................................................................................................................................................................................................................................................................................................................................................................................................................................................................................................................................................................................................ | $51,823 |
|---|
Portfolio Turnover Rate........................................................................................................................................................................................................................................................................................................................................................................................................................................................................................................................................................................................................................................................................................................................................................................................................................................................................................................................................................................................................................................ | 28% |
|---|
|
|
| C000012045 |
|
|
|
| Shareholder Report [Line Items] |
|
|
|
| Fund Name |
|
iShares Europe ETF
|
|
| Trading Symbol |
|
IEV
|
|
| Security Exchange Name |
|
NYSEArca
|
|
| Annual or Semi-Annual Statement [Text Block] |
|
This annual shareholder report contains important information about iShares Europe ETF (the “Fund”) for the period of April 1, 2025 to March 31, 2026
|
|
| Additional Information [Text Block] |
|
You can find additional information about the Fund at blackrock.com/fundreports. You can also request this information by contacting us at 1-800-iShares (1-800-474-2737).
|
|
| Additional Information Phone Number |
|
1-800-474-2737
|
|
| Additional Information Website |
|
blackrock.com/fundreports
|
|
| Expenses [Text Block] |
|
What were the Fund costs for the last year?(based on a hypothetical $10,000 investment) Table SummaryFund name | Costs of a $10,000
investment | Costs paid as a percentage of a
$10,000 investment |
|---|
iShares Europe ETF | $65 | 0.59% |
|---|
|
|
| Expenses Paid, Amount |
|
$ 65
|
|
| Expense Ratio, Percent |
|
0.59%
|
|
| Performance Past Does Not Indicate Future [Text] |
|
Past performance is not an indication of future results.
|
|
| Line Graph [Table Text Block] |
|
Cumulative performance: April 1, 2016 through March 31, 2026 Initial investment of $10,000 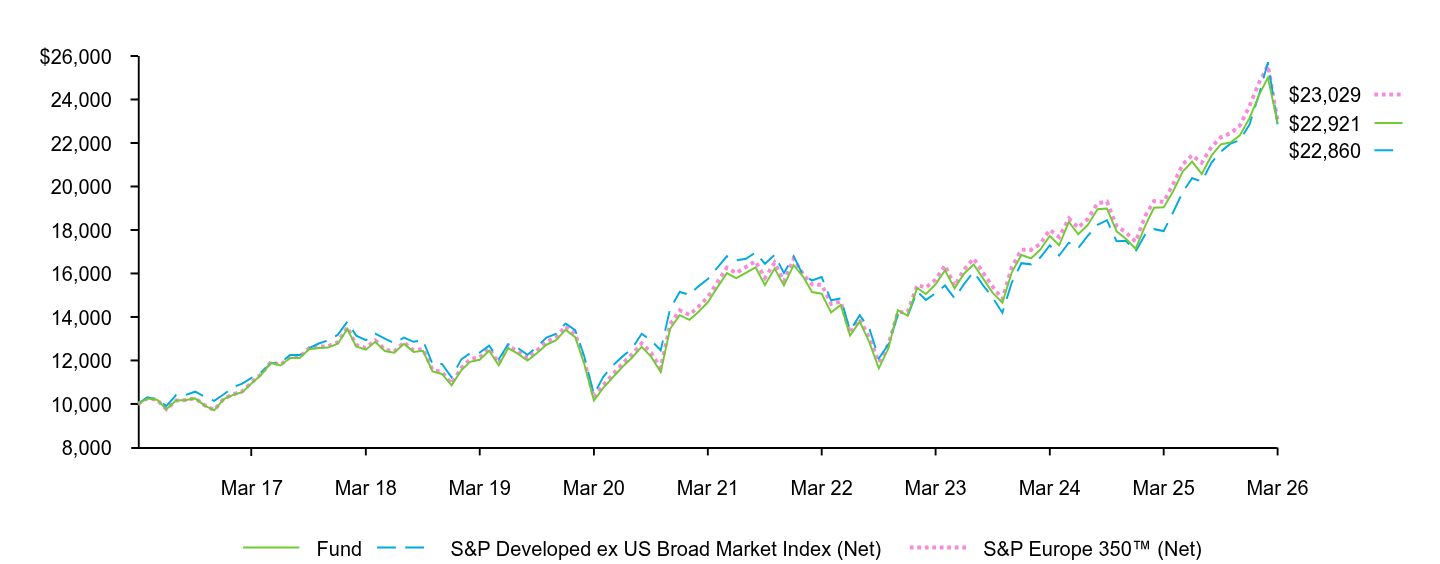 Table Summary | Fund | S&P Developed ex US Broad Market Index (Net) | S&P Europe 350™ (Net) |
|---|
Mar 16 | $10,000 | $10,000 | $10,000 |
|---|
Apr 16 | $10,252 | $10,310 | $10,251 |
|---|
May 16 | $10,196 | $10,202 | $10,192 |
|---|
Jun 16 | $9,756 | $9,904 | $9,752 |
|---|
Jul 16 | $10,154 | $10,409 | $10,157 |
|---|
Aug 16 | $10,177 | $10,414 | $10,180 |
|---|
Sep 16 | $10,255 | $10,563 | $10,262 |
|---|
Oct 16 | $9,922 | $10,330 | $9,932 |
|---|
Nov 16 | $9,704 | $10,142 | $9,717 |
|---|
Dec 16 | $10,220 | $10,444 | $10,243 |
|---|
Jan 17 | $10,425 | $10,783 | $10,451 |
|---|
Feb 17 | $10,543 | $10,935 | $10,576 |
|---|
Mar 17 | $10,965 | $11,209 | $10,998 |
|---|
Apr 17 | $11,345 | $11,461 | $11,379 |
|---|
May 17 | $11,898 | $11,870 | $11,928 |
|---|
Jun 17 | $11,768 | $11,892 | $11,798 |
|---|
Jul 17 | $12,118 | $12,251 | $12,154 |
|---|
Aug 17 | $12,115 | $12,249 | $12,160 |
|---|
Sep 17 | $12,519 | $12,557 | $12,571 |
|---|
Oct 17 | $12,572 | $12,779 | $12,633 |
|---|
Nov 17 | $12,591 | $12,923 | $12,652 |
|---|
Dec 17 | $12,770 | $13,173 | $12,836 |
|---|
Jan 18 | $13,450 | $13,785 | $13,526 |
|---|
Feb 18 | $12,643 | $13,143 | $12,717 |
|---|
Mar 18 | $12,495 | $12,932 | $12,568 |
|---|
Apr 18 | $12,856 | $13,234 | $12,926 |
|---|
May 18 | $12,434 | $13,000 | $12,494 |
|---|
Jun 18 | $12,353 | $12,801 | $12,416 |
|---|
Jul 18 | $12,768 | $13,048 | $12,840 |
|---|
Aug 18 | $12,394 | $12,857 | $12,469 |
|---|
Sep 18 | $12,441 | $12,938 | $12,522 |
|---|
Oct 18 | $11,492 | $11,824 | $11,571 |
|---|
Nov 18 | $11,381 | $11,841 | $11,466 |
|---|
Dec 18 | $10,852 | $11,220 | $10,939 |
|---|
Jan 19 | $11,553 | $12,050 | $11,659 |
|---|
Feb 19 | $11,936 | $12,328 | $12,053 |
|---|
Mar 19 | $12,030 | $12,361 | $12,143 |
|---|
Apr 19 | $12,448 | $12,683 | $12,560 |
|---|
May 19 | $11,775 | $12,052 | $11,874 |
|---|
Jun 19 | $12,564 | $12,747 | $12,671 |
|---|
Jul 19 | $12,313 | $12,578 | $12,424 |
|---|
Aug 19 | $11,992 | $12,260 | $12,107 |
|---|
Sep 19 | $12,328 | $12,614 | $12,451 |
|---|
Oct 19 | $12,723 | $13,053 | $12,863 |
|---|
Nov 19 | $12,917 | $13,219 | $13,063 |
|---|
Dec 19 | $13,411 | $13,700 | $13,569 |
|---|
Jan 20 | $13,067 | $13,398 | $13,229 |
|---|
Feb 20 | $11,844 | $12,194 | $11,995 |
|---|
Mar 20 | $10,152 | $10,438 | $10,281 |
|---|
Apr 20 | $10,742 | $11,245 | $10,874 |
|---|
May 20 | $11,226 | $11,776 | $11,364 |
|---|
Jun 20 | $11,699 | $12,175 | $11,844 |
|---|
Jul 20 | $12,125 | $12,542 | $12,281 |
|---|
Aug 20 | $12,624 | $13,227 | $12,791 |
|---|
Sep 20 | $12,177 | $12,927 | $12,358 |
|---|
Oct 20 | $11,470 | $12,465 | $11,648 |
|---|
Nov 20 | $13,453 | $14,365 | $13,661 |
|---|
Dec 20 | $14,081 | $15,149 | $14,307 |
|---|
Jan 21 | $13,865 | $15,023 | $14,092 |
|---|
Feb 21 | $14,221 | $15,396 | $14,461 |
|---|
Mar 21 | $14,677 | $15,741 | $14,912 |
|---|
Apr 21 | $15,346 | $16,256 | $15,587 |
|---|
May 21 | $16,018 | $16,790 | $16,265 |
|---|
Jun 21 | $15,783 | $16,608 | $16,017 |
|---|
Jul 21 | $16,030 | $16,672 | $16,297 |
|---|
Aug 21 | $16,279 | $16,962 | $16,560 |
|---|
Sep 21 | $15,472 | $16,446 | $15,789 |
|---|
Oct 21 | $16,225 | $16,854 | $16,498 |
|---|
Nov 21 | $15,448 | $16,018 | $15,641 |
|---|
Dec 21 | $16,382 | $16,796 | $16,684 |
|---|
Jan 22 | $15,844 | $15,899 | $15,943 |
|---|
Feb 22 | $15,147 | $15,683 | $15,495 |
|---|
Mar 22 | $15,071 | $15,838 | $15,478 |
|---|
Apr 22 | $14,201 | $14,764 | $14,597 |
|---|
May 22 | $14,553 | $14,854 | $14,705 |
|---|
Jun 22 | $13,147 | $13,373 | $13,245 |
|---|
Jul 22 | $13,791 | $14,082 | $13,896 |
|---|
Aug 22 | $12,818 | $13,462 | $13,035 |
|---|
Sep 22 | $11,637 | $12,098 | $11,909 |
|---|
Oct 22 | $12,562 | $12,740 | $12,760 |
|---|
Nov 22 | $14,311 | $14,092 | $14,214 |
|---|
Dec 22 | $14,062 | $14,022 | $14,223 |
|---|
Jan 23 | $15,334 | $15,180 | $15,460 |
|---|
Feb 23 | $15,053 | $14,785 | $15,352 |
|---|
Mar 23 | $15,503 | $15,090 | $15,723 |
|---|
Apr 23 | $16,144 | $15,446 | $16,376 |
|---|
May 23 | $15,313 | $14,856 | $15,422 |
|---|
Jun 23 | $15,992 | $15,513 | $16,178 |
|---|
Jul 23 | $16,414 | $16,072 | $16,685 |
|---|
Aug 23 | $15,749 | $15,439 | $16,015 |
|---|
Sep 23 | $15,106 | $14,883 | $15,393 |
|---|
Oct 23 | $14,657 | $14,193 | $14,818 |
|---|
Nov 23 | $16,039 | $15,574 | $16,291 |
|---|
Dec 23 | $16,850 | $16,473 | $17,097 |
|---|
Jan 24 | $16,692 | $16,419 | $17,081 |
|---|
Feb 24 | $17,086 | $16,728 | $17,357 |
|---|
Mar 24 | $17,723 | $17,291 | $18,006 |
|---|
Apr 24 | $17,294 | $16,824 | $17,672 |
|---|
May 24 | $18,369 | $17,415 | $18,526 |
|---|
Jun 24 | $17,803 | $17,165 | $18,109 |
|---|
Jul 24 | $18,238 | $17,740 | $18,509 |
|---|
Aug 24 | $18,950 | $18,231 | $19,229 |
|---|
Sep 24 | $18,982 | $18,449 | $19,308 |
|---|
Oct 24 | $17,938 | $17,483 | $18,182 |
|---|
Nov 24 | $17,595 | $17,499 | $17,887 |
|---|
Dec 24 | $17,138 | $17,008 | $17,457 |
|---|
Jan 25 | $18,199 | $17,807 | $18,650 |
|---|
Feb 25 | $19,025 | $18,037 | $19,332 |
|---|
Mar 25 | $19,042 | $17,951 | $19,288 |
|---|
Apr 25 | $19,772 | $18,806 | $20,102 |
|---|
May 25 | $20,686 | $19,744 | $21,020 |
|---|
Jun 25 | $21,148 | $20,378 | $21,435 |
|---|
Jul 25 | $20,574 | $20,229 | $21,091 |
|---|
Aug 25 | $21,416 | $21,093 | $21,813 |
|---|
Sep 25 | $21,939 | $21,607 | $22,261 |
|---|
Oct 25 | $22,019 | $21,970 | $22,444 |
|---|
Nov 25 | $22,352 | $22,127 | $22,792 |
|---|
Dec 25 | $23,140 | $22,851 | $23,702 |
|---|
Jan 26 | $24,214 | $24,255 | $24,784 |
|---|
Feb 26 | $25,009 | $25,712 | $25,566 |
|---|
Mar 26 | $22,921 | $22,860 | $23,029 |
|---|
See “Average annual total returns” for additional information on fund performance. |
|
| No Deduction of Taxes [Text Block] |
|
Performance results do not reflect the deduction of taxes that a shareholder would pay on fund distributions or on the redemption or sale of fund shares.
|
|
| AssetsNet |
|
$ 1,628,891,506
|
|
| Holdings Count | Holding |
|
367
|
|
| Advisory Fees Paid, Amount |
|
$ 11,344,781
|
|
| InvestmentCompanyPortfolioTurnover |
|
4.00%
|
|
| Additional Fund Statistics [Text Block] |
|
Table SummaryNet Assets........................................................................................................................................................................................................................................................................................................................................................................................................................................................................................................................................................................................................................................................................................................................................................................................................................................................................................................................................................................................................................................ | $1,628,891,506 |
|---|
Number of Portfolio Holdings........................................................................................................................................................................................................................................................................................................................................................................................................................................................................................................................................................................................................................................................................................................................................................................................................................................................................................................................................................................................................................................ | 367 |
|---|
Net Investment Advisory Fees........................................................................................................................................................................................................................................................................................................................................................................................................................................................................................................................................................................................................................................................................................................................................................................................................................................................................................................................................................................................................................................ | $11,344,781 |
|---|
Portfolio Turnover Rate........................................................................................................................................................................................................................................................................................................................................................................................................................................................................................................................................................................................................................................................................................................................................................................................................................................................................................................................................................................................................................................ | 4% |
|---|
|
|
| C000201209 |
|
|
|
| Shareholder Report [Line Items] |
|
|
|
| Fund Name |
|
iShares Future AI & Tech ETF
|
|
| Trading Symbol |
|
ARTY
|
|
| Security Exchange Name |
|
NYSEArca
|
|
| Annual or Semi-Annual Statement [Text Block] |
|
This annual shareholder report contains important information about iShares Future AI & Tech ETF (the “Fund”) for the period of April 1, 2025 to March 31, 2026
|
|
| Additional Information [Text Block] |
|
You can find additional information about the Fund at blackrock.com/fundreports. You can also request this information by contacting us at 1-800-iShares (1-800-474-2737).
|
|
| Additional Information Phone Number |
|
1-800-474-2737
|
|
| Additional Information Website |
|
blackrock.com/fundreports
|
|
| Expenses [Text Block] |
|
What were the Fund costs for the last year?(based on a hypothetical $10,000 investment) Table SummaryFund name | Costs of a $10,000
investment | Costs paid as a percentage of a
$10,000 investment |
|---|
iShares Future AI & Tech ETF | $58 | 0.47% |
|---|
|
|
| Expenses Paid, Amount |
|
$ 58
|
|
| Expense Ratio, Percent |
|
0.47%
|
|
| Performance Past Does Not Indicate Future [Text] |
|
Past performance is not an indication of future results.
|
|
| Line Graph [Table Text Block] |
|
Cumulative performance: June 26, 2018 through March 31, 2026 Initial investment of $10,000 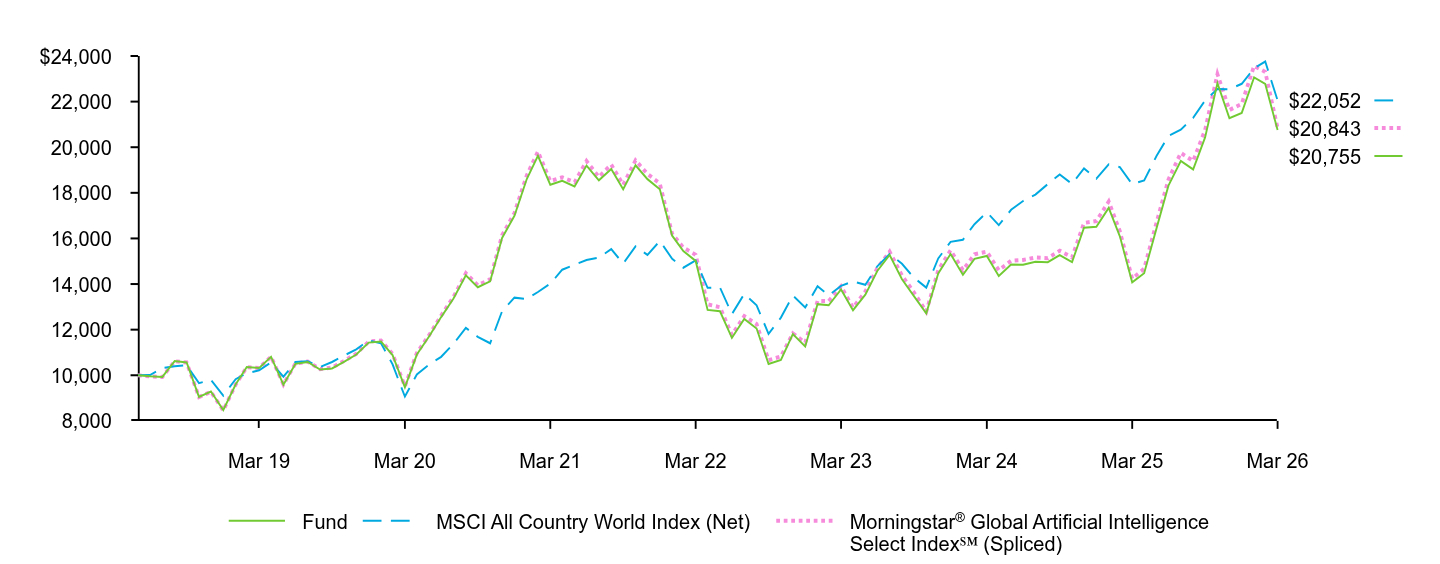 Table Summary | Fund | MSCI All Country World Index (Net) | Morningstar® Global Artificial Intelligence Select Index℠ (Spliced) |
|---|
May 18 | $10,000 | $10,000 | $10,000 |
|---|
Jun 18 | $9,954 | $10,010 | $9,949 |
|---|
Jul 18 | $9,929 | $10,312 | $9,924 |
|---|
Aug 18 | $10,622 | $10,393 | $10,615 |
|---|
Sep 18 | $10,561 | $10,438 | $10,561 |
|---|
Oct 18 | $9,055 | $9,656 | $9,045 |
|---|
Nov 18 | $9,287 | $9,797 | $9,273 |
|---|
Dec 18 | $8,476 | $9,107 | $8,458 |
|---|
Jan 19 | $9,597 | $9,826 | $9,590 |
|---|
Feb 19 | $10,360 | $10,089 | $10,353 |
|---|
Mar 19 | $10,322 | $10,216 | $10,323 |
|---|
Apr 19 | $10,807 | $10,561 | $10,815 |
|---|
May 19 | $9,588 | $9,934 | $9,598 |
|---|
Jun 19 | $10,499 | $10,585 | $10,512 |
|---|
Jul 19 | $10,584 | $10,616 | $10,601 |
|---|
Aug 19 | $10,249 | $10,364 | $10,271 |
|---|
Sep 19 | $10,300 | $10,582 | $10,335 |
|---|
Oct 19 | $10,601 | $10,871 | $10,636 |
|---|
Nov 19 | $10,910 | $11,137 | $10,943 |
|---|
Dec 19 | $11,432 | $11,529 | $11,475 |
|---|
Jan 20 | $11,478 | $11,402 | $11,525 |
|---|
Feb 20 | $10,888 | $10,481 | $10,936 |
|---|
Mar 20 | $9,474 | $9,066 | $9,514 |
|---|
Apr 20 | $10,909 | $10,037 | $10,980 |
|---|
May 20 | $11,712 | $10,474 | $11,766 |
|---|
Jun 20 | $12,552 | $10,808 | $12,616 |
|---|
Jul 20 | $13,364 | $11,380 | $13,440 |
|---|
Aug 20 | $14,381 | $12,077 | $14,475 |
|---|
Sep 20 | $13,858 | $11,687 | $13,947 |
|---|
Oct 20 | $14,117 | $11,403 | $14,210 |
|---|
Nov 20 | $16,022 | $12,808 | $16,140 |
|---|
Dec 20 | $16,990 | $13,403 | $17,115 |
|---|
Jan 21 | $18,605 | $13,342 | $18,770 |
|---|
Feb 21 | $19,626 | $13,651 | $19,811 |
|---|
Mar 21 | $18,353 | $14,016 | $18,514 |
|---|
Apr 21 | $18,524 | $14,629 | $18,681 |
|---|
May 21 | $18,280 | $14,850 | $18,463 |
|---|
Jun 21 | $19,194 | $15,052 | $19,394 |
|---|
Jul 21 | $18,548 | $15,156 | $18,695 |
|---|
Aug 21 | $19,049 | $15,535 | $19,238 |
|---|
Sep 21 | $18,159 | $14,894 | $18,351 |
|---|
Oct 21 | $19,211 | $15,654 | $19,426 |
|---|
Nov 21 | $18,599 | $15,277 | $18,830 |
|---|
Dec 21 | $18,155 | $15,888 | $18,407 |
|---|
Jan 22 | $16,121 | $15,108 | $16,202 |
|---|
Feb 22 | $15,446 | $14,717 | $15,599 |
|---|
Mar 22 | $15,016 | $15,036 | $15,285 |
|---|
Apr 22 | $12,867 | $13,833 | $13,110 |
|---|
May 22 | $12,808 | $13,849 | $12,985 |
|---|
Jun 22 | $11,642 | $12,681 | $11,766 |
|---|
Jul 22 | $12,466 | $13,567 | $12,595 |
|---|
Aug 22 | $12,049 | $13,067 | $12,247 |
|---|
Sep 22 | $10,496 | $11,816 | $10,658 |
|---|
Oct 22 | $10,672 | $12,530 | $10,824 |
|---|
Nov 22 | $11,807 | $13,501 | $11,839 |
|---|
Dec 22 | $11,263 | $12,970 | $11,426 |
|---|
Jan 23 | $13,119 | $13,900 | $13,256 |
|---|
Feb 23 | $13,068 | $13,501 | $13,250 |
|---|
Mar 23 | $13,767 | $13,918 | $13,896 |
|---|
Apr 23 | $12,854 | $14,118 | $12,962 |
|---|
May 23 | $13,534 | $13,967 | $13,672 |
|---|
Jun 23 | $14,574 | $14,778 | $14,697 |
|---|
Jul 23 | $15,277 | $15,318 | $15,421 |
|---|
Aug 23 | $14,211 | $14,890 | $14,377 |
|---|
Sep 23 | $13,474 | $14,275 | $13,634 |
|---|
Oct 23 | $12,716 | $13,845 | $12,790 |
|---|
Nov 23 | $14,463 | $15,124 | $14,607 |
|---|
Dec 23 | $15,318 | $15,850 | $15,482 |
|---|
Jan 24 | $14,405 | $15,943 | $14,607 |
|---|
Feb 24 | $15,107 | $16,627 | $15,303 |
|---|
Mar 24 | $15,232 | $17,149 | $15,419 |
|---|
Apr 24 | $14,354 | $16,583 | $14,607 |
|---|
May 24 | $14,862 | $17,257 | $15,023 |
|---|
Jun 24 | $14,850 | $17,641 | $15,058 |
|---|
Jul 24 | $14,979 | $17,925 | $15,164 |
|---|
Aug 24 | $14,956 | $18,381 | $15,135 |
|---|
Sep 24 | $15,270 | $18,808 | $15,464 |
|---|
Oct 24 | $14,961 | $18,386 | $15,169 |
|---|
Nov 24 | $16,470 | $19,073 | $16,680 |
|---|
Dec 24 | $16,509 | $18,622 | $16,763 |
|---|
Jan 25 | $17,341 | $19,247 | $17,621 |
|---|
Feb 25 | $16,094 | $19,131 | $16,315 |
|---|
Mar 25 | $14,074 | $18,375 | $14,236 |
|---|
Apr 25 | $14,476 | $18,547 | $14,673 |
|---|
May 25 | $16,440 | $19,612 | $16,698 |
|---|
Jun 25 | $18,316 | $20,493 | $18,585 |
|---|
Jul 25 | $19,398 | $20,771 | $19,752 |
|---|
Aug 25 | $19,026 | $21,284 | $19,394 |
|---|
Sep 25 | $20,428 | $22,055 | $20,761 |
|---|
Oct 25 | $22,805 | $22,549 | $23,208 |
|---|
Nov 25 | $21,273 | $22,546 | $21,629 |
|---|
Dec 25 | $21,503 | $22,781 | $21,904 |
|---|
Jan 26 | $23,061 | $23,457 | $23,568 |
|---|
Feb 26 | $22,777 | $23,758 | $23,305 |
|---|
Mar 26 | $20,755 | $22,052 | $20,843 |
|---|
See “Average annual total returns” for additional information on fund performance. |
|
| No Deduction of Taxes [Text Block] |
|
Performance results do not reflect the deduction of taxes that a shareholder would pay on fund distributions or on the redemption or sale of fund shares.
|
|
| AssetsNet |
|
$ 2,063,628,665
|
|
| Holdings Count | Holding |
|
53
|
|
| Advisory Fees Paid, Amount |
|
$ 7,420,811
|
|
| InvestmentCompanyPortfolioTurnover |
|
91.00%
|
|
| Additional Fund Statistics [Text Block] |
|
Table SummaryNet Assets........................................................................................................................................................................................................................................................................................................................................................................................................................................................................................................................................................................................................................................................................................................................................................................................................................................................................................................................................................................................................................................ | $2,063,628,665 |
|---|
Number of Portfolio Holdings........................................................................................................................................................................................................................................................................................................................................................................................................................................................................................................................................................................................................................................................................................................................................................................................................................................................................................................................................................................................................................................ | 53 |
|---|
Net Investment Advisory Fees........................................................................................................................................................................................................................................................................................................................................................................................................................................................................................................................................................................................................................................................................................................................................................................................................................................................................................................................................................................................................................................ | $7,420,811 |
|---|
Portfolio Turnover Rate........................................................................................................................................................................................................................................................................................................................................................................................................................................................................................................................................................................................................................................................................................................................................................................................................................................................................................................................................................................................................................................ | 91% |
|---|
|
|
| C000240080 |
|
|
|
| Shareholder Report [Line Items] |
|
|
|
| Fund Name |
|
iShares Future Metaverse Tech and Communications ETF
|
|
| Trading Symbol |
|
IVRS
|
|
| Security Exchange Name |
|
NYSEArca
|
|
| Annual or Semi-Annual Statement [Text Block] |
|
This annual shareholder report contains important information about iShares Future Metaverse Tech and Communications ETF (the “Fund”) for the period of April 1, 2025 to March 31, 2026
|
|
| Additional Information [Text Block] |
|
You can find additional information about the Fund at blackrock.com/fundreports. You can also request this information by contacting us at 1-800-iShares (1-800-474-2737).
|
|
| Additional Information Phone Number |
|
1-800-474-2737
|
|
| Additional Information Website |
|
blackrock.com/fundreports
|
|
| Expenses [Text Block] |
|
What were the Fund costs for the last year?(based on a hypothetical $10,000 investment) Table SummaryFund name | Costs of a $10,000
investment | Costs paid as a percentage of a
$10,000 investment |
|---|
iShares Future Metaverse Tech and Communications ETF | $46 | 0.47% |
|---|
|
|
| Expenses Paid, Amount |
|
$ 46
|
|
| Expense Ratio, Percent |
|
0.47%
|
|
| Performance Past Does Not Indicate Future [Text] |
|
Past performance is not an indication of future results.
|
|
| Line Graph [Table Text Block] |
|
Cumulative performance: February 14, 2023 through March 31, 2026 Initial investment of $10,000 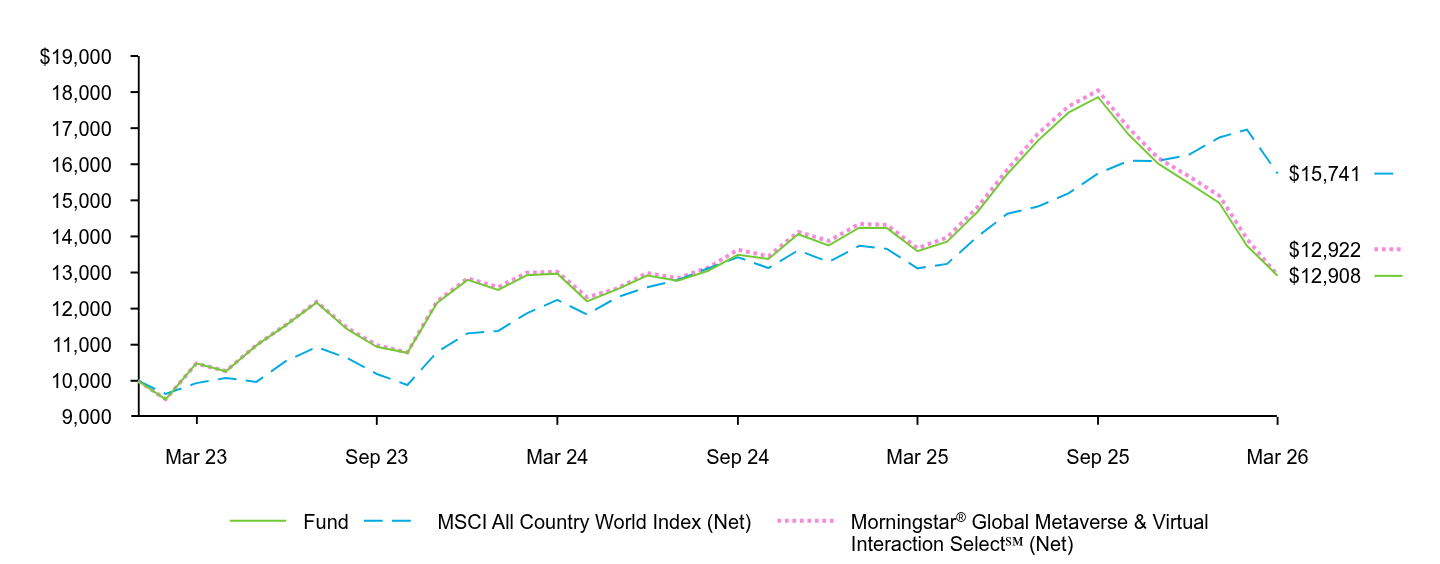 Table Summary | Fund | MSCI All Country World Index (Net) | Morningstar® Global Metaverse & Virtual Interaction Select℠ (Net) |
|---|
Jan 23 | $10,000 | $10,000 | $10,000 |
|---|
Feb 23 | $9,485 | $9,637 | $9,488 |
|---|
Mar 23 | $10,482 | $9,935 | $10,477 |
|---|
Apr 23 | $10,262 | $10,077 | $10,271 |
|---|
May 23 | $10,981 | $9,969 | $10,990 |
|---|
Jun 23 | $11,543 | $10,548 | $11,553 |
|---|
Jul 23 | $12,169 | $10,934 | $12,190 |
|---|
Aug 23 | $11,430 | $10,629 | $11,464 |
|---|
Sep 23 | $10,941 | $10,189 | $10,987 |
|---|
Oct 23 | $10,776 | $9,883 | $10,787 |
|---|
Nov 23 | $12,158 | $10,795 | $12,202 |
|---|
Dec 23 | $12,796 | $11,314 | $12,838 |
|---|
Jan 24 | $12,519 | $11,380 | $12,596 |
|---|
Feb 24 | $12,922 | $11,868 | $12,995 |
|---|
Mar 24 | $12,969 | $12,241 | $13,019 |
|---|
Apr 24 | $12,201 | $11,837 | $12,314 |
|---|
May 24 | $12,540 | $12,318 | $12,559 |
|---|
Jun 24 | $12,915 | $12,592 | $12,986 |
|---|
Jul 24 | $12,772 | $12,795 | $12,841 |
|---|
Aug 24 | $13,049 | $13,120 | $13,136 |
|---|
Sep 24 | $13,490 | $13,425 | $13,634 |
|---|
Oct 24 | $13,373 | $13,124 | $13,450 |
|---|
Nov 24 | $14,062 | $13,615 | $14,124 |
|---|
Dec 24 | $13,750 | $13,292 | $13,876 |
|---|
Jan 25 | $14,242 | $13,739 | $14,346 |
|---|
Feb 25 | $14,231 | $13,656 | $14,320 |
|---|
Mar 25 | $13,590 | $13,116 | $13,675 |
|---|
Apr 25 | $13,854 | $13,239 | $13,972 |
|---|
May 25 | $14,684 | $14,000 | $14,816 |
|---|
Jun 25 | $15,725 | $14,628 | $15,850 |
|---|
Jul 25 | $16,650 | $14,827 | $16,844 |
|---|
Aug 25 | $17,430 | $15,193 | $17,600 |
|---|
Sep 25 | $17,858 | $15,743 | $18,044 |
|---|
Oct 25 | $16,823 | $16,095 | $17,010 |
|---|
Nov 25 | $16,018 | $16,093 | $16,168 |
|---|
Dec 25 | $15,480 | $16,262 | $15,668 |
|---|
Jan 26 | $14,929 | $16,743 | $15,126 |
|---|
Feb 26 | $13,742 | $16,959 | $13,930 |
|---|
Mar 26 | $12,908 | $15,741 | $12,922 |
|---|
See “Average annual total returns” for additional information on fund performance. |
|
| No Deduction of Taxes [Text Block] |
|
Performance results do not reflect the deduction of taxes that a shareholder would pay on fund distributions or on the redemption or sale of fund shares.
|
|
| AssetsNet |
|
$ 7,163,385
|
|
| Holdings Count | Holding |
|
42
|
|
| Advisory Fees Paid, Amount |
|
$ 35,084
|
|
| InvestmentCompanyPortfolioTurnover |
|
79.00%
|
|
| Additional Fund Statistics [Text Block] |
|
Table SummaryNet Assets........................................................................................................................................................................................................................................................................................................................................................................................................................................................................................................................................................................................................................................................................................................................................................................................................................................................................................................................................................................................................................................ | $7,163,385 |
|---|
Number of Portfolio Holdings........................................................................................................................................................................................................................................................................................................................................................................................................................................................................................................................................................................................................................................................................................................................................................................................................................................................................................................................................................................................................................................ | 42 |
|---|
Net Investment Advisory Fees........................................................................................................................................................................................................................................................................................................................................................................................................................................................................................................................................................................................................................................................................................................................................................................................................................................................................................................................................................................................................................................ | $35,084 |
|---|
Portfolio Turnover Rate........................................................................................................................................................................................................................................................................................................................................................................................................................................................................................................................................................................................................................................................................................................................................................................................................................................................................................................................................................................................................................................ | 79% |
|---|
|
|
| C000064225 |
|
|
|
| Shareholder Report [Line Items] |
|
|
|
| Fund Name |
|
iShares India 50 ETF
|
|
| Trading Symbol |
|
INDY
|
|
| Security Exchange Name |
|
NASDAQ
|
|
| Annual or Semi-Annual Statement [Text Block] |
|
This annual shareholder report contains important information about iShares India 50 ETF (the “Fund”) for the period of April 1, 2025 to March 31, 2026
|
|
| Additional Information [Text Block] |
|
You can find additional information about the Fund at blackrock.com/fundreports. You can also request this information by contacting us at 1-800-iShares (1-800-474-2737).
|
|
| Material Fund Change Notice [Text Block] |
|
This report describes changes to the Fund that occurred during the reporting period.
|
|
| Additional Information Phone Number |
|
1-800-474-2737
|
|
| Additional Information Website |
|
blackrock.com/fundreports
|
|
| Expenses [Text Block] |
|
What were the Fund costs for the last year?(based on a hypothetical $10,000 investment) Table SummaryFund name | Costs of a $10,000
investment | Costs paid as a percentage of a
$10,000 investment |
|---|
iShares India 50 ETF | $69 | 0.73% |
|---|
|
|
| Expenses Paid, Amount |
|
$ 69
|
|
| Expense Ratio, Percent |
|
0.73%
|
|
| Performance Past Does Not Indicate Future [Text] |
|
Past performance is not an indication of future results.
|
|
| Line Graph [Table Text Block] |
|
Cumulative performance: April 1, 2016 through March 31, 2026 Initial investment of $10,000 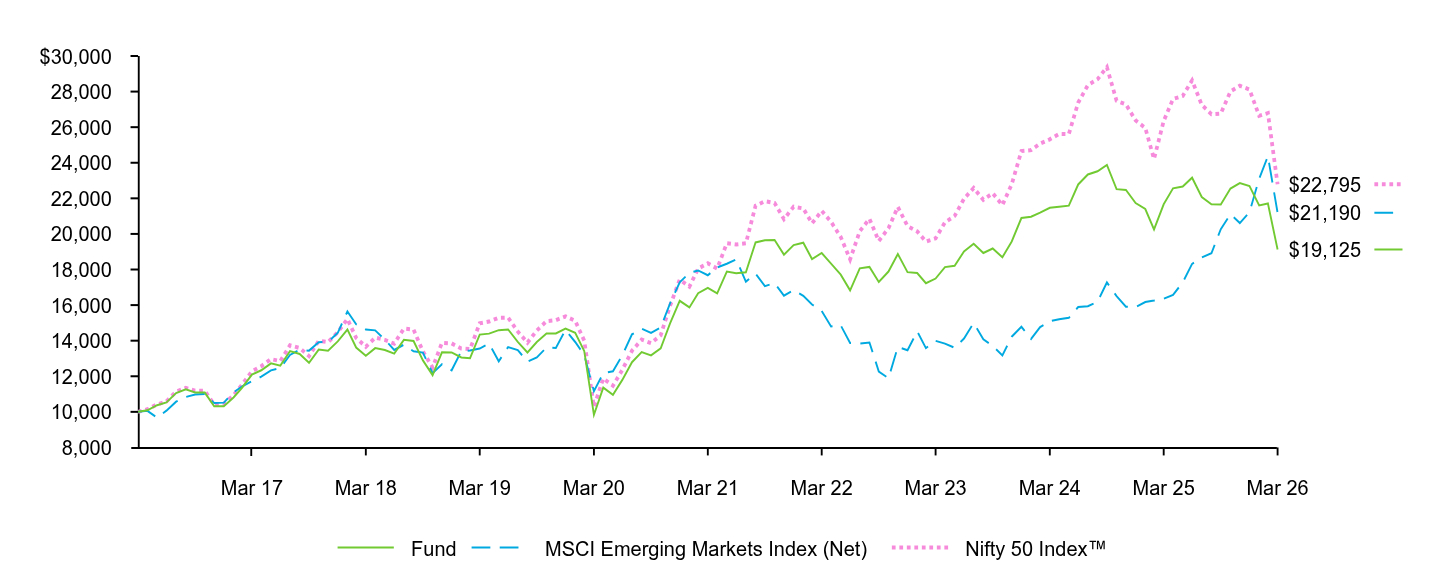 Table Summary | Fund | MSCI Emerging Markets Index (Net) | Nifty 50 Index™ |
|---|
Mar 16 | $10,000 | $10,000 | $10,000 |
|---|
Apr 16 | $10,086 | $10,055 | $10,145 |
|---|
May 16 | $10,373 | $9,679 | $10,415 |
|---|
Jun 16 | $10,531 | $10,066 | $10,585 |
|---|
Jul 16 | $11,055 | $10,573 | $11,139 |
|---|
Aug 16 | $11,268 | $10,835 | $11,345 |
|---|
Sep 16 | $11,089 | $10,975 | $11,191 |
|---|
Oct 16 | $11,085 | $11,001 | $11,185 |
|---|
Nov 16 | $10,310 | $10,495 | $10,411 |
|---|
Dec 16 | $10,317 | $10,518 | $10,450 |
|---|
Jan 17 | $10,808 | $11,093 | $10,935 |
|---|
Feb 17 | $11,370 | $11,433 | $11,546 |
|---|
Mar 17 | $12,094 | $11,721 | $12,274 |
|---|
Apr 17 | $12,337 | $11,978 | $12,566 |
|---|
May 17 | $12,727 | $12,332 | $12,963 |
|---|
Jun 17 | $12,596 | $12,456 | $12,853 |
|---|
Jul 17 | $13,414 | $13,199 | $13,743 |
|---|
Aug 17 | $13,256 | $13,493 | $13,588 |
|---|
Sep 17 | $12,753 | $13,440 | $13,132 |
|---|
Oct 17 | $13,500 | $13,911 | $13,993 |
|---|
Nov 17 | $13,436 | $13,939 | $13,915 |
|---|
Dec 17 | $13,961 | $14,439 | $14,475 |
|---|
Jan 18 | $14,630 | $15,643 | $15,219 |
|---|
Feb 18 | $13,615 | $14,921 | $14,160 |
|---|
Mar 18 | $13,153 | $14,624 | $13,657 |
|---|
Apr 18 | $13,582 | $14,579 | $14,173 |
|---|
May 18 | $13,473 | $14,062 | $14,042 |
|---|
Jun 18 | $13,271 | $13,478 | $13,834 |
|---|
Jul 18 | $14,046 | $13,774 | $14,680 |
|---|
Aug 18 | $13,979 | $13,402 | $14,622 |
|---|
Sep 18 | $12,894 | $13,331 | $13,395 |
|---|
Oct 18 | $12,062 | $12,170 | $12,491 |
|---|
Nov 18 | $13,346 | $12,671 | $13,882 |
|---|
Dec 18 | $13,341 | $12,336 | $13,848 |
|---|
Jan 19 | $13,054 | $13,416 | $13,560 |
|---|
Feb 19 | $13,012 | $13,446 | $13,529 |
|---|
Mar 19 | $14,343 | $13,559 | $14,973 |
|---|
Apr 19 | $14,396 | $13,844 | $15,073 |
|---|
May 19 | $14,592 | $12,840 | $15,287 |
|---|
Jun 19 | $14,630 | $13,641 | $15,295 |
|---|
Jul 19 | $13,934 | $13,474 | $14,513 |
|---|
Aug 19 | $13,333 | $12,817 | $13,891 |
|---|
Sep 19 | $13,927 | $13,062 | $14,570 |
|---|
Oct 19 | $14,398 | $13,613 | $15,096 |
|---|
Nov 19 | $14,410 | $13,594 | $15,150 |
|---|
Dec 19 | $14,676 | $14,608 | $15,370 |
|---|
Jan 20 | $14,444 | $13,927 | $15,116 |
|---|
Feb 20 | $13,417 | $13,193 | $14,000 |
|---|
Mar 20 | $9,838 | $11,161 | $10,280 |
|---|
Apr 20 | $11,360 | $12,183 | $11,878 |
|---|
May 20 | $10,960 | $12,276 | $11,472 |
|---|
Jun 20 | $11,795 | $13,179 | $12,360 |
|---|
Jul 20 | $12,792 | $14,356 | $13,435 |
|---|
Aug 20 | $13,360 | $14,674 | $14,060 |
|---|
Sep 20 | $13,173 | $14,438 | $13,859 |
|---|
Oct 20 | $13,569 | $14,736 | $14,307 |
|---|
Nov 20 | $14,978 | $16,099 | $15,955 |
|---|
Dec 20 | $16,242 | $17,282 | $17,438 |
|---|
Jan 21 | $15,869 | $17,812 | $17,035 |
|---|
Feb 21 | $16,668 | $17,948 | $18,048 |
|---|
Mar 21 | $16,965 | $17,677 | $18,352 |
|---|
Apr 21 | $16,657 | $18,117 | $18,050 |
|---|
May 21 | $17,883 | $18,325 | $19,476 |
|---|
Jun 21 | $17,794 | $18,570 | $19,408 |
|---|
Jul 21 | $17,847 | $17,320 | $19,471 |
|---|
Aug 21 | $19,523 | $17,773 | $21,581 |
|---|
Sep 21 | $19,641 | $17,067 | $21,840 |
|---|
Oct 21 | $19,656 | $17,235 | $21,740 |
|---|
Nov 21 | $18,834 | $16,533 | $20,831 |
|---|
Dec 21 | $19,373 | $16,843 | $21,526 |
|---|
Jan 22 | $19,508 | $16,524 | $21,432 |
|---|
Feb 22 | $18,586 | $16,030 | $20,593 |
|---|
Mar 22 | $18,928 | $15,668 | $21,295 |
|---|
Apr 22 | $18,330 | $14,796 | $20,680 |
|---|
May 22 | $17,714 | $14,862 | $19,825 |
|---|
Jun 22 | $16,826 | $13,874 | $18,571 |
|---|
Jul 22 | $18,068 | $13,840 | $20,152 |
|---|
Aug 22 | $18,146 | $13,898 | $20,849 |
|---|
Sep 22 | $17,301 | $12,269 | $19,601 |
|---|
Oct 22 | $17,885 | $11,888 | $20,320 |
|---|
Nov 22 | $18,865 | $13,651 | $21,517 |
|---|
Dec 22 | $17,851 | $13,459 | $20,443 |
|---|
Jan 23 | $17,803 | $14,522 | $20,141 |
|---|
Feb 23 | $17,231 | $13,580 | $19,572 |
|---|
Mar 23 | $17,492 | $13,992 | $19,751 |
|---|
Apr 23 | $18,135 | $13,833 | $20,648 |
|---|
May 23 | $18,211 | $13,601 | $21,011 |
|---|
Jun 23 | $19,020 | $14,117 | $21,974 |
|---|
Jul 23 | $19,449 | $14,996 | $22,581 |
|---|
Aug 23 | $18,927 | $14,072 | $21,917 |
|---|
Sep 23 | $19,181 | $13,704 | $22,286 |
|---|
Oct 23 | $18,691 | $13,172 | $21,618 |
|---|
Nov 23 | $19,579 | $14,226 | $22,791 |
|---|
Dec 23 | $20,895 | $14,782 | $24,654 |
|---|
Jan 24 | $20,967 | $14,095 | $24,708 |
|---|
Feb 24 | $21,193 | $14,766 | $25,073 |
|---|
Mar 24 | $21,468 | $15,091 | $25,317 |
|---|
Apr 24 | $21,523 | $15,200 | $25,621 |
|---|
May 24 | $21,589 | $15,285 | $25,618 |
|---|
Jun 24 | $22,780 | $15,888 | $27,380 |
|---|
Jul 24 | $23,342 | $15,936 | $28,358 |
|---|
Aug 24 | $23,524 | $16,193 | $28,695 |
|---|
Sep 24 | $23,878 | $17,274 | $29,373 |
|---|
Oct 24 | $22,518 | $16,506 | $27,482 |
|---|
Nov 24 | $22,471 | $15,913 | $27,279 |
|---|
Dec 24 | $21,735 | $15,891 | $26,380 |
|---|
Jan 25 | $21,401 | $16,175 | $25,958 |
|---|
Feb 25 | $20,250 | $16,253 | $24,208 |
|---|
Mar 25 | $21,667 | $16,356 | $26,347 |
|---|
Apr 25 | $22,563 | $16,571 | $27,584 |
|---|
May 25 | $22,668 | $17,278 | $27,756 |
|---|
Jun 25 | $23,160 | $18,317 | $28,628 |
|---|
Jul 25 | $22,076 | $18,674 | $27,251 |
|---|
Aug 25 | $21,669 | $18,913 | $26,731 |
|---|
Sep 25 | $21,648 | $20,266 | $26,766 |
|---|
Oct 25 | $22,550 | $21,113 | $28,007 |
|---|
Nov 25 | $22,856 | $20,608 | $28,329 |
|---|
Dec 25 | $22,695 | $21,225 | $28,114 |
|---|
Jan 26 | $21,602 | $23,104 | $26,636 |
|---|
Feb 26 | $21,713 | $24,374 | $26,794 |
|---|
Mar 26 | $19,125 | $21,190 | $22,795 |
|---|
See “Average annual total returns” for additional information on fund performance. |
|
| No Deduction of Taxes [Text Block] |
|
Performance results do not reflect the deduction of taxes that a shareholder would pay on fund distributions or on the redemption or sale of fund shares.
|
|
| Material Change Date |
|
|
Mar. 31, 2025
|
| AssetsNet |
|
$ 557,377,974
|
|
| Holdings Count | Holding |
|
53
|
|
| Advisory Fees Paid, Amount |
|
$ 4,872,568
|
|
| InvestmentCompanyPortfolioTurnover |
|
19.00%
|
|
| Additional Fund Statistics [Text Block] |
|
Table SummaryNet Assets........................................................................................................................................................................................................................................................................................................................................................................................................................................................................................................................................................................................................................................................................................................................................................................................................................................................................................................................................................................................................................................ | $557,377,974 |
|---|
Number of Portfolio Holdings........................................................................................................................................................................................................................................................................................................................................................................................................................................................................................................................................................................................................................................................................................................................................................................................................................................................................................................................................................................................................................................ | 53 |
|---|
Net Investment Advisory Fees........................................................................................................................................................................................................................................................................................................................................................................................................................................................................................................................................................................................................................................................................................................................................................................................................................................................................................................................................................................................................................................ | $4,872,568 |
|---|
Portfolio Turnover Rate........................................................................................................................................................................................................................................................................................................................................................................................................................................................................................................................................................................................................................................................................................................................................................................................................................................................................................................................................................................................................................................ | 19% |
|---|
|
|
| Updated Prospectus Phone Number |
|
(1-800-474-2737)
|
|
| Updated Prospectus Web Address |
|
blackrock.com/fundreports
|
|
| C000224636 |
|
|
|
| Shareholder Report [Line Items] |
|
|
|
| Fund Name |
|
iShares International Developed Small Cap Value Factor ETF
|
|
| Trading Symbol |
|
ISVL
|
|
| Security Exchange Name |
|
CboeBZX
|
|
| Annual or Semi-Annual Statement [Text Block] |
|
This annual shareholder report contains important information about iShares International Developed Small Cap Value Factor ETF (the “Fund”) for the period of April 1, 2025 to March 31, 2026
|
|
| Additional Information [Text Block] |
|
You can find additional information about the Fund at blackrock.com/fundreports. You can also request this information by contacting us at 1-800-iShares (1-800-474-2737).
|
|
| Additional Information Phone Number |
|
1-800-474-2737
|
|
| Additional Information Website |
|
blackrock.com/fundreports
|
|
| Expenses [Text Block] |
|
What were the Fund costs for the last year?(based on a hypothetical $10,000 investment) Table SummaryFund name | Costs of a $10,000
investment | Costs paid as a percentage of a
$10,000 investment |
|---|
iShares International Developed Small Cap Value Factor ETF | $37 | 0.31% |
|---|
|
|
| Expenses Paid, Amount |
|
$ 37
|
|
| Expense Ratio, Percent |
|
0.31%
|
|
| Performance Past Does Not Indicate Future [Text] |
|
Past performance is not an indication of future results.
|
|
| Line Graph [Table Text Block] |
|
Cumulative performance: March 23, 2021 through March 31, 2026 Initial investment of $10,000 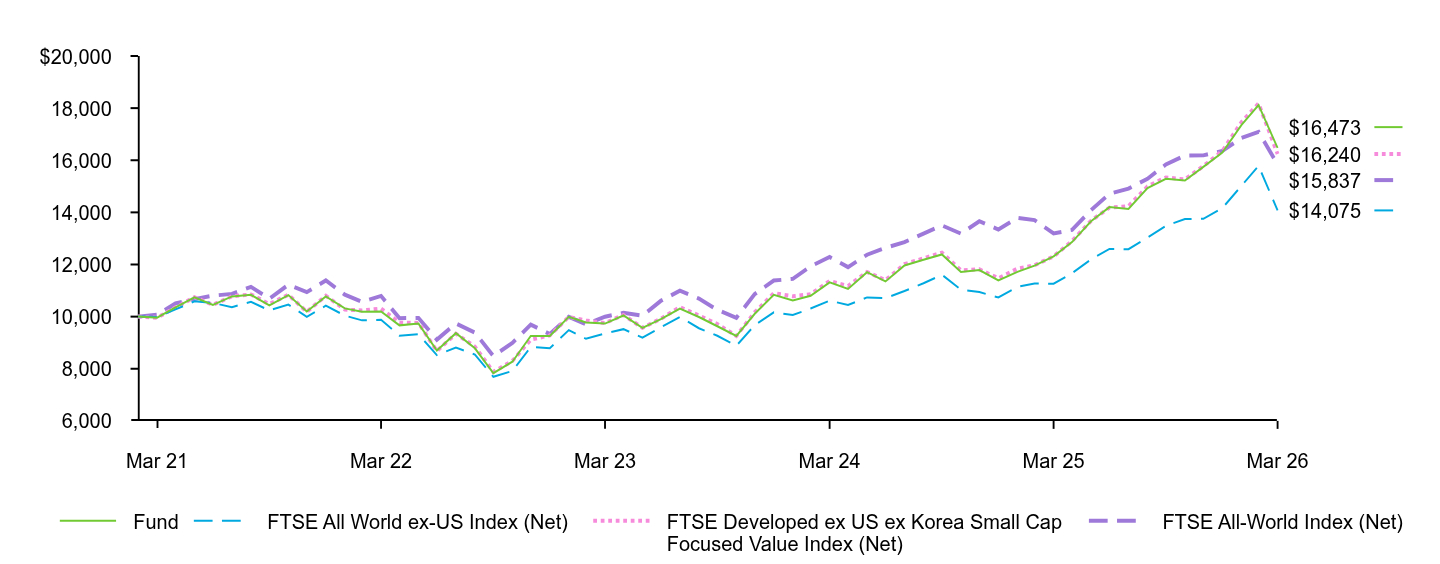 Table Summary | Fund | FTSE All World ex-US Index (Net) | FTSE Developed ex US ex Korea Small Cap Focused Value Index (Net) | FTSE All-World Index (Net) |
|---|
Feb 21 | $10,000 | $10,000 | $10,000 | $10,000 |
|---|
Mar 21 | $9,957 | $9,982 | $9,954 | $10,073 |
|---|
Apr 21 | $10,353 | $10,276 | $10,354 | $10,507 |
|---|
May 21 | $10,739 | $10,587 | $10,743 | $10,671 |
|---|
Jun 21 | $10,450 | $10,526 | $10,453 | $10,804 |
|---|
Jul 21 | $10,774 | $10,363 | $10,779 | $10,872 |
|---|
Aug 21 | $10,838 | $10,567 | $10,851 | $11,143 |
|---|
Sep 21 | $10,433 | $10,240 | $10,483 | $10,689 |
|---|
Oct 21 | $10,827 | $10,461 | $10,839 | $11,223 |
|---|
Nov 21 | $10,194 | $9,994 | $10,185 | $10,939 |
|---|
Dec 21 | $10,774 | $10,419 | $10,798 | $11,389 |
|---|
Jan 22 | $10,315 | $10,040 | $10,269 | $10,842 |
|---|
Feb 22 | $10,190 | $9,857 | $10,236 | $10,566 |
|---|
Mar 22 | $10,197 | $9,880 | $10,308 | $10,793 |
|---|
Apr 22 | $9,665 | $9,270 | $9,769 | $9,940 |
|---|
May 22 | $9,734 | $9,322 | $9,758 | $9,951 |
|---|
Jun 22 | $8,696 | $8,522 | $8,680 | $9,116 |
|---|
Jul 22 | $9,366 | $8,813 | $9,344 | $9,738 |
|---|
Aug 22 | $8,786 | $8,545 | $8,848 | $9,387 |
|---|
Sep 22 | $7,828 | $7,691 | $7,882 | $8,488 |
|---|
Oct 22 | $8,269 | $7,916 | $8,299 | $8,992 |
|---|
Nov 22 | $9,257 | $8,840 | $9,116 | $9,694 |
|---|
Dec 22 | $9,258 | $8,790 | $9,278 | $9,331 |
|---|
Jan 23 | $9,991 | $9,482 | $9,990 | $9,991 |
|---|
Feb 23 | $9,775 | $9,149 | $9,855 | $9,703 |
|---|
Mar 23 | $9,733 | $9,357 | $9,754 | $9,996 |
|---|
Apr 23 | $10,044 | $9,519 | $10,062 | $10,146 |
|---|
May 23 | $9,569 | $9,190 | $9,571 | $10,037 |
|---|
Jun 23 | $9,901 | $9,592 | $9,919 | $10,606 |
|---|
Jul 23 | $10,306 | $9,986 | $10,367 | $10,994 |
|---|
Aug 23 | $9,984 | $9,555 | $10,045 | $10,693 |
|---|
Sep 23 | $9,630 | $9,265 | $9,712 | $10,261 |
|---|
Oct 23 | $9,259 | $8,878 | $9,260 | $9,952 |
|---|
Nov 23 | $10,110 | $9,675 | $10,168 | $10,866 |
|---|
Dec 23 | $10,834 | $10,163 | $10,900 | $11,384 |
|---|
Jan 24 | $10,617 | $10,061 | $10,780 | $11,450 |
|---|
Feb 24 | $10,802 | $10,311 | $10,859 | $11,931 |
|---|
Mar 24 | $11,315 | $10,613 | $11,367 | $12,289 |
|---|
Apr 24 | $11,062 | $10,445 | $11,174 | $11,900 |
|---|
May 24 | $11,704 | $10,737 | $11,713 | $12,376 |
|---|
Jun 24 | $11,350 | $10,710 | $11,399 | $12,639 |
|---|
Jul 24 | $11,962 | $10,983 | $12,014 | $12,859 |
|---|
Aug 24 | $12,185 | $11,279 | $12,235 | $13,188 |
|---|
Sep 24 | $12,387 | $11,607 | $12,456 | $13,500 |
|---|
Oct 24 | $11,710 | $11,037 | $11,773 | $13,184 |
|---|
Nov 24 | $11,788 | $10,943 | $11,815 | $13,659 |
|---|
Dec 24 | $11,388 | $10,734 | $11,471 | $13,342 |
|---|
Jan 25 | $11,717 | $11,140 | $11,842 | $13,785 |
|---|
Feb 25 | $11,955 | $11,273 | $11,974 | $13,704 |
|---|
Mar 25 | $12,311 | $11,263 | $12,309 | $13,193 |
|---|
Apr 25 | $12,860 | $11,663 | $12,900 | $13,328 |
|---|
May 25 | $13,662 | $12,193 | $13,680 | $14,086 |
|---|
Jun 25 | $14,203 | $12,598 | $14,183 | $14,712 |
|---|
Jul 25 | $14,131 | $12,586 | $14,238 | $14,910 |
|---|
Aug 25 | $14,930 | $13,034 | $14,998 | $15,289 |
|---|
Sep 25 | $15,291 | $13,484 | $15,341 | $15,837 |
|---|
Oct 25 | $15,221 | $13,745 | $15,263 | $16,180 |
|---|
Nov 25 | $15,747 | $13,753 | $15,775 | $16,187 |
|---|
Dec 25 | $16,295 | $14,164 | $16,358 | $16,359 |
|---|
Jan 26 | $17,345 | $15,015 | $17,458 | $16,851 |
|---|
Feb 26 | $18,116 | $15,785 | $18,180 | $17,090 |
|---|
Mar 26 | $16,473 | $14,075 | $16,240 | $15,837 |
|---|
See “Average annual total returns” for additional information on fund performance. |
|
| No Deduction of Taxes [Text Block] |
|
Performance results do not reflect the deduction of taxes that a shareholder would pay on fund distributions or on the redemption or sale of fund shares.
|
|
| AssetsNet |
|
$ 297,494,994
|
|
| Holdings Count | Holding |
|
544
|
|
| Advisory Fees Paid, Amount |
|
$ 262,866
|
|
| InvestmentCompanyPortfolioTurnover |
|
139.00%
|
|
| Additional Fund Statistics [Text Block] |
|
Table SummaryNet Assets........................................................................................................................................................................................................................................................................................................................................................................................................................................................................................................................................................................................................................................................................................................................................................................................................................................................................................................................................................................................................................................ | $297,494,994 |
|---|
Number of Portfolio Holdings........................................................................................................................................................................................................................................................................................................................................................................................................................................................................................................................................................................................................................................................................................................................................................................................................................................................................................................................................................................................................................................ | 544 |
|---|
Net Investment Advisory Fees........................................................................................................................................................................................................................................................................................................................................................................................................................................................................................................................................................................................................................................................................................................................................................................................................................................................................................................................................................................................................................................ | $262,866 |
|---|
Portfolio Turnover Rate........................................................................................................................................................................................................................................................................................................................................................................................................................................................................................................................................................................................................................................................................................................................................................................................................................................................................................................................................................................................................................................ | 139% |
|---|
|
|
| C000168437 |
|
|
|
| Shareholder Report [Line Items] |
|
|
|
| Fund Name |
|
iShares International Dividend Growth ETF
|
|
| Trading Symbol |
|
IGRO
|
|
| Security Exchange Name |
|
CboeBZX
|
|
| Annual or Semi-Annual Statement [Text Block] |
|
This annual shareholder report contains important information about iShares International Dividend Growth ETF (the “Fund”) for the period of April 1, 2025 to March 31, 2026
|
|
| Additional Information [Text Block] |
|
You can find additional information about the Fund at blackrock.com/fundreports. You can also request this information by contacting us at 1-800-iShares (1-800-474-2737).
|
|
| Additional Information Phone Number |
|
1-800-474-2737
|
|
| Additional Information Website |
|
blackrock.com/fundreports
|
|
| Expenses [Text Block] |
|
What were the Fund costs for the last year?(based on a hypothetical $10,000 investment) Table SummaryFund name | Costs of a $10,000
investment | Costs paid as a percentage of a
$10,000 investment |
|---|
iShares International Dividend Growth ETF | $16 | 0.15% |
|---|
|
|
| Expenses Paid, Amount |
|
$ 16
|
|
| Expense Ratio, Percent |
|
0.15%
|
|
| Performance Past Does Not Indicate Future [Text] |
|
Past performance is not an indication of future results.
|
|
| Line Graph [Table Text Block] |
|
Cumulative performance: May 17, 2016 through March 31, 2026 Initial investment of $10,000 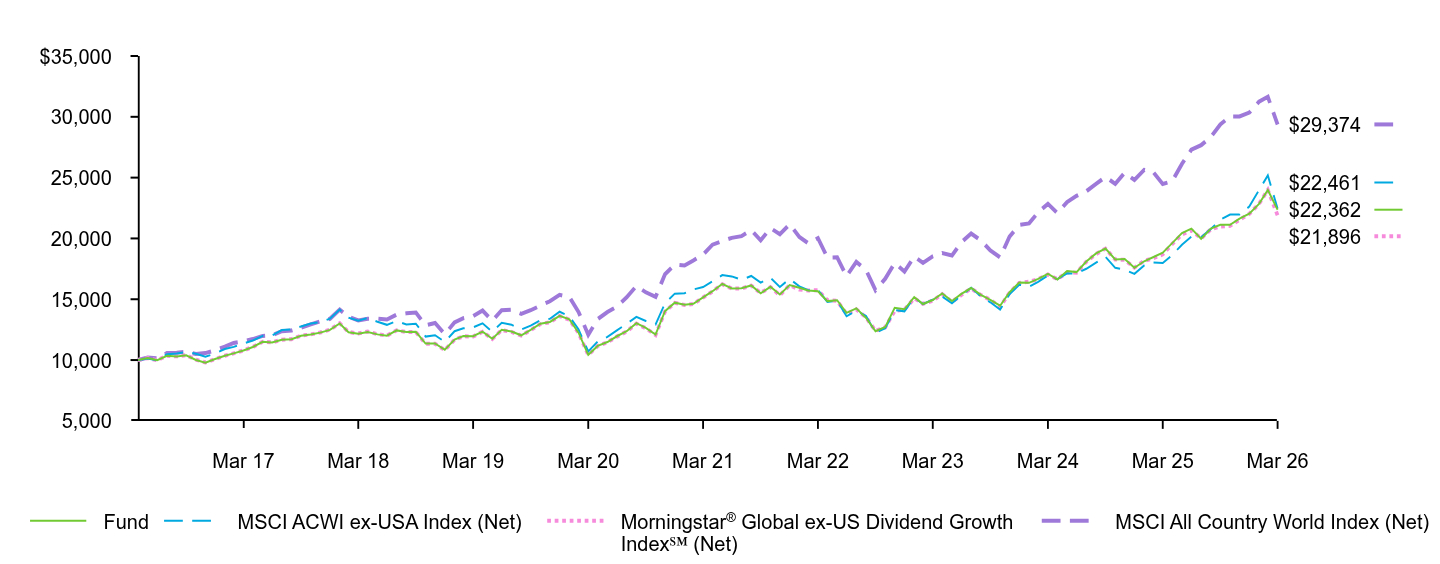 Table Summary | Fund | MSCI ACWI ex-USA Index (Net) | Morningstar® Global ex-US Dividend Growth Index℠ (Net) | MSCI All Country World Index (Net) |
|---|
Apr 16 | $10,000 | $10,000 | $10,000 | $10,000 |
|---|
May 16 | $10,174 | $10,136 | $10,169 | $10,199 |
|---|
Jun 16 | $9,987 | $9,981 | $9,982 | $10,137 |
|---|
Jul 16 | $10,347 | $10,475 | $10,362 | $10,574 |
|---|
Aug 16 | $10,293 | $10,541 | $10,309 | $10,610 |
|---|
Sep 16 | $10,386 | $10,671 | $10,409 | $10,675 |
|---|
Oct 16 | $10,008 | $10,518 | $10,028 | $10,494 |
|---|
Nov 16 | $9,783 | $10,275 | $9,804 | $10,574 |
|---|
Dec 16 | $10,087 | $10,537 | $10,086 | $10,802 |
|---|
Jan 17 | $10,349 | $10,910 | $10,354 | $11,097 |
|---|
Feb 17 | $10,550 | $11,084 | $10,554 | $11,409 |
|---|
Mar 17 | $10,792 | $11,365 | $10,791 | $11,548 |
|---|
Apr 17 | $11,074 | $11,609 | $11,074 | $11,728 |
|---|
May 17 | $11,495 | $11,986 | $11,501 | $11,987 |
|---|
Jun 17 | $11,446 | $12,022 | $11,449 | $12,041 |
|---|
Jul 17 | $11,674 | $12,466 | $11,678 | $12,378 |
|---|
Aug 17 | $11,716 | $12,531 | $11,715 | $12,425 |
|---|
Sep 17 | $11,996 | $12,764 | $12,006 | $12,666 |
|---|
Oct 17 | $12,098 | $13,004 | $12,106 | $12,929 |
|---|
Nov 17 | $12,257 | $13,109 | $12,266 | $13,179 |
|---|
Dec 17 | $12,479 | $13,402 | $12,496 | $13,392 |
|---|
Jan 18 | $13,006 | $14,149 | $13,021 | $14,147 |
|---|
Feb 18 | $12,288 | $13,482 | $12,303 | $13,553 |
|---|
Mar 18 | $12,174 | $13,244 | $12,184 | $13,253 |
|---|
Apr 18 | $12,308 | $13,455 | $12,340 | $13,389 |
|---|
May 18 | $12,111 | $13,145 | $12,132 | $13,406 |
|---|
Jun 18 | $11,998 | $12,897 | $12,007 | $13,333 |
|---|
Jul 18 | $12,438 | $13,206 | $12,444 | $13,735 |
|---|
Aug 18 | $12,311 | $12,930 | $12,307 | $13,844 |
|---|
Sep 18 | $12,317 | $12,988 | $12,302 | $13,903 |
|---|
Oct 18 | $11,354 | $11,932 | $11,334 | $12,862 |
|---|
Nov 18 | $11,363 | $12,045 | $11,342 | $13,050 |
|---|
Dec 18 | $10,842 | $11,500 | $10,825 | $12,131 |
|---|
Jan 19 | $11,683 | $12,369 | $11,670 | $13,089 |
|---|
Feb 19 | $11,968 | $12,610 | $11,957 | $13,439 |
|---|
Mar 19 | $11,958 | $12,686 | $11,939 | $13,607 |
|---|
Apr 19 | $12,342 | $13,021 | $12,325 | $14,067 |
|---|
May 19 | $11,755 | $12,322 | $11,734 | $13,233 |
|---|
Jun 19 | $12,496 | $13,064 | $12,467 | $14,099 |
|---|
Jul 19 | $12,342 | $12,906 | $12,315 | $14,141 |
|---|
Aug 19 | $12,036 | $12,507 | $12,017 | $13,805 |
|---|
Sep 19 | $12,479 | $12,829 | $12,457 | $14,095 |
|---|
Oct 19 | $12,986 | $13,277 | $12,961 | $14,481 |
|---|
Nov 19 | $13,131 | $13,394 | $13,112 | $14,835 |
|---|
Dec 19 | $13,641 | $13,974 | $13,619 | $15,357 |
|---|
Jan 20 | $13,341 | $13,599 | $13,323 | $15,188 |
|---|
Feb 20 | $12,252 | $12,523 | $12,231 | $13,961 |
|---|
Mar 20 | $10,433 | $10,710 | $10,420 | $12,076 |
|---|
Apr 20 | $11,164 | $11,522 | $11,159 | $13,370 |
|---|
May 20 | $11,485 | $11,899 | $11,467 | $13,951 |
|---|
Jun 20 | $11,957 | $12,436 | $11,928 | $14,397 |
|---|
Jul 20 | $12,373 | $12,991 | $12,343 | $15,158 |
|---|
Aug 20 | $13,032 | $13,547 | $12,996 | $16,086 |
|---|
Sep 20 | $12,650 | $13,214 | $12,614 | $15,567 |
|---|
Oct 20 | $12,103 | $12,930 | $12,063 | $15,189 |
|---|
Nov 20 | $14,021 | $14,669 | $13,991 | $17,061 |
|---|
Dec 20 | $14,718 | $15,462 | $14,701 | $17,853 |
|---|
Jan 21 | $14,545 | $15,496 | $14,533 | $17,772 |
|---|
Feb 21 | $14,620 | $15,803 | $14,605 | $18,184 |
|---|
Mar 21 | $15,158 | $16,002 | $15,144 | $18,670 |
|---|
Apr 21 | $15,662 | $16,473 | $15,637 | $19,486 |
|---|
May 21 | $16,260 | $16,989 | $16,239 | $19,780 |
|---|
Jun 21 | $15,892 | $16,878 | $15,878 | $20,050 |
|---|
Jul 21 | $15,909 | $16,601 | $15,887 | $20,188 |
|---|
Aug 21 | $16,135 | $16,916 | $16,124 | $20,693 |
|---|
Sep 21 | $15,490 | $16,374 | $15,519 | $19,839 |
|---|
Oct 21 | $16,022 | $16,765 | $16,000 | $20,851 |
|---|
Nov 21 | $15,385 | $16,010 | $15,324 | $20,349 |
|---|
Dec 21 | $16,165 | $16,672 | $16,155 | $21,163 |
|---|
Jan 22 | $15,949 | $16,057 | $15,801 | $20,124 |
|---|
Feb 22 | $15,722 | $15,740 | $15,717 | $19,604 |
|---|
Mar 22 | $15,655 | $15,765 | $15,739 | $20,029 |
|---|
Apr 22 | $14,847 | $14,775 | $14,930 | $18,425 |
|---|
May 22 | $14,923 | $14,881 | $14,870 | $18,447 |
|---|
Jun 22 | $13,879 | $13,601 | $13,788 | $16,892 |
|---|
Jul 22 | $14,249 | $14,066 | $14,168 | $18,071 |
|---|
Aug 22 | $13,461 | $13,614 | $13,500 | $17,406 |
|---|
Sep 22 | $12,373 | $12,253 | $12,407 | $15,740 |
|---|
Oct 22 | $12,722 | $12,620 | $12,698 | $16,690 |
|---|
Nov 22 | $14,299 | $14,109 | $14,049 | $17,984 |
|---|
Dec 22 | $14,173 | $14,004 | $14,146 | $17,277 |
|---|
Jan 23 | $15,177 | $15,139 | $15,080 | $18,515 |
|---|
Feb 23 | $14,606 | $14,609 | $14,628 | $17,984 |
|---|
Mar 23 | $14,936 | $14,965 | $14,879 | $18,539 |
|---|
Apr 23 | $15,476 | $15,225 | $15,423 | $18,805 |
|---|
May 23 | $14,857 | $14,672 | $14,769 | $18,604 |
|---|
Jun 23 | $15,443 | $15,330 | $15,357 | $19,684 |
|---|
Jul 23 | $15,923 | $15,953 | $15,890 | $20,404 |
|---|
Aug 23 | $15,364 | $15,233 | $15,343 | $19,834 |
|---|
Sep 23 | $14,944 | $14,752 | $14,952 | $19,014 |
|---|
Oct 23 | $14,466 | $14,143 | $14,364 | $18,442 |
|---|
Nov 23 | $15,575 | $15,416 | $15,536 | $20,145 |
|---|
Dec 23 | $16,370 | $16,191 | $16,345 | $21,112 |
|---|
Jan 24 | $16,351 | $16,030 | $16,439 | $21,236 |
|---|
Feb 24 | $16,681 | $16,436 | $16,653 | $22,147 |
|---|
Mar 24 | $17,096 | $16,949 | $17,034 | $22,843 |
|---|
Apr 24 | $16,627 | $16,645 | $16,650 | $22,089 |
|---|
May 24 | $17,329 | $17,128 | $17,201 | $22,986 |
|---|
Jun 24 | $17,234 | $17,112 | $17,185 | $23,498 |
|---|
Jul 24 | $18,105 | $17,508 | $18,081 | $23,877 |
|---|
Aug 24 | $18,774 | $18,007 | $18,719 | $24,484 |
|---|
Sep 24 | $19,172 | $18,492 | $19,160 | $25,052 |
|---|
Oct 24 | $18,278 | $17,584 | $18,264 | $24,490 |
|---|
Nov 24 | $18,315 | $17,425 | $18,240 | $25,406 |
|---|
Dec 24 | $17,581 | $17,087 | $17,602 | $24,805 |
|---|
Jan 25 | $18,122 | $17,775 | $18,164 | $25,637 |
|---|
Feb 25 | $18,453 | $18,022 | $18,356 | $25,483 |
|---|
Mar 25 | $18,824 | $17,981 | $18,687 | $24,476 |
|---|
Apr 25 | $19,614 | $18,630 | $19,539 | $24,705 |
|---|
May 25 | $20,437 | $19,483 | $20,333 | $26,124 |
|---|
Jun 25 | $20,805 | $20,145 | $20,655 | $27,297 |
|---|
Jul 25 | $19,970 | $20,087 | $20,010 | $27,668 |
|---|
Aug 25 | $20,811 | $20,784 | $20,756 | $28,351 |
|---|
Sep 25 | $21,120 | $21,533 | $20,974 | $29,378 |
|---|
Oct 25 | $21,120 | $21,968 | $21,035 | $30,035 |
|---|
Nov 25 | $21,629 | $21,962 | $21,539 | $30,032 |
|---|
Dec 25 | $22,039 | $22,620 | $22,015 | $30,346 |
|---|
Jan 26 | $22,838 | $23,973 | $22,840 | $31,245 |
|---|
Feb 26 | $23,989 | $25,178 | $23,990 | $31,647 |
|---|
Mar 26 | $22,362 | $22,461 | $21,896 | $29,374 |
|---|
See “Average annual total returns” for additional information on fund performance. |
|
| No Deduction of Taxes [Text Block] |
|
Performance results do not reflect the deduction of taxes that a shareholder would pay on fund distributions or on the redemption or sale of fund shares.
|
|
| AssetsNet |
|
$ 1,178,849,665
|
|
| Holdings Count | Holding |
|
572
|
|
| Advisory Fees Paid, Amount |
|
$ 1,710,520
|
|
| InvestmentCompanyPortfolioTurnover |
|
56.00%
|
|
| Additional Fund Statistics [Text Block] |
|
Table SummaryNet Assets........................................................................................................................................................................................................................................................................................................................................................................................................................................................................................................................................................................................................................................................................................................................................................................................................................................................................................................................................................................................................................................ | $1,178,849,665 |
|---|
Number of Portfolio Holdings........................................................................................................................................................................................................................................................................................................................................................................................................................................................................................................................................................................................................................................................................................................................................................................................................................................................................................................................................................................................................................................ | 572 |
|---|
Net Investment Advisory Fees........................................................................................................................................................................................................................................................................................................................................................................................................................................................................................................................................................................................................................................................................................................................................................................................................................................................................................................................................................................................................................................ | $1,710,520 |
|---|
Portfolio Turnover Rate........................................................................................................................................................................................................................................................................................................................................................................................................................................................................................................................................................................................................................................................................................................................................................................................................................................................................................................................................................................................................................................ | 56% |
|---|
|
|
| C000012078 |
|
|
|
| Shareholder Report [Line Items] |
|
|
|
| Fund Name |
|
iShares Latin America 40 ETF
|
|
| Trading Symbol |
|
ILF
|
|
| Security Exchange Name |
|
NYSEArca
|
|
| Annual or Semi-Annual Statement [Text Block] |
|
This annual shareholder report contains important information about iShares Latin America 40 ETF (the “Fund”) for the period of April 1, 2025 to March 31, 2026
|
|
| Additional Information [Text Block] |
|
You can find additional information about the Fund at blackrock.com/fundreports. You can also request this information by contacting us at 1-800-iShares (1-800-474-2737).
|
|
| Additional Information Phone Number |
|
1-800-474-2737
|
|
| Additional Information Website |
|
blackrock.com/fundreports
|
|
| Expenses [Text Block] |
|
What were the Fund costs for the last year?(based on a hypothetical $10,000 investment) Table SummaryFund name | Costs of a $10,000
investment | Costs paid as a percentage of a
$10,000 investment |
|---|
iShares Latin America 40 ETF | $60 | 0.47% |
|---|
|
|
| Expenses Paid, Amount |
|
$ 60
|
|
| Expense Ratio, Percent |
|
0.47%
|
|
| Performance Past Does Not Indicate Future [Text] |
|
Past performance is not an indication of future results.
|
|
| Line Graph [Table Text Block] |
|
Cumulative performance: April 1, 2016 through March 31, 2026 Initial investment of $10,000 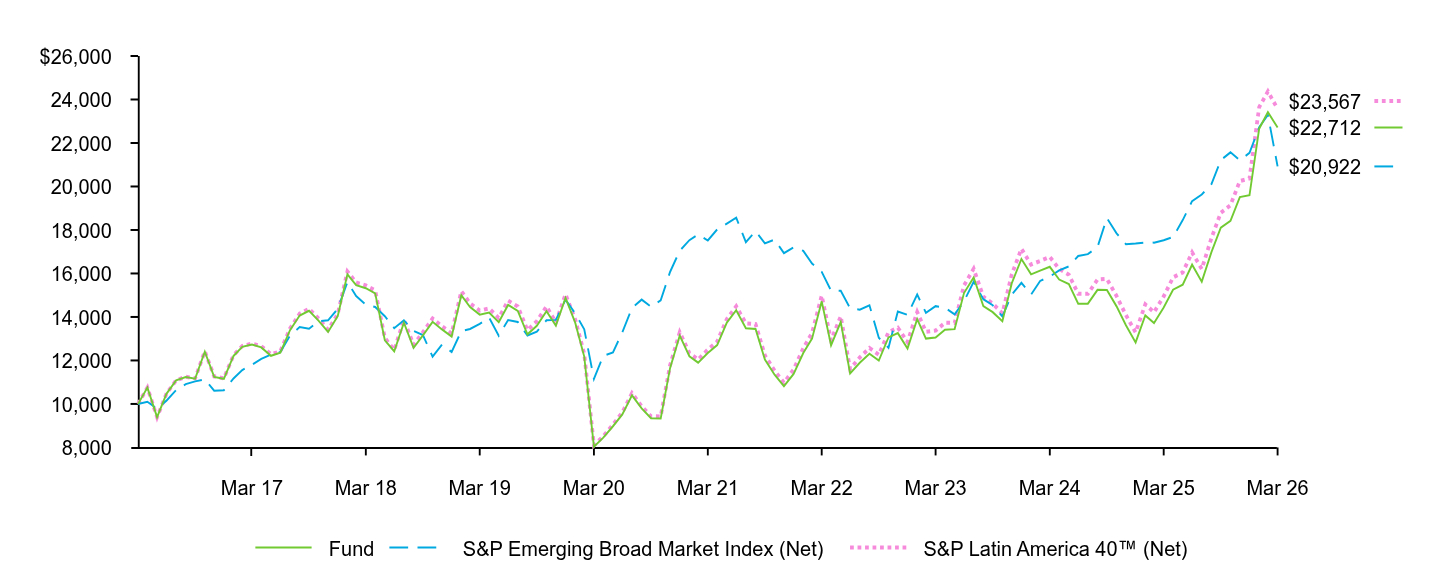 Table Summary | Fund | S&P Emerging Broad Market Index (Net) | S&P Latin America 40™ (Net) |
|---|
Mar 16 | $10,000 | $10,000 | $10,000 |
|---|
Apr 16 | $10,753 | $10,103 | $10,751 |
|---|
May 16 | $9,394 | $9,776 | $9,391 |
|---|
Jun 16 | $10,468 | $10,152 | $10,470 |
|---|
Jul 16 | $11,082 | $10,636 | $11,086 |
|---|
Aug 16 | $11,241 | $10,914 | $11,249 |
|---|
Sep 16 | $11,161 | $11,037 | $11,176 |
|---|
Oct 16 | $12,402 | $11,135 | $12,424 |
|---|
Nov 16 | $11,241 | $10,606 | $11,262 |
|---|
Dec 16 | $11,156 | $10,629 | $11,177 |
|---|
Jan 17 | $12,207 | $11,174 | $12,241 |
|---|
Feb 17 | $12,627 | $11,560 | $12,663 |
|---|
Mar 17 | $12,727 | $11,805 | $12,780 |
|---|
Apr 17 | $12,602 | $12,070 | $12,656 |
|---|
May 17 | $12,215 | $12,269 | $12,285 |
|---|
Jun 17 | $12,356 | $12,387 | $12,420 |
|---|
Jul 17 | $13,391 | $13,139 | $13,470 |
|---|
Aug 17 | $14,067 | $13,534 | $14,151 |
|---|
Sep 17 | $14,283 | $13,457 | $14,375 |
|---|
Oct 17 | $13,822 | $13,806 | $13,918 |
|---|
Nov 17 | $13,309 | $13,843 | $13,407 |
|---|
Dec 17 | $14,039 | $14,371 | $14,138 |
|---|
Jan 18 | $15,963 | $15,605 | $16,090 |
|---|
Feb 18 | $15,461 | $14,961 | $15,584 |
|---|
Mar 18 | $15,321 | $14,564 | $15,452 |
|---|
Apr 18 | $15,083 | $14,458 | $15,218 |
|---|
May 18 | $12,925 | $14,038 | $13,037 |
|---|
Jun 18 | $12,423 | $13,484 | $12,479 |
|---|
Jul 18 | $13,735 | $13,848 | $13,868 |
|---|
Aug 18 | $12,577 | $13,358 | $12,714 |
|---|
Sep 18 | $13,154 | $13,172 | $13,295 |
|---|
Oct 18 | $13,777 | $12,170 | $13,931 |
|---|
Nov 18 | $13,426 | $12,730 | $13,576 |
|---|
Dec 18 | $13,096 | $12,387 | $13,239 |
|---|
Jan 19 | $15,001 | $13,348 | $15,185 |
|---|
Feb 19 | $14,458 | $13,446 | $14,626 |
|---|
Mar 19 | $14,106 | $13,678 | $14,292 |
|---|
Apr 19 | $14,199 | $13,968 | $14,393 |
|---|
May 19 | $13,758 | $13,137 | $13,947 |
|---|
Jun 19 | $14,551 | $13,860 | $14,753 |
|---|
Jul 19 | $14,276 | $13,768 | $14,480 |
|---|
Aug 19 | $13,203 | $13,145 | $13,393 |
|---|
Sep 19 | $13,595 | $13,323 | $13,803 |
|---|
Oct 19 | $14,263 | $13,847 | $14,486 |
|---|
Nov 19 | $13,604 | $13,865 | $13,746 |
|---|
Dec 19 | $14,875 | $14,797 | $15,045 |
|---|
Jan 20 | $13,736 | $14,160 | $13,884 |
|---|
Feb 20 | $12,177 | $13,433 | $12,306 |
|---|
Mar 20 | $8,033 | $11,151 | $8,093 |
|---|
Apr 20 | $8,450 | $12,215 | $8,517 |
|---|
May 20 | $8,975 | $12,366 | $9,049 |
|---|
Jun 20 | $9,521 | $13,297 | $9,606 |
|---|
Jul 20 | $10,394 | $14,409 | $10,496 |
|---|
Aug 20 | $9,796 | $14,797 | $9,891 |
|---|
Sep 20 | $9,343 | $14,469 | $9,432 |
|---|
Oct 20 | $9,330 | $14,763 | $9,425 |
|---|
Nov 20 | $11,645 | $16,068 | $11,777 |
|---|
Dec 20 | $13,143 | $17,044 | $13,297 |
|---|
Jan 21 | $12,193 | $17,531 | $12,341 |
|---|
Feb 21 | $11,898 | $17,794 | $12,044 |
|---|
Mar 21 | $12,341 | $17,514 | $12,500 |
|---|
Apr 21 | $12,704 | $18,024 | $12,867 |
|---|
May 21 | $13,738 | $18,296 | $13,905 |
|---|
Jun 21 | $14,310 | $18,564 | $14,490 |
|---|
Jul 21 | $13,480 | $17,443 | $13,703 |
|---|
Aug 21 | $13,449 | $17,950 | $13,673 |
|---|
Sep 21 | $12,044 | $17,386 | $12,234 |
|---|
Oct 21 | $11,342 | $17,557 | $11,531 |
|---|
Nov 21 | $10,816 | $16,936 | $10,975 |
|---|
Dec 21 | $11,381 | $17,204 | $11,586 |
|---|
Jan 22 | $12,340 | $17,041 | $12,563 |
|---|
Feb 22 | $13,002 | $16,455 | $13,263 |
|---|
Mar 22 | $14,716 | $16,077 | $14,983 |
|---|
Apr 22 | $12,699 | $15,205 | $12,923 |
|---|
May 22 | $13,763 | $15,206 | $14,033 |
|---|
Jun 22 | $11,406 | $14,405 | $11,610 |
|---|
Jul 22 | $11,897 | $14,333 | $12,137 |
|---|
Aug 22 | $12,309 | $14,537 | $12,575 |
|---|
Sep 22 | $11,996 | $13,046 | $12,257 |
|---|
Oct 22 | $13,060 | $12,584 | $13,299 |
|---|
Nov 22 | $13,259 | $14,251 | $13,507 |
|---|
Dec 22 | $12,550 | $14,096 | $12,848 |
|---|
Jan 23 | $13,904 | $15,033 | $14,230 |
|---|
Feb 23 | $13,005 | $14,194 | $13,318 |
|---|
Mar 23 | $13,054 | $14,497 | $13,371 |
|---|
Apr 23 | $13,414 | $14,420 | $13,733 |
|---|
May 23 | $13,440 | $14,122 | $13,727 |
|---|
Jun 23 | $15,099 | $14,721 | $15,447 |
|---|
Jul 23 | $15,817 | $15,615 | $16,217 |
|---|
Aug 23 | $14,501 | $14,817 | $14,928 |
|---|
Sep 23 | $14,221 | $14,538 | $14,619 |
|---|
Oct 23 | $13,807 | $14,020 | $14,166 |
|---|
Nov 23 | $15,543 | $15,027 | $15,955 |
|---|
Dec 23 | $16,666 | $15,570 | $17,137 |
|---|
Jan 24 | $15,959 | $15,030 | $16,412 |
|---|
Feb 24 | $16,129 | $15,656 | $16,573 |
|---|
Mar 24 | $16,306 | $15,856 | $16,762 |
|---|
Apr 24 | $15,720 | $16,143 | $16,208 |
|---|
May 24 | $15,514 | $16,328 | $15,943 |
|---|
Jun 24 | $14,607 | $16,805 | $15,066 |
|---|
Jul 24 | $14,611 | $16,887 | $15,063 |
|---|
Aug 24 | $15,246 | $17,221 | $15,724 |
|---|
Sep 24 | $15,236 | $18,546 | $15,750 |
|---|
Oct 24 | $14,487 | $17,843 | $14,961 |
|---|
Nov 24 | $13,616 | $17,347 | $14,086 |
|---|
Dec 24 | $12,830 | $17,377 | $13,287 |
|---|
Jan 25 | $14,072 | $17,427 | $14,580 |
|---|
Feb 25 | $13,716 | $17,418 | $14,216 |
|---|
Mar 25 | $14,433 | $17,527 | $14,946 |
|---|
Apr 25 | $15,255 | $17,675 | $15,816 |
|---|
May 25 | $15,486 | $18,453 | $16,047 |
|---|
Jun 25 | $16,404 | $19,327 | $16,966 |
|---|
Jul 25 | $15,622 | $19,629 | $16,206 |
|---|
Aug 25 | $16,983 | $20,110 | $17,626 |
|---|
Sep 25 | $18,104 | $21,210 | $18,788 |
|---|
Oct 25 | $18,422 | $21,570 | $19,139 |
|---|
Nov 25 | $19,510 | $21,204 | $20,248 |
|---|
Dec 25 | $19,597 | $21,544 | $20,373 |
|---|
Jan 26 | $22,658 | $22,727 | $23,646 |
|---|
Feb 26 | $23,419 | $23,287 | $24,370 |
|---|
Mar 26 | $22,712 | $20,922 | $23,567 |
|---|
See “Average annual total returns” for additional information on fund performance. |
|
| No Deduction of Taxes [Text Block] |
|
Performance results do not reflect the deduction of taxes that a shareholder would pay on fund distributions or on the redemption or sale of fund shares.
|
|
| AssetsNet |
|
$ 4,259,870,779
|
|
| Holdings Count | Holding |
|
45
|
|
| Advisory Fees Paid, Amount |
|
$ 10,884,277
|
|
| InvestmentCompanyPortfolioTurnover |
|
10.00%
|
|
| Additional Fund Statistics [Text Block] |
|
Table SummaryNet Assets........................................................................................................................................................................................................................................................................................................................................................................................................................................................................................................................................................................................................................................................................................................................................................................................................................................................................................................................................................................................................................................ | $4,259,870,779 |
|---|
Number of Portfolio Holdings........................................................................................................................................................................................................................................................................................................................................................................................................................................................................................................................................................................................................................................................................................................................................................................................................................................................................................................................................................................................................................................ | 45 |
|---|
Net Investment Advisory Fees........................................................................................................................................................................................................................................................................................................................................................................................................................................................................................................................................................................................................................................................................................................................................................................................................................................................................................................................................................................................................................................ | $10,884,277 |
|---|
Portfolio Turnover Rate........................................................................................................................................................................................................................................................................................................................................................................................................................................................................................................................................................................................................................................................................................................................................................................................................................................................................................................................................................................................................................................ | 10% |
|---|
|
|
| C000012067 |
|
|
|
| Shareholder Report [Line Items] |
|
|
|
| Fund Name |
|
iShares JPX-Nikkei 400 ETF
|
|
| Trading Symbol |
|
JPXN
|
|
| Security Exchange Name |
|
NYSEArca
|
|
| Annual or Semi-Annual Statement [Text Block] |
|
This annual shareholder report contains important information about iShares JPX-Nikkei 400 ETF (the “Fund”) for the period of April 1, 2025 to March 31, 2026
|
|
| Additional Information [Text Block] |
|
You can find additional information about the Fund at blackrock.com/fundreports. You can also request this information by contacting us at 1-800-iShares (1-800-474-2737).
|
|
| Additional Information Phone Number |
|
1-800-474-2737
|
|
| Additional Information Website |
|
blackrock.com/fundreports
|
|
| Expenses [Text Block] |
|
What were the Fund costs for the last year?(based on a hypothetical $10,000 investment) Table SummaryFund name | Costs of a $10,000
investment | Costs paid as a percentage of a
$10,000 investment |
|---|
iShares JPX-Nikkei 400 ETF | $55 | 0.48% |
|---|
|
|
| Expenses Paid, Amount |
|
$ 55
|
|
| Expense Ratio, Percent |
|
0.48%
|
|
| Performance Past Does Not Indicate Future [Text] |
|
Past performance is not an indication of future results.
|
|
| Line Graph [Table Text Block] |
|
Cumulative performance: April 1, 2016 through March 31, 2026 Initial investment of $10,000 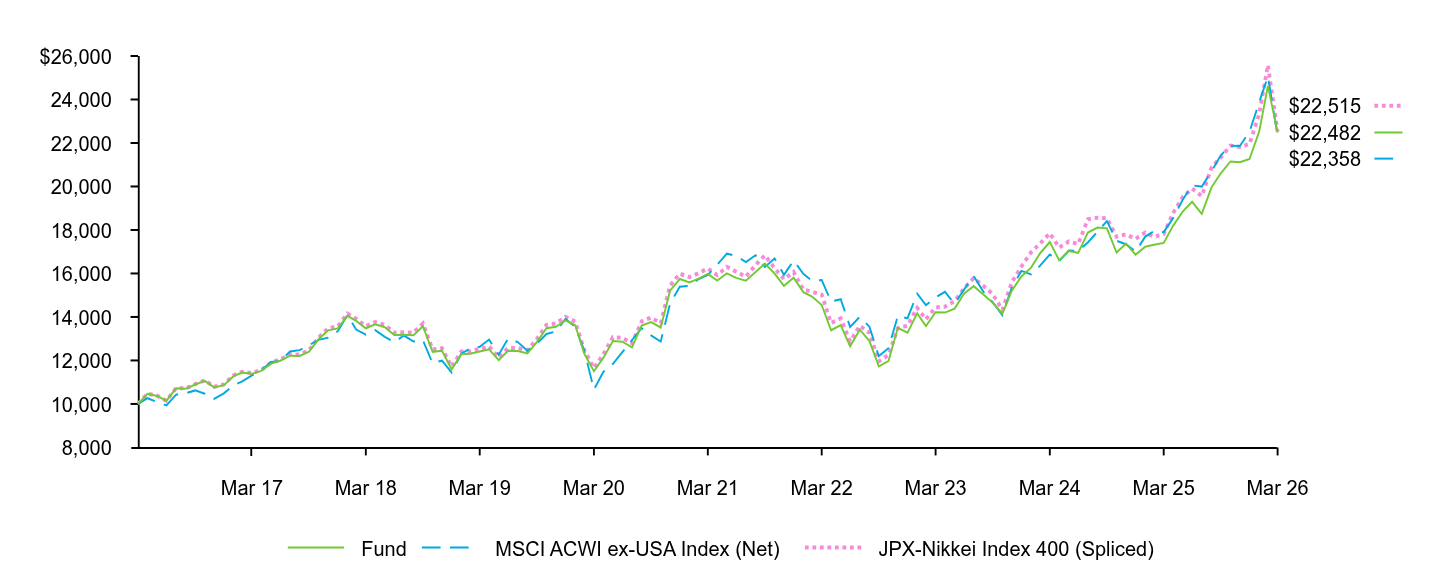 Table Summary | Fund | MSCI ACWI ex-USA Index (Net) | JPX-Nikkei Index 400 (Spliced) |
|---|
Mar 16 | $10,000 | $10,000 | $10,000 |
|---|
Apr 16 | $10,469 | $10,263 | $10,472 |
|---|
May 16 | $10,368 | $10,090 | $10,377 |
|---|
Jun 16 | $10,148 | $9,936 | $10,149 |
|---|
Jul 16 | $10,721 | $10,427 | $10,728 |
|---|
Aug 16 | $10,696 | $10,493 | $10,712 |
|---|
Sep 16 | $10,894 | $10,622 | $10,911 |
|---|
Oct 16 | $11,062 | $10,470 | $11,084 |
|---|
Nov 16 | $10,761 | $10,228 | $10,791 |
|---|
Dec 16 | $10,865 | $10,489 | $10,900 |
|---|
Jan 17 | $11,278 | $10,860 | $11,316 |
|---|
Feb 17 | $11,440 | $11,034 | $11,480 |
|---|
Mar 17 | $11,384 | $11,313 | $11,423 |
|---|
Apr 17 | $11,521 | $11,556 | $11,562 |
|---|
May 17 | $11,855 | $11,931 | $11,898 |
|---|
Jun 17 | $11,986 | $11,967 | $12,045 |
|---|
Jul 17 | $12,219 | $12,409 | $12,280 |
|---|
Aug 17 | $12,208 | $12,474 | $12,275 |
|---|
Sep 17 | $12,408 | $12,705 | $12,473 |
|---|
Oct 17 | $12,984 | $12,945 | $13,061 |
|---|
Nov 17 | $13,383 | $13,049 | $13,472 |
|---|
Dec 17 | $13,474 | $13,341 | $13,568 |
|---|
Jan 18 | $14,055 | $14,084 | $14,157 |
|---|
Feb 18 | $13,816 | $13,420 | $13,917 |
|---|
Mar 18 | $13,480 | $13,183 | $13,581 |
|---|
Apr 18 | $13,659 | $13,394 | $13,763 |
|---|
May 18 | $13,530 | $13,084 | $13,630 |
|---|
Jun 18 | $13,166 | $12,839 | $13,275 |
|---|
Jul 18 | $13,178 | $13,146 | $13,297 |
|---|
Aug 18 | $13,159 | $12,871 | $13,282 |
|---|
Sep 18 | $13,577 | $12,929 | $13,705 |
|---|
Oct 18 | $12,391 | $11,878 | $12,499 |
|---|
Nov 18 | $12,449 | $11,990 | $12,561 |
|---|
Dec 18 | $11,596 | $11,447 | $11,707 |
|---|
Jan 19 | $12,287 | $12,312 | $12,408 |
|---|
Feb 19 | $12,304 | $12,553 | $12,427 |
|---|
Mar 19 | $12,407 | $12,628 | $12,530 |
|---|
Apr 19 | $12,514 | $12,961 | $12,641 |
|---|
May 19 | $12,017 | $12,266 | $12,130 |
|---|
Jun 19 | $12,443 | $13,004 | $12,575 |
|---|
Jul 19 | $12,430 | $12,847 | $12,567 |
|---|
Aug 19 | $12,322 | $12,450 | $12,463 |
|---|
Sep 19 | $12,844 | $12,770 | $12,986 |
|---|
Oct 19 | $13,481 | $13,216 | $13,635 |
|---|
Nov 19 | $13,549 | $13,333 | $13,703 |
|---|
Dec 19 | $13,840 | $13,910 | $14,006 |
|---|
Jan 20 | $13,617 | $13,536 | $13,784 |
|---|
Feb 20 | $12,315 | $12,466 | $12,471 |
|---|
Mar 20 | $11,502 | $10,661 | $11,649 |
|---|
Apr 20 | $12,117 | $11,469 | $12,279 |
|---|
May 20 | $12,897 | $11,844 | $13,072 |
|---|
Jun 20 | $12,865 | $12,379 | $13,042 |
|---|
Jul 20 | $12,603 | $12,932 | $12,786 |
|---|
Aug 20 | $13,601 | $13,485 | $13,800 |
|---|
Sep 20 | $13,768 | $13,154 | $13,972 |
|---|
Oct 20 | $13,515 | $12,871 | $13,713 |
|---|
Nov 20 | $15,210 | $14,602 | $15,438 |
|---|
Dec 20 | $15,747 | $15,392 | $15,990 |
|---|
Jan 21 | $15,590 | $15,425 | $15,835 |
|---|
Feb 21 | $15,752 | $15,730 | $16,003 |
|---|
Mar 21 | $15,978 | $15,929 | $16,230 |
|---|
Apr 21 | $15,675 | $16,398 | $15,924 |
|---|
May 21 | $16,002 | $16,911 | $16,304 |
|---|
Jun 21 | $15,798 | $16,801 | $16,082 |
|---|
Jul 21 | $15,667 | $16,525 | $15,846 |
|---|
Aug 21 | $16,069 | $16,838 | $16,390 |
|---|
Sep 21 | $16,455 | $16,299 | $16,837 |
|---|
Oct 21 | $15,996 | $16,689 | $16,240 |
|---|
Nov 21 | $15,434 | $15,937 | $15,743 |
|---|
Dec 21 | $15,810 | $16,596 | $16,068 |
|---|
Jan 22 | $15,141 | $15,984 | $15,253 |
|---|
Feb 22 | $14,941 | $15,668 | $15,162 |
|---|
Mar 22 | $14,550 | $15,693 | $15,022 |
|---|
Apr 22 | $13,389 | $14,707 | $13,725 |
|---|
May 22 | $13,629 | $14,813 | $13,933 |
|---|
Jun 22 | $12,649 | $13,539 | $12,876 |
|---|
Jul 22 | $13,415 | $14,002 | $13,596 |
|---|
Aug 22 | $12,888 | $13,552 | $13,274 |
|---|
Sep 22 | $11,724 | $12,197 | $11,958 |
|---|
Oct 22 | $11,969 | $12,562 | $12,249 |
|---|
Nov 22 | $13,500 | $14,045 | $13,487 |
|---|
Dec 22 | $13,275 | $13,940 | $13,598 |
|---|
Jan 23 | $14,168 | $15,070 | $14,417 |
|---|
Feb 23 | $13,582 | $14,542 | $13,897 |
|---|
Mar 23 | $14,217 | $14,897 | $14,437 |
|---|
Apr 23 | $14,202 | $15,156 | $14,473 |
|---|
May 23 | $14,385 | $14,604 | $14,728 |
|---|
Jun 23 | $15,071 | $15,260 | $15,311 |
|---|
Jul 23 | $15,419 | $15,880 | $15,784 |
|---|
Aug 23 | $15,036 | $15,163 | $15,435 |
|---|
Sep 23 | $14,654 | $14,684 | $15,057 |
|---|
Oct 23 | $14,145 | $14,078 | $14,322 |
|---|
Nov 23 | $15,200 | $15,346 | $15,591 |
|---|
Dec 23 | $15,860 | $16,117 | $16,318 |
|---|
Jan 24 | $16,267 | $15,957 | $16,974 |
|---|
Feb 24 | $16,931 | $16,360 | $17,381 |
|---|
Mar 24 | $17,447 | $16,872 | $17,849 |
|---|
Apr 24 | $16,612 | $16,569 | $17,190 |
|---|
May 24 | $17,032 | $17,050 | $17,471 |
|---|
Jun 24 | $16,948 | $17,034 | $17,353 |
|---|
Jul 24 | $17,882 | $17,428 | $18,494 |
|---|
Aug 24 | $18,109 | $17,924 | $18,566 |
|---|
Sep 24 | $18,074 | $18,407 | $18,540 |
|---|
Oct 24 | $16,963 | $17,504 | $17,693 |
|---|
Nov 24 | $17,370 | $17,346 | $17,797 |
|---|
Dec 24 | $16,869 | $17,009 | $17,595 |
|---|
Jan 25 | $17,227 | $17,694 | $17,879 |
|---|
Feb 25 | $17,317 | $17,939 | $17,682 |
|---|
Mar 25 | $17,404 | $17,899 | $17,816 |
|---|
Apr 25 | $18,192 | $18,545 | $18,775 |
|---|
May 25 | $18,845 | $19,394 | $19,515 |
|---|
Jun 25 | $19,296 | $20,053 | $19,901 |
|---|
Jul 25 | $18,738 | $19,995 | $19,558 |
|---|
Aug 25 | $19,952 | $20,689 | $20,863 |
|---|
Sep 25 | $20,608 | $21,435 | $21,341 |
|---|
Oct 25 | $21,152 | $21,868 | $21,880 |
|---|
Nov 25 | $21,117 | $21,862 | $21,815 |
|---|
Dec 25 | $21,263 | $22,517 | $21,959 |
|---|
Jan 26 | $22,523 | $23,864 | $23,328 |
|---|
Feb 26 | $24,627 | $25,062 | $25,585 |
|---|
Mar 26 | $22,482 | $22,358 | $22,515 |
|---|
See “Average annual total returns” for additional information on fund performance. |
|
| No Deduction of Taxes [Text Block] |
|
Performance results do not reflect the deduction of taxes that a shareholder would pay on fund distributions or on the redemption or sale of fund shares.
|
|
| AssetsNet |
|
$ 137,068,893
|
|
| Holdings Count | Holding |
|
394
|
|
| Advisory Fees Paid, Amount |
|
$ 535,061
|
|
| InvestmentCompanyPortfolioTurnover |
|
12.00%
|
|
| Additional Fund Statistics [Text Block] |
|
Table SummaryNet Assets........................................................................................................................................................................................................................................................................................................................................................................................................................................................................................................................................................................................................................................................................................................................................................................................................................................................................................................................................................................................................................................ | $137,068,893 |
|---|
Number of Portfolio Holdings........................................................................................................................................................................................................................................................................................................................................................................................................................................................................................................................................................................................................................................................................................................................................................................................................................................................................................................................................................................................................................................ | 394 |
|---|
Net Investment Advisory Fees........................................................................................................................................................................................................................................................................................................................................................................................................................................................................................................................................................................................................................................................................................................................................................................................................................................................................................................................................................................................................................................ | $535,061 |
|---|
Portfolio Turnover Rate........................................................................................................................................................................................................................................................................................................................................................................................................................................................................................................................................................................................................................................................................................................................................................................................................................................................................................................................................................................................................................................ | 12% |
|---|
|
|
| C000012077 |
|
|
|
| Shareholder Report [Line Items] |
|
|
|
| Fund Name |
|
iShares Russell 1000 ETF
|
|
| Trading Symbol |
|
IWB
|
|
| Security Exchange Name |
|
NYSEArca
|
|
| Annual or Semi-Annual Statement [Text Block] |
|
This annual shareholder report contains important information about iShares Russell 1000 ETF (the “Fund”) for the period of April 1, 2025 to March 31, 2026
|
|
| Additional Information [Text Block] |
|
You can find additional information about the Fund at blackrock.com/fundreports. You can also request this information by contacting us at 1-800-iShares (1-800-474-2737).
|
|
| Material Fund Change Notice [Text Block] |
|
This report describes changes to the Fund that occurred during the reporting period.
|
|
| Additional Information Phone Number |
|
1-800-474-2737
|
|
| Additional Information Website |
|
blackrock.com/fundreports
|
|
| Expenses [Text Block] |
|
What were the Fund costs for the last year?(based on a hypothetical $10,000 investment) Table SummaryFund name | Costs of a $10,000
investment | Costs paid as a percentage of a
$10,000 investment |
|---|
iShares Russell 1000 ETF | $16 | 0.15% |
|---|
|
|
| Expenses Paid, Amount |
|
$ 16
|
|
| Expense Ratio, Percent |
|
0.15%
|
|
| Performance Past Does Not Indicate Future [Text] |
|
Past performance is not an indication of future results.
|
|
| Line Graph [Table Text Block] |
|
Cumulative performance: April 1, 2016 through March 31, 2026 Initial investment of $10,000 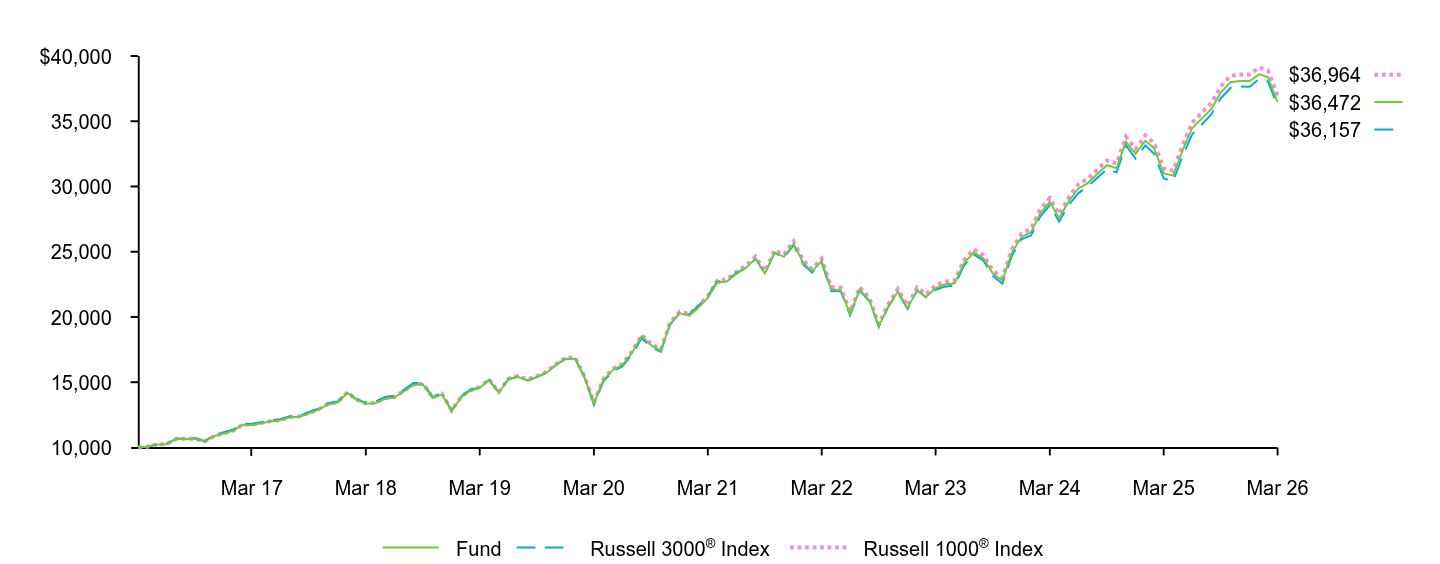 Table Summary | Fund | Russell 3000® Index | Russell 1000® Index |
|---|
Mar 16 | $10,000 | $10,000 | $10,000 |
|---|
Apr 16 | $10,053 | $10,062 | $10,054 |
|---|
May 16 | $10,228 | $10,242 | $10,230 |
|---|
Jun 16 | $10,250 | $10,263 | $10,254 |
|---|
Jul 16 | $10,640 | $10,670 | $10,644 |
|---|
Aug 16 | $10,652 | $10,698 | $10,658 |
|---|
Sep 16 | $10,660 | $10,714 | $10,667 |
|---|
Oct 16 | $10,451 | $10,483 | $10,459 |
|---|
Nov 16 | $10,861 | $10,952 | $10,871 |
|---|
Dec 16 | $11,064 | $11,165 | $11,075 |
|---|
Jan 17 | $11,286 | $11,376 | $11,298 |
|---|
Feb 17 | $11,721 | $11,799 | $11,735 |
|---|
Mar 17 | $11,727 | $11,807 | $11,743 |
|---|
Apr 17 | $11,850 | $11,932 | $11,867 |
|---|
May 17 | $12,000 | $12,054 | $12,018 |
|---|
Jun 17 | $12,082 | $12,163 | $12,102 |
|---|
Jul 17 | $12,319 | $12,392 | $12,342 |
|---|
Aug 17 | $12,356 | $12,416 | $12,381 |
|---|
Sep 17 | $12,619 | $12,719 | $12,644 |
|---|
Oct 17 | $12,907 | $12,996 | $12,934 |
|---|
Nov 17 | $13,298 | $13,391 | $13,329 |
|---|
Dec 17 | $13,446 | $13,525 | $13,477 |
|---|
Jan 18 | $14,182 | $14,238 | $14,217 |
|---|
Feb 18 | $13,660 | $13,713 | $13,695 |
|---|
Mar 18 | $13,348 | $13,438 | $13,384 |
|---|
Apr 18 | $13,392 | $13,489 | $13,430 |
|---|
May 18 | $13,732 | $13,869 | $13,773 |
|---|
Jun 18 | $13,819 | $13,960 | $13,862 |
|---|
Jul 18 | $14,294 | $14,423 | $14,340 |
|---|
Aug 18 | $14,786 | $14,930 | $14,834 |
|---|
Sep 18 | $14,840 | $14,955 | $14,890 |
|---|
Oct 18 | $13,788 | $13,853 | $13,837 |
|---|
Nov 18 | $14,066 | $14,131 | $14,118 |
|---|
Dec 18 | $12,786 | $12,816 | $12,833 |
|---|
Jan 19 | $13,857 | $13,916 | $13,908 |
|---|
Feb 19 | $14,324 | $14,405 | $14,379 |
|---|
Mar 19 | $14,573 | $14,616 | $14,629 |
|---|
Apr 19 | $15,159 | $15,199 | $15,220 |
|---|
May 19 | $14,192 | $14,216 | $14,250 |
|---|
Jun 19 | $15,187 | $15,214 | $15,250 |
|---|
Jul 19 | $15,421 | $15,440 | $15,487 |
|---|
Aug 19 | $15,137 | $15,125 | $15,204 |
|---|
Sep 19 | $15,397 | $15,391 | $15,467 |
|---|
Oct 19 | $15,722 | $15,722 | $15,795 |
|---|
Nov 19 | $16,314 | $16,320 | $16,392 |
|---|
Dec 19 | $16,783 | $16,791 | $16,865 |
|---|
Jan 20 | $16,800 | $16,773 | $16,883 |
|---|
Feb 20 | $15,425 | $15,400 | $15,504 |
|---|
Mar 20 | $13,385 | $13,282 | $13,455 |
|---|
Apr 20 | $15,153 | $15,041 | $15,233 |
|---|
May 20 | $15,951 | $15,845 | $16,037 |
|---|
Jun 20 | $16,302 | $16,207 | $16,391 |
|---|
Jul 20 | $17,254 | $17,128 | $17,351 |
|---|
Aug 20 | $18,519 | $18,369 | $18,625 |
|---|
Sep 20 | $17,839 | $17,700 | $17,944 |
|---|
Oct 20 | $17,406 | $17,318 | $17,511 |
|---|
Nov 20 | $19,454 | $19,425 | $19,573 |
|---|
Dec 20 | $20,274 | $20,298 | $20,401 |
|---|
Jan 21 | $20,104 | $20,208 | $20,233 |
|---|
Feb 21 | $20,686 | $20,840 | $20,819 |
|---|
Mar 21 | $21,466 | $21,587 | $21,607 |
|---|
Apr 21 | $22,619 | $22,700 | $22,770 |
|---|
May 21 | $22,723 | $22,803 | $22,878 |
|---|
Jun 21 | $23,289 | $23,365 | $23,451 |
|---|
Jul 21 | $23,769 | $23,761 | $23,939 |
|---|
Aug 21 | $24,454 | $24,438 | $24,631 |
|---|
Sep 21 | $23,328 | $23,342 | $23,500 |
|---|
Oct 21 | $24,944 | $24,920 | $25,131 |
|---|
Nov 21 | $24,606 | $24,541 | $24,794 |
|---|
Dec 21 | $25,600 | $25,507 | $25,798 |
|---|
Jan 22 | $24,153 | $24,006 | $24,343 |
|---|
Feb 22 | $23,487 | $23,402 | $23,675 |
|---|
Mar 22 | $24,277 | $24,161 | $24,474 |
|---|
Apr 22 | $22,110 | $21,993 | $22,293 |
|---|
May 22 | $22,074 | $21,963 | $22,259 |
|---|
Jun 22 | $20,223 | $20,126 | $20,395 |
|---|
Jul 22 | $22,104 | $22,014 | $22,294 |
|---|
Aug 22 | $21,253 | $21,192 | $21,438 |
|---|
Sep 22 | $19,285 | $19,227 | $19,454 |
|---|
Oct 22 | $20,829 | $20,804 | $21,015 |
|---|
Nov 22 | $21,953 | $21,890 | $22,152 |
|---|
Dec 22 | $20,675 | $20,608 | $20,863 |
|---|
Jan 23 | $22,058 | $22,027 | $22,262 |
|---|
Feb 23 | $21,531 | $21,513 | $21,733 |
|---|
Mar 23 | $22,209 | $22,088 | $22,420 |
|---|
Apr 23 | $22,482 | $22,323 | $22,698 |
|---|
May 23 | $22,584 | $22,410 | $22,804 |
|---|
Jun 23 | $24,106 | $23,940 | $24,344 |
|---|
Jul 23 | $24,932 | $24,798 | $25,181 |
|---|
Aug 23 | $24,496 | $24,320 | $24,740 |
|---|
Sep 23 | $23,341 | $23,161 | $23,578 |
|---|
Oct 23 | $22,774 | $22,547 | $23,008 |
|---|
Nov 23 | $24,906 | $24,650 | $25,157 |
|---|
Dec 23 | $26,132 | $25,957 | $26,398 |
|---|
Jan 24 | $26,493 | $26,245 | $26,767 |
|---|
Feb 24 | $27,921 | $27,666 | $28,212 |
|---|
Mar 24 | $28,812 | $28,558 | $29,116 |
|---|
Apr 24 | $27,583 | $27,301 | $27,877 |
|---|
May 24 | $28,878 | $28,591 | $29,190 |
|---|
Jun 24 | $29,830 | $29,476 | $30,156 |
|---|
Jul 24 | $30,262 | $30,024 | $30,595 |
|---|
Aug 24 | $30,975 | $30,678 | $31,320 |
|---|
Sep 24 | $31,633 | $31,313 | $31,990 |
|---|
Oct 24 | $31,408 | $31,083 | $31,767 |
|---|
Nov 24 | $33,426 | $33,150 | $33,812 |
|---|
Dec 24 | $32,490 | $32,137 | $32,869 |
|---|
Jan 25 | $33,519 | $33,152 | $33,915 |
|---|
Feb 25 | $32,929 | $32,516 | $33,322 |
|---|
Mar 25 | $31,019 | $30,620 | $31,394 |
|---|
Apr 25 | $30,831 | $30,414 | $31,207 |
|---|
May 25 | $32,795 | $32,342 | $33,199 |
|---|
Jun 25 | $34,451 | $33,985 | $34,880 |
|---|
Jul 25 | $35,212 | $34,734 | $35,655 |
|---|
Aug 25 | $35,950 | $35,537 | $36,406 |
|---|
Sep 25 | $37,192 | $36,764 | $37,668 |
|---|
Oct 25 | $37,989 | $37,552 | $38,481 |
|---|
Nov 25 | $38,078 | $37,655 | $38,574 |
|---|
Dec 25 | $38,075 | $37,647 | $38,577 |
|---|
Jan 26 | $38,595 | $38,231 | $39,108 |
|---|
Feb 26 | $38,385 | $38,049 | $38,898 |
|---|
Mar 26 | $36,472 | $36,157 | $36,964 |
|---|
See “Average annual total returns” for additional information on fund performance. |
|
| No Deduction of Taxes [Text Block] |
|
Performance results do not reflect the deduction of taxes that a shareholder would pay on fund distributions or on the redemption or sale of fund shares.
|
|
| Material Change Date |
|
|
Mar. 31, 2025
|
| AssetsNet |
|
$ 42,563,762,470
|
|
| Holdings Count | Holding |
|
1,009
|
|
| Advisory Fees Paid, Amount |
|
$ 64,456,142
|
|
| InvestmentCompanyPortfolioTurnover |
|
3.00%
|
|
| Additional Fund Statistics [Text Block] |
|
Table SummaryNet Assets........................................................................................................................................................................................................................................................................................................................................................................................................................................................................................................................................................................................................................................................................................................................................................................................................................................................................................................................................................................................................................................ | $42,563,762,470 |
|---|
Number of Portfolio Holdings........................................................................................................................................................................................................................................................................................................................................................................................................................................................................................................................................................................................................................................................................................................................................................................................................................................................................................................................................................................................................................................ | 1,009 |
|---|
Net Investment Advisory Fees........................................................................................................................................................................................................................................................................................................................................................................................................................................................................................................................................................................................................................................................................................................................................................................................................................................................................................................................................................................................................................................ | $64,456,142 |
|---|
Portfolio Turnover Rate........................................................................................................................................................................................................................................................................................................................................................................................................................................................................................................................................................................................................................................................................................................................................................................................................................................................................................................................................................................................................................................ | 3% |
|---|
|
|
| Updated Prospectus Phone Number |
|
(1-800-474-2737)
|
|
| Updated Prospectus Web Address |
|
blackrock.com/fundreports
|
|
| C000012076 |
|
|
|
| Shareholder Report [Line Items] |
|
|
|
| Fund Name |
|
iShares Russell 1000 Growth ETF
|
|
| Trading Symbol |
|
IWF
|
|
| Security Exchange Name |
|
NYSEArca
|
|
| Annual or Semi-Annual Statement [Text Block] |
|
This annual shareholder report contains important information about iShares Russell 1000 Growth ETF (the “Fund”) for the period of April 1, 2025 to March 31, 2026
|
|
| Additional Information [Text Block] |
|
You can find additional information about the Fund at blackrock.com/fundreports. You can also request this information by contacting us at 1-800-iShares (1-800-474-2737).
|
|
| Additional Information Phone Number |
|
1-800-474-2737
|
|
| Additional Information Website |
|
blackrock.com/fundreports
|
|
| Expenses [Text Block] |
|
What were the Fund costs for the last year?(based on a hypothetical $10,000 investment) Table SummaryFund name | Costs of a $10,000
investment | Costs paid as a percentage of a
$10,000 investment |
|---|
iShares Russell 1000 Growth ETF | $20 | 0.18% |
|---|
|
|
| Expenses Paid, Amount |
|
$ 20
|
|
| Expense Ratio, Percent |
|
0.18%
|
|
| Performance Past Does Not Indicate Future [Text] |
|
Past performance is not an indication of future results.
|
|
| Line Graph [Table Text Block] |
|
Cumulative performance: April 1, 2016 through March 31, 2026 Initial investment of $10,000 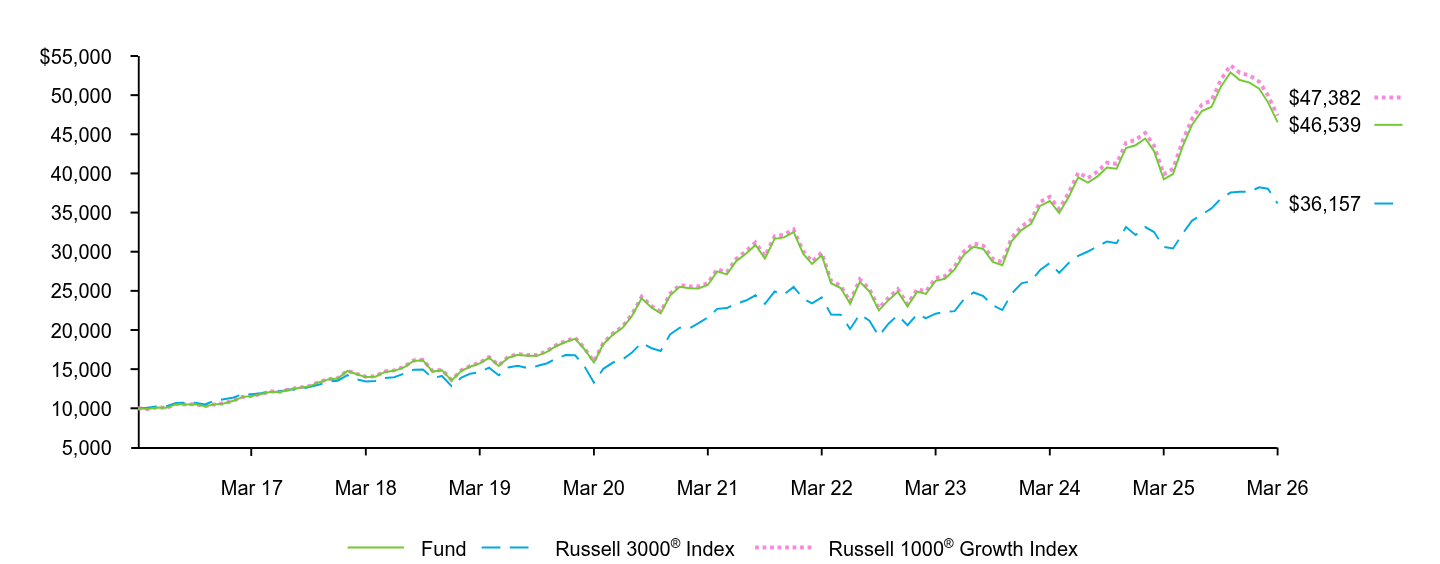 Table Summary | Fund | Russell 3000® Index | Russell 1000® Growth Index |
|---|
Mar 16 | $10,000 | $10,000 | $10,000 |
|---|
Apr 16 | $9,908 | $10,062 | $9,909 |
|---|
May 16 | $10,099 | $10,242 | $10,101 |
|---|
Jun 16 | $10,057 | $10,263 | $10,061 |
|---|
Jul 16 | $10,530 | $10,670 | $10,536 |
|---|
Aug 16 | $10,477 | $10,698 | $10,484 |
|---|
Sep 16 | $10,514 | $10,714 | $10,522 |
|---|
Oct 16 | $10,266 | $10,483 | $10,275 |
|---|
Nov 16 | $10,488 | $10,952 | $10,499 |
|---|
Dec 16 | $10,617 | $11,165 | $10,629 |
|---|
Jan 17 | $10,973 | $11,376 | $10,987 |
|---|
Feb 17 | $11,426 | $11,799 | $11,443 |
|---|
Mar 17 | $11,556 | $11,807 | $11,576 |
|---|
Apr 17 | $11,818 | $11,932 | $11,840 |
|---|
May 17 | $12,123 | $12,054 | $12,148 |
|---|
Jun 17 | $12,090 | $12,163 | $12,116 |
|---|
Jul 17 | $12,408 | $12,392 | $12,438 |
|---|
Aug 17 | $12,634 | $12,416 | $12,666 |
|---|
Sep 17 | $12,798 | $12,719 | $12,831 |
|---|
Oct 17 | $13,291 | $12,996 | $13,328 |
|---|
Nov 17 | $13,693 | $13,391 | $13,733 |
|---|
Dec 17 | $13,797 | $13,525 | $13,840 |
|---|
Jan 18 | $14,772 | $14,238 | $14,820 |
|---|
Feb 18 | $14,382 | $13,713 | $14,432 |
|---|
Mar 18 | $13,986 | $13,438 | $14,036 |
|---|
Apr 18 | $14,032 | $13,489 | $14,085 |
|---|
May 18 | $14,644 | $13,869 | $14,702 |
|---|
Jun 18 | $14,784 | $13,960 | $14,844 |
|---|
Jul 18 | $15,216 | $14,423 | $15,280 |
|---|
Aug 18 | $16,044 | $14,930 | $16,115 |
|---|
Sep 18 | $16,131 | $14,955 | $16,205 |
|---|
Oct 18 | $14,689 | $13,853 | $14,756 |
|---|
Nov 18 | $14,844 | $14,131 | $14,913 |
|---|
Dec 18 | $13,566 | $12,816 | $13,630 |
|---|
Jan 19 | $14,782 | $13,916 | $14,856 |
|---|
Feb 19 | $15,308 | $14,405 | $15,387 |
|---|
Mar 19 | $15,743 | $14,616 | $15,825 |
|---|
Apr 19 | $16,452 | $15,199 | $16,540 |
|---|
May 19 | $15,409 | $14,216 | $15,495 |
|---|
Jun 19 | $16,466 | $15,214 | $16,559 |
|---|
Jul 19 | $16,834 | $15,440 | $16,933 |
|---|
Aug 19 | $16,701 | $15,125 | $16,804 |
|---|
Sep 19 | $16,700 | $15,391 | $16,806 |
|---|
Oct 19 | $17,165 | $15,722 | $17,280 |
|---|
Nov 19 | $17,923 | $16,320 | $18,046 |
|---|
Dec 19 | $18,461 | $16,791 | $18,591 |
|---|
Jan 20 | $18,870 | $16,773 | $19,006 |
|---|
Feb 20 | $17,582 | $15,400 | $17,712 |
|---|
Mar 20 | $15,850 | $13,282 | $15,969 |
|---|
Apr 20 | $18,192 | $15,041 | $18,332 |
|---|
May 20 | $19,410 | $15,845 | $19,563 |
|---|
Jun 20 | $20,252 | $16,207 | $20,415 |
|---|
Jul 20 | $21,805 | $17,128 | $21,986 |
|---|
Aug 20 | $24,050 | $18,369 | $24,255 |
|---|
Sep 20 | $22,916 | $17,700 | $23,113 |
|---|
Oct 20 | $22,136 | $17,318 | $22,328 |
|---|
Nov 20 | $24,397 | $19,425 | $24,615 |
|---|
Dec 20 | $25,514 | $20,298 | $25,747 |
|---|
Jan 21 | $25,323 | $20,208 | $25,556 |
|---|
Feb 21 | $25,314 | $20,840 | $25,550 |
|---|
Mar 21 | $25,747 | $21,587 | $25,989 |
|---|
Apr 21 | $27,494 | $22,700 | $27,757 |
|---|
May 21 | $27,110 | $22,803 | $27,374 |
|---|
Jun 21 | $28,805 | $23,365 | $29,091 |
|---|
Jul 21 | $29,748 | $23,761 | $30,050 |
|---|
Aug 21 | $30,856 | $24,438 | $31,173 |
|---|
Sep 21 | $29,124 | $23,342 | $29,427 |
|---|
Oct 21 | $31,641 | $24,920 | $31,976 |
|---|
Nov 21 | $31,830 | $24,541 | $32,172 |
|---|
Dec 21 | $32,498 | $25,507 | $32,852 |
|---|
Jan 22 | $29,705 | $24,006 | $30,032 |
|---|
Feb 22 | $28,440 | $23,402 | $28,757 |
|---|
Mar 22 | $29,548 | $24,161 | $29,882 |
|---|
Apr 22 | $25,976 | $21,993 | $26,273 |
|---|
May 22 | $25,367 | $21,963 | $25,662 |
|---|
Jun 22 | $23,354 | $20,126 | $23,630 |
|---|
Jul 22 | $26,153 | $22,014 | $26,466 |
|---|
Aug 22 | $24,931 | $21,192 | $25,233 |
|---|
Sep 22 | $22,505 | $19,227 | $22,780 |
|---|
Oct 22 | $23,817 | $20,804 | $24,111 |
|---|
Nov 22 | $24,898 | $21,890 | $25,210 |
|---|
Dec 22 | $22,989 | $20,608 | $23,280 |
|---|
Jan 23 | $24,902 | $22,027 | $25,220 |
|---|
Feb 23 | $24,603 | $21,513 | $24,921 |
|---|
Mar 23 | $26,280 | $22,088 | $26,624 |
|---|
Apr 23 | $26,536 | $22,323 | $26,887 |
|---|
May 23 | $27,740 | $22,410 | $28,112 |
|---|
Jun 23 | $29,633 | $23,940 | $30,035 |
|---|
Jul 23 | $30,626 | $24,798 | $31,047 |
|---|
Aug 23 | $30,346 | $24,320 | $30,768 |
|---|
Sep 23 | $28,692 | $23,161 | $29,095 |
|---|
Oct 23 | $28,279 | $22,547 | $28,680 |
|---|
Nov 23 | $31,373 | $24,650 | $31,807 |
|---|
Dec 23 | $32,758 | $25,957 | $33,215 |
|---|
Jan 24 | $33,569 | $26,245 | $34,044 |
|---|
Feb 24 | $35,853 | $27,666 | $36,366 |
|---|
Mar 24 | $36,480 | $28,558 | $37,007 |
|---|
Apr 24 | $34,927 | $27,301 | $35,437 |
|---|
May 24 | $37,013 | $28,591 | $37,558 |
|---|
Jun 24 | $39,502 | $29,476 | $40,091 |
|---|
Jul 24 | $38,824 | $30,024 | $39,409 |
|---|
Aug 24 | $39,627 | $30,678 | $40,230 |
|---|
Sep 24 | $40,744 | $31,313 | $41,370 |
|---|
Oct 24 | $40,603 | $31,083 | $41,233 |
|---|
Nov 24 | $43,230 | $33,150 | $43,907 |
|---|
Dec 24 | $43,605 | $32,137 | $44,295 |
|---|
Jan 25 | $44,461 | $33,152 | $45,171 |
|---|
Feb 25 | $42,858 | $32,516 | $43,548 |
|---|
Mar 25 | $39,242 | $30,620 | $39,879 |
|---|
Apr 25 | $39,931 | $30,414 | $40,586 |
|---|
May 25 | $43,457 | $32,342 | $44,177 |
|---|
Jun 25 | $46,219 | $33,985 | $46,993 |
|---|
Jul 25 | $47,957 | $34,734 | $48,767 |
|---|
Aug 25 | $48,487 | $35,537 | $49,313 |
|---|
Sep 25 | $51,054 | $36,764 | $51,932 |
|---|
Oct 25 | $52,900 | $37,552 | $53,819 |
|---|
Nov 25 | $51,934 | $37,655 | $52,843 |
|---|
Dec 25 | $51,603 | $37,647 | $52,516 |
|---|
Jan 26 | $50,816 | $38,231 | $51,722 |
|---|
Feb 26 | $49,103 | $38,049 | $49,985 |
|---|
Mar 26 | $46,539 | $36,157 | $47,382 |
|---|
See “Average annual total returns” for additional information on fund performance. |
|
| No Deduction of Taxes [Text Block] |
|
Performance results do not reflect the deduction of taxes that a shareholder would pay on fund distributions or on the redemption or sale of fund shares.
|
|
| AssetsNet |
|
$ 111,880,148,100
|
|
| Holdings Count | Holding |
|
390
|
|
| Advisory Fees Paid, Amount |
|
$ 208,497,101
|
|
| InvestmentCompanyPortfolioTurnover |
|
16.00%
|
|
| Additional Fund Statistics [Text Block] |
|
Table SummaryNet Assets........................................................................................................................................................................................................................................................................................................................................................................................................................................................................................................................................................................................................................................................................................................................................................................................................................................................................................................................................................................................................................................ | $111,880,148,100 |
|---|
Number of Portfolio Holdings........................................................................................................................................................................................................................................................................................................................................................................................................................................................................................................................................................................................................................................................................................................................................................................................................................................................................................................................................................................................................................................ | 390 |
|---|
Net Investment Advisory Fees........................................................................................................................................................................................................................................................................................................................................................................................................................................................................................................................................................................................................................................................................................................................................................................................................................................................................................................................................................................................................................................ | $208,497,101 |
|---|
Portfolio Turnover Rate........................................................................................................................................................................................................................................................................................................................................................................................................................................................................................................................................................................................................................................................................................................................................................................................................................................................................................................................................................................................................................................ | 16% |
|---|
|
|
| C000012075 |
|
|
|
| Shareholder Report [Line Items] |
|
|
|
| Fund Name |
|
iShares Russell 1000 Value ETF
|
|
| Trading Symbol |
|
IWD
|
|
| Security Exchange Name |
|
NYSEArca
|
|
| Annual or Semi-Annual Statement [Text Block] |
|
This annual shareholder report contains important information about iShares Russell 1000 Value ETF (the “Fund”) for the period of April 1, 2025 to March 31, 2026
|
|
| Additional Information [Text Block] |
|
You can find additional information about the Fund at blackrock.com/fundreports. You can also request this information by contacting us at 1-800-iShares (1-800-474-2737).
|
|
| Additional Information Phone Number |
|
1-800-474-2737
|
|
| Additional Information Website |
|
blackrock.com/fundreports
|
|
| Expenses [Text Block] |
|
What were the Fund costs for the last year?(based on a hypothetical $10,000 investment) Table SummaryFund name | Costs of a $10,000
investment | Costs paid as a percentage of a
$10,000 investment |
|---|
iShares Russell 1000 Value ETF | $19 | 0.18% |
|---|
|
|
| Expenses Paid, Amount |
|
$ 19
|
|
| Expense Ratio, Percent |
|
0.18%
|
|
| Performance Past Does Not Indicate Future [Text] |
|
Past performance is not an indication of future results.
|
|
| Line Graph [Table Text Block] |
|
Cumulative performance: April 1, 2016 through March 31, 2026 Initial investment of $10,000 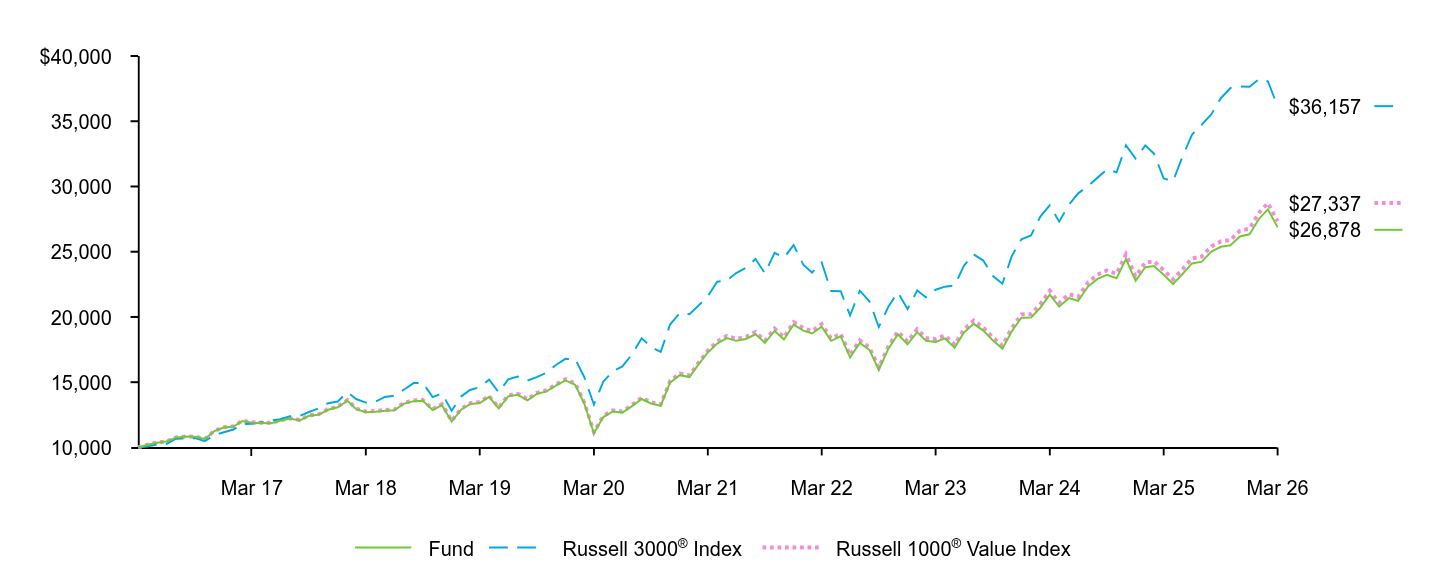 Table Summary | Fund | Russell 3000® Index | Russell 1000® Value Index |
|---|
Mar 16 | $10,000 | $10,000 | $10,000 |
|---|
Apr 16 | $10,207 | $10,062 | $10,210 |
|---|
May 16 | $10,364 | $10,242 | $10,369 |
|---|
Jun 16 | $10,451 | $10,263 | $10,458 |
|---|
Jul 16 | $10,753 | $10,670 | $10,762 |
|---|
Aug 16 | $10,834 | $10,698 | $10,845 |
|---|
Sep 16 | $10,810 | $10,714 | $10,822 |
|---|
Oct 16 | $10,641 | $10,483 | $10,655 |
|---|
Nov 16 | $11,246 | $10,952 | $11,263 |
|---|
Dec 16 | $11,525 | $11,165 | $11,545 |
|---|
Jan 17 | $11,605 | $11,376 | $11,627 |
|---|
Feb 17 | $12,021 | $11,799 | $12,045 |
|---|
Mar 17 | $11,896 | $11,807 | $11,922 |
|---|
Apr 17 | $11,874 | $11,932 | $11,900 |
|---|
May 17 | $11,860 | $12,054 | $11,888 |
|---|
Jun 17 | $12,052 | $12,163 | $12,083 |
|---|
Jul 17 | $12,210 | $12,392 | $12,243 |
|---|
Aug 17 | $12,066 | $12,416 | $12,101 |
|---|
Sep 17 | $12,421 | $12,719 | $12,459 |
|---|
Oct 17 | $12,510 | $12,996 | $12,549 |
|---|
Nov 17 | $12,891 | $13,391 | $12,934 |
|---|
Dec 17 | $13,077 | $13,525 | $13,122 |
|---|
Jan 18 | $13,582 | $14,238 | $13,630 |
|---|
Feb 18 | $12,932 | $13,713 | $12,979 |
|---|
Mar 18 | $12,703 | $13,438 | $12,751 |
|---|
Apr 18 | $12,742 | $13,489 | $12,793 |
|---|
May 18 | $12,817 | $13,869 | $12,869 |
|---|
Jun 18 | $12,847 | $13,960 | $12,901 |
|---|
Jul 18 | $13,352 | $14,423 | $13,411 |
|---|
Aug 18 | $13,548 | $14,930 | $13,609 |
|---|
Sep 18 | $13,573 | $14,955 | $13,636 |
|---|
Oct 18 | $12,867 | $13,853 | $12,930 |
|---|
Nov 18 | $13,248 | $14,131 | $13,316 |
|---|
Dec 18 | $11,979 | $12,816 | $12,038 |
|---|
Jan 19 | $12,910 | $13,916 | $12,975 |
|---|
Feb 19 | $13,321 | $14,405 | $13,389 |
|---|
Mar 19 | $13,405 | $14,616 | $13,474 |
|---|
Apr 19 | $13,879 | $15,199 | $13,952 |
|---|
May 19 | $12,985 | $14,216 | $13,055 |
|---|
Jun 19 | $13,914 | $15,214 | $13,992 |
|---|
Jul 19 | $14,028 | $15,440 | $14,108 |
|---|
Aug 19 | $13,614 | $15,125 | $13,693 |
|---|
Sep 19 | $14,096 | $15,391 | $14,182 |
|---|
Oct 19 | $14,292 | $15,722 | $14,380 |
|---|
Nov 19 | $14,731 | $16,320 | $14,825 |
|---|
Dec 19 | $15,134 | $16,791 | $15,233 |
|---|
Jan 20 | $14,807 | $16,773 | $14,905 |
|---|
Feb 20 | $13,372 | $15,400 | $13,461 |
|---|
Mar 20 | $11,087 | $13,282 | $11,161 |
|---|
Apr 20 | $12,333 | $15,041 | $12,416 |
|---|
May 20 | $12,755 | $15,845 | $12,841 |
|---|
Jun 20 | $12,670 | $16,207 | $12,756 |
|---|
Jul 20 | $13,169 | $17,128 | $13,260 |
|---|
Aug 20 | $13,712 | $18,369 | $13,808 |
|---|
Sep 20 | $13,371 | $17,700 | $13,469 |
|---|
Oct 20 | $13,194 | $17,318 | $13,292 |
|---|
Nov 20 | $14,967 | $19,425 | $15,080 |
|---|
Dec 20 | $15,539 | $20,298 | $15,658 |
|---|
Jan 21 | $15,394 | $20,208 | $15,515 |
|---|
Feb 21 | $16,322 | $20,840 | $16,453 |
|---|
Mar 21 | $17,277 | $21,587 | $17,421 |
|---|
Apr 21 | $17,966 | $22,700 | $18,117 |
|---|
May 21 | $18,383 | $22,803 | $18,540 |
|---|
Jun 21 | $18,169 | $23,365 | $18,328 |
|---|
Jul 21 | $18,312 | $23,761 | $18,475 |
|---|
Aug 21 | $18,672 | $24,438 | $18,841 |
|---|
Sep 21 | $18,020 | $23,342 | $18,185 |
|---|
Oct 21 | $18,931 | $24,920 | $19,108 |
|---|
Nov 21 | $18,263 | $24,541 | $18,435 |
|---|
Dec 21 | $19,411 | $25,507 | $19,598 |
|---|
Jan 22 | $18,954 | $24,006 | $19,142 |
|---|
Feb 22 | $18,731 | $23,402 | $18,919 |
|---|
Mar 22 | $19,256 | $24,161 | $19,454 |
|---|
Apr 22 | $18,167 | $21,993 | $18,356 |
|---|
May 22 | $18,517 | $21,963 | $18,713 |
|---|
Jun 22 | $16,897 | $20,126 | $17,078 |
|---|
Jul 22 | $18,016 | $22,014 | $18,211 |
|---|
Aug 22 | $17,477 | $21,192 | $17,668 |
|---|
Sep 22 | $15,941 | $19,227 | $16,119 |
|---|
Oct 22 | $17,573 | $20,804 | $17,771 |
|---|
Nov 22 | $18,668 | $21,890 | $18,882 |
|---|
Dec 22 | $17,912 | $20,608 | $18,121 |
|---|
Jan 23 | $18,838 | $22,027 | $19,060 |
|---|
Feb 23 | $18,172 | $21,513 | $18,388 |
|---|
Mar 23 | $18,087 | $22,088 | $18,303 |
|---|
Apr 23 | $18,357 | $22,323 | $18,579 |
|---|
May 23 | $17,647 | $22,410 | $17,862 |
|---|
Jun 23 | $18,816 | $23,940 | $19,049 |
|---|
Jul 23 | $19,475 | $24,798 | $19,719 |
|---|
Aug 23 | $18,951 | $24,320 | $19,186 |
|---|
Sep 23 | $18,216 | $23,161 | $18,446 |
|---|
Oct 23 | $17,571 | $22,547 | $17,795 |
|---|
Nov 23 | $18,894 | $24,650 | $19,138 |
|---|
Dec 23 | $19,938 | $25,957 | $20,198 |
|---|
Jan 24 | $19,955 | $26,245 | $20,219 |
|---|
Feb 24 | $20,689 | $27,666 | $20,965 |
|---|
Mar 24 | $21,719 | $28,558 | $22,013 |
|---|
Apr 24 | $20,788 | $27,301 | $21,073 |
|---|
May 24 | $21,444 | $28,591 | $21,741 |
|---|
Jun 24 | $21,239 | $29,476 | $21,536 |
|---|
Jul 24 | $22,322 | $30,024 | $22,637 |
|---|
Aug 24 | $22,918 | $30,678 | $23,244 |
|---|
Sep 24 | $23,232 | $31,313 | $23,567 |
|---|
Oct 24 | $22,972 | $31,083 | $23,308 |
|---|
Nov 24 | $24,436 | $33,150 | $24,796 |
|---|
Dec 24 | $22,761 | $32,137 | $23,100 |
|---|
Jan 25 | $23,810 | $33,152 | $24,169 |
|---|
Feb 25 | $23,903 | $32,516 | $24,267 |
|---|
Mar 25 | $23,236 | $30,620 | $23,593 |
|---|
Apr 25 | $22,525 | $30,414 | $22,874 |
|---|
May 25 | $23,312 | $32,342 | $23,678 |
|---|
Jun 25 | $24,105 | $33,985 | $24,487 |
|---|
Jul 25 | $24,240 | $34,734 | $24,628 |
|---|
Aug 25 | $25,011 | $35,537 | $25,412 |
|---|
Sep 25 | $25,381 | $36,764 | $25,792 |
|---|
Oct 25 | $25,489 | $37,552 | $25,906 |
|---|
Nov 25 | $26,163 | $37,655 | $26,594 |
|---|
Dec 25 | $26,336 | $37,647 | $26,774 |
|---|
Jan 26 | $27,534 | $38,231 | $27,996 |
|---|
Feb 26 | $28,245 | $38,049 | $28,722 |
|---|
Mar 26 | $26,878 | $36,157 | $27,337 |
|---|
See “Average annual total returns” for additional information on fund performance. |
|
| No Deduction of Taxes [Text Block] |
|
Performance results do not reflect the deduction of taxes that a shareholder would pay on fund distributions or on the redemption or sale of fund shares.
|
|
| AssetsNet |
|
$ 69,842,327,062
|
|
| Holdings Count | Holding |
|
869
|
|
| Advisory Fees Paid, Amount |
|
$ 117,668,328
|
|
| InvestmentCompanyPortfolioTurnover |
|
14.00%
|
|
| Additional Fund Statistics [Text Block] |
|
Table SummaryNet Assets........................................................................................................................................................................................................................................................................................................................................................................................................................................................................................................................................................................................................................................................................................................................................................................................................................................................................................................................................................................................................................................ | $69,842,327,062 |
|---|
Number of Portfolio Holdings........................................................................................................................................................................................................................................................................................................................................................................................................................................................................................................................................................................................................................................................................................................................................................................................................................................................................................................................................................................................................................................ | 869 |
|---|
Net Investment Advisory Fees........................................................................................................................................................................................................................................................................................................................................................................................................................................................................................................................................................................................................................................................................................................................................................................................................................................................................................................................................................................................................................................ | $117,668,328 |
|---|
Portfolio Turnover Rate........................................................................................................................................................................................................................................................................................................................................................................................................................................................................................................................................................................................................................................................................................................................................................................................................................................................................................................................................................................................................................................ | 14% |
|---|
|
|
| C000025777 |
|
|
|
| Shareholder Report [Line Items] |
|
|
|
| Fund Name |
|
iShares U.S. Aerospace & Defense ETF
|
|
| Trading Symbol |
|
ITA
|
|
| Security Exchange Name |
|
CboeBZX
|
|
| Annual or Semi-Annual Statement [Text Block] |
|
This annual shareholder report contains important information about iShares U.S. Aerospace & Defense ETF (the “Fund”) for the period of April 1, 2025 to March 31, 2026
|
|
| Additional Information [Text Block] |
|
You can find additional information about the Fund at blackrock.com/fundreports. You can also request this information by contacting us at 1-800-iShares (1-800-474-2737).
|
|
| Additional Information Phone Number |
|
1-800-474-2737
|
|
| Additional Information Website |
|
blackrock.com/fundreports
|
|
| Expenses [Text Block] |
|
What were the Fund costs for the last year?(based on a hypothetical $10,000 investment) Table SummaryFund name | Costs of a $10,000
investment | Costs paid as a percentage of a
$10,000 investment |
|---|
iShares U.S. Aerospace & Defense ETF | $45 | 0.37% |
|---|
|
|
| Expenses Paid, Amount |
|
$ 45
|
|
| Expense Ratio, Percent |
|
0.37%
|
|
| Performance Past Does Not Indicate Future [Text] |
|
Past performance is not an indication of future results.
|
|
| Line Graph [Table Text Block] |
|
Cumulative performance: April 1, 2016 through March 31, 2026 Initial investment of $10,000  Table Summary | Fund | S&P Total Market Index | Dow Jones U.S. Select Aerospace & Defense Index™ |
|---|
Mar 16 | $10,000 | $10,000 | $10,000 |
|---|
Apr 16 | $10,421 | $10,062 | $10,425 |
|---|
May 16 | $10,609 | $10,242 | $10,617 |
|---|
Jun 16 | $10,709 | $10,262 | $10,721 |
|---|
Jul 16 | $11,103 | $10,670 | $11,120 |
|---|
Aug 16 | $11,170 | $10,699 | $11,187 |
|---|
Sep 16 | $11,103 | $10,718 | $11,124 |
|---|
Oct 16 | $11,204 | $10,483 | $11,229 |
|---|
Nov 16 | $12,317 | $10,949 | $12,352 |
|---|
Dec 16 | $12,137 | $11,162 | $12,176 |
|---|
Jan 17 | $12,290 | $11,379 | $12,333 |
|---|
Feb 17 | $13,098 | $11,799 | $13,149 |
|---|
Mar 17 | $12,870 | $11,808 | $12,924 |
|---|
Apr 17 | $13,294 | $11,931 | $13,354 |
|---|
May 17 | $13,653 | $12,053 | $13,721 |
|---|
Jun 17 | $13,638 | $12,164 | $13,709 |
|---|
Jul 17 | $14,293 | $12,393 | $14,373 |
|---|
Aug 17 | $14,810 | $12,416 | $14,899 |
|---|
Sep 17 | $15,483 | $12,719 | $15,580 |
|---|
Oct 17 | $15,701 | $12,995 | $15,805 |
|---|
Nov 17 | $16,173 | $13,389 | $16,286 |
|---|
Dec 17 | $16,406 | $13,524 | $16,526 |
|---|
Jan 18 | $17,709 | $14,242 | $17,846 |
|---|
Feb 18 | $17,679 | $13,714 | $17,818 |
|---|
Mar 18 | $17,297 | $13,442 | $17,438 |
|---|
Apr 18 | $16,813 | $13,490 | $16,956 |
|---|
May 18 | $17,394 | $13,871 | $17,549 |
|---|
Jun 18 | $16,853 | $13,963 | $17,008 |
|---|
Jul 18 | $18,032 | $14,430 | $18,205 |
|---|
Aug 18 | $18,179 | $14,932 | $18,363 |
|---|
Sep 18 | $19,037 | $14,955 | $19,242 |
|---|
Oct 18 | $16,860 | $13,848 | $17,035 |
|---|
Nov 18 | $16,890 | $14,125 | $17,079 |
|---|
Dec 18 | $15,232 | $12,808 | $15,404 |
|---|
Jan 19 | $17,131 | $13,911 | $17,343 |
|---|
Feb 19 | $18,413 | $14,399 | $18,660 |
|---|
Mar 19 | $17,627 | $14,606 | $17,865 |
|---|
Apr 19 | $18,527 | $15,188 | $18,784 |
|---|
May 19 | $17,840 | $14,208 | $18,092 |
|---|
Jun 19 | $18,974 | $15,203 | $19,251 |
|---|
Jul 19 | $19,069 | $15,426 | $19,352 |
|---|
Aug 19 | $19,655 | $15,115 | $19,958 |
|---|
Sep 19 | $19,961 | $15,376 | $20,274 |
|---|
Oct 19 | $19,548 | $15,702 | $19,860 |
|---|
Nov 19 | $20,551 | $16,297 | $20,887 |
|---|
Dec 19 | $19,873 | $16,766 | $20,204 |
|---|
Jan 20 | $20,374 | $16,745 | $20,723 |
|---|
Feb 20 | $17,970 | $15,374 | $18,281 |
|---|
Mar 20 | $12,941 | $13,251 | $13,179 |
|---|
Apr 20 | $14,014 | $15,008 | $14,274 |
|---|
May 20 | $14,784 | $15,814 | $15,063 |
|---|
Jun 20 | $14,851 | $16,179 | $15,136 |
|---|
Jul 20 | $14,124 | $17,093 | $14,397 |
|---|
Aug 20 | $15,064 | $18,321 | $15,360 |
|---|
Sep 20 | $14,317 | $17,647 | $14,605 |
|---|
Oct 20 | $13,661 | $17,271 | $13,939 |
|---|
Nov 20 | $16,683 | $19,382 | $17,030 |
|---|
Dec 20 | $17,174 | $20,251 | $17,538 |
|---|
Jan 21 | $16,151 | $20,186 | $16,497 |
|---|
Feb 21 | $17,335 | $20,832 | $17,712 |
|---|
Mar 21 | $18,925 | $21,557 | $19,345 |
|---|
Apr 21 | $19,339 | $22,664 | $19,774 |
|---|
May 21 | $20,037 | $22,767 | $20,495 |
|---|
Jun 21 | $19,943 | $23,344 | $20,407 |
|---|
Jul 21 | $19,663 | $23,746 | $20,125 |
|---|
Aug 21 | $19,292 | $24,425 | $19,752 |
|---|
Sep 21 | $19,009 | $23,316 | $19,471 |
|---|
Oct 21 | $19,055 | $24,882 | $19,516 |
|---|
Nov 21 | $17,890 | $24,516 | $18,327 |
|---|
Dec 21 | $18,780 | $25,447 | $19,245 |
|---|
Jan 22 | $18,453 | $23,919 | $18,916 |
|---|
Feb 22 | $20,431 | $23,318 | $20,953 |
|---|
Mar 22 | $20,250 | $24,073 | $20,773 |
|---|
Apr 22 | $18,822 | $21,902 | $19,314 |
|---|
May 22 | $18,698 | $21,858 | $19,194 |
|---|
Jun 22 | $18,186 | $20,020 | $18,676 |
|---|
Jul 22 | $19,022 | $21,898 | $19,538 |
|---|
Aug 22 | $18,649 | $21,071 | $19,163 |
|---|
Sep 22 | $16,784 | $19,107 | $17,252 |
|---|
Oct 22 | $19,751 | $20,666 | $20,310 |
|---|
Nov 22 | $20,595 | $21,757 | $21,183 |
|---|
Dec 22 | $20,649 | $20,478 | $21,248 |
|---|
Jan 23 | $21,167 | $21,906 | $21,789 |
|---|
Feb 23 | $21,178 | $21,398 | $21,806 |
|---|
Mar 23 | $21,295 | $21,961 | $21,935 |
|---|
Apr 23 | $21,089 | $22,182 | $21,730 |
|---|
May 23 | $20,113 | $22,278 | $20,731 |
|---|
Jun 23 | $21,641 | $23,804 | $22,311 |
|---|
Jul 23 | $21,830 | $24,662 | $22,513 |
|---|
Aug 23 | $21,533 | $24,178 | $22,214 |
|---|
Sep 23 | $19,682 | $23,021 | $20,310 |
|---|
Oct 23 | $20,416 | $22,401 | $21,076 |
|---|
Nov 23 | $22,277 | $24,503 | $23,006 |
|---|
Dec 23 | $23,596 | $25,814 | $24,375 |
|---|
Jan 24 | $22,873 | $26,099 | $23,636 |
|---|
Feb 24 | $23,847 | $27,518 | $24,650 |
|---|
Mar 24 | $24,648 | $28,407 | $25,483 |
|---|
Apr 24 | $24,254 | $27,155 | $25,085 |
|---|
May 24 | $25,428 | $28,444 | $26,310 |
|---|
Jun 24 | $24,719 | $29,327 | $25,582 |
|---|
Jul 24 | $26,821 | $29,866 | $27,768 |
|---|
Aug 24 | $27,652 | $30,506 | $28,637 |
|---|
Sep 24 | $28,069 | $31,134 | $29,077 |
|---|
Oct 24 | $27,076 | $30,912 | $28,056 |
|---|
Nov 24 | $29,150 | $32,971 | $30,215 |
|---|
Dec 24 | $27,325 | $31,977 | $28,334 |
|---|
Jan 25 | $29,464 | $32,957 | $30,561 |
|---|
Feb 25 | $29,127 | $32,335 | $30,221 |
|---|
Mar 25 | $28,849 | $30,420 | $29,946 |
|---|
Apr 25 | $29,562 | $30,211 | $30,696 |
|---|
May 25 | $33,385 | $32,146 | $34,679 |
|---|
Jun 25 | $35,555 | $33,793 | $36,945 |
|---|
Jul 25 | $37,079 | $34,564 | $38,542 |
|---|
Aug 25 | $37,426 | $35,349 | $38,915 |
|---|
Sep 25 | $39,618 | $36,570 | $41,208 |
|---|
Oct 25 | $40,812 | $37,374 | $42,464 |
|---|
Nov 25 | $38,815 | $37,433 | $40,397 |
|---|
Dec 25 | $40,621 | $37,431 | $42,292 |
|---|
Jan 26 | $43,968 | $38,014 | $45,792 |
|---|
Feb 26 | $46,163 | $37,805 | $48,091 |
|---|
Mar 26 | $41,408 | $35,939 | $43,149 |
|---|
See “Average annual total returns” for additional information on fund performance. |
|
| No Deduction of Taxes [Text Block] |
|
Performance results do not reflect the deduction of taxes that a shareholder would pay on fund distributions or on the redemption or sale of fund shares.
|
|
| AssetsNet |
|
$ 13,379,396,671
|
|
| Holdings Count | Holding |
|
47
|
|
| Advisory Fees Paid, Amount |
|
$ 40,000,711
|
|
| InvestmentCompanyPortfolioTurnover |
|
18.00%
|
|
| Additional Fund Statistics [Text Block] |
|
Table SummaryNet Assets........................................................................................................................................................................................................................................................................................................................................................................................................................................................................................................................................................................................................................................................................................................................................................................................................................................................................................................................................................................................................................................ | $13,379,396,671 |
|---|
Number of Portfolio Holdings........................................................................................................................................................................................................................................................................................................................................................................................................................................................................................................................................................................................................................................................................................................................................................................................................................................................................................................................................................................................................................................ | 47 |
|---|
Net Investment Advisory Fees........................................................................................................................................................................................................................................................................................................................................................................................................................................................................................................................................................................................................................................................................................................................................................................................................................................................................................................................................................................................................................................ | $40,000,711 |
|---|
Portfolio Turnover Rate........................................................................................................................................................................................................................................................................................................................................................................................................................................................................................................................................................................................................................................................................................................................................................................................................................................................................................................................................................................................................................................ | 18% |
|---|
|
|
| C000025774 |
|
|
|
| Shareholder Report [Line Items] |
|
|
|
| Fund Name |
|
iShares U.S. Broker-Dealers & Securities Exchanges ETF
|
|
| Trading Symbol |
|
IAI
|
|
| Security Exchange Name |
|
NYSEArca
|
|
| Annual or Semi-Annual Statement [Text Block] |
|
This annual shareholder report contains important information about iShares U.S. Broker-Dealers & Securities Exchanges ETF (the “Fund”) for the period of April 1, 2025 to March 31, 2026
|
|
| Additional Information [Text Block] |
|
You can find additional information about the Fund at blackrock.com/fundreports. You can also request this information by contacting us at 1-800-iShares (1-800-474-2737).
|
|
| Additional Information Phone Number |
|
1-800-474-2737
|
|
| Additional Information Website |
|
blackrock.com/fundreports
|
|
| Expenses [Text Block] |
|
What were the Fund costs for the last year?(based on a hypothetical $10,000 investment) Table SummaryFund name | Costs of a $10,000
investment | Costs paid as a percentage of a
$10,000 investment |
|---|
iShares U.S. Broker-Dealers & Securities Exchanges ETF | $40 | 0.37% |
|---|
|
|
| Expenses Paid, Amount |
|
$ 40
|
|
| Expense Ratio, Percent |
|
0.37%
|
|
| Performance Past Does Not Indicate Future [Text] |
|
Past performance is not an indication of future results.
|
|
| Line Graph [Table Text Block] |
|
Cumulative performance: April 1, 2016 through March 31, 2026 Initial investment of $10,000  Table Summary | Fund | S&P Total Market Index | Dow Jones U.S. Select Investment Services Index™ |
|---|
Mar 16 | $10,000 | $10,000 | $10,000 |
|---|
Apr 16 | $10,064 | $10,062 | $10,068 |
|---|
May 16 | $10,556 | $10,242 | $10,564 |
|---|
Jun 16 | $9,682 | $10,262 | $9,691 |
|---|
Jul 16 | $10,503 | $10,670 | $10,516 |
|---|
Aug 16 | $11,203 | $10,699 | $11,223 |
|---|
Sep 16 | $11,156 | $10,718 | $11,181 |
|---|
Oct 16 | $11,143 | $10,483 | $11,170 |
|---|
Nov 16 | $13,064 | $10,949 | $13,103 |
|---|
Dec 16 | $13,361 | $11,162 | $13,408 |
|---|
Jan 17 | $13,925 | $11,379 | $13,980 |
|---|
Feb 17 | $14,087 | $11,799 | $14,146 |
|---|
Mar 17 | $13,927 | $11,808 | $13,991 |
|---|
Apr 17 | $13,762 | $11,931 | $13,830 |
|---|
May 17 | $13,520 | $12,053 | $13,592 |
|---|
Jun 17 | $14,522 | $12,164 | $14,606 |
|---|
Jul 17 | $14,942 | $12,393 | $15,033 |
|---|
Aug 17 | $14,609 | $12,416 | $14,701 |
|---|
Sep 17 | $15,617 | $12,719 | $15,725 |
|---|
Oct 17 | $15,855 | $12,995 | $15,972 |
|---|
Nov 17 | $16,858 | $13,389 | $16,989 |
|---|
Dec 17 | $17,207 | $13,524 | $17,348 |
|---|
Jan 18 | $18,186 | $14,242 | $18,344 |
|---|
Feb 18 | $18,172 | $13,714 | $18,339 |
|---|
Mar 18 | $18,020 | $13,442 | $18,192 |
|---|
Apr 18 | $18,100 | $13,490 | $18,280 |
|---|
May 18 | $18,271 | $13,871 | $18,457 |
|---|
Jun 18 | $17,703 | $13,963 | $17,891 |
|---|
Jul 18 | $17,998 | $14,430 | $18,197 |
|---|
Aug 18 | $18,139 | $14,932 | $18,346 |
|---|
Sep 18 | $17,243 | $14,955 | $17,437 |
|---|
Oct 18 | $16,858 | $13,848 | $17,054 |
|---|
Nov 18 | $16,997 | $14,125 | $17,202 |
|---|
Dec 18 | $15,607 | $12,808 | $15,797 |
|---|
Jan 19 | $16,851 | $13,911 | $17,055 |
|---|
Feb 19 | $17,193 | $14,399 | $17,407 |
|---|
Mar 19 | $16,465 | $14,606 | $16,673 |
|---|
Apr 19 | $17,870 | $15,188 | $18,102 |
|---|
May 19 | $16,905 | $14,208 | $17,127 |
|---|
Jun 19 | $17,744 | $15,203 | $17,988 |
|---|
Jul 19 | $18,322 | $15,426 | $18,582 |
|---|
Aug 19 | $18,008 | $15,115 | $18,269 |
|---|
Sep 19 | $18,135 | $15,376 | $18,402 |
|---|
Oct 19 | $18,174 | $15,702 | $18,447 |
|---|
Nov 19 | $19,285 | $16,297 | $19,582 |
|---|
Dec 19 | $19,391 | $16,766 | $19,699 |
|---|
Jan 20 | $19,943 | $16,745 | $20,268 |
|---|
Feb 20 | $17,957 | $15,374 | $18,255 |
|---|
Mar 20 | $14,630 | $13,251 | $14,885 |
|---|
Apr 20 | $16,401 | $15,008 | $16,690 |
|---|
May 20 | $17,453 | $15,814 | $17,770 |
|---|
Jun 20 | $17,153 | $16,179 | $17,471 |
|---|
Jul 20 | $17,485 | $17,093 | $17,768 |
|---|
Aug 20 | $18,494 | $18,321 | $18,780 |
|---|
Sep 20 | $17,824 | $17,647 | $18,107 |
|---|
Oct 20 | $17,847 | $17,271 | $18,135 |
|---|
Nov 20 | $20,926 | $19,382 | $21,272 |
|---|
Dec 20 | $22,988 | $20,251 | $23,380 |
|---|
Jan 21 | $22,939 | $20,186 | $23,338 |
|---|
Feb 21 | $25,849 | $20,832 | $26,306 |
|---|
Mar 21 | $26,685 | $21,557 | $27,168 |
|---|
Apr 21 | $28,154 | $22,664 | $28,671 |
|---|
May 21 | $29,492 | $22,767 | $30,046 |
|---|
Jun 21 | $29,638 | $23,344 | $30,206 |
|---|
Jul 21 | $29,963 | $23,746 | $30,545 |
|---|
Aug 21 | $31,819 | $24,425 | $32,453 |
|---|
Sep 21 | $30,420 | $23,316 | $31,035 |
|---|
Oct 21 | $33,208 | $24,882 | $33,890 |
|---|
Nov 21 | $31,254 | $24,516 | $31,906 |
|---|
Dec 21 | $32,274 | $25,447 | $32,959 |
|---|
Jan 22 | $31,363 | $23,919 | $32,038 |
|---|
Feb 22 | $30,339 | $23,318 | $31,000 |
|---|
Mar 22 | $29,454 | $24,073 | $30,105 |
|---|
Apr 22 | $26,246 | $21,902 | $26,832 |
|---|
May 22 | $27,261 | $21,858 | $27,881 |
|---|
Jun 22 | $24,879 | $20,020 | $25,455 |
|---|
Jul 22 | $27,505 | $21,898 | $28,150 |
|---|
Aug 22 | $27,478 | $21,071 | $28,134 |
|---|
Sep 22 | $25,436 | $19,107 | $26,053 |
|---|
Oct 22 | $28,574 | $20,666 | $29,278 |
|---|
Nov 22 | $30,746 | $21,757 | $31,515 |
|---|
Dec 22 | $28,814 | $20,478 | $29,544 |
|---|
Jan 23 | $30,611 | $21,906 | $31,398 |
|---|
Feb 23 | $30,280 | $21,398 | $31,069 |
|---|
Mar 23 | $27,560 | $21,961 | $28,288 |
|---|
Apr 23 | $27,667 | $22,182 | $28,406 |
|---|
May 23 | $26,219 | $22,278 | $26,926 |
|---|
Jun 23 | $27,428 | $23,804 | $28,174 |
|---|
Jul 23 | $29,632 | $24,662 | $30,448 |
|---|
Aug 23 | $28,647 | $24,178 | $29,445 |
|---|
Sep 23 | $27,752 | $23,021 | $28,535 |
|---|
Oct 23 | $26,620 | $22,401 | $27,381 |
|---|
Nov 23 | $30,015 | $24,503 | $30,885 |
|---|
Dec 23 | $33,144 | $25,814 | $34,117 |
|---|
Jan 24 | $32,357 | $26,099 | $33,300 |
|---|
Feb 24 | $33,796 | $27,518 | $34,791 |
|---|
Mar 24 | $35,558 | $28,407 | $36,617 |
|---|
Apr 24 | $34,177 | $27,155 | $35,190 |
|---|
May 24 | $35,745 | $28,444 | $36,831 |
|---|
Jun 24 | $36,000 | $29,327 | $37,104 |
|---|
Jul 24 | $38,111 | $29,866 | $39,301 |
|---|
Aug 24 | $39,266 | $30,506 | $40,514 |
|---|
Sep 24 | $39,642 | $31,134 | $40,913 |
|---|
Oct 24 | $40,969 | $30,912 | $42,293 |
|---|
Nov 24 | $47,244 | $32,971 | $48,792 |
|---|
Dec 24 | $44,542 | $31,977 | $46,018 |
|---|
Jan 25 | $48,401 | $32,957 | $50,021 |
|---|
Feb 25 | $47,258 | $32,335 | $48,848 |
|---|
Mar 25 | $43,532 | $30,420 | $45,004 |
|---|
Apr 25 | $43,775 | $30,211 | $45,272 |
|---|
May 25 | $47,996 | $32,146 | $49,657 |
|---|
Jun 25 | $52,645 | $33,793 | $54,490 |
|---|
Jul 25 | $54,681 | $34,564 | $56,613 |
|---|
Aug 25 | $54,205 | $35,349 | $56,132 |
|---|
Sep 25 | $55,135 | $36,570 | $57,113 |
|---|
Oct 25 | $54,630 | $37,374 | $56,614 |
|---|
Nov 25 | $54,875 | $37,433 | $56,883 |
|---|
Dec 25 | $56,095 | $37,431 | $58,172 |
|---|
Jan 26 | $57,659 | $38,014 | $59,812 |
|---|
Feb 26 | $53,401 | $37,805 | $55,410 |
|---|
Mar 26 | $51,599 | $35,939 | $53,557 |
|---|
See “Average annual total returns” for additional information on fund performance. |
|
| No Deduction of Taxes [Text Block] |
|
Performance results do not reflect the deduction of taxes that a shareholder would pay on fund distributions or on the redemption or sale of fund shares.
|
|
| AssetsNet |
|
$ 1,519,917,792
|
|
| Holdings Count | Holding |
|
38
|
|
| Advisory Fees Paid, Amount |
|
$ 5,558,733
|
|
| InvestmentCompanyPortfolioTurnover |
|
18.00%
|
|
| Additional Fund Statistics [Text Block] |
|
Table SummaryNet Assets........................................................................................................................................................................................................................................................................................................................................................................................................................................................................................................................................................................................................................................................................................................................................................................................................................................................................................................................................................................................................................................ | $1,519,917,792 |
|---|
Number of Portfolio Holdings........................................................................................................................................................................................................................................................................................................................................................................................................................................................................................................................................................................................................................................................................................................................................................................................................................................................................................................................................................................................................................................ | 38 |
|---|
Net Investment Advisory Fees........................................................................................................................................................................................................................................................................................................................................................................................................................................................................................................................................................................................................................................................................................................................................................................................................................................................................................................................................................................................................................................ | $5,558,733 |
|---|
Portfolio Turnover Rate........................................................................................................................................................................................................................................................................................................................................................................................................................................................................................................................................................................................................................................................................................................................................................................................................................................................................................................................................................................................................................................ | 18% |
|---|
|
|
| C000025772 |
|
|
|
| Shareholder Report [Line Items] |
|
|
|
| Fund Name |
|
iShares U.S. Healthcare Providers ETF
|
|
| Trading Symbol |
|
IHF
|
|
| Security Exchange Name |
|
NYSEArca
|
|
| Annual or Semi-Annual Statement [Text Block] |
|
This annual shareholder report contains important information about iShares U.S. Healthcare Providers ETF (the “Fund”) for the period of April 1, 2025 to March 31, 2026
|
|
| Additional Information [Text Block] |
|
You can find additional information about the Fund at blackrock.com/fundreports. You can also request this information by contacting us at 1-800-iShares (1-800-474-2737).
|
|
| Additional Information Phone Number |
|
1-800-474-2737
|
|
| Additional Information Website |
|
blackrock.com/fundreports
|
|
| Expenses [Text Block] |
|
What were the Fund costs for the last year?(based on a hypothetical $10,000 investment) Table SummaryFund name | Costs of a $10,000
investment | Costs paid as a percentage of a
$10,000 investment |
|---|
iShares U.S. Healthcare Providers ETF | $33 | 0.37% |
|---|
|
|
| Expenses Paid, Amount |
|
$ 33
|
|
| Expense Ratio, Percent |
|
0.37%
|
|
| Performance Past Does Not Indicate Future [Text] |
|
Past performance is not an indication of future results.
|
|
| Line Graph [Table Text Block] |
|
Cumulative performance: April 1, 2016 through March 31, 2026 Initial investment of $10,000  Table Summary | Fund | S&P Total Market Index | Dow Jones U.S. Select Health Care Providers Index™ |
|---|
Mar 16 | $10,000 | $10,000 | $10,000 |
|---|
Apr 16 | $10,352 | $10,062 | $10,355 |
|---|
May 16 | $10,275 | $10,242 | $10,282 |
|---|
Jun 16 | $10,452 | $10,262 | $10,463 |
|---|
Jul 16 | $10,548 | $10,670 | $10,561 |
|---|
Aug 16 | $10,085 | $10,699 | $10,100 |
|---|
Sep 16 | $10,184 | $10,718 | $10,203 |
|---|
Oct 16 | $9,615 | $10,483 | $9,635 |
|---|
Nov 16 | $10,387 | $10,949 | $10,412 |
|---|
Dec 16 | $10,284 | $11,162 | $10,312 |
|---|
Jan 17 | $10,649 | $11,379 | $10,683 |
|---|
Feb 17 | $11,152 | $11,799 | $11,191 |
|---|
Mar 17 | $11,023 | $11,808 | $11,064 |
|---|
Apr 17 | $11,306 | $11,931 | $11,352 |
|---|
May 17 | $11,508 | $12,053 | $11,551 |
|---|
Jun 17 | $12,216 | $12,164 | $12,267 |
|---|
Jul 17 | $11,968 | $12,393 | $12,022 |
|---|
Aug 17 | $12,153 | $12,416 | $12,212 |
|---|
Sep 17 | $12,159 | $12,719 | $12,221 |
|---|
Oct 17 | $12,299 | $12,995 | $12,367 |
|---|
Nov 17 | $12,906 | $13,389 | $12,979 |
|---|
Dec 17 | $12,904 | $13,524 | $12,982 |
|---|
Jan 18 | $13,780 | $14,242 | $13,868 |
|---|
Feb 18 | $13,292 | $13,714 | $13,381 |
|---|
Mar 18 | $12,941 | $13,442 | $13,031 |
|---|
Apr 18 | $13,507 | $13,490 | $13,608 |
|---|
May 18 | $14,063 | $13,871 | $14,174 |
|---|
Jun 18 | $14,469 | $13,963 | $14,595 |
|---|
Jul 18 | $15,041 | $14,430 | $15,180 |
|---|
Aug 18 | $16,227 | $14,932 | $16,387 |
|---|
Sep 18 | $16,472 | $14,955 | $16,639 |
|---|
Oct 18 | $15,709 | $13,848 | $15,872 |
|---|
Nov 18 | $16,487 | $14,125 | $16,660 |
|---|
Dec 18 | $14,144 | $12,808 | $14,302 |
|---|
Jan 19 | $15,449 | $13,911 | $15,629 |
|---|
Feb 19 | $14,960 | $14,399 | $15,139 |
|---|
Mar 19 | $14,397 | $14,606 | $14,571 |
|---|
Apr 19 | $14,029 | $15,188 | $14,205 |
|---|
May 19 | $14,104 | $14,208 | $14,284 |
|---|
Jun 19 | $14,697 | $15,203 | $14,890 |
|---|
Jul 19 | $15,216 | $15,426 | $15,423 |
|---|
Aug 19 | $14,428 | $15,115 | $14,628 |
|---|
Sep 19 | $13,910 | $15,376 | $14,107 |
|---|
Oct 19 | $15,172 | $15,702 | $15,393 |
|---|
Nov 19 | $16,759 | $16,297 | $17,012 |
|---|
Dec 19 | $17,318 | $16,766 | $17,585 |
|---|
Jan 20 | $16,585 | $16,745 | $16,847 |
|---|
Feb 20 | $15,456 | $15,374 | $15,704 |
|---|
Mar 20 | $14,411 | $13,251 | $14,646 |
|---|
Apr 20 | $16,409 | $15,008 | $16,681 |
|---|
May 20 | $17,295 | $15,814 | $17,588 |
|---|
Jun 20 | $16,653 | $16,179 | $16,941 |
|---|
Jul 20 | $17,669 | $17,093 | $17,979 |
|---|
Aug 20 | $17,812 | $18,321 | $18,130 |
|---|
Sep 20 | $17,511 | $17,647 | $17,832 |
|---|
Oct 20 | $17,404 | $17,271 | $17,697 |
|---|
Nov 20 | $19,540 | $19,382 | $19,910 |
|---|
Dec 20 | $20,374 | $20,251 | $20,767 |
|---|
Jan 21 | $20,810 | $20,186 | $21,218 |
|---|
Feb 21 | $20,365 | $20,832 | $20,770 |
|---|
Mar 21 | $21,852 | $21,557 | $22,295 |
|---|
Apr 21 | $22,840 | $22,664 | $23,309 |
|---|
May 21 | $23,574 | $22,767 | $24,065 |
|---|
Jun 21 | $23,183 | $23,344 | $23,674 |
|---|
Jul 21 | $23,379 | $23,746 | $23,877 |
|---|
Aug 21 | $23,354 | $24,425 | $23,858 |
|---|
Sep 21 | $22,289 | $23,316 | $22,777 |
|---|
Oct 21 | $24,294 | $24,882 | $24,835 |
|---|
Nov 21 | $22,716 | $24,516 | $23,230 |
|---|
Dec 21 | $25,339 | $25,447 | $25,923 |
|---|
Jan 22 | $23,391 | $23,919 | $23,937 |
|---|
Feb 22 | $23,881 | $23,318 | $24,447 |
|---|
Mar 22 | $24,726 | $24,073 | $25,319 |
|---|
Apr 22 | $23,264 | $21,902 | $23,829 |
|---|
May 22 | $23,058 | $21,858 | $23,626 |
|---|
Jun 22 | $22,344 | $20,020 | $22,896 |
|---|
Jul 22 | $24,203 | $21,898 | $24,810 |
|---|
Aug 22 | $23,447 | $21,071 | $24,043 |
|---|
Sep 22 | $22,407 | $19,107 | $22,984 |
|---|
Oct 22 | $24,259 | $20,666 | $24,889 |
|---|
Nov 22 | $24,500 | $21,757 | $25,139 |
|---|
Dec 22 | $23,543 | $20,478 | $24,164 |
|---|
Jan 23 | $23,530 | $21,906 | $24,160 |
|---|
Feb 23 | $22,481 | $21,398 | $23,077 |
|---|
Mar 23 | $21,804 | $21,961 | $22,389 |
|---|
Apr 23 | $22,670 | $22,182 | $23,281 |
|---|
May 23 | $21,577 | $22,278 | $22,166 |
|---|
Jun 23 | $22,547 | $23,804 | $23,171 |
|---|
Jul 23 | $23,170 | $24,662 | $23,819 |
|---|
Aug 23 | $21,856 | $24,178 | $22,473 |
|---|
Sep 23 | $21,790 | $23,021 | $22,413 |
|---|
Oct 23 | $21,968 | $22,401 | $22,605 |
|---|
Nov 23 | $22,563 | $24,503 | $23,224 |
|---|
Dec 23 | $23,294 | $25,814 | $23,984 |
|---|
Jan 24 | $23,048 | $26,099 | $23,738 |
|---|
Feb 24 | $23,479 | $27,518 | $24,189 |
|---|
Mar 24 | $24,267 | $28,407 | $25,011 |
|---|
Apr 24 | $23,034 | $27,155 | $23,747 |
|---|
May 24 | $23,383 | $28,444 | $24,114 |
|---|
Jun 24 | $23,326 | $29,327 | $24,062 |
|---|
Jul 24 | $25,085 | $29,866 | $25,886 |
|---|
Aug 24 | $25,977 | $30,506 | $26,813 |
|---|
Sep 24 | $25,463 | $31,134 | $26,290 |
|---|
Oct 24 | $23,189 | $30,912 | $23,948 |
|---|
Nov 24 | $24,340 | $32,971 | $25,146 |
|---|
Dec 24 | $21,459 | $31,977 | $22,173 |
|---|
Jan 25 | $23,595 | $32,957 | $24,389 |
|---|
Feb 25 | $22,750 | $32,335 | $23,521 |
|---|
Mar 25 | $23,666 | $30,420 | $24,478 |
|---|
Apr 25 | $22,515 | $30,211 | $23,293 |
|---|
May 25 | $21,281 | $32,146 | $22,023 |
|---|
Jun 25 | $21,829 | $33,793 | $22,598 |
|---|
Jul 25 | $18,660 | $34,564 | $19,323 |
|---|
Aug 25 | $21,178 | $35,349 | $21,938 |
|---|
Sep 25 | $22,189 | $36,570 | $22,993 |
|---|
Oct 25 | $21,794 | $37,374 | $22,590 |
|---|
Nov 25 | $22,229 | $37,433 | $23,047 |
|---|
Dec 25 | $21,655 | $37,431 | $22,460 |
|---|
Jan 26 | $20,557 | $38,014 | $21,325 |
|---|
Feb 26 | $20,845 | $37,805 | $21,630 |
|---|
Mar 26 | $18,981 | $35,939 | $19,702 |
|---|
See “Average annual total returns” for additional information on fund performance. |
|
| No Deduction of Taxes [Text Block] |
|
Performance results do not reflect the deduction of taxes that a shareholder would pay on fund distributions or on the redemption or sale of fund shares.
|
|
| AssetsNet |
|
$ 661,982,963
|
|
| Holdings Count | Holding |
|
63
|
|
| Advisory Fees Paid, Amount |
|
$ 2,653,851
|
|
| InvestmentCompanyPortfolioTurnover |
|
37.00%
|
|
| Additional Fund Statistics [Text Block] |
|
Table SummaryNet Assets........................................................................................................................................................................................................................................................................................................................................................................................................................................................................................................................................................................................................................................................................................................................................................................................................................................................................................................................................................................................................................................ | $661,982,963 |
|---|
Number of Portfolio Holdings........................................................................................................................................................................................................................................................................................................................................................................................................................................................................................................................................................................................................................................................................................................................................................................................................................................................................................................................................................................................................................................ | 63 |
|---|
Net Investment Advisory Fees........................................................................................................................................................................................................................................................................................................................................................................................................................................................................................................................................................................................................................................................................................................................................................................................................................................................................................................................................................................................................................................ | $2,653,851 |
|---|
Portfolio Turnover Rate........................................................................................................................................................................................................................................................................................................................................................................................................................................................................................................................................................................................................................................................................................................................................................................................................................................................................................................................................................................................................................................ | 37% |
|---|
|
|
| C000025769 |
|
|
|
| Shareholder Report [Line Items] |
|
|
|
| Fund Name |
|
iShares U.S. Home Construction ETF
|
|
| Trading Symbol |
|
ITB
|
|
| Security Exchange Name |
|
CboeBZX
|
|
| Annual or Semi-Annual Statement [Text Block] |
|
This annual shareholder report contains important information about iShares U.S. Home Construction ETF (the “Fund”) for the period of April 1, 2025 to March 31, 2026
|
|
| Additional Information [Text Block] |
|
You can find additional information about the Fund at blackrock.com/fundreports. You can also request this information by contacting us at 1-800-iShares (1-800-474-2737).
|
|
| Additional Information Phone Number |
|
1-800-474-2737
|
|
| Additional Information Website |
|
blackrock.com/fundreports
|
|
| Expenses [Text Block] |
|
What were the Fund costs for the last year?(based on a hypothetical $10,000 investment) Table SummaryFund name | Costs of a $10,000
investment | Costs paid as a percentage of a
$10,000 investment |
|---|
iShares U.S. Home Construction ETF | $36 | 0.37% |
|---|
|
|
| Expenses Paid, Amount |
|
$ 36
|
|
| Expense Ratio, Percent |
|
0.37%
|
|
| Performance Past Does Not Indicate Future [Text] |
|
Past performance is not an indication of future results.
|
|
| Line Graph [Table Text Block] |
|
Cumulative performance: April 1, 2016 through March 31, 2026 Initial investment of $10,000  Table Summary | Fund | S&P Total Market Index | Dow Jones U.S. Select Home Construction Index™ |
|---|
Mar 16 | $10,000 | $10,000 | $10,000 |
|---|
Apr 16 | $9,827 | $10,062 | $9,829 |
|---|
May 16 | $10,181 | $10,242 | $10,187 |
|---|
Jun 16 | $10,221 | $10,262 | $10,231 |
|---|
Jul 16 | $10,705 | $10,670 | $10,721 |
|---|
Aug 16 | $10,742 | $10,699 | $10,760 |
|---|
Sep 16 | $10,190 | $10,718 | $10,212 |
|---|
Oct 16 | $9,535 | $10,483 | $9,559 |
|---|
Nov 16 | $10,112 | $10,949 | $10,141 |
|---|
Dec 16 | $10,179 | $11,162 | $10,210 |
|---|
Jan 17 | $10,716 | $11,379 | $10,755 |
|---|
Feb 17 | $11,278 | $11,799 | $11,323 |
|---|
Mar 17 | $11,850 | $11,808 | $11,902 |
|---|
Apr 17 | $11,983 | $11,931 | $12,039 |
|---|
May 17 | $12,017 | $12,053 | $12,076 |
|---|
Jun 17 | $12,592 | $12,164 | $12,659 |
|---|
Jul 17 | $12,577 | $12,393 | $12,647 |
|---|
Aug 17 | $12,644 | $12,416 | $12,720 |
|---|
Sep 17 | $13,569 | $12,719 | $13,654 |
|---|
Oct 17 | $14,764 | $12,995 | $14,864 |
|---|
Nov 17 | $16,094 | $13,389 | $16,208 |
|---|
Dec 17 | $16,230 | $13,524 | $16,351 |
|---|
Jan 18 | $15,936 | $14,242 | $16,064 |
|---|
Feb 18 | $14,249 | $13,714 | $14,363 |
|---|
Mar 18 | $14,598 | $13,442 | $14,724 |
|---|
Apr 18 | $14,308 | $13,490 | $14,434 |
|---|
May 18 | $14,311 | $13,871 | $14,444 |
|---|
Jun 18 | $14,202 | $13,963 | $14,334 |
|---|
Jul 18 | $14,101 | $14,430 | $14,236 |
|---|
Aug 18 | $14,045 | $14,932 | $14,185 |
|---|
Sep 18 | $13,181 | $14,955 | $13,316 |
|---|
Oct 18 | $11,630 | $13,848 | $11,750 |
|---|
Nov 18 | $12,074 | $14,125 | $12,202 |
|---|
Dec 18 | $11,204 | $12,808 | $11,326 |
|---|
Jan 19 | $12,795 | $13,911 | $12,944 |
|---|
Feb 19 | $12,922 | $14,399 | $13,077 |
|---|
Mar 19 | $13,196 | $14,606 | $13,359 |
|---|
Apr 19 | $14,203 | $15,188 | $14,386 |
|---|
May 19 | $13,642 | $14,208 | $13,819 |
|---|
Jun 19 | $14,328 | $15,203 | $14,521 |
|---|
Jul 19 | $14,590 | $15,426 | $14,793 |
|---|
Aug 19 | $15,299 | $15,115 | $15,520 |
|---|
Sep 19 | $16,248 | $15,376 | $16,489 |
|---|
Oct 19 | $16,750 | $15,702 | $17,004 |
|---|
Nov 19 | $17,073 | $16,297 | $17,339 |
|---|
Dec 19 | $16,681 | $16,766 | $16,944 |
|---|
Jan 20 | $17,845 | $16,745 | $18,135 |
|---|
Feb 20 | $16,286 | $15,374 | $16,555 |
|---|
Mar 20 | $10,900 | $13,251 | $11,083 |
|---|
Apr 20 | $13,740 | $15,008 | $13,978 |
|---|
May 20 | $16,278 | $15,814 | $16,569 |
|---|
Jun 20 | $16,667 | $16,179 | $16,973 |
|---|
Jul 20 | $19,469 | $17,093 | $19,832 |
|---|
Aug 20 | $20,570 | $18,321 | $20,966 |
|---|
Sep 20 | $21,375 | $17,647 | $21,793 |
|---|
Oct 20 | $19,604 | $17,271 | $19,990 |
|---|
Nov 20 | $21,129 | $19,382 | $21,554 |
|---|
Dec 20 | $21,084 | $20,251 | $21,518 |
|---|
Jan 21 | $22,282 | $20,186 | $22,745 |
|---|
Feb 21 | $22,735 | $20,832 | $23,216 |
|---|
Mar 21 | $25,672 | $21,557 | $26,227 |
|---|
Apr 21 | $27,708 | $22,664 | $28,320 |
|---|
May 21 | $27,209 | $22,767 | $27,817 |
|---|
Jun 21 | $26,211 | $23,344 | $26,806 |
|---|
Jul 21 | $27,101 | $23,746 | $27,725 |
|---|
Aug 21 | $27,707 | $24,425 | $28,356 |
|---|
Sep 21 | $25,096 | $23,316 | $25,689 |
|---|
Oct 21 | $27,284 | $24,882 | $27,938 |
|---|
Nov 21 | $28,680 | $24,516 | $29,382 |
|---|
Dec 21 | $31,445 | $25,447 | $32,228 |
|---|
Jan 22 | $26,856 | $23,919 | $27,529 |
|---|
Feb 22 | $25,350 | $23,318 | $25,991 |
|---|
Mar 22 | $22,538 | $24,073 | $23,112 |
|---|
Apr 22 | $21,989 | $21,902 | $22,556 |
|---|
May 22 | $22,949 | $21,858 | $23,550 |
|---|
Jun 22 | $19,992 | $20,020 | $20,521 |
|---|
Jul 22 | $23,293 | $21,898 | $23,918 |
|---|
Aug 22 | $21,361 | $21,071 | $21,941 |
|---|
Sep 22 | $19,867 | $19,107 | $20,413 |
|---|
Oct 22 | $21,500 | $20,666 | $22,098 |
|---|
Nov 22 | $23,253 | $21,757 | $23,907 |
|---|
Dec 22 | $23,213 | $20,478 | $23,875 |
|---|
Jan 23 | $26,633 | $21,906 | $27,401 |
|---|
Feb 23 | $25,914 | $21,398 | $26,669 |
|---|
Mar 23 | $26,976 | $21,961 | $27,773 |
|---|
Apr 23 | $29,090 | $22,182 | $29,964 |
|---|
May 23 | $28,070 | $22,278 | $28,923 |
|---|
Jun 23 | $32,835 | $23,804 | $33,847 |
|---|
Jul 23 | $34,130 | $24,662 | $35,194 |
|---|
Aug 23 | $33,156 | $24,178 | $34,201 |
|---|
Sep 23 | $30,208 | $23,021 | $31,169 |
|---|
Oct 23 | $28,319 | $22,401 | $29,230 |
|---|
Nov 23 | $33,503 | $24,503 | $34,596 |
|---|
Dec 23 | $39,190 | $25,814 | $40,485 |
|---|
Jan 24 | $38,532 | $26,099 | $39,818 |
|---|
Feb 24 | $41,570 | $27,518 | $42,973 |
|---|
Mar 24 | $44,717 | $28,407 | $46,242 |
|---|
Apr 24 | $40,081 | $27,155 | $41,465 |
|---|
May 24 | $40,986 | $28,444 | $42,414 |
|---|
Jun 24 | $39,078 | $29,327 | $40,449 |
|---|
Jul 24 | $46,604 | $29,866 | $48,267 |
|---|
Aug 24 | $46,717 | $30,506 | $48,399 |
|---|
Sep 24 | $49,161 | $31,134 | $50,950 |
|---|
Oct 24 | $45,305 | $30,912 | $46,964 |
|---|
Nov 24 | $47,888 | $32,971 | $49,655 |
|---|
Dec 24 | $40,021 | $31,977 | $41,505 |
|---|
Jan 25 | $41,527 | $32,957 | $43,051 |
|---|
Feb 25 | $38,290 | $32,335 | $39,819 |
|---|
Mar 25 | $37,095 | $30,420 | $38,591 |
|---|
Apr 25 | $35,921 | $30,211 | $37,375 |
|---|
May 25 | $34,873 | $32,146 | $36,285 |
|---|
Jun 25 | $36,559 | $33,793 | $38,051 |
|---|
Jul 25 | $38,258 | $34,564 | $39,843 |
|---|
Aug 25 | $43,446 | $35,349 | $45,264 |
|---|
Sep 25 | $42,148 | $36,570 | $43,924 |
|---|
Oct 25 | $39,471 | $37,374 | $41,142 |
|---|
Nov 25 | $40,870 | $37,433 | $42,609 |
|---|
Dec 25 | $37,913 | $37,431 | $39,535 |
|---|
Jan 26 | $40,209 | $38,014 | $41,943 |
|---|
Feb 26 | $42,383 | $37,805 | $44,223 |
|---|
Mar 26 | $35,745 | $35,939 | $37,303 |
|---|
See “Average annual total returns” for additional information on fund performance. |
|
| No Deduction of Taxes [Text Block] |
|
Performance results do not reflect the deduction of taxes that a shareholder would pay on fund distributions or on the redemption or sale of fund shares.
|
|
| AssetsNet |
|
$ 2,392,265,647
|
|
| Holdings Count | Holding |
|
49
|
|
| Advisory Fees Paid, Amount |
|
$ 9,990,508
|
|
| InvestmentCompanyPortfolioTurnover |
|
12.00%
|
|
| Additional Fund Statistics [Text Block] |
|
Table SummaryNet Assets........................................................................................................................................................................................................................................................................................................................................................................................................................................................................................................................................................................................................................................................................................................................................................................................................................................................................................................................................................................................................................................ | $2,392,265,647 |
|---|
Number of Portfolio Holdings........................................................................................................................................................................................................................................................................................................................................................................................................................................................................................................................................................................................................................................................................................................................................................................................................................................................................................................................................................................................................................................ | 49 |
|---|
Net Investment Advisory Fees........................................................................................................................................................................................................................................................................................................................................................................................................................................................................................................................................................................................................................................................................................................................................................................................................................................................................................................................................................................................................................................ | $9,990,508 |
|---|
Portfolio Turnover Rate........................................................................................................................................................................................................................................................................................................................................................................................................................................................................................................................................................................................................................................................................................................................................................................................................................................................................................................................................................................................................................................ | 12% |
|---|
|
|
| C000198491 |
|
|
|
| Shareholder Report [Line Items] |
|
|
|
| Fund Name |
|
iShares U.S. Infrastructure ETF
|
|
| Trading Symbol |
|
IFRA
|
|
| Security Exchange Name |
|
CboeBZX
|
|
| Annual or Semi-Annual Statement [Text Block] |
|
This annual shareholder report contains important information about iShares U.S. Infrastructure ETF (the “Fund”) for the period of April 1, 2025 to March 31, 2026
|
|
| Additional Information [Text Block] |
|
You can find additional information about the Fund at blackrock.com/fundreports. You can also request this information by contacting us at 1-800-iShares (1-800-474-2737).
|
|
| Material Fund Change Notice [Text Block] |
|
This report describes changes to the Fund that occurred during the reporting period.
|
|
| Additional Information Phone Number |
|
1-800-474-2737
|
|
| Additional Information Website |
|
blackrock.com/fundreports
|
|
| Expenses [Text Block] |
|
What were the Fund costs for the last year?(based on a hypothetical $10,000 investment) Table SummaryFund name | Costs of a $10,000
investment | Costs paid as a percentage of a
$10,000 investment |
|---|
iShares U.S. Infrastructure ETF | $34 | 0.30% |
|---|
|
|
| Expenses Paid, Amount |
|
$ 34
|
|
| Expense Ratio, Percent |
|
0.30%
|
|
| Performance Past Does Not Indicate Future [Text] |
|
Past performance is not an indication of future results.
|
|
| Line Graph [Table Text Block] |
|
Cumulative performance: April 3, 2018 through March 31, 2026 Initial investment of $10,000 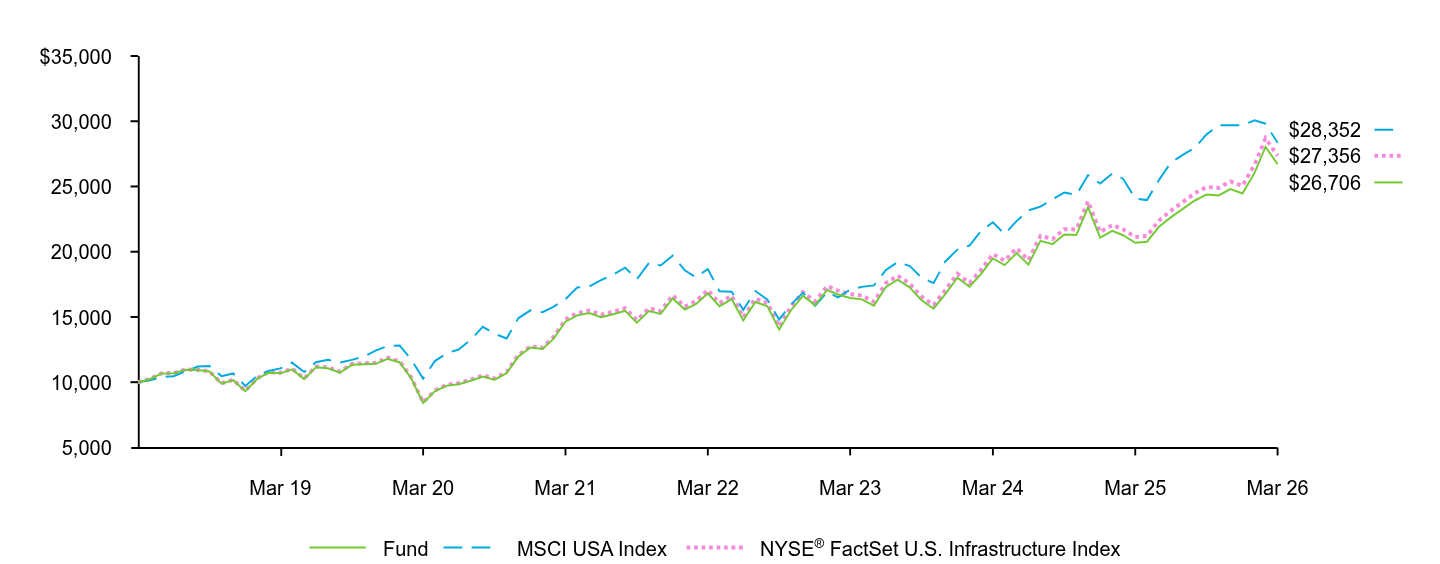 Table Summary | Fund | MSCI USA Index | NYSE® FactSet U.S. Infrastructure Index |
|---|
Mar 18 | $10,000 | $10,000 | $10,000 |
|---|
Apr 18 | $10,225 | $10,143 | $10,232 |
|---|
May 18 | $10,672 | $10,390 | $10,684 |
|---|
Jun 18 | $10,692 | $10,461 | $10,705 |
|---|
Jul 18 | $10,950 | $10,837 | $10,969 |
|---|
Aug 18 | $10,930 | $11,195 | $10,952 |
|---|
Sep 18 | $10,814 | $11,247 | $10,837 |
|---|
Oct 18 | $9,886 | $10,466 | $9,913 |
|---|
Nov 18 | $10,157 | $10,670 | $10,190 |
|---|
Dec 18 | $9,312 | $9,709 | $9,344 |
|---|
Jan 19 | $10,270 | $10,507 | $10,309 |
|---|
Feb 19 | $10,719 | $10,859 | $10,763 |
|---|
Mar 19 | $10,678 | $11,060 | $10,727 |
|---|
Apr 19 | $10,982 | $11,503 | $11,039 |
|---|
May 19 | $10,236 | $10,776 | $10,291 |
|---|
Jun 19 | $11,140 | $11,533 | $11,204 |
|---|
Jul 19 | $11,066 | $11,711 | $11,137 |
|---|
Aug 19 | $10,736 | $11,507 | $10,803 |
|---|
Sep 19 | $11,332 | $11,712 | $11,403 |
|---|
Oct 19 | $11,377 | $11,967 | $11,451 |
|---|
Nov 19 | $11,409 | $12,417 | $11,488 |
|---|
Dec 19 | $11,795 | $12,781 | $11,879 |
|---|
Jan 20 | $11,515 | $12,806 | $11,601 |
|---|
Feb 20 | $10,318 | $11,761 | $10,391 |
|---|
Mar 20 | $8,407 | $10,270 | $8,459 |
|---|
Apr 20 | $9,303 | $11,620 | $9,363 |
|---|
May 20 | $9,739 | $12,225 | $9,809 |
|---|
Jun 20 | $9,850 | $12,504 | $9,924 |
|---|
Jul 20 | $10,117 | $13,246 | $10,195 |
|---|
Aug 20 | $10,433 | $14,241 | $10,521 |
|---|
Sep 20 | $10,196 | $13,709 | $10,283 |
|---|
Oct 20 | $10,690 | $13,353 | $10,784 |
|---|
Nov 20 | $11,962 | $14,898 | $12,079 |
|---|
Dec 20 | $12,655 | $15,512 | $12,748 |
|---|
Jan 21 | $12,541 | $15,368 | $12,636 |
|---|
Feb 21 | $13,318 | $15,769 | $13,461 |
|---|
Mar 21 | $14,638 | $16,363 | $14,808 |
|---|
Apr 21 | $15,121 | $17,253 | $15,300 |
|---|
May 21 | $15,303 | $17,336 | $15,491 |
|---|
Jun 21 | $14,978 | $17,819 | $15,165 |
|---|
Jul 21 | $15,203 | $18,240 | $15,399 |
|---|
Aug 21 | $15,471 | $18,778 | $15,673 |
|---|
Sep 21 | $14,559 | $17,892 | $14,756 |
|---|
Oct 21 | $15,449 | $19,140 | $15,661 |
|---|
Nov 21 | $15,235 | $18,947 | $15,449 |
|---|
Dec 21 | $16,421 | $19,696 | $16,664 |
|---|
Jan 22 | $15,566 | $18,581 | $15,794 |
|---|
Feb 22 | $15,973 | $18,036 | $16,213 |
|---|
Mar 22 | $16,801 | $18,670 | $17,059 |
|---|
Apr 22 | $15,822 | $16,978 | $16,065 |
|---|
May 22 | $16,376 | $16,941 | $16,628 |
|---|
Jun 22 | $14,739 | $15,538 | $14,972 |
|---|
Jul 22 | $16,148 | $16,988 | $16,410 |
|---|
Aug 22 | $15,808 | $16,322 | $16,059 |
|---|
Sep 22 | $14,030 | $14,809 | $14,252 |
|---|
Oct 22 | $15,549 | $15,984 | $15,806 |
|---|
Nov 22 | $16,615 | $16,854 | $16,895 |
|---|
Dec 22 | $15,910 | $15,863 | $16,184 |
|---|
Jan 23 | $17,070 | $16,906 | $17,369 |
|---|
Feb 23 | $16,722 | $16,503 | $17,020 |
|---|
Mar 23 | $16,451 | $17,089 | $16,751 |
|---|
Apr 23 | $16,348 | $17,306 | $16,649 |
|---|
May 23 | $15,867 | $17,418 | $16,165 |
|---|
Jun 23 | $17,280 | $18,580 | $17,577 |
|---|
Jul 23 | $17,852 | $19,220 | $18,164 |
|---|
Aug 23 | $17,247 | $18,896 | $17,553 |
|---|
Sep 23 | $16,276 | $18,010 | $16,570 |
|---|
Oct 23 | $15,631 | $17,595 | $15,917 |
|---|
Nov 23 | $16,756 | $19,254 | $17,068 |
|---|
Dec 23 | $18,010 | $20,161 | $18,310 |
|---|
Jan 24 | $17,319 | $20,475 | $17,611 |
|---|
Feb 24 | $18,275 | $21,574 | $18,589 |
|---|
Mar 24 | $19,481 | $22,260 | $19,823 |
|---|
Apr 24 | $18,973 | $21,341 | $19,311 |
|---|
May 24 | $19,900 | $22,361 | $20,260 |
|---|
Jun 24 | $19,010 | $23,161 | $19,359 |
|---|
Jul 24 | $20,831 | $23,451 | $21,220 |
|---|
Aug 24 | $20,581 | $24,017 | $20,970 |
|---|
Sep 24 | $21,319 | $24,534 | $21,728 |
|---|
Oct 24 | $21,288 | $24,352 | $21,709 |
|---|
Nov 24 | $23,403 | $25,877 | $23,874 |
|---|
Dec 24 | $21,077 | $25,218 | $21,507 |
|---|
Jan 25 | $21,602 | $25,986 | $22,048 |
|---|
Feb 25 | $21,266 | $25,576 | $21,712 |
|---|
Mar 25 | $20,681 | $24,080 | $21,120 |
|---|
Apr 25 | $20,767 | $23,957 | $21,214 |
|---|
May 25 | $21,909 | $25,503 | $22,387 |
|---|
Jun 25 | $22,635 | $26,815 | $23,139 |
|---|
Jul 25 | $23,287 | $27,429 | $23,811 |
|---|
Aug 25 | $23,926 | $27,967 | $24,480 |
|---|
Sep 25 | $24,391 | $28,993 | $24,964 |
|---|
Oct 25 | $24,317 | $29,682 | $24,893 |
|---|
Nov 25 | $24,799 | $29,691 | $25,392 |
|---|
Dec 25 | $24,461 | $29,694 | $25,048 |
|---|
Jan 26 | $26,045 | $30,078 | $26,667 |
|---|
Feb 26 | $28,035 | $29,813 | $28,706 |
|---|
Mar 26 | $26,706 | $28,352 | $27,356 |
|---|
See “Average annual total returns” for additional information on fund performance. |
|
| Performance Inception Date |
|
Apr. 03, 2018
|
|
| No Deduction of Taxes [Text Block] |
|
Performance results do not reflect the deduction of taxes that a shareholder would pay on fund distributions or on the redemption or sale of fund shares.
|
|
| Material Change Date |
|
|
Mar. 31, 2025
|
| AssetsNet |
|
$ 3,702,676,300
|
|
| Holdings Count | Holding |
|
167
|
|
| Advisory Fees Paid, Amount |
|
$ 9,005,257
|
|
| InvestmentCompanyPortfolioTurnover |
|
68.00%
|
|
| Additional Fund Statistics [Text Block] |
|
Table SummaryNet Assets........................................................................................................................................................................................................................................................................................................................................................................................................................................................................................................................................................................................................................................................................................................................................................................................................................................................................................................................................................................................................................................ | $3,702,676,300 |
|---|
Number of Portfolio Holdings........................................................................................................................................................................................................................................................................................................................................................................................................................................................................................................................................................................................................................................................................................................................................................................................................................................................................................................................................................................................................................................ | 167 |
|---|
Net Investment Advisory Fees........................................................................................................................................................................................................................................................................................................................................................................................................................................................................................................................................................................................................................................................................................................................................................................................................................................................................................................................................................................................................................................ | $9,005,257 |
|---|
Portfolio Turnover Rate........................................................................................................................................................................................................................................................................................................................................................................................................................................................................................................................................................................................................................................................................................................................................................................................................................................................................................................................................................................................................................................ | 68% |
|---|
|
|
| Updated Prospectus Phone Number |
|
(1-800-474-2737)
|
|
| Updated Prospectus Web Address |
|
blackrock.com/fundreports
|
|
| C000025775 |
|
|
|
| Shareholder Report [Line Items] |
|
|
|
| Fund Name |
|
iShares U.S. Insurance ETF
|
|
| Trading Symbol |
|
IAK
|
|
| Security Exchange Name |
|
NYSEArca
|
|
| Annual or Semi-Annual Statement [Text Block] |
|
This annual shareholder report contains important information about iShares U.S. Insurance ETF (the “Fund”) for the period of April 1, 2025 to March 31, 2026
|
|
| Additional Information [Text Block] |
|
You can find additional information about the Fund at blackrock.com/fundreports. You can also request this information by contacting us at 1-800-iShares (1-800-474-2737).
|
|
| Additional Information Phone Number |
|
1-800-474-2737
|
|
| Additional Information Website |
|
blackrock.com/fundreports
|
|
| Expenses [Text Block] |
|
What were the Fund costs for the last year?(based on a hypothetical $10,000 investment) Table SummaryFund name | Costs of a $10,000
investment | Costs paid as a percentage of a
$10,000 investment |
|---|
iShares U.S. Insurance ETF | $36 | 0.37% |
|---|
|
|
| Expenses Paid, Amount |
|
$ 36
|
|
| Expense Ratio, Percent |
|
0.37%
|
|
| Performance Past Does Not Indicate Future [Text] |
|
Past performance is not an indication of future results.
|
|
| Line Graph [Table Text Block] |
|
Cumulative performance: April 1, 2016 through March 31, 2026 Initial investment of $10,000 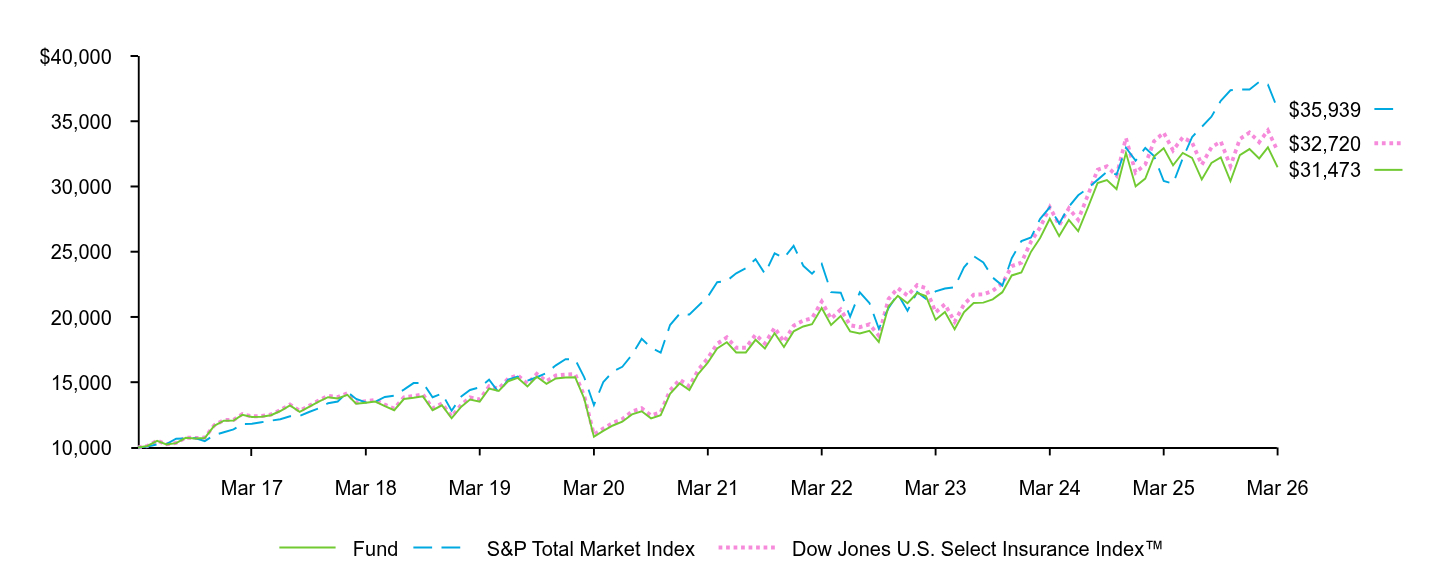 Table Summary | Fund | S&P Total Market Index | Dow Jones U.S. Select Insurance Index™ |
|---|
Mar 16 | $10,000 | $10,000 | $10,000 |
|---|
Apr 16 | $10,110 | $10,062 | $10,114 |
|---|
May 16 | $10,509 | $10,242 | $10,518 |
|---|
Jun 16 | $10,230 | $10,262 | $10,241 |
|---|
Jul 16 | $10,330 | $10,670 | $10,345 |
|---|
Aug 16 | $10,739 | $10,699 | $10,758 |
|---|
Sep 16 | $10,693 | $10,718 | $10,716 |
|---|
Oct 16 | $10,729 | $10,483 | $10,756 |
|---|
Nov 16 | $11,661 | $10,949 | $11,695 |
|---|
Dec 16 | $12,054 | $11,162 | $12,093 |
|---|
Jan 17 | $12,063 | $11,379 | $12,109 |
|---|
Feb 17 | $12,497 | $11,799 | $12,553 |
|---|
Mar 17 | $12,325 | $11,808 | $12,383 |
|---|
Apr 17 | $12,358 | $11,931 | $12,409 |
|---|
May 17 | $12,466 | $12,053 | $12,520 |
|---|
Jun 17 | $12,791 | $12,164 | $12,851 |
|---|
Jul 17 | $13,221 | $12,393 | $13,292 |
|---|
Aug 17 | $12,729 | $12,416 | $12,800 |
|---|
Sep 17 | $13,105 | $12,719 | $13,183 |
|---|
Oct 17 | $13,507 | $12,995 | $13,594 |
|---|
Nov 17 | $13,853 | $13,389 | $13,949 |
|---|
Dec 17 | $13,755 | $13,524 | $13,853 |
|---|
Jan 18 | $14,034 | $14,242 | $14,142 |
|---|
Feb 18 | $13,344 | $13,714 | $13,448 |
|---|
Mar 18 | $13,426 | $13,442 | $13,532 |
|---|
Apr 18 | $13,511 | $13,490 | $13,624 |
|---|
May 18 | $13,164 | $13,871 | $13,280 |
|---|
Jun 18 | $12,853 | $13,963 | $12,971 |
|---|
Jul 18 | $13,712 | $14,430 | $13,843 |
|---|
Aug 18 | $13,800 | $14,932 | $13,937 |
|---|
Sep 18 | $13,917 | $14,955 | $14,059 |
|---|
Oct 18 | $12,855 | $13,848 | $12,989 |
|---|
Nov 18 | $13,224 | $14,125 | $13,367 |
|---|
Dec 18 | $12,234 | $12,808 | $12,368 |
|---|
Jan 19 | $13,125 | $13,911 | $13,275 |
|---|
Feb 19 | $13,675 | $14,399 | $13,837 |
|---|
Mar 19 | $13,507 | $14,606 | $13,668 |
|---|
Apr 19 | $14,507 | $15,188 | $14,682 |
|---|
May 19 | $14,329 | $14,208 | $14,507 |
|---|
Jun 19 | $15,073 | $15,203 | $15,266 |
|---|
Jul 19 | $15,331 | $15,426 | $15,532 |
|---|
Aug 19 | $14,676 | $15,115 | $14,877 |
|---|
Sep 19 | $15,423 | $15,376 | $15,639 |
|---|
Oct 19 | $14,867 | $15,702 | $15,076 |
|---|
Nov 19 | $15,291 | $16,297 | $15,511 |
|---|
Dec 19 | $15,353 | $16,766 | $15,581 |
|---|
Jan 20 | $15,377 | $16,745 | $15,611 |
|---|
Feb 20 | $13,738 | $15,374 | $13,952 |
|---|
Mar 20 | $10,817 | $13,251 | $10,988 |
|---|
Apr 20 | $11,267 | $15,008 | $11,447 |
|---|
May 20 | $11,684 | $15,814 | $11,874 |
|---|
Jun 20 | $11,972 | $16,179 | $12,174 |
|---|
Jul 20 | $12,535 | $17,093 | $12,752 |
|---|
Aug 20 | $12,775 | $18,321 | $12,999 |
|---|
Sep 20 | $12,230 | $17,647 | $12,451 |
|---|
Oct 20 | $12,472 | $17,271 | $12,702 |
|---|
Nov 20 | $14,102 | $19,382 | $14,368 |
|---|
Dec 20 | $14,912 | $20,251 | $15,198 |
|---|
Jan 21 | $14,398 | $20,186 | $14,678 |
|---|
Feb 21 | $15,623 | $20,832 | $15,931 |
|---|
Mar 21 | $16,499 | $21,557 | $16,832 |
|---|
Apr 21 | $17,583 | $22,664 | $17,942 |
|---|
May 21 | $18,063 | $22,767 | $18,437 |
|---|
Jun 21 | $17,273 | $23,344 | $17,635 |
|---|
Jul 21 | $17,276 | $23,746 | $17,639 |
|---|
Aug 21 | $18,249 | $24,425 | $18,643 |
|---|
Sep 21 | $17,580 | $23,316 | $17,964 |
|---|
Oct 21 | $18,760 | $24,882 | $19,177 |
|---|
Nov 21 | $17,692 | $24,516 | $18,090 |
|---|
Dec 21 | $18,894 | $25,447 | $19,329 |
|---|
Jan 22 | $19,274 | $23,919 | $19,721 |
|---|
Feb 22 | $19,446 | $23,318 | $19,908 |
|---|
Mar 22 | $20,684 | $24,073 | $21,183 |
|---|
Apr 22 | $19,387 | $21,902 | $19,867 |
|---|
May 22 | $20,069 | $21,858 | $20,575 |
|---|
Jun 22 | $18,892 | $20,020 | $19,368 |
|---|
Jul 22 | $18,735 | $21,898 | $19,213 |
|---|
Aug 22 | $18,943 | $21,071 | $19,439 |
|---|
Sep 22 | $18,085 | $19,107 | $18,565 |
|---|
Oct 22 | $20,806 | $20,666 | $21,369 |
|---|
Nov 22 | $21,614 | $21,757 | $22,205 |
|---|
Dec 22 | $21,053 | $20,478 | $21,637 |
|---|
Jan 23 | $21,837 | $21,906 | $22,444 |
|---|
Feb 23 | $21,598 | $21,398 | $22,212 |
|---|
Mar 23 | $19,784 | $21,961 | $20,353 |
|---|
Apr 23 | $20,381 | $22,182 | $20,975 |
|---|
May 23 | $19,064 | $22,278 | $19,624 |
|---|
Jun 23 | $20,362 | $23,804 | $20,966 |
|---|
Jul 23 | $21,069 | $24,662 | $21,698 |
|---|
Aug 23 | $21,098 | $24,178 | $21,735 |
|---|
Sep 23 | $21,350 | $23,021 | $22,001 |
|---|
Oct 23 | $21,898 | $22,401 | $22,565 |
|---|
Nov 23 | $23,180 | $24,503 | $23,895 |
|---|
Dec 23 | $23,416 | $25,814 | $24,160 |
|---|
Jan 24 | $25,003 | $26,099 | $25,789 |
|---|
Feb 24 | $26,052 | $27,518 | $26,861 |
|---|
Mar 24 | $27,534 | $28,407 | $28,415 |
|---|
Apr 24 | $26,193 | $27,155 | $27,033 |
|---|
May 24 | $27,435 | $28,444 | $28,329 |
|---|
Jun 24 | $26,572 | $29,327 | $27,449 |
|---|
Jul 24 | $28,386 | $29,866 | $29,330 |
|---|
Aug 24 | $30,259 | $30,506 | $31,275 |
|---|
Sep 24 | $30,492 | $31,134 | $31,540 |
|---|
Oct 24 | $29,801 | $30,912 | $30,830 |
|---|
Nov 24 | $32,583 | $32,971 | $33,716 |
|---|
Dec 24 | $30,015 | $31,977 | $31,068 |
|---|
Jan 25 | $30,608 | $32,957 | $31,689 |
|---|
Feb 25 | $32,308 | $32,335 | $33,461 |
|---|
Mar 25 | $32,931 | $30,420 | $34,122 |
|---|
Apr 25 | $31,621 | $30,211 | $32,768 |
|---|
May 25 | $32,571 | $32,146 | $33,761 |
|---|
Jun 25 | $32,190 | $33,793 | $33,373 |
|---|
Jul 25 | $30,535 | $34,564 | $31,667 |
|---|
Aug 25 | $31,807 | $35,349 | $32,997 |
|---|
Sep 25 | $32,229 | $36,570 | $33,446 |
|---|
Oct 25 | $30,405 | $37,374 | $31,560 |
|---|
Nov 25 | $32,395 | $37,433 | $33,637 |
|---|
Dec 25 | $32,870 | $37,431 | $34,139 |
|---|
Jan 26 | $32,149 | $38,014 | $33,395 |
|---|
Feb 26 | $33,002 | $37,805 | $34,298 |
|---|
Mar 26 | $31,473 | $35,939 | $32,720 |
|---|
See “Average annual total returns” for additional information on fund performance. |
|
| No Deduction of Taxes [Text Block] |
|
Performance results do not reflect the deduction of taxes that a shareholder would pay on fund distributions or on the redemption or sale of fund shares.
|
|
| AssetsNet |
|
$ 372,072,861
|
|
| Holdings Count | Holding |
|
60
|
|
| Advisory Fees Paid, Amount |
|
$ 2,356,639
|
|
| InvestmentCompanyPortfolioTurnover |
|
5.00%
|
|
| Additional Fund Statistics [Text Block] |
|
Table SummaryNet Assets........................................................................................................................................................................................................................................................................................................................................................................................................................................................................................................................................................................................................................................................................................................................................................................................................................................................................................................................................................................................................................................ | $372,072,861 |
|---|
Number of Portfolio Holdings........................................................................................................................................................................................................................................................................................................................................................................................................................................................................................................................................................................................................................................................................................................................................................................................................................................................................................................................................................................................................................................ | 60 |
|---|
Net Investment Advisory Fees........................................................................................................................................................................................................................................................................................................................................................................................................................................................................................................................................................................................................................................................................................................................................................................................................................................................................................................................................................................................................................................ | $2,356,639 |
|---|
Portfolio Turnover Rate........................................................................................................................................................................................................................................................................................................................................................................................................................................................................................................................................................................................................................................................................................................................................................................................................................................................................................................................................................................................................................................ | 5% |
|---|
|
|
| C000251033 |
|
|
|
| Shareholder Report [Line Items] |
|
|
|
| Fund Name |
|
iShares U.S. Manufacturing ETF
|
|
| Trading Symbol |
|
MADE
|
|
| Security Exchange Name |
|
NYSEArca
|
|
| Annual or Semi-Annual Statement [Text Block] |
|
This annual shareholder report contains important information about iShares U.S. Manufacturing ETF (the “Fund”) for the period of April 1, 2025 to March 31, 2026
|
|
| Additional Information [Text Block] |
|
You can find additional information about the Fund at blackrock.com/fundreports. You can also request this information by contacting us at 1-800-iShares (1-800-474-2737).
|
|
| Additional Information Phone Number |
|
1-800-474-2737
|
|
| Additional Information Website |
|
blackrock.com/fundreports
|
|
| Expenses [Text Block] |
|
What were the Fund costs for the last year?(based on a hypothetical $10,000 investment) Table SummaryFund name | Costs of a $10,000
investment | Costs paid as a percentage of a
$10,000 investment |
|---|
iShares U.S. Manufacturing ETF | $49 | 0.40% |
|---|
|
|
| Expenses Paid, Amount |
|
$ 49
|
|
| Expense Ratio, Percent |
|
0.40%
|
|
| Performance Past Does Not Indicate Future [Text] |
|
Past performance is not an indication of future results.
|
|
| Line Graph [Table Text Block] |
|
Cumulative performance: July 17, 2024 through March 31, 2026 Initial investment of $10,000 Table Summary | Fund | S&P Total Market Index | S&P U.S. Manufacturing Select Index |
|---|
Jun 24 | $10,000 | $10,000 | $10,000 |
|---|
Jul 24 | $9,841 | $9,906 | $9,843 |
|---|
Aug 24 | $10,039 | $10,118 | $10,045 |
|---|
Sep 24 | $10,192 | $10,326 | $10,202 |
|---|
Oct 24 | $10,043 | $10,253 | $10,055 |
|---|
Nov 24 | $10,965 | $10,936 | $10,980 |
|---|
Dec 24 | $10,155 | $10,606 | $10,172 |
|---|
Jan 25 | $10,431 | $10,931 | $10,453 |
|---|
Feb 25 | $10,074 | $10,725 | $10,099 |
|---|
Mar 25 | $9,536 | $10,089 | $9,562 |
|---|
Apr 25 | $9,531 | $10,020 | $9,560 |
|---|
May 25 | $10,476 | $10,662 | $10,513 |
|---|
Jun 25 | $10,961 | $11,208 | $11,004 |
|---|
Jul 25 | $11,536 | $11,464 | $11,586 |
|---|
Aug 25 | $11,710 | $11,724 | $11,764 |
|---|
Sep 25 | $12,092 | $12,129 | $12,151 |
|---|
Oct 25 | $12,721 | $12,396 | $12,788 |
|---|
Nov 25 | $12,742 | $12,415 | $12,814 |
|---|
Dec 25 | $12,913 | $12,415 | $12,991 |
|---|
Jan 26 | $14,152 | $12,608 | $14,243 |
|---|
Feb 26 | $15,072 | $12,539 | $15,174 |
|---|
Mar 26 | $13,817 | $11,920 | $13,915 |
|---|
See “Average annual total returns” for additional information on fund performance. |
|
| No Deduction of Taxes [Text Block] |
|
Performance results do not reflect the deduction of taxes that a shareholder would pay on fund distributions or on the redemption or sale of fund shares.
|
|
| AssetsNet |
|
$ 47,990,519
|
|
| Holdings Count | Holding |
|
114
|
|
| Advisory Fees Paid, Amount |
|
$ 107,435
|
|
| InvestmentCompanyPortfolioTurnover |
|
22.00%
|
|
| Additional Fund Statistics [Text Block] |
|
Table SummaryNet Assets........................................................................................................................................................................................................................................................................................................................................................................................................................................................................................................................................................................................................................................................................................................................................................................................................................................................................................................................................................................................................................................ | $47,990,519 |
|---|
Number of Portfolio Holdings........................................................................................................................................................................................................................................................................................................................................................................................................................................................................................................................................................................................................................................................................................................................................................................................................................................................................................................................................................................................................................................ | 114 |
|---|
Net Investment Advisory Fees........................................................................................................................................................................................................................................................................................................................................................................................................................................................................................................................................................................................................................................................................................................................................................................................................................................................................................................................................................................................................................................ | $107,435 |
|---|
Portfolio Turnover Rate........................................................................................................................................................................................................................................................................................................................................................................................................................................................................................................................................................................................................................................................................................................................................................................................................................................................................................................................................................................................................................................ | 22% |
|---|
|
|
| C000025773 |
|
|
|
| Shareholder Report [Line Items] |
|
|
|
| Fund Name |
|
iShares U.S. Medical Devices ETF
|
|
| Trading Symbol |
|
IHI
|
|
| Security Exchange Name |
|
NYSEArca
|
|
| Annual or Semi-Annual Statement [Text Block] |
|
This annual shareholder report contains important information about iShares U.S. Medical Devices ETF (the “Fund”) for the period of April 1, 2025 to March 31, 2026
|
|
| Additional Information [Text Block] |
|
You can find additional information about the Fund at blackrock.com/fundreports. You can also request this information by contacting us at 1-800-iShares (1-800-474-2737).
|
|
| Additional Information Phone Number |
|
1-800-474-2737
|
|
| Additional Information Website |
|
blackrock.com/fundreports
|
|
| Expenses [Text Block] |
|
What were the Fund costs for the last year?(based on a hypothetical $10,000 investment) Table SummaryFund name | Costs of a $10,000
investment | Costs paid as a percentage of a
$10,000 investment |
|---|
iShares U.S. Medical Devices ETF | $35 | 0.37% |
|---|
|
|
| Expenses Paid, Amount |
|
$ 35
|
|
| Expense Ratio, Percent |
|
0.37%
|
|
| Performance Past Does Not Indicate Future [Text] |
|
Past performance is not an indication of future results.
|
|
| Line Graph [Table Text Block] |
|
Cumulative performance: April 1, 2016 through March 31, 2026 Initial investment of $10,000 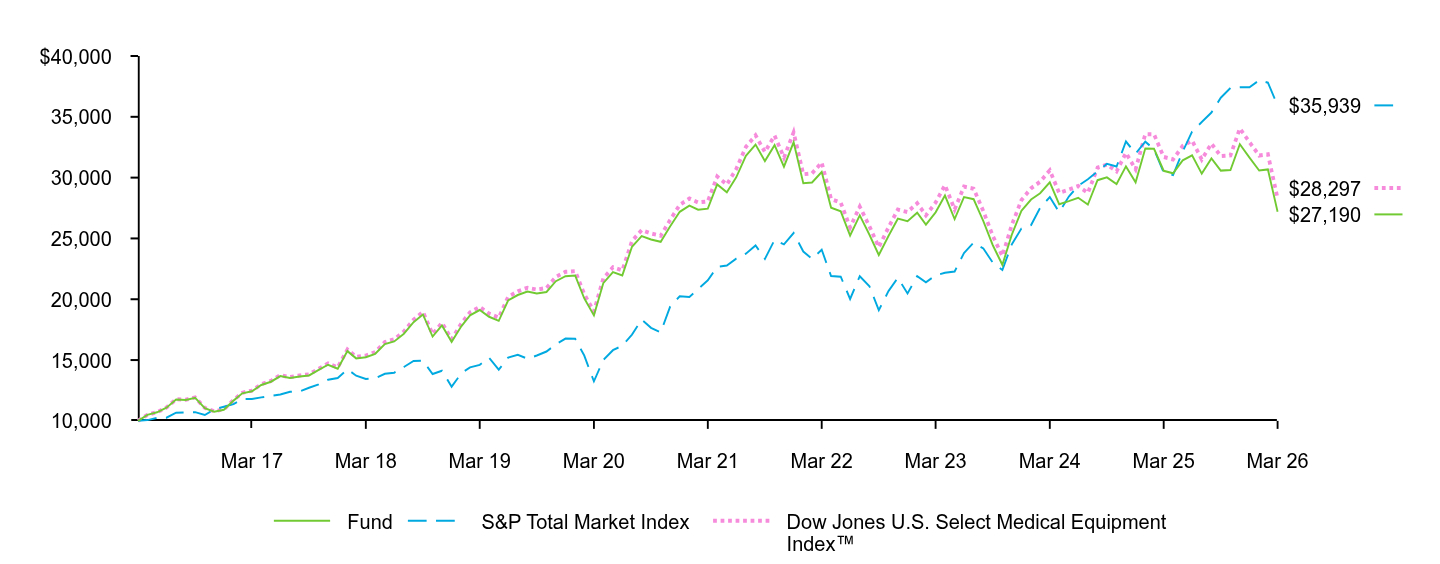 Table Summary | Fund | S&P Total Market Index | Dow Jones U.S. Select Medical Equipment Index™ |
|---|
Mar 16 | $10,000 | $10,000 | $10,000 |
|---|
Apr 16 | $10,494 | $10,062 | $10,499 |
|---|
May 16 | $10,704 | $10,242 | $10,711 |
|---|
Jun 16 | $11,083 | $10,262 | $11,095 |
|---|
Jul 16 | $11,760 | $10,670 | $11,777 |
|---|
Aug 16 | $11,716 | $10,699 | $11,738 |
|---|
Sep 16 | $11,897 | $10,718 | $11,924 |
|---|
Oct 16 | $11,040 | $10,483 | $11,068 |
|---|
Nov 16 | $10,760 | $10,949 | $10,790 |
|---|
Dec 16 | $10,913 | $11,162 | $10,948 |
|---|
Jan 17 | $11,666 | $11,379 | $11,708 |
|---|
Feb 17 | $12,266 | $11,799 | $12,313 |
|---|
Mar 17 | $12,436 | $11,808 | $12,489 |
|---|
Apr 17 | $12,949 | $11,931 | $13,010 |
|---|
May 17 | $13,217 | $12,053 | $13,284 |
|---|
Jun 17 | $13,680 | $12,164 | $13,755 |
|---|
Jul 17 | $13,518 | $12,393 | $13,597 |
|---|
Aug 17 | $13,647 | $12,416 | $13,731 |
|---|
Sep 17 | $13,732 | $12,719 | $13,822 |
|---|
Oct 17 | $14,184 | $12,995 | $14,283 |
|---|
Nov 17 | $14,616 | $13,389 | $14,723 |
|---|
Dec 17 | $14,289 | $13,524 | $14,398 |
|---|
Jan 18 | $15,737 | $14,242 | $15,865 |
|---|
Feb 18 | $15,136 | $13,714 | $15,263 |
|---|
Mar 18 | $15,231 | $13,442 | $15,365 |
|---|
Apr 18 | $15,512 | $13,490 | $15,654 |
|---|
May 18 | $16,313 | $13,871 | $16,478 |
|---|
Jun 18 | $16,530 | $13,963 | $16,704 |
|---|
Jul 18 | $17,162 | $14,430 | $17,349 |
|---|
Aug 18 | $18,114 | $14,932 | $18,318 |
|---|
Sep 18 | $18,751 | $14,955 | $18,966 |
|---|
Oct 18 | $16,931 | $13,848 | $17,132 |
|---|
Nov 18 | $17,851 | $14,125 | $18,067 |
|---|
Dec 18 | $16,499 | $12,808 | $16,704 |
|---|
Jan 19 | $17,780 | $13,911 | $18,008 |
|---|
Feb 19 | $18,677 | $14,399 | $18,924 |
|---|
Mar 19 | $19,114 | $14,606 | $19,374 |
|---|
Apr 19 | $18,561 | $15,188 | $18,818 |
|---|
May 19 | $18,226 | $14,208 | $18,485 |
|---|
Jun 19 | $19,900 | $15,203 | $20,190 |
|---|
Jul 19 | $20,348 | $15,426 | $20,653 |
|---|
Aug 19 | $20,628 | $15,115 | $20,945 |
|---|
Sep 19 | $20,472 | $15,376 | $20,794 |
|---|
Oct 19 | $20,592 | $15,702 | $20,922 |
|---|
Nov 19 | $21,484 | $16,297 | $21,834 |
|---|
Dec 19 | $21,897 | $16,766 | $22,259 |
|---|
Jan 20 | $21,944 | $16,745 | $22,315 |
|---|
Feb 20 | $20,071 | $15,374 | $20,417 |
|---|
Mar 20 | $18,671 | $13,251 | $18,999 |
|---|
Apr 20 | $21,324 | $15,008 | $21,706 |
|---|
May 20 | $22,231 | $15,814 | $22,635 |
|---|
Jun 20 | $21,958 | $16,179 | $22,365 |
|---|
Jul 20 | $24,318 | $17,093 | $24,782 |
|---|
Aug 20 | $25,198 | $18,321 | $25,687 |
|---|
Sep 20 | $24,919 | $17,647 | $25,412 |
|---|
Oct 20 | $24,724 | $17,271 | $25,223 |
|---|
Nov 20 | $25,980 | $19,382 | $26,510 |
|---|
Dec 20 | $27,191 | $20,251 | $27,755 |
|---|
Jan 21 | $27,699 | $20,186 | $28,285 |
|---|
Feb 21 | $27,369 | $20,832 | $27,956 |
|---|
Mar 21 | $27,450 | $21,557 | $28,047 |
|---|
Apr 21 | $29,439 | $22,664 | $30,091 |
|---|
May 21 | $28,786 | $22,767 | $29,429 |
|---|
Jun 21 | $30,021 | $23,344 | $30,702 |
|---|
Jul 21 | $31,790 | $23,746 | $32,522 |
|---|
Aug 21 | $32,719 | $24,425 | $33,482 |
|---|
Sep 21 | $31,365 | $23,316 | $32,107 |
|---|
Oct 21 | $32,673 | $24,882 | $33,460 |
|---|
Nov 21 | $30,895 | $24,516 | $31,646 |
|---|
Dec 21 | $32,908 | $25,447 | $33,722 |
|---|
Jan 22 | $29,539 | $23,919 | $30,277 |
|---|
Feb 22 | $29,601 | $23,318 | $30,350 |
|---|
Mar 22 | $30,466 | $24,073 | $31,246 |
|---|
Apr 22 | $27,534 | $21,902 | $28,246 |
|---|
May 22 | $27,225 | $21,858 | $27,938 |
|---|
Jun 22 | $25,239 | $20,020 | $25,907 |
|---|
Jul 22 | $26,901 | $21,898 | $27,620 |
|---|
Aug 22 | $25,301 | $21,071 | $25,986 |
|---|
Sep 22 | $23,640 | $19,107 | $24,288 |
|---|
Oct 22 | $25,201 | $20,666 | $25,899 |
|---|
Nov 22 | $26,627 | $21,757 | $27,372 |
|---|
Dec 22 | $26,418 | $20,478 | $27,168 |
|---|
Jan 23 | $27,117 | $21,906 | $27,896 |
|---|
Feb 23 | $26,139 | $21,398 | $26,898 |
|---|
Mar 23 | $27,149 | $21,961 | $27,946 |
|---|
Apr 23 | $28,532 | $22,182 | $29,381 |
|---|
May 23 | $26,589 | $22,278 | $27,387 |
|---|
Jun 23 | $28,396 | $23,804 | $29,260 |
|---|
Jul 23 | $28,225 | $24,662 | $29,092 |
|---|
Aug 23 | $26,428 | $24,178 | $27,246 |
|---|
Sep 23 | $24,461 | $23,021 | $25,224 |
|---|
Oct 23 | $22,830 | $22,401 | $23,548 |
|---|
Nov 23 | $25,291 | $24,503 | $26,096 |
|---|
Dec 23 | $27,267 | $25,814 | $28,146 |
|---|
Jan 24 | $28,204 | $26,099 | $29,124 |
|---|
Feb 24 | $28,717 | $27,518 | $29,661 |
|---|
Mar 24 | $29,618 | $28,407 | $30,601 |
|---|
Apr 24 | $27,810 | $27,155 | $28,742 |
|---|
May 24 | $28,070 | $28,444 | $29,019 |
|---|
Jun 24 | $28,342 | $29,327 | $29,306 |
|---|
Jul 24 | $27,786 | $29,866 | $28,739 |
|---|
Aug 24 | $29,788 | $30,506 | $30,820 |
|---|
Sep 24 | $30,021 | $31,134 | $31,071 |
|---|
Oct 24 | $29,474 | $30,912 | $30,517 |
|---|
Nov 24 | $30,927 | $32,971 | $32,032 |
|---|
Dec 24 | $29,615 | $31,977 | $30,684 |
|---|
Jan 25 | $32,394 | $32,957 | $33,576 |
|---|
Feb 25 | $32,369 | $32,335 | $33,560 |
|---|
Mar 25 | $30,563 | $30,420 | $31,696 |
|---|
Apr 25 | $30,359 | $30,211 | $31,495 |
|---|
May 25 | $31,422 | $32,146 | $32,612 |
|---|
Jun 25 | $31,832 | $33,793 | $33,048 |
|---|
Jul 25 | $30,324 | $34,564 | $31,491 |
|---|
Aug 25 | $31,577 | $35,349 | $32,802 |
|---|
Sep 25 | $30,577 | $36,570 | $31,771 |
|---|
Oct 25 | $30,620 | $37,374 | $31,824 |
|---|
Nov 25 | $32,747 | $37,433 | $34,045 |
|---|
Dec 25 | $31,652 | $37,431 | $32,916 |
|---|
Jan 26 | $30,585 | $38,014 | $31,815 |
|---|
Feb 26 | $30,677 | $37,805 | $31,917 |
|---|
Mar 26 | $27,190 | $35,939 | $28,297 |
|---|
See “Average annual total returns” for additional information on fund performance. |
|
| No Deduction of Taxes [Text Block] |
|
Performance results do not reflect the deduction of taxes that a shareholder would pay on fund distributions or on the redemption or sale of fund shares.
|
|
| AssetsNet |
|
$ 3,195,557,172
|
|
| Holdings Count | Holding |
|
51
|
|
| Advisory Fees Paid, Amount |
|
$ 15,532,253
|
|
| InvestmentCompanyPortfolioTurnover |
|
12.00%
|
|
| Additional Fund Statistics [Text Block] |
|
Table SummaryNet Assets........................................................................................................................................................................................................................................................................................................................................................................................................................................................................................................................................................................................................................................................................................................................................................................................................................................................................................................................................................................................................................................ | $3,195,557,172 |
|---|
Number of Portfolio Holdings........................................................................................................................................................................................................................................................................................................................................................................................................................................................................................................................................................................................................................................................................................................................................................................................................................................................................................................................................................................................................................................ | 51 |
|---|
Net Investment Advisory Fees........................................................................................................................................................................................................................................................................................................................................................................................................................................................................................................................................................................................................................................................................................................................................................................................................................................................................................................................................................................................................................................ | $15,532,253 |
|---|
Portfolio Turnover Rate........................................................................................................................................................................................................................................................................................................................................................................................................................................................................................................................................................................................................................................................................................................................................................................................................................................................................................................................................................................................................................................ | 12% |
|---|
|
|
| C000025768 |
|
|
|
| Shareholder Report [Line Items] |
|
|
|
| Fund Name |
|
iShares U.S. Oil & Gas Exploration & Production ETF
|
|
| Trading Symbol |
|
IEO
|
|
| Security Exchange Name |
|
CboeBZX
|
|
| Annual or Semi-Annual Statement [Text Block] |
|
This annual shareholder report contains important information about iShares U.S. Oil & Gas Exploration & Production ETF (the “Fund”) for the period of April 1, 2025 to March 31, 2026
|
|
| Additional Information [Text Block] |
|
You can find additional information about the Fund at blackrock.com/fundreports. You can also request this information by contacting us at 1-800-iShares (1-800-474-2737).
|
|
| Additional Information Phone Number |
|
1-800-474-2737
|
|
| Additional Information Website |
|
blackrock.com/fundreports
|
|
| Expenses [Text Block] |
|
What were the Fund costs for the last year?(based on a hypothetical $10,000 investment) Table SummaryFund name | Costs of a $10,000
investment | Costs paid as a percentage of a
$10,000 investment |
|---|
iShares U.S. Oil & Gas Exploration & Production ETF | $44 | 0.37% |
|---|
|
|
| Expenses Paid, Amount |
|
$ 44
|
|
| Expense Ratio, Percent |
|
0.37%
|
|
| Performance Past Does Not Indicate Future [Text] |
|
Past performance is not an indication of future results.
|
|
| Line Graph [Table Text Block] |
|
Cumulative performance: April 1, 2016 through March 31, 2026 Initial investment of $10,000 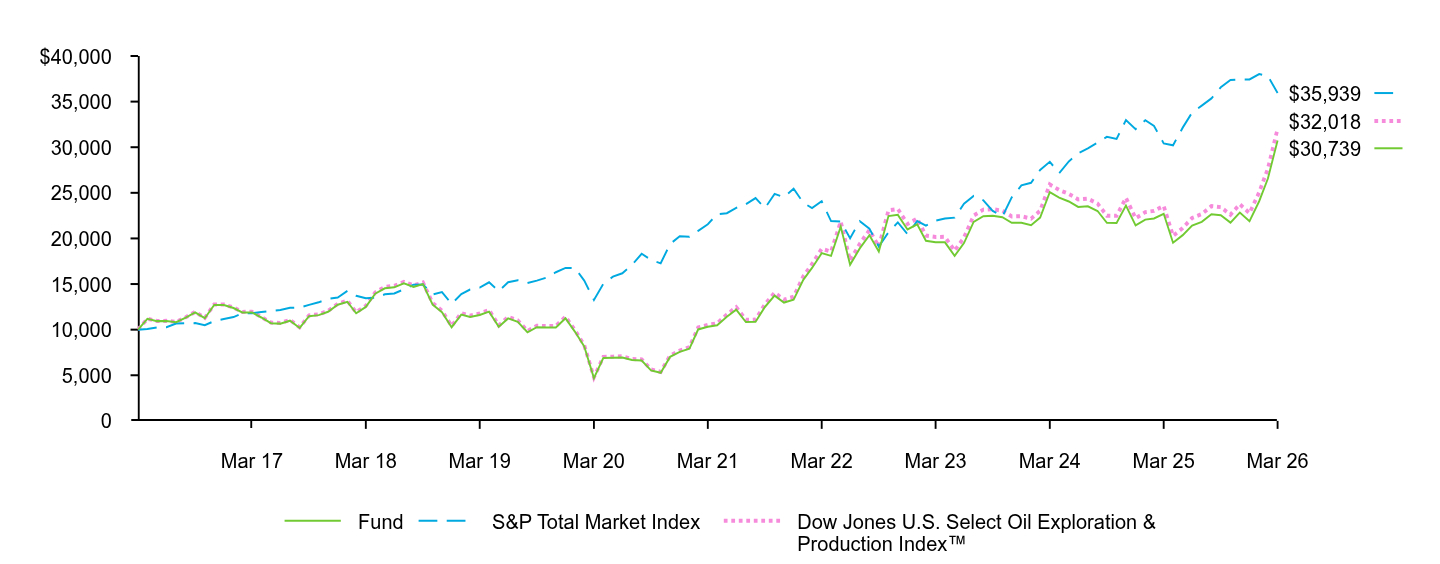 Table Summary | Fund | S&P Total Market Index | Dow Jones U.S. Select Oil Exploration & Production Index™ |
|---|
Mar 16 | $10,000 | $10,000 | $10,000 |
|---|
Apr 16 | $11,191 | $10,062 | $11,196 |
|---|
May 16 | $10,935 | $10,242 | $10,947 |
|---|
Jun 16 | $10,949 | $10,262 | $10,967 |
|---|
Jul 16 | $10,819 | $10,670 | $10,844 |
|---|
Aug 16 | $11,325 | $10,699 | $11,357 |
|---|
Sep 16 | $11,903 | $10,718 | $11,940 |
|---|
Oct 16 | $11,251 | $10,483 | $11,290 |
|---|
Nov 16 | $12,710 | $10,949 | $12,762 |
|---|
Dec 16 | $12,694 | $11,162 | $12,750 |
|---|
Jan 17 | $12,372 | $11,379 | $12,431 |
|---|
Feb 17 | $11,889 | $11,799 | $11,948 |
|---|
Mar 17 | $11,888 | $11,808 | $11,952 |
|---|
Apr 17 | $11,334 | $11,931 | $11,396 |
|---|
May 17 | $10,710 | $12,053 | $10,772 |
|---|
Jun 17 | $10,661 | $12,164 | $10,731 |
|---|
Jul 17 | $10,985 | $12,393 | $11,061 |
|---|
Aug 17 | $10,187 | $12,416 | $10,259 |
|---|
Sep 17 | $11,481 | $12,719 | $11,566 |
|---|
Oct 17 | $11,592 | $12,995 | $11,683 |
|---|
Nov 17 | $11,964 | $13,389 | $12,061 |
|---|
Dec 17 | $12,732 | $13,524 | $12,839 |
|---|
Jan 18 | $13,055 | $14,242 | $13,171 |
|---|
Feb 18 | $11,795 | $13,714 | $11,903 |
|---|
Mar 18 | $12,493 | $13,442 | $12,612 |
|---|
Apr 18 | $13,940 | $13,490 | $14,078 |
|---|
May 18 | $14,535 | $13,871 | $14,685 |
|---|
Jun 18 | $14,642 | $13,963 | $14,797 |
|---|
Jul 18 | $15,075 | $14,430 | $15,241 |
|---|
Aug 18 | $14,685 | $14,932 | $14,851 |
|---|
Sep 18 | $14,995 | $14,955 | $15,169 |
|---|
Oct 18 | $12,760 | $13,848 | $12,921 |
|---|
Nov 18 | $11,922 | $14,125 | $12,075 |
|---|
Dec 18 | $10,266 | $12,808 | $10,399 |
|---|
Jan 19 | $11,655 | $13,911 | $11,811 |
|---|
Feb 19 | $11,381 | $14,399 | $11,534 |
|---|
Mar 19 | $11,611 | $14,606 | $11,772 |
|---|
Apr 19 | $11,982 | $15,188 | $12,154 |
|---|
May 19 | $10,318 | $14,208 | $10,463 |
|---|
Jun 19 | $11,235 | $15,203 | $11,397 |
|---|
Jul 19 | $10,850 | $15,426 | $11,012 |
|---|
Aug 19 | $9,710 | $15,115 | $9,855 |
|---|
Sep 19 | $10,268 | $15,376 | $10,426 |
|---|
Oct 19 | $10,232 | $15,702 | $10,392 |
|---|
Nov 19 | $10,236 | $16,297 | $10,398 |
|---|
Dec 19 | $11,247 | $16,766 | $11,430 |
|---|
Jan 20 | $9,738 | $16,745 | $9,900 |
|---|
Feb 20 | $8,158 | $15,374 | $8,296 |
|---|
Mar 20 | $4,685 | $13,251 | $4,762 |
|---|
Apr 20 | $6,895 | $15,008 | $7,014 |
|---|
May 20 | $6,921 | $15,814 | $7,042 |
|---|
Jun 20 | $6,952 | $16,179 | $7,076 |
|---|
Jul 20 | $6,665 | $17,093 | $6,787 |
|---|
Aug 20 | $6,616 | $18,321 | $6,739 |
|---|
Sep 20 | $5,537 | $17,647 | $5,643 |
|---|
Oct 20 | $5,273 | $17,271 | $5,374 |
|---|
Nov 20 | $7,013 | $19,382 | $7,151 |
|---|
Dec 20 | $7,563 | $20,251 | $7,715 |
|---|
Jan 21 | $7,922 | $20,186 | $8,084 |
|---|
Feb 21 | $10,022 | $20,832 | $10,231 |
|---|
Mar 21 | $10,309 | $21,557 | $10,529 |
|---|
Apr 21 | $10,476 | $22,664 | $10,702 |
|---|
May 21 | $11,409 | $22,767 | $11,661 |
|---|
Jun 21 | $12,195 | $23,344 | $12,470 |
|---|
Jul 21 | $10,829 | $23,746 | $11,075 |
|---|
Aug 21 | $10,853 | $24,425 | $11,104 |
|---|
Sep 21 | $12,486 | $23,316 | $12,781 |
|---|
Oct 21 | $13,728 | $24,882 | $14,057 |
|---|
Nov 21 | $12,970 | $24,516 | $13,285 |
|---|
Dec 21 | $13,280 | $25,447 | $13,609 |
|---|
Jan 22 | $15,454 | $23,919 | $15,841 |
|---|
Feb 22 | $16,763 | $23,318 | $17,189 |
|---|
Mar 22 | $18,395 | $24,073 | $18,868 |
|---|
Apr 22 | $18,086 | $21,902 | $18,558 |
|---|
May 22 | $21,302 | $21,858 | $21,867 |
|---|
Jun 22 | $17,110 | $20,020 | $17,566 |
|---|
Jul 22 | $18,904 | $21,898 | $19,414 |
|---|
Aug 22 | $20,359 | $21,071 | $20,920 |
|---|
Sep 22 | $18,573 | $19,107 | $19,091 |
|---|
Oct 22 | $22,451 | $20,666 | $23,084 |
|---|
Nov 22 | $22,589 | $21,757 | $23,234 |
|---|
Dec 22 | $20,981 | $20,478 | $21,584 |
|---|
Jan 23 | $21,549 | $21,906 | $22,176 |
|---|
Feb 23 | $19,739 | $21,398 | $20,318 |
|---|
Mar 23 | $19,573 | $21,961 | $20,162 |
|---|
Apr 23 | $19,579 | $22,182 | $20,173 |
|---|
May 23 | $18,090 | $22,278 | $18,646 |
|---|
Jun 23 | $19,490 | $23,804 | $20,098 |
|---|
Jul 23 | $21,817 | $24,662 | $22,506 |
|---|
Aug 23 | $22,443 | $24,178 | $23,160 |
|---|
Sep 23 | $22,486 | $23,021 | $23,203 |
|---|
Oct 23 | $22,325 | $22,401 | $23,045 |
|---|
Nov 23 | $21,707 | $24,503 | $22,412 |
|---|
Dec 23 | $21,719 | $25,814 | $22,432 |
|---|
Jan 24 | $21,453 | $26,099 | $22,164 |
|---|
Feb 24 | $22,288 | $27,518 | $23,035 |
|---|
Mar 24 | $25,073 | $28,407 | $25,922 |
|---|
Apr 24 | $24,472 | $27,155 | $25,308 |
|---|
May 24 | $24,054 | $28,444 | $24,885 |
|---|
Jun 24 | $23,459 | $29,327 | $24,275 |
|---|
Jul 24 | $23,529 | $29,866 | $24,356 |
|---|
Aug 24 | $23,011 | $30,506 | $23,828 |
|---|
Sep 24 | $21,712 | $31,134 | $22,489 |
|---|
Oct 24 | $21,694 | $30,912 | $22,476 |
|---|
Nov 24 | $23,604 | $32,971 | $24,463 |
|---|
Dec 24 | $21,420 | $31,977 | $22,206 |
|---|
Jan 25 | $22,063 | $32,957 | $22,883 |
|---|
Feb 25 | $22,191 | $32,335 | $23,021 |
|---|
Mar 25 | $22,707 | $30,420 | $23,563 |
|---|
Apr 25 | $19,530 | $30,211 | $20,273 |
|---|
May 25 | $20,364 | $32,146 | $21,146 |
|---|
Jun 25 | $21,411 | $33,793 | $22,240 |
|---|
Jul 25 | $21,821 | $34,564 | $22,673 |
|---|
Aug 25 | $22,649 | $35,349 | $23,541 |
|---|
Sep 25 | $22,536 | $36,570 | $23,432 |
|---|
Oct 25 | $21,730 | $37,374 | $22,600 |
|---|
Nov 25 | $22,834 | $37,433 | $23,758 |
|---|
Dec 25 | $21,879 | $37,431 | $22,769 |
|---|
Jan 26 | $24,081 | $38,014 | $25,063 |
|---|
Feb 26 | $26,569 | $37,805 | $27,662 |
|---|
Mar 26 | $30,739 | $35,939 | $32,018 |
|---|
See “Average annual total returns” for additional information on fund performance. |
|
| No Deduction of Taxes [Text Block] |
|
Performance results do not reflect the deduction of taxes that a shareholder would pay on fund distributions or on the redemption or sale of fund shares.
|
|
| AssetsNet |
|
$ 655,465,993
|
|
| Holdings Count | Holding |
|
49
|
|
| Advisory Fees Paid, Amount |
|
$ 1,766,558
|
|
| InvestmentCompanyPortfolioTurnover |
|
24.00%
|
|
| Additional Fund Statistics [Text Block] |
|
Table SummaryNet Assets........................................................................................................................................................................................................................................................................................................................................................................................................................................................................................................................................................................................................................................................................................................................................................................................................................................................................................................................................................................................................................................ | $655,465,993 |
|---|
Number of Portfolio Holdings........................................................................................................................................................................................................................................................................................................................................................................................................................................................................................................................................................................................................................................................................................................................................................................................................................................................................................................................................................................................................................................ | 49 |
|---|
Net Investment Advisory Fees........................................................................................................................................................................................................................................................................................................................................................................................................................................................................................................................................................................................................................................................................................................................................................................................................................................................................................................................................................................................................................................ | $1,766,558 |
|---|
Portfolio Turnover Rate........................................................................................................................................................................................................................................................................................................................................................................................................................................................................................................................................................................................................................................................................................................................................................................................................................................................................................................................................................................................................................................ | 24% |
|---|
|
|
| C000025770 |
|
|
|
| Shareholder Report [Line Items] |
|
|
|
| Fund Name |
|
iShares U.S. Oil Equipment & Services ETF
|
|
| Trading Symbol |
|
IEZ
|
|
| Security Exchange Name |
|
NYSEArca
|
|
| Annual or Semi-Annual Statement [Text Block] |
|
This annual shareholder report contains important information about iShares U.S. Oil Equipment & Services ETF (the “Fund”) for the period of April 1, 2025 to March 31, 2026
|
|
| Additional Information [Text Block] |
|
You can find additional information about the Fund at blackrock.com/fundreports. You can also request this information by contacting us at 1-800-iShares (1-800-474-2737).
|
|
| Additional Information Phone Number |
|
1-800-474-2737
|
|
| Additional Information Website |
|
blackrock.com/fundreports
|
|
| Expenses [Text Block] |
|
What were the Fund costs for the last year?(based on a hypothetical $10,000 investment) Table SummaryFund name | Costs of a $10,000
investment | Costs paid as a percentage of a
$10,000 investment |
|---|
iShares U.S. Oil Equipment & Services ETF | $46 | 0.37% |
|---|
|
|
| Expenses Paid, Amount |
|
$ 46
|
|
| Expense Ratio, Percent |
|
0.37%
|
|
| Performance Past Does Not Indicate Future [Text] |
|
Past performance is not an indication of future results.
|
|
| Line Graph [Table Text Block] |
|
Cumulative performance: April 1, 2016 through March 31, 2026 Initial investment of $10,000 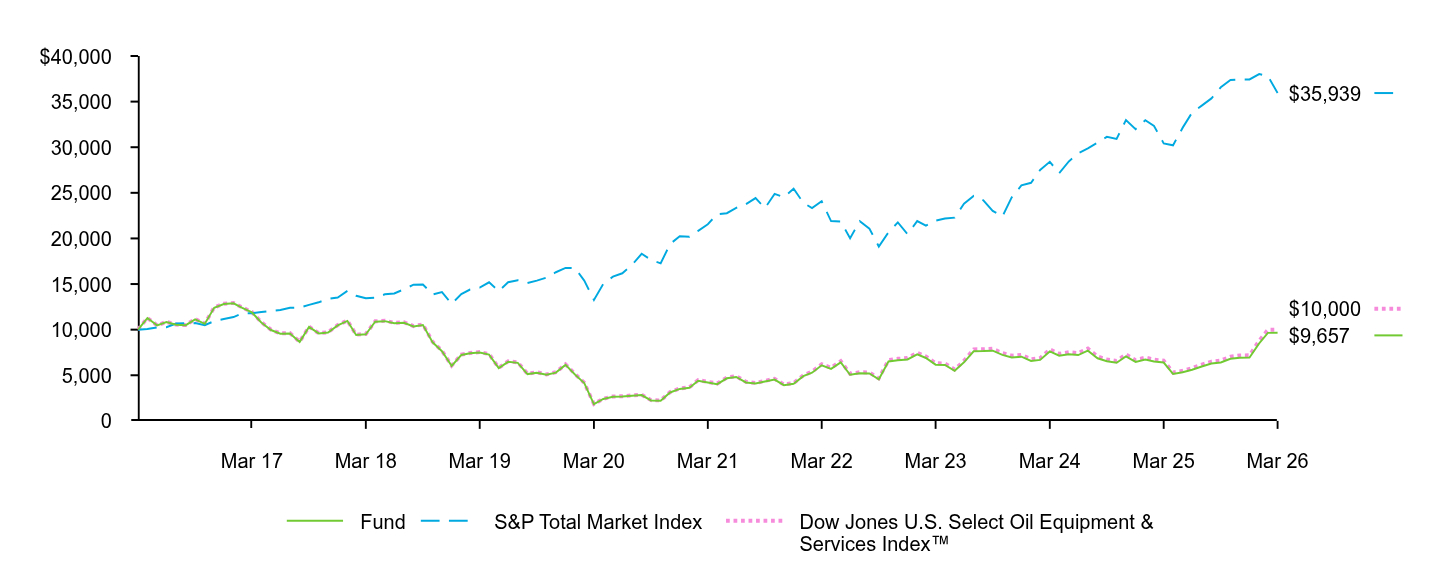 Table Summary | Fund | S&P Total Market Index | Dow Jones U.S. Select Oil Equipment & Services Index™ |
|---|
Mar 16 | $10,000 | $10,000 | $10,000 |
|---|
Apr 16 | $11,277 | $10,062 | $11,281 |
|---|
May 16 | $10,468 | $10,242 | $10,473 |
|---|
Jun 16 | $10,839 | $10,262 | $10,851 |
|---|
Jul 16 | $10,544 | $10,670 | $10,559 |
|---|
Aug 16 | $10,485 | $10,699 | $10,504 |
|---|
Sep 16 | $11,131 | $10,718 | $11,155 |
|---|
Oct 16 | $10,642 | $10,483 | $10,668 |
|---|
Nov 16 | $12,397 | $10,949 | $12,435 |
|---|
Dec 16 | $12,805 | $11,162 | $12,846 |
|---|
Jan 17 | $12,884 | $11,379 | $12,930 |
|---|
Feb 17 | $12,391 | $11,799 | $12,438 |
|---|
Mar 17 | $11,888 | $11,808 | $11,935 |
|---|
Apr 17 | $10,778 | $11,931 | $10,819 |
|---|
May 17 | $9,959 | $12,053 | $10,001 |
|---|
Jun 17 | $9,550 | $12,164 | $9,592 |
|---|
Jul 17 | $9,581 | $12,393 | $9,618 |
|---|
Aug 17 | $8,655 | $12,416 | $8,671 |
|---|
Sep 17 | $10,299 | $12,719 | $10,323 |
|---|
Oct 17 | $9,586 | $12,995 | $9,608 |
|---|
Nov 17 | $9,691 | $13,389 | $9,715 |
|---|
Dec 17 | $10,475 | $13,524 | $10,505 |
|---|
Jan 18 | $10,959 | $14,242 | $10,996 |
|---|
Feb 18 | $9,416 | $13,714 | $9,447 |
|---|
Mar 18 | $9,487 | $13,442 | $9,521 |
|---|
Apr 18 | $10,875 | $13,490 | $10,914 |
|---|
May 18 | $10,933 | $13,871 | $10,976 |
|---|
Jun 18 | $10,707 | $13,963 | $10,753 |
|---|
Jul 18 | $10,762 | $14,430 | $10,813 |
|---|
Aug 18 | $10,343 | $14,932 | $10,392 |
|---|
Sep 18 | $10,513 | $14,955 | $10,569 |
|---|
Oct 18 | $8,621 | $13,848 | $8,669 |
|---|
Nov 18 | $7,642 | $14,125 | $7,683 |
|---|
Dec 18 | $6,025 | $12,808 | $6,055 |
|---|
Jan 19 | $7,224 | $13,911 | $7,264 |
|---|
Feb 19 | $7,404 | $14,399 | $7,450 |
|---|
Mar 19 | $7,485 | $14,606 | $7,536 |
|---|
Apr 19 | $7,272 | $15,188 | $7,324 |
|---|
May 19 | $5,783 | $14,208 | $5,826 |
|---|
Jun 19 | $6,469 | $15,203 | $6,519 |
|---|
Jul 19 | $6,361 | $15,426 | $6,415 |
|---|
Aug 19 | $5,130 | $15,115 | $5,174 |
|---|
Sep 19 | $5,285 | $15,376 | $5,333 |
|---|
Oct 19 | $5,045 | $15,702 | $5,092 |
|---|
Nov 19 | $5,285 | $16,297 | $5,335 |
|---|
Dec 19 | $6,138 | $16,766 | $6,200 |
|---|
Jan 20 | $5,068 | $16,745 | $5,121 |
|---|
Feb 20 | $4,141 | $15,374 | $4,185 |
|---|
Mar 20 | $1,836 | $13,251 | $1,850 |
|---|
Apr 20 | $2,408 | $15,008 | $2,429 |
|---|
May 20 | $2,651 | $15,814 | $2,671 |
|---|
Jun 20 | $2,660 | $16,179 | $2,693 |
|---|
Jul 20 | $2,759 | $17,093 | $2,795 |
|---|
Aug 20 | $2,824 | $18,321 | $2,863 |
|---|
Sep 20 | $2,245 | $17,647 | $2,273 |
|---|
Oct 20 | $2,214 | $17,271 | $2,242 |
|---|
Nov 20 | $3,110 | $19,382 | $3,153 |
|---|
Dec 20 | $3,506 | $20,251 | $3,555 |
|---|
Jan 21 | $3,625 | $20,186 | $3,679 |
|---|
Feb 21 | $4,404 | $20,832 | $4,472 |
|---|
Mar 21 | $4,205 | $21,557 | $4,275 |
|---|
Apr 21 | $4,023 | $22,664 | $4,092 |
|---|
May 21 | $4,666 | $22,767 | $4,748 |
|---|
Jun 21 | $4,812 | $23,344 | $4,896 |
|---|
Jul 21 | $4,216 | $23,746 | $4,290 |
|---|
Aug 21 | $4,087 | $24,425 | $4,161 |
|---|
Sep 21 | $4,305 | $23,316 | $4,384 |
|---|
Oct 21 | $4,534 | $24,882 | $4,618 |
|---|
Nov 21 | $3,915 | $24,516 | $3,986 |
|---|
Dec 21 | $4,064 | $25,447 | $4,141 |
|---|
Jan 22 | $4,902 | $23,919 | $4,997 |
|---|
Feb 22 | $5,279 | $23,318 | $5,384 |
|---|
Mar 22 | $6,092 | $24,073 | $6,216 |
|---|
Apr 22 | $5,696 | $21,902 | $5,813 |
|---|
May 22 | $6,416 | $21,858 | $6,551 |
|---|
Jun 22 | $5,055 | $20,020 | $5,162 |
|---|
Jul 22 | $5,217 | $21,898 | $5,328 |
|---|
Aug 22 | $5,197 | $21,071 | $5,310 |
|---|
Sep 22 | $4,561 | $19,107 | $4,661 |
|---|
Oct 22 | $6,508 | $20,666 | $6,655 |
|---|
Nov 22 | $6,647 | $21,757 | $6,799 |
|---|
Dec 22 | $6,736 | $20,478 | $6,893 |
|---|
Jan 23 | $7,291 | $21,906 | $7,464 |
|---|
Feb 23 | $6,897 | $21,398 | $7,063 |
|---|
Mar 23 | $6,163 | $21,961 | $6,312 |
|---|
Apr 23 | $6,129 | $22,182 | $6,279 |
|---|
May 23 | $5,491 | $22,278 | $5,627 |
|---|
Jun 23 | $6,419 | $23,804 | $6,582 |
|---|
Jul 23 | $7,635 | $24,662 | $7,833 |
|---|
Aug 23 | $7,647 | $24,178 | $7,849 |
|---|
Sep 23 | $7,695 | $23,021 | $7,900 |
|---|
Oct 23 | $7,233 | $22,401 | $7,428 |
|---|
Nov 23 | $6,949 | $24,503 | $7,138 |
|---|
Dec 23 | $7,037 | $25,814 | $7,230 |
|---|
Jan 24 | $6,569 | $26,099 | $6,751 |
|---|
Feb 24 | $6,683 | $27,518 | $6,870 |
|---|
Mar 24 | $7,618 | $28,407 | $7,835 |
|---|
Apr 24 | $7,142 | $27,155 | $7,347 |
|---|
May 24 | $7,310 | $28,444 | $7,523 |
|---|
Jun 24 | $7,214 | $29,327 | $7,427 |
|---|
Jul 24 | $7,694 | $29,866 | $7,925 |
|---|
Aug 24 | $6,863 | $30,506 | $7,068 |
|---|
Sep 24 | $6,534 | $31,134 | $6,731 |
|---|
Oct 24 | $6,363 | $30,912 | $6,557 |
|---|
Nov 24 | $7,071 | $32,971 | $7,289 |
|---|
Dec 24 | $6,458 | $31,977 | $6,659 |
|---|
Jan 25 | $6,726 | $32,957 | $6,938 |
|---|
Feb 25 | $6,510 | $32,335 | $6,715 |
|---|
Mar 25 | $6,391 | $30,420 | $6,593 |
|---|
Apr 25 | $5,138 | $30,211 | $5,301 |
|---|
May 25 | $5,320 | $32,146 | $5,491 |
|---|
Jun 25 | $5,596 | $33,793 | $5,778 |
|---|
Jul 25 | $5,965 | $34,564 | $6,161 |
|---|
Aug 25 | $6,285 | $35,349 | $6,494 |
|---|
Sep 25 | $6,393 | $36,570 | $6,609 |
|---|
Oct 25 | $6,800 | $37,374 | $7,032 |
|---|
Nov 25 | $6,926 | $37,433 | $7,164 |
|---|
Dec 25 | $6,946 | $37,431 | $7,187 |
|---|
Jan 26 | $8,487 | $38,014 | $8,785 |
|---|
Feb 26 | $9,647 | $37,805 | $9,989 |
|---|
Mar 26 | $9,657 | $35,939 | $10,000 |
|---|
See “Average annual total returns” for additional information on fund performance. |
|
| No Deduction of Taxes [Text Block] |
|
Performance results do not reflect the deduction of taxes that a shareholder would pay on fund distributions or on the redemption or sale of fund shares.
|
|
| AssetsNet |
|
$ 419,590,307
|
|
| Holdings Count | Holding |
|
34
|
|
| Advisory Fees Paid, Amount |
|
$ 584,292
|
|
| InvestmentCompanyPortfolioTurnover |
|
17.00%
|
|
| Additional Fund Statistics [Text Block] |
|
Table SummaryNet Assets........................................................................................................................................................................................................................................................................................................................................................................................................................................................................................................................................................................................................................................................................................................................................................................................................................................................................................................................................................................................................................................ | $419,590,307 |
|---|
Number of Portfolio Holdings........................................................................................................................................................................................................................................................................................................................................................................................................................................................................................................................................................................................................................................................................................................................................................................................................................................................................................................................................................................................................................................ | 34 |
|---|
Net Investment Advisory Fees........................................................................................................................................................................................................................................................................................................................................................................................................................................................................................................................................................................................................................................................................................................................................................................................................................................................................................................................................................................................................................................ | $584,292 |
|---|
Portfolio Turnover Rate........................................................................................................................................................................................................................................................................................................................................................................................................................................................................................................................................................................................................................................................................................................................................................................................................................................................................................................................................................................................................................................ | 17% |
|---|
|
|
| C000025771 |
|
|
|
| Shareholder Report [Line Items] |
|
|
|
| Fund Name |
|
iShares U.S. Pharmaceuticals ETF
|
|
| Trading Symbol |
|
IHE
|
|
| Security Exchange Name |
|
NYSEArca
|
|
| Annual or Semi-Annual Statement [Text Block] |
|
This annual shareholder report contains important information about iShares U.S. Pharmaceuticals ETF (the “Fund”) for the period of April 1, 2025 to March 31, 2026
|
|
| Additional Information [Text Block] |
|
You can find additional information about the Fund at blackrock.com/fundreports. You can also request this information by contacting us at 1-800-iShares (1-800-474-2737).
|
|
| Additional Information Phone Number |
|
1-800-474-2737
|
|
| Additional Information Website |
|
blackrock.com/fundreports
|
|
| Expenses [Text Block] |
|
What were the Fund costs for the last year?(based on a hypothetical $10,000 investment) Table SummaryFund name | Costs of a $10,000
investment | Costs paid as a percentage of a
$10,000 investment |
|---|
iShares U.S. Pharmaceuticals ETF | $42 | 0.37% |
|---|
|
|
| Expenses Paid, Amount |
|
$ 42
|
|
| Expense Ratio, Percent |
|
0.37%
|
|
| Performance Past Does Not Indicate Future [Text] |
|
Past performance is not an indication of future results.
|
|
| Line Graph [Table Text Block] |
|
Cumulative performance: April 1, 2016 through March 31, 2026 Initial investment of $10,000  Table Summary | Fund | S&P Total Market Index | Dow Jones U.S. Select Pharmaceuticals Index™ |
|---|
Mar 16 | $10,000 | $10,000 | $10,000 |
|---|
Apr 16 | $10,298 | $10,062 | $10,303 |
|---|
May 16 | $10,687 | $10,242 | $10,700 |
|---|
Jun 16 | $10,577 | $10,262 | $10,592 |
|---|
Jul 16 | $11,393 | $10,670 | $11,411 |
|---|
Aug 16 | $10,901 | $10,699 | $10,920 |
|---|
Sep 16 | $10,961 | $10,718 | $10,985 |
|---|
Oct 16 | $10,009 | $10,483 | $10,030 |
|---|
Nov 16 | $10,236 | $10,949 | $10,260 |
|---|
Dec 16 | $10,379 | $11,162 | $10,407 |
|---|
Jan 17 | $10,424 | $11,379 | $10,454 |
|---|
Feb 17 | $11,260 | $11,799 | $11,295 |
|---|
Mar 17 | $11,119 | $11,808 | $11,156 |
|---|
Apr 17 | $11,287 | $11,931 | $11,327 |
|---|
May 17 | $11,075 | $12,053 | $11,116 |
|---|
Jun 17 | $11,488 | $12,164 | $11,532 |
|---|
Jul 17 | $11,498 | $12,393 | $11,543 |
|---|
Aug 17 | $11,506 | $12,416 | $11,554 |
|---|
Sep 17 | $11,628 | $12,719 | $11,678 |
|---|
Oct 17 | $11,219 | $12,995 | $11,270 |
|---|
Nov 17 | $11,441 | $13,389 | $11,495 |
|---|
Dec 17 | $11,486 | $13,524 | $11,541 |
|---|
Jan 18 | $11,728 | $14,242 | $11,786 |
|---|
Feb 18 | $11,136 | $13,714 | $11,192 |
|---|
Mar 18 | $11,003 | $13,442 | $11,059 |
|---|
Apr 18 | $10,785 | $13,490 | $10,841 |
|---|
May 18 | $11,135 | $13,871 | $11,195 |
|---|
Jun 18 | $11,337 | $13,963 | $11,399 |
|---|
Jul 18 | $12,125 | $14,430 | $12,195 |
|---|
Aug 18 | $12,701 | $14,932 | $12,775 |
|---|
Sep 18 | $12,626 | $14,955 | $12,702 |
|---|
Oct 18 | $11,451 | $13,848 | $11,518 |
|---|
Nov 18 | $11,846 | $14,125 | $11,920 |
|---|
Dec 18 | $10,604 | $12,808 | $10,669 |
|---|
Jan 19 | $11,069 | $13,911 | $11,138 |
|---|
Feb 19 | $11,659 | $14,399 | $11,736 |
|---|
Mar 19 | $11,649 | $14,606 | $11,729 |
|---|
Apr 19 | $11,298 | $15,188 | $11,374 |
|---|
May 19 | $10,668 | $14,208 | $10,740 |
|---|
Jun 19 | $11,446 | $15,203 | $11,529 |
|---|
Jul 19 | $10,967 | $15,426 | $11,051 |
|---|
Aug 19 | $10,589 | $15,115 | $10,671 |
|---|
Sep 19 | $10,659 | $15,376 | $10,746 |
|---|
Oct 19 | $11,130 | $15,702 | $11,224 |
|---|
Nov 19 | $11,523 | $16,297 | $11,625 |
|---|
Dec 19 | $12,247 | $16,766 | $12,360 |
|---|
Jan 20 | $12,188 | $16,745 | $12,305 |
|---|
Feb 20 | $11,059 | $15,374 | $11,167 |
|---|
Mar 20 | $10,361 | $13,251 | $10,467 |
|---|
Apr 20 | $11,709 | $15,008 | $11,833 |
|---|
May 20 | $12,087 | $15,814 | $12,221 |
|---|
Jun 20 | $11,844 | $16,179 | $11,980 |
|---|
Jul 20 | $12,152 | $17,093 | $12,295 |
|---|
Aug 20 | $12,883 | $18,321 | $13,041 |
|---|
Sep 20 | $12,633 | $17,647 | $12,792 |
|---|
Oct 20 | $12,345 | $17,271 | $12,505 |
|---|
Nov 20 | $13,232 | $19,382 | $13,408 |
|---|
Dec 20 | $13,940 | $20,251 | $14,131 |
|---|
Jan 21 | $13,946 | $20,186 | $14,141 |
|---|
Feb 21 | $13,857 | $20,832 | $14,052 |
|---|
Mar 21 | $13,812 | $21,557 | $14,008 |
|---|
Apr 21 | $13,948 | $22,664 | $14,151 |
|---|
May 21 | $14,352 | $22,767 | $14,565 |
|---|
Jun 21 | $14,508 | $23,344 | $14,729 |
|---|
Jul 21 | $14,986 | $23,746 | $15,219 |
|---|
Aug 21 | $15,097 | $24,425 | $15,336 |
|---|
Sep 21 | $14,368 | $23,316 | $14,599 |
|---|
Oct 21 | $14,763 | $24,882 | $15,006 |
|---|
Nov 21 | $14,693 | $24,516 | $14,928 |
|---|
Dec 21 | $15,727 | $25,447 | $15,983 |
|---|
Jan 22 | $15,015 | $23,919 | $15,264 |
|---|
Feb 22 | $14,487 | $23,318 | $14,728 |
|---|
Mar 22 | $15,371 | $24,073 | $15,632 |
|---|
Apr 22 | $14,872 | $21,902 | $15,128 |
|---|
May 22 | $15,388 | $21,858 | $15,659 |
|---|
Jun 22 | $15,232 | $20,020 | $15,504 |
|---|
Jul 22 | $15,131 | $21,898 | $15,404 |
|---|
Aug 22 | $13,982 | $21,071 | $14,238 |
|---|
Sep 22 | $13,528 | $19,107 | $13,778 |
|---|
Oct 22 | $14,462 | $20,666 | $14,726 |
|---|
Nov 22 | $15,000 | $21,757 | $15,276 |
|---|
Dec 22 | $14,976 | $20,478 | $15,256 |
|---|
Jan 23 | $14,926 | $21,906 | $15,210 |
|---|
Feb 23 | $14,154 | $21,398 | $14,419 |
|---|
Mar 23 | $14,167 | $21,961 | $14,438 |
|---|
Apr 23 | $14,646 | $22,182 | $14,927 |
|---|
May 23 | $13,871 | $22,278 | $14,142 |
|---|
Jun 23 | $14,514 | $23,804 | $14,802 |
|---|
Jul 23 | $14,777 | $24,662 | $15,075 |
|---|
Aug 23 | $15,361 | $24,178 | $15,676 |
|---|
Sep 23 | $14,411 | $23,021 | $14,709 |
|---|
Oct 23 | $13,632 | $22,401 | $13,918 |
|---|
Nov 23 | $14,285 | $24,503 | $14,586 |
|---|
Dec 23 | $15,125 | $25,814 | $15,447 |
|---|
Jan 24 | $15,577 | $26,099 | $15,911 |
|---|
Feb 24 | $16,622 | $27,518 | $16,985 |
|---|
Mar 24 | $16,698 | $28,407 | $17,060 |
|---|
Apr 24 | $15,758 | $27,155 | $16,104 |
|---|
May 24 | $16,161 | $28,444 | $16,522 |
|---|
Jun 24 | $16,387 | $29,327 | $16,758 |
|---|
Jul 24 | $16,876 | $29,866 | $17,263 |
|---|
Aug 24 | $18,010 | $30,506 | $18,427 |
|---|
Sep 24 | $17,523 | $31,134 | $17,931 |
|---|
Oct 24 | $17,160 | $30,912 | $17,558 |
|---|
Nov 24 | $17,166 | $32,971 | $17,568 |
|---|
Dec 24 | $16,348 | $31,977 | $16,738 |
|---|
Jan 25 | $17,304 | $32,957 | $17,722 |
|---|
Feb 25 | $18,094 | $32,335 | $18,539 |
|---|
Mar 25 | $17,641 | $30,420 | $18,081 |
|---|
Apr 25 | $17,087 | $30,211 | $17,507 |
|---|
May 25 | $16,282 | $32,146 | $16,688 |
|---|
Jun 25 | $16,460 | $33,793 | $16,877 |
|---|
Jul 25 | $16,506 | $34,564 | $16,931 |
|---|
Aug 25 | $17,870 | $35,349 | $18,330 |
|---|
Sep 25 | $18,316 | $36,570 | $18,769 |
|---|
Oct 25 | $19,161 | $37,374 | $19,643 |
|---|
Nov 25 | $21,530 | $37,433 | $22,078 |
|---|
Dec 25 | $21,537 | $37,431 | $22,094 |
|---|
Jan 26 | $22,001 | $38,014 | $22,578 |
|---|
Feb 26 | $23,330 | $37,805 | $23,948 |
|---|
Mar 26 | $22,082 | $35,939 | $22,676 |
|---|
See “Average annual total returns” for additional information on fund performance. |
|
| No Deduction of Taxes [Text Block] |
|
Performance results do not reflect the deduction of taxes that a shareholder would pay on fund distributions or on the redemption or sale of fund shares.
|
|
| AssetsNet |
|
$ 996,286,067
|
|
| Holdings Count | Holding |
|
59
|
|
| Advisory Fees Paid, Amount |
|
$ 2,608,334
|
|
| InvestmentCompanyPortfolioTurnover |
|
29.00%
|
|
| Additional Fund Statistics [Text Block] |
|
Table SummaryNet Assets........................................................................................................................................................................................................................................................................................................................................................................................................................................................................................................................................................................................................................................................................................................................................................................................................................................................................................................................................................................................................................................ | $996,286,067 |
|---|
Number of Portfolio Holdings........................................................................................................................................................................................................................................................................................................................................................................................................................................................................................................................................................................................................................................................................................................................................................................................................................................................................................................................................................................................................................................ | 59 |
|---|
Net Investment Advisory Fees........................................................................................................................................................................................................................................................................................................................................................................................................................................................................................................................................................................................................................................................................................................................................................................................................................................................................................................................................................................................................................................ | $2,608,334 |
|---|
Portfolio Turnover Rate........................................................................................................................................................................................................................................................................................................................................................................................................................................................................................................................................................................................................................................................................................................................................................................................................................................................................................................................................................................................................................................ | 29% |
|---|
|
|
| C000012058 |
|
|
|
| Shareholder Report [Line Items] |
|
|
|
| Fund Name |
|
iShares U.S. Real Estate ETF
|
|
| Trading Symbol |
|
IYR
|
|
| Security Exchange Name |
|
NYSEArca
|
|
| Annual or Semi-Annual Statement [Text Block] |
|
This annual shareholder report contains important information about iShares U.S. Real Estate ETF (the “Fund”) for the period of April 1, 2025 to March 31, 2026
|
|
| Additional Information [Text Block] |
|
You can find additional information about the Fund at blackrock.com/fundreports. You can also request this information by contacting us at 1-800-iShares (1-800-474-2737).
|
|
| Additional Information Phone Number |
|
1-800-474-2737
|
|
| Additional Information Website |
|
blackrock.com/fundreports
|
|
| Expenses [Text Block] |
|
What were the Fund costs for the last year?(based on a hypothetical $10,000 investment) Table SummaryFund name | Costs of a $10,000
investment | Costs paid as a percentage of a
$10,000 investment |
|---|
iShares U.S. Real Estate ETF | $37 | 0.37% |
|---|
|
|
| Expenses Paid, Amount |
|
$ 37
|
|
| Expense Ratio, Percent |
|
0.37%
|
|
| Performance Past Does Not Indicate Future [Text] |
|
Past performance is not an indication of future results.
|
|
| Line Graph [Table Text Block] |
|
Cumulative performance: April 1, 2016 through March 31, 2026 Initial investment of $10,000  Table Summary | Fund | S&P Total Market Index | Dow Jones U.S. Real Estate Capped Index™ (Spliced) |
|---|
Mar 16 | $10,000 | $10,000 | $10,000 |
|---|
Apr 16 | $9,827 | $10,062 | $9,829 |
|---|
May 16 | $10,055 | $10,242 | $10,060 |
|---|
Jun 16 | $10,668 | $10,262 | $10,679 |
|---|
Jul 16 | $11,064 | $10,670 | $11,081 |
|---|
Aug 16 | $10,691 | $10,699 | $10,710 |
|---|
Sep 16 | $10,534 | $10,718 | $10,556 |
|---|
Oct 16 | $10,010 | $10,483 | $10,036 |
|---|
Nov 16 | $9,784 | $10,949 | $9,814 |
|---|
Dec 16 | $10,188 | $11,162 | $10,228 |
|---|
Jan 17 | $10,208 | $11,379 | $10,252 |
|---|
Feb 17 | $10,652 | $11,799 | $10,702 |
|---|
Mar 17 | $10,503 | $11,808 | $10,557 |
|---|
Apr 17 | $10,558 | $11,931 | $10,617 |
|---|
May 17 | $10,554 | $12,053 | $10,614 |
|---|
Jun 17 | $10,765 | $12,164 | $10,831 |
|---|
Jul 17 | $10,893 | $12,393 | $10,963 |
|---|
Aug 17 | $10,963 | $12,416 | $11,036 |
|---|
Sep 17 | $10,880 | $12,719 | $10,953 |
|---|
Oct 17 | $10,884 | $12,995 | $10,963 |
|---|
Nov 17 | $11,158 | $13,389 | $11,245 |
|---|
Dec 17 | $11,142 | $13,524 | $11,235 |
|---|
Jan 18 | $10,822 | $14,242 | $10,915 |
|---|
Feb 18 | $10,097 | $13,714 | $10,186 |
|---|
Mar 18 | $10,474 | $13,442 | $10,571 |
|---|
Apr 18 | $10,499 | $13,490 | $10,600 |
|---|
May 18 | $10,840 | $13,871 | $10,949 |
|---|
Jun 18 | $11,277 | $13,963 | $11,394 |
|---|
Jul 18 | $11,374 | $14,430 | $11,496 |
|---|
Aug 18 | $11,641 | $14,932 | $11,770 |
|---|
Sep 18 | $11,338 | $14,955 | $11,467 |
|---|
Oct 18 | $11,040 | $13,848 | $11,154 |
|---|
Nov 18 | $11,555 | $14,125 | $11,680 |
|---|
Dec 18 | $10,665 | $12,808 | $10,783 |
|---|
Jan 19 | $11,882 | $13,911 | $12,017 |
|---|
Feb 19 | $11,976 | $14,399 | $12,116 |
|---|
Mar 19 | $12,474 | $14,606 | $12,624 |
|---|
Apr 19 | $12,465 | $15,188 | $12,620 |
|---|
May 19 | $12,459 | $14,208 | $12,619 |
|---|
Jun 19 | $12,686 | $15,203 | $12,854 |
|---|
Jul 19 | $12,911 | $15,426 | $13,087 |
|---|
Aug 19 | $13,355 | $15,115 | $13,540 |
|---|
Sep 19 | $13,599 | $15,376 | $13,792 |
|---|
Oct 19 | $13,709 | $15,702 | $13,910 |
|---|
Nov 19 | $13,565 | $16,297 | $13,767 |
|---|
Dec 19 | $13,692 | $16,766 | $13,901 |
|---|
Jan 20 | $13,894 | $16,745 | $14,112 |
|---|
Feb 20 | $12,924 | $15,374 | $13,131 |
|---|
Mar 20 | $10,336 | $13,251 | $10,511 |
|---|
Apr 20 | $11,277 | $15,008 | $11,466 |
|---|
May 20 | $11,486 | $15,814 | $11,686 |
|---|
Jun 20 | $11,774 | $16,179 | $11,974 |
|---|
Jul 20 | $12,247 | $17,093 | $12,475 |
|---|
Aug 20 | $12,275 | $18,321 | $12,505 |
|---|
Sep 20 | $11,995 | $17,647 | $12,222 |
|---|
Oct 20 | $11,642 | $17,271 | $11,863 |
|---|
Nov 20 | $12,637 | $19,382 | $12,841 |
|---|
Dec 20 | $12,954 | $20,251 | $13,165 |
|---|
Jan 21 | $12,909 | $20,186 | $13,123 |
|---|
Feb 21 | $13,210 | $20,832 | $13,434 |
|---|
Mar 21 | $13,956 | $21,557 | $14,198 |
|---|
Apr 21 | $15,076 | $22,664 | $15,343 |
|---|
May 21 | $15,225 | $22,767 | $15,498 |
|---|
Jun 21 | $15,568 | $23,344 | $15,854 |
|---|
Jul 21 | $16,298 | $23,746 | $16,603 |
|---|
Aug 21 | $16,631 | $24,425 | $16,948 |
|---|
Sep 21 | $15,689 | $23,316 | $15,992 |
|---|
Oct 21 | $16,800 | $24,882 | $17,131 |
|---|
Nov 21 | $16,418 | $24,516 | $16,745 |
|---|
Dec 21 | $17,967 | $25,447 | $18,330 |
|---|
Jan 22 | $16,500 | $23,919 | $16,839 |
|---|
Feb 22 | $15,751 | $23,318 | $16,080 |
|---|
Mar 22 | $16,784 | $24,073 | $17,139 |
|---|
Apr 22 | $16,113 | $21,902 | $16,460 |
|---|
May 22 | $15,406 | $21,858 | $15,743 |
|---|
Jun 22 | $14,343 | $20,020 | $14,661 |
|---|
Jul 22 | $15,610 | $21,898 | $15,962 |
|---|
Aug 22 | $14,703 | $21,071 | $15,039 |
|---|
Sep 22 | $12,836 | $19,107 | $13,135 |
|---|
Oct 22 | $13,237 | $20,666 | $13,548 |
|---|
Nov 22 | $14,064 | $21,757 | $14,400 |
|---|
Dec 22 | $13,392 | $20,478 | $13,716 |
|---|
Jan 23 | $14,724 | $21,906 | $15,086 |
|---|
Feb 23 | $13,842 | $21,398 | $14,186 |
|---|
Mar 23 | $13,588 | $21,961 | $13,931 |
|---|
Apr 23 | $13,707 | $22,182 | $14,059 |
|---|
May 23 | $13,153 | $22,278 | $13,495 |
|---|
Jun 23 | $13,907 | $23,804 | $14,273 |
|---|
Jul 23 | $14,149 | $24,662 | $14,527 |
|---|
Aug 23 | $13,705 | $24,178 | $14,075 |
|---|
Sep 23 | $12,704 | $23,021 | $13,051 |
|---|
Oct 23 | $12,247 | $22,401 | $12,582 |
|---|
Nov 23 | $13,748 | $24,503 | $14,128 |
|---|
Dec 23 | $14,980 | $25,814 | $15,401 |
|---|
Jan 24 | $14,232 | $26,099 | $14,636 |
|---|
Feb 24 | $14,523 | $27,518 | $14,937 |
|---|
Mar 24 | $14,796 | $28,407 | $15,221 |
|---|
Apr 24 | $13,595 | $27,155 | $13,991 |
|---|
May 24 | $14,254 | $28,444 | $14,673 |
|---|
Jun 24 | $14,539 | $29,327 | $14,970 |
|---|
Jul 24 | $15,623 | $29,866 | $16,093 |
|---|
Aug 24 | $16,474 | $30,506 | $16,975 |
|---|
Sep 24 | $16,998 | $31,134 | $17,521 |
|---|
Oct 24 | $16,388 | $30,912 | $16,897 |
|---|
Nov 24 | $17,055 | $32,971 | $17,591 |
|---|
Dec 24 | $15,652 | $31,977 | $16,148 |
|---|
Jan 25 | $15,948 | $32,957 | $16,460 |
|---|
Feb 25 | $16,552 | $32,335 | $17,088 |
|---|
Mar 25 | $16,159 | $30,420 | $16,687 |
|---|
Apr 25 | $15,830 | $30,211 | $16,352 |
|---|
May 25 | $15,963 | $32,146 | $16,494 |
|---|
Jun 25 | $16,080 | $33,793 | $16,621 |
|---|
Jul 25 | $16,100 | $34,564 | $16,647 |
|---|
Aug 25 | $16,563 | $35,349 | $17,132 |
|---|
Sep 25 | $16,575 | $36,570 | $17,149 |
|---|
Oct 25 | $16,165 | $37,374 | $16,731 |
|---|
Nov 25 | $16,538 | $37,433 | $17,120 |
|---|
Dec 25 | $16,180 | $37,431 | $16,756 |
|---|
Jan 26 | $16,595 | $38,014 | $17,190 |
|---|
Feb 26 | $17,449 | $37,805 | $18,079 |
|---|
Mar 26 | $16,338 | $35,939 | $16,934 |
|---|
See “Average annual total returns” for additional information on fund performance. |
|
| No Deduction of Taxes [Text Block] |
|
Performance results do not reflect the deduction of taxes that a shareholder would pay on fund distributions or on the redemption or sale of fund shares.
|
|
| AssetsNet |
|
$ 3,999,042,787
|
|
| Holdings Count | Holding |
|
64
|
|
| Advisory Fees Paid, Amount |
|
$ 14,081,806
|
|
| InvestmentCompanyPortfolioTurnover |
|
9.00%
|
|
| Additional Fund Statistics [Text Block] |
|
Table SummaryNet Assets........................................................................................................................................................................................................................................................................................................................................................................................................................................................................................................................................................................................................................................................................................................................................................................................................................................................................................................................................................................................................................................ | $3,999,042,787 |
|---|
Number of Portfolio Holdings........................................................................................................................................................................................................................................................................................................................................................................................................................................................................................................................................................................................................................................................................................................................................................................................................................................................................................................................................................................................................................................ | 64 |
|---|
Net Investment Advisory Fees........................................................................................................................................................................................................................................................................................................................................................................................................................................................................................................................................................................................................................................................................................................................................................................................................................................................................................................................................................................................................................................ | $14,081,806 |
|---|
Portfolio Turnover Rate........................................................................................................................................................................................................................................................................................................................................................................................................................................................................................................................................................................................................................................................................................................................................................................................................................................................................................................................................................................................................................................ | 9% |
|---|
|
|
| C000025776 |
|
|
|
| Shareholder Report [Line Items] |
|
|
|
| Fund Name |
|
iShares U.S. Regional Banks ETF
|
|
| Trading Symbol |
|
IAT
|
|
| Security Exchange Name |
|
NYSEArca
|
|
| Annual or Semi-Annual Statement [Text Block] |
|
This annual shareholder report contains important information about iShares U.S. Regional Banks ETF (the “Fund”) for the period of April 1, 2025 to March 31, 2026
|
|
| Additional Information [Text Block] |
|
You can find additional information about the Fund at blackrock.com/fundreports. You can also request this information by contacting us at 1-800-iShares (1-800-474-2737).
|
|
| Additional Information Phone Number |
|
1-800-474-2737
|
|
| Additional Information Website |
|
blackrock.com/fundreports
|
|
| Expenses [Text Block] |
|
What were the Fund costs for the last year?(based on a hypothetical $10,000 investment) Table SummaryFund name | Costs of a $10,000
investment | Costs paid as a percentage of a
$10,000 investment |
|---|
iShares U.S. Regional Banks ETF | $41 | 0.37% |
|---|
|
|
| Expenses Paid, Amount |
|
$ 41
|
|
| Expense Ratio, Percent |
|
0.37%
|
|
| Performance Past Does Not Indicate Future [Text] |
|
Past performance is not an indication of future results.
|
|
| Line Graph [Table Text Block] |
|
Cumulative performance: April 1, 2016 through March 31, 2026 Initial investment of $10,000  Table Summary | Fund | S&P Total Market Index | Dow Jones U.S. Select Regional Banks Index™ |
|---|
Mar 16 | $10,000 | $10,000 | $10,000 |
|---|
Apr 16 | $10,692 | $10,062 | $10,695 |
|---|
May 16 | $11,000 | $10,242 | $11,010 |
|---|
Jun 16 | $10,253 | $10,262 | $10,264 |
|---|
Jul 16 | $10,633 | $10,670 | $10,649 |
|---|
Aug 16 | $11,331 | $10,699 | $11,354 |
|---|
Sep 16 | $11,182 | $10,718 | $11,211 |
|---|
Oct 16 | $11,672 | $10,483 | $11,704 |
|---|
Nov 16 | $13,689 | $10,949 | $13,737 |
|---|
Dec 16 | $14,472 | $11,162 | $14,530 |
|---|
Jan 17 | $14,580 | $11,379 | $14,641 |
|---|
Feb 17 | $15,168 | $11,799 | $15,236 |
|---|
Mar 17 | $14,337 | $11,808 | $14,405 |
|---|
Apr 17 | $14,215 | $11,931 | $14,290 |
|---|
May 17 | $13,857 | $12,053 | $13,933 |
|---|
Jun 17 | $14,643 | $12,164 | $14,729 |
|---|
Jul 17 | $14,708 | $12,393 | $14,802 |
|---|
Aug 17 | $14,129 | $12,416 | $14,221 |
|---|
Sep 17 | $15,238 | $12,719 | $15,346 |
|---|
Oct 17 | $15,432 | $12,995 | $15,547 |
|---|
Nov 17 | $15,939 | $13,389 | $16,064 |
|---|
Dec 17 | $15,997 | $13,524 | $16,129 |
|---|
Jan 18 | $17,217 | $14,242 | $17,367 |
|---|
Feb 18 | $16,947 | $13,714 | $17,101 |
|---|
Mar 18 | $16,405 | $13,442 | $16,558 |
|---|
Apr 18 | $16,516 | $13,490 | $16,680 |
|---|
May 18 | $16,548 | $13,871 | $16,717 |
|---|
Jun 18 | $16,073 | $13,963 | $16,243 |
|---|
Jul 18 | $16,625 | $14,430 | $16,806 |
|---|
Aug 18 | $16,991 | $14,932 | $17,184 |
|---|
Sep 18 | $16,109 | $14,955 | $16,296 |
|---|
Oct 18 | $15,133 | $13,848 | $15,314 |
|---|
Nov 18 | $15,669 | $14,125 | $15,861 |
|---|
Dec 18 | $13,215 | $12,808 | $13,378 |
|---|
Jan 19 | $14,889 | $13,911 | $15,079 |
|---|
Feb 19 | $15,731 | $14,399 | $15,939 |
|---|
Mar 19 | $14,471 | $14,606 | $14,664 |
|---|
Apr 19 | $15,870 | $15,188 | $16,092 |
|---|
May 19 | $14,454 | $14,208 | $14,657 |
|---|
Jun 19 | $15,408 | $15,203 | $15,634 |
|---|
Jul 19 | $16,112 | $15,426 | $16,353 |
|---|
Aug 19 | $14,684 | $15,115 | $14,907 |
|---|
Sep 19 | $15,729 | $15,376 | $15,975 |
|---|
Oct 19 | $16,050 | $15,702 | $16,308 |
|---|
Nov 19 | $16,800 | $16,297 | $17,075 |
|---|
Dec 19 | $17,366 | $16,766 | $17,650 |
|---|
Jan 20 | $16,109 | $16,745 | $16,376 |
|---|
Feb 20 | $14,073 | $15,374 | $14,310 |
|---|
Mar 20 | $9,971 | $13,251 | $10,137 |
|---|
Apr 20 | $11,570 | $15,008 | $11,769 |
|---|
May 20 | $11,691 | $15,814 | $11,899 |
|---|
Jun 20 | $11,726 | $16,179 | $11,937 |
|---|
Jul 20 | $11,685 | $17,093 | $11,899 |
|---|
Aug 20 | $11,945 | $18,321 | $12,165 |
|---|
Sep 20 | $11,482 | $17,647 | $11,696 |
|---|
Oct 20 | $12,818 | $17,271 | $13,069 |
|---|
Nov 20 | $14,750 | $19,382 | $15,046 |
|---|
Dec 20 | $16,034 | $20,251 | $16,359 |
|---|
Jan 21 | $16,296 | $20,186 | $16,634 |
|---|
Feb 21 | $19,254 | $20,832 | $19,664 |
|---|
Mar 21 | $20,097 | $21,557 | $20,537 |
|---|
Apr 21 | $21,173 | $22,664 | $21,638 |
|---|
May 21 | $21,918 | $22,767 | $22,407 |
|---|
Jun 21 | $20,517 | $23,344 | $20,976 |
|---|
Jul 21 | $19,861 | $23,746 | $20,311 |
|---|
Aug 21 | $20,845 | $24,425 | $21,325 |
|---|
Sep 21 | $21,699 | $23,316 | $22,207 |
|---|
Oct 21 | $22,892 | $24,882 | $23,438 |
|---|
Nov 21 | $21,942 | $24,516 | $22,472 |
|---|
Dec 21 | $22,289 | $25,447 | $22,837 |
|---|
Jan 22 | $22,650 | $23,919 | $23,211 |
|---|
Feb 22 | $23,107 | $23,318 | $23,691 |
|---|
Mar 22 | $21,325 | $24,073 | $21,868 |
|---|
Apr 22 | $19,188 | $21,902 | $19,683 |
|---|
May 22 | $20,093 | $21,858 | $20,619 |
|---|
Jun 22 | $17,967 | $20,020 | $18,444 |
|---|
Jul 22 | $19,245 | $21,898 | $19,763 |
|---|
Aug 22 | $18,873 | $21,071 | $19,387 |
|---|
Sep 22 | $17,577 | $19,107 | $18,063 |
|---|
Oct 22 | $18,499 | $20,666 | $19,015 |
|---|
Nov 22 | $19,069 | $21,757 | $19,606 |
|---|
Dec 22 | $17,698 | $20,478 | $18,202 |
|---|
Jan 23 | $19,479 | $21,906 | $20,042 |
|---|
Feb 23 | $18,884 | $21,398 | $19,436 |
|---|
Mar 23 | $13,372 | $21,961 | $13,758 |
|---|
Apr 23 | $13,167 | $22,182 | $13,548 |
|---|
May 23 | $12,001 | $22,278 | $12,351 |
|---|
Jun 23 | $12,759 | $23,804 | $13,135 |
|---|
Jul 23 | $14,746 | $24,662 | $15,191 |
|---|
Aug 23 | $13,440 | $24,178 | $13,847 |
|---|
Sep 23 | $12,845 | $23,021 | $13,239 |
|---|
Oct 23 | $12,183 | $22,401 | $12,558 |
|---|
Nov 23 | $14,121 | $24,503 | $14,564 |
|---|
Dec 23 | $16,188 | $25,814 | $16,706 |
|---|
Jan 24 | $15,868 | $26,099 | $16,379 |
|---|
Feb 24 | $15,647 | $27,518 | $16,154 |
|---|
Mar 24 | $16,910 | $28,407 | $17,465 |
|---|
Apr 24 | $15,965 | $27,155 | $16,494 |
|---|
May 24 | $16,321 | $28,444 | $16,867 |
|---|
Jun 24 | $16,316 | $29,327 | $16,867 |
|---|
Jul 24 | $18,928 | $29,866 | $19,577 |
|---|
Aug 24 | $19,164 | $30,506 | $19,827 |
|---|
Sep 24 | $18,875 | $31,134 | $19,535 |
|---|
Oct 24 | $19,697 | $30,912 | $20,393 |
|---|
Nov 24 | $22,390 | $32,971 | $23,192 |
|---|
Dec 24 | $20,128 | $31,977 | $20,852 |
|---|
Jan 25 | $21,268 | $32,957 | $22,040 |
|---|
Feb 25 | $20,485 | $32,335 | $21,232 |
|---|
Mar 25 | $18,757 | $30,420 | $19,445 |
|---|
Apr 25 | $17,651 | $30,211 | $18,302 |
|---|
May 25 | $18,828 | $32,146 | $19,530 |
|---|
Jun 25 | $20,099 | $33,793 | $20,857 |
|---|
Jul 25 | $20,337 | $34,564 | $21,112 |
|---|
Aug 25 | $21,941 | $35,349 | $22,787 |
|---|
Sep 25 | $21,465 | $36,570 | $22,299 |
|---|
Oct 25 | $20,260 | $37,374 | $21,053 |
|---|
Nov 25 | $21,197 | $37,433 | $22,034 |
|---|
Dec 25 | $22,775 | $37,431 | $23,683 |
|---|
Jan 26 | $23,957 | $38,014 | $24,924 |
|---|
Feb 26 | $23,213 | $37,805 | $24,130 |
|---|
Mar 26 | $22,362 | $35,939 | $23,253 |
|---|
See “Average annual total returns” for additional information on fund performance. |
|
| No Deduction of Taxes [Text Block] |
|
Performance results do not reflect the deduction of taxes that a shareholder would pay on fund distributions or on the redemption or sale of fund shares.
|
|
| AssetsNet |
|
$ 568,383,848
|
|
| Holdings Count | Holding |
|
33
|
|
| Advisory Fees Paid, Amount |
|
$ 2,264,464
|
|
| InvestmentCompanyPortfolioTurnover |
|
8.00%
|
|
| Additional Fund Statistics [Text Block] |
|
Table SummaryNet Assets........................................................................................................................................................................................................................................................................................................................................................................................................................................................................................................................................................................................................................................................................................................................................................................................................................................................................................................................................................................................................................................ | $568,383,848 |
|---|
Number of Portfolio Holdings........................................................................................................................................................................................................................................................................................................................................................................................................................................................................................................................................................................................................................................................................................................................................................................................................................................................................................................................................................................................................................................ | 33 |
|---|
Net Investment Advisory Fees........................................................................................................................................................................................................................................................................................................................................................................................................................................................................................................................................................................................................................................................................................................................................................................................................................................................................................................................................................................................................................................ | $2,264,464 |
|---|
Portfolio Turnover Rate........................................................................................................................................................................................................................................................................................................................................................................................................................................................................................................................................................................................................................................................................................................................................................................................................................................................................................................................................................................................................................................ | 8% |
|---|
|
|
| C000012063 |
|
|
|
| Shareholder Report [Line Items] |
|
|
|
| Fund Name |
|
iShares U.S. Telecommunications ETF
|
|
| Trading Symbol |
|
IYZ
|
|
| Security Exchange Name |
|
CboeBZX
|
|
| Annual or Semi-Annual Statement [Text Block] |
|
This annual shareholder report contains important information about iShares U.S. Telecommunications ETF (the “Fund”) for the period of April 1, 2025 to March 31, 2026
|
|
| Additional Information [Text Block] |
|
You can find additional information about the Fund at blackrock.com/fundreports. You can also request this information by contacting us at 1-800-iShares (1-800-474-2737).
|
|
| Additional Information Phone Number |
|
1-800-474-2737
|
|
| Additional Information Website |
|
blackrock.com/fundreports
|
|
| Expenses [Text Block] |
|
What were the Fund costs for the last year?(based on a hypothetical $10,000 investment) Table SummaryFund name | Costs of a $10,000
investment | Costs paid as a percentage of a
$10,000 investment |
|---|
iShares U.S. Telecommunications ETF | $46 | 0.37% |
|---|
|
|
| Expenses Paid, Amount |
|
$ 46
|
|
| Expense Ratio, Percent |
|
0.37%
|
|
| Performance Past Does Not Indicate Future [Text] |
|
Past performance is not an indication of future results.
|
|
| Line Graph [Table Text Block] |
|
Cumulative performance: April 1, 2016 through March 31, 2026 Initial investment of $10,000  Table Summary | Fund | Russell 3000® Index | Russell 1000 Telecommunications RIC 22.5/45 Capped Index (Spliced) |
|---|
Mar 16 | $10,000 | $10,000 | $10,000 |
|---|
Apr 16 | $10,163 | $10,062 | $10,165 |
|---|
May 16 | $10,309 | $10,242 | $10,312 |
|---|
Jun 16 | $10,880 | $10,263 | $10,881 |
|---|
Jul 16 | $11,273 | $10,670 | $11,270 |
|---|
Aug 16 | $10,553 | $10,698 | $10,551 |
|---|
Sep 16 | $10,625 | $10,714 | $10,626 |
|---|
Oct 16 | $10,325 | $10,483 | $10,326 |
|---|
Nov 16 | $10,513 | $10,952 | $10,519 |
|---|
Dec 16 | $11,397 | $11,165 | $11,409 |
|---|
Jan 17 | $11,751 | $11,376 | $11,766 |
|---|
Feb 17 | $11,035 | $11,799 | $11,041 |
|---|
Mar 17 | $10,825 | $11,807 | $10,826 |
|---|
Apr 17 | $11,373 | $11,932 | $11,375 |
|---|
May 17 | $10,908 | $12,054 | $10,910 |
|---|
Jun 17 | $10,860 | $12,163 | $10,860 |
|---|
Jul 17 | $10,715 | $12,392 | $10,714 |
|---|
Aug 17 | $10,729 | $12,416 | $10,724 |
|---|
Sep 17 | $10,337 | $12,719 | $10,332 |
|---|
Oct 17 | $10,269 | $12,996 | $10,259 |
|---|
Nov 17 | $10,249 | $13,391 | $10,242 |
|---|
Dec 17 | $10,076 | $13,525 | $10,056 |
|---|
Jan 18 | $10,124 | $14,238 | $10,113 |
|---|
Feb 18 | $9,552 | $13,713 | $9,538 |
|---|
Mar 18 | $9,349 | $13,438 | $9,334 |
|---|
Apr 18 | $9,456 | $13,489 | $9,445 |
|---|
May 18 | $9,311 | $13,869 | $9,291 |
|---|
Jun 18 | $9,580 | $13,960 | $9,558 |
|---|
Jul 18 | $9,605 | $14,423 | $9,586 |
|---|
Aug 18 | $10,335 | $14,930 | $10,315 |
|---|
Sep 18 | $10,415 | $14,955 | $10,400 |
|---|
Oct 18 | $9,869 | $13,853 | $9,855 |
|---|
Nov 18 | $10,093 | $14,131 | $10,081 |
|---|
Dec 18 | $9,215 | $12,816 | $9,206 |
|---|
Jan 19 | $9,817 | $13,916 | $9,811 |
|---|
Feb 19 | $10,387 | $14,405 | $10,383 |
|---|
Mar 19 | $10,463 | $14,616 | $10,462 |
|---|
Apr 19 | $10,677 | $15,199 | $10,682 |
|---|
May 19 | $9,850 | $14,216 | $9,858 |
|---|
Jun 19 | $10,423 | $15,214 | $10,435 |
|---|
Jul 19 | $10,607 | $15,440 | $10,620 |
|---|
Aug 19 | $10,051 | $15,125 | $10,069 |
|---|
Sep 19 | $10,393 | $15,391 | $10,413 |
|---|
Oct 19 | $10,606 | $15,722 | $10,633 |
|---|
Nov 19 | $10,538 | $16,320 | $10,571 |
|---|
Dec 19 | $10,713 | $16,791 | $10,748 |
|---|
Jan 20 | $10,527 | $16,773 | $10,566 |
|---|
Feb 20 | $9,968 | $15,400 | $10,007 |
|---|
Mar 20 | $8,999 | $13,282 | $9,032 |
|---|
Apr 20 | $9,846 | $15,041 | $9,878 |
|---|
May 20 | $10,197 | $15,845 | $10,233 |
|---|
Jun 20 | $10,030 | $16,207 | $10,067 |
|---|
Jul 20 | $10,444 | $17,128 | $10,492 |
|---|
Aug 20 | $10,579 | $18,369 | $10,627 |
|---|
Sep 20 | $9,973 | $17,700 | $10,023 |
|---|
Oct 20 | $9,761 | $17,318 | $9,810 |
|---|
Nov 20 | $10,919 | $19,425 | $10,975 |
|---|
Dec 20 | $11,150 | $20,298 | $11,213 |
|---|
Jan 21 | $11,364 | $20,208 | $11,432 |
|---|
Feb 21 | $11,309 | $20,840 | $11,379 |
|---|
Mar 21 | $12,043 | $21,587 | $12,120 |
|---|
Apr 21 | $12,222 | $22,700 | $12,301 |
|---|
May 21 | $12,322 | $22,803 | $12,406 |
|---|
Jun 21 | $12,421 | $23,365 | $12,511 |
|---|
Jul 21 | $12,657 | $23,761 | $12,754 |
|---|
Aug 21 | $12,911 | $24,438 | $13,014 |
|---|
Sep 21 | $12,236 | $23,342 | $12,340 |
|---|
Oct 21 | $11,995 | $24,920 | $12,098 |
|---|
Nov 21 | $11,598 | $24,541 | $11,701 |
|---|
Dec 21 | $12,452 | $25,507 | $12,568 |
|---|
Jan 22 | $11,711 | $24,006 | $11,823 |
|---|
Feb 22 | $11,387 | $23,402 | $11,502 |
|---|
Mar 22 | $11,365 | $24,161 | $11,482 |
|---|
Apr 22 | $9,888 | $21,993 | $9,993 |
|---|
May 22 | $10,385 | $21,963 | $10,498 |
|---|
Jun 22 | $9,611 | $20,126 | $9,720 |
|---|
Jul 22 | $9,768 | $22,014 | $9,879 |
|---|
Aug 22 | $9,466 | $21,192 | $9,577 |
|---|
Sep 22 | $8,020 | $19,227 | $8,116 |
|---|
Oct 22 | $8,852 | $20,804 | $8,964 |
|---|
Nov 22 | $9,134 | $21,890 | $9,246 |
|---|
Dec 22 | $8,683 | $20,608 | $8,794 |
|---|
Jan 23 | $9,412 | $22,027 | $9,533 |
|---|
Feb 23 | $8,860 | $21,513 | $8,976 |
|---|
Mar 23 | $9,028 | $22,088 | $9,149 |
|---|
Apr 23 | $8,791 | $22,323 | $8,908 |
|---|
May 23 | $8,351 | $22,410 | $8,465 |
|---|
Jun 23 | $8,671 | $23,940 | $8,789 |
|---|
Jul 23 | $8,791 | $24,798 | $8,911 |
|---|
Aug 23 | $8,961 | $24,320 | $9,090 |
|---|
Sep 23 | $8,395 | $23,161 | $8,518 |
|---|
Oct 23 | $8,162 | $22,547 | $8,285 |
|---|
Nov 23 | $8,533 | $24,650 | $8,664 |
|---|
Dec 23 | $9,020 | $25,957 | $9,161 |
|---|
Jan 24 | $9,310 | $26,245 | $9,460 |
|---|
Feb 24 | $8,708 | $27,666 | $8,842 |
|---|
Mar 24 | $8,771 | $28,558 | $8,908 |
|---|
Apr 24 | $8,210 | $27,301 | $8,341 |
|---|
May 24 | $8,653 | $28,591 | $8,793 |
|---|
Jun 24 | $8,727 | $29,476 | $8,871 |
|---|
Jul 24 | $9,268 | $30,024 | $9,424 |
|---|
Aug 24 | $9,455 | $30,678 | $9,617 |
|---|
Sep 24 | $10,198 | $31,313 | $10,378 |
|---|
Oct 24 | $10,327 | $31,083 | $10,513 |
|---|
Nov 24 | $11,197 | $33,150 | $11,401 |
|---|
Dec 24 | $10,872 | $32,137 | $11,075 |
|---|
Jan 25 | $11,121 | $33,152 | $11,330 |
|---|
Feb 25 | $11,513 | $32,516 | $11,733 |
|---|
Mar 25 | $11,173 | $30,620 | $11,390 |
|---|
Apr 25 | $11,001 | $30,414 | $11,218 |
|---|
May 25 | $11,434 | $32,342 | $11,663 |
|---|
Jun 25 | $12,197 | $33,985 | $12,447 |
|---|
Jul 25 | $12,223 | $34,734 | $12,479 |
|---|
Aug 25 | $12,923 | $35,537 | $13,198 |
|---|
Sep 25 | $13,306 | $36,764 | $13,595 |
|---|
Oct 25 | $13,609 | $37,552 | $13,913 |
|---|
Nov 25 | $13,510 | $37,655 | $13,814 |
|---|
Dec 25 | $14,056 | $37,647 | $14,379 |
|---|
Jan 26 | $14,870 | $38,231 | $15,230 |
|---|
Feb 26 | $16,484 | $38,049 | $16,891 |
|---|
Mar 26 | $16,367 | $36,157 | $16,777 |
|---|
See “Average annual total returns” for additional information on fund performance. |
|
| No Deduction of Taxes [Text Block] |
|
Performance results do not reflect the deduction of taxes that a shareholder would pay on fund distributions or on the redemption or sale of fund shares.
|
|
| AssetsNet |
|
$ 794,264,815
|
|
| Holdings Count | Holding |
|
24
|
|
| Advisory Fees Paid, Amount |
|
$ 2,167,963
|
|
| InvestmentCompanyPortfolioTurnover |
|
44.00%
|
|
| Additional Fund Statistics [Text Block] |
|
Table SummaryNet Assets........................................................................................................................................................................................................................................................................................................................................................................................................................................................................................................................................................................................................................................................................................................................................................................................................................................................................................................................................................................................................................................ | $794,264,815 |
|---|
Number of Portfolio Holdings........................................................................................................................................................................................................................................................................................................................................................................................................................................................................................................................................................................................................................................................................................................................................................................................................................................................................................................................................................................................................................................ | 24 |
|---|
Net Investment Advisory Fees........................................................................................................................................................................................................................................................................................................................................................................................................................................................................................................................................................................................................................................................................................................................................................................................................................................................................................................................................................................................................................................ | $2,167,963 |
|---|
Portfolio Turnover Rate........................................................................................................................................................................................................................................................................................................................................................................................................................................................................................................................................................................................................................................................................................................................................................................................................................................................................................................................................................................................................................................ | 44% |
|---|
|
|
| C000261357 |
|
|
|
| Shareholder Report [Line Items] |
|
|
|
| Fund Name |
|
iShares Texas Equity ETF
|
|
| Trading Symbol |
|
TEXN
|
|
| Security Exchange Name |
|
NASDAQ
|
|
| Annual or Semi-Annual Statement [Text Block] |
|
This annual shareholder report contains important information about iShares Texas Equity ETF (the “Fund”) for the period of June 23, 2025 to March 31, 2026
|
|
| Additional Information [Text Block] |
|
You can find additional information about the Fund at blackrock.com/fundreports. You can also request this information by contacting us at 1-800-iShares (1-800-474-2737).
|
|
| Additional Information Phone Number |
|
1-800-474-2737
|
|
| Additional Information Website |
|
blackrock.com/fundreports
|
|
| Expenses [Text Block] |
|
What were the Fund costs for the period?(based on a hypothetical $10,000 investment) Table SummaryFund name | Costs of a $10,000
investment | Costs paid as a percentage of a
$10,000 investment |
|---|
iShares Texas Equity ETF | $17Footnote Reference(a) | 0.20%Footnote Reference(b) |
|---|
| Footnote | Description | Footnote(a) | The Fund commenced operations during the reporting period. Expenses for a full reporting period would be higher than the amount shown. | Footnote(b) | Annualized. |
|
|
| Expenses Paid, Amount |
[1] |
$ 17
|
|
| Expense Ratio, Percent |
[2] |
0.20%
|
|
| Factors Affecting Performance [Text Block] |
|
How did the Fund perform during the period?For the reporting period ended March 31, 2026, the Fund returned 22.36%. For the same period, the Russell 3000® Index returned 9.54% and the Russell Texas Equity Index returned 22.57%.
What contributed to performance? Companies headquartered in Texas advanced during the reporting period, even as volatility resurfaced later in the period amid renewed geopolitical tensions in the Middle East. Energy stocks were the largest contributors to the Fund’s return, supported by steady U.S. oil production growth and resilient demand. Oil prices surged late in the reporting period as the war in Iran heightened supply fears and benefited firms across the energy value chain. Integrated oil and gas producers gained as steady output and robust cash flows funded dividends and stock buybacks. The industrials sector advanced due to record U.S. defense budgets, aircraft upgrades, infrastructure spending, and surging global orders amid geopolitical tensions. Additionally, increased infrastructure spending supported firms that supply construction and engineering and heavy machinery. What detracted from performance? During the reporting period, software and services stocks detracted from the Fund’s return, amid growing investor concerns over artificial intelligence tools disrupting the revenue streams of traditional models. The views expressed reflect the opinions of BlackRock as of the date of this report and are subject to change based on changes in market, economic or other conditions. These views are not intended to be a forecast of future events and are no guarantee of future results. |
|
| Performance Past Does Not Indicate Future [Text] |
|
Past performance is not an indication of future results.
|
|
| Line Graph [Table Text Block] |
|
Table Summary | Fund | Russell 3000® Index | Russell Texas Equity Index |
|---|
Jun-25 | $10,000 | $10,000 | $10,000 |
|---|
Jun-25 | $9,991 | $10,296 | $9,992 |
|---|
Jul-25 | $10,248 | $10,522 | $10,251 |
|---|
Aug-25 | $10,440 | $10,766 | $10,445 |
|---|
Sep-25 | $11,060 | $11,138 | $11,068 |
|---|
Oct-25 | $11,056 | $11,376 | $11,066 |
|---|
Nov-25 | $10,837 | $11,407 | $10,846 |
|---|
Dec-25 | $10,845 | $11,405 | $10,856 |
|---|
Jan-26 | $11,587 | $11,582 | $11,602 |
|---|
Feb-26 | $12,118 | $11,527 | $12,134 |
|---|
Mar-26 | $12,236 | $10,954 | $12,257 |
|---|
|
|
| No Deduction of Taxes [Text Block] |
|
Performance results do not reflect the deduction of taxes that a shareholder would pay on fund distributions or on the redemption or sale of fund shares.
|
|
| AssetsNet |
|
$ 15,829,558
|
|
| Holdings Count | Holding |
|
195
|
|
| Advisory Fees Paid, Amount |
|
$ 20,242
|
|
| InvestmentCompanyPortfolioTurnover |
|
10.00%
|
|
| Additional Fund Statistics [Text Block] |
|
Table SummaryNet Assets........................................................................................................................................................................................................................................................................................................................................................................................................................................................................................................................................................................................................................................................................................................................................................................................................................................................................................................................................................................................................................................ | $15,829,558 |
|---|
Number of Portfolio Holdings........................................................................................................................................................................................................................................................................................................................................................................................................................................................................................................................................................................................................................................................................................................................................................................................................................................................................................................................................................................................................................................ | 195 |
|---|
Net Investment Advisory Fees........................................................................................................................................................................................................................................................................................................................................................................................................................................................................................................................................................................................................................................................................................................................................................................................................................................................................................................................................................................................................................................ | $20,242 |
|---|
Portfolio Turnover Rate........................................................................................................................................................................................................................................................................................................................................................................................................................................................................................................................................................................................................................................................................................................................................................................................................................................................................................................................................................................................................................................ | 10% |
|---|
|
|
| Holdings [Text Block] |
|
Table SummarySector | Percent of Total InvestmentsFootnote Reference(a) |
|---|
Energy........................................................................................................................................................................................................................................................................................................................................................................................................................................................................................................................................................................................................................................................................................................................................................................................................................................................................................................................................................................................................................................ | 39.2% | Industrials........................................................................................................................................................................................................................................................................................................................................................................................................................................................................................................................................................................................................................................................................................................................................................................................................................................................................................................................................................................................................................................ | 15.0 | Information Technology........................................................................................................................................................................................................................................................................................................................................................................................................................................................................................................................................................................................................................................................................................................................................................................................................................................................................................................................................................................................................................................ | 13.0 | Consumer Discretionary........................................................................................................................................................................................................................................................................................................................................................................................................................................................................................................................................................................................................................................................................................................................................................................................................................................................................................................................................................................................................................................ | 10.9 | Communication Services........................................................................................................................................................................................................................................................................................................................................................................................................................................................................................................................................................................................................................................................................................................................................................................................................................................................................................................................................................................................................................................ | 4.5 | Financials........................................................................................................................................................................................................................................................................................................................................................................................................................................................................................................................................................................................................................................................................................................................................................................................................................................................................................................................................................................................................................................ | 4.2 | Real Estate........................................................................................................................................................................................................................................................................................................................................................................................................................................................................................................................................................................................................................................................................................................................................................................................................................................................................................................................................................................................................................................ | 4.0 | Health Care........................................................................................................................................................................................................................................................................................................................................................................................................................................................................................................................................................................................................................................................................................................................................................................................................................................................................................................................................................................................................................................ | 3.2 | Utilities........................................................................................................................................................................................................................................................................................................................................................................................................................................................................................................................................................................................................................................................................................................................................................................................................................................................................................................................................................................................................................................ | 2.9 | Consumer Staples........................................................................................................................................................................................................................................................................................................................................................................................................................................................................................................................................................................................................................................................................................................................................................................................................................................................................................................................................................................................................................................ | 2.1 | Materials........................................................................................................................................................................................................................................................................................................................................................................................................................................................................................................................................................................................................................................................................................................................................................................................................................................................................................................................................................................................................................................ | 1.0 | | Footnote | Description | Footnote(a) | Excludes money market funds. |
Table SummarySecurity | Percent of Total InvestmentsFootnote Reference(a) |
|---|
Exxon Mobil Corp......................................................................................................................................................................................................................................................................................................................................................................................................................................................................................................................................................................................................................................................................................................................................................................................................................................................................................................................................................................................................................................... | 11.1% | Tesla, Inc......................................................................................................................................................................................................................................................................................................................................................................................................................................................................................................................................................................................................................................................................................................................................................................................................................................................................................................................................................................................................................................... | 9.0 | Chevron Corp......................................................................................................................................................................................................................................................................................................................................................................................................................................................................................................................................................................................................................................................................................................................................................................................................................................................................................................................................................................................................................................... | 7.4 | Caterpillar, Inc......................................................................................................................................................................................................................................................................................................................................................................................................................................................................................................................................................................................................................................................................................................................................................................................................................................................................................................................................................................................................................................... | 6.3 | Oracle Corp......................................................................................................................................................................................................................................................................................................................................................................................................................................................................................................................................................................................................................................................................................................................................................................................................................................................................................................................................................................................................................................... | 4.7 | AT&T, Inc......................................................................................................................................................................................................................................................................................................................................................................................................................................................................................................................................................................................................................................................................................................................................................................................................................................................................................................................................................................................................................................... | 3.8 | Texas Instruments, Inc......................................................................................................................................................................................................................................................................................................................................................................................................................................................................................................................................................................................................................................................................................................................................................................................................................................................................................................................................................................................................................................... | 3.4 | ConocoPhillips........................................................................................................................................................................................................................................................................................................................................................................................................................................................................................................................................................................................................................................................................................................................................................................................................................................................................................................................................................................................................................................ | 3.1 | Charles Schwab Corp. (The)........................................................................................................................................................................................................................................................................................................................................................................................................................................................................................................................................................................................................................................................................................................................................................................................................................................................................................................................................................................................................................................ | 3.0 | McKesson Corp......................................................................................................................................................................................................................................................................................................................................................................................................................................................................................................................................................................................................................................................................................................................................................................................................................................................................................................................................................................................................................................... | 2.1 | |
|
| C000222498 |
|
|
|
| Shareholder Report [Line Items] |
|
|
|
| Fund Name |
|
iShares US Small Cap Value Factor ETF
|
|
| Trading Symbol |
|
SVAL
|
|
| Security Exchange Name |
|
CboeBZX
|
|
| Annual or Semi-Annual Statement [Text Block] |
|
This annual shareholder report contains important information about iShares US Small Cap Value Factor ETF (the “Fund”) for the period of April 1, 2025 to March 31, 2026
|
|
| Additional Information [Text Block] |
|
You can find additional information about the Fund at blackrock.com/fundreports. You can also request this information by contacting us at 1-800-iShares (1-800-474-2737).
|
|
| Additional Information Phone Number |
|
1-800-474-2737
|
|
| Additional Information Website |
|
blackrock.com/fundreports
|
|
| Expenses [Text Block] |
|
What were the Fund costs for the last year?(based on a hypothetical $10,000 investment) Table SummaryFund name | Costs of a $10,000
investment | Costs paid as a percentage of a
$10,000 investment |
|---|
iShares US Small Cap Value Factor ETF | $22 | 0.20% |
|---|
|
|
| Expenses Paid, Amount |
|
$ 22
|
|
| Expense Ratio, Percent |
|
0.20%
|
|
| Performance Past Does Not Indicate Future [Text] |
|
Past performance is not an indication of future results.
|
|
| Line Graph [Table Text Block] |
|
Cumulative performance: October 27, 2020 through March 31, 2026 Initial investment of $10,000  Table Summary | Fund | Russell 3000® Index | Russell 2000 Focused Value Select Index |
|---|
Sep 20 | $10,000 | $10,000 | $10,000 |
|---|
Oct 20 | $9,821 | $9,640 | $9,823 |
|---|
Nov 20 | $11,585 | $10,812 | $11,610 |
|---|
Dec 20 | $12,592 | $11,299 | $12,624 |
|---|
Jan 21 | $12,905 | $11,249 | $12,933 |
|---|
Feb 21 | $14,694 | $11,600 | $14,730 |
|---|
Mar 21 | $15,705 | $12,016 | $15,758 |
|---|
Apr 21 | $16,034 | $12,635 | $16,097 |
|---|
May 21 | $16,568 | $12,693 | $16,639 |
|---|
Jun 21 | $15,896 | $13,006 | $15,965 |
|---|
Jul 21 | $15,441 | $13,226 | $15,505 |
|---|
Aug 21 | $15,772 | $13,603 | $15,838 |
|---|
Sep 21 | $15,598 | $12,993 | $15,672 |
|---|
Oct 21 | $16,243 | $13,872 | $16,327 |
|---|
Nov 21 | $15,941 | $13,660 | $16,014 |
|---|
Dec 21 | $16,787 | $14,198 | $16,872 |
|---|
Jan 22 | $16,152 | $13,363 | $16,237 |
|---|
Feb 22 | $16,504 | $13,026 | $16,593 |
|---|
Mar 22 | $16,143 | $13,449 | $16,232 |
|---|
Apr 22 | $15,019 | $12,242 | $15,114 |
|---|
May 22 | $15,596 | $12,226 | $15,693 |
|---|
Jun 22 | $14,177 | $11,203 | $14,269 |
|---|
Jul 22 | $15,555 | $12,254 | $15,653 |
|---|
Aug 22 | $14,921 | $11,796 | $15,015 |
|---|
Sep 22 | $13,719 | $10,703 | $13,808 |
|---|
Oct 22 | $15,604 | $11,580 | $15,710 |
|---|
Nov 22 | $16,180 | $12,185 | $16,292 |
|---|
Dec 22 | $15,090 | $11,471 | $15,198 |
|---|
Jan 23 | $16,046 | $12,261 | $16,164 |
|---|
Feb 23 | $15,970 | $11,975 | $16,090 |
|---|
Mar 23 | $14,376 | $12,295 | $14,487 |
|---|
Apr 23 | $13,768 | $12,426 | $13,880 |
|---|
May 23 | $13,324 | $12,474 | $13,434 |
|---|
Jun 23 | $14,489 | $13,326 | $14,616 |
|---|
Jul 23 | $15,849 | $13,804 | $15,992 |
|---|
Aug 23 | $15,113 | $13,537 | $15,251 |
|---|
Sep 23 | $14,453 | $12,893 | $14,588 |
|---|
Oct 23 | $13,856 | $12,551 | $13,994 |
|---|
Nov 23 | $14,948 | $13,721 | $15,100 |
|---|
Dec 23 | $16,949 | $14,449 | $17,123 |
|---|
Jan 24 | $16,158 | $14,609 | $16,329 |
|---|
Feb 24 | $16,236 | $15,400 | $16,413 |
|---|
Mar 24 | $16,954 | $15,897 | $17,143 |
|---|
Apr 24 | $15,853 | $15,197 | $16,033 |
|---|
May 24 | $16,501 | $15,915 | $16,689 |
|---|
Jun 24 | $16,297 | $16,408 | $16,487 |
|---|
Jul 24 | $18,683 | $16,713 | $18,928 |
|---|
Aug 24 | $18,263 | $17,077 | $18,504 |
|---|
Sep 24 | $18,066 | $17,430 | $18,306 |
|---|
Oct 24 | $17,897 | $17,302 | $18,140 |
|---|
Nov 24 | $20,018 | $18,453 | $20,294 |
|---|
Dec 24 | $18,239 | $17,889 | $18,493 |
|---|
Jan 25 | $18,510 | $18,454 | $18,769 |
|---|
Feb 25 | $17,889 | $18,100 | $18,142 |
|---|
Mar 25 | $16,840 | $17,044 | $17,082 |
|---|
Apr 25 | $16,013 | $16,930 | $16,251 |
|---|
May 25 | $16,805 | $18,003 | $17,058 |
|---|
Jun 25 | $17,537 | $18,917 | $17,803 |
|---|
Jul 25 | $17,591 | $19,334 | $17,860 |
|---|
Aug 25 | $19,230 | $19,782 | $19,545 |
|---|
Sep 25 | $19,039 | $20,464 | $19,362 |
|---|
Oct 25 | $18,739 | $20,903 | $19,062 |
|---|
Nov 25 | $19,447 | $20,960 | $19,789 |
|---|
Dec 25 | $19,744 | $20,956 | $20,100 |
|---|
Jan 26 | $21,092 | $21,281 | $21,468 |
|---|
Feb 26 | $21,533 | $21,180 | $21,902 |
|---|
Mar 26 | $20,722 | $20,127 | $21,078 |
|---|
See “Average annual total returns” for additional information on fund performance. |
|
| Performance Inception Date |
|
Oct. 27, 2020
|
|
| No Deduction of Taxes [Text Block] |
|
Performance results do not reflect the deduction of taxes that a shareholder would pay on fund distributions or on the redemption or sale of fund shares.
|
|
| AssetsNet |
|
$ 168,992,634
|
|
| Holdings Count | Holding |
|
254
|
|
| Advisory Fees Paid, Amount |
|
$ 252,022
|
|
| InvestmentCompanyPortfolioTurnover |
|
125.00%
|
|
| Additional Fund Statistics [Text Block] |
|
Table SummaryNet Assets........................................................................................................................................................................................................................................................................................................................................................................................................................................................................................................................................................................................................................................................................................................................................................................................................................................................................................................................................................................................................................................ | $168,992,634 |
|---|
Number of Portfolio Holdings........................................................................................................................................................................................................................................................................................................................................................................................................................................................................................................................................................................................................................................................................................................................................................................................................................................................................................................................................................................................................................................ | 254 |
|---|
Net Investment Advisory Fees........................................................................................................................................................................................................................................................................................................................................................................................................................................................................................................................................................................................................................................................................................................................................................................................................................................................................................................................................................................................................................................ | $252,022 |
|---|
Portfolio Turnover Rate........................................................................................................................................................................................................................................................................................................................................................................................................................................................................................................................................................................................................................................................................................................................................................................................................................................................................................................................................................................................................................................ | 125% |
|---|
|
|
|
|