Shareholder Report
Mar. 31, 2026
USD ($)
Holding
What were the Fund costs for the last year?
(based on a hypothetical $10,000 investment)
| Fund name | Costs of a $10,000 investment |
Costs paid as a percentage of a $10,000 investment |
| $22 | 0.20% |
How did the Fund perform last year?
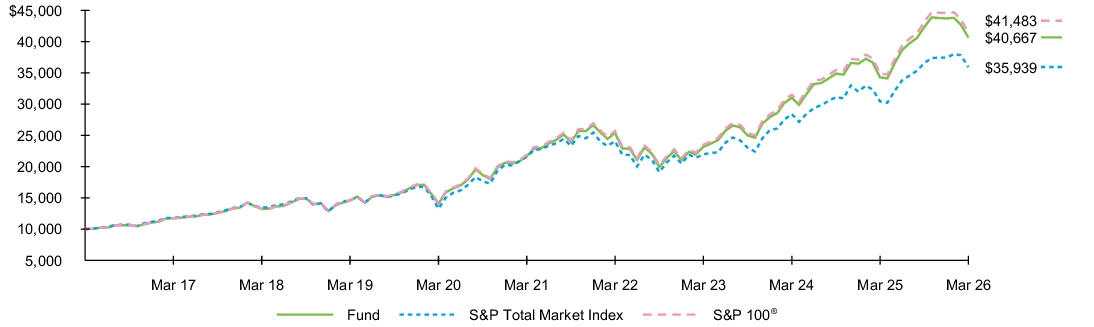
- For the reporting period ended March 31, 2026, the Fund returned 18.67%.
- For the same period, the S&P Total Market Index returned 18.14% and the S&P 100® returned 18.91%.
What contributed to performance?
U.S. equities advanced during the reporting period, supported by resilient economic growth and sustained investor enthusiasm for large-cap technology and artificial intelligence (“AI”) related names. However, volatility resurfaced later in the period amid renewed geopolitical tensions in the Middle East. Stocks in the U.S. information technology sector were the largest contributors to the Fund’s return, particularly semiconductor stocks, driven by robust demand for AI, cloud computing, and data center infrastructure. An interactive media and services company in the communication sector benefited from accelerating ad revenue growth, aided by AI-driven search expansion, alongside expanding cloud services fueled by surging enterprise AI demand. Additionally, the industrials sector contributed, driven by U.S. reshoring efforts, infrastructure spending, and robust aerospace and defense demand, heightened by geopolitical tensions.
What detracted from performance?
During the reporting period, there were no significant detractors from the Fund’s return.
The views expressed reflect the opinions of BlackRock as of the date of this report and are subject to change based on changes in market, economic or other conditions. These views are not intended to be a forecast of future events and are no guarantee of future results.
Fund performance
Cumulative performance: April 1, 2016 through March 31, 2026
Initial investment of $10,000
See “Average annual total returns” for additional information on fund performance.
Average annual total returns
| 1 Year | 5 Years | 10 Years | |||
| 18.67 | % | 13.41 | % | 15.06 | % |
| 18.14 | 10.76 | 13.65 | |||
| 18.91 | 13.64 | 15.29 |
Key Fund statistics
| $17,777,668,397 |
| 103 |
| $47,802,574 |
| 5% |
What did the Fund invest in?
(as of March 31, 2026)
Sector allocation
| Sector | Percent of Total Investments(a) |
|
| 38.9 | % | |
| 13.5 | ||
| 11.3 | ||
| 10.2 | ||
| 9.3 | ||
| 5.9 | ||
| 5.8 | ||
| 3.1 | ||
| 1.0 | ||
| 0.6 | ||
| 0.4 |
Ten largest holdings
| Security | Percent of Total Investments(a) |
|
| 10.5 | % | |
| 9.2 | ||
| 6.8 | ||
| 5.0 | ||
| 4.2 | ||
| 3.6 | ||
| 3.3 | ||
| 3.1 | ||
| 2.6 | ||
| 2.2 |
| Excludes money market funds. |
Ten largest holdings
| Security | Percent of Total Investments(a) |
|
| 10.5 | % | |
| 9.2 | ||
| 6.8 | ||
| 5.0 | ||
| 4.2 | ||
| 3.6 | ||
| 3.3 | ||
| 3.1 | ||
| 2.6 | ||
| 2.2 |
| Excludes money market funds. |
What were the Fund costs for the last year?
(based on a hypothetical $10,000 investment)
| Fund name | Costs of a $10,000 investment |
Costs paid as a percentage of a $10,000 investment |
| $5 | 0.05% |
How did the Fund perform last year?
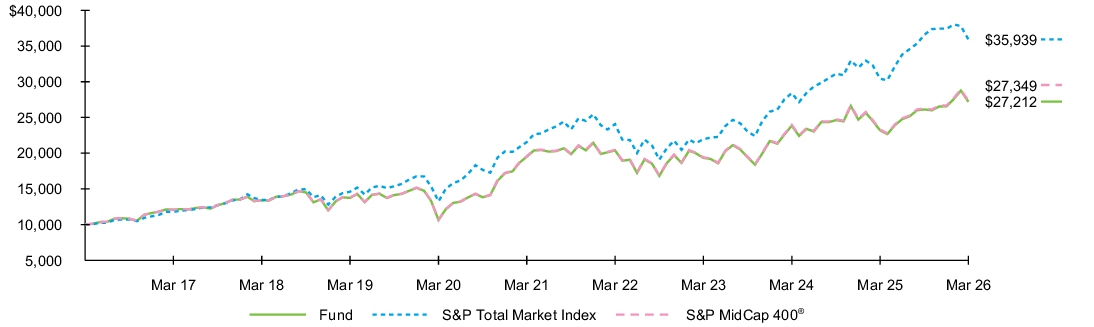
- For the reporting period ended March 31, 2026, the Fund returned 17.30%.
- For the same period, the S&P Total Market Index returned 18.14% and the S&P MidCap 400® returned 17.35%.
What contributed to performance?
U.S. equities advanced during the reporting period, supported by resilient economic growth and sustained investor enthusiasm for artificial intelligence (“AI”) related names. However, volatility resurfaced later in the period amid renewed geopolitical tensions in the Middle East. The industrials sector was the largest contributor to the Fund's performance, aided by record U.S. defense budgets, aircraft upgrades, and surging global orders amid geopolitical tensions. Additionally, increased infrastructure spending supported firms that supply construction and engineering and heavy machinery. In the information technology sector, technology hardware and equipment stocks contributed due to explosive AI data center demand boosting needs for specialized components. Energy stocks advanced, supported by steady U.S. oil production growth and resilient demand, and as oil prices surged late in the reporting period amid renewed Middle East geopolitical tensions that heightened supply fears.
What detracted from performance?
During the reporting period, application software stocks detracted from the Fund’s return, amid growing investor concerns over AI tools disrupting the revenue streams of traditional models.
The views expressed reflect the opinions of BlackRock as of the date of this report and are subject to change based on changes in market, economic or other conditions. These views are not intended to be a forecast of future events and are no guarantee of future results.
Fund performance
Cumulative performance: April 1, 2016 through March 31, 2026
Initial investment of $10,000
See “Average annual total returns” for additional information on fund performance.
Average annual total returns
| 1 Year | 5 Years | 10 Years | |||
| 17.30 | % | 6.88 | % | 10.53 | % |
| 18.14 | 10.76 | 13.65 | |||
| 17.35 | 6.92 | 10.58 |
Key Fund statistics
| $106,132,634,226 |
| 408 |
| $49,578,562 |
| 16% |
What did the Fund invest in?
(as of March 31, 2026)
Sector allocation
| Sector | Percent of Total Investments(a) |
|
| 25.7 | % | |
| 14.7 | ||
| 12.3 | ||
| 11.1 | ||
| 9.0 | ||
| 6.9 | ||
| 5.9 | ||
| 5.4 | ||
| 4.6 | ||
| 3.4 | ||
| 1.0 |
Ten largest holdings
| Security | Percent of Total Investments(a) |
|
| 0.9 | % | |
| 0.8 | ||
| 0.8 | ||
| 0.8 | ||
| 0.8 | ||
| 0.7 | ||
| 0.7 | ||
| 0.6 | ||
| 0.6 | ||
| 0.6 |
| Excludes money market funds. |
Ten largest holdings
| Security | Percent of Total Investments(a) |
|
| 0.9 | % | |
| 0.8 | ||
| 0.8 | ||
| 0.8 | ||
| 0.8 | ||
| 0.7 | ||
| 0.7 | ||
| 0.6 | ||
| 0.6 | ||
| 0.6 |
| Excludes money market funds. |
What were the Fund costs for the last year?
(based on a hypothetical $10,000 investment)
| Fund name | Costs of a $10,000 investment |
Costs paid as a percentage of a $10,000 investment |
| $20 | 0.18% |
How did the Fund perform last year?
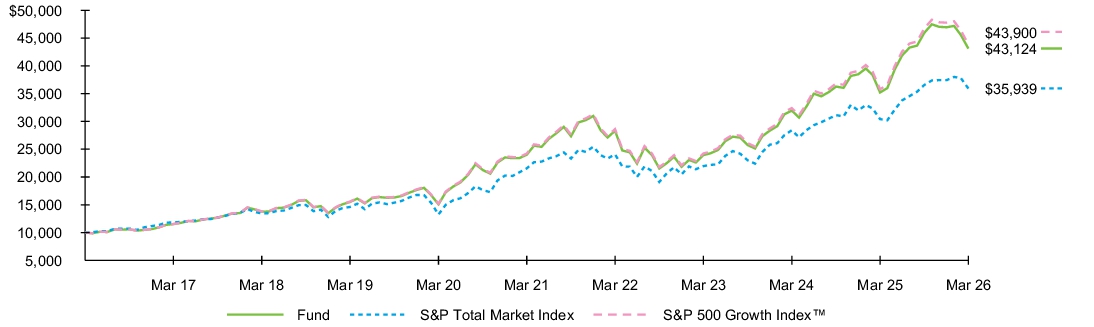
- For the reporting period ended March 31, 2026, the Fund returned 22.44%.
- For the same period, the S&P Total Market Index returned 18.14% and the S&P 500 Growth Index™ returned 22.67%.
What contributed to performance?
U.S. equities advanced during the reporting period, supported by resilient economic growth and sustained investor enthusiasm for large-cap technology and artificial intelligence (“AI”) related names. However, volatility resurfaced later in the period amid renewed geopolitical tensions in the Middle East. Stocks in the U.S. information technology sector were the largest contributors to the Fund’s return, particularly semiconductor stocks, driven by robust demand for AI, cloud computing, and data center infrastructure. An interactive media and services company in the communication sector benefited from accelerating ad revenue growth, aided by AI-driven search expansion, alongside expanding cloud services fueled by surging enterprise AI demand. Additionally, the industrials sector contributed, driven by U.S. reshoring efforts, infrastructure spending, and robust aerospace and defense demand, heightened by geopolitical tensions.
What detracted from performance?
During the reporting period, software and services stocks detracted from the Fund’s return, amid growing investor concerns over AI tools disrupting the revenue streams of traditional software business models.
The views expressed reflect the opinions of BlackRock as of the date of this report and are subject to change based on changes in market, economic or other conditions. These views are not intended to be a forecast of future events and are no guarantee of future results.
Fund performance
Cumulative performance: April 1, 2016 through March 31, 2026
Initial investment of $10,000
See “Average annual total returns” for additional information on fund performance.
Average annual total returns
| 1 Year | 5 Years | 10 Years | |||
| 22.44 | % | 12.43 | % | 15.74 | % |
| 18.14 | 10.76 | 13.65 | |||
| 22.67 | 12.63 | 15.94 |
Key Fund statistics
| $60,977,919,628 |
| 146 |
| $111,562,707 |
| 22% |
What did the Fund invest in?
(as of March 31, 2026)
Sector allocation
| Sector | Percent of Total Investments(a) |
|
| 48.1 | % | |
| 16.5 | ||
| 9.8 | ||
| 9.4 | ||
| 6.8 | ||
| 6.8 | ||
| 1.1 | ||
| 0.6 | ||
| 0.5 | ||
| 0.4 |
Ten largest holdings
| Security | Percent of Total Investments(a) |
|
| 14.6 | % | |
| 9.5 | ||
| 6.4 | ||
| 5.8 | ||
| 5.1 | ||
| 4.6 | ||
| 4.3 | ||
| 3.7 | ||
| 3.0 | ||
| 2.5 |
| Excludes money market funds. |
Ten largest holdings
| Security | Percent of Total Investments(a) |
|
| 14.6 | % | |
| 9.5 | ||
| 6.4 | ||
| 5.8 | ||
| 5.1 | ||
| 4.6 | ||
| 4.3 | ||
| 3.7 | ||
| 3.0 | ||
| 2.5 |
| Excludes money market funds. |
What were the Fund costs for the last year?
(based on a hypothetical $10,000 investment)
| Fund name | Costs of a $10,000 investment |
Costs paid as a percentage of a $10,000 investment |
| $19 | 0.18% |
How did the Fund perform last year?
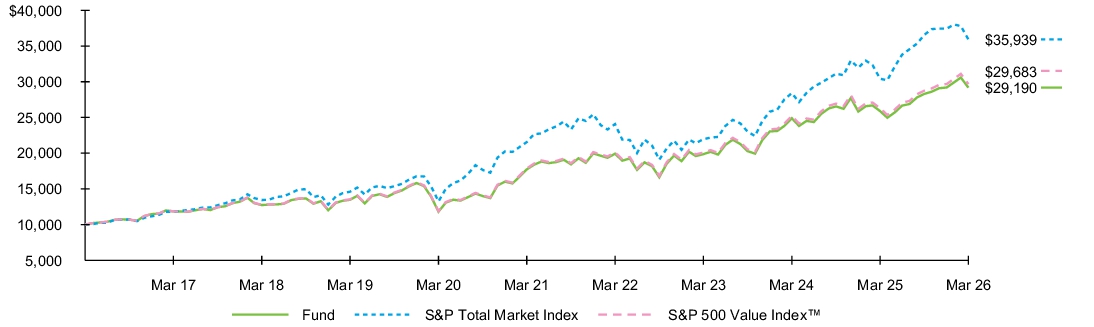
- For the reporting period ended March 31, 2026, the Fund returned 12.74%.
- For the same period, the S&P Total Market Index returned 18.14% and the S&P 500 Value Index™ returned 12.91%.
What contributed to performance?
Value stocks in the U.S. information technology sector were the largest contributors to the Fund’s return, particularly semiconductor stocks, as robust demand for AI, cloud computing, and data center infrastructure supported spending on advanced chips and semiconductor manufacturing equipment. Additionally, a consumer-facing technology hardware company gained as a major new smartphone launch drove record sales and an expanding software and subscription business added high-margin recurring revenue. Energy stocks also gained, supported by steady U.S. oil production growth and resilient demand, as oil prices surged late in the reporting period amid renewed Middle East geopolitical tensions that heightened supply fears. Established producers benefited as steady output and robust cash flows funded dividends and stock buybacks. In the industrials sector, value-oriented aerospace and defense firms advanced due to record U.S. defense budgets, aircraft upgrades, and surging global orders amid geopolitical tensions.
What detracted from performance?
During the reporting period, there were no significant detractors from the Fund’s return.
The views expressed reflect the opinions of BlackRock as of the date of this report and are subject to change based on changes in market, economic or other conditions. These views are not intended to be a forecast of future events and are no guarantee of future results.
Fund performance
Cumulative performance: April 1, 2016 through March 31, 2026
Initial investment of $10,000
See “Average annual total returns” for additional information on fund performance.
Average annual total returns
| 1 Year | 5 Years | 10 Years | |||
| 12.74 | % | 10.49 | % | 11.31 | % |
| 18.14 | 10.76 | 13.65 | |||
| 12.91 | 10.68 | 11.49 |
Key Fund statistics
| $46,606,444,733 |
| 443 |
| $76,906,704 |
| 28% |
What did the Fund invest in?
(as of March 31, 2026)
Sector allocation
| Sector | Percent of Total Investments(a) |
|
| 16.6 | % | |
| 15.6 | ||
| 12.3 | ||
| 11.4 | ||
| 10.4 | ||
| 9.7 | ||
| 8.3 | ||
| 4.8 | ||
| 3.9 | ||
| 3.6 | ||
| 3.4 |
Ten largest holdings
| Security | Percent of Total Investments(a) |
|
| 6.9 | % | |
| 3.5 | ||
| 2.6 | ||
| 2.0 | ||
| 1.6 | ||
| 1.5 | ||
| 1.4 | ||
| 1.2 | ||
| 1.2 | ||
| 1.2 |
| Excludes money market funds. |
Ten largest holdings
| Security | Percent of Total Investments(a) |
|
| 6.9 | % | |
| 3.5 | ||
| 2.6 | ||
| 2.0 | ||
| 1.6 | ||
| 1.5 | ||
| 1.4 | ||
| 1.2 | ||
| 1.2 | ||
| 1.2 |
| Excludes money market funds. |
What were the Fund costs for the last year?
(based on a hypothetical $10,000 investment)
| Fund name | Costs of a $10,000 investment |
Costs paid as a percentage of a $10,000 investment |
| $7 | 0.06% |
How did the Fund perform last year?
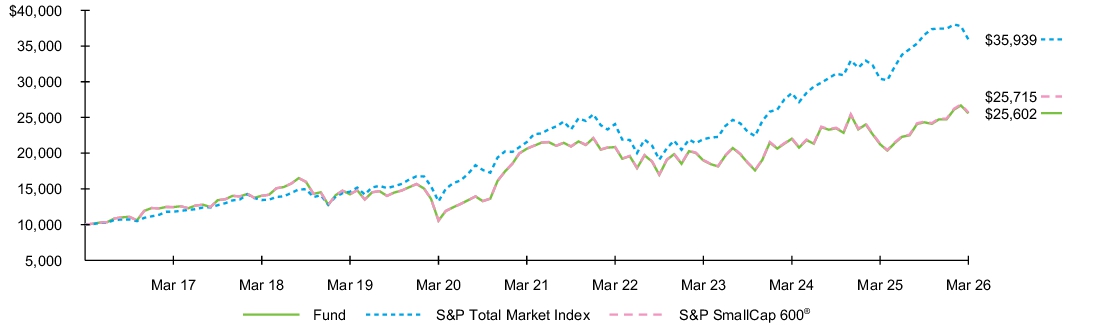
- For the reporting period ended March 31, 2026, the Fund returned 20.43%.
- For the same period, the S&P Total Market Index returned 18.14% and the S&P SmallCap 600® returned 20.50%.
What contributed to performance?
Small-cap stocks gained during the reporting period, supported by resilient U.S. economic growth and reshoring tailwinds. However, volatility resurfaced later in the reporting period amid renewed Middle East geopolitical tensions that spiked volatility. In this landscape, information technology stocks were the largest contributors to the Fund’s return, propelled by surging demand for artificial intelligence (“AI”) infrastructure and components amid the global expansion of data centers and generative AI models. Additionally, the industrials sector contributed, driven by U.S. reshoring efforts, infrastructure spending, and robust aerospace and defense demand, heightened by geopolitical tensions. Energy stocks were supported by steady U.S. oil production growth and resilient demand as oil prices surged late in the reporting period amid renewed Middle East geopolitical tensions that heightened supply fears.
What detracted from performance?
During the reporting period, healthcare equipment and supplies firms in the healthcare sector were modest detractors from the Fund’s return. These companies faced a challenging combination of regulatory and reimbursement uncertainty, earnings disappointments, and policy-driven headwinds.
The views expressed reflect the opinions of BlackRock as of the date of this report and are subject to change based on changes in market, economic or other conditions. These views are not intended to be a forecast of future events and are no guarantee of future results.
Fund performance
Cumulative performance: April 1, 2016 through March 31, 2026
Initial investment of $10,000
See “Average annual total returns” for additional information on fund performance.
Average annual total returns
| 1 Year | 5 Years | 10 Years | |||
| 20.43 | % | 4.42 | % | 9.86 | % |
| 18.14 | 10.76 | 13.65 | |||
| 20.50 | 4.49 | 9.90 |
Key Fund statistics
| $92,018,041,533 |
| 673 |
| $50,909,805 |
| 25% |
What did the Fund invest in?
(as of March 31, 2026)
Sector allocation
| Sector | Percent of Total Investments(a) |
|
| 17.9 | % | |
| 17.6 | ||
| 13.6 | ||
| 12.9 | ||
| 11.3 | ||
| 6.3 | ||
| 6.1 | ||
| 5.3 | ||
| 3.7 | ||
| 2.9 | ||
| 2.4 |
Ten largest holdings
| Security | Percent of Total Investments(a) |
|
| 0.6 | % | |
| 0.5 | ||
| 0.5 | ||
| 0.5 | ||
| 0.5 | ||
| 0.5 | ||
| 0.5 | ||
| 0.5 | ||
| 0.5 | ||
| 0.5 |
| Excludes money market funds. |
Ten largest holdings
| Security | Percent of Total Investments(a) |
|
| 0.6 | % | |
| 0.5 | ||
| 0.5 | ||
| 0.5 | ||
| 0.5 | ||
| 0.5 | ||
| 0.5 | ||
| 0.5 | ||
| 0.5 | ||
| 0.5 |
| Excludes money market funds. |
What were the Fund costs for the last year?
(based on a hypothetical $10,000 investment)
| Fund name | Costs of a $10,000 investment |
Costs paid as a percentage of a $10,000 investment |
| $20 | 0.18% |
How did the Fund perform last year?
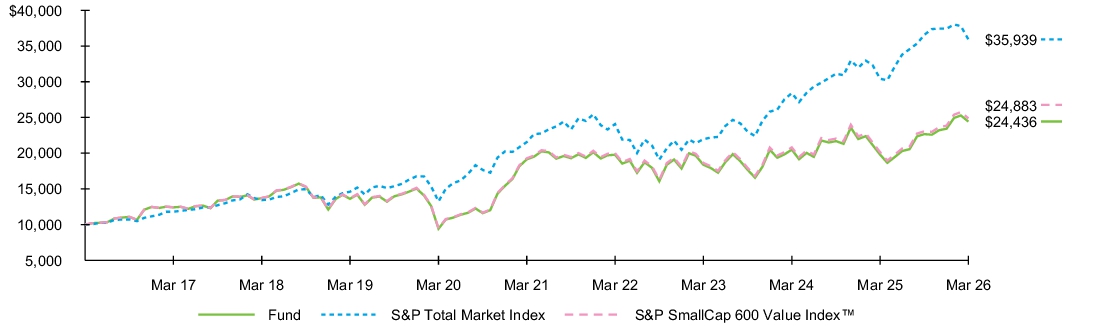
- For the reporting period ended March 31, 2026, the Fund returned 23.37%.
- For the same period, the S&P Total Market Index returned 18.14% and the S&P SmallCap 600 Value Index™ returned 23.56%.
What contributed to performance?
Small-cap value stocks gained during the reporting period, supported by resilient U.S. economic growth and reshoring tailwinds. However, volatility resurfaced later in the reporting period amid renewed Middle East geopolitical tensions that spiked volatility. Technology hardware and semiconductor stocks contributed to the Fund’s return as robust artificial intelligence (“AI”) data center demand boosting needs for memory chips, semiconductor manufacturing equipment, and testing systems. Among energy companies, oil and gas explorers benefited from a favorable commodity price environment alongside solid production growth. In the financials sector, regional banks posted solid gains over the period, supported by the Federal Reserve's rate cutting cycle, which eased funding costs and supported profitability alongside moderate loan growth.
What detracted from performance?
During the reporting period, software and services stocks detracted from the Fund’s return, amid growing investor concerns over AI tools disrupting the revenue streams of traditional software business models.
The views expressed reflect the opinions of BlackRock as of the date of this report and are subject to change based on changes in market, economic or other conditions. These views are not intended to be a forecast of future events and are no guarantee of future results.
Fund performance
Cumulative performance: April 1, 2016 through March 31, 2026
Initial investment of $10,000
See “Average annual total returns” for additional information on fund performance.
Average annual total returns
| 1 Year | 5 Years | 10 Years | |||
| 23.37 | % | 5.01 | % | 9.35 | % |
| 18.14 | 10.76 | 13.65 | |||
| 23.56 | 5.23 | 9.54 |
Key Fund statistics
| $7,627,702,941 |
| 496 |
| $11,875,560 |
| 56% |
What did the Fund invest in?
(as of March 31, 2026)
Sector allocation
| Sector | Percent of Total Investments(a) |
|
| 20.9 | % | |
| 15.9 | ||
| 13.7 | ||
| 9.3 | ||
| 8.4 | ||
| 7.5 | ||
| 7.3 | ||
| 6.6 | ||
| 4.5 | ||
| 3.3 | ||
| 2.6 |
Ten largest holdings
| Security | Percent of Total Investments(a) |
|
| 1.1 | % | |
| 1.0 | ||
| 0.9 | ||
| 0.9 | ||
| 0.9 | ||
| 0.9 | ||
| 0.8 | ||
| 0.8 | ||
| 0.8 | ||
| 0.7 |
| Excludes money market funds. |
Ten largest holdings
| Security | Percent of Total Investments(a) |
|
| 1.1 | % | |
| 1.0 | ||
| 0.9 | ||
| 0.9 | ||
| 0.9 | ||
| 0.9 | ||
| 0.8 | ||
| 0.8 | ||
| 0.8 | ||
| 0.7 |
| Excludes money market funds. |
What were the Fund costs for the last year?
(based on a hypothetical $10,000 investment)
| Fund name | Costs of a $10,000 investment |
Costs paid as a percentage of a $10,000 investment |
| $25 | 0.23% |
How did the Fund perform last year?
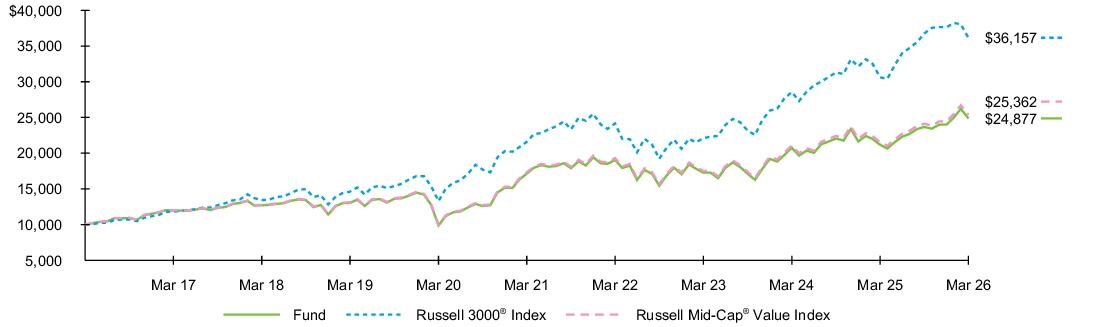
- For the reporting period ended March 31, 2026, the Fund returned 17.43%.
- For the same period, the Russell 3000® Index returned 18.09% and the Russell MidCap® Value Index returned 17.62%.
What contributed to performance?
U.S. equities advanced during the reporting period, supported by resilient economic growth and sustained investor enthusiasm for artificial intelligence (“AI”) related names. In this landscape, information technology stocks were the largest contributors to the Fund’s return. Technology hardware and equipment stocks were meaningful contributors to the Fund's return due to data center demand boosting needs for specialized components. Energy stocks advanced, supported by steady U.S. oil production growth and resilient demand. Oil prices surged late in the reporting period amid renewed Middle East geopolitical tensions that heightened supply fears. The industrials sector was driven by robust aerospace and defense demand, heightened by geopolitical tensions. Energy stocks also gained, supported by steady U.S. oil production growth and resilient demand. Oil prices surged late in the reporting period amid renewed Middle East geopolitical tensions that heightened supply fears.
What detracted from performance?
During the reporting period, there were no significant detractors from the Fund’s return.
The views expressed reflect the opinions of BlackRock as of the date of this report and are subject to change based on changes in market, economic or other conditions. These views are not intended to be a forecast of future events and are no guarantee of future results.
Fund performance
Cumulative performance: April 1, 2016 through March 31, 2026
Initial investment of $10,000
See “Average annual total returns” for additional information on fund performance.
Average annual total returns
| 1 Year | 5 Years | 10 Years | |||
| 17.43 | % | 7.73 | % | 9.54 | % |
| 18.09 | 10.87 | 13.72 | |||
| 17.62 | 7.94 | 9.75 |
Key Fund statistics
| $14,161,786,208 |
| 716 |
| $31,484,574 |
| 15% |
What did the Fund invest in?
(as of March 31, 2026)
Sector allocation
| Sector | Percent of Total Investments(a) |
|
| 17.4 | % | |
| 15.0 | ||
| 12.3 | ||
| 8.5 | ||
| 8.2 | ||
| 7.8 | ||
| 7.7 | ||
| 7.5 | ||
| 6.9 | ||
| 5.5 | ||
| 3.2 |
Ten largest holdings
| Security | Percent of Total Investments(a) |
|
| 1.1 | % | |
| 0.9 | ||
| 0.9 | ||
| 0.8 | ||
| 0.8 | ||
| 0.8 | ||
| 0.7 | ||
| 0.7 | ||
| 0.7 | ||
| 0.7 |
| Excludes money market funds. |
Ten largest holdings
| Security | Percent of Total Investments(a) |
|
| 1.1 | % | |
| 0.9 | ||
| 0.9 | ||
| 0.8 | ||
| 0.8 | ||
| 0.8 | ||
| 0.7 | ||
| 0.7 | ||
| 0.7 | ||
| 0.7 |
| Excludes money market funds. |
What were the Fund costs for the last year?
(based on a hypothetical $10,000 investment)
| Fund name | Costs of a $10,000 investment |
Costs paid as a percentage of a $10,000 investment |
| $4 | 0.04% |
How did the Fund perform last year?
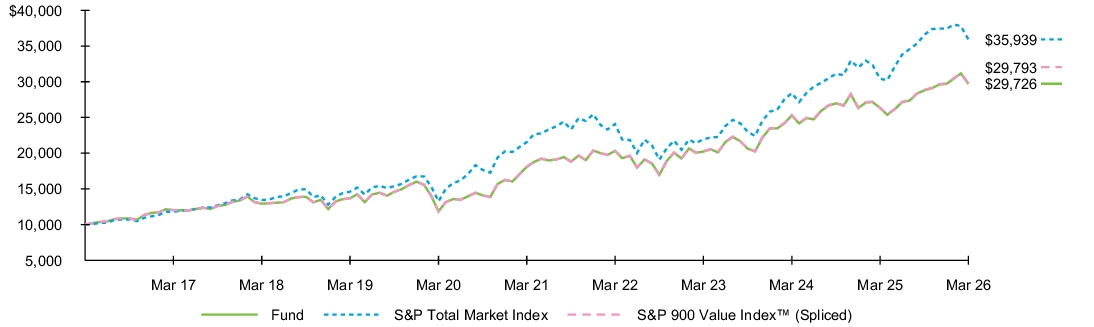
- For the reporting period ended March 31, 2026, the Fund returned 12.89%.
- For the same period, the S&P Total Market Index returned 18.14% and the S&P 900 Value Index™ (Spliced) returned 12.91%.
What contributed to performance?
U.S. equities advanced during the reporting period, supported by resilient economic growth and sustained investor enthusiasm for large-cap technology and artificial-intelligence (“AI”) related names. However, volatility resurfaced later in the period amid renewed geopolitical tensions in the Middle East. Value-oriented semiconductor stocks gained as heightened AI data center demand increased demand for memory chips, semiconductor manufacturing equipment, and testing systems. Additionally, a consumer-facing technology hardware company advanced amid resilient demand for its smartphone, while growth in its software and subscription services business supported margins. Energy stocks were supported by steady U.S. oil production growth and resilient demand, as oil prices surged late in the reporting period amid renewed Middle East geopolitical tensions that heightened supply fears. Firms in the industrials sector benefited from record U.S. defense budgets, infrastructure spending, aircraft upgrades, and surging global orders amid geopolitical tensions.
What detracted from performance?
During the reporting period, there were no significant detractors from the Fund’s return.
The views expressed reflect the opinions of BlackRock as of the date of this report and are subject to change based on changes in market, economic or other conditions. These views are not intended to be a forecast of future events and are no guarantee of future results.
Fund performance
Cumulative performance: April 1, 2016 through March 31, 2026
Initial investment of $10,000
See “Average annual total returns” for additional information on fund performance.
Average annual total returns
| 1 Year | 5 Years | 10 Years | |||
| 12.89 | % | 10.44 | % | 11.51 | % |
| 18.14 | 10.76 | 13.65 | |||
| 12.91 | 10.49 | 11.54 |
Key Fund statistics
| $24,069,243,521 |
| 745 |
| $8,955,208 |
| 28% |
What did the Fund invest in?
(as of March 31, 2026)
Sector allocation
| Sector | Percent of Total Investments(a) |
|
| 16.1 | % | |
| 16.0 | ||
| 11.8 | ||
| 11.8 | ||
| 10.5 | ||
| 9.5 | ||
| 8.3 | ||
| 4.8 | ||
| 4.1 | ||
| 3.6 | ||
| 3.5 |
Ten largest holdings
| Security | Percent of Total Investments(a) |
|
| 6.5 | % | |
| 3.4 | ||
| 2.5 | ||
| 1.9 | ||
| 1.6 | ||
| 1.4 | ||
| 1.4 | ||
| 1.2 | ||
| 1.2 | ||
| 1.1 |
| Excludes money market funds. |
Ten largest holdings
| Security | Percent of Total Investments(a) |
|
| 6.5 | % | |
| 3.4 | ||
| 2.5 | ||
| 1.9 | ||
| 1.6 | ||
| 1.4 | ||
| 1.4 | ||
| 1.2 | ||
| 1.2 | ||
| 1.1 |
| Excludes money market funds. |
What were the Fund costs for the last year?
(based on a hypothetical $10,000 investment)
| Fund name | Costs of a $10,000 investment |
Costs paid as a percentage of a $10,000 investment |
| $4 | 0.04% |
How did the Fund perform last year?
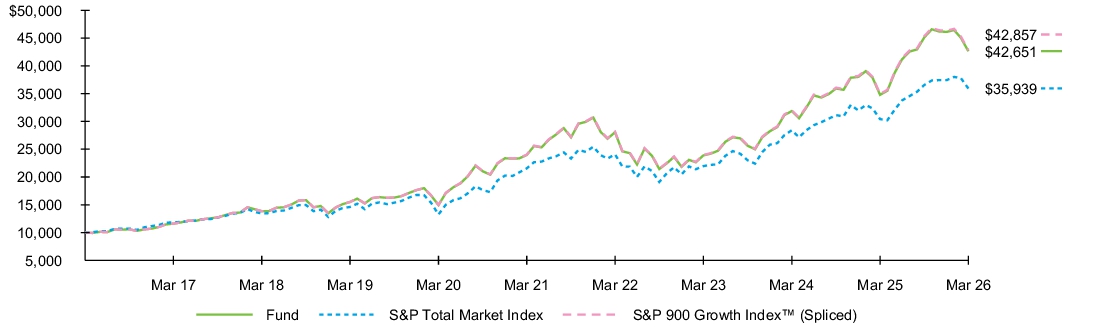
- For the reporting period ended March 31, 2026, the Fund returned 22.58%.
- For the same period, the S&P Total Market Index returned 18.14% and the S&P 900 Growth Index™ (Spliced) returned 22.63%.
What contributed to performance?
Information technology stocks were the largest contributors to the Fund’s return during the reporting period. Companies that provide semiconductors and semiconductor equipment benefited from surging artificial intelligence (“AI”) infrastructure demand, as hyperscale data center expansion spurred increased chip production and investment in semiconductor manufacturing capacity. Technology hardware and equipment stocks also contributed as a consumer-facing technology hardware company gained following a major smartphone launch that drove record sales, while growth in services and subscription revenue supported margins. An interactive media and services company in the communication sector benefited from accelerating ad revenue growth, aided by AI-driven search expansion, alongside expanding cloud services. Additionally, the industrials sector was supported by U.S. reshoring efforts and infrastructure spending, which supported demand for construction equipment and related machinery.
What detracted from performance?
During the reporting period, software and services stocks detracted from the Fund’s return, amid growing investor concerns over AI tools disrupting the revenue streams of traditional software models. In the financials sector, transaction and payment processing services firms were hindered by reduced consumer spending and stiff competition in payment processing.
The views expressed reflect the opinions of BlackRock as of the date of this report and are subject to change based on changes in market, economic or other conditions. These views are not intended to be a forecast of future events and are no guarantee of future results.
Fund performance
Cumulative performance: April 1, 2016 through March 31, 2026
Initial investment of $10,000
See “Average annual total returns” for additional information on fund performance.
Average annual total returns
| 1 Year | 5 Years | 10 Years | |||
| 22.58 | % | 12.22 | % | 15.61 | % |
| 18.14 | 10.76 | 13.65 | |||
| 22.63 | 12.27 | 15.67 |
Key Fund statistics
| $25,998,002,837 |
| 390 |
| $9,804,375 |
| 22% |
What did the Fund invest in?
(as of March 31, 2026)
Sector allocation
| Sector | Percent of Total Investments(a) |
|
| 46.4 | % | |
| 15.7 | ||
| 9.7 | ||
| 9.4 | ||
| 8.2 | ||
| 7.2 | ||
| 1.2 | ||
| 0.9 | ||
| 0.6 | ||
| 0.5 | ||
| 0.2 |
Ten largest holdings
| Security | Percent of Total Investments(a) |
|
| 13.9 | % | |
| 9.0 | ||
| 6.1 | ||
| 5.5 | ||
| 4.8 | ||
| 4.4 | ||
| 4.1 | ||
| 3.5 | ||
| 2.9 | ||
| 2.4 |
| Excludes money market funds. |
Ten largest holdings
| Security | Percent of Total Investments(a) |
|
| 13.9 | % | |
| 9.0 | ||
| 6.1 | ||
| 5.5 | ||
| 4.8 | ||
| 4.4 | ||
| 4.1 | ||
| 3.5 | ||
| 2.9 | ||
| 2.4 |
| Excludes money market funds. |
This report describes changes to the Fund that occurred during the reporting period.
What were the Fund costs for the last year?
(based on a hypothetical $10,000 investment)
| Fund name | Costs of a $10,000 investment |
Costs paid as a percentage of a $10,000 investment |
| $22 | 0.20% |
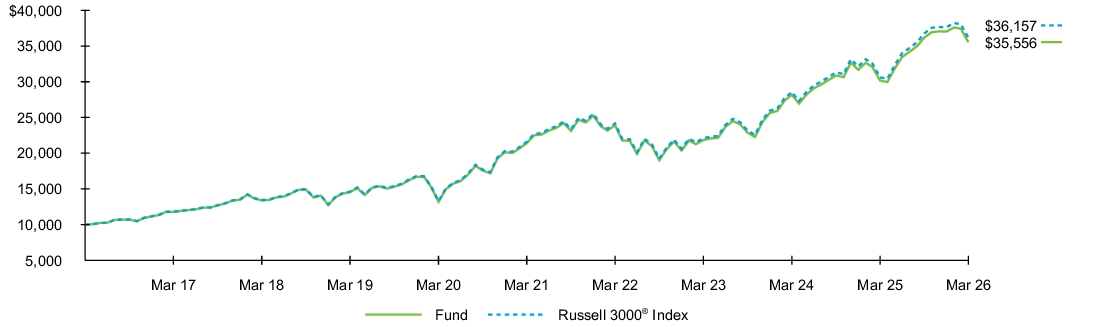
How did the Fund perform last year?
- For the reporting period ended March 31, 2026, the Fund returned 17.87%.
- For the same period, the Russell 3000® Index returned 18.09%.
What contributed to performance?
U.S. equities advanced during the reporting period, supported by resilient economic growth and sustained investor enthusiasm for artificial intelligence (“AI”) related names. However, volatility resurfaced later in the period amid renewed geopolitical tensions in the Middle East. Stocks in the information technology sector were the largest contributors to the Fund’s return, particularly semiconductor stocks, driven by robust demand for AI, cloud computing, and data center infrastructure. Technology hardware and equipment stocks also contributed due to the data center demand boosting needs for specialized components. In the communications sector, interactive media and services companies benefited from robust ad revenue growth and expanding cloud services. The industrials sector was driven by U.S. reshoring efforts, infrastructure spending, and robust aerospace and defense demand, heightened by geopolitical tensions.
What detracted from performance?
There were no significant detractors from returns during the reporting period.
The views expressed reflect the opinions of BlackRock as of the date of this report and are subject to change based on changes in market, economic or other conditions. These views are not intended to be a forecast of future events and are no guarantee of future results.
Fund performance
Cumulative performance: April 1, 2016 through March 31, 2026
Initial investment of $10,000
See “Average annual total returns” for additional information on fund performance.
Average annual total returns
| 1 Year | 5 Years | 10 Years | |||
| 17.87 | % | 10.69 | % | 13.52 | % |
| 18.09 | 10.87 | 13.72 |
Key Fund statistics
| $17,047,138,938 |
| 2,594 |
| $33,279,809 |
| 3% |
What did the Fund invest in?
(as of March 31, 2026)
Sector allocation
| Sector | Percent of Total Investments(a) |
|
| 30.3 | % | |
| 13.1 | ||
| 10.3 | ||
| 10.0 | ||
| 10.0 | ||
| 9.7 | ||
| 5.0 | ||
| 4.2 | ||
| 2.5 | ||
| 2.5 | ||
| 2.4 |
Ten largest holdings
| Security | Percent of Total Investments(a) |
|
| 6.5 | % | |
| 5.9 | ||
| 4.4 | ||
| 3.2 | ||
| 2.7 | ||
| 2.3 | ||
| 2.2 | ||
| 2.0 | ||
| 1.7 | ||
| 1.4 |
| Excludes money market funds. |
Ten largest holdings
| Security | Percent of Total Investments(a) |
|
| 6.5 | % | |
| 5.9 | ||
| 4.4 | ||
| 3.2 | ||
| 2.7 | ||
| 2.3 | ||
| 2.2 | ||
| 2.0 | ||
| 1.7 | ||
| 1.4 |
| Excludes money market funds. |
Material Fund changes
This is a summary of certain changes to the Fund since March 31, 2025. For more complete information, you may review the Fund’s next prospectus, which we expect to be available approximately 120 days after March 31, 2026 at blackrock.com/fundreports or upon request by contacting us at 1-800-iShares (1-800-474-2737).
Effective August 1, 2025, the investment management agreement was amended to add a new breakpoint tier of 0.1900% greater than $15billion.
Effective November 24, 2025, the Fund updated its investment policy to indicate that it intends to be “diversified,” as defined in the Investment Company Act of 1940, in approximately the same proportion as its Underlying Index is diversified. Therefore, shareholder approval will not be sought if the Fund crosses from diversified to non diversified status due solely to a change in the relative market capitalization or index weighting of the constituents of its Underlying Index.
This is a summary of certain changes to the Fund since March 31, 2025. For more complete information, you may review the Fund’s next prospectus, which we expect to be available approximately 120 days after March 31, 2026 at blackrock.com/fundreports or upon request by contacting us at 1-800-iShares (1-800-474-2737).
What were the Fund costs for the last year?
(based on a hypothetical $10,000 investment)
| Fund name | Costs of a $10,000 investment |
Costs paid as a percentage of a $10,000 investment |
| $46 | 0.45% |
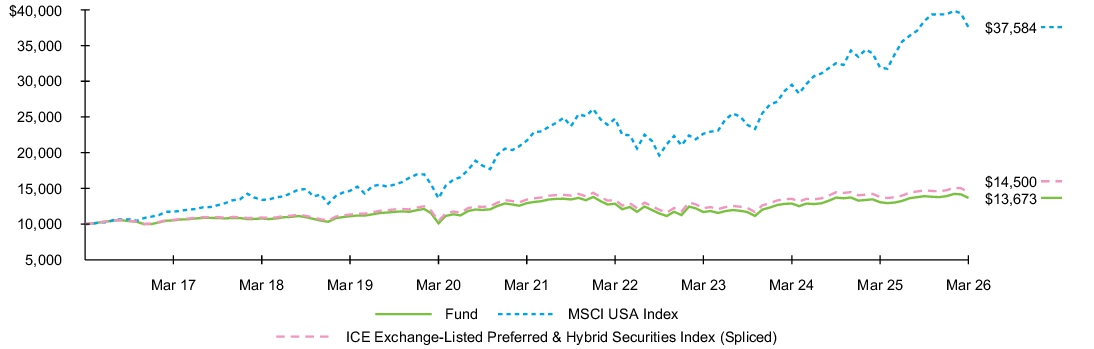
How did the Fund perform last year?
- For the reporting period ended March 31, 2026, the Fund returned 4.63%.
- For the same period, the MSCI USA Index returned 17.74% and the ICE Exchange-Listed Preferred & Hybrid Securities Index (Spliced) returned 5.13%.
What contributed to performance?
U.S. equities advanced during the reporting period, supported by resilient economic growth and sustained investor enthusiasm for artificial intelligence (“AI”) related names. However, volatility resurfaced later in the period amid renewed geopolitical tensions in the Middle East. Materials stocks contributed the most to the Fund’s return, particularly a leading producer of lithium for electric vehicle batteries and energy storage systems due to strong demand and a rally in lithium prices. In the utilities sector, electric utilities companies benefited from rising power demand from AI data centers and hyperscale customers, which supported increased grid and generation investment. In the industrials sector, an aerospace manufacturer contributed as improving commercial aircraft demand and a gradual recovery in production supported investor sentiment.
What detracted from performance?
During the reporting period, there were no significant detractors from the Fund’s return.
The views expressed reflect the opinions of BlackRock as of the date of this report and are subject to change based on changes in market, economic or other conditions. These views are not intended to be a forecast of future events and are no guarantee of future results.
Fund performance
Cumulative performance: April 1, 2016 through March 31, 2026
Initial investment of $10,000
See “Average annual total returns” for additional information on fund performance.
Average annual total returns
| 1 Year | 5 Years | 10 Years | |||
| 4.63 | % | 1.12 | % | 3.18 | % |
| 17.74 | 11.62 | 14.16 | |||
| 5.13 | 1.54 | 3.79 |
Key Fund statistics
| $13,343,657,164 |
| 462 |
| $63,842,706 |
| 20% |
What did the Fund invest in?
(as of March 31, 2026)
Sector allocation
| Sector | Percent of Total Investments(a) |
|
| 57.7 | % | |
| 13.1 | ||
| 8.9 | ||
| 5.3 | ||
| 5.2 | ||
| 3.5 | ||
| 1.8 | ||
| 1.5 | ||
| 1.2 | ||
| 1.2 | ||
| 0.6 |
Ten largest holdings
| Security | Percent of Total Investments(a) |
|
| 3.9 | % | |
| 2.6 | ||
| 2.3 | ||
| 2.3 | ||
| 1.7 | ||
| 1.4 | ||
| 1.4 | ||
| 1.2 | ||
| 1.2 | ||
| 1.1 |
| Excludes money market funds. |
Ten largest holdings
| Security | Percent of Total Investments(a) |
|
| 3.9 | % | |
| 2.6 | ||
| 2.3 | ||
| 2.3 | ||
| 1.7 | ||
| 1.4 | ||
| 1.4 | ||
| 1.2 | ||
| 1.2 | ||
| 1.1 |
| Excludes money market funds. |
What were the Fund costs for the last year?
(based on a hypothetical $10,000 investment)
| Fund name | Costs of a $10,000 investment |
Costs paid as a percentage of a $10,000 investment |
| $48 | 0.48% |
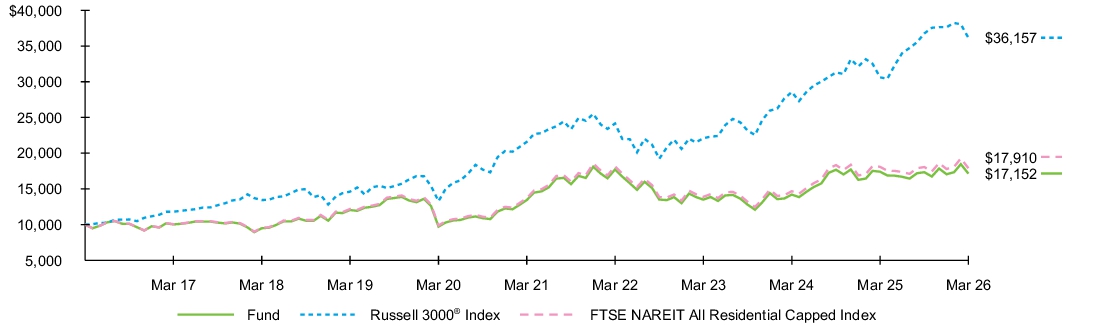
How did the Fund perform last year?
- For the reporting period ended March 31, 2026, the Fund returned (1.47)%.
- For the same period, the Russell 3000® Index returned 18.09% and the FTSE Nareit All Residential Capped Index returned (0.99)%.
What contributed to performance?
While inflation remained elevated, worries over labor market softness led the Federal Reserve (“Fed”) to lower short-term borrowing costs three times for a total of 75 basis points in the second half of 2025. During the reporting period, healthcare REIT holdings contributed to the Fund’s return, driven by positive demographic tailwinds which supported robust demand for senior housing.
What detracted from performance?
Residential REIT holdings detracted from the Fund's return during the reporting period. Although the Federal Reserve cut rates during the reporting period, borrowing costs remained elevated amid persistent inflation, which weighed on valuations for multi-family residential REITs. Fundamentals were further pressured by a wave of new supply that outpaced demand in several markets, pushing vacancy rates higher and constraining rent growth and landlord pricing power. Single family residential REIT holdings also detracted, as slowing rent growth, regulatory uncertainty, and elevated financing costs constrained earnings and weighed on valuations.
The views expressed reflect the opinions of BlackRock as of the date of this report and are subject to change based on changes in market, economic or other conditions. These views are not intended to be a forecast of future events and are no guarantee of future results.
Fund performance
Cumulative performance: April 1, 2016 through March 31, 2026
Initial investment of $10,000
See “Average annual total returns” for additional information on fund performance.
Average annual total returns
| 1 Year | 5 Years | 10 Years | |||
| (1.47 | )% | 4.99 | % | 5.54 | % |
| 18.09 | 10.87 | 13.72 | |||
| (0.99 | ) | 5.48 | 6.00 |
Key Fund statistics
| $785,973,550 |
| 40 |
| $3,826,257 |
| 14% |
What did the Fund invest in?
(as of March 31, 2026)
Industry allocation
| Industry | Percent of Total Investments(a) |
|
| 47.7 | % | |
| 35.1 | ||
| 17.2 |
Ten largest holdings
| Security | Percent of Total Investments(a) |
|
| 23.3 | % | |
| 8.6 | ||
| 7.7 | ||
| 5.6 | ||
| 4.6 | ||
| 4.4 | ||
| 3.6 | ||
| 3.6 | ||
| 3.6 | ||
| 3.4 |
| Excludes money market funds. |
Ten largest holdings
| Security | Percent of Total Investments(a) |
|
| 23.3 | % | |
| 8.6 | ||
| 7.7 | ||
| 5.6 | ||
| 4.6 | ||
| 4.4 | ||
| 3.6 | ||
| 3.6 | ||
| 3.6 | ||
| 3.4 |
| Excludes money market funds. |
What were the Fund costs for the last year?
(based on a hypothetical $10,000 investment)
| Fund name | Costs of a $10,000 investment |
Costs paid as a percentage of a $10,000 investment |
| $49 | 0.48% |
How did the Fund perform last year?
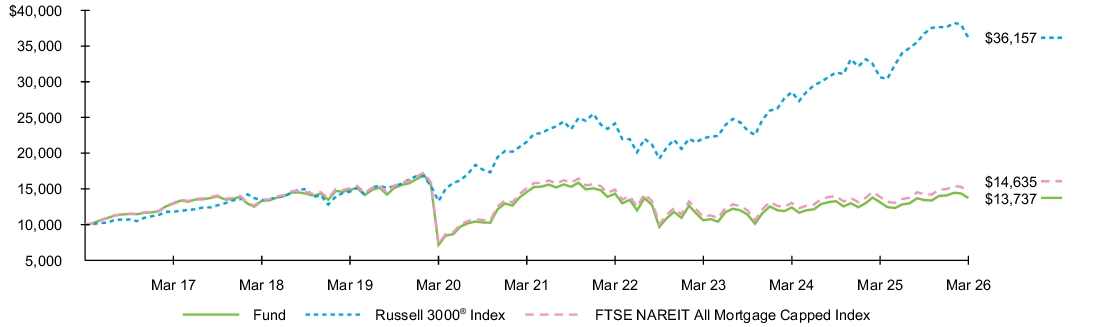
- For the reporting period ended March 31, 2026, the Fund returned 4.66%.
- For the same period, the Russell 3000® Index returned 18.09% and the FTSE Nareit All Mortgage Capped Index returned 5.40%.
What contributed to performance?
While inflation remained elevated, worries over labor market softness led the Federal Reserve (“Fed”) to lower short-term borrowing costs three times for a total of 75 basis points in the second half of 2025. During the reporting period, agency mortgage REIT holdings contributed to the Fund’s return, as lower short-term funding costs, modestly improving mortgage spreads, and continued demand for high dividend income supported share prices of agency-focused REITs.
What detracted from performance?
The mortgage market remained challenged during the reporting period, as persistent inflation and elevated longer-term Treasury yields kept borrowing costs high despite the Fed’s three rate cuts. While lower short-term rates provided some relief, commercial real estate fundamentals remained under pressure from tighter credit conditions and refinancing risk. The Fund’s commercial mortgage REIT holdings detracted from performance, as concerns over multifamily and transitional property loans weighed on investor sentiment and increased expectations for loan losses.
The views expressed reflect the opinions of BlackRock as of the date of this report and are subject to change based on changes in market, economic or other conditions. These views are not intended to be a forecast of future events and are no guarantee of future results.
Fund performance
Cumulative performance: April 1, 2016 through March 31, 2026
Initial investment of $10,000
See “Average annual total returns” for additional information on fund performance.
Average annual total returns
| 1 Year | 5 Years | 10 Years | |||
| 4.66 | % | (1.18 | )% | 3.23 | % |
| 18.09 | 10.87 | 13.72 | |||
| 5.40 | (0.63 | ) | 3.88 |
Key Fund statistics
| $545,352,077 |
| 35 |
| $2,853,956 |
| 21% |
What did the Fund invest in?
(as of March 31, 2026)
Industry allocation
| Industry | Percent of Total Investments(a) |
|
| 100.0 | % |
Ten largest holdings
| Security | Percent of Total Investments(a) |
|
| 22.2 | % | |
| 14.5 | ||
| 7.8 | ||
| 4.7 | ||
| 4.6 | ||
| 4.5 | ||
| 4.2 | ||
| 3.3 | ||
| 3.3 | ||
| 3.2 |
| Excludes money market funds. |
Ten largest holdings
| Security | Percent of Total Investments(a) |
|
| 22.2 | % | |
| 14.5 | ||
| 7.8 | ||
| 4.7 | ||
| 4.6 | ||
| 4.5 | ||
| 4.2 | ||
| 3.3 | ||
| 3.3 | ||
| 3.2 |
| Excludes money market funds. |
This report describes changes to the Fund that occurred during the reporting period.
What were the Fund costs for the last year?
(based on a hypothetical $10,000 investment)
| Fund name | Costs of a $10,000 investment |
Costs paid as a percentage of a $10,000 investment |
| $22 | 0.20% |
How did the Fund perform last year?
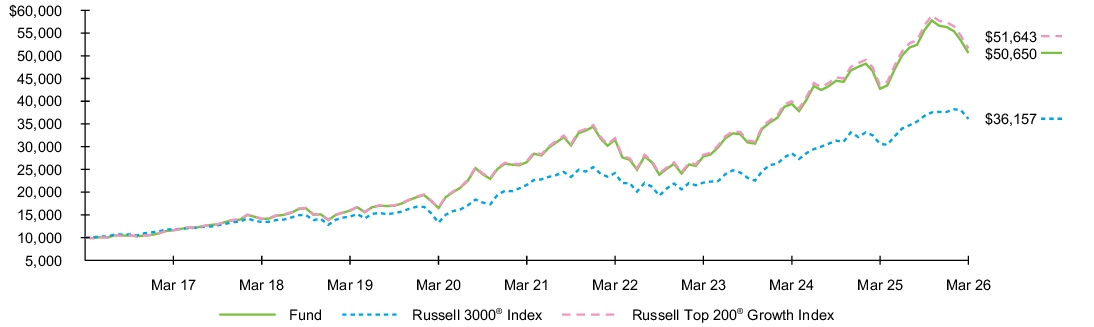
- For the reporting period ended March 31, 2026, the Fund returned 18.49%.
- For the same period, the Russell 3000® Index returned 18.09% and the Russell Top 200® Growth Index returned 18.73%.
What contributed to performance?
During the reporting period, the information technology sector contributed the most to the Fund’s performance. Companies that provide semiconductors and semiconductor equipment were driven by surging AI infrastructure demand, as hyperscale data center expansion fueled increased chip production, custom silicon deployment, and wafer fabrication investment. Makers of high-performance AI chips were standout performers, as their products have become essential infrastructure for cloud providers and businesses adopting AI at scale. Additionally, a consumer-facing technology hardware company gained as a major new smartphone launch drove record sales, and an expanding software and subscription business added recurring revenue. An interactive media and services company in the communication sector benefited from accelerating ad revenue growth, aided by AI-driven search expansion, alongside expanding cloud services fueled by surging enterprise AI demand.
What detracted from performance?
During the reporting period, payment and financial technology companies in the financials sector detracted from the Fund’s returns, amid regulatory concerns around interchange fees, and softer consumer spending sentiment. Additionally, software and services stocks faced growing investor concerns over AI tools disrupting the revenue streams of traditional software models.
The views expressed reflect the opinions of BlackRock as of the date of this report and are subject to change based on changes in market, economic or other conditions. These views are not intended to be a forecast of future events and are no guarantee of future results.
Fund performance
Cumulative performance: April 1, 2016 through March 31, 2026
Initial investment of $10,000
See “Average annual total returns” for additional information on fund performance.
Average annual total returns
| 1 Year | 5 Years | 10 Years | |||
| 18.49 | % | 13.76 | % | 17.61 | % |
| 18.09 | 10.87 | 13.72 | |||
| 18.73 | 14.00 | 17.84 |
Key Fund statistics
| $14,767,219,623 |
| 113 |
| $29,553,397 |
| 18% |
What did the Fund invest in?
(as of March 31, 2026)
Sector allocation
| Sector | Percent of Total Investments(a) |
|
| 53.6 | % | |
| 12.6 | ||
| 11.3 | ||
| 7.5 | ||
| 6.0 | ||
| 5.0 | ||
| 3.3 | ||
| 0.4 | ||
| 0.3 |
Ten largest holdings
| Security | Percent of Total Investments(a) |
|
| 14.6 | % | |
| 13.2 | ||
| 9.9 | ||
| 4.5 | ||
| 4.3 | ||
| 3.9 | ||
| 3.5 | ||
| 3.4 | ||
| 3.2 | ||
| 2.9 |
| Excludes money market funds. |
Ten largest holdings
| Security | Percent of Total Investments(a) |
|
| 14.6 | % | |
| 13.2 | ||
| 9.9 | ||
| 4.5 | ||
| 4.3 | ||
| 3.9 | ||
| 3.5 | ||
| 3.4 | ||
| 3.2 | ||
| 2.9 |
| Excludes money market funds. |
Material Fund changes
This is a summary of certain changes to the Fund since March 31, 2025. For more complete information, you may review the Fund’s next prospectus, which we expect to be available approximately 120 days after March 31, 2026 at blackrock.com/fundreports or upon request by contacting us at 1-800-iShares (1-800-474-2737).
Effective August 1, 2025, the investment management agreement was amended to add a new breakpoint tier of 0.1900% greater than $13billion.
Effective August 1, 2025, the investment management agreement was amended to add a new breakpoint tier of 0.1900% greater than $13billion.
This is a summary of certain changes to the Fund since March 31, 2025. For more complete information, you may review the Fund’s next prospectus, which we expect to be available approximately 120 days after March 31, 2026 at blackrock.com/fundreports or upon request by contacting us at 1-800-iShares (1-800-474-2737).
What were the Fund costs for the last year?
(based on a hypothetical $10,000 investment)
| Fund name | Costs of a $10,000 investment |
Costs paid as a percentage of a $10,000 investment |
| $16 | 0.15% |
How did the Fund perform last year?
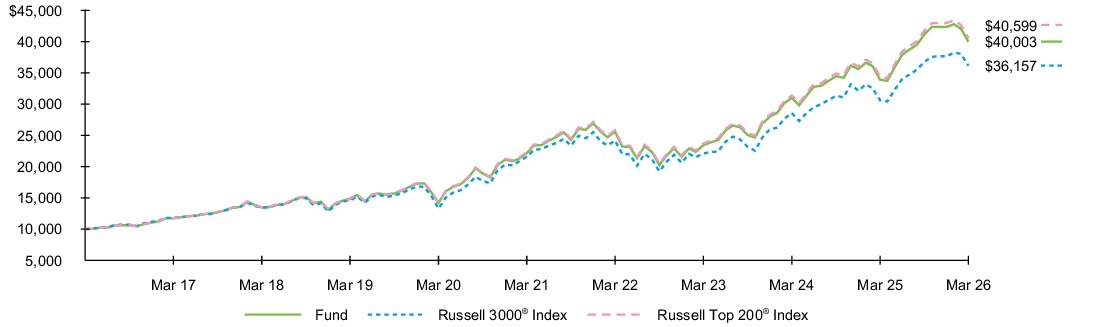
- For the reporting period ended March 31, 2026, the Fund returned 18.06%.
- For the same period, the Russell 3000® Index returned 18.09% and the Russell Top 200® Index returned 18.25%.
What contributed to performance?
The information technology sector contributed the most to the Fund’s performance during the reporting period. Companies that provide semiconductors and semiconductor equipment were driven by surging AI infrastructure demand, as hyperscale data center expansion fueled increased chip production, custom silicon deployment, and wafer fabrication investment. Makers of high-performance AI chips were standout performers, as their products have become essential infrastructure for cloud providers and businesses adopting AI at scale. businesses adopting AI at scale. Additionally, a consumer-facing technology hardware company gained as a major new smartphone launch drove record sales, and an expanding software and subscription business added recurring revenue. An interactive media and services company in the communication sector benefited from accelerating ad revenue growth, aided by AI-driven search expansion, alongside expanding cloud services fueled by surging enterprise AI demand.
What detracted from performance?
During the reporting period, software and services stocks modestly detracted from the Fund’s return, amid growing investor concerns over AI tools disrupting the revenue streams of traditional software models.
The views expressed reflect the opinions of BlackRock as of the date of this report and are subject to change based on changes in market, economic or other conditions. These views are not intended to be a forecast of future events and are no guarantee of future results.
Fund performance
Cumulative performance: April 1, 2016 through March 31, 2026
Initial investment of $10,000
See “Average annual total returns” for additional information on fund performance.
Average annual total returns
| 1 Year | 5 Years | 10 Years | |||
| 18.06 | % | 12.54 | % | 14.87 | % |
| 18.09 | 10.87 | 13.72 | |||
| 18.25 | 12.71 | 15.04 |
Key Fund statistics
| $1,920,537,080 |
| 202 |
| $2,759,932 |
| 3% |
What did the Fund invest in?
(as of March 31, 2026)
Sector allocation
| Sector | Percent of Total Investments(a) |
|
| 35.9 | % | |
| 12.7 | ||
| 11.8 | ||
| 9.8 | ||
| 9.8 | ||
| 7.5 | ||
| 5.3 | ||
| 3.2 | ||
| 1.6 | ||
| 1.4 | ||
| 1.0 |
Ten largest holdings
| Security | Percent of Total Investments(a) |
|
| 8.6 | % | |
| 7.7 | ||
| 5.8 | ||
| 4.2 | ||
| 3.5 | ||
| 3.0 | ||
| 2.9 | ||
| 2.6 | ||
| 2.2 | ||
| 1.9 |
| Excludes money market funds. |
Ten largest holdings
| Security | Percent of Total Investments(a) |
|
| 8.6 | % | |
| 7.7 | ||
| 5.8 | ||
| 4.2 | ||
| 3.5 | ||
| 3.0 | ||
| 2.9 | ||
| 2.6 | ||
| 2.2 | ||
| 1.9 |
| Excludes money market funds. |
What were the Fund costs for the last year?
(based on a hypothetical $10,000 investment)
| Fund name | Costs of a $10,000 investment |
Costs paid as a percentage of a $10,000 investment |
| $21 | 0.20% |
How did the Fund perform last year?
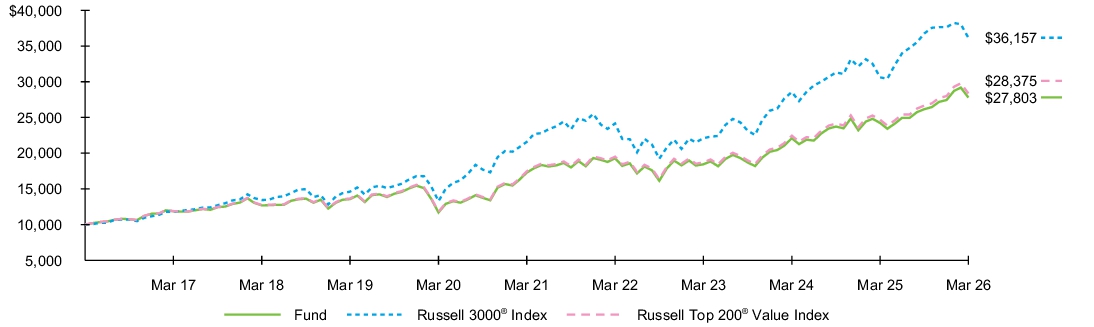
- For the reporting period ended March 31, 2026, the Fund returned 14.71%.
- For the same period, the Russell 3000® Index returned 18.09% and the Russell Top 200® Value Index returned 14.94%.
What contributed to performance?
U.S. equities advanced during the reporting period, supported by resilient economic growth and sustained investor enthusiasm for artificial intelligence (“AI”) related names. The industrials sector contributed the most to the Fund’s performance, due to record U.S. defense budgets, aircraft upgrades, infrastructure spending, and surging global orders amid geopolitical tensions. Companies in the semiconductors and semiconductor equipment subsector benefited from renewed investor confidence across the AI supply chain, were driven by surging AI infrastructure demand. Energy stocks advanced, supported by steady U.S. oil production growth and resilient demand as oil prices surged late in the reporting period amid renewed Middle East geopolitical tensions that heightened supply fears.
What detracted from performance?
During the reporting period, software and services stocks detracted from the Fund’s return, amid growing investor concerns over AI tools disrupting the revenue streams of traditional software models.
The views expressed reflect the opinions of BlackRock as of the date of this report and are subject to change based on changes in market, economic or other conditions. These views are not intended to be a forecast of future events and are no guarantee of future results.
Fund performance
Cumulative performance: April 1, 2016 through March 31, 2026
Initial investment of $10,000
See “Average annual total returns” for additional information on fund performance.
Average annual total returns
| 1 Year | 5 Years | 10 Years | |||
| 14.71 | % | 9.97 | % | 10.77 | % |
| 18.09 | 10.87 | 13.72 | |||
| 14.94 | 10.20 | 10.99 |
Key Fund statistics
| $3,414,624,746 |
| 156 |
| $6,039,495 |
| 18% |
What did the Fund invest in?
(as of March 31, 2026)
Sector allocation
| Sector | Percent of Total Investments(a) |
|
| 22.4 | % | |
| 13.6 | ||
| 11.6 | ||
| 11.4 | ||
| 10.2 | ||
| 8.5 | ||
| 7.3 | ||
| 6.6 | ||
| 3.3 | ||
| 3.2 | ||
| 1.9 |
Ten largest holdings
| Security | Percent of Total Investments(a) |
|
| 4.3 | % | |
| 3.9 | ||
| 3.5 | ||
| 2.9 | ||
| 2.9 | ||
| 2.7 | ||
| 2.4 | ||
| 2.4 | ||
| 1.9 | ||
| 1.8 |
| Excludes money market funds. |
Ten largest holdings
| Security | Percent of Total Investments(a) |
|
| 4.3 | % | |
| 3.9 | ||
| 3.5 | ||
| 2.9 | ||
| 2.9 | ||
| 2.7 | ||
| 2.4 | ||
| 2.4 | ||
| 1.9 | ||
| 1.8 |
| Excludes money market funds. |
What were the Fund costs for the last year?
(based on a hypothetical $10,000 investment)
| Fund name | Costs of a $10,000 investment |
Costs paid as a percentage of a $10,000 investment |
| $17 | 0.15% |
How did the Fund perform last year?
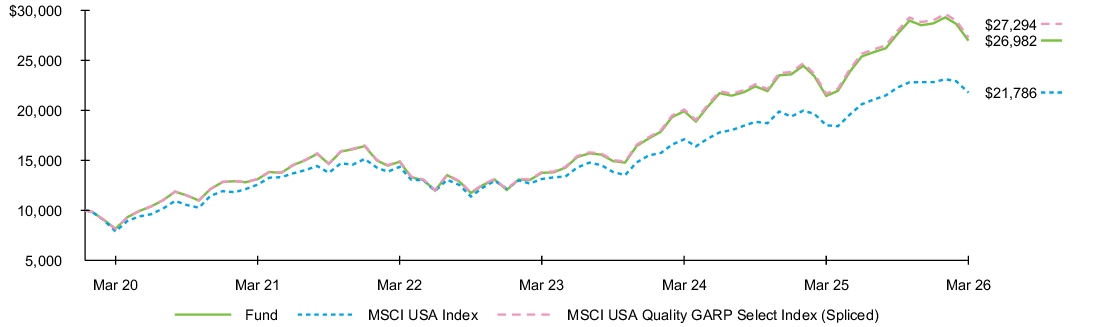
- For the reporting period ended March 31, 2026, the Fund returned 25.86%.
- For the same period, the MSCI USA Index returned 17.74% and the MSCI USA Quality GARP Select Index (Spliced) returned 26.05%.
What contributed to performance?
U.S. equities advanced during the reporting period, supported by resilient economic growth and sustained investor enthusiasm for artificial intelligence (“AI”) related names. Firms that provide semiconductors and semiconductor equipment were the largest contributors to the Fund’s return, as heightened AI data center demand boosting needs key semiconductor components. Makers of high-performance AI chips were standout performers, as their products have become essential infrastructure for cloud providers and businesses adopting AI at scale. An interactive media and services company in the communication sector benefited from accelerating ad revenue growth, aided by AI-driven search expansion, alongside expanding cloud services. Additionally, the industrials sector contributed, driven by U.S. reshoring efforts, infrastructure spending, and robust aerospace and defense demand, heightened by geopolitical tensions.
What detracted from performance?
During the reporting period, software and services stocks detracted from the Fund’s return, amid growing investor concerns over AI tools disrupting the revenue streams of traditional software models. In the financials sector, transaction and payment processing services firms were hindered by broader fintech challenges, including reduced consumer spending and competition in payment processing.
The views expressed reflect the opinions of BlackRock as of the date of this report and are subject to change based on changes in market, economic or other conditions. These views are not intended to be a forecast of future events and are no guarantee of future results.
Fund performance
Cumulative performance: January 14, 2020 through March 31, 2026
Initial investment of $10,000
See “Average annual total returns” for additional information on fund performance.
Average annual total returns
| 1 Year | 5 Years | Since Fund Inception |
|||
| 25.86 | % | 15.52 | % | 17.32 | % |
| 17.74 | 11.62 | 13.36 | |||
| 26.05 | 15.75 | 17.54 |
Key Fund statistics
| $1,372,451,190 |
| 150 |
| $1,245,970 |
| 67% |
What did the Fund invest in?
(as of March 31, 2026)
Sector allocation
| Sector | Percent of Total Investments(a) |
|
| 49.1 | % | |
| 11.7 | ||
| 9.7 | ||
| 8.8 | ||
| 7.6 | ||
| 6.5 | ||
| 3.9 | ||
| 1.1 | ||
| 1.0 | ||
| 0.6 |
Ten largest holdings
| Security | Percent of Total Investments(a) |
|
| 5.1 | % | |
| 5.0 | ||
| 4.9 | ||
| 4.8 | ||
| 4.7 | ||
| 3.3 | ||
| 3.2 | ||
| 3.2 | ||
| 3.0 | ||
| 2.9 |
| Excludes money market funds. |
Ten largest holdings
| Security | Percent of Total Investments(a) |
|
| 5.1 | % | |
| 5.0 | ||
| 4.9 | ||
| 4.8 | ||
| 4.7 | ||
| 3.3 | ||
| 3.2 | ||
| 3.2 | ||
| 3.0 | ||
| 2.9 |
| Excludes money market funds. |
What were the Fund costs for the last year?
(based on a hypothetical $10,000 investment)
| Fund name | Costs of a $10,000 investment |
Costs paid as a percentage of a $10,000 investment |
| $9 | 0.08% |
How did the Fund perform last year?
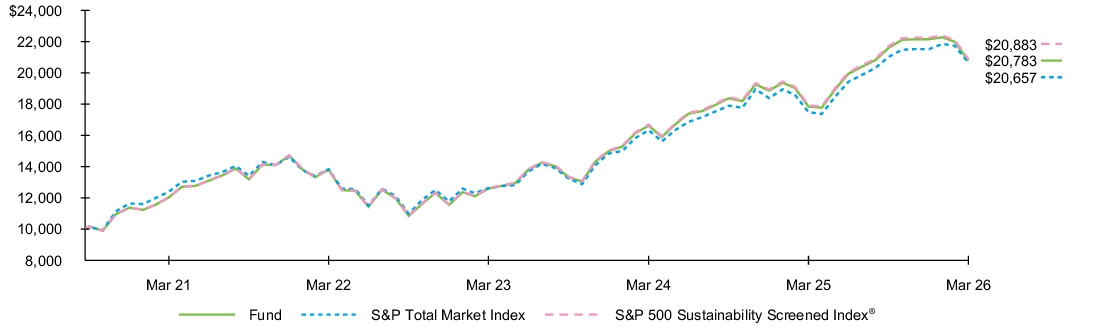
- For the reporting period ended March 31, 2026, the Fund returned 16.47%.
- For the same period, the S&P Total Market Index returned 18.14% and the S&P 500 Sustainability Screened Index® returned 16.56%.
What contributed to performance?
U.S. equities advanced during the reporting period, supported by resilient economic growth and sustained investor enthusiasm for artificial intelligence (“AI”) related companies. However, volatility resurfaced later in the period as renewed geopolitical tensions in the Middle East increased investor uncertainty and contributed to higher energy prices. Stocks in the U.S. information technology sector were the largest contributors to the Fund’s return, particularly semiconductor stocks, driven by robust demand for AI, cloud computing, and data center infrastructure. An interactive media and services company in the communication sector benefited from accelerating ad revenue growth, aided by AI-driven search expansion, alongside expanding cloud services. The industrials sector advanced due to commercial aircraft upgrades, infrastructure spending, and record U.S. defense budgets amid geopolitical tensions.
What detracted from performance?
During the reporting period, software and services stocks detracted from the Fund’s return, amid growing investor concerns over AI tools disrupting the revenue streams of traditional software models.
The views expressed reflect the opinions of BlackRock as of the date of this report and are subject to change based on changes in market, economic or other conditions. These views are not intended to be a forecast of future events and are no guarantee of future results.
Fund performance
Cumulative performance: September 22, 2020 through March 31, 2026
Initial investment of $10,000
See “Average annual total returns” for additional information on fund performance.
Average annual total returns
| 1 Year | 5 Years | Since Fund Inception |
|||
| 16.47 | % | 11.56 | % | 14.16 | % |
| 18.14 | 10.76 | 14.04 | |||
| 16.56 | 11.65 | 14.26 |
Key Fund statistics
| $596,406,914 |
| 444 |
| $392,506 |
| 4% |
What did the Fund invest in?
(as of March 31, 2026)
Sector allocation
| Sector | Percent of Total Investments(a) |
|
| 35.3 | % | |
| 14.1 | ||
| 11.5 | ||
| 11.0 | ||
| 9.4 | ||
| 7.4 | ||
| 4.0 | ||
| 2.3 | ||
| 2.2 | ||
| 1.5 | ||
| 1.3 |
Ten largest holdings
| Security | Percent of Total Investments(a) |
|
| 8.5 | % | |
| 7.5 | ||
| 5.5 | ||
| 4.1 | ||
| 3.4 | ||
| 3.0 | ||
| 2.7 | ||
| 2.5 | ||
| 2.1 | ||
| 1.8 |
| Excludes money market funds. |
Ten largest holdings
| Security | Percent of Total Investments(a) |
|
| 8.5 | % | |
| 7.5 | ||
| 5.5 | ||
| 4.1 | ||
| 3.4 | ||
| 3.0 | ||
| 2.7 | ||
| 2.5 | ||
| 2.1 | ||
| 1.8 |
| Excludes money market funds. |
What were the Fund costs for the last year?
(based on a hypothetical $10,000 investment)
| Fund name | Costs of a $10,000 investment |
Costs paid as a percentage of a $10,000 investment |
| $13 | 0.12% |
How did the Fund perform last year?
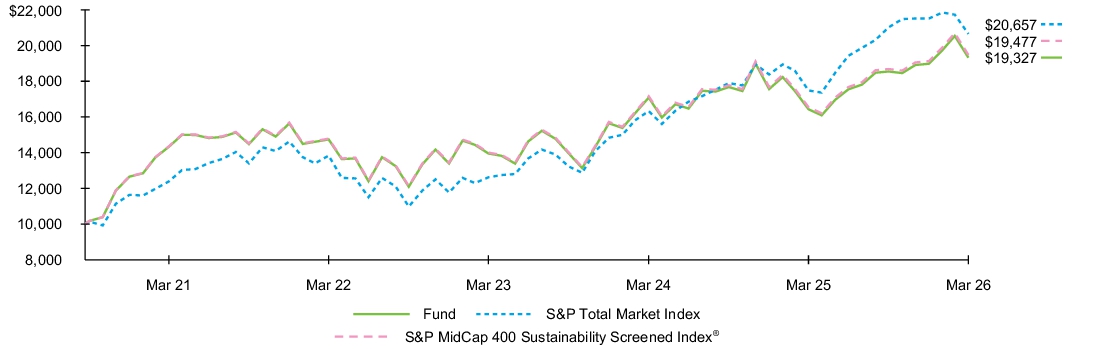
- For the reporting period ended March 31, 2026, the Fund returned 17.62%.
- For the same period, the S&P Total Market Index returned 18.14% and the S&P MidCap 400 Sustainability Screened Index® returned 17.73%.
What contributed to performance?
U.S. equities advanced during the reporting period, supported by resilient economic growth and sustained investor enthusiasm for artificial intelligence (“AI”) related companies. However, volatility resurfaced later in the period as renewed geopolitical tensions in the Middle East increased investor uncertainty and contributed to higher energy prices. Companies in the industrials sector were the largest contributors to the Fund’s return. The industrials sector advanced due to commercial aircraft upgrades, infrastructure spending, and record U.S. defense budgets amid geopolitical tensions. Technology hardware and equipment companies in the information technology sector were supported by demand for networking equipment and optical components needed for AI infrastructure and cloud workloads. Elevated oil prices amid geopolitical risks drove energy names higher.
What detracted from performance?
During the reporting period, software and services stocks detracted from the Fund’s return, amid growing investor concerns over AI tools disrupting the revenue streams of traditional software models.
The views expressed reflect the opinions of BlackRock as of the date of this report and are subject to change based on changes in market, economic or other conditions. These views are not intended to be a forecast of future events and are no guarantee of future results.
Fund performance
Cumulative performance: September 22, 2020 through March 31, 2026
Initial investment of $10,000
See “Average annual total returns” for additional information on fund performance.
Average annual total returns
| 1 Year | 5 Years | Since Fund Inception |
|||
| 17.62 | % | 6.17 | % | 12.67 | % |
| 18.14 | 10.76 | 14.04 | |||
| 17.73 | 6.30 | 12.83 |
Key Fund statistics
| $346,608,830 |
| 362 |
| $372,695 |
| 20% |
What did the Fund invest in?
(as of March 31, 2026)
Sector allocation
| Sector | Percent of Total Investments(a) |
|
| 25.6 | % | |
| 15.3 | ||
| 13.3 | ||
| 11.8 | ||
| 10.0 | ||
| 7.4 | ||
| 6.1 | ||
| 4.7 | ||
| 2.9 | ||
| 1.7 | ||
| 1.2 |
Ten largest holdings
| Security | Percent of Total Investments(a) |
|
| 1.0 | % | |
| 1.0 | ||
| 0.9 | ||
| 0.9 | ||
| 0.8 | ||
| 0.8 | ||
| 0.8 | ||
| 0.7 | ||
| 0.7 | ||
| 0.7 |
| Excludes money market funds. |
Ten largest holdings
| Security | Percent of Total Investments(a) |
|
| 1.0 | % | |
| 1.0 | ||
| 0.9 | ||
| 0.9 | ||
| 0.8 | ||
| 0.8 | ||
| 0.8 | ||
| 0.7 | ||
| 0.7 | ||
| 0.7 |
| Excludes money market funds. |
What were the Fund costs for the last year?
(based on a hypothetical $10,000 investment)
| Fund name | Costs of a $10,000 investment |
Costs paid as a percentage of a $10,000 investment |
| $13 | 0.12% |
How did the Fund perform last year?
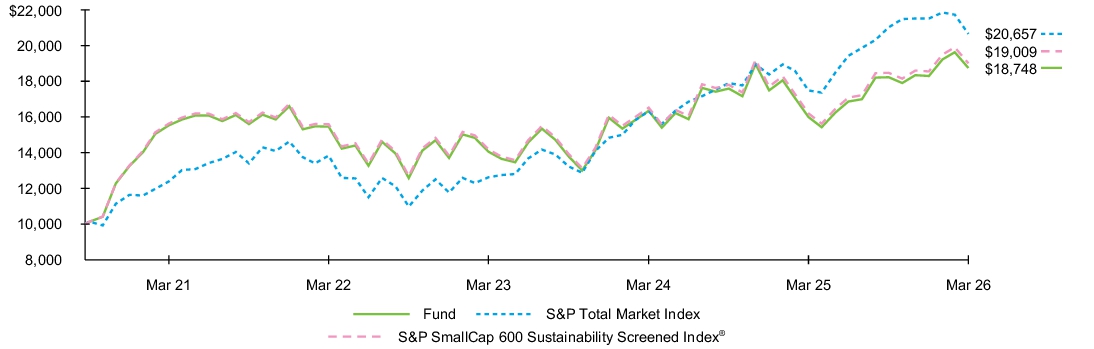
- For the reporting period ended March 31, 2026, the Fund returned 17.22%.
- For the same period, the S&P Total Market Index returned 18.14% and the S&P SmallCap 600 Sustainability Screened Index® returned 17.35%.
What contributed to performance?
U.S. equities advanced during the reporting period, supported by resilient economic growth and sustained investor enthusiasm for artificial intelligence (“AI”) related companies. However, volatility resurfaced later in the period as renewed geopolitical tensions in the Middle East increased investor uncertainty and contributed to higher energy prices. Companies in the industrials sector were the largest contributors to the Fund’s return. The industrials sector advanced due to commercial aircraft upgrades, infrastructure spending, and record U.S. defense budgets amid geopolitical tensions. Stocks in the U.S. information technology sector benefited from robust demand for AI, cloud computing, and data center infrastructure. In the financials sector, regional banks were supported by loan growth, improved credit quality, and an improved interest rate environment.
What detracted from performance?
During the reporting period there were no significant detractors from the Fund’s performance.
The views expressed reflect the opinions of BlackRock as of the date of this report and are subject to change based on changes in market, economic or other conditions. These views are not intended to be a forecast of future events and are no guarantee of future results.
Fund performance
Cumulative performance: September 22, 2020 through March 31, 2026
Initial investment of $10,000
See “Average annual total returns” for additional information on fund performance.
Average annual total returns
| 1 Year | 5 Years | Since Fund Inception |
|||
| 17.22 | % | 3.84 | % | 12.05 | % |
| 18.14 | 10.76 | 14.04 | |||
| 17.35 | 3.99 | 12.34 |
Key Fund statistics
| $121,903,614 |
| 603 |
| $124,995 |
| 27% |
What did the Fund invest in?
(as of March 31, 2026)
Sector allocation
| Sector | Percent of Total Investments(a) |
|
| 19.1 | % | |
| 17.7 | ||
| 14.7 | ||
| 14.1 | ||
| 11.3 | ||
| 6.7 | ||
| 4.7 | ||
| 3.9 | ||
| 3.0 | ||
| 2.6 | ||
| 2.2 |
Ten largest holdings
| Security | Percent of Total Investments(a) |
|
| 0.6 | % | |
| 0.6 | ||
| 0.6 | ||
| 0.6 | ||
| 0.6 | ||
| 0.6 | ||
| 0.6 | ||
| 0.5 | ||
| 0.5 | ||
| 0.5 |
| Excludes money market funds. |
Ten largest holdings
| Security | Percent of Total Investments(a) |
|
| 0.6 | % | |
| 0.6 | ||
| 0.6 | ||
| 0.6 | ||
| 0.6 | ||
| 0.6 | ||
| 0.6 | ||
| 0.5 | ||
| 0.5 | ||
| 0.5 |
| Excludes money market funds. |