Pay vs Performance Disclosure - USD ($)
|
12 Months Ended |
Mar. 31, 2026 |
Mar. 31, 2025 |
Mar. 31, 2024 |
Mar. 31, 2023 |
Mar. 31, 2022 |
| Pay vs Performance Disclosure |
|
|
|
|
|
| Pay vs Performance Disclosure, Table |
| | | | | | | | | | | | | | | | | | | | | | | | | | | | | | | | | | | | | | | | | | | | | | | | | | | | | Fiscal Year | Summary Compensation Total for PEO - Mr. Fernandez(1) ($) | Summary Compensation Total for PEO - Mr. Salvino(1) ($) | Compensation Actually Paid to PEO - Mr. Fernandez(1)(2)(3) ($) | Compensation Actually Paid to PEO - Mr. Salvino(1)(2)(3) ($) | Average Summary Compensation Total for Non-PEO NEOs(1) ($) | Average Compensation Actually Paid to Non-PEO NEOs(1)(2)(3) ($) | Value of Initial Fixed $100 Investment Based On: | Net
Income
($ in millions) | Free Cash Flow(5)
($ in millions) | | | | | | | TSR ($) | Peer Group
TSR(4) ($) | | | | | | | | | | | | | | | | 2026 | 47,790,716 | | — | | 36,447,626 | | — | | 9,839,514 | | 4,787,852 | | | 40.21 | 134.07 | 28 | | 713 | | | | 2025 | 16,737,748 | | — | | 15,205,065 | | — | | 6,008,801 | | 3,329,598 | | 54.54 | 89.09 | 396 | | 687 | | | | 2024 | 9,666,663 | | 19,821,384 | | 9,666,663 | | 7,948,091 | | 5,697,213 | | 3,508,102 | | 67.85 | | 103.09 | | 86 | | 756 | | | | 2023 | — | | 20,317,972 | | — | | (1,015,552) | | 4,204,094 | | 1,442,117 | | 81.77 | | 97.24 | | (566) | | 737 | | | | 2022 | — | | 28,716,680 | | — | | 30,679,306 | | 4,832,088 | | 5,153,180 | | 104.38 | | 102.49 | | 736 | | 743 | | | | | | | | | | | | | | | | | | | | | | | | | | | | | | | | | | | | | | | | | | | | | | | | | | | | | | | | | | | | | | | | | | | | | | | | | | | | | | | | | | | | | | | | | | | | | | | | | | | | | | | | | | | | | | | | | | | | | | | | | | | | | | | | | | | | | | | | | | | | | | | | | | | | | | | | | | | | | | | | | | | | | | | | | | | | | | | | | | | | | | | | | | | | | | | | | | | | | | | | | | | | | | | | | | |
|
|
|
|
|
| Company Selected Measure Name |
Free Cash Flow
|
|
|
|
|
| Named Executive Officers, Footnote |
Mr. Salvino was the Company’s only PEO for fiscal 2022 and fiscal 2023. Both Mr. Salvino and Mr. Fernandez separately served as PEOs during fiscal 2024. Mr. Fernandez was the Company’s only PEO for fiscal 2025 and fiscal 2026. The individuals comprising the Non-PEO NEOs for each year presented are listed below. | | | | | | | | | | | | | | | | | | | | | Fiscal 2022 | Fiscal 2023 | Fiscal 2024 | Fiscal 2025 | Fiscal 2026 | | | | | | | Kenneth P. Sharp | Kenneth P. Sharp | Robert Del Bene | Robert Del Bene | Robert Del Bene | | Mary E. Finch | Mary E. Finch | Howard Boville | Howard Boville | Christopher Drumgoole | | William L. Deckelman Jr. | Christopher Drumgoole | Christopher Drumgoole | Christopher Drumgoole | Raymond A. August | | Vinod Bagal | William L. Deckelman Jr. | James M. Brady | Matthew K. Fawcett | Matthew K. Fawcett | | | Kenneth P. Sharp | Andrew Wilson | Howard Boville | | | | James M. Brady | |
|
|
|
|
|
| Peer Group Issuers, Footnote |
Peer Group Total Shareholder Return is calculated based on the S&P 600 Information Technology Index, which we also utilize in the stock performance graph required by Item 201(e) of Regulation S-K included in our Annual Report for the year ended March 31, 2026. The comparison assumes $100 was invested on March 31, 2021, then tracked through the end of the listed year in the Company and in the S&P 600 Information Technology Index, respectively. Historical stock performance is not necessarily indicative of future stock performance.
|
|
|
|
|
| Adjustment To PEO Compensation, Footnote |
Compensation Actually Paid reflects the exclusions and inclusions of certain amounts for the PEO and the Non-PEO NEOs as set forth below. Equity values are calculated in accordance with FASB ASC Topic 718. Amounts in the Exclusion of Stock Awards column are the totals from the Stock Awards columns set forth in the Summary Compensation Table. | | | | | | | | | | | | | | | | | | | | | | | | | Fiscal Year | Summary Compensation Table Total for Mr. Fernandez
($) | Exclusion of Stock Awards for Mr. Fernandez
($) | Total - Inclusion of Equity Values for Mr. Fernandez
($) | Compensation Actually Paid to Mr. Fernandez
($) | | | | | | | | | 2026 | 47,790,716 | | 42,402,038 | | 31,058,948 | | 36,447,626 | | | | 2025 | 16,737,748 | | 11,941,625 | | 10,408,942 | | 15,205,065 | | | | 2024 | 9,666,663 | | 8,208,431 | | 8,208,431 | | 9,666,663 | | | | 2023 | — | | — | | — | | — | | | | 2022 | — | | — | | — | | — | | |
| | | | | | | | | | | | | | | | | | | | | | | | | Fiscal Year | Summary Compensation Table Total for Mr. Salvino
($) | Exclusion of Stock Awards for Mr. Salvino
($) | Total - Inclusion of Equity Values for Mr. Salvino
($) | Compensation Actually Paid to Mr. Salvino
($) | | | | | | | | | 2026 | — | | — | | — | | — | | | | 2025 | — | | — | | — | | — | | | | 2024 | 19,821,384 | | 16,575,400 | | 4,702,107 | | 7,948,091 | | | | 2023 | 20,317,972 | | 17,130,174 | | (4,203,350) | | (1,015,552) | | | | 2022 | 28,716,680 | | 25,087,727 | | 27,050,353 | | 30,679,306 | | |
The amounts in the Inclusion of Equity Values in the tables above are derived from the amounts set forth in the following tables for our PEO and our non-PEO NEOs, respectively: | | | | | | | | | | | | | | | | | | | | | | | | | | | | | | | | | Fiscal Year | Year End Fair Value of Equity Awards Granted During Year that Remained Unvested as of Last Day of Year for Mr. Fernandez
($) | Change in Fair Value of Prior Awards that Remained Unvested at
Year End for
Mr. Fernandez
($) | Vesting Date Fair Value of Equity Awards Granted During Year that Vested During Year for
Mr. Fernandez
($) | Change in Fair Value from Last Day of Prior Year to Vesting Date of Unvested Equity Awards that Vested During
the Year for
Mr. Fernandez
($) | Value of Dividends Paid
on Stock Awards Not Otherwise Included for
Mr. Fernandez
($) | Total - Inclusion of Equity Values for Mr. Fernandez
($) | | | | | | | | | | | 2026 | 35,229,907 | | (4,002,559) | | — | | (168,400) | | — | | 31,058,948 | | | | 2025 | 12,633,169 | | (2,224,227) | | — | | — | | — | | 10,408,942 | | | | 2024 | 3,131,714 | | — | | 5,076,717 | | — | | — | | 8,208,431 | | | | 2023 | — | | — | | — | | — | | — | | — | | | | 2022 | — | | — | | — | | — | | — | | — | | |
| | | | | | | | | | | | | | | | | | | | | | | | | | | | | | | | | Fiscal Year | Year End Fair Value of Equity Awards Granted During Year that Remained Unvested as of Last Day of Year for Mr. Salvino
($) | Change in Fair Value of Prior Awards that Remained Unvested at
Year End for
Mr. Salvino
($) | Vesting Date Fair Value of Equity Awards Granted During Year that Vested During Year for
Mr. Salvino
($) | Change in Fair Value from Last Day of Prior Year to Vesting Date of Unvested Equity Awards that Vested During
the Year for
Mr. Salvino
($) | Value of Dividends Paid on Stock Awards Not Otherwise Included for
Mr. Salvino
($) | Total - Inclusion of Equity Values for Mr. Salvino
($) | | | | | | | | | | | 2026 | — | | — | | — | | — | | — | | — | | | | 2025 | — | | — | | — | | — | | — | | — | | | | 2024 | 11,974,254 | | (6,812,432) | | — | | (459,715) | | — | | 4,702,107 | | | | 2023 | 10,916,402 | | (15,247,425) | | — | | 102,458 | | 25,215 | | (4,203,350) | | | | 2022 | 23,666,951 | | 3,071,643 | | — | | 286,543 | | 25,216 | | 27,050,353 | | |
|
|
|
|
|
| Non-PEO NEO Average Total Compensation Amount |
$ 9,839,514
|
$ 6,008,801
|
$ 5,697,213
|
$ 4,204,094
|
$ 4,832,088
|
| Non-PEO NEO Average Compensation Actually Paid Amount |
$ 4,787,852
|
3,329,598
|
3,508,102
|
1,442,117
|
5,153,180
|
| Adjustment to Non-PEO NEO Compensation Footnote |
Compensation Actually Paid reflects the exclusions and inclusions of certain amounts for the PEO and the Non-PEO NEOs as set forth below. Equity values are calculated in accordance with FASB ASC Topic 718. Amounts in the Exclusion of Stock Awards column are the totals from the Stock Awards columns set forth in the Summary Compensation Table. | | | | | | | | | | | | | | | | | | | | | | | | | Fiscal Year | Average Summary Compensation Table Total for Non-PEO NEOs
($) | Average Exclusion of Stock Awards for Non‑PEO NEOs
($) | Total - Average Inclusion of Equity Values for Non‑PEO NEOs
($) | Average Compensation Actually Paid to Non‑PEO NEOs
($) | | | | | | | | | 2026 | 9,839,514 | | 8,134,295 | | 3,082,633 | | 4,787,852 | | | | 2025 | 6,008,801 | | 4,339,205 | | 1,660,002 | | 3,329,598 | | | | 2024 | 5,697,213 | | 4,122,256 | | 1,933,145 | | 3,508,102 | | | | 2023 | 4,204,094 | | 3,061,944 | | 299,967 | | 1,442,117 | | | | 2022 | 4,832,088 | | 3,599,308 | | 3,920,400 | | 5,153,180 | | |
| | | | | | | | | | | | | | | | | | | | | | | | | | | | | | | | | Fiscal Year | Average Year
End Fair Value
of Equity Awards Granted During Year that Remained Unvested as of Last Day of Year for Non-PEO NEOs
($) | Average Change in Fair Value of Prior Awards
that Remained Unvested at
Year End for
Non-PEO NEOs
($) | Average Vesting Date Fair Value of Equity Awards Granted During Year that Vested During Year for Non-PEO NEOs
($) | Average Change in Fair Value from Last Day of Prior Year to Vesting Date of Unvested Equity Awards that Vested During the Year for Non-PEO NEOs
($) | Average Value
of Dividends Paid on Stock Awards Not Otherwise Included for
Non-PEO NEOs
($) | Total - Average Inclusion of Equity Values
for Non-PEO NEOs
($) | | | | | | | | | | | 2026 | 5,559,805 | | (2,338,760) | | 30,463 | | (168,875) | | — | | 3,082,633 | | | | 2025 | 3,234,202 | | (1,438,170) | | — | | (136,030) | | — | | 1,660,002 | | | | 2024 | 3,211,318 | | (1,254,897) | | — | | (23,276) | | — | | 1,933,145 | | | | 2023 | 1,934,108 | | (1,606,924) | | 78,109 | | (108,393) | | 3,067 | | 299,967 | | | | 2022 | 3,235,621 | | 370,681 | | 106,489 | | 201,597 | | 6,012 | | 3,920,400 | | |
|
|
|
|
|
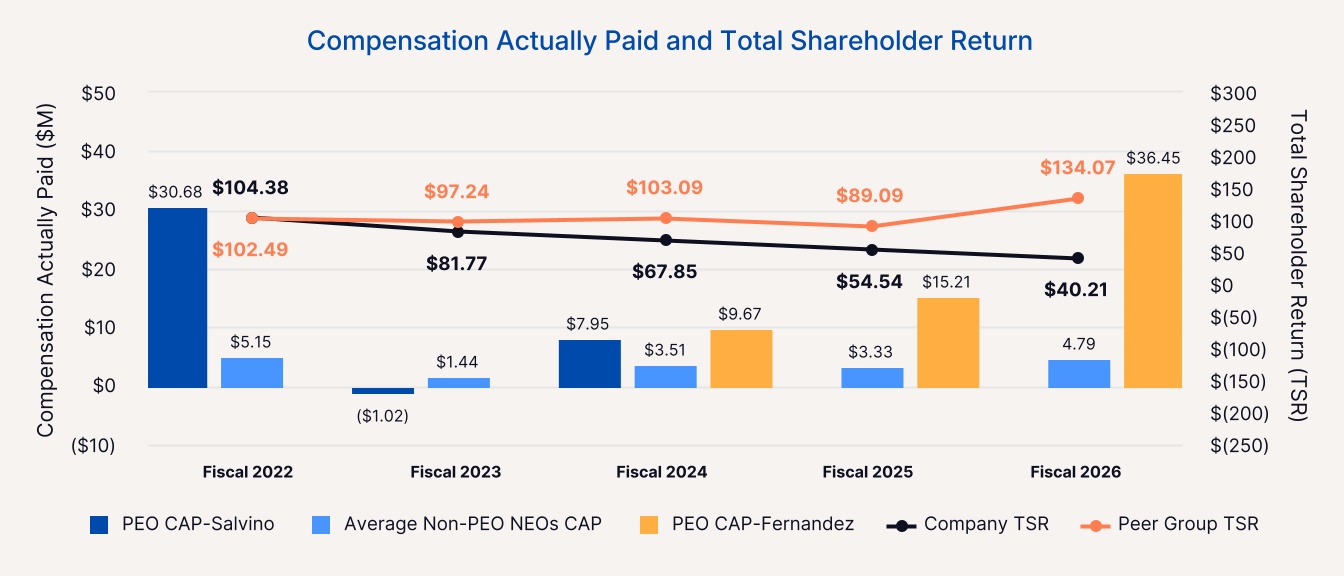
| Compensation Actually Paid vs. Total Shareholder Return |
The following charts set forth the relationship between CAP to our PEO, the average CAP to our non-PEO NEOs and (1) the Company’s cumulative TSR and the Peer Group’s cumulative TSR, (2) Net Income, and (3) Free Cash Flow, each over the five completed years from fiscal 2022 through fiscal 2026:
|
|
|
|
|
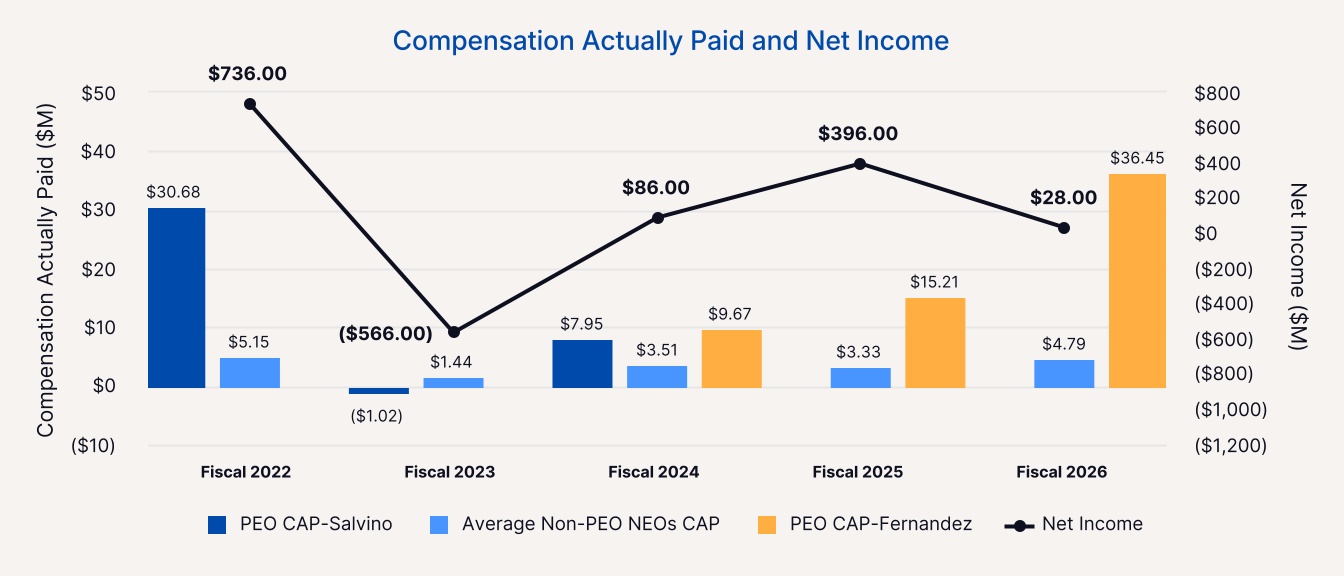
| Compensation Actually Paid vs. Net Income |
The following charts set forth the relationship between CAP to our PEO, the average CAP to our non-PEO NEOs and (1) the Company’s cumulative TSR and the Peer Group’s cumulative TSR, (2) Net Income, and (3) Free Cash Flow, each over the five completed years from fiscal 2022 through fiscal 2026:
|
|
|
|
|
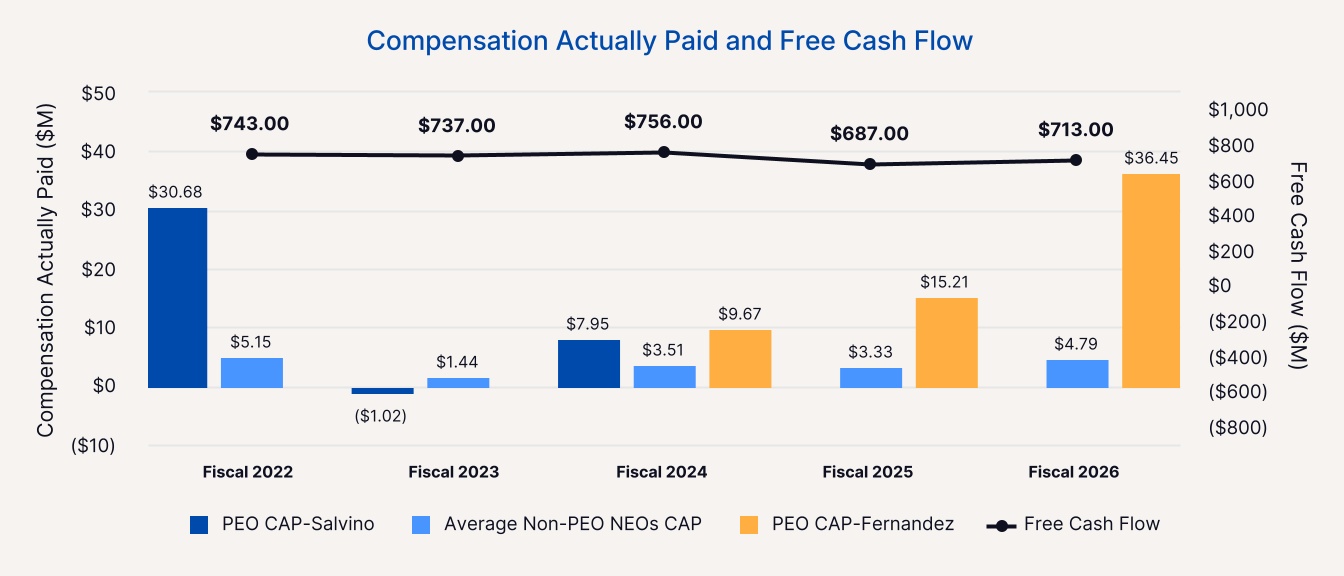
| Compensation Actually Paid vs. Company Selected Measure |
The following charts set forth the relationship between CAP to our PEO, the average CAP to our non-PEO NEOs and (1) the Company’s cumulative TSR and the Peer Group’s cumulative TSR, (2) Net Income, and (3) Free Cash Flow, each over the five completed years from fiscal 2022 through fiscal 2026:
|
|
|
|
|
| Total Shareholder Return Vs Peer Group |
The following charts set forth the relationship between CAP to our PEO, the average CAP to our non-PEO NEOs and (1) the Company’s cumulative TSR and the Peer Group’s cumulative TSR, (2) Net Income, and (3) Free Cash Flow, each over the five completed years from fiscal 2022 through fiscal 2026:
|
|
|
|
|
| Tabular List, Table |
| | | Free Cash Flow | Organic Revenue Growth % | Adjusted EBIT Margin % | | Relative TSR |
|
|
|
|
|
| Total Shareholder Return Amount |
$ 40.21
|
54.54
|
67.85
|
81.77
|
104.38
|
| Peer Group Total Shareholder Return Amount |
134.07
|
89.09
|
103.09
|
97.24
|
102.49
|
| Net Income (Loss), Including Portion Attributable to Noncontrolling Interest |
$ 28,000,000
|
$ 396,000,000
|
$ 86,000,000
|
$ (566,000,000)
|
$ 736,000,000
|
| Company Selected Measure Amount |
713,000,000
|
687,000,000
|
756,000,000
|
737,000,000
|
743,000,000
|
| Additional 402(v) Disclosure |
The amounts shown for Compensation Actually Paid have been calculated in accordance with Item 402(v) of Regulation S-K and do not reflect compensation actually realized or received by the Company’s PEO and Non-PEO NEOs. These amounts reflect compensation as set forth in the Summary Compensation Table above for each year, adjusted as described in footnote 3 below.
|
|
|
|
|
| Measure:: 1 |
|
|
|
|
|
| Pay vs Performance Disclosure |
|
|
|
|
|
| Name |
Free Cash Flow
|
|
|
|
|
| Non-GAAP Measure Description |
We determined Free Cash Flow to be the most important financial performance measure used to link Company performance to Compensation Actually Paid to our PEO and Non-PEO NEOs in fiscal 2026. Free Cash Flow is a non-GAAP measure that is defined as cash flow from operations less capital expenditures. For a reconciliation of Non-GAAP measures as set forth in this Proxy Statement to the most directly comparable GAAP measure, see “Appendix A - Non-GAAP Financial Measures.”
|
|
|
|
|
| Measure:: 2 |
|
|
|
|
|
| Pay vs Performance Disclosure |
|
|
|
|
|
| Name |
Organic Revenue Growth %
|
|
|
|
|
| Measure:: 3 |
|
|
|
|
|
| Pay vs Performance Disclosure |
|
|
|
|
|
| Name |
Adjusted EBIT Margin %
|
|
|
|
|
| Measure:: 4 |
|
|
|
|
|
| Pay vs Performance Disclosure |
|
|
|
|
|
| Name |
Relative TSR
|
|
|
|
|
| Fernandez [Member] |
|
|
|
|
|
| Pay vs Performance Disclosure |
|
|
|
|
|
| PEO Total Compensation Amount |
$ 47,790,716
|
$ 16,737,748
|
$ 9,666,663
|
|
|
| PEO Actually Paid Compensation Amount |
$ 36,447,626
|
$ 15,205,065
|
$ 9,666,663
|
|
|
| PEO Name |
Mr. Fernandez
|
Mr. Fernandez
|
Mr. Fernandez
|
|
|
| Salvino [Member] |
|
|
|
|
|
| Pay vs Performance Disclosure |
|
|
|
|
|
| PEO Total Compensation Amount |
|
|
$ 19,821,384
|
$ 20,317,972
|
$ 28,716,680
|
| PEO Actually Paid Compensation Amount |
|
|
$ 7,948,091
|
$ (1,015,552)
|
$ 30,679,306
|
| PEO Name |
|
|
Mr. Salvino
|
Mr. Salvino
|
Mr. Salvino
|
| PEO | Fernandez [Member] | Aggregate Grant Date Fair Value of Equity Award Amounts Reported in Summary Compensation Table |
|
|
|
|
|
| Pay vs Performance Disclosure |
|
|
|
|
|
| Adjustment to Compensation, Amount |
$ (42,402,038)
|
$ (11,941,625)
|
$ (8,208,431)
|
|
|
| PEO | Fernandez [Member] | Equity Awards Adjustments, Excluding Value Reported in Compensation Table |
|
|
|
|
|
| Pay vs Performance Disclosure |
|
|
|
|
|
| Adjustment to Compensation, Amount |
31,058,948
|
10,408,942
|
8,208,431
|
|
|
| PEO | Fernandez [Member] | Year-end Fair Value of Equity Awards Granted in Covered Year that are Outstanding and Unvested |
|
|
|
|
|
| Pay vs Performance Disclosure |
|
|
|
|
|
| Adjustment to Compensation, Amount |
35,229,907
|
12,633,169
|
3,131,714
|
|
|
| PEO | Fernandez [Member] | Year-over-Year Change in Fair Value of Equity Awards Granted in Prior Years That are Outstanding and Unvested |
|
|
|
|
|
| Pay vs Performance Disclosure |
|
|
|
|
|
| Adjustment to Compensation, Amount |
(4,002,559)
|
(2,224,227)
|
0
|
|
|
| PEO | Fernandez [Member] | Vesting Date Fair Value of Equity Awards Granted and Vested in Covered Year |
|
|
|
|
|
| Pay vs Performance Disclosure |
|
|
|
|
|
| Adjustment to Compensation, Amount |
0
|
0
|
5,076,717
|
|
|
| PEO | Fernandez [Member] | Change in Fair Value as of Vesting Date of Prior Year Equity Awards Vested in Covered Year |
|
|
|
|
|
| Pay vs Performance Disclosure |
|
|
|
|
|
| Adjustment to Compensation, Amount |
(168,400)
|
0
|
0
|
|
|
| PEO | Fernandez [Member] | Dividends or Other Earnings Paid on Equity Awards not Otherwise Reflected in Total Compensation for Covered Year |
|
|
|
|
|
| Pay vs Performance Disclosure |
|
|
|
|
|
| Adjustment to Compensation, Amount |
0
|
0
|
0
|
|
|
| PEO | Salvino [Member] | Aggregate Grant Date Fair Value of Equity Award Amounts Reported in Summary Compensation Table |
|
|
|
|
|
| Pay vs Performance Disclosure |
|
|
|
|
|
| Adjustment to Compensation, Amount |
|
|
(16,575,400)
|
$ (17,130,174)
|
$ (25,087,727)
|
| PEO | Salvino [Member] | Equity Awards Adjustments, Excluding Value Reported in Compensation Table |
|
|
|
|
|
| Pay vs Performance Disclosure |
|
|
|
|
|
| Adjustment to Compensation, Amount |
|
|
4,702,107
|
(4,203,350)
|
27,050,353
|
| PEO | Salvino [Member] | Year-end Fair Value of Equity Awards Granted in Covered Year that are Outstanding and Unvested |
|
|
|
|
|
| Pay vs Performance Disclosure |
|
|
|
|
|
| Adjustment to Compensation, Amount |
|
|
11,974,254
|
10,916,402
|
23,666,951
|
| PEO | Salvino [Member] | Year-over-Year Change in Fair Value of Equity Awards Granted in Prior Years That are Outstanding and Unvested |
|
|
|
|
|
| Pay vs Performance Disclosure |
|
|
|
|
|
| Adjustment to Compensation, Amount |
|
|
(6,812,432)
|
(15,247,425)
|
3,071,643
|
| PEO | Salvino [Member] | Vesting Date Fair Value of Equity Awards Granted and Vested in Covered Year |
|
|
|
|
|
| Pay vs Performance Disclosure |
|
|
|
|
|
| Adjustment to Compensation, Amount |
|
|
0
|
0
|
0
|
| PEO | Salvino [Member] | Change in Fair Value as of Vesting Date of Prior Year Equity Awards Vested in Covered Year |
|
|
|
|
|
| Pay vs Performance Disclosure |
|
|
|
|
|
| Adjustment to Compensation, Amount |
|
|
(459,715)
|
102,458
|
286,543
|
| PEO | Salvino [Member] | Dividends or Other Earnings Paid on Equity Awards not Otherwise Reflected in Total Compensation for Covered Year |
|
|
|
|
|
| Pay vs Performance Disclosure |
|
|
|
|
|
| Adjustment to Compensation, Amount |
|
|
0
|
25,215
|
25,216
|
| Non-PEO NEO | Aggregate Grant Date Fair Value of Equity Award Amounts Reported in Summary Compensation Table |
|
|
|
|
|
| Pay vs Performance Disclosure |
|
|
|
|
|
| Adjustment to Compensation, Amount |
(8,134,295)
|
(4,339,205)
|
(4,122,256)
|
(3,061,944)
|
(3,599,308)
|
| Non-PEO NEO | Equity Awards Adjustments, Excluding Value Reported in Compensation Table |
|
|
|
|
|
| Pay vs Performance Disclosure |
|
|
|
|
|
| Adjustment to Compensation, Amount |
3,082,633
|
1,660,002
|
1,933,145
|
299,967
|
3,920,400
|
| Non-PEO NEO | Year-end Fair Value of Equity Awards Granted in Covered Year that are Outstanding and Unvested |
|
|
|
|
|
| Pay vs Performance Disclosure |
|
|
|
|
|
| Adjustment to Compensation, Amount |
5,559,805
|
3,234,202
|
3,211,318
|
1,934,108
|
3,235,621
|
| Non-PEO NEO | Year-over-Year Change in Fair Value of Equity Awards Granted in Prior Years That are Outstanding and Unvested |
|
|
|
|
|
| Pay vs Performance Disclosure |
|
|
|
|
|
| Adjustment to Compensation, Amount |
(2,338,760)
|
(1,438,170)
|
(1,254,897)
|
(1,606,924)
|
370,681
|
| Non-PEO NEO | Vesting Date Fair Value of Equity Awards Granted and Vested in Covered Year |
|
|
|
|
|
| Pay vs Performance Disclosure |
|
|
|
|
|
| Adjustment to Compensation, Amount |
30,463
|
0
|
0
|
78,109
|
106,489
|
| Non-PEO NEO | Change in Fair Value as of Vesting Date of Prior Year Equity Awards Vested in Covered Year |
|
|
|
|
|
| Pay vs Performance Disclosure |
|
|
|
|
|
| Adjustment to Compensation, Amount |
(168,875)
|
(136,030)
|
(23,276)
|
(108,393)
|
201,597
|
| Non-PEO NEO | Dividends or Other Earnings Paid on Equity Awards not Otherwise Reflected in Total Compensation for Covered Year |
|
|
|
|
|
| Pay vs Performance Disclosure |
|
|
|
|
|
| Adjustment to Compensation, Amount |
$ 0
|
$ 0
|
$ 0
|
$ 3,067
|
$ 6,012
|