What were the Fund costs for the past year?
(based on a hypothetical $10,000 investment)
|
Fund Name |
Costs of a $10,000 investment |
Costs paid as a percentage of a $10,000 investment |
|---|---|---|
|
Perkins Discovery Fund |
$272 |
2.54% |
How did the Fund perform?
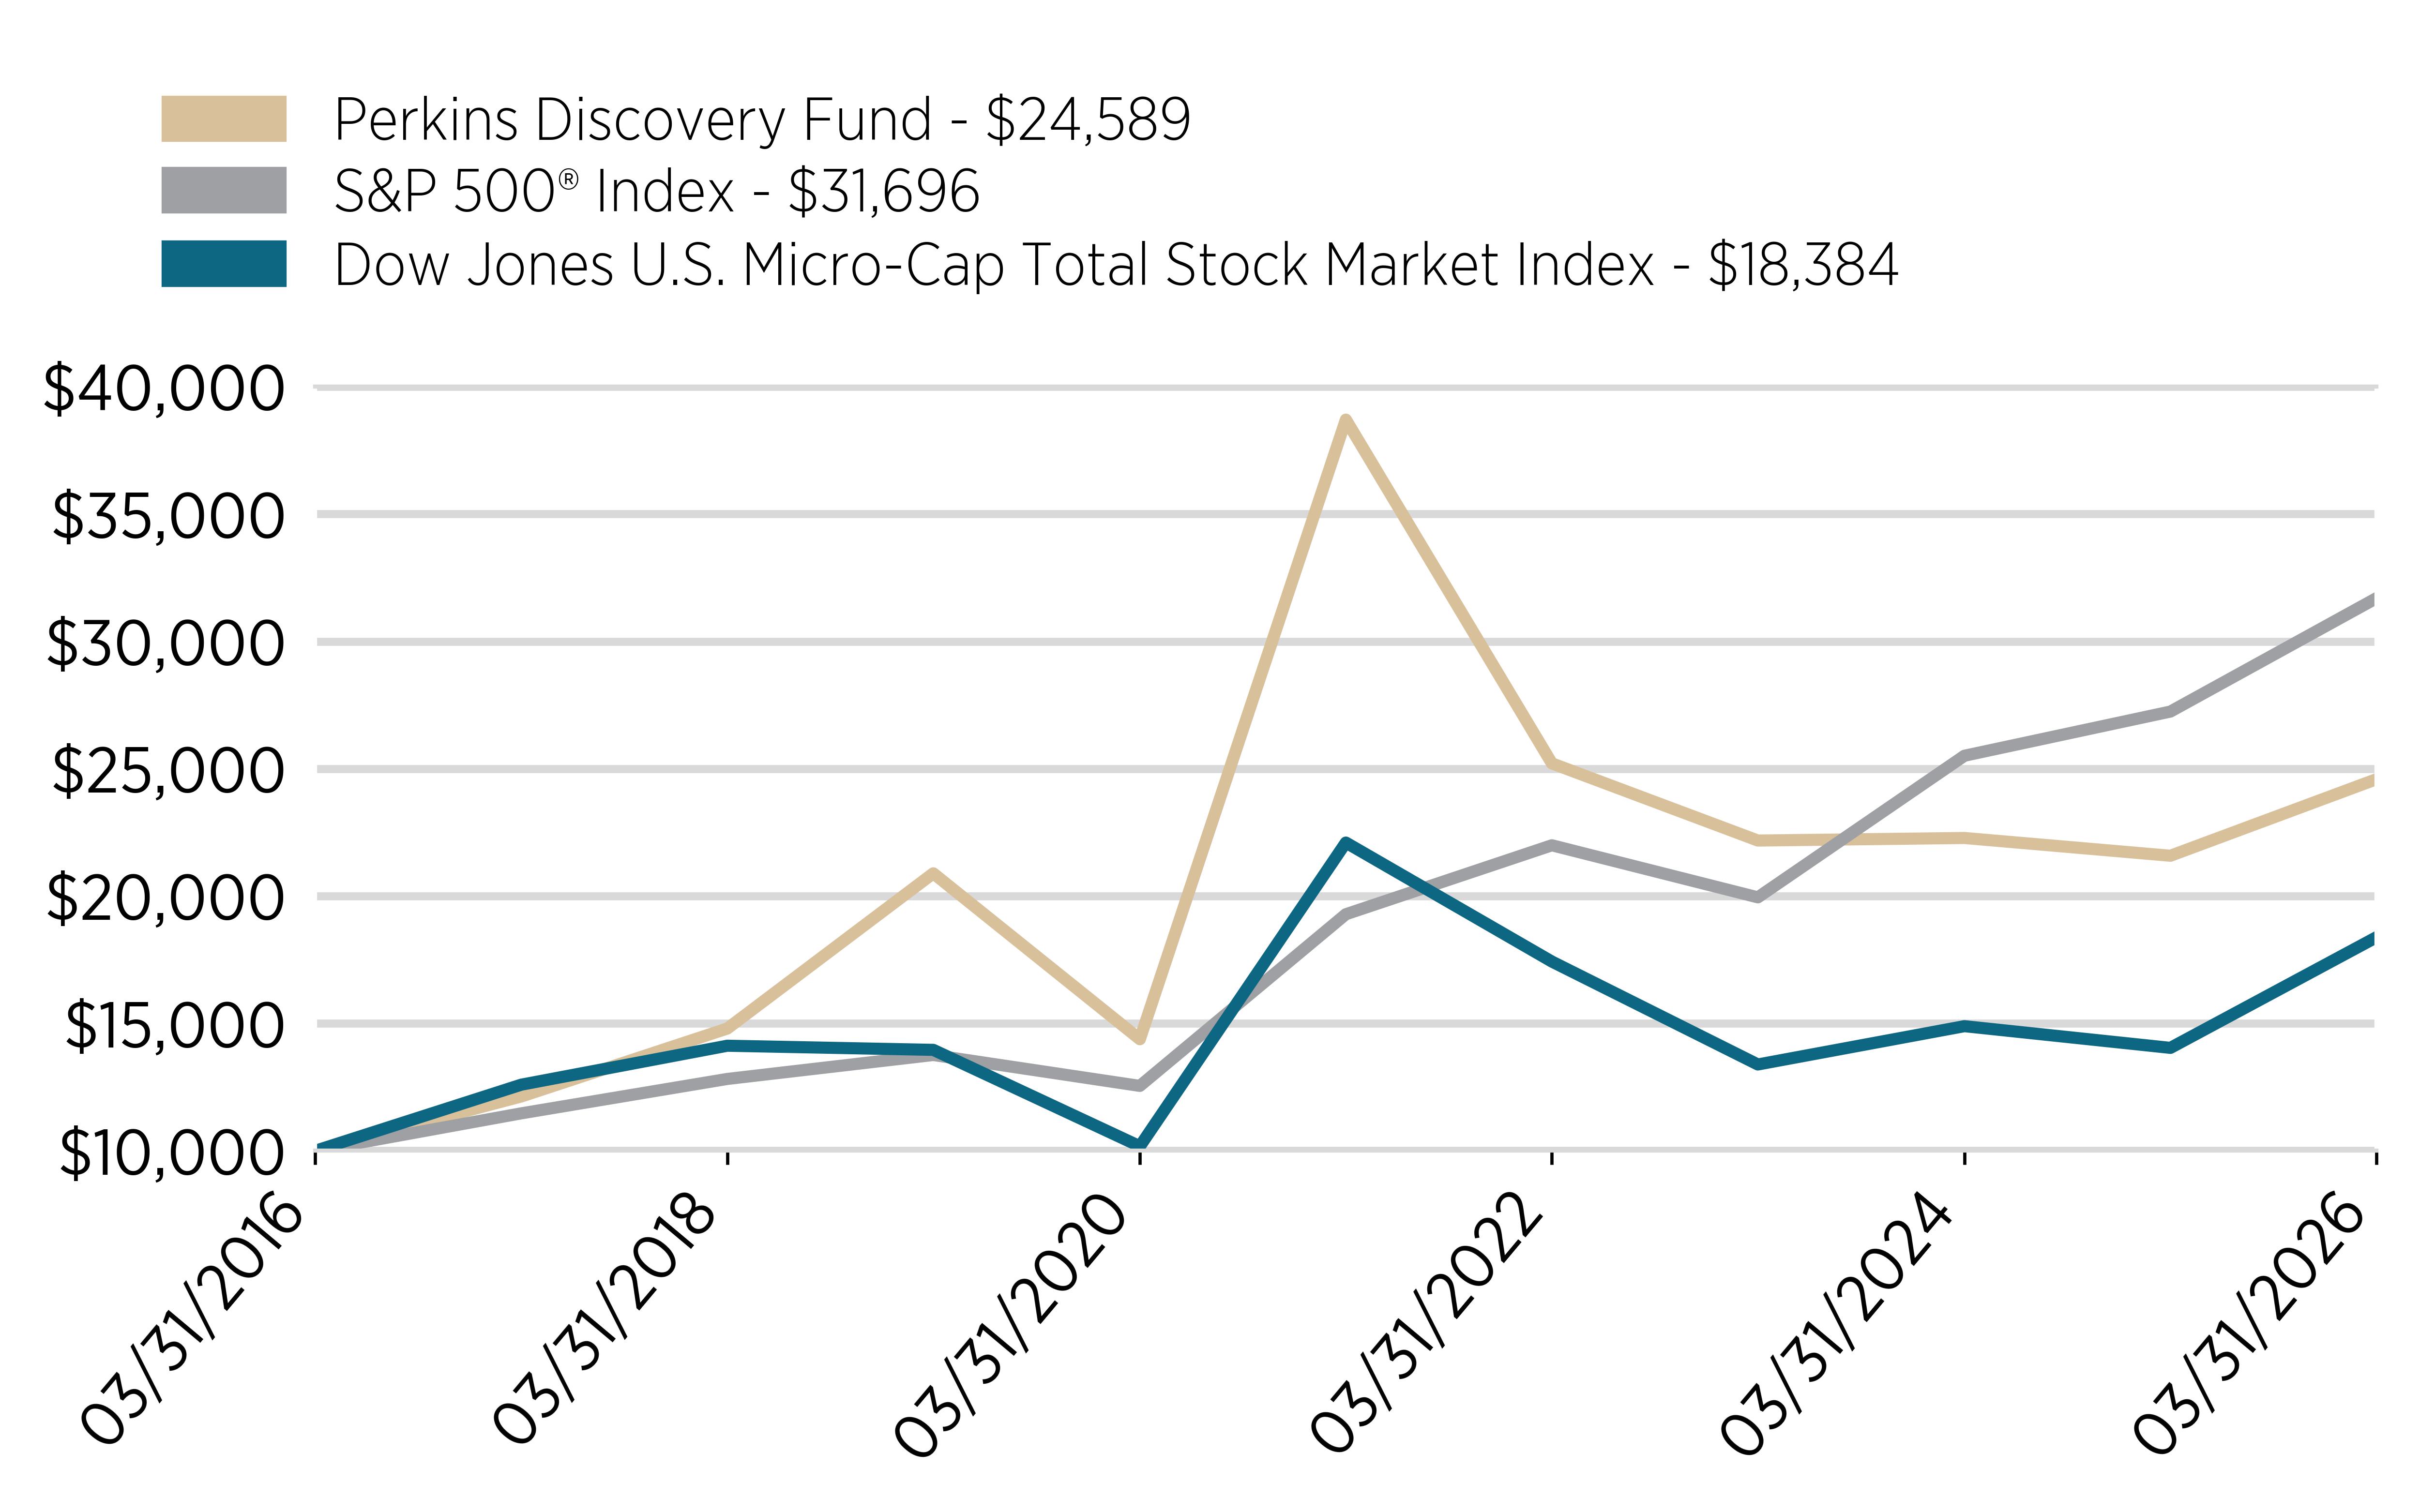
For the period of April 1, 2025 to March 31, 2026, the Perkins Discovery Fund (the “Fund”) returned 13.92%. In comparison, the S&P 500® Index returned 16.33% for the same period and
the Dow Jones U.S. Micro-cap Total Stock Market Index returned 30.93%.
What key factors affected the Fund's performance?
As a micro-cap fund, the Fund was affected primarily by the relative performance of small-cap and micro-cap stocks as compared to large-cap companies and the market as a whole. After several difficult years during which small-cap and micro-cap companies lagged behind large-caps, they began to perform better during the first three quarters of the fiscal year, as did the Fund. During the March quarter, however, the market as a whole was mostly down and the Fund underperformed.
Positioning
At the Perkins Discovery Fund, we follow a bottom-up approach, using both fundamental and technical chart analysis to find new investment opportunities one at a time and to monitor our current holdings. During the 12-month period, we added 4 holdings and disposed of 6. As a result, the portfolio went from 28 holdings to 26. We started the period with 99.13% of the Fund invested in equities and ended with 99.12% invested in equities.
Cumulative Performance
(based on a hypothetical $10,000 investment)
Annual Performance
Average Annual Total Return
|
|
1 Year |
5 Year |
10 Year |
|---|---|---|---|
|
Perkins Discovery Fund |
13.92% |
-8.67% |
9.41% |
|
S&P 500® Index |
16.33% |
10.44% |
13.02% |
|
Dow Jones U.S. Micro-Cap Total Stock Market Index |
30.93% |
-3.62% |
5.79% |
Key Fund Statistics
(as of March 31, 2026)
|
Fund Net Assets |
$5,799,179 |
|
Number of Holdings |
26 |
|
Total Net Advisory Fee |
$0 |
|
Portfolio Turnover Rate |
7.90% |
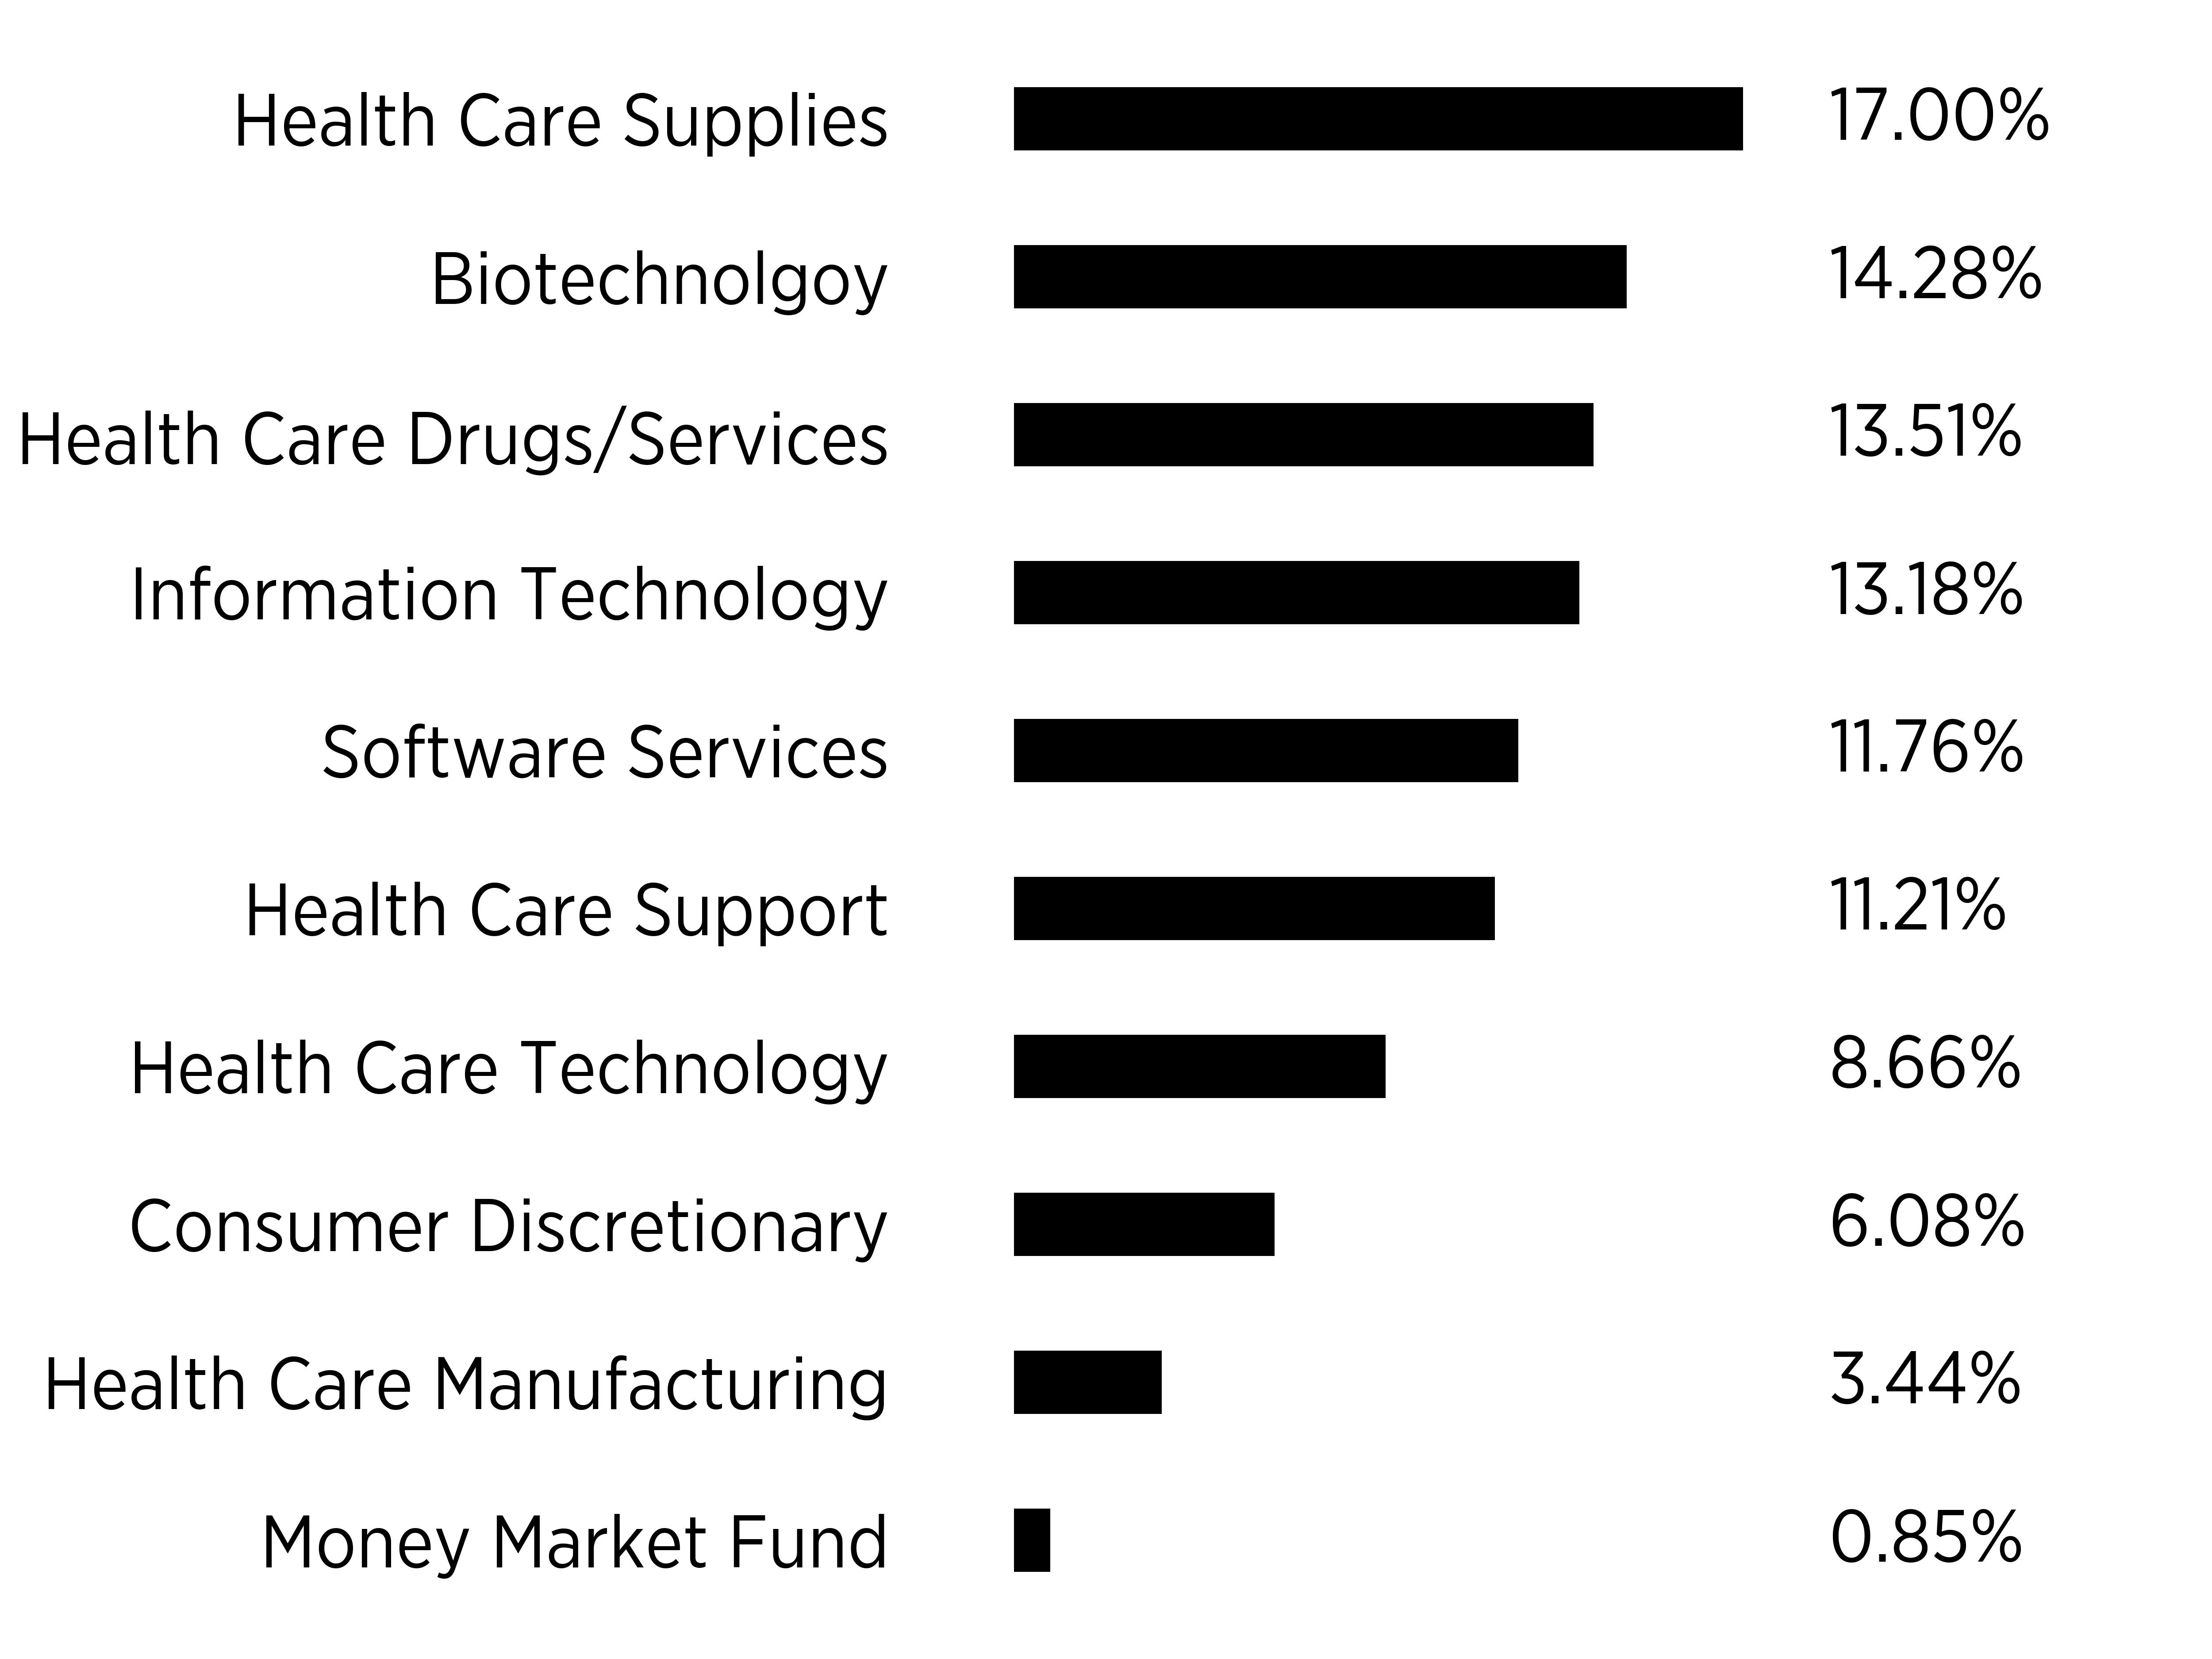
Sector Breakdown
|
Top Ten Holdings |
|
|---|---|
|
Axogen, Inc. |
|
|
Natera, Inc. |
|
|
Veracyte, Inc. |
|
|
ANI Pharmaceuticals, Inc. |
|
|
SkyWater Technology, Inc. |
|
|
ePlus, Inc. |
|
|
Digi International, Inc. |
|
|
Butterfly Network, Inc. |
|
|
BioLife Solutions, Inc. |
|
|
Magnite, Inc. |
Material Changes
Fund Liquidation
On May 20, 2026, the Board of Trustees of WFT approved a Plan of Liquidation for the Fund, based on the recommendation of the Fund's investment advisor, Perkins Capital Management, Inc.The Fund will cease trading and will be closed to purchases as of the close of regular trading on May 29, 2026 (the "Closing Date"). The Fund will not accept purchase orders after the Closing Date. Shareholders may sell their shares through the Closing Date. The Fund is expected to liquidate on June 29, 2026 (the "Liquidation Date").
On or about the Liquidation Date, the Fund expects to distribute to shareholders of record who have not previously redeemed or sold their shares cash in an amount equal to each shareholder's proportionate interest in the net assets of the Fund, after payment of Fund liabilities and liquidation expenses. Distributions may also be made in cash equivalents or in-kind, as permitted under the Plan. Once distributions are complete, the Fund will terminate.
Prior to the Closing Date, the Advisor will begin liquidating the Fund's portfolios, which will result in the Fund holding increased cash positions and deviating from its stated investment objectives and strategies. The Fund will bear brokerage, transaction, and other expenses associated with the liquidation, which have been determined to be extraordinary expenses.