Shareholder Report
|
6 Months Ended |
|
Mar. 31, 2026
USD ($)
Holding
|
|---|
| Shareholder Report [Line Items] |
|
| Document Type |
N-CSRS
|
| Amendment Flag |
false
|
| Registrant Name |
CONESTOGA FUNDS
|
| Entity Central Index Key |
0001175813
|
| Entity Investment Company Type |
N-1A
|
| Document Period End Date |
Mar. 31, 2026
|
| Shareholder Report Annual or Semi-Annual |
Semi-Annual Shareholder Report
|
| C000142731 |
|
| Shareholder Report [Line Items] |
|
| Fund Name |
Conestoga Small Cap Fund
|
| Class Name |
Institutional Class
|
| Trading Symbol |
CCALX
|
| Additional Information Phone Number |
(800) 494-2755
|
| Expenses [Text Block] |
What were the Fund’s annualized costs for the Period?(based on a hypothetical $10,000 investment) Table SummaryClass Name | Costs of a $10,000 investment | Costs paid as a percentage of a $10,000 investment |
|---|
Institutional Class | $43 | 0.90% |
|---|
|
| Expenses Paid, Amount |
$ 43
|
| Expense Ratio, Percent |
0.90%
|
| Performance Past Does Not Indicate Future [Text] |
The Fund's past performance is not a good predictor of how the Fund will perform in the future.
|
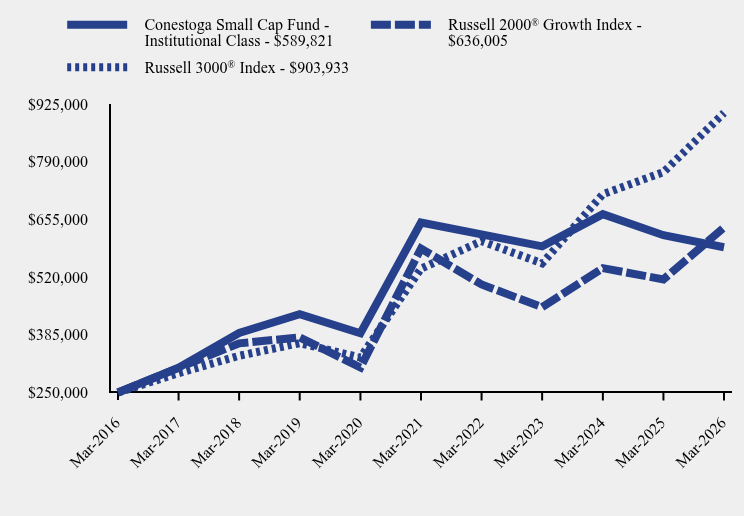
| Line Graph [Table Text Block] |
Table Summary | Conestoga Small Cap Fund - Institutional Class | Russell 2000® Growth Index | Russell 3000® Index |
|---|
Mar-2016 | $250,000 | $250,000 | $250,000 |
|---|
Mar-2017 | $307,872 | $307,584 | $295,167 |
|---|
Mar-2018 | $389,329 | $364,889 | $335,939 |
|---|
Mar-2019 | $433,428 | $378,948 | $365,389 |
|---|
Mar-2020 | $388,719 | $308,541 | $332,046 |
|---|
Mar-2021 | $647,493 | $586,849 | $539,668 |
|---|
Mar-2022 | $619,884 | $502,769 | $604,021 |
|---|
Mar-2023 | $591,867 | $449,496 | $552,194 |
|---|
Mar-2024 | $667,096 | $540,953 | $713,950 |
|---|
Mar-2025 | $618,035 | $514,666 | $765,490 |
|---|
Mar-2026 | $589,821 | $636,005 | $903,933 |
|---|
|
| Average Annual Return [Table Text Block] |
Average Total Returns(period ended March 31, 2026)Table Summary | 6 Months* | 1 Year** | 5 Years** | 10 Years** |
|---|
Conestoga Small Cap Fund - Institutional Class | -7.56% | -4.56% | -1.85% | 8.96% |
|---|
Russell 3000® Index | -1.65% | 18.09% | 10.87% | 13.72% |
|---|
Russell 2000® Growth Index | -1.63% | 23.58% | 1.62% | 9.79% |
|---|
* Not annualized ** Annualized The Fund's past performance is not a good predictor of how the Fund will perform in the future. The graph and table do not reflect the deduction of taxes that a shareholder would pay on fund distributions or redemption of fund shares. Call (800) 494-2755 or visit https://conestogacapital.com/strategies/small-cap-fund/ for updated performance information. |
| No Deduction of Taxes [Text Block] |
The graph and table do not reflect the deduction of taxes that a shareholder would pay on fund distributions or redemption of fund shares.
|
| Updated Performance Information Location [Text Block] |
Call (800) 494-2755 or visit https://conestogacapital.com/strategies/small-cap-fund/ for updated performance information.
|
| AssetsNet |
$ 2,231,985,529
|
| Holdings Count | Holding |
45
|
| Advisory Fees Paid, Amount |
$ 11,885,902
|
| InvestmentCompanyPortfolioTurnover |
14.00%
|
| Additional Fund Statistics [Text Block] |
Fund Statistics (as of March 31, 2026)- Net Assets$2,231,985,529
- Total Number of Portfolio Holdings45
- Advisory Fee (net of waivers)$11,885,902
- Portfolio Turnover Rate14%
|
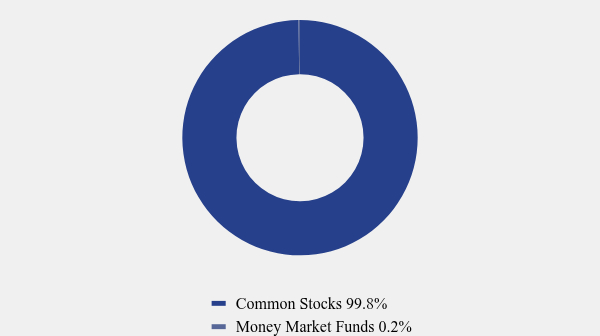
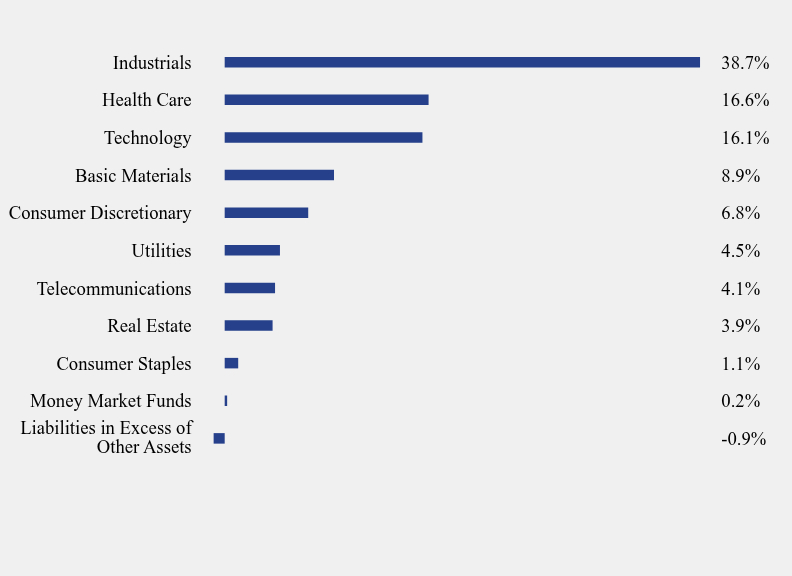
| Holdings [Text Block] |
Asset Weighting (% of total investments)(as of March 31, 2026)Table SummaryValue | Value |
|---|
Common Stocks | 99.8% | Money Market Funds | 0.2% | Sector Weighting (% of net assets)(as of March 31, 2026)Table SummaryValue | Value |
|---|
Liabilities in Excess of Other Assets | -0.9% | Money Market Funds | 0.2% | Consumer Staples | 1.1% | Real Estate | 3.9% | Telecommunications | 4.1% | Utilities | 4.5% | Consumer Discretionary | 6.8% | Basic Materials | 8.9% | Technology | 16.1% | Health Care | 16.6% | Industrials | 38.7% | Top 10 Holdings (% of net assets)(as of March 31, 2026)Table SummaryHolding Name | % of Net Assets |
|---|
LeMaitre Vascular, Inc. | 4.6% |
|---|
RBC Bearings, Inc. | 4.6% |
|---|
Casella Waste Systems, Inc. - Class A | 4.5% |
|---|
ESCO Technologies, Inc. | 4.3% |
|---|
Balchem Corporation | 4.3% |
|---|
Digi International, Inc. | 4.1% |
|---|
FirstService Corporation | 3.9% |
|---|
Novanta, Inc. | 3.7% |
|---|
Construction Partners, Inc. - Class A | 3.5% |
|---|
SiteOne Landscape Supply, Inc. | 3.3% |
|---|
|
| Material Fund Change [Text Block] |
No material changes occurred for the Fund during the Period. |
| C000012946 |
|
| Shareholder Report [Line Items] |
|
| Fund Name |
Conestoga Small Cap Fund
|
| Class Name |
Investors Class
|
| Trading Symbol |
CCASX
|
| Additional Information Phone Number |
(800) 494-2755
|
| Expenses [Text Block] |
What were the Fund’s annualized costs for the Period?(based on a hypothetical $10,000 investment) Table SummaryClass Name | Costs of a $10,000 investment | Costs paid as a percentage of a $10,000 investment |
|---|
Investors Class | $53 | 1.10% |
|---|
|
| Expenses Paid, Amount |
$ 53
|
| Expense Ratio, Percent |
1.10%
|
| Performance Past Does Not Indicate Future [Text] |
The Fund's past performance is not a good predictor of how the Fund will perform in the future.
|
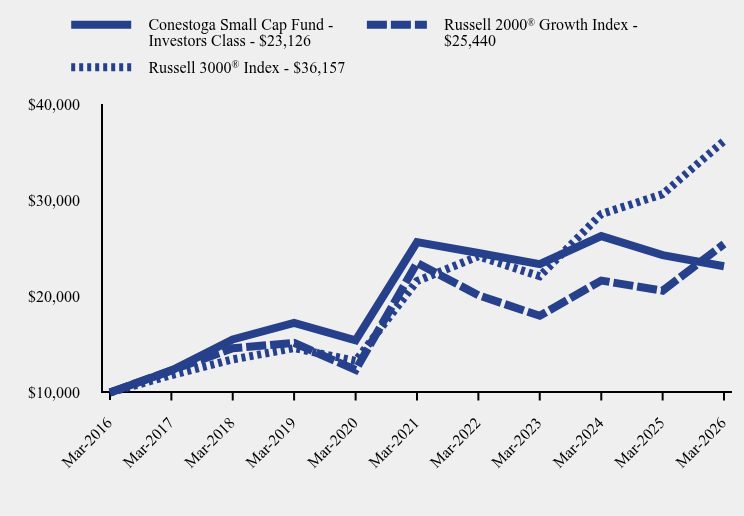
| Line Graph [Table Text Block] |
Table Summary | Conestoga Small Cap Fund - Investors Class | Russell 2000® Growth Index | Russell 3000® Index |
|---|
Mar-2016 | $10,000 | $10,000 | $10,000 |
|---|
Mar-2017 | $12,292 | $12,303 | $11,807 |
|---|
Mar-2018 | $15,509 | $14,596 | $13,438 |
|---|
Mar-2019 | $17,234 | $15,158 | $14,616 |
|---|
Mar-2020 | $15,422 | $12,342 | $13,282 |
|---|
Mar-2021 | $25,641 | $23,474 | $21,587 |
|---|
Mar-2022 | $24,501 | $20,111 | $24,161 |
|---|
Mar-2023 | $23,347 | $17,980 | $22,088 |
|---|
Mar-2024 | $26,259 | $21,638 | $28,558 |
|---|
Mar-2025 | $24,280 | $20,587 | $30,620 |
|---|
Mar-2026 | $23,126 | $25,440 | $36,157 |
|---|
|
| Average Annual Return [Table Text Block] |
Average Total Returns(period ended March 31, 2026)Table Summary | 6 Months* | 1 Year** | 5 Years** | 10 Years** |
|---|
Conestoga Small Cap Fund - Investors Class | -7.66% | -4.75% | -2.04% | 8.75% |
|---|
Russell 3000® Index | -1.65% | 18.09% | 10.87% | 13.72% |
|---|
Russell 2000® Growth Index | -1.63% | 23.58% | 1.62% | 9.79% |
|---|
* Not annualized ** Annualized The Fund's past performance is not a good predictor of how the Fund will perform in the future. The graph and table do not reflect the deduction of taxes that a shareholder would pay on fund distributions or redemption of fund shares. Call (800) 494-2755 or visit https://conestogacapital.com/strategies/small-cap-fund/ for updated performance information. |
| No Deduction of Taxes [Text Block] |
The graph and table do not reflect the deduction of taxes that a shareholder would pay on fund distributions or redemption of fund shares.
|
| Updated Performance Information Location [Text Block] |
Call (800) 494-2755 or visit https://conestogacapital.com/strategies/small-cap-fund/ for updated performance information.
|
| AssetsNet |
$ 2,231,985,529
|
| Holdings Count | Holding |
45
|
| Advisory Fees Paid, Amount |
$ 11,885,902
|
| InvestmentCompanyPortfolioTurnover |
14.00%
|
| Additional Fund Statistics [Text Block] |
Fund Statistics (as of March 31, 2026)- Net Assets$2,231,985,529
- Total Number of Portfolio Holdings45
- Advisory Fee (net of waivers)$11,885,902
- Portfolio Turnover Rate14%
|
| Holdings [Text Block] |
Asset Weighting (% of total investments)(as of March 31, 2026)Table SummaryValue | Value |
|---|
Common Stocks | 99.8% | Money Market Funds | 0.2% | Sector Weighting (% of net assets)(as of March 31, 2026)Table SummaryValue | Value |
|---|
Liabilities in Excess of Other Assets | -0.9% | Money Market Funds | 0.2% | Consumer Staples | 1.1% | Real Estate | 3.9% | Telecommunications | 4.1% | Utilities | 4.5% | Consumer Discretionary | 6.8% | Basic Materials | 8.9% | Technology | 16.1% | Health Care | 16.6% | Industrials | 38.7% | Top 10 Holdings (% of net assets)(as of March 31, 2026)Table SummaryHolding Name | % of Net Assets |
|---|
LeMaitre Vascular, Inc. | 4.6% |
|---|
RBC Bearings, Inc. | 4.6% |
|---|
Casella Waste Systems, Inc. - Class A | 4.5% |
|---|
ESCO Technologies, Inc. | 4.3% |
|---|
Balchem Corporation | 4.3% |
|---|
Digi International, Inc. | 4.1% |
|---|
FirstService Corporation | 3.9% |
|---|
Novanta, Inc. | 3.7% |
|---|
Construction Partners, Inc. - Class A | 3.5% |
|---|
SiteOne Landscape Supply, Inc. | 3.3% |
|---|
|
| Material Fund Change [Text Block] |
No material changes occurred for the Fund during the Period. |
| C000136097 |
|
| Shareholder Report [Line Items] |
|
| Fund Name |
Conestoga SMid Cap Fund
|
| Class Name |
Institutional Class
|
| Trading Symbol |
CCSGX
|
| Additional Information Phone Number |
(800) 494-2755
|
| Expenses [Text Block] |
What were the Fund’s annualized costs for the Period?(based on a hypothetical $10,000 investment) Table SummaryClass Name | Costs of a $10,000 investment | Costs paid as a percentage of a $10,000 investment |
|---|
Institutional Class | $40 | 0.85% |
|---|
|
| Expenses Paid, Amount |
$ 40
|
| Expense Ratio, Percent |
0.85%
|
| Performance Past Does Not Indicate Future [Text] |
The Fund's past performance is not a good predictor of how the Fund will perform in the future.
|
| Line Graph [Table Text Block] |
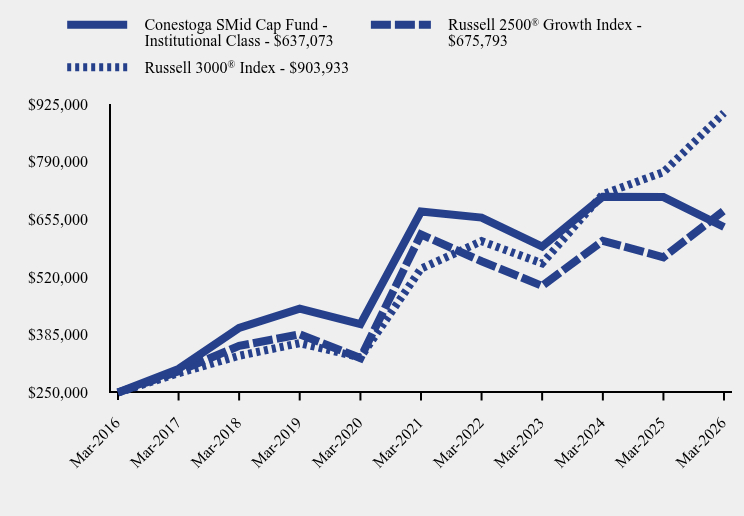
Table Summary | Conestoga SMid Cap Fund - Institutional Class | Russell 2500® Growth Index | Russell 3000® Index |
|---|
Mar-2016 | $250,000 | $250,000 | $250,000 |
|---|
Mar-2017 | $305,246 | $299,429 | $295,167 |
|---|
Mar-2018 | $400,871 | $359,076 | $335,939 |
|---|
Mar-2019 | $446,233 | $386,166 | $365,389 |
|---|
Mar-2020 | $409,741 | $330,561 | $332,046 |
|---|
Mar-2021 | $673,166 | $619,795 | $539,668 |
|---|
Mar-2022 | $659,135 | $557,094 | $604,021 |
|---|
Mar-2023 | $591,275 | $499,425 | $552,194 |
|---|
Mar-2024 | $708,098 | $604,919 | $713,950 |
|---|
Mar-2025 | $707,239 | $566,394 | $765,490 |
|---|
Mar-2026 | $637,073 | $675,793 | $903,933 |
|---|
|
| Average Annual Return [Table Text Block] |
Average Total Returns(period ended March 31, 2026)Table Summary | 6 Months* | 1 Year** | 5 Years** | 10 Years** |
|---|
Conestoga SMid Cap Fund - Institutional Class | -12.82% | -9.92% | -1.10% | 9.81% |
|---|
Russell 3000® Index | -1.65% | 18.09% | 10.87% | 13.72% |
|---|
Russell 2500® Growth Index | -3.20% | 19.31% | 1.75% | 10.46% |
|---|
* Not annualized ** Annualized The Fund's past performance is not a good predictor of how the Fund will perform in the future. The graph and table do not reflect the deduction of taxes that a shareholder would pay on fund distributions or redemption of fund shares. Call (800) 494-2755 or visit https://conestogacapital.com/strategies/smid-cap-fund/ for updated performance information. |
| No Deduction of Taxes [Text Block] |
The graph and table do not reflect the deduction of taxes that a shareholder would pay on fund distributions or redemption of fund shares.
|
| Updated Performance Information Location [Text Block] |
Call (800) 494-2755 or visit https://conestogacapital.com/strategies/smid-cap-fund/ for updated performance information.
|
| AssetsNet |
$ 497,975,065
|
| Holdings Count | Holding |
43
|
| Advisory Fees Paid, Amount |
$ 1,941,098
|
| InvestmentCompanyPortfolioTurnover |
10.00%
|
| Additional Fund Statistics [Text Block] |
Fund Statistics (as of March 31, 2026)- Net Assets$497,975,065
- Total Number of Portfolio Holdings43
- Advisory Fee (net of waivers)$1,941,098
- Portfolio Turnover Rate10%
|
| Holdings [Text Block] |
Asset Weighting (% of total investments)(as of March 31, 2026)Table SummaryValue | Value |
|---|
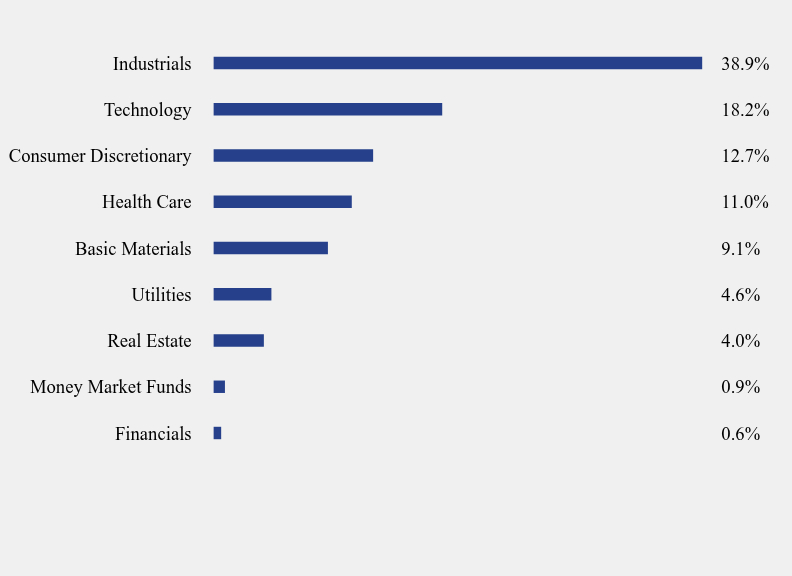
Common Stocks | 99.1% | Money Market Funds | 0.9% | Sector Weighting (% of net assets)(as of March 31, 2026)Table SummaryValue | Value |
|---|
Financials | 0.6% | Money Market Funds | 0.9% | Real Estate | 4.0% | Utilities | 4.6% | Basic Materials | 9.1% | Health Care | 11.0% | Consumer Discretionary | 12.7% | Technology | 18.2% | Industrials | 38.9% | Top 10 Holdings (% of net assets)(as of March 31, 2026)Table SummaryHolding Name | % of Net Assets |
|---|
RBC Bearings, Inc. | 5.0% |
|---|
Casella Waste Systems, Inc. - Class A | 4.6% |
|---|
Rollins, Inc. | 4.2% |
|---|
Balchem Corporation | 4.1% |
|---|
FirstService Corporation | 4.0% |
|---|
Construction Partners, Inc. - Class A | 3.7% |
|---|
Descartes Systems Group, Inc. (The) | 3.2% |
|---|
CSW Industrials, Inc. | 3.1% |
|---|
SPX Technologies, Inc. | 3.1% |
|---|
Novanta, Inc. | 3.0% |
|---|
|
| Material Fund Change [Text Block] |
No material changes occurred for the Fund during the Period. |
| C000136096 |
|
| Shareholder Report [Line Items] |
|
| Fund Name |
Conestoga SMid Cap Fund
|
| Class Name |
Investors Class
|
| Trading Symbol |
CCSMX
|
| Additional Information Phone Number |
(800) 494-2755
|
| Expenses [Text Block] |
What were the Fund’s annualized costs for the Period?(based on a hypothetical $10,000 investment) Table SummaryClass Name | Costs of a $10,000 investment | Costs paid as a percentage of a $10,000 investment |
|---|
Investors Class | $51 | 1.10% |
|---|
|
| Expenses Paid, Amount |
$ 51
|
| Expense Ratio, Percent |
1.10%
|
| Performance Past Does Not Indicate Future [Text] |
The Fund's past performance is not a good predictor of how the Fund will perform in the future.
|
| Line Graph [Table Text Block] |
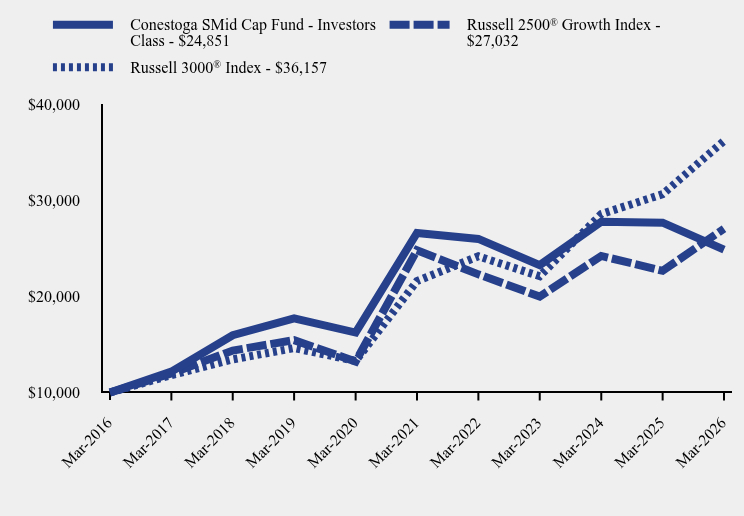
Table Summary | Conestoga SMid Cap Fund - Investors Class | Russell 2500® Growth Index | Russell 3000® Index |
|---|
Mar-2016 | $10,000 | $10,000 | $10,000 |
|---|
Mar-2017 | $12,172 | $11,977 | $11,807 |
|---|
Mar-2018 | $15,954 | $14,363 | $13,438 |
|---|
Mar-2019 | $17,707 | $15,447 | $14,616 |
|---|
Mar-2020 | $16,231 | $13,222 | $13,282 |
|---|
Mar-2021 | $26,588 | $24,792 | $21,587 |
|---|
Mar-2022 | $25,967 | $22,284 | $24,161 |
|---|
Mar-2023 | $23,243 | $19,977 | $22,088 |
|---|
Mar-2024 | $27,761 | $24,197 | $28,558 |
|---|
Mar-2025 | $27,657 | $22,656 | $30,620 |
|---|
Mar-2026 | $24,851 | $27,032 | $36,157 |
|---|
|
| Average Annual Return [Table Text Block] |
Average Total Returns(period ended March 31, 2026)Table Summary | 6 Months* | 1 Year** | 5 Years** | 10 Years** |
|---|
Conestoga SMid Cap Fund - Investors Class | -12.93% | -10.15% | -1.34% | 9.53% |
|---|
Russell 3000® Index | -1.65% | 18.09% | 10.87% | 13.72% |
|---|
Russell 2500® Growth Index | -3.20% | 19.31% | 1.75% | 10.46% |
|---|
* Not annualized ** Annualized The Fund's past performance is not a good predictor of how the Fund will perform in the future. The graph and table do not reflect the deduction of taxes that a shareholder would pay on fund distributions or redemption of fund shares. Call (800) 494-2755 or visit https://conestogacapital.com/strategies/smid-cap-fund/ for updated performance information. |
| No Deduction of Taxes [Text Block] |
The graph and table do not reflect the deduction of taxes that a shareholder would pay on fund distributions or redemption of fund shares.
|
| Updated Performance Information Location [Text Block] |
Call (800) 494-2755 or visit https://conestogacapital.com/strategies/smid-cap-fund/ for updated performance information.
|
| AssetsNet |
$ 497,975,065
|
| Holdings Count | Holding |
43
|
| Advisory Fees Paid, Amount |
$ 1,941,098
|
| InvestmentCompanyPortfolioTurnover |
10.00%
|
| Additional Fund Statistics [Text Block] |
Fund Statistics (as of March 31, 2026)- Net Assets$497,975,065
- Total Number of Portfolio Holdings43
- Advisory Fee (net of waivers)$1,941,098
- Portfolio Turnover Rate10%
|
| Holdings [Text Block] |
Asset Weighting (% of total investments)(as of March 31, 2026)Table SummaryValue | Value |
|---|
Common Stocks | 99.1% | Money Market Funds | 0.9% | Sector Weighting (% of net assets)(as of March 31, 2026)Table SummaryValue | Value |
|---|
Financials | 0.6% | Money Market Funds | 0.9% | Real Estate | 4.0% | Utilities | 4.6% | Basic Materials | 9.1% | Health Care | 11.0% | Consumer Discretionary | 12.7% | Technology | 18.2% | Industrials | 38.9% | Top 10 Holdings (% of net assets)(as of March 31, 2026)Table SummaryHolding Name | % of Net Assets |
|---|
RBC Bearings, Inc. | 5.0% |
|---|
Casella Waste Systems, Inc. - Class A | 4.6% |
|---|
Rollins, Inc. | 4.2% |
|---|
Balchem Corporation | 4.1% |
|---|
FirstService Corporation | 4.0% |
|---|
Construction Partners, Inc. - Class A | 3.7% |
|---|
Descartes Systems Group, Inc. (The) | 3.2% |
|---|
CSW Industrials, Inc. | 3.1% |
|---|
SPX Technologies, Inc. | 3.1% |
|---|
Novanta, Inc. | 3.0% |
|---|
|
| Material Fund Change [Text Block] |
No material changes occurred for the Fund during the Period. |
| C000232594 |
|
| Shareholder Report [Line Items] |
|
| Fund Name |
Conestoga Discovery Fund
|
| Class Name |
Institutional Class
|
| Trading Symbol |
CMIRX
|
| Additional Information Phone Number |
(800) 494-2755
|
| Expenses [Text Block] |
What were the Fund’s annualized costs for the Period?(based on a hypothetical $10,000 investment) Table SummaryClass Name | Costs of a $10,000 investment | Costs paid as a percentage of a $10,000 investment |
|---|
Institutional Class | $60 | 1.25% |
|---|
|
| Expenses Paid, Amount |
$ 60
|
| Expense Ratio, Percent |
1.25%
|
| Performance Past Does Not Indicate Future [Text] |
The Fund's past performance is not a good predictor of how the Fund will perform in the future.
|
| Line Graph [Table Text Block] |
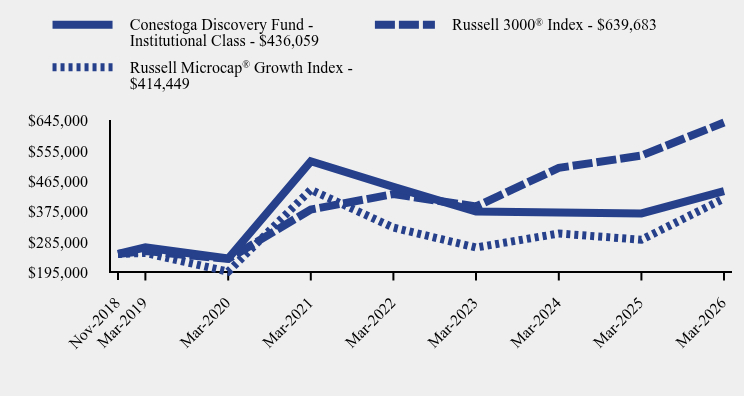
Table Summary | Conestoga Discovery Fund - Institutional Class | Russell 3000® Index | Russell Microcap® Growth Index |
|---|
Nov-2018 | $250,000 | $250,000 | $249,999 |
|---|
Mar-2019 | $269,333 | $258,574 | $252,976 |
|---|
Mar-2020 | $236,257 | $234,978 | $197,430 |
|---|
Mar-2021 | $524,799 | $381,905 | $440,434 |
|---|
Mar-2022 | $449,102 | $427,445 | $328,087 |
|---|
Mar-2023 | $375,759 | $390,770 | $269,087 |
|---|
Mar-2024 | $372,745 | $505,239 | $310,615 |
|---|
Mar-2025 | $370,233 | $541,712 | $292,183 |
|---|
Mar-2026 | $436,059 | $639,683 | $414,449 |
|---|
|
| Average Annual Return [Table Text Block] |
Average Total Returns(period ended March 31, 2026)Table Summary | 6 Months* | 1 Year** | 5 Years** | Since Inception (November 30, 2018)*** |
|---|
Conestoga Discovery Fund - Institutional Class | -9.01% | 17.78% | -3.64% | 7.88% |
|---|
Russell 3000® Index | -1.65% | 18.09% | 10.87% | 13.67% |
|---|
Russell Microcap® Growth Index | -2.19% | 41.84% | -1.21% | 7.14% |
|---|
The Fund's past performance is not a good predictor of how the Fund will perform in the future. The graph and table do not reflect the deduction of taxes that a shareholder would pay on fund distributions or redemption of fund shares. Call (800) 494-2755 or visit https://conestogacapital.com/strategies/discovery-fund/ for updated performance information. |
| Performance Inception Date |
Nov. 30, 2018
|
| No Deduction of Taxes [Text Block] |
The graph and table do not reflect the deduction of taxes that a shareholder would pay on fund distributions or redemption of fund shares.
|
| Updated Performance Information Location [Text Block] |
Call (800) 494-2755 or visit https://conestogacapital.com/strategies/discovery-fund/ for updated performance information.
|
| AssetsNet |
$ 4,934,445
|
| Holdings Count | Holding |
30
|
| Advisory Fees Paid, Amount |
$ 0
|
| InvestmentCompanyPortfolioTurnover |
31.00%
|
| Additional Fund Statistics [Text Block] |
Fund Statistics (as of March 31, 2026)- Net Assets$4,934,445
- Total Number of Portfolio Holdings30
- Advisory Fee (net of waivers)$0
- Portfolio Turnover Rate31%
|
| Holdings [Text Block] |
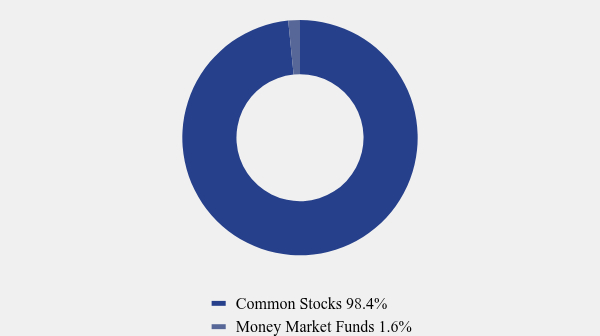
Asset Weighting (% of total investments)(as of March 31, 2026)Table SummaryValue | Value |
|---|
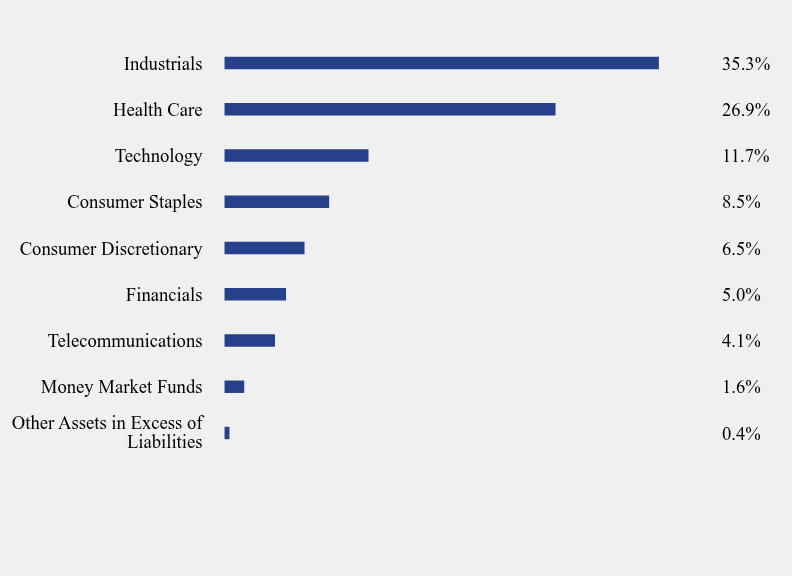
Common Stocks | 98.4% | Money Market Funds | 1.6% | Sector Weighting (% of net assets)(as of March 31, 2026)Table SummaryValue | Value |
|---|
Other Assets in Excess of Liabilities | 0.4% | Money Market Funds | 1.6% | Telecommunications | 4.1% | Financials | 5.0% | Consumer Discretionary | 6.5% | Consumer Staples | 8.5% | Technology | 11.7% | Health Care | 26.9% | Industrials | 35.3% | Top 10 Holdings (% of net assets)(as of March 31, 2026)Table SummaryHolding Name | % of Net Assets |
|---|
Mama's Creations, Inc. | 5.7% |
|---|
Twist Bioscience Corporation | 5.5% |
|---|
Palomar Holdings, Inc. | 5.0% |
|---|
Vericel Corporation | 4.6% |
|---|
Transcat, Inc. | 4.4% |
|---|
Electrovaya, Inc. | 4.2% |
|---|
Digi International, Inc. | 4.1% |
|---|
iRadimed Corporation | 4.1% |
|---|
Hillman Solutions Corporation | 4.0% |
|---|
Universal Technical Institute, Inc. | 3.9% |
|---|
|
| Material Fund Change [Text Block] |
No material changes occurred for the Fund during the Period. |
| C000232593 |
|
| Shareholder Report [Line Items] |
|
| Fund Name |
Conestoga Discovery Fund
|
| Class Name |
Investors Class
|
| Trading Symbol |
CMCMX
|
| Additional Information Phone Number |
(800) 494-2755
|
| Expenses [Text Block] |
What were the Fund’s annualized costs for the Period?(based on a hypothetical $10,000 investment) Table SummaryClass Name | Costs of a $10,000 investment | Costs paid as a percentage of a $10,000 investment |
|---|
Investors Class | $71 | 1.50% |
|---|
|
| Expenses Paid, Amount |
$ 71
|
| Expense Ratio, Percent |
1.50%
|
| Performance Past Does Not Indicate Future [Text] |
The Fund's past performance is not a good predictor of how the Fund will perform in the future.
|
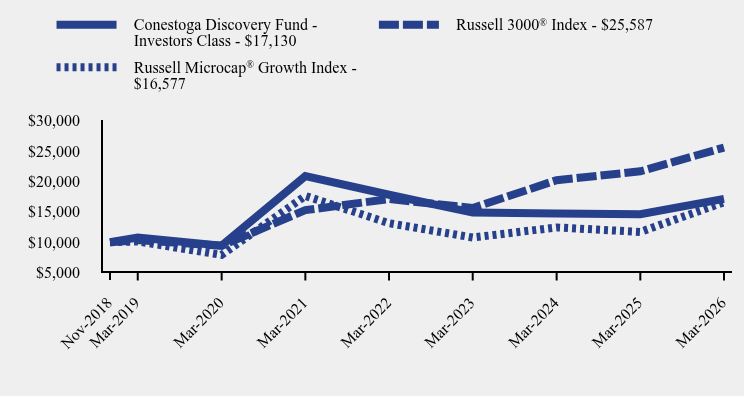
| Line Graph [Table Text Block] |
Table Summary | Conestoga Discovery Fund - Investors Class | Russell 3000® Index | Russell Microcap® Growth Index |
|---|
Nov-2018 | $10,000 | $10,000 | $9,999 |
|---|
Mar-2019 | $10,764 | $10,343 | $10,119 |
|---|
Mar-2020 | $9,419 | $9,399 | $7,897 |
|---|
Mar-2021 | $20,870 | $15,276 | $17,617 |
|---|
Mar-2022 | $17,808 | $17,098 | $13,123 |
|---|
Mar-2023 | $14,876 | $15,631 | $10,763 |
|---|
Mar-2024 | $14,717 | $20,210 | $12,424 |
|---|
Mar-2025 | $14,597 | $21,668 | $11,687 |
|---|
Mar-2026 | $17,130 | $25,587 | $16,577 |
|---|
|
| Average Annual Return [Table Text Block] |
Average Total Returns(period ended March 31, 2026)Table Summary | 6 Months* | 1 Year** | 5 Years** | Since Inception (November 30, 2018)*** |
|---|
Conestoga Discovery Fund - Investors Class | -9.19% | 17.35% | -3.87% | 7.62% |
|---|
Russell 3000® Index | -1.65% | 18.09% | 10.87% | 13.67% |
|---|
Russell Microcap® Growth Index | -2.19% | 41.84% | -1.21% | 7.14% |
|---|
The Fund's past performance is not a good predictor of how the Fund will perform in the future. The graph and table do not reflect the deduction of taxes that a shareholder would pay on fund distributions or redemption of fund shares. Call (800) 494-2755 or visit https://conestogacapital.com/strategies/discovery-fund/ for updated performance information. |
| Performance Inception Date |
Nov. 30, 2018
|
| No Deduction of Taxes [Text Block] |
The graph and table do not reflect the deduction of taxes that a shareholder would pay on fund distributions or redemption of fund shares.
|
| Updated Performance Information Location [Text Block] |
Call (800) 494-2755 or visit https://conestogacapital.com/strategies/discovery-fund/ for updated performance information.
|
| AssetsNet |
$ 4,934,445
|
| Holdings Count | Holding |
30
|
| Advisory Fees Paid, Amount |
$ 0
|
| InvestmentCompanyPortfolioTurnover |
31.00%
|
| Additional Fund Statistics [Text Block] |
Fund Statistics (as of March 31, 2026)- Net Assets$4,934,445
- Total Number of Portfolio Holdings30
- Advisory Fee (net of waivers)$0
- Portfolio Turnover Rate31%
|
| Holdings [Text Block] |
Asset Weighting (% of total investments)(as of March 31, 2026)Table SummaryValue | Value |
|---|
Common Stocks | 98.4% | Money Market Funds | 1.6% | Sector Weighting (% of net assets)(as of March 31, 2026)Table SummaryValue | Value |
|---|
Other Assets in Excess of Liabilities | 0.4% | Money Market Funds | 1.6% | Telecommunications | 4.1% | Financials | 5.0% | Consumer Discretionary | 6.5% | Consumer Staples | 8.5% | Technology | 11.7% | Health Care | 26.9% | Industrials | 35.3% | Top 10 Holdings (% of net assets)(as of March 31, 2026)Table SummaryHolding Name | % of Net Assets |
|---|
Mama's Creations, Inc. | 5.7% |
|---|
Twist Bioscience Corporation | 5.5% |
|---|
Palomar Holdings, Inc. | 5.0% |
|---|
Vericel Corporation | 4.6% |
|---|
Transcat, Inc. | 4.4% |
|---|
Electrovaya, Inc. | 4.2% |
|---|
Digi International, Inc. | 4.1% |
|---|
iRadimed Corporation | 4.1% |
|---|
Hillman Solutions Corporation | 4.0% |
|---|
Universal Technical Institute, Inc. | 3.9% |
|---|
|
| Material Fund Change [Text Block] |
No material changes occurred for the Fund during the Period. |