This report describes changes to the Fund that occurred during the reporting period.
| What were the Fund costs for the period? (based on a hypothetical $10,000 investment) | ||||||
| Fund Name | Costs of a $10,000 | Costs paid as a percentage of | ||||
| The Cook & Bynum Fund | $77 | 1.49%1 | ||||
| 1 Annualized. | ||||||
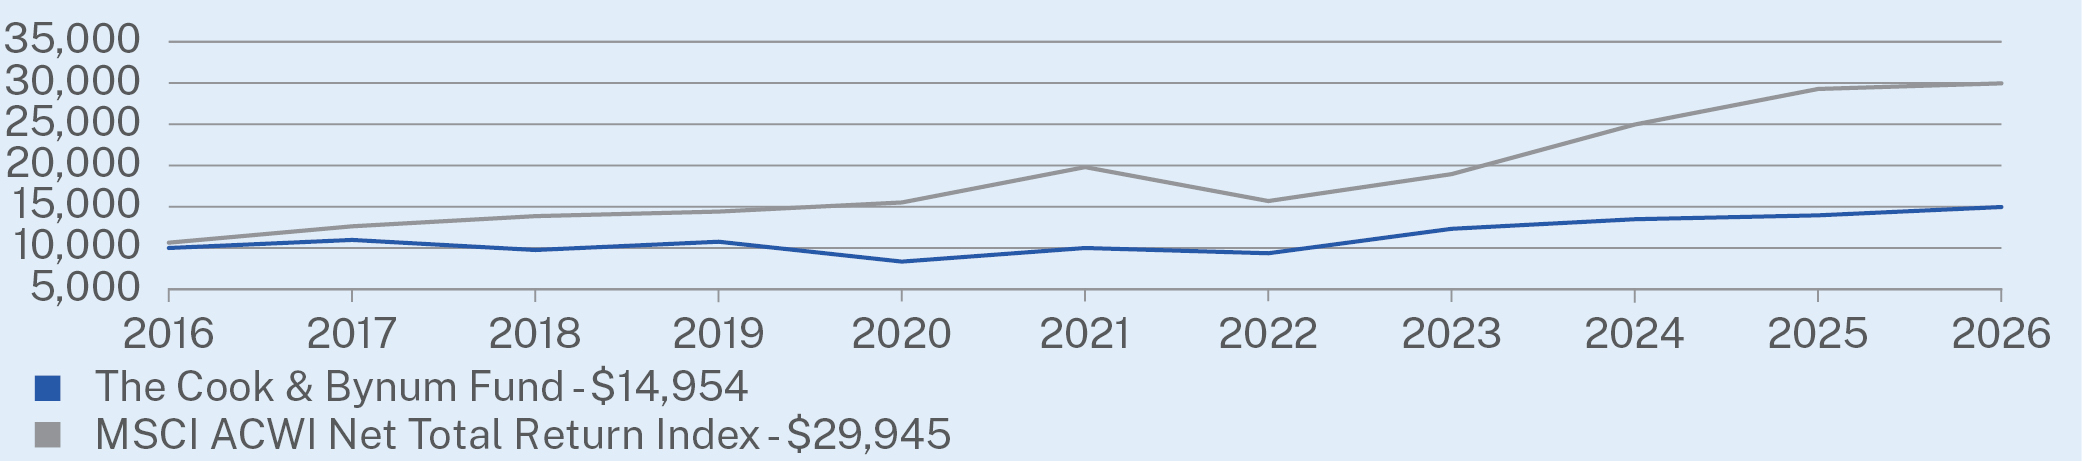
| How did the Fund perform? The Cook & Bynum Fund (the “Fund”) delivered positive returns for the period of October 1, 2025, through March 31, 2026, in contrast to the slight decline of the MSCI All Country World Index (“ACWI”). The solid 2025 business performance that many of our companies recently reported underpinned the Fund’s positive results. The Fund’s five beverage investments contributed significantly to returns on the back of strong business results and a modest improvement in their valuations. The Fund’s six investments in Latin America also all contributed to returns as the region had a strong 2025 that continued into 2026. |
| CUMULATIVE PERFORMANCE (based on a hypothetical $10,000 investment) |
|
|
| ANNUAL Performance |
| Average Annual Return (%) | ||||||
| 1 Year | 5 Year | 10 Year | ||||
| The Cook & Bynum Fund | 8.42% | 8.24% | 4.10% | |||
| MSCI ACWI Net Total Return Index | 20.01% | 9.48% | 11.33% | |||
The MSCI All Country World Index (ACWI) Net Total Return Index captures the performance of large- and mid-cap stocks across 23 developed and 24 emerging markets, reflecting dividends reinvested after withholding taxes. It offers a broad, global equity benchmark covering approximately 85% of the investable market capitalization.
| KEY FUND STATISTICS (as of March 31, 2026) | |||
| Fund Net Assets | $82,493,977 | ||
| Number of Holdings | 12 | ||
| Total Net Advisory Fee | $404,782 | ||
| Portfolio Turnover Rate | 5.13% |
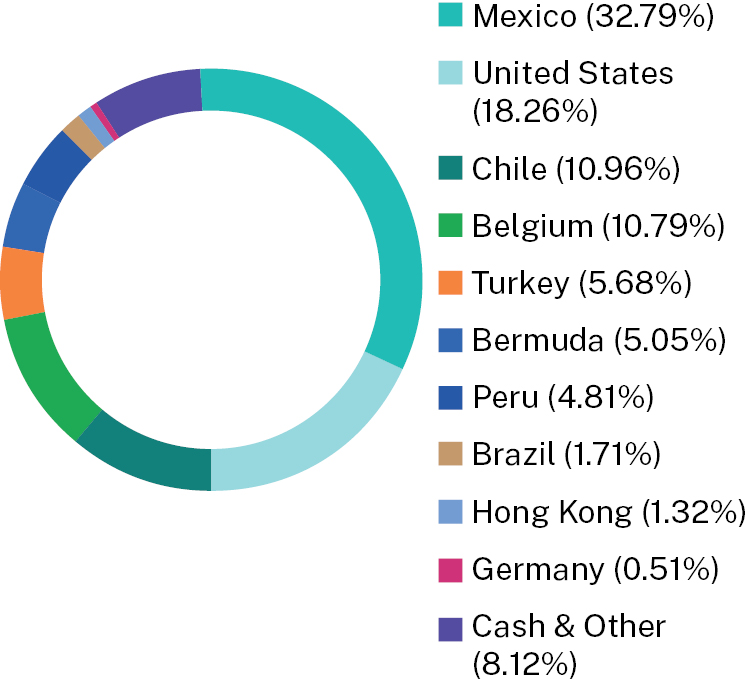
| Geographic Breakdown
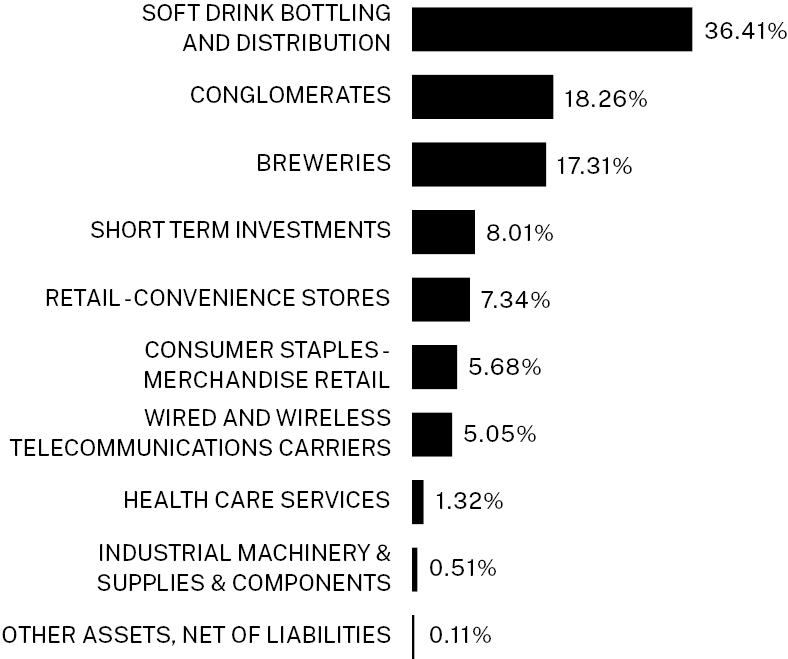
| Sector Breakdown
|
WHAT DID THE FUND INVEST IN? (% of Net Assets as of March 31, 2026)
| Top 10 Holdings | (%) | ||
| Arca Continental S.A.B. de C.V. | 25.45% | ||
| Berkshire Hathaway Class B | 18.26% | ||
| Coca-Cola Embonor SA | 10.96% | ||
| Anheuser-Busch InBev SA/NV | 10.79% | ||
| Fomento Economico Mexicano SAB | 7.34% | ||
| US Treasury Bill 4/2/2026 | 6.85% | ||
| Union de Cervecerias Peruanas Backus y Johnston SA | 4.81% | ||
| Liberty Latin America Ltd. Class C | 4.19% | ||
| AG Anadolu Grubu Holding AS | 2.90% | ||
| BIM Birlesik Magazalar AS | 2.78% |
| [1] | Annualized |