v3.26.1
Pay vs Performance Disclosure - USD ($)
12 Months Ended
Dec. 31, 2025
Dec. 31, 2024
Dec. 31, 2023
Pay vs Performance Disclosure      
Pay vs Performance Disclosure, Table

Pay Versus Performance Table


Year


Summary
Compensation
Table for
PEO (Mr. Arthur)
(1)


Compensation
Actually
Paid to
PEO (Mr. Arthur)
(2)(3)


Summary
Compensation
Table for
PEO (Mr. Rosenblum)
(1)


Compensation
Actually
Paid to
PEO (Mr. Rosenblum)
(2)(3)


Summary
Compensation
Table for
PEO (Mr. Pierce)
(1)


Compensation
Actually
Paid to
PEO (Mr. Pierce)
(2)(3)


2025


$

106,230


$

106,223


$

569,000


$

567,967


$

225,036


$

124,488


2024


$

734,450


$

727,586


$


$


$


$


2023


$

544,600


$

516,927


$


$


$


$


Average
Summary
Compensation
Table Totals
for non-PEO
NEOs
(1)


Average
Compensation
Actually
Paid to
non-PEO
NEO
(2)(3)


Value of
Initial
Fixed $100
Investment
Based On:
Total
Shareholder
Return


Net Loss
(in millions)

2025


$

225,059


$

124,511


$

0.35


$

12.52

2024


$

350,422


$

343,233


$

15.03


$

5.58

2023


$

355,760


$

345,284


$

42.48


$

12.54


(1)
Reflects the amount reported in the “Total” column of the Summary Compensation Table for each of David Arthur, Mark Rosenblum, and Frederick Pierce for each corresponding year in which they served as PEO. See “Executive Compensation - Summary Compensation Table” and “Executive Compensation - Summary Compensation Table” in our 2025 Definitive Proxy Statement filed with the SEC on November 7, 2025.The PEO for 2025 is David Arthur, Mark Rosenblum and Frederick Pierce. The PEO for 2024 and 2023 is David Arthur. The Non-PEO NEO for whom the average compensation is presented in the table for 2025 is Barbara Hibner and Peter Marschel and for 2024 and 2023 is Mark Rosenblum.
(2)
The amounts shown as Compensation Actually Paid (“CAP”) have been calculated in accordance with Item 402(v) of Regulation S-K and do not reflect compensation actually realized or received by the Company’s PEOs and Non-PEO NEOs. These amounts reflect total compensation as set forth in the Summary Compensation Table for each year, adjusted as described in footnote 3 below.
(3)
CAP reflects the exclusions and inclusions for the PEOs and the Non-PEO NEOs set forth below. Amounts excluded, which are set forth in the “Minus Stock and Option Awards from Summ. Comp. Table” columns below, represent the stock awards and option awards reported in the Stock Awards and Option Awards columns of the Summary Compensation Table for each applicable year. Amounts added back to determine CAP are made up of the following components which are set forth in the table below, as applicable: (i) the fair value as of the end of the fiscal year of outstanding and unvested equity awards granted in that year; (ii) the change in fair value during the year of equity awards granted in prior years that remained outstanding and unvested at the end of the year; (iii) the fair value as of the vesting date of equity awards that were granted and vested in that year; and (iv) the change in fair value during the year through the vesting date of equity awards granted in prior years that vested during that year. The fair value at the end of the prior year of awards granted in any prior year that failed to meet applicable vesting conditions during the covered year are subtracted. Equity values are calculated in accordance with ASC Topic 718.


Year


Summary
Comp. Table
Total for
PEO


Minus Stock
and Option
Awards from
Summ.
Comp. Table


Plus Year-
End Equity
Value of
Unvested
Awards
Granted
During Year


Plus Change
in Value of
Unvested
Awards
Granted in
Prior Years


Plus Value of
Awards
Granted
and Vested
During Year


Plus Change
in Value of
Prior Years’
Awards
Vested
During Year


Comp.
Actually
Paid to PEO


2025


$

900,266


$

195,429


$

189


$

(11)


$

94,692


$

(1,029)


$

798,678


2024


$

734,450


$

8,265


$

1,522


$

(163

)


$


$

42


$

727,586


2023


$

544,600


$

31,400


$

13,000


$

(10,395

)


$


$

1,122


$

516,927


Year


Average Summary
Comp. Table
Total for
Other NEOs


Minus Average Stock
and Option
Awards from
Summ.
Comp. Table


Plus Average Year-
End Equity
Value of
Unvested
Awards
Granted
During Year


Plus Average Change
in Value of
Unvested
Awards
Granted in
Prior Years


Plus Average Value of
Awards
Granted
and Vested
During Year


Plus Average Change
in Value of
Prior Years’
Awards
Vested
During Year


Average Comp.
Actually
Paid to
Other NEOs


2025


$

225,059


$

195,429


$

189


$


$


$

94,692


$

124,511


2024


$

350,422


$

11,372


$

4,230


$

(65

)


$


$

18


$

343,233


2023


$

355,760


$

12,560


$

5,200


$

(3,791

)


$


$

675


$

345,284


Named Executive Officers, Footnote
(1)
Reflects the amount reported in the “Total” column of the Summary Compensation Table for each of David Arthur, Mark Rosenblum, and Frederick Pierce for each corresponding year in which they served as PEO. See “Executive Compensation - Summary Compensation Table” and “Executive Compensation - Summary Compensation Table” in our 2025 Definitive Proxy Statement filed with the SEC on November 7, 2025.The PEO for 2025 is David Arthur, Mark Rosenblum and Frederick Pierce. The PEO for 2024 and 2023 is David Arthur. The Non-PEO NEO for whom the average compensation is presented in the table for 2025 is Barbara Hibner and Peter Marschel and for 2024 and 2023 is Mark Rosenblum.
   
PEO Total Compensation Amount $ 900,266 $ 734,450 $ 544,600
PEO Actually Paid Compensation Amount $ 798,678 727,586 516,927
Adjustment To PEO Compensation, Footnote
(3)
CAP reflects the exclusions and inclusions for the PEOs and the Non-PEO NEOs set forth below. Amounts excluded, which are set forth in the “Minus Stock and Option Awards from Summ. Comp. Table” columns below, represent the stock awards and option awards reported in the Stock Awards and Option Awards columns of the Summary Compensation Table for each applicable year. Amounts added back to determine CAP are made up of the following components which are set forth in the table below, as applicable: (i) the fair value as of the end of the fiscal year of outstanding and unvested equity awards granted in that year; (ii) the change in fair value during the year of equity awards granted in prior years that remained outstanding and unvested at the end of the year; (iii) the fair value as of the vesting date of equity awards that were granted and vested in that year; and (iv) the change in fair value during the year through the vesting date of equity awards granted in prior years that vested during that year. The fair value at the end of the prior year of awards granted in any prior year that failed to meet applicable vesting conditions during the covered year are subtracted. Equity values are calculated in accordance with ASC Topic 718.


Year


Summary
Comp. Table
Total for
PEO


Minus Stock
and Option
Awards from
Summ.
Comp. Table


Plus Year-
End Equity
Value of
Unvested
Awards
Granted
During Year


Plus Change
in Value of
Unvested
Awards
Granted in
Prior Years


Plus Value of
Awards
Granted
and Vested
During Year


Plus Change
in Value of
Prior Years’
Awards
Vested
During Year


Comp.
Actually
Paid to PEO


2025


$

900,266


$

195,429


$

189


$

(11)


$

94,692


$

(1,029)


$

798,678


2024


$

734,450


$

8,265


$

1,522


$

(163

)


$


$

42


$

727,586


2023


$

544,600


$

31,400


$

13,000


$

(10,395

)


$


$

1,122


$

516,927


Non-PEO NEO Average Total Compensation Amount $ 225,059 350,422 355,760
Non-PEO NEO Average Compensation Actually Paid Amount $ 124,511 343,233 345,284
Compensation Actually Paid vs. Total Shareholder Return

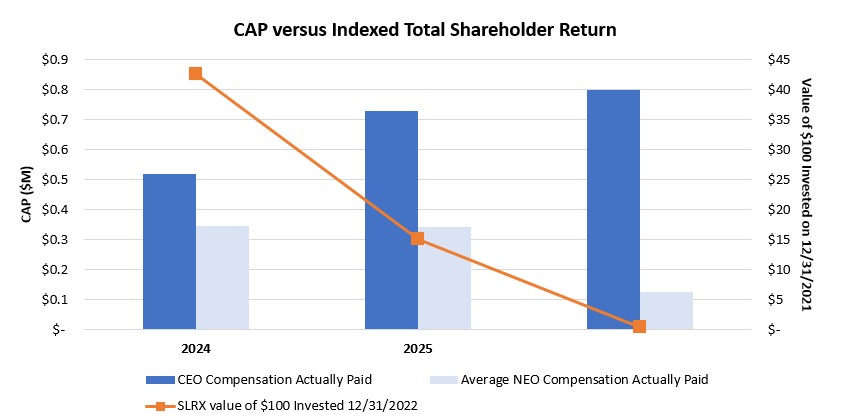
The following graph illustrates the relationship during 2023-2025 of the CAP for our PEOs and non-PEO NEOs as calculated pursuant to SEC rules to our TSR assuming a $100 investment in our stock on December 31, 2022.


img45420450_0.jpg

   
Compensation Actually Paid vs. Net Income

The following graph illustrates the relationship during 2023-2025 of the CAP for our CEOs and other NEOs as calculated pursuant to SEC rules to our net loss.

   
Tabular List, Table

In accordance with Item 402(v) of Regulation S-K, we are providing the following descriptions of the relationships between information presented in the Pay Versus Performance table on CAP and each of total stockholder return (“TSR”) and net loss.

   
Total Shareholder Return Amount $ 0.35 15.03 42.48
Net Income (Loss) $ 12,520,000 5,580,000 12,540,000
Additional 402(v) Disclosure
(2)
The amounts shown as Compensation Actually Paid (“CAP”) have been calculated in accordance with Item 402(v) of Regulation S-K and do not reflect compensation actually realized or received by the Company’s PEOs and Non-PEO NEOs. These amounts reflect total compensation as set forth in the Summary Compensation Table for each year, adjusted as described in footnote 3 below.

We do not utilize TSR and net loss in our executive compensation program. However, we do utilize several other performance measures to align executive compensation with our performance. As described in more detail above in the section of Summary Compensation Tables and Employment Agreements, part of the compensation our NEOs are eligible to receive consists of annual performance-based cash bonuses that are designed to provide appropriate incentives to our executives to achieve defined annual corporate goals and to reward our executives for individual achievement towards these goals, subject to certain employment criteria. Additionally, we view stock options, which are an integral part of our executive compensation program, as related to company performance although not directly tied to TSR, because they provide value only if the market price of our common stock increases, and if the executive officer continues in our employment over the vesting period. These stock option awards strongly align our executive officers’ interests with those of our stockholders by providing a continuing financial incentive to maximize long-term value for our stockholders and by encouraging our executive officers to continue in our employment for the long-term.

With respect to net income, specifically, because we are not a commercial-stage company, we did not have any revenue during the periods presented, other than revenue associated with grants. Consequently, our company does not consider net loss as a performance measure for our executive compensation program. In 2025, our net loss increased from 2024. This increase was primarily due to the Merger closed on November 12, 2025.

   
Measure:: 1      
Pay vs Performance Disclosure      
Name TSR    
Measure:: 2      
Pay vs Performance Disclosure      
Name net loss    
David Arthur [Member]      
Pay vs Performance Disclosure      
PEO Total Compensation Amount $ 106,230 734,450 544,600
PEO Actually Paid Compensation Amount $ 106,223 $ 727,586 $ 516,927
PEO Name David Arthur, David Arthur, David Arthur,
Mark Rosenblum [Member]      
Pay vs Performance Disclosure      
PEO Total Compensation Amount $ 569,000   $ 0
PEO Actually Paid Compensation Amount $ 567,967 $ 0 $ 0
PEO Name Mark Rosenblum Mark Rosenblum Mark Rosenblum
Frederick Pierce [Member]      
Pay vs Performance Disclosure      
PEO Total Compensation Amount $ 225,036 $ 0 $ 0
PEO Actually Paid Compensation Amount $ 124,488 $ 0 $ 0
PEO Name Frederick Pierce Frederick Pierce Frederick Pierce
PEO | Aggregate Grant Date Fair Value of Equity Award Amounts Reported in Summary Compensation Table      
Pay vs Performance Disclosure      
Adjustment to Compensation, Amount $ (195,429) $ (8,265) $ (31,400)
PEO | Year-end Fair Value of Equity Awards Granted in Covered Year that are Outstanding and Unvested      
Pay vs Performance Disclosure      
Adjustment to Compensation, Amount 189 1,522 13,000
PEO | Year-over-Year Change in Fair Value of Equity Awards Granted in Prior Years That are Outstanding and Unvested      
Pay vs Performance Disclosure      
Adjustment to Compensation, Amount (11) (163) (10,395)
PEO | Vesting Date Fair Value of Equity Awards Granted and Vested in Covered Year      
Pay vs Performance Disclosure      
Adjustment to Compensation, Amount 94,692 0 0
PEO | Change in Fair Value as of Vesting Date of Prior Year Equity Awards Vested in Covered Year      
Pay vs Performance Disclosure      
Adjustment to Compensation, Amount (1,029) 42 1,122
Non-PEO NEO | Aggregate Grant Date Fair Value of Equity Award Amounts Reported in Summary Compensation Table      
Pay vs Performance Disclosure      
Adjustment to Compensation, Amount (195,429) (11,372) (12,560)
Non-PEO NEO | Year-end Fair Value of Equity Awards Granted in Covered Year that are Outstanding and Unvested      
Pay vs Performance Disclosure      
Adjustment to Compensation, Amount 189 4,230 5,200
Non-PEO NEO | Year-over-Year Change in Fair Value of Equity Awards Granted in Prior Years That are Outstanding and Unvested      
Pay vs Performance Disclosure      
Adjustment to Compensation, Amount 0 (65) (3,791)
Non-PEO NEO | Vesting Date Fair Value of Equity Awards Granted and Vested in Covered Year      
Pay vs Performance Disclosure      
Adjustment to Compensation, Amount 0 0 0
Non-PEO NEO | Change in Fair Value as of Vesting Date of Prior Year Equity Awards Vested in Covered Year      
Pay vs Performance Disclosure      
Adjustment to Compensation, Amount $ 94,692 $ 18 $ 675