Shareholder Report
Mar. 31, 2026
USD ($)
Holding
Shareholder Report |
6 Months Ended |
|---|---|
|
Mar. 31, 2026
USD ($)
Holding
| |
| Shareholder Report [Line Items] | |
| Document Type | N-CSRS |
| Amendment Flag | false |
| Registrant Name | CAUSEWAY CAPITAL MANAGEMENT TRUST |
| Entity Central Index Key | 0001156906 |
| Entity Investment Company Type | N-1A |
| Document Period End Date | Mar. 31, 2026 |
| C000031758 | |
| Shareholder Report [Line Items] | |
| Fund Name | Causeway International Value Fund |
| Class Name | Institutional Class |
| Trading Symbol | CIVIX |
| Annual or Semi-Annual Statement [Text Block] | Semi-Annual Shareholder Report |
| Shareholder Report Annual or Semi-Annual | semi-annual shareholder report |
| Additional Information [Text Block] | This semi-annual shareholder report contains important information about Institutional Class of the Causeway International Value Fund (the "Fund") for the period from October 1, 2025 to March 31, 2026. You can find additional information about the Fund at https://www.causewaycap.com/documents/#documents-international-value-fund. You can also request this information by contacting us at 1-866-947-7000. |
| Additional Information Phone Number | 1-866-947-7000 |
| Additional Information Website | https://www.causewaycap.com/documents/#documents-international-value-fund |
| Expenses [Text Block] | |
| Expenses Paid, Amount | $ 43 |
| Expense Ratio, Percent | 0.85% |
| AssetsNet | $ 17,296,181,000 |
| Holdings Count | Holding | 73 |
| Advisory Fees Paid, Amount | $ 70,035 |
| InvestmentCompanyPortfolioTurnover | 29.00% |
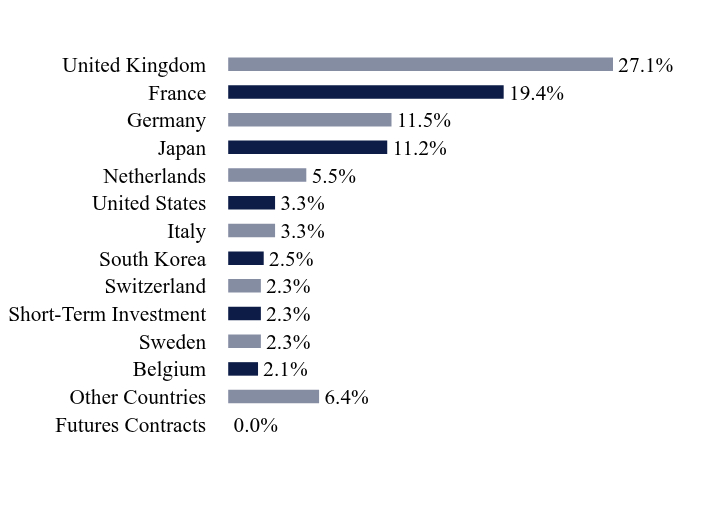
| Holdings [Text Block] | |
| Updated Prospectus Phone Number | 1-866-947-7000 |
| Updated Prospectus Web Address | https://www.causewaycap.com/documents/#documents-international-value-fund |
| C000031757 | |
| Shareholder Report [Line Items] | |
| Fund Name | Causeway International Value Fund |
| Class Name | Investor Class |
| Trading Symbol | CIVVX |
| Annual or Semi-Annual Statement [Text Block] | Semi-Annual Shareholder Report |
| Shareholder Report Annual or Semi-Annual | semi-annual shareholder report |
| Additional Information [Text Block] | This semi-annual shareholder report contains important information about Investor Class of the Causeway International Value Fund (the "Fund") for the period from October 1, 2025 to March 31, 2026. You can find additional information about the Fund at https://www.causewaycap.com/documents/#documents-international-value-fund. You can also request this information by contacting us at 1-866-947-7000. |
| Additional Information Phone Number | 1-866-947-7000 |
| Additional Information Website | https://www.causewaycap.com/documents/#documents-international-value-fund |
| Expenses [Text Block] | |
| Expenses Paid, Amount | $ 56 |
| Expense Ratio, Percent | 1.10% |
| AssetsNet | $ 17,296,181,000 |
| Holdings Count | Holding | 73 |
| Advisory Fees Paid, Amount | $ 70,035 |
| InvestmentCompanyPortfolioTurnover | 29.00% |
| Holdings [Text Block] | |
| Updated Prospectus Phone Number | 1-866-947-7000 |
| Updated Prospectus Web Address | https://www.causewaycap.com/documents/#documents-international-value-fund |