Pay vs Performance Disclosure - USD ($)
Mar. 31, 2026
Mar. 31, 2025
Mar. 31, 2024
Mar. 31, 2023
Mar. 31, 2022
Pay-Versus-Performance (PVP)
The SEC has adopted a rule requiring annual disclosure of pay-versus-performance which shows the relationship between executive compensation actually paid and the Company’s performance. The following pay versus performance disclosure is based on upon permitted methodology, pursuant to the SEC guidance under Item 402(v) of Regulation S-K.
| Value of Initial Fixed $100 Investment Based On: | |||||||||||||||||||||||||||||||||||||||||||||||
| Fiscal Year | Summary Compensation Table Total for PEO | Compensation Actually Paid to PEO 1,3 | Average Summary Compensation Table Total for Non-PEO NEOs | Average Compensation Actually Paid to Non-PEO NEOs 3 | Total Shareholder Return | Peer Total Shareholder Return 2 | Net Income ($mm) | Adjusted EBITDA ($mm) | |||||||||||||||||||||||||||||||||||||||
| 2026 | $9,780,935 | $12,878,345 | $2,365,378 | $2,939,443 | $136 | $209 | $429 | $963 | |||||||||||||||||||||||||||||||||||||||
| 2025 | $7,398,322 | $(4,844,893) | $1,945,932 | $(313,725) | $107 | $146 | $453 | $889 | |||||||||||||||||||||||||||||||||||||||
| 2024 | $8,315,222 | $29,365,753 | $2,264,976 | $6,151,222 | $169 | $157 | $513 | $923 | |||||||||||||||||||||||||||||||||||||||
| 2023 | $6,976,773 | $(539,260) | $1,820,679 | $84,472 | $82 | $109 | $511 | $904 | |||||||||||||||||||||||||||||||||||||||
| 2022 | $6,388,700 | $16,344,430 | $1,709,479 | $3,865,384 | $115 | $101 | $275 | $676 | |||||||||||||||||||||||||||||||||||||||
(1) Principal executive officer (PEO) is D. Scott Barbour, who began serving as our president and chief executive officer in September 2017.
(2) Peer Total Shareholder Return reflects S&P 400 Capital Goods index.
(3) To calculate Compensation Actually Paid (CAP) for the PEO, the following adjustments were made to SCT total compensation, calculated in accordance with the SEC methodology for determining CAP for each year shown below:
Following non-PEO named executive officers are included in the average figures shown:
2022: Scott Cottrill, Roy Moore, Darin Harvey, Kevin Talley
2023: Scott Cottrill, Roy Moore, Darin Harvey, Kevin Talley
2024: Scott Cottrill, Darin Harvey, Michael Huebert, Kevin Talley
2025: Scott Cottrill, Darin Harvey, Kevin Talley, Craig Taylor
2026: Scott Cottrill, Kevin Talley, Craig Taylor, Thomas Waun
(3) To calculate Compensation Actually Paid (CAP) for the PEO, the following adjustments were made to SCT total compensation, calculated in accordance with the SEC methodology for determining CAP for each year shown below:
| Fiscal Year 2026 | Fiscal Year 2025 | Fiscal Year 2024 | Fiscal Year 2023 | Fiscal Year 2022 | ||||||||||||||||||||||||||||||||||||||||||||||||||||||||||
| Adjustments | PEO | Average Non-PEO NEOs | PEO | Average Non-PEO NEOs | PEO | Average Non-PEO NEOs | PEO | Average Non-PEO NEOs | PEO | Average Non-PEO NEOs | ||||||||||||||||||||||||||||||||||||||||||||||||||||
| Amounts reported the "Stock Awards" and "Option Awards" in Summary Compensation Table for applicable fiscal year | $(6,453,368) | $(1,190,726) | $(5,396,526) | $(1,064,251) | $(4,946,342) | $(997,831) | $(4,200,837) | $(805,648) | $(3,789,942) | $(607,681) | ||||||||||||||||||||||||||||||||||||||||||||||||||||
| Year End Fair Value of Current Year Unvested Equity Awards | $6,434,890 | $1,187,323 | $1,419,825 | $293,718 | $13,620,257 | $2,747,581 | $3,511,133 | $673,375 | $4,297,095 | $688,997 | ||||||||||||||||||||||||||||||||||||||||||||||||||||
| Year over Year Change in Fair Value of Outstanding and Unvested Equity Awards | $2,474,808 | $480,831 | $(8,514,040) | $(1,522,727) | $10,890,080 | $1,830,979 | $(4,401,548) | $(756,891) | $7,874,554 | $1,837,437 | ||||||||||||||||||||||||||||||||||||||||||||||||||||
| Year over Year Change in Fair Value of Equity Awards Granted in Prior Year that Vested in the Year | $587,298 | $88,605 | $154,079 | $21,005 | $1,392,683 | $290,990 | $(2,977,146) | $(945,850) | $910,792 | $158,396 | ||||||||||||||||||||||||||||||||||||||||||||||||||||
| Average Value of Dividends or other Earnings Paid on Stock or Option Awards not Otherwise Reflected in Fair Value or Total Compensation | $53,783 | $8,031 | $93,447 | $12,599 | $93,853 | $14,527 | $552,364 | $98,807 | $663,232 | $78,755 | ||||||||||||||||||||||||||||||||||||||||||||||||||||
| Total Adjustments | $3,097,411 | $574,064 | $(12,243,215) | $(2,259,656) | $21,050,531 | $3,886,246 | $(7,516,034) | $(1,736,207) | $9,955,731 | $2,155,904 | ||||||||||||||||||||||||||||||||||||||||||||||||||||
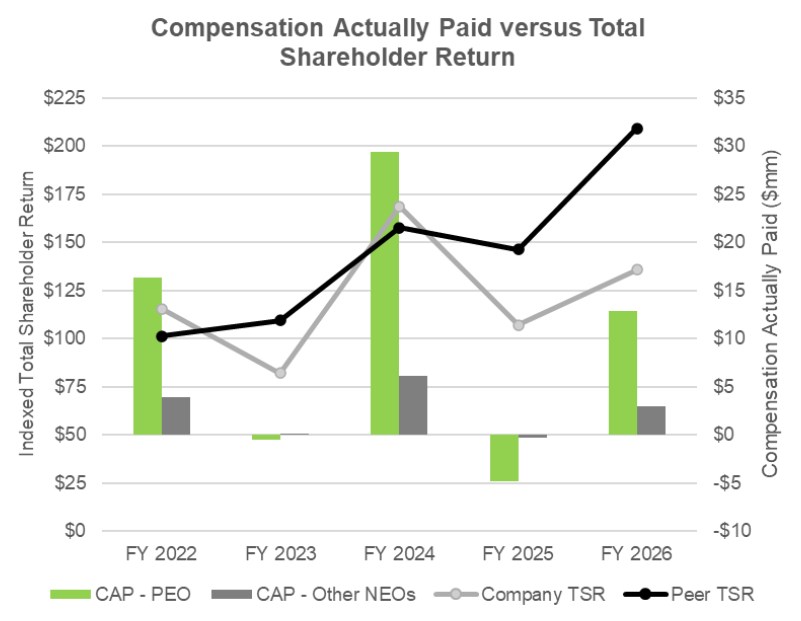
Relationship between CAP and TSR
The charts below reflect the relationship between the PEO and Average Non-PEO NEOs CAP (per the SEC’s definition), ADS TSR and the Peer Group—the S&P 400 Capital Goods Index
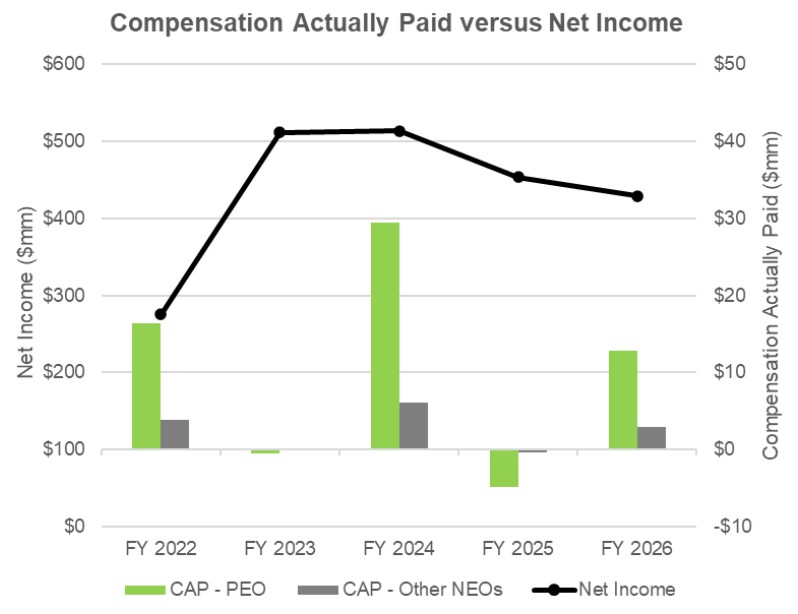
Relationship between CAP and Net Income (GAAP)
The charts below reflect the relationship between the PEO, Average Non-PEO NEOs CAP and ADS GAAP net income.
Required Tabular Disclosure of Most Important Measures to Determine Fiscal Year 2026 CAP
Listed below are the most important measures used to determine compensation actually paid in fiscal year 2026.
| Performance Measure | ||
| Adjusted EBITDA | ||
| Net Sales | ||
| Return on Invested Capital (ROIC) | ||
| Cash from Operations (CFO) | ||