Shareholder Report
Mar. 31, 2026
USD ($)
$ / shares
WHAT WERE THE FUND COSTS FOR THE LAST YEAR? (based on a hypothetical $10,000 investment)
|
Fund Name
|
Costs of a $10,000 investment
|
Costs paid as a percentage of a $10,000 investment*
|
|
Franklin Emerging Market Core Dividend Tilt Index ETF
|
$22
|
0.19%
|
HOW DID THE FUND PERFORM LAST YEAR AND WHAT AFFECTED ITS PERFORMANCE?
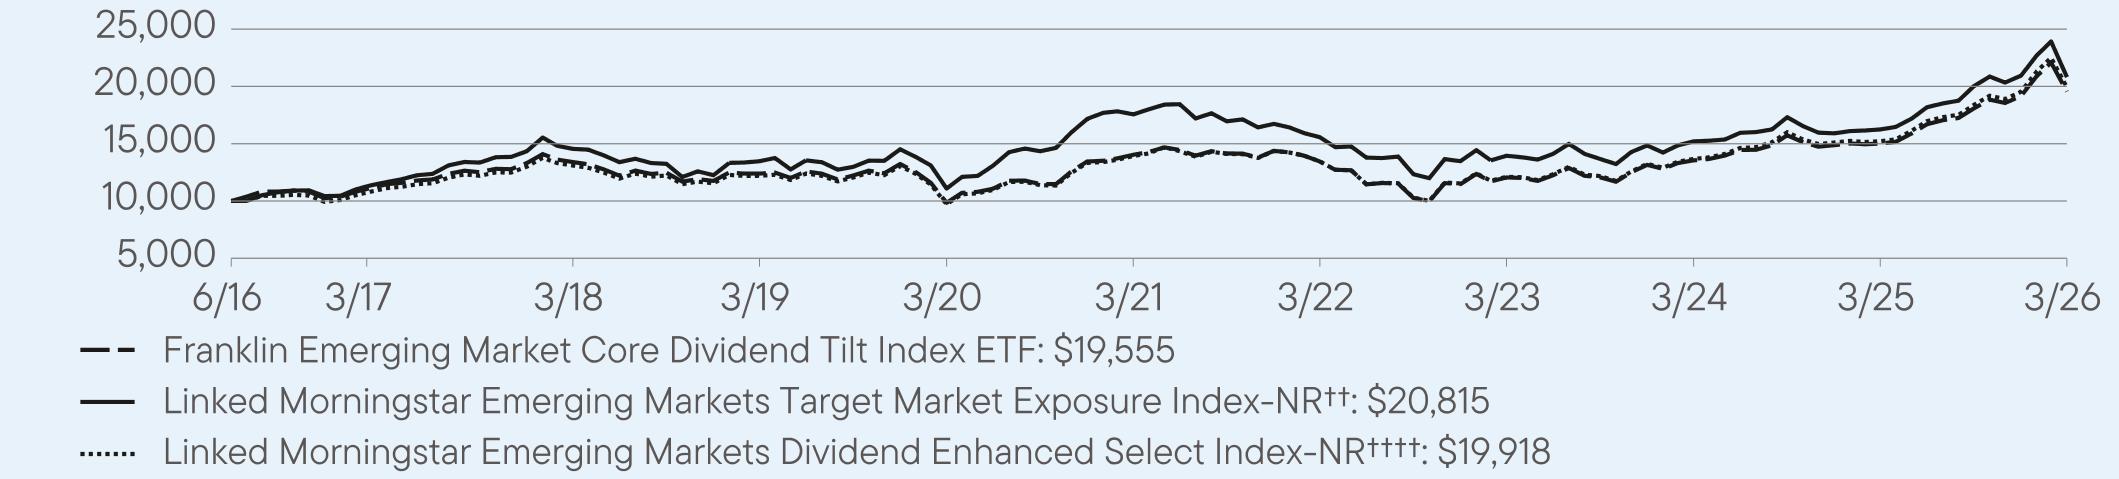
For the twelve months ended March 31, 2026, Franklin Emerging Market Core Dividend Tilt Index ETF returned 30.30%. The Fund compares its performance to the Morningstar Emerging Markets Target Market Exposure Index-NR (the Parent Index)†, the Linked Morningstar Emerging Markets Target Market Exposure Index-NR††, the Morningstar Emerging Markets Dividend Enhanced Select Index-NR (the Underlying Index)††† and the Linked Morningstar Emerging Markets Dividend Enhanced Select Index-NR††††, which returned 28.11%, 28.11%, 30.84% and 30.84%, respectively, for the same period.
PERFORMANCE HIGHLIGHTS
|
Top contributors to performance:
|
|
|
↑
|
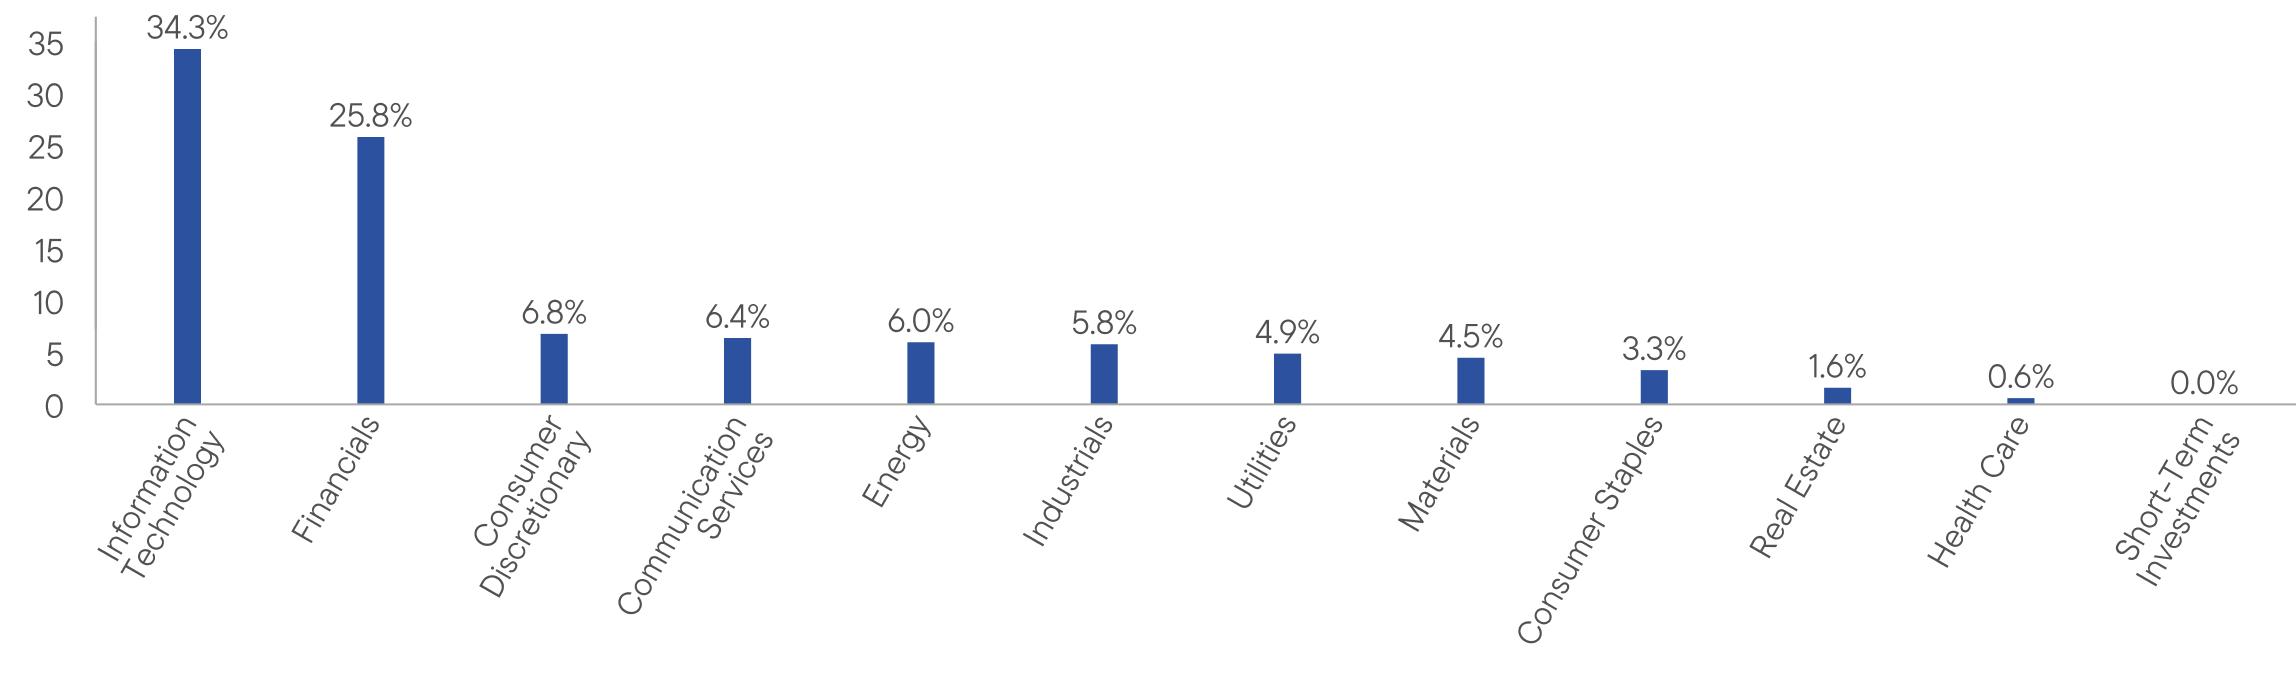
The sectors that contributed most to absolute performance include information technology, financials and energy.
|
|
↑
|
The individual holdings that contributed most to absolute performance include Taiwan Semiconductor Manufacturing, Samsung Electronics and Hyundai Motor Company.
|
|
Top detractors from performance:
|
|
|
↓
|
There were no sectors which materially detracted from absolute performance.
|
|
↓
|
The individual holdings that detracted most from absolute performance include Info Sys, Meituan and Tata Consultancy Services.
|
AVERAGE ANNUAL TOTAL RETURNS (%) Period Ended March 31, 2026
|
|
1 Year
|
5 Year
|
Since Inception
(6/1/2016) |
|
Franklin Emerging Market Core Dividend Tilt Index ETF (NAV)
|
30.30
|
6.86
|
7.06
|
|
Morningstar Emerging Markets Target Market Exposure Index-NR†
|
28.11
|
3.95
|
--
|
|
Linked Morningstar Emerging Markets Target Market Exposure Index-NR††
|
28.11
|
3.46
|
8.18
|
|
Morningstar Emerging Markets Dividend Enhanced Select Index-NR†††
|
30.84
|
--
|
--
|
|
Linked Morningstar Emerging Markets Dividend Enhanced Select Index-NR††††
|
30.84
|
7.42
|
7.65
|
For current month-end performance, please call Franklin Templeton at (800) DIAL BEN/342-5236 or visit
https://www.franklintempleton.com/investments/options/exchange-traded-funds.
https://www.franklintempleton.com/investments/options/exchange-traded-funds.
Important data provider notices and terms available at www.franklintempletondatasources.com.
KEY FUND STATISTICS (as of March 31, 2026)
|
Total Net Assets
|
$44,347,198
|
|
Total Number of Portfolio Holdings (excludes derivatives, except purchased options, if any)
|
570
|
|
Total Management Fee Paid (based on a unitary fee)
|
$48,358
|
|
Portfolio Turnover Rate
|
61%
|
WHAT DID THE FUND INVEST IN? (as of March 31, 2026)
Portfolio Composition*,† (% of Total Investments)
This report describes changes to the Fund that occurred during the reporting period.
WHAT WERE THE FUND COSTS FOR THE LAST YEAR? (based on a hypothetical $10,000 investment)
|
Fund Name
|
Costs of a $10,000 investment
|
Costs paid as a percentage of a $10,000 investment*
|
|
Franklin International Core Dividend Tilt Index ETF
|
$10
|
0.09%
|
HOW DID THE FUND PERFORM LAST YEAR AND WHAT AFFECTED ITS PERFORMANCE?
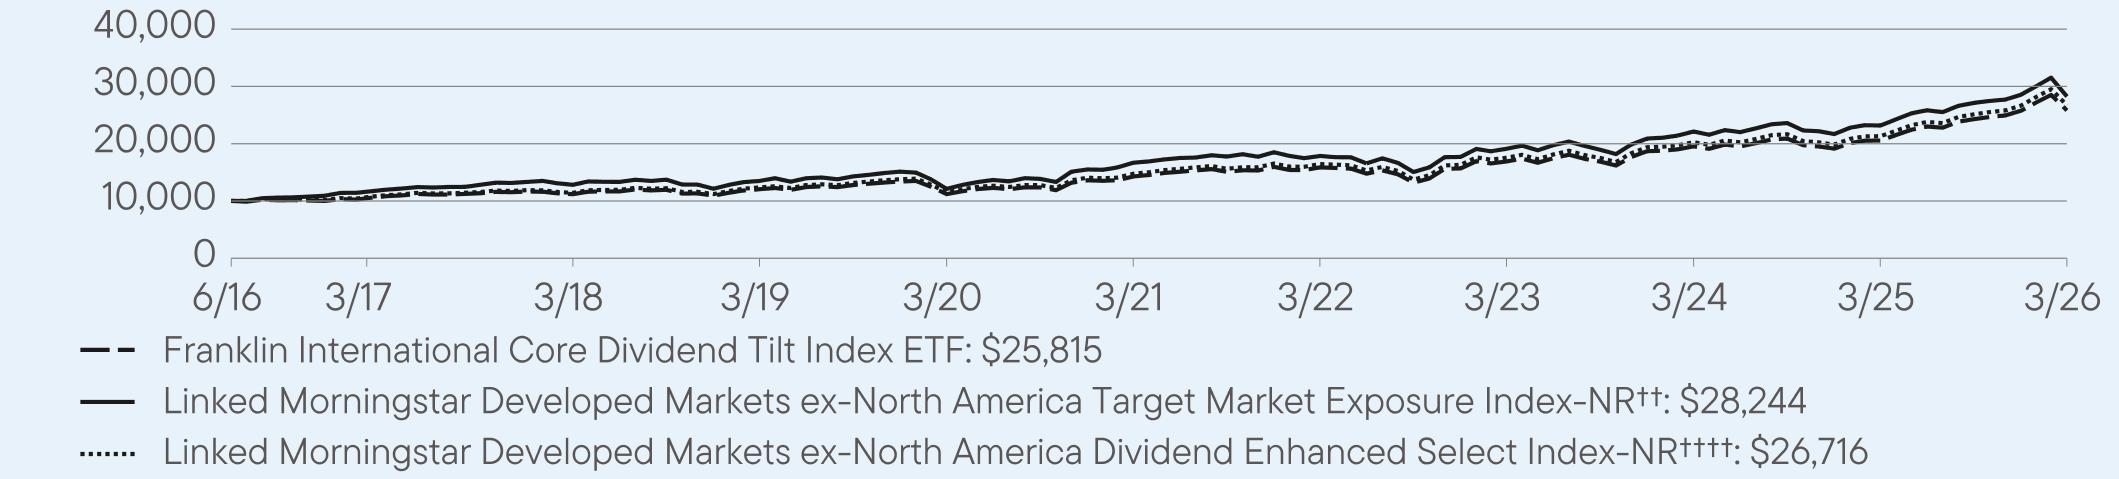
For the twelve months ended March 31, 2026, Franklin International Core Dividend Tilt Index ETF returned 25.59%. The Fund compares its performance to the Morningstar Developed Markets ex-North America Target Market Exposure Index-NR (the Parent Index)†, the Linked Morningstar Developed Markets ex-North America Target Market Exposure Index-NR††, the Morningstar Developed Markets ex-North America Dividend Enhanced Select Index-NR (the Underlying Index)††† and the Linked Morningstar Developed Markets ex-North America Dividend Enhanced Select Index-NR††††, which returned 21.86%, 21.86%, 25.41% and 25.41%, respectively, for the same period.
PERFORMANCE HIGHLIGHTS
|
Top contributors to performance:
|
|
|
↑
|
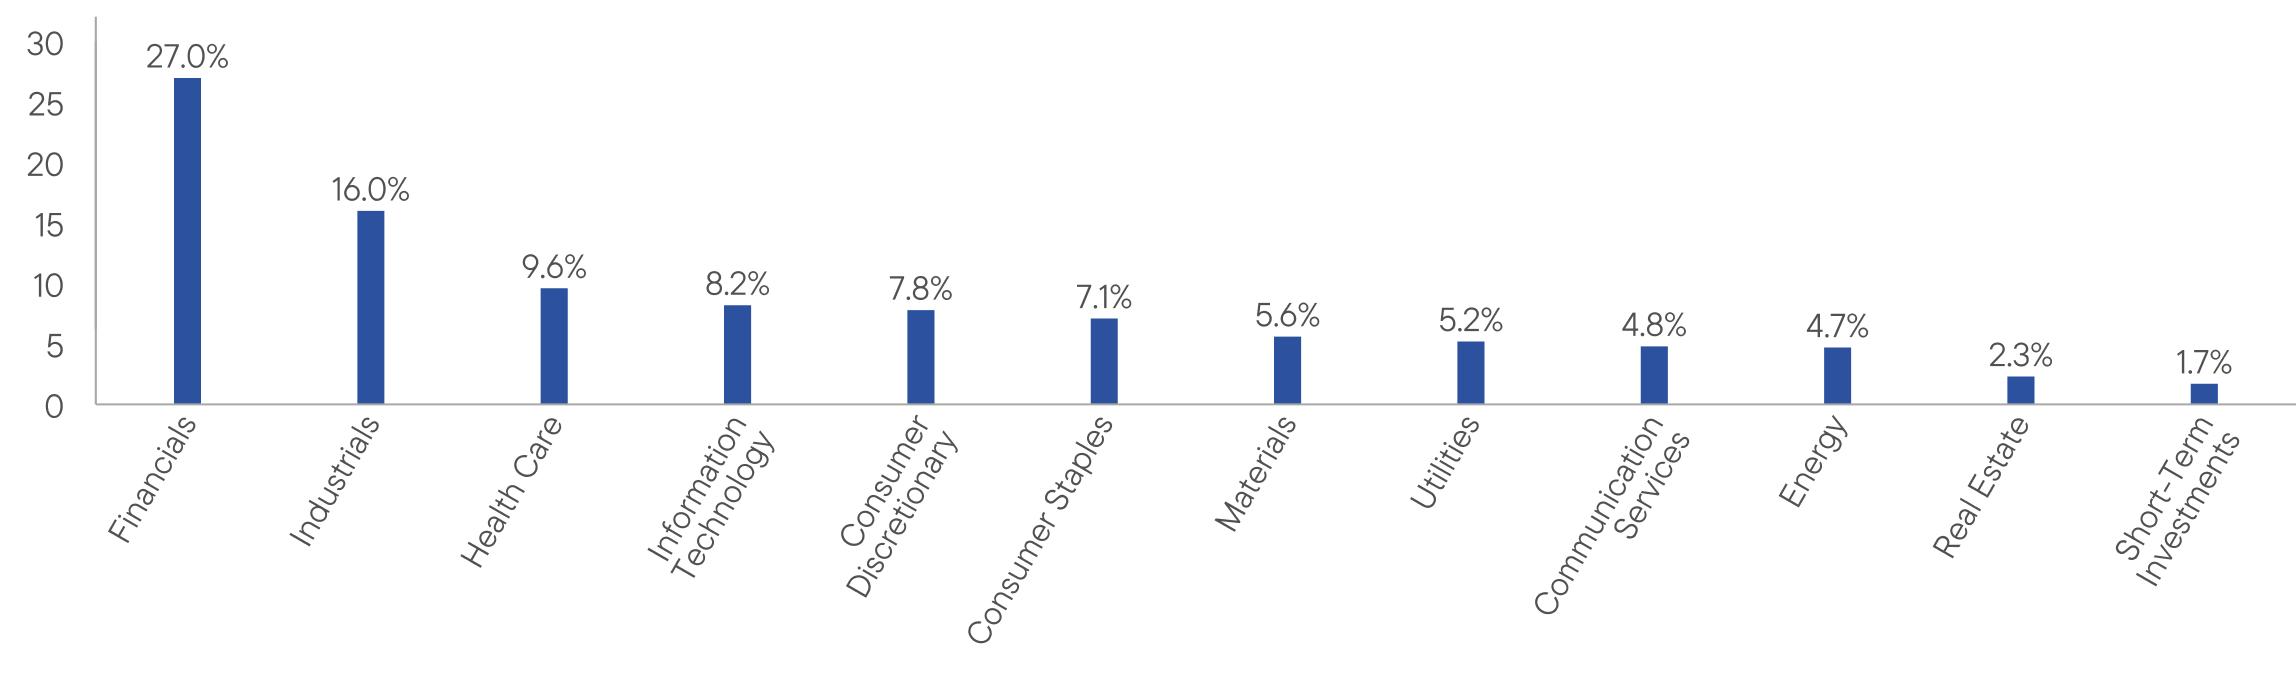
The sectors that contributed most to absolute performance were financials, industrials and information technology.
|
|
↑
|
Individual holdings that contributed to absolute returns included ASML Holding NV, HSBC Holdings Plc and Advantest Corp.
|
|
Top detractors from performance:
|
|
|
↓
|
There were no sectors that detracted from absolute performance over the period.
|
|
↓
|
The individual holdings that detracted from absolute returns included Novo Nordisk A/S, SAP SE and Diageo Plc.
|
AVERAGE ANNUAL TOTAL RETURNS (%) Period Ended March 31, 2026
|
|
1 Year
|
5 Year
|
Since Inception
(6/1/2016) |
|
Franklin International Core Dividend Tilt Index ETF (NAV)
|
25.59
|
12.58
|
10.13
|
|
Morningstar Developed Markets ex-North America Target Market Exposure Index-NR†
|
21.86
|
7.99
|
--
|
|
Linked Morningstar Developed Markets ex-North America Target Market Exposure Index-NR††
|
21.86
|
11.11
|
10.79
|
|
Morningstar Developed Markets ex-North America Dividend Enhanced Select Index-NR†††
|
25.41
|
--
|
--
|
|
Linked Morningstar Developed Markets ex-North America Dividend Enhanced Select Index-NR††††
|
25.41
|
12.61
|
10.39
|
For current month-end performance, please call Franklin Templeton at (800) DIAL BEN/342-5236 or visit
https://www.franklintempleton.com/investments/options/exchange-traded-funds.
https://www.franklintempleton.com/investments/options/exchange-traded-funds.
Important data provider notices and terms available at www.franklintempletondatasources.com.
KEY FUND STATISTICS (as of March 31, 2026)
|
Total Net Assets
|
$2,256,949,401
|
|
Total Number of Portfolio Holdings (excludes derivatives, except purchased options, if any)
|
427
|
|
Total Management Fee Paid (based on a unitary fee)
|
$1,637,583
|
|
Portfolio Turnover Rate
|
27%
|
WHAT DID THE FUND INVEST IN? (as of March 31, 2026)
Portfolio Composition* (% of Total Investments)
HOW HAS THE FUND CHANGED?
On August 1, 2025, the Fund’s principal investment strategies were revised to reflect the Underlying Index’s (and therefore the Fund’s) increased exposure to the financial services sector.
Related disclosure regarding the risks of investing in the financial services sector was added as a principal risk of the Fund.
This is a summary of certain changes to the Fund since April 1, 2025. For more complete information, you may review the Fund’s current prospectus and the Fund’s next prospectus, which we expect to be available by August 1, 2026, at https://www.franklintempleton.com/regulatory-fund-documents or upon request at (800) DIAL BEN/342-5236 or ETFs-Product@franklintempleton.com.
This report describes changes to the Fund that occurred during the reporting period.
WHAT WERE THE FUND COSTS FOR THE LAST YEAR? (based on a hypothetical $10,000 investment)
|
Fund Name
|
Costs of a $10,000 investment
|
Costs paid as a percentage of a $10,000 investment*
|
|
Franklin International Dividend Booster Index ETF
|
$22
|
0.19%
|
HOW DID THE FUND PERFORM LAST YEAR AND WHAT AFFECTED ITS PERFORMANCE?
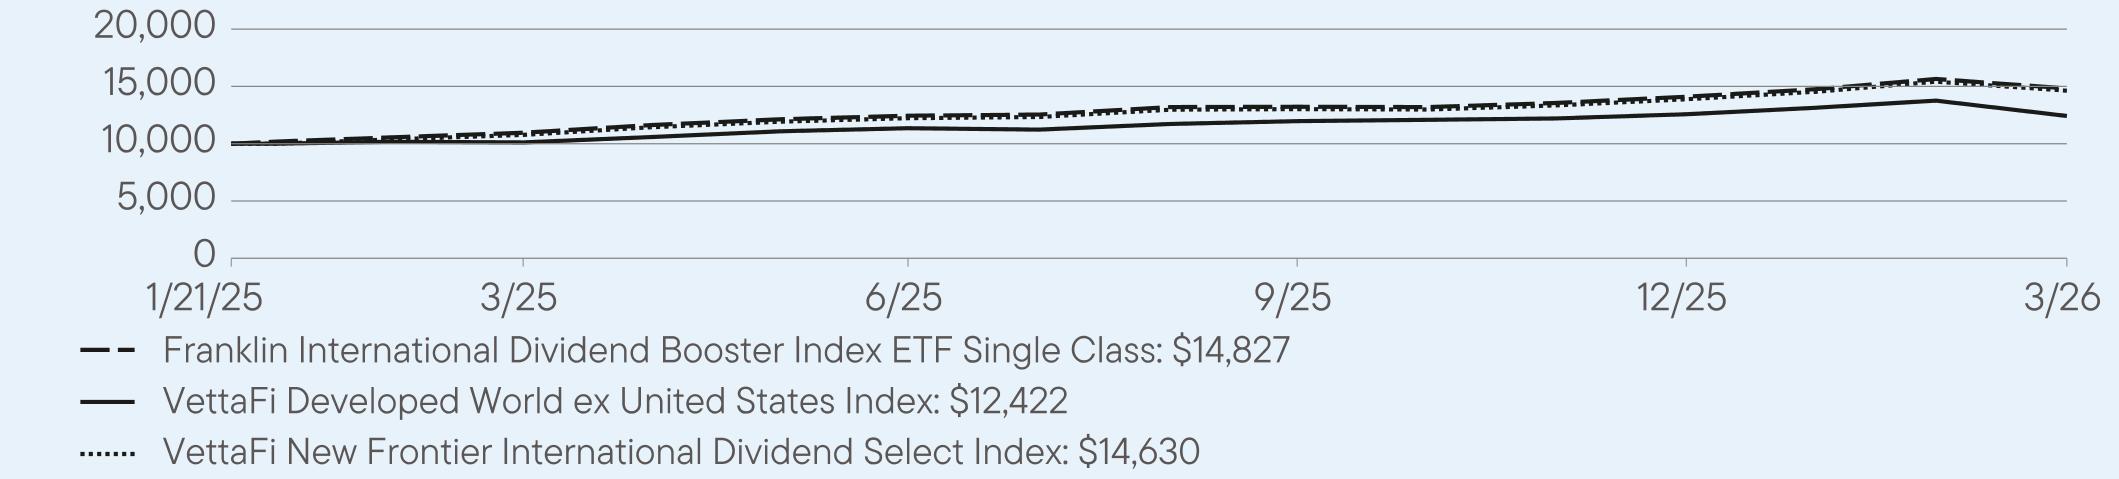
For the twelve months ended March 31, 2026, Franklin International Dividend Booster Index ETF returned 35.32%. The Fund compares its performance to VettaFi Developed World ex United States Index and the VettaFi New Frontier International Dividend Select Index, which returned 22.83% and 35.83%, respectively, for the same period.
PERFORMANCE HIGHLIGHTS
|
Top contributors to performance:
|
|
|
↑
|
The sectors that contributed most to absolute returns were financials, energy and utilities.
|
|
↑
|
Individual contributors that most contributed to absolute returns were Repsol SA, SITC International Holdings and ENGIE.
|
|
Top detractors from performance:
|
|
|
↓
|
The only sector that detracted from absolute performance over the period was communication services.
|
|
↓
|
Individual contributors that most detracted from absolute returns were Renault SA, MGM China Holdings Limited and WPP Plc.
|
AVERAGE ANNUAL TOTAL RETURNS (%) Period Ended March 31, 2026
|
|
1 Year
|
Since Inception
(1/21/2025) |
|
Franklin International Dividend Booster Index ETF (NAV)
|
35.32
|
39.27
|
|
VettaFi Developed World ex United States Index
|
22.83
|
22.13
|
|
VettaFi New Frontier International Dividend Select Index
|
35.83
|
39.77
|
For current month-end performance, please call Franklin Templeton at (800) DIAL BEN/342-5236 or visit
https://www.franklintempleton.com/investments/options/exchange-traded-funds.
https://www.franklintempleton.com/investments/options/exchange-traded-funds.
KEY FUND STATISTICS (as of March 31, 2026)
|
Total Net Assets
|
$60,745,500
|
|
Total Number of Portfolio Holdings
|
87
|
|
Total Management Fee Paid (based on a unitary fee)
|
$70,660
|
|
Portfolio Turnover Rate
|
66%
|
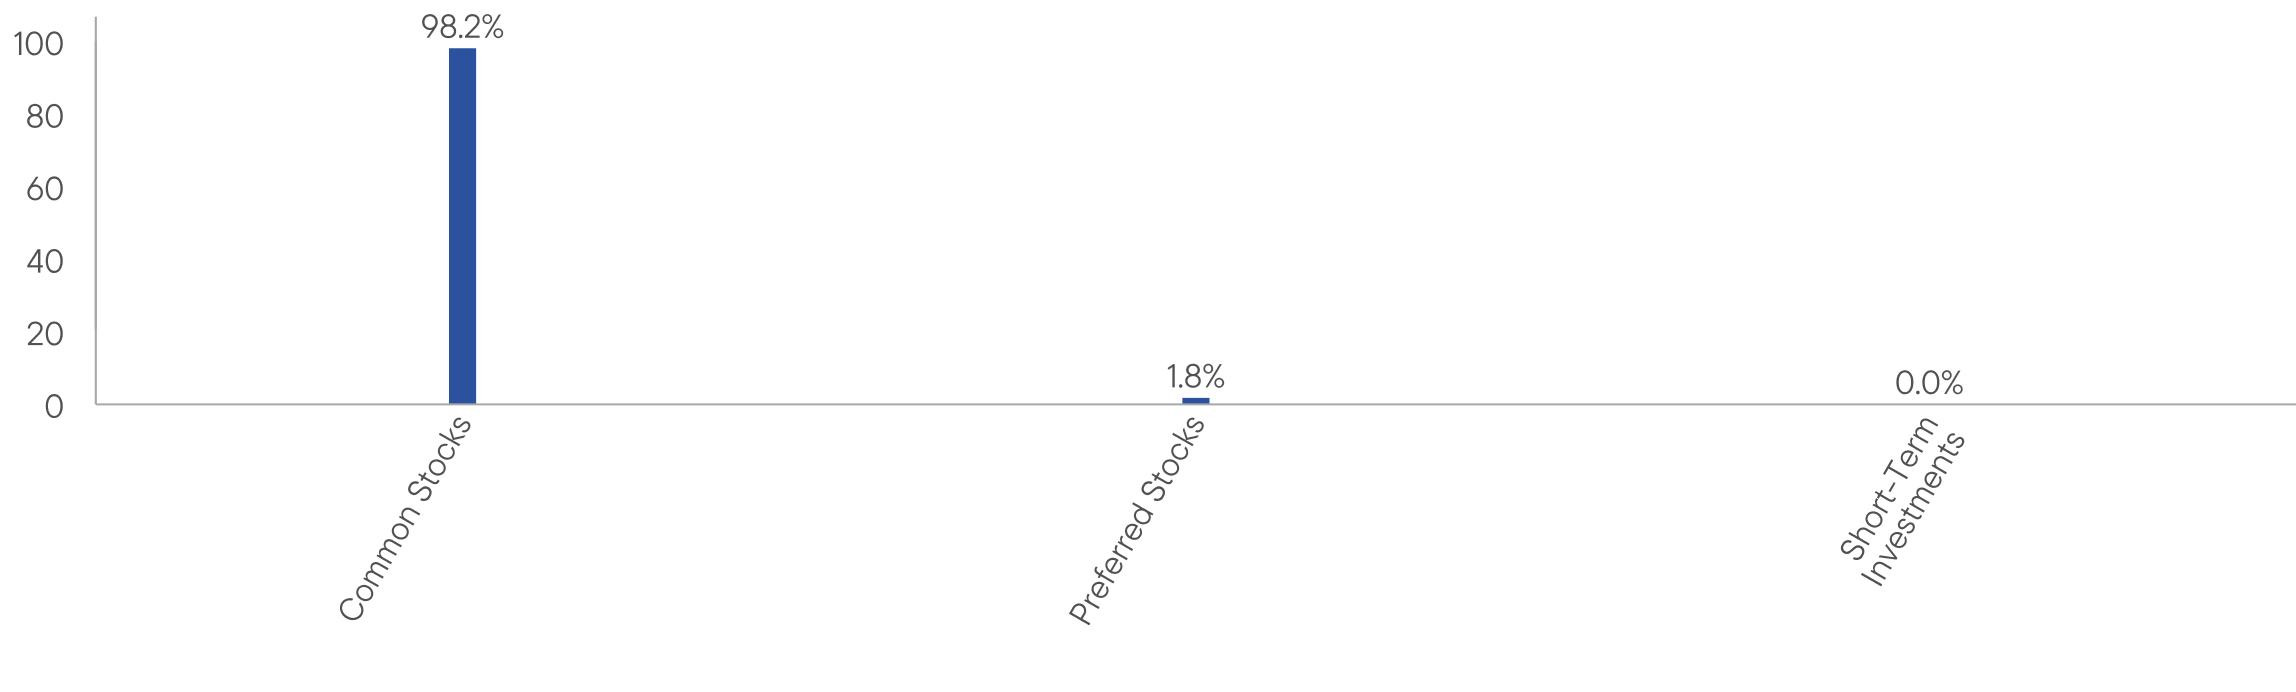
WHAT DID THE FUND INVEST IN? (as of March 31, 2026)
Portfolio Composition*,† (% of Total Investments)
HOW HAS THE FUND CHANGED?
Effective August 1, 2025, the Fund’s name was changed to Franklin International Dividend Booster Index ETF.
This is a summary of certain changes to the Fund since April 1, 2025. For more complete information, you may review the Fund’s current prospectus and any applicable supplements and the Fund’s next prospectus, which we expect to be available by August 1, 2026, at https://www.franklintempleton.com/regulatory-fund-documents or upon request at (800) DIAL BEN/342-5236 or
ETFs-Product@franklintempleton.com.
ETFs-Product@franklintempleton.com.
WHAT WERE THE FUND COSTS FOR THE LAST YEAR? (based on a hypothetical $10,000 investment)
|
Fund Name
|
Costs of a $10,000 investment
|
Costs paid as a percentage of a $10,000 investment*
|
|
Franklin U.S. Core Dividend Tilt Index ETF
|
$7
|
0.06%
|
HOW DID THE FUND PERFORM LAST YEAR AND WHAT AFFECTED ITS PERFORMANCE?
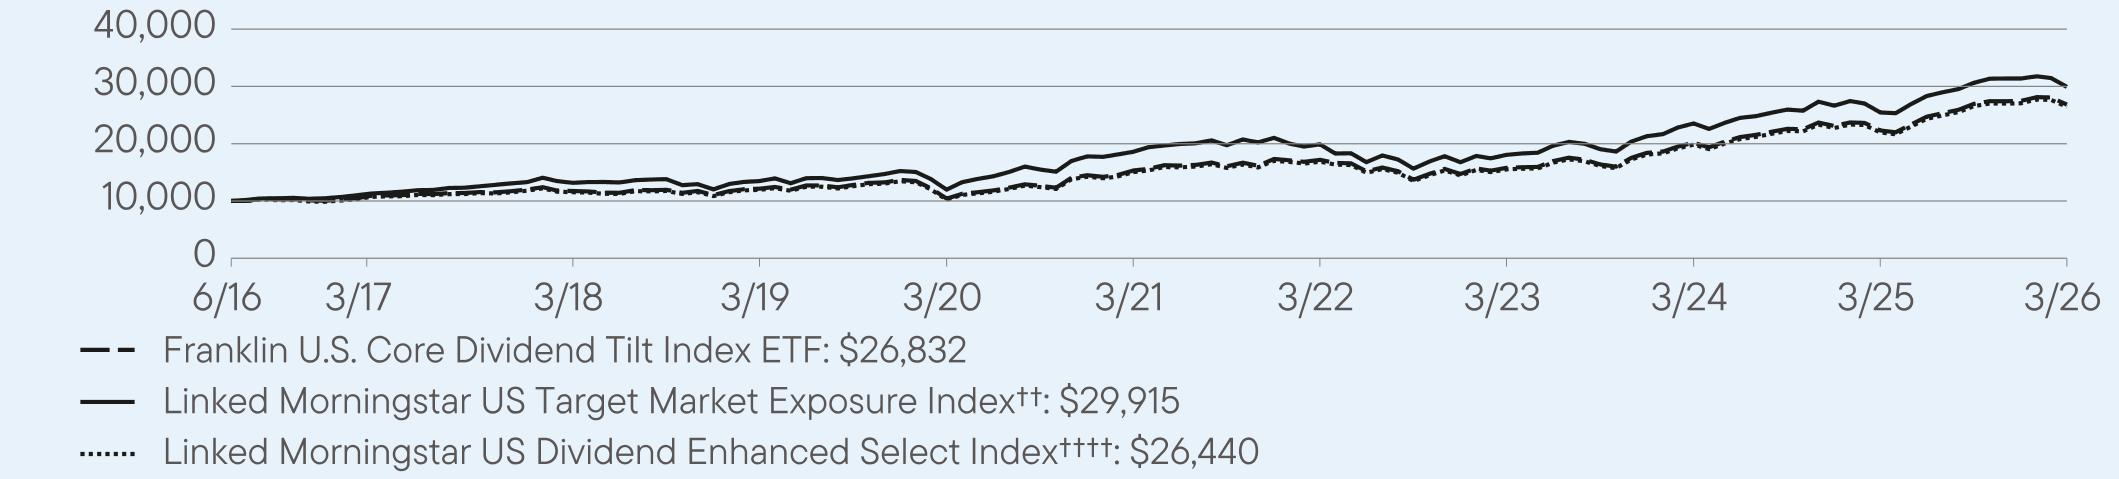
For the twelve months ended March 31, 2026, Franklin U.S. Core Dividend Tilt Index ETF returned 20.25%. The Fund compares its performance to the Morningstar US Target Market Exposure Index (the Parent Index)†, the Linked Morningstar US Target Market Exposure Index††, the Morningstar US Dividend Enhanced Select Index (the Underlying Index)††† and the Linked Morningstar US Dividend Enhanced Select Index††††, which returned 17.53%, 17.53%, 20.37% and 20.37%, respectively, for the same period.
PERFORMANCE HIGHLIGHTS
|
Top contributors to performance:
|
|
|
↑
|
The sectors that contributed most to absolute performance included information technology, communication services and financials.
|
|
↑
|
The individual holdings that contributed most to absolute performance included NVIDIA, Broadcom and Google.
|
|
Top detractors from performance:
|
|
|
↓
|
There were no sectors that detracted from absolute performance.
|
|
↓
|
The individual holdings that detracted most from absolute performance were UnitedHealth Group, Accenture and Proctor & Gamble.
|
AVERAGE ANNUAL TOTAL RETURNS (%) Period Ended March 31, 2026
|
|
1 Year
|
5 Year
|
Since Inception
(6/1/2016) |
|
Franklin U.S. Core Dividend Tilt Index ETF (NAV)
|
20.25
|
11.86
|
10.56
|
|
Morningstar US Target Market Exposure Index†
|
17.53
|
11.54
|
--
|
|
Linked Morningstar US Target Market Exposure Index††
|
17.53
|
9.98
|
11.72
|
|
Morningstar US Dividend Enhanced Select Index†††
|
20.37
|
--
|
--
|
|
Linked Morningstar US Dividend Enhanced Select Index††††
|
20.37
|
11.94
|
10.59
|
For current month-end performance, please call Franklin Templeton at (800) DIAL BEN/342-5236 or visit
https://www.franklintempleton.com/investments/options/exchange-traded-funds.
https://www.franklintempleton.com/investments/options/exchange-traded-funds.
Important data provider notices and terms available at www.franklintempletondatasources.com.
KEY FUND STATISTICS (as of March 31, 2026)
|
Total Net Assets
|
$105,869,699
|
|
Total Number of Portfolio Holdings (excludes derivatives, except purchased options, if any)
|
289
|
|
Total Management Fee Paid (based on a unitary fee)
|
$50,196
|
|
Portfolio Turnover Rate
|
24%
|
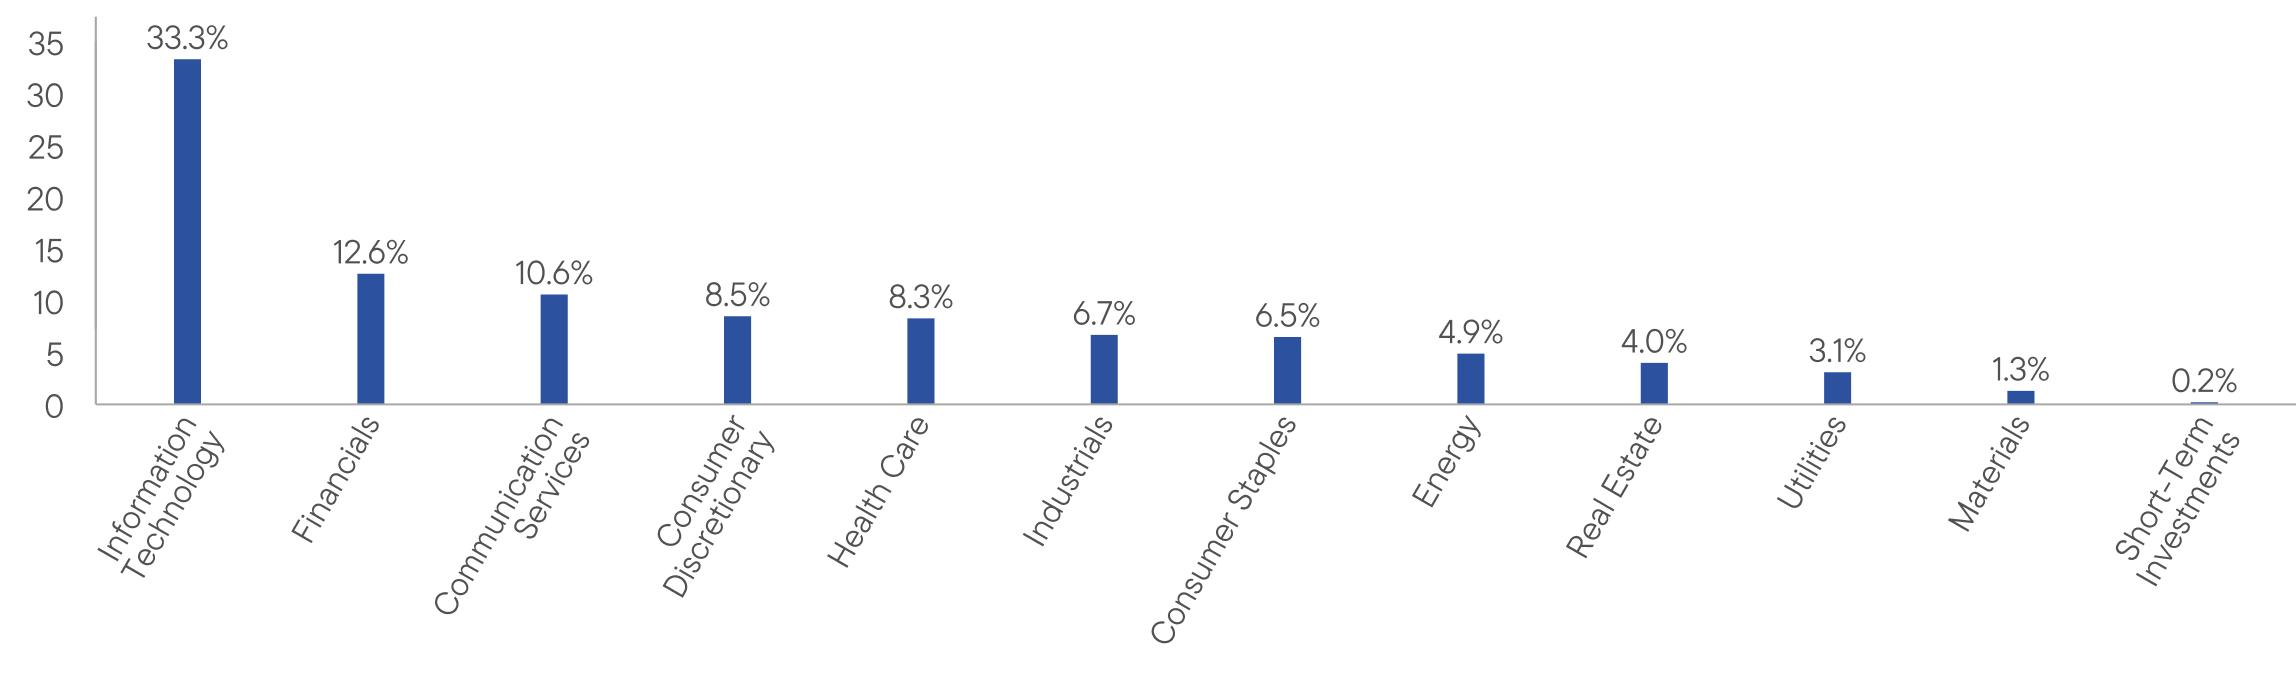
WHAT DID THE FUND INVEST IN? (as of March 31, 2026)
Portfolio Composition* (% of Total Investments)
This report describes changes to the Fund that occurred during the reporting period.
WHAT WERE THE FUND COSTS FOR THE LAST YEAR? (based on a hypothetical $10,000 investment)
|
Fund Name
|
Costs of a $10,000 investment
|
Costs paid as a percentage of a $10,000 investment*
|
|
Franklin U.S. Dividend Booster Index ETF
|
$10
|
0.09%
|
HOW DID THE FUND PERFORM LAST YEAR AND WHAT AFFECTED ITS PERFORMANCE?
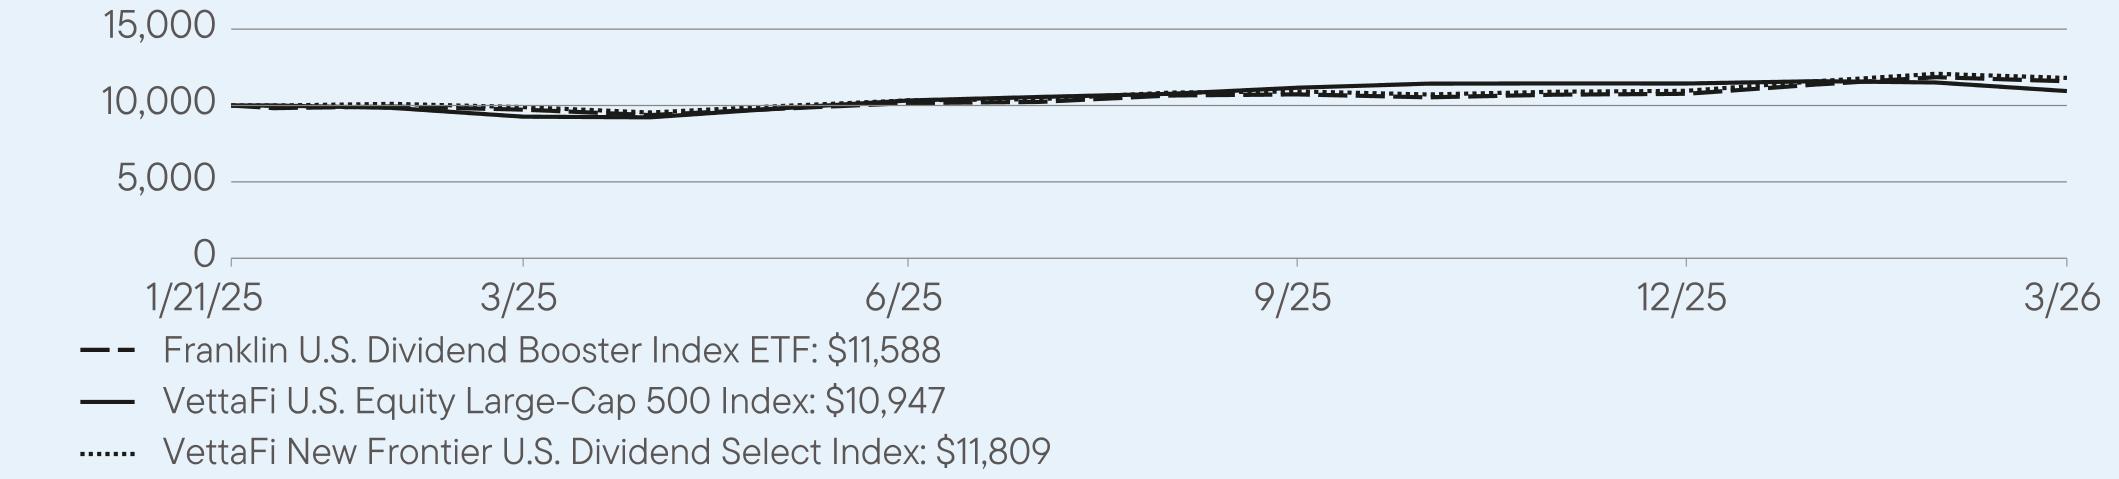
For the twelve months ended March 31, 2026, Franklin U.S. Dividend Booster Index ETF returned 19.12%. The Fund compares its performance to the VettaFi U.S. Equity Large-Cap 500 Index and the VettaFi New Frontier U.S. Dividend Select Index, which returned 18.09% and 19.32%, respectively, for the same period.
PERFORMANCE HIGHLIGHTS
|
Top contributors to performance:
|
|
|
↑
|
The sectors that contributed most to absolute performance were financials, information technology, and consumer discretionary.
|
|
↑
|
Individual holdings that contributed to absolute return included LyondellBasell Industries, Ford Motor Company, and Edison International.
|
|
Top detractors from performance:
|
|
|
↓
|
There were no sectors which materially detracted from absolute performance.
|
|
↓
|
Individual holdings that detracted from absolute return included Kraft Heinz Company, General Mills, and IonQ.
|
AVERAGE ANNUAL TOTAL RETURNS (%) Period Ended March 31, 2026
|
|
1 Year
|
Since Inception
(1/21/2025) |
|
Franklin U.S. Dividend Booster Index ETF (NAV)
|
19.12
|
13.20
|
|
VettaFi U.S. Equity Large-Cap 500 Index
|
18.09
|
7.87
|
|
VettaFi New Frontier U.S. Dividend Select Index
|
19.32
|
13.37
|
For current month-end performance, please call Franklin Templeton at (800) DIAL BEN/342-5236 or visit
https://www.franklintempleton.com/investments/options/exchange-traded-funds.
https://www.franklintempleton.com/investments/options/exchange-traded-funds.
Important data provider notices and terms available at www.franklintempletondatasources.com.
KEY FUND STATISTICS (as of March 31, 2026)
|
Total Net Assets
|
$59,319,472
|
|
Total Number of Portfolio Holdings (excludes derivatives, except purchased options, if any)
|
98
|
|
Total Management Fee Paid (based on a unitary fee)
|
$35,805
|
|
Portfolio Turnover Rate
|
65%
|
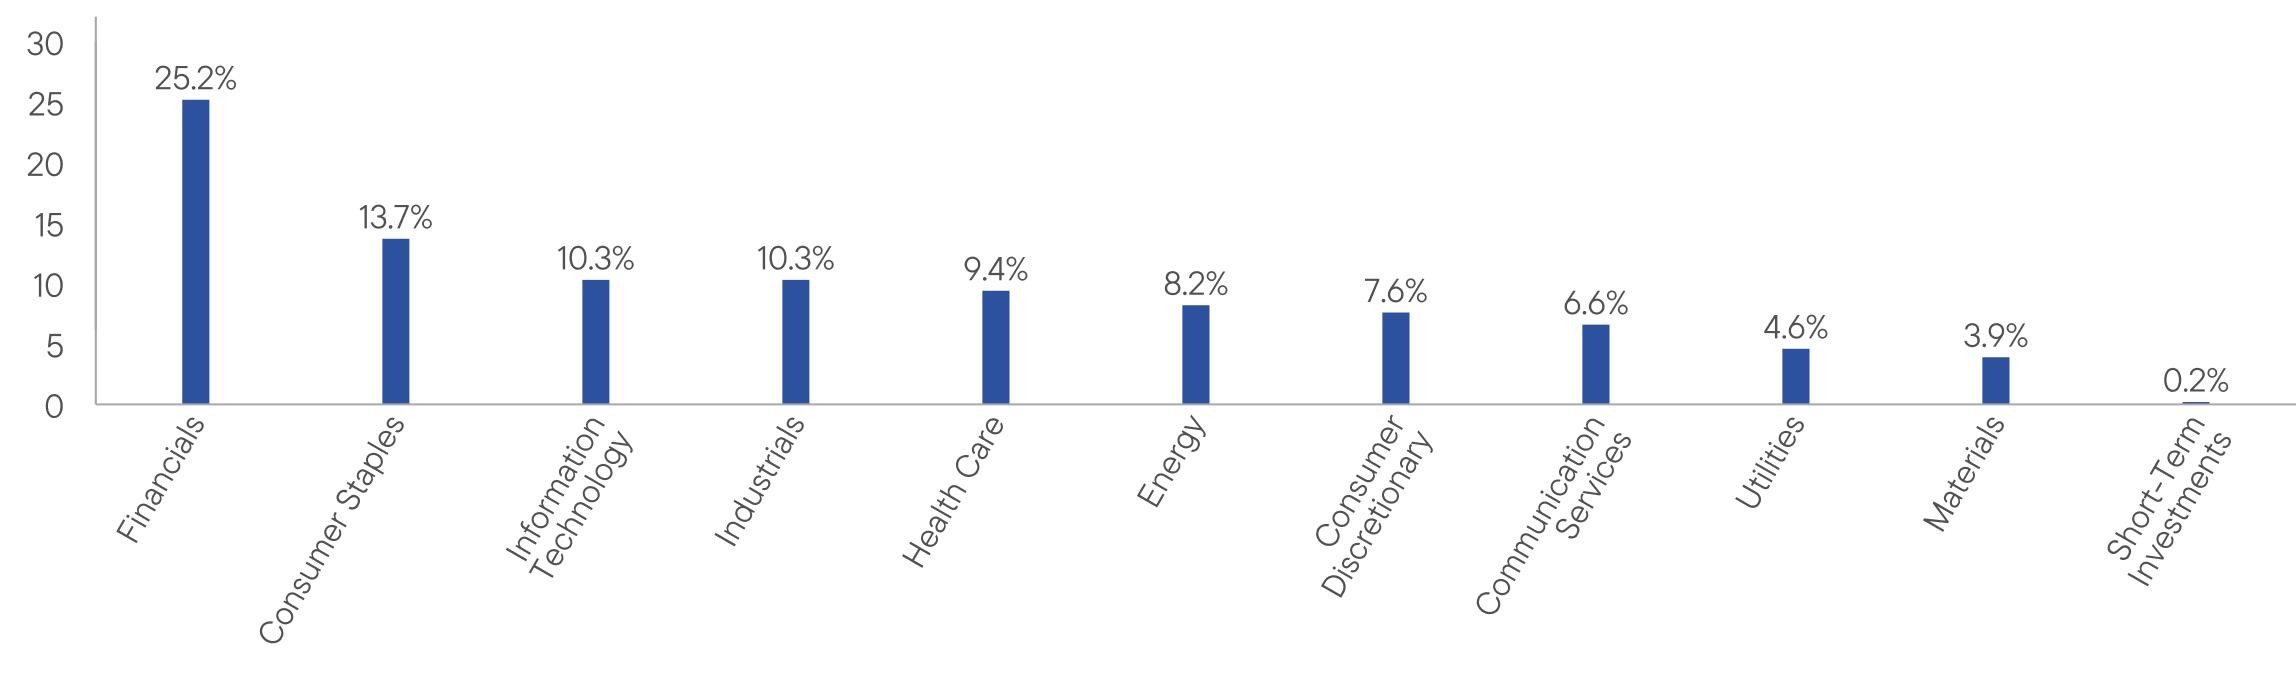
WHAT DID THE FUND INVEST IN? (as of March 31, 2026)
Portfolio Composition* (% of Total Investments)
HOW HAS THE FUND CHANGED?
Effective August 1, 2025, the Fund’s name was changed to Franklin U.S. Dividend Booster Index ETF.
On August 1, 2025, the Fund’s principal investment strategies were revised to reflect the Underlying Index’s (and therefore the Fund’s) decreased exposure to the financial services sector.
Related risk disclosure was removed from the Fund’s principal risks.
This is a summary of certain changes to the Fund since April 1, 2025. For more complete information, you may review the Fund’s current prospectus and any applicable supplements and the Fund’s next prospectus, which we expect to be available by August 1, 2026, at https://www.franklintempleton.com/regulatory-fund-documents or upon request at (800) DIAL BEN/342-5236 or
ETFs-Product@franklintempleton.com.
ETFs-Product@franklintempleton.com.
This report describes changes to the Fund that occurred during the reporting period.
WHAT WERE THE FUND COSTS FOR THE LAST YEAR? (based on a hypothetical $10,000 investment)
|
Fund Name
|
Costs of a $10,000 investment
|
Costs paid as a percentage of a $10,000 investment*
|
|
Franklin U.S. Large Cap Multifactor Index ETF
|
$17
|
0.15%
|
HOW DID THE FUND PERFORM LAST YEAR AND WHAT AFFECTED ITS PERFORMANCE?
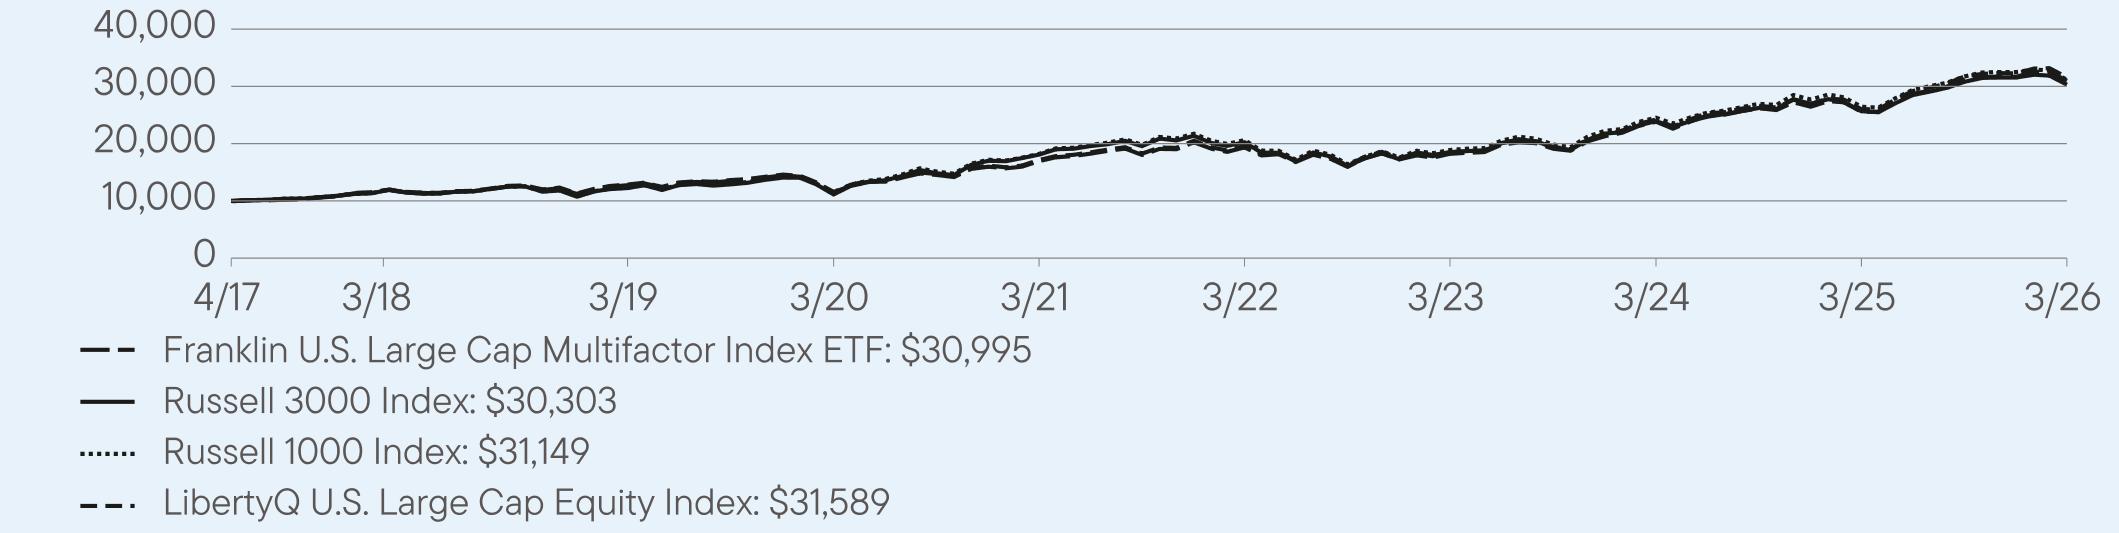
For the twelve months ended March 31, 2026, Franklin U.S. Large Cap Multifactor Index ETF returned 21.27%. The Fund compares its performance to the Russell 1000 Index and the LibertyQ U.S. Large Cap Equity Index, which returned 17.74% and 21.49%, respectively, for the same period.
PERFORMANCE HIGHLIGHTS
|
Top contributors to performance:
|
|
|
↑
|
The sectors that contributed most to absolute performance were information technology, communication services, and industrials.
|
|
↑
|
The Individual holdings that contributed most to absolute performane were NVIDIA, Broadcom, and Google.
|
|
Top detractors from performance:
|
|
|
↓
|
There were no sectors which materially detracted from absolute performance.
|
|
↓
|
The individual holdings that detracted most from absolute returns were Netflix, Visa, and Abbott Laboratories.
|
AVERAGE ANNUAL TOTAL RETURNS (%) Period Ended March 31, 2026
|
|
1 Year
|
5 Year
|
Since Inception
(4/26/2017) |
|
Franklin U.S. Large Cap Multifactor Index ETF (NAV)
|
21.27
|
12.83
|
13.51
|
|
Russell 3000 Index
|
18.09
|
10.87
|
13.19
|
|
Russell 1000 Index
|
17.74
|
11.34
|
13.55
|
|
LibertyQ U.S. Large Cap Equity Index
|
21.49
|
12.99
|
13.70
|
For current month-end performance, please call Franklin Templeton at (800) DIAL BEN/342-5236 or visit
https://www.franklintempleton.com/investments/options/exchange-traded-funds.
https://www.franklintempleton.com/investments/options/exchange-traded-funds.
Important data provider notices and terms available at www.franklintempletondatasources.com.
KEY FUND STATISTICS (as of March 31, 2026)
|
Total Net Assets
|
$1,732,200,718
|
|
Total Number of Portfolio Holdings (excludes derivatives, except purchased options, if any)
|
212
|
|
Total Management Fee Paid (based on a unitary fee)
|
$2,394,760
|
|
Portfolio Turnover Rate
|
52%
|
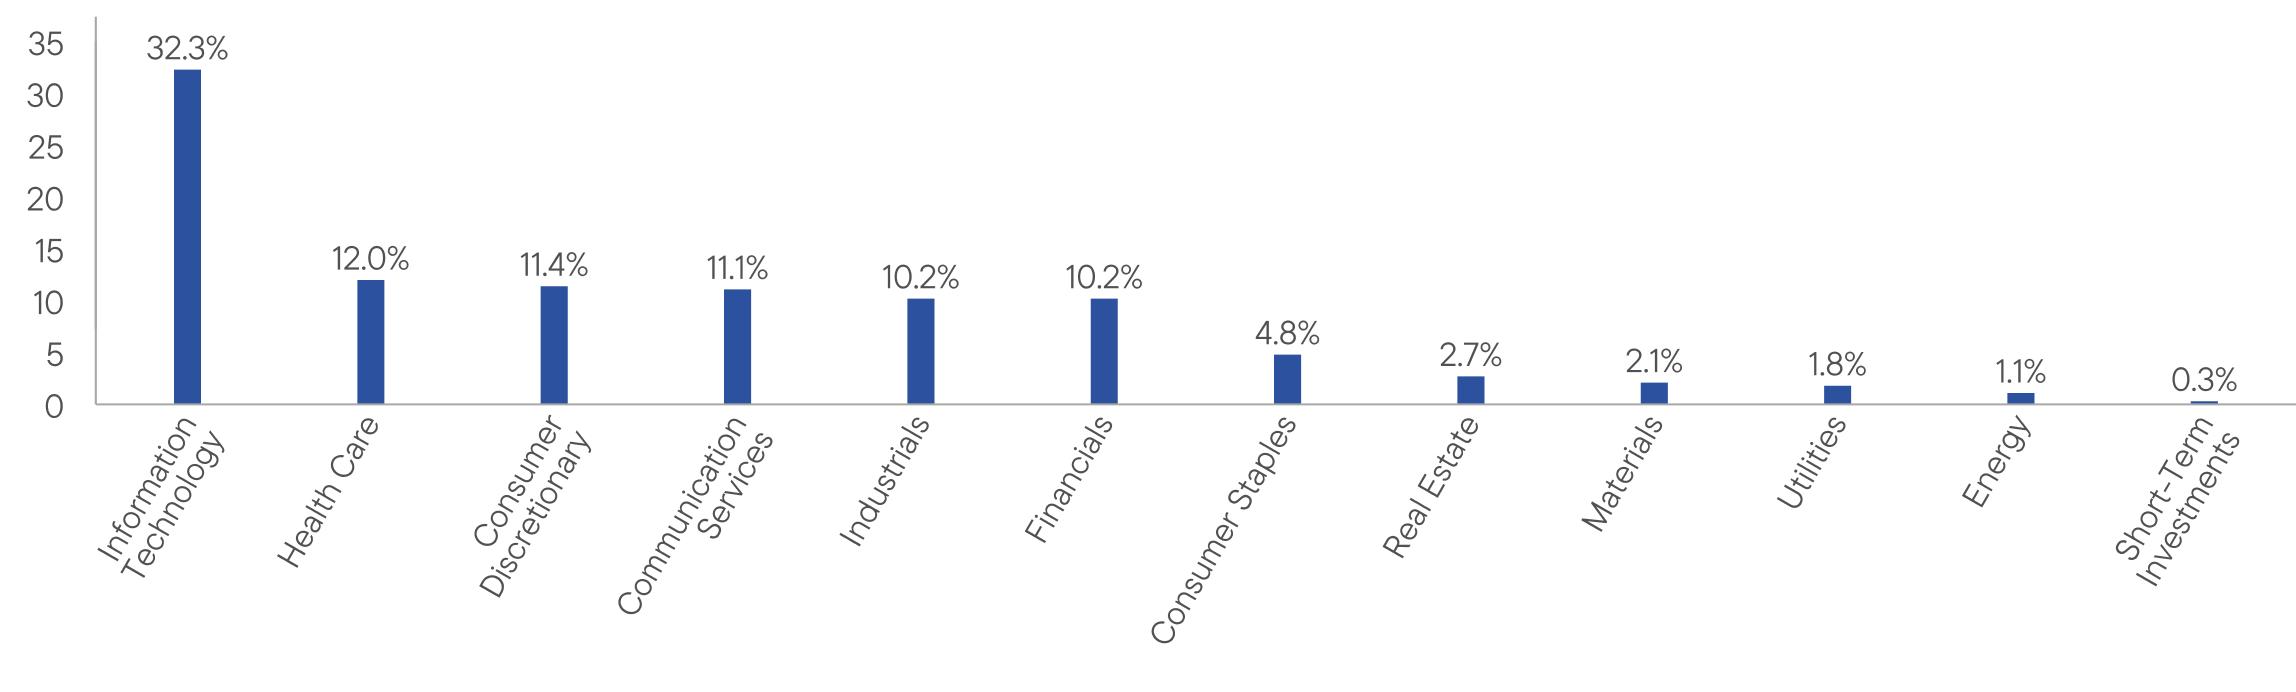
WHAT DID THE FUND INVEST IN? (as of March 31, 2026)
Portfolio Composition* (% of Total Investments)
HOW HAS THE FUND CHANGED?
Effective December 30, 2025, the Fund updated its diversification policy to reflect that the Fund intends to be diversified in approximately the same proportion as its Underlying Index is diversified. Therefore, under the revised policy, the Fund will continue to track its Underlying Index even if the Fund operates as non-diversified as a result of a change in relative market capitalization or index weighting of one or more constituents of its Underlying Index.
In connection with this change, disclosure regarding the risks of non-diversification was added to the Fund’s prospectus to reflect that, when a fund is non-diversified, it may be more sensitive to economic, business, political or other changes affecting individual issuers or investments than a diversified fund, which may negatively impact the Fund’s performance and result in greater fluctuation in the value of the Fund’s shares and greater risk of loss.
This is a summary of certain changes to the Fund since April 1, 2025. For more complete information, you may review the Fund’s current prospectus and the Fund’s next prospectus, which we expect to be available by August 1, 2026, at https://www.franklintempleton.com/regulatory-fund-documents or upon request at (800) DIAL BEN/342-5236 or ETFs-Product@franklintempleton.com.
This report describes changes to the Fund that occurred during the reporting period.
WHAT WERE THE FUND COSTS FOR THE LAST YEAR? (based on a hypothetical $10,000 investment)
|
Fund Name
|
Costs of a $10,000 investment
|
Costs paid as a percentage of a $10,000 investment*
|
|
Franklin U.S. Mid Cap Multifactor Index ETF
|
$31
|
0.30%
|
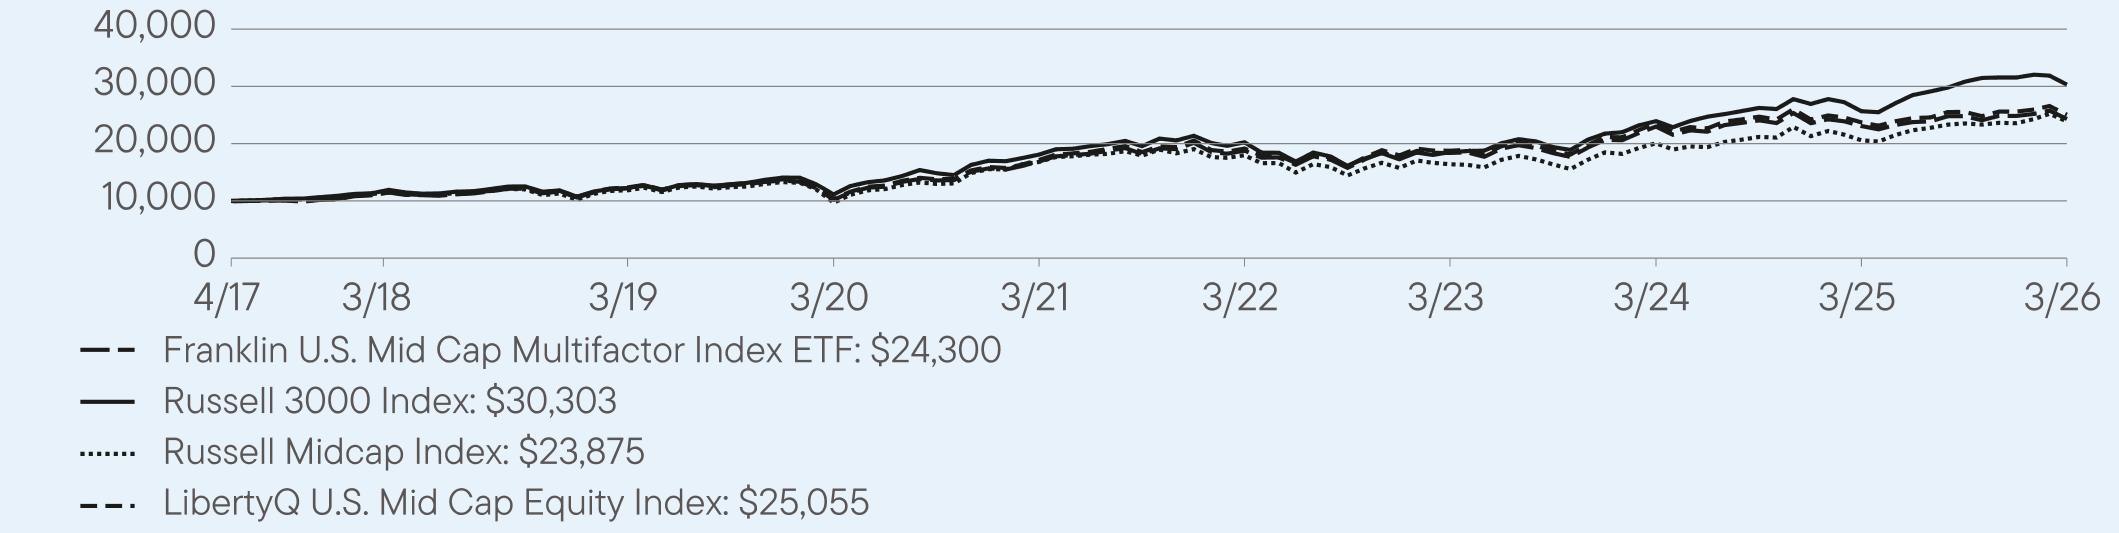
HOW DID THE FUND PERFORM LAST YEAR AND WHAT AFFECTED ITS PERFORMANCE?
For the twelve months ended March 31, 2026, Franklin U.S. Mid Cap Multifactor Index ETF returned 5.33%. The Fund compares its performance to the Russell Midcap Index and the LibertyQ U.S. Mid Cap Equity Index, which returned 15.98% and 5.64%, respectively, for the same period.
PERFORMANCE HIGHLIGHTS
|
Top contributors to performance:
|
|
|
↑
|
The sectors that contributed most to absolute performance were industrials, health care and consumer discretionary.
|
|
↑
|
Individual holdings that contributed most to absolute performance were Tapestry, Cummins, and United Therapeutics.
|
|
Top detractors from performance:
|
|
|
↓
|
The information technology and consumer staples sectors detracted most from relative returns.
|
|
↓
|
Individual holdings that detracted most from absolute performance were Gartner, GoDaddy, and Paychex.
|
AVERAGE ANNUAL TOTAL RETURNS (%) Period Ended March 31, 2026
|
|
1 Year
|
5 Year
|
Since Inception
(4/26/2017) |
|
Franklin U.S. Mid Cap Multifactor Index ETF (NAV)
|
5.33
|
7.54
|
10.46
|
|
Russell 3000 Index
|
18.09
|
10.87
|
13.19
|
|
Russell Midcap Index
|
15.98
|
7.26
|
10.15
|
|
LibertyQ U.S. Mid Cap Equity Index
|
5.64
|
7.84
|
10.77
|
For current month-end performance, please call Franklin Templeton at (800) DIAL BEN/342-5236 or visit
https://www.franklintempleton.com/investments/options/exchange-traded-funds.
https://www.franklintempleton.com/investments/options/exchange-traded-funds.
Important data provider notices and terms available at www.franklintempletondatasources.com.
KEY FUND STATISTICS (as of March 31, 2026)
|
Total Net Assets
|
$1,674,981,799
|
|
Total Number of Portfolio Holdings (excludes derivatives, except purchased options, if any)
|
203
|
|
Total Management Fee Paid (based on a unitary fee)
|
$5,060,769
|
|
Portfolio Turnover Rate
|
25%
|
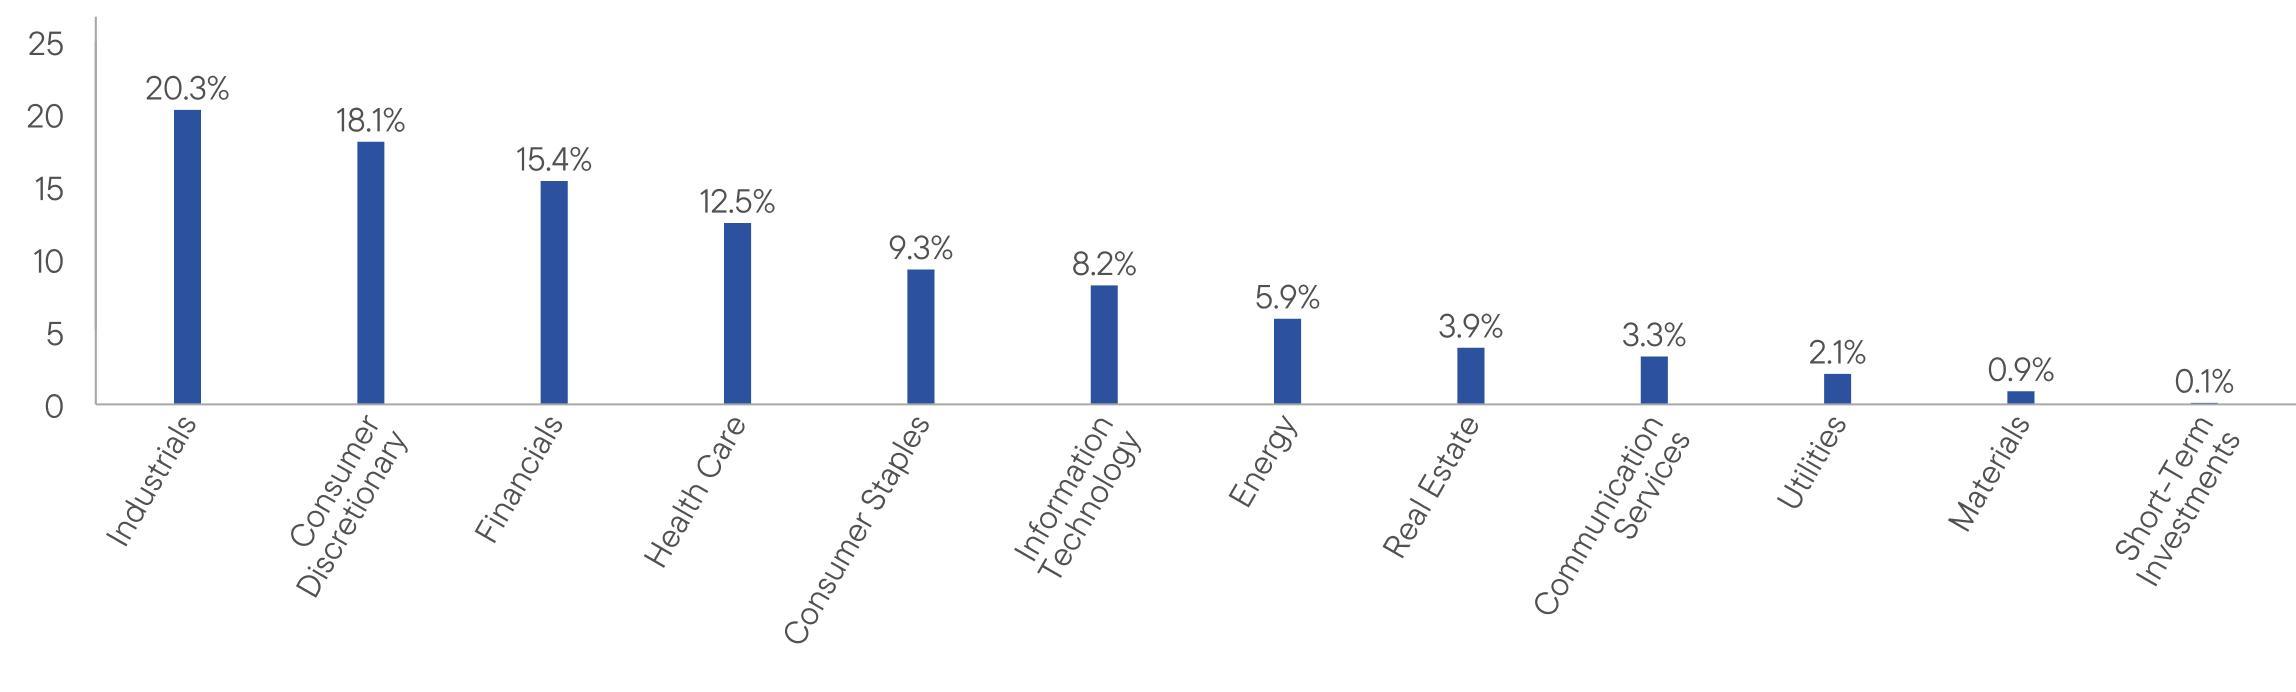
WHAT DID THE FUND INVEST IN? (as of March 31, 2026)
Portfolio Composition* (% of Total Investments)
HOW HAS THE FUND CHANGED?
Effective December 30, 2025, the Fund updated its diversification policy to reflect that the Fund intends to be diversified in approximately the same proportion as its Underlying Index is diversified. Therefore, under the revised policy, the Fund will continue to track its Underlying Index even if the Fund operates as non-diversified as a result of a change in relative market capitalization or index weighting of one or more constituents of its Underlying Index.
In connection with this change, disclosure regarding the risks of non-diversification was added to the Fund’s prospectus to reflect that, when a fund is non-diversified, it may be more sensitive to economic, business, political or other changes affecting individual issuers or investments than a diversified fund, which may negatively impact the Fund’s performance and result in greater fluctuation in the value of the Fund’s shares and greater risk of loss.
This is a summary of certain changes to the Fund since April 1, 2025. For more complete information, you may review the Fund’s current prospectus and the Fund’s next prospectus, which we expect to be available by August 1, 2026, at https://www.franklintempleton.com/regulatory-fund-documents or upon request at (800) DIAL BEN/342-5236 or ETFs-Product@franklintempleton.com.
This report describes changes to the Fund that occurred during the reporting period.
WHAT WERE THE FUND COSTS FOR THE LAST YEAR? (based on a hypothetical $10,000 investment)
|
Fund Name
|
Costs of a $10,000 investment
|
Costs paid as a percentage of a $10,000 investment*
|
|
Franklin U.S. Small Cap Multifactor Index ETF
|
$37
|
0.35%
|
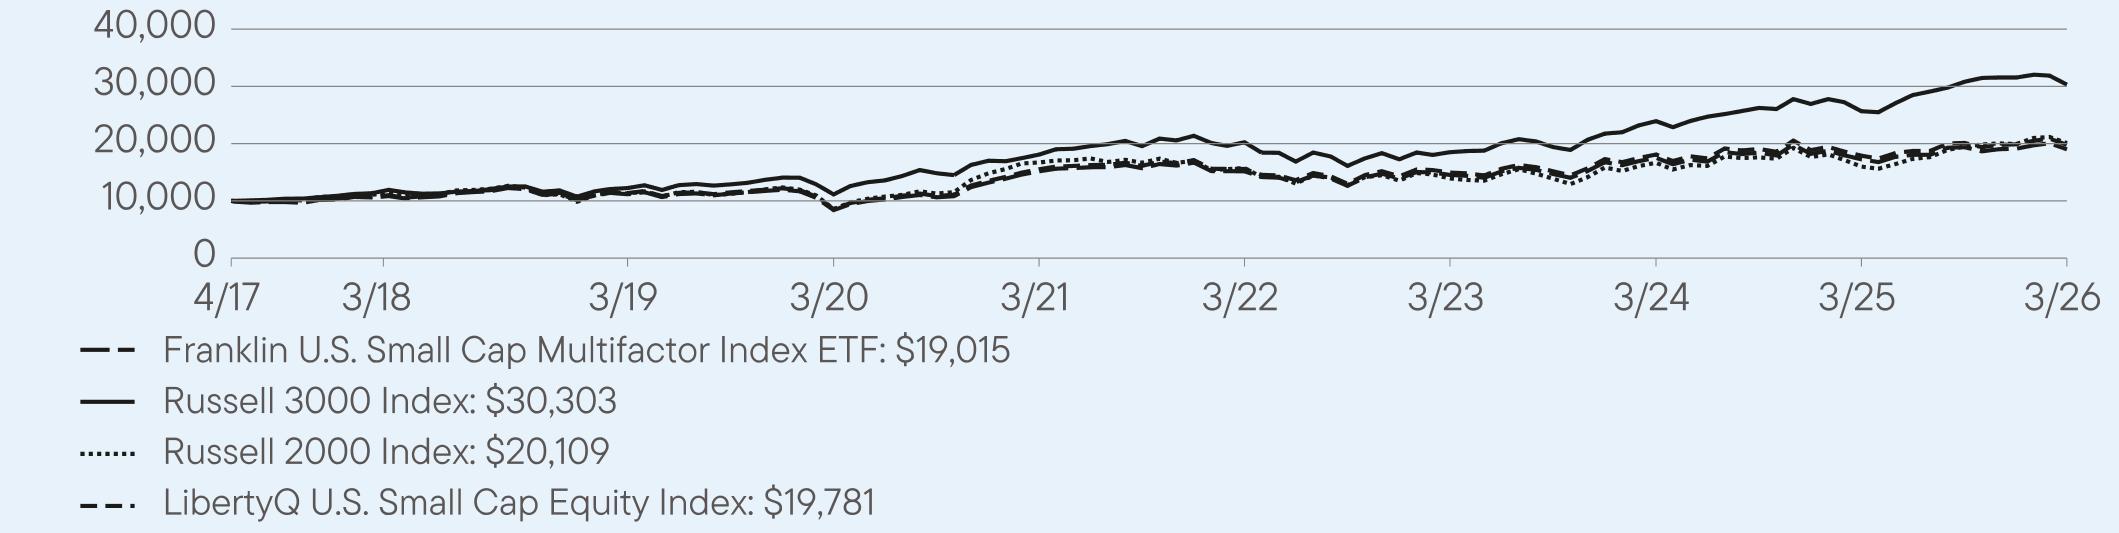
HOW DID THE FUND PERFORM LAST YEAR AND WHAT AFFECTED ITS PERFORMANCE?
For the twelve months ended March 31, 2026, Franklin U.S. Small Cap Multifactor Index ETF returned 10.14%. The Fund compares its performance to the Russell 2000 Index and the LibertyQ U.S. Small Cap Equity Index, which returned 25.72% and 10.52%, respectively, for the same period.
PERFORMANCE HIGHLIGHTS
|
Top contributors to performance:
|
|
|
↑
|
The sectors that contributed most to absolute performance were industrials, consumer discretionary and financials.
|
|
↑
|
Individual holdings that contributed most to absolute performance were Rambus, Viavi Solutions and Primoris Services.
|
|
Top detractors from performance:
|
|
|
↓
|
The health care and communications services sectors detracted most from absolute performance.
|
|
↓
|
Individual holdings that detracted most from absolute performance were Corcept Therapeutics, Commvault Systems, and SPS Commerce.
|
AVERAGE ANNUAL TOTAL RETURNS (%) Period Ended March 31, 2026
|
|
1 Year
|
5 Year
|
Since Inception
(4/26/2017) |
|
Franklin U.S. Small Cap Multifactor Index ETF (NAV)
|
10.14
|
4.62
|
7.46
|
|
Russell 3000 Index
|
18.09
|
10.87
|
13.19
|
|
Russell 2000 Index
|
25.72
|
3.77
|
7.98
|
|
LibertyQ U.S. Small Cap Equity Index
|
10.52
|
4.95
|
7.81
|
For current month-end performance, please call Franklin Templeton at (800) DIAL BEN/342-5236 or visit
https://www.franklintempleton.com/investments/options/exchange-traded-funds.
https://www.franklintempleton.com/investments/options/exchange-traded-funds.
Important data provider notices and terms available at www.franklintempletondatasources.com.
KEY FUND STATISTICS (as of March 31, 2026)
|
Total Net Assets
|
$47,012,405
|
|
Total Number of Portfolio Holdings (excludes derivatives, except purchased options, if any)
|
482
|
|
Total Management Fee Paid (based on a unitary fee)
|
$202,964
|
|
Portfolio Turnover Rate
|
23%
|
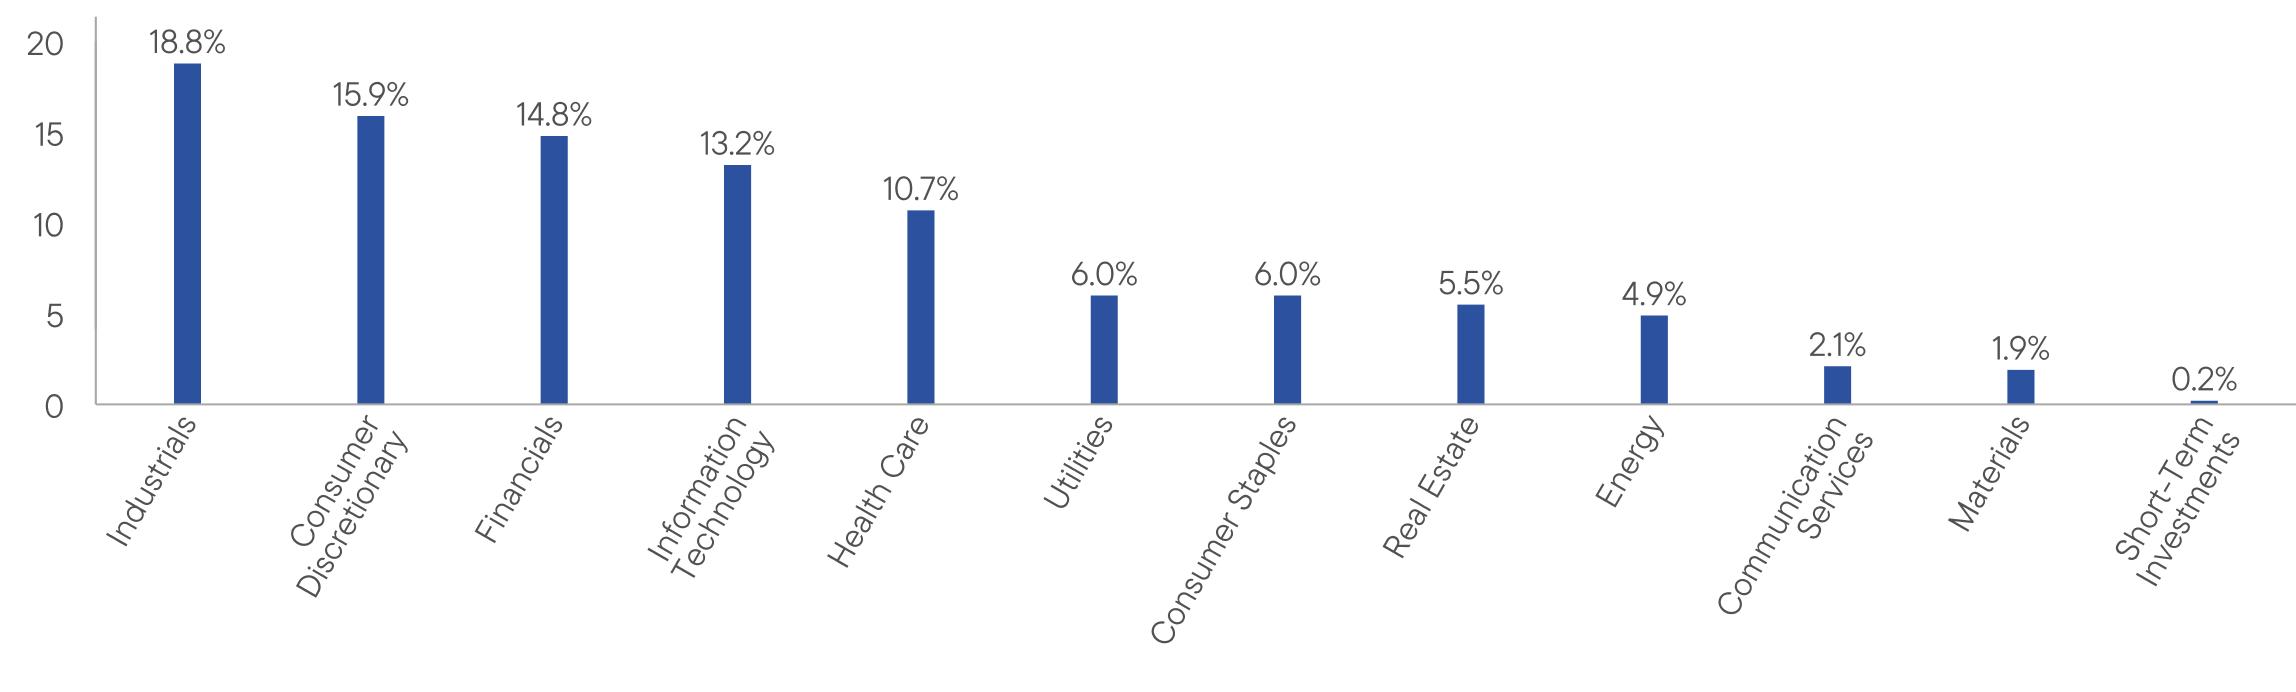
WHAT DID THE FUND INVEST IN? (as of March 31, 2026)
Portfolio Composition* (% of Total Investments)
HOW HAS THE FUND CHANGED?
Effective December 30, 2025, the Fund updated its diversification policy to reflect that the Fund intends to be diversified in approximately the same proportion as its Underlying Index is diversified. Therefore, under the revised policy, the Fund will continue to track its Underlying Index even if the Fund operates as non-diversified as a result of a change in relative market capitalization or index weighting of one or more constituents of its Underlying Index.
In connection with this change, disclosure regarding the risks of non-diversification was added to the Fund’s prospectus to reflect that, when a fund is non-diversified, it may be more sensitive to economic, business, political or other changes affecting individual issuers or investments than a diversified fund, which may negatively impact the Fund’s performance and result in greater fluctuation in the value of the Fund’s shares and greater risk of loss.
This is a summary of certain changes to the Fund since April 1, 2025. For more complete information, you may review the Fund’s current prospectus and the Fund’s next prospectus, which we expect to be available by August 1, 2026, at https://www.franklintempleton.com/regulatory-fund-documents or upon request at (800) DIAL BEN/342-5236 or ETFs-Product@franklintempleton.com.
WHAT WERE THE FUND COSTS FOR THE LAST YEAR? (based on a hypothetical $10,000 investment)
|
Fund Name
|
Costs of a $10,000 investment
|
Costs paid as a percentage of a $10,000 investment
|
|
Franklin Disruptive Commerce ETF
|
$48
|
0.50%
|
HOW DID THE FUND PERFORM LAST YEAR AND WHAT AFFECTED ITS PERFORMANCE?
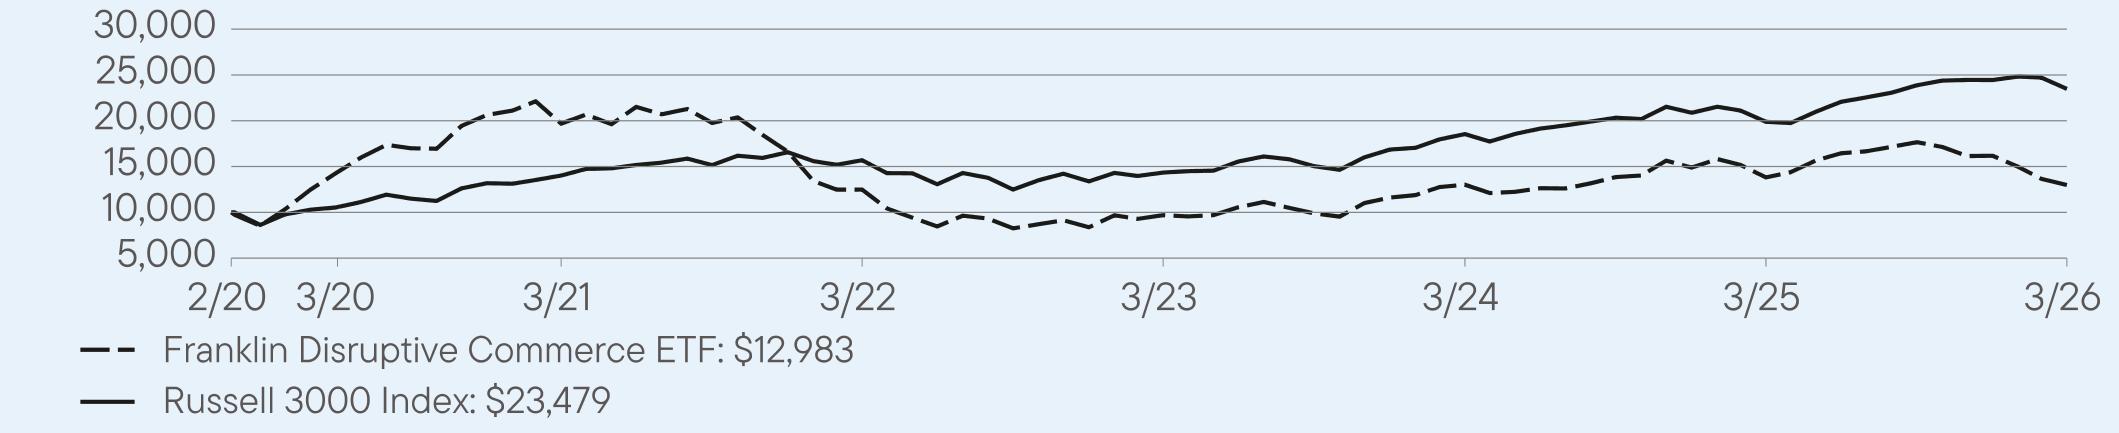
For the twelve months ended March 31, 2026, Franklin Disruptive Commerce ETF returned -6.04%. The Fund compares its performance to the Russell 3000 Index, which returned 18.09% for the same period.
PERFORMANCE HIGHLIGHTS
|
Top contributors to performance:
|
|
|
↑
|
Information technology (IT) sector led with absolute gains that were concentrated in Shopify (IT services industry), as well as AppLovin and Life360 (software). E-commerce platform provider Shopify—the Fund’s second-largest holding—rose on improving profitability and margins, strong merchant subscriber growth, and investor optimism around its streamlined cost structure and expanding ecosystem.
|
|
↑
|
In consumer staples, absolute returns were boosted by Costco Wholesale and Walmart, both of which are large, value-oriented retailers with strong grocery exposure and loyal customer bases. Their shares rose as cost-conscious consumers traded down amid historically elevated inflation, driving resilient sales and steady earnings growth. Walmart continued to grow its e-commerce business with faster delivery, expanded marketplace offerings, and improved fulfillment capabilities, helping it gain online share and compete more effectively with Amazon.
|
|
↑
|
Alphabet (Google) also contributed to absolute performance and was a major outlier to the upside in the interactive media and services industry, backed by strong advertising growth, improving cost discipline, and investor enthusiasm around its leadership in artificial intelligence. Other key contributors included Netflix in entertainment, eBay and Amazon.com in broadline retail, and Carvana in specialty retail.
|
|
Top detractors from performance:
|
|
|
↓
|
Core portfolio holdings were negatively impacted by higher interest rates, which compressed valuations and detracted from absolute performance for many growth-oriented e-commerce and fintech companies. At the same time, slowing consumer spending and normalization after pandemic-era demand weighed on revenue growth. Together, these macroeconomic pressures led investors to rotate away from higher-risk, long-duration growth stocks.
|
|
↓
|
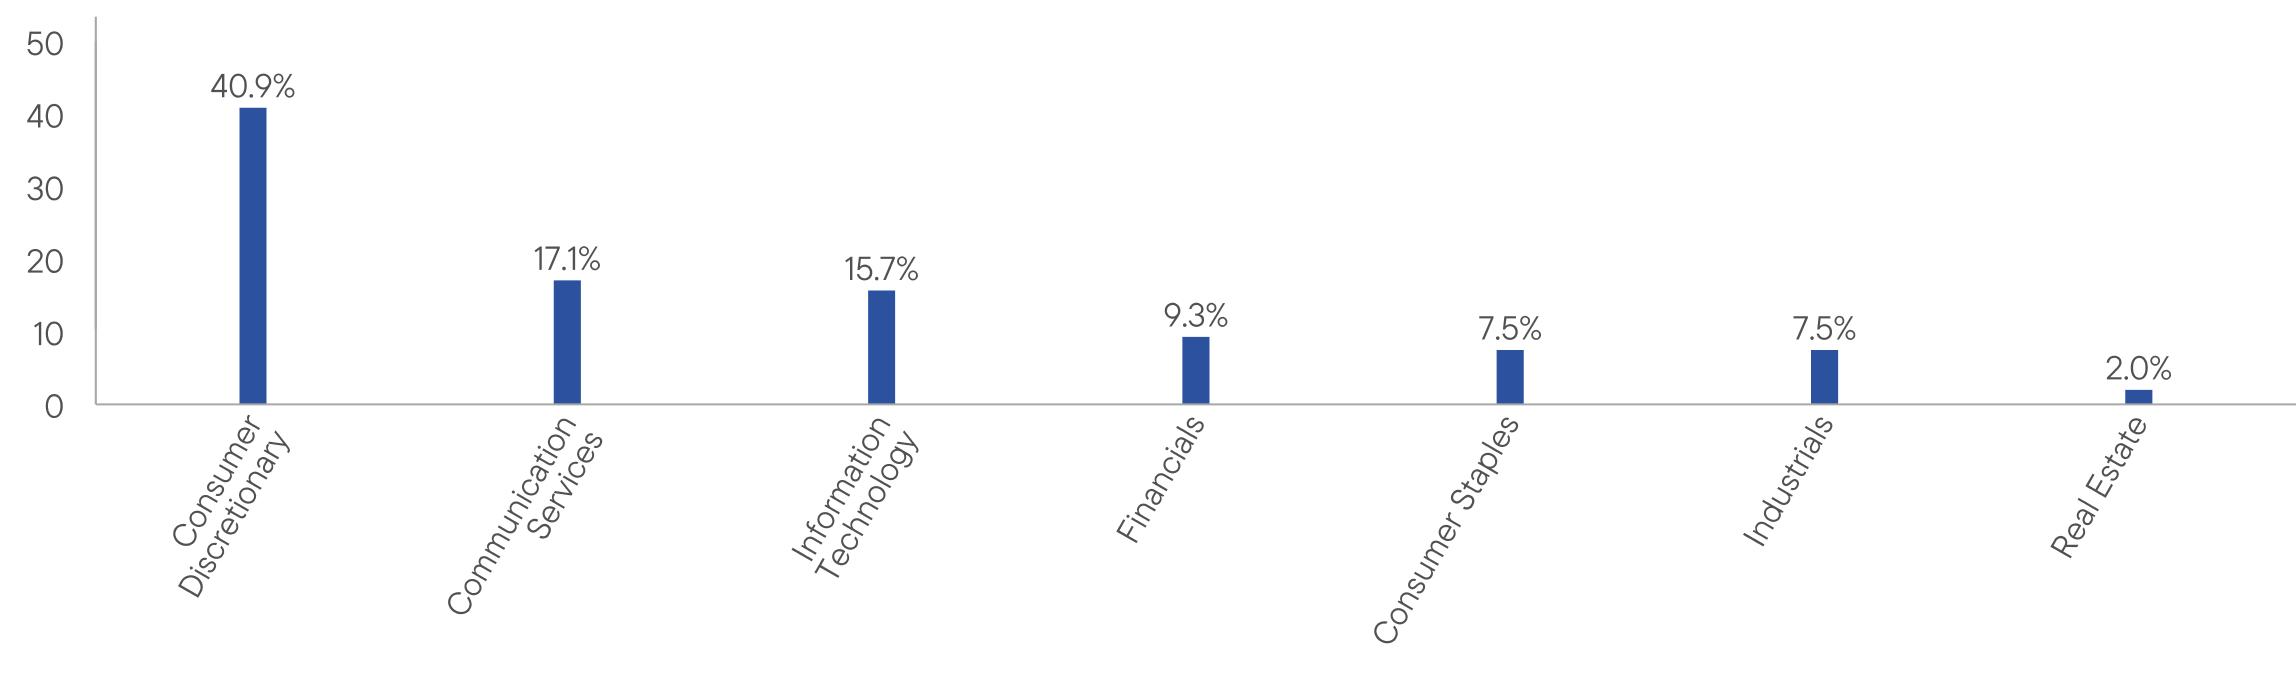
Most consumer discretionary sector holdings (covering about 41% of the portfolio) traded lower and detracted from absolute performance, including key e-commerce detractors Sea, Alibaba Group Holding and MercadoLibre. Holdings in the hotels, restaurants and leisure industry also declined overall, with “last mile” delivery platform specialist DoorDash trading lower as investors reacted to slowing order growth and continued profitability concerns amid a more price-sensitive consumer environment.
|
|
↓
|
Fintech companies also detracted from absolute performance as cloud-based transaction and digital payments specialists such as Affirm Holdings, Toast, Adyen and Visa generally declined as the tougher consumer spending backdrop pressured payment volumes and weighed on valuations across digital commerce.
|
AVERAGE ANNUAL TOTAL RETURNS (%) Period Ended March 31, 2026
|
|
1 Year
|
5 Year
|
Since Inception
(2/25/2020) |
|
Franklin Disruptive Commerce ETF (NAV)
|
-6.04
|
-7.99
|
4.38
|
|
Russell 3000 Index
|
18.09
|
10.87
|
13.94
|
For current month-end performance, please call Franklin Templeton at (800) DIAL BEN/342-5236 or visit
https://www.franklintempleton.com/investments/options/exchange-traded-funds.
https://www.franklintempleton.com/investments/options/exchange-traded-funds.
Important data provider notices and terms available at www.franklintempletondatasources.com.
KEY FUND STATISTICS (as of March 31, 2026)
|
Total Net Assets
|
$6,437,551
|
|
Total Number of Portfolio Holdings
|
56
|
|
Total Management Fee Paid (based on a unitary fee)
|
$39,886
|
|
Portfolio Turnover Rate
|
34%
|
WHAT DID THE FUND INVEST IN? (as of March 31, 2026)
Portfolio Composition* (% of Total Investments)
WHAT WERE THE FUND COSTS FOR THE LAST YEAR? (based on a hypothetical $10,000 investment)
|
Fund Name
|
Costs of a $10,000 investment
|
Costs paid as a percentage of a $10,000 investment*
|
|
Franklin Dividend Growth ETF1
|
$29
|
0.49%
|
HOW DID THE FUND PERFORM LAST YEAR AND WHAT AFFECTED ITS PERFORMANCE?
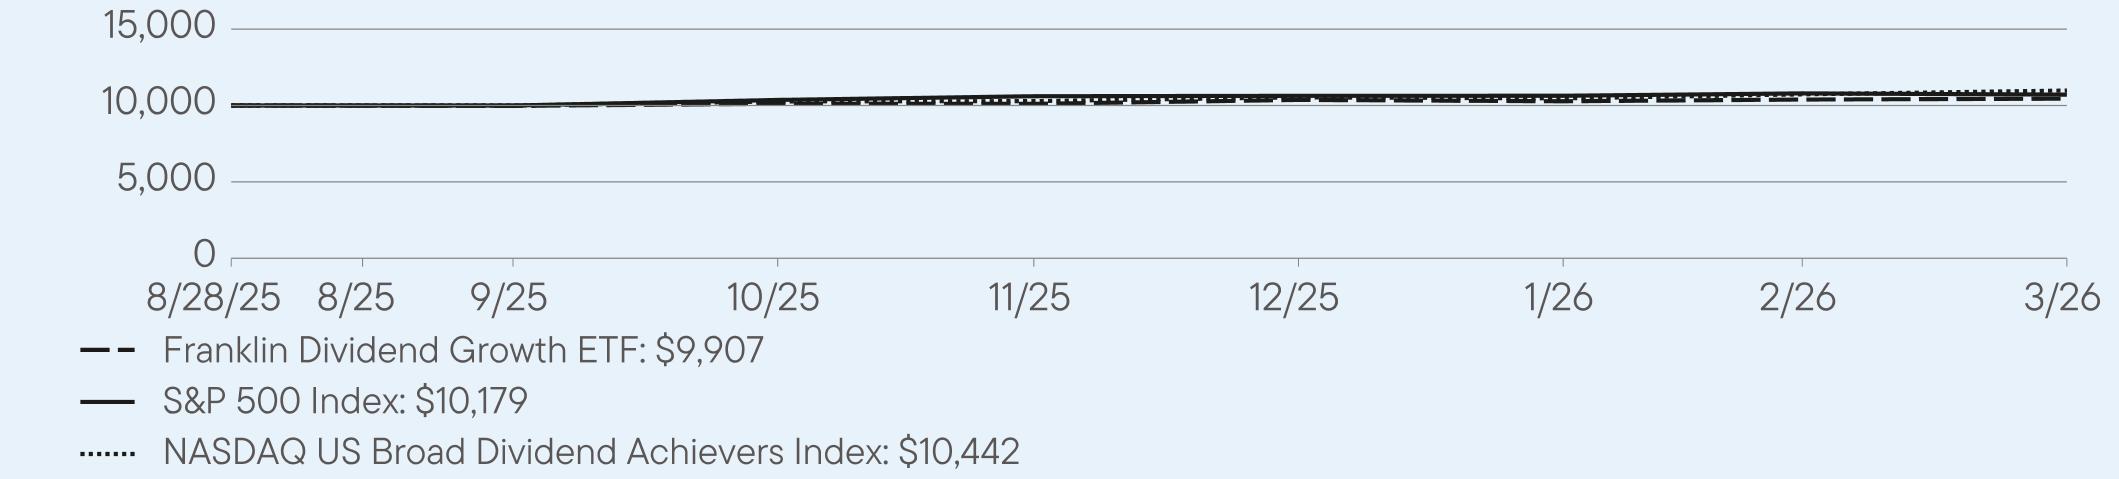
For the period August 28, 2025, to March 31, 2026, Franklin Dividend Growth ETF returned -0.93%. The Fund compares its performance to the NASDAQ US Broad Dividend Achievers Index, which returned 4.20% for the same period.
PERFORMANCE HIGHLIGHTS
|
Top contributors to performance:
|
|
|
↑
|
Convenience fuel retailer Casey’s General Stores outperformed due to resilient consumer demand, record earnings growth, margin expansion from foodservice strength, and S&P 500 inclusion, which boosted investor demand.
|
|
↑
|
Renewable electric utility NextEra Energy’s outperformance was driven by strong regulated utility earnings, rapid renewable backlog growth and data-center power demand.
|
|
↑
|
Industrial motion controls manufacturer Parker-Hannifin had a positive impact on booming aerospace demand, margin expansion, earnings beats, raised guidance and early signs of industrial recovery.
|
|
Top detractors from performance:
|
|
|
↓
|
Enterprise software giant Microsoft underperformed as heavy artificial intelligence (AI) capital spending, margin pressure and valuation concerns outweighed strong revenue growth and dividend stability.
|
|
↓
|
Vertical software conglomerate Roper Technologies lagged due to weaker guidance, slower organic growth in key units, and earnings resets.
|
|
↓
|
Alternative asset manager Apollo Global Management underperformed amid private credit liquidity fears, fund redemption caps, and heightened regulatory and credit-cycle concerns.
|
AVERAGE ANNUAL TOTAL RETURNS (%) Period Ended March 31, 2026
|
|
Since Inception
(8/28/2025) |
|
Franklin Dividend Growth ETF (NAV)
|
-0.93
|
|
S&P 500 Index
|
32.64
|
|
NASDAQ US Broad Dividend Achievers Index
|
4.20
|
For current month-end performance, please call Franklin Templeton at (800) DIAL BEN/342-5236 or visit
https://www.franklintempleton.com/investments/options/exchange-traded-funds.
https://www.franklintempleton.com/investments/options/exchange-traded-funds.
Important data provider notices and terms available at www.franklintempletondatasources.com.
KEY FUND STATISTICS (as of March 31, 2026)
|
Total Net Assets
|
$4,928,124
|
|
Total Number of Portfolio Holdings
|
42
|
|
Total Management Fee Paid (based on a unitary fee)
|
$14,711
|
|
Portfolio Turnover Rate
|
10%
|
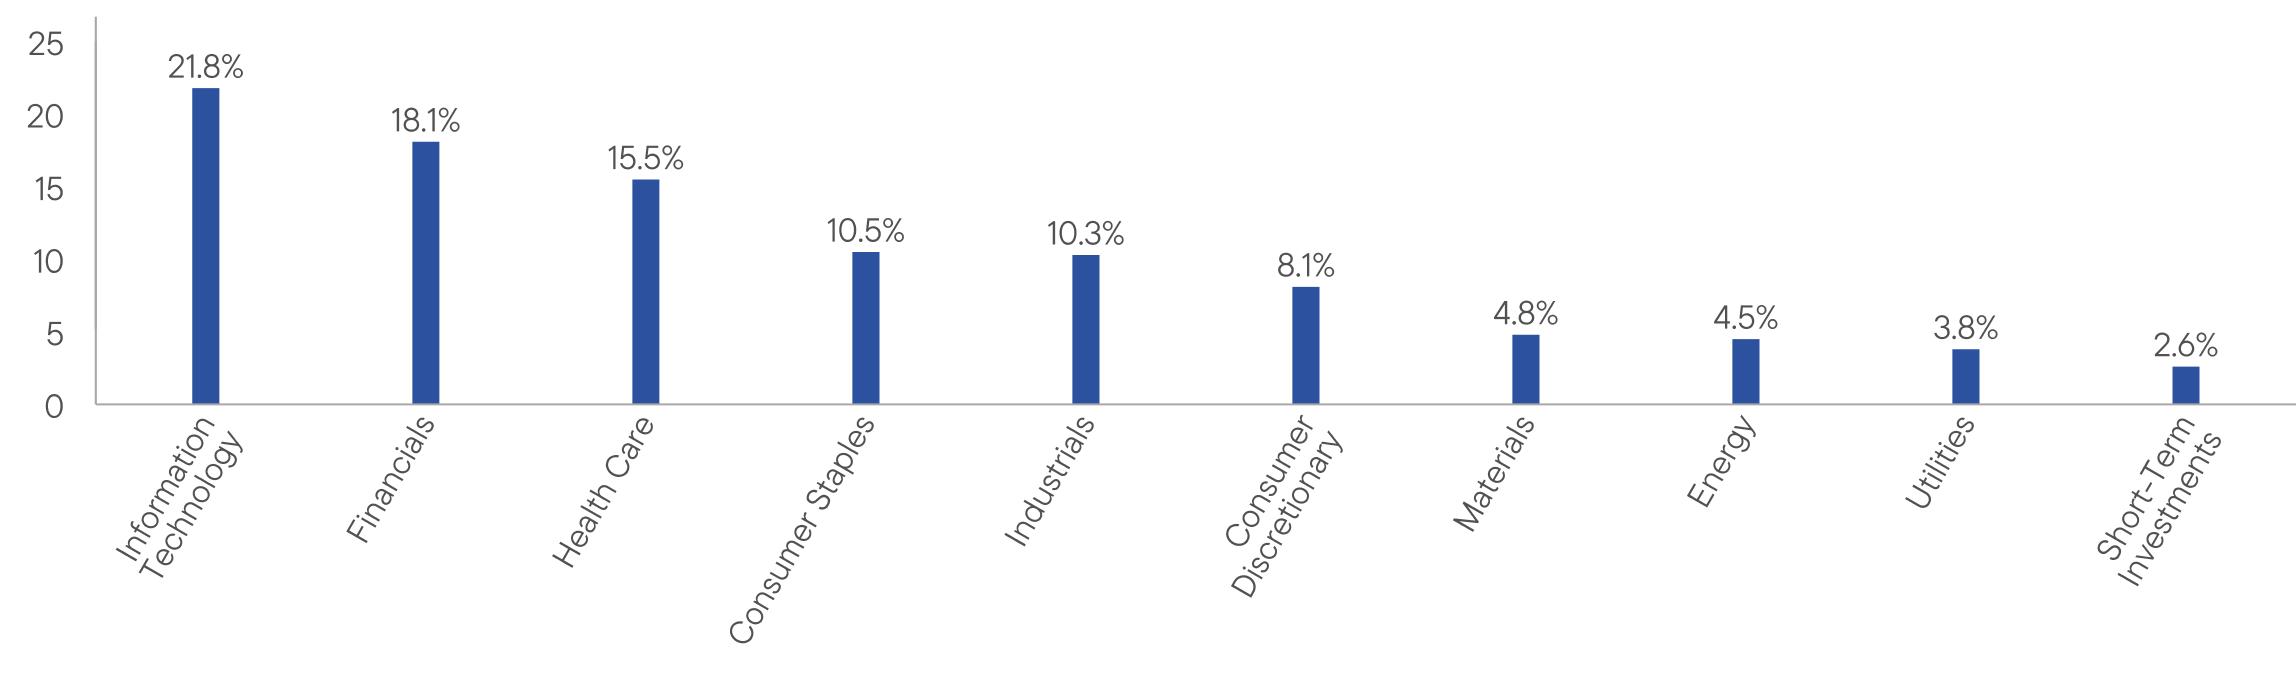
WHAT DID THE FUND INVEST IN? (as of March 31, 2026)
Portfolio Composition* (% of Total Investments)
This report describes changes to the Fund that occurred during the reporting period.
WHAT WERE THE FUND COSTS FOR THE LAST YEAR? (based on a hypothetical $10,000 investment)
|
Fund Name
|
Costs of a $10,000 investment
|
Costs paid as a percentage of a $10,000 investment
|
|
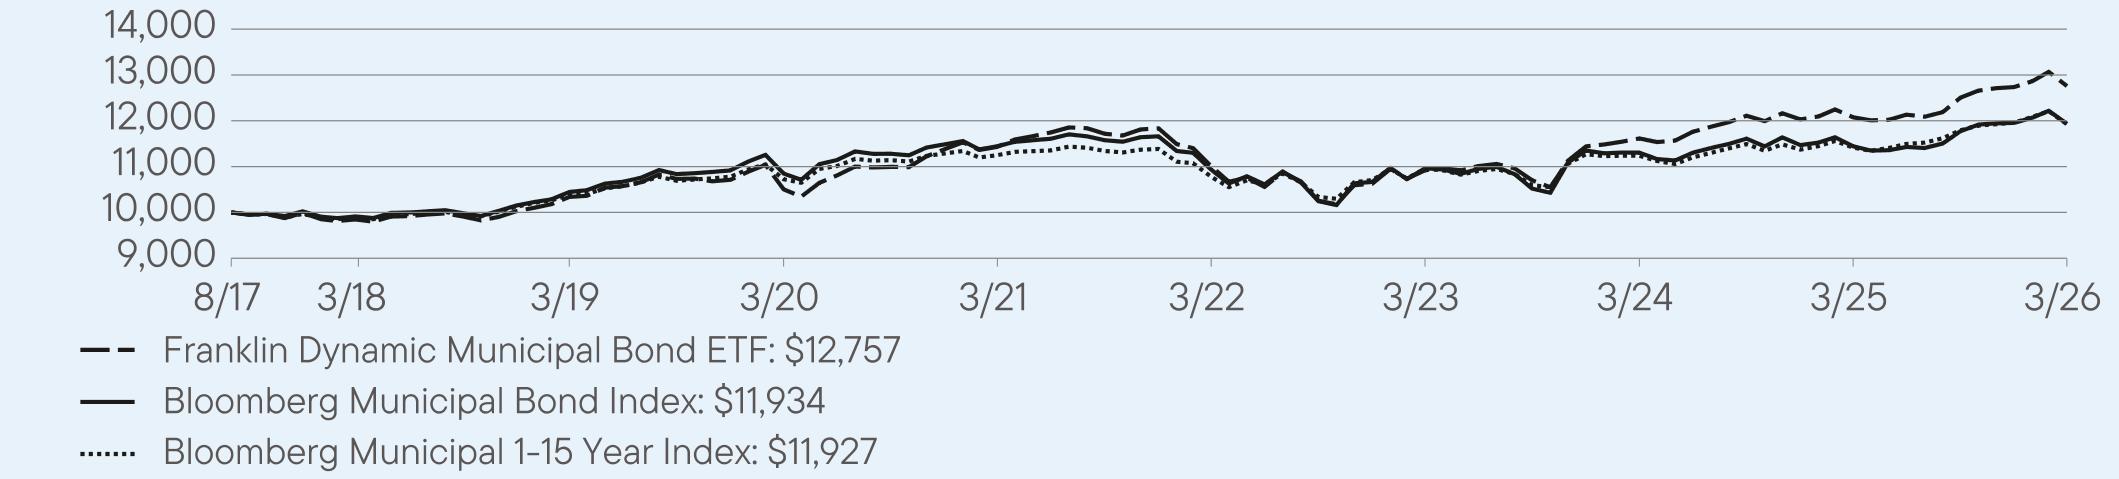
Franklin Dynamic Municipal Bond ETF
|
$31
|
0.30%
|
HOW DID THE FUND PERFORM LAST YEAR AND WHAT AFFECTED ITS PERFORMANCE?
For the twelve months ended March 31, 2026, Franklin Dynamic Municipal Bond ETF returned 5.63%. The Fund compares its performance to the Bloomberg Municipal 1-15 Year Index, which returned 4.49% for the same period.
PERFORMANCE HIGHLIGHTS
|
Top contributors to performance:
|
|
|
↑
|
Security selection in AAA rated bonds.
|
|
↑
|
Overweight allocation to non-rated bonds.
|
|
↑
|
Yield curve contributions, including an overweight to bonds with 20 years to maturity.
|
|
Top detractors from performance:
|
|
|
↓
|
Overweight to A rated bonds.
|
|
↓
|
Overweight to bonds with 20 years to maturity.
|
|
↓
|
Underweight to bonds with 2 years to maturity.
|
AVERAGE ANNUAL TOTAL RETURNS (%) Period Ended March 31, 2026
|
|
1 Year
|
5 Year
|
Since Inception
(8/31/2017) |
|
Franklin Dynamic Municipal Bond ETF (NAV)
|
5.63
|
2.21
|
2.88
|
|
Bloomberg Municipal Bond Index
|
4.29
|
0.84
|
2.08
|
|
Bloomberg Municipal 1-15 Year Index
|
4.49
|
1.17
|
2.07
|
For current month-end performance, please call Franklin Templeton at (800) DIAL BEN/342-5236 or visit
https://www.franklintempleton.com/investments/options/exchange-traded-funds.
https://www.franklintempleton.com/investments/options/exchange-traded-funds.
Important data provider notices and terms available at www.franklintempletondatasources.com.
KEY FUND STATISTICS (as of March 31, 2026)
|
Total Net Assets
|
$1,883,385,478
|
|
Total Number of Portfolio Holdings
|
1210
|
|
Total Management Fee Paid (based on a unitary fee)
|
$3,244,997
|
|
Portfolio Turnover Rate
|
34%
|
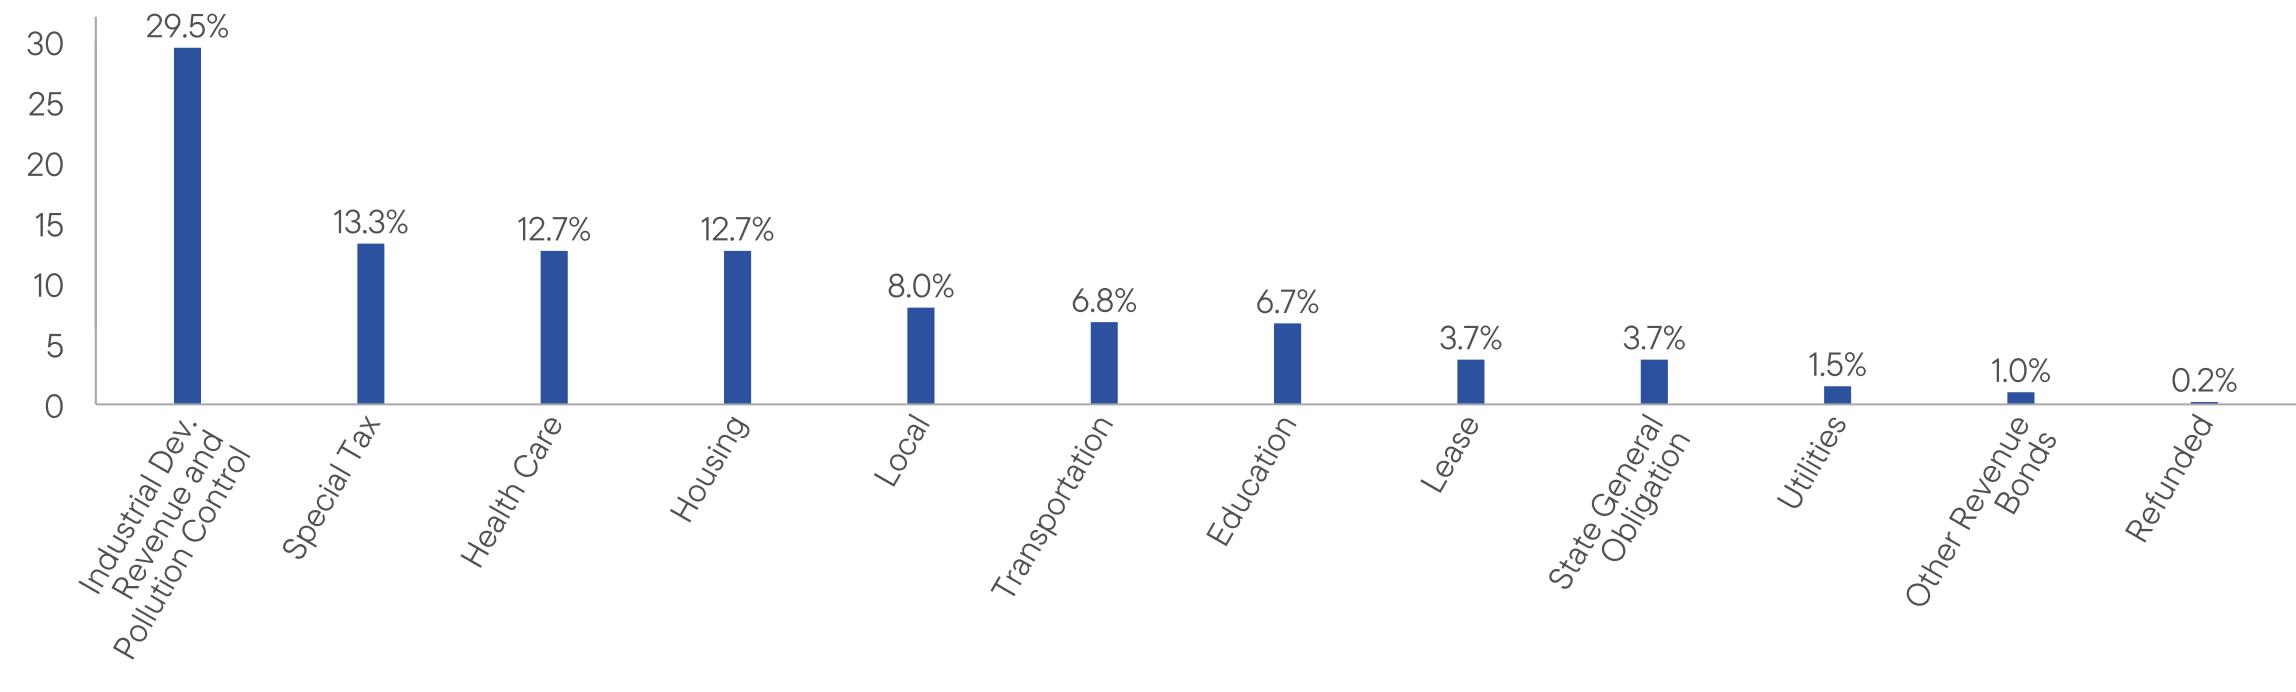
WHAT DID THE FUND INVEST IN? (as of March 31, 2026)
Portfolio Composition* (% of Total Investments)
HOW HAS THE FUND CHANGED?
Effective September 30, 2025, Garrett L. Hamilton was added as a portfolio manager of the Fund.
This is a summary of a certain change to the Fund since April 1, 2025. For more complete information, you may review the Fund’s current prospectus and the Fund’s next prospectus, which we expect to be available by August 1, 2026, at https://www.franklintempleton.com/regulatory-fund-documents or upon request at (800) DIAL BEN/342-5236 or ETFs-Product@franklintempleton.com.
WHAT WERE THE FUND COSTS FOR THE LAST YEAR? (based on a hypothetical $10,000 investment)
|
Fund Name
|
Costs of a $10,000 investment
|
Costs paid as a percentage of a $10,000 investment*
|
|
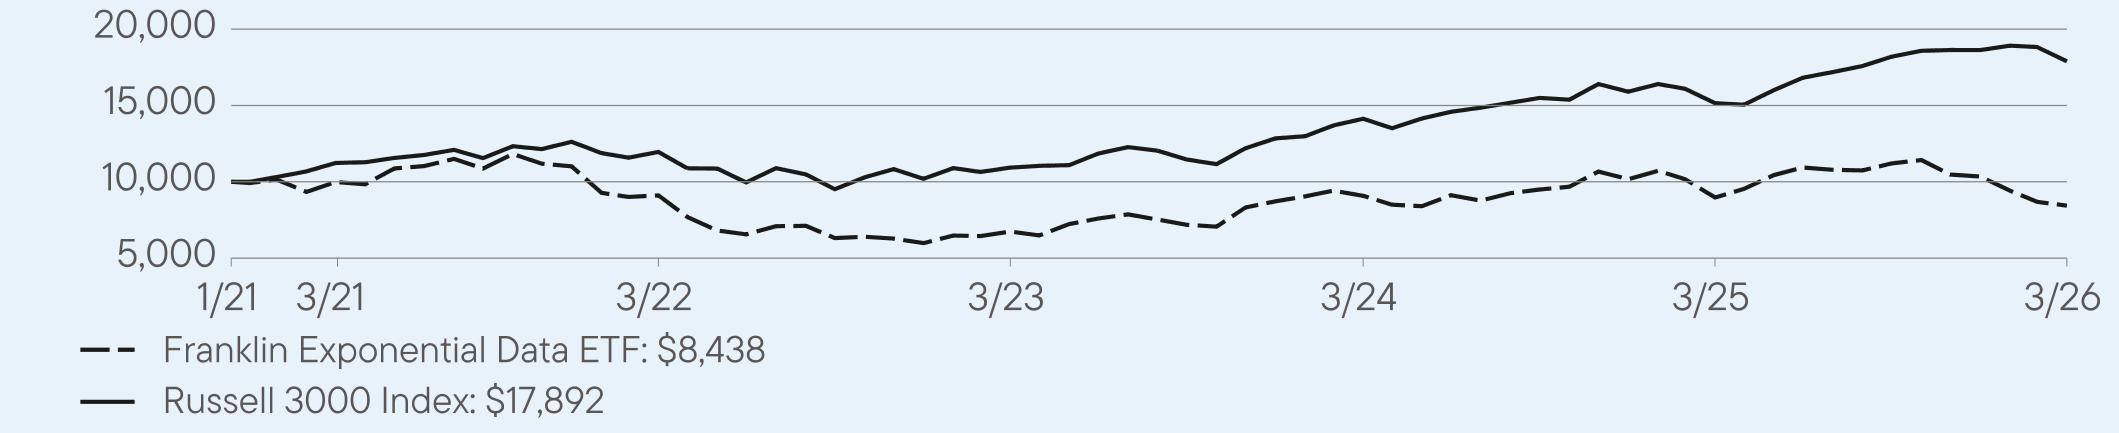
Franklin Exponential Data ETF
|
$48
|
0.49%
|
HOW DID THE FUND PERFORM LAST YEAR AND WHAT AFFECTED ITS PERFORMANCE?
For the twelve months ended March 31, 2026, Franklin Exponential Data ETF returned -5.98%. The Fund compares its performance to the Russell 3000 Index, which returned 18.09% for the same period.
PERFORMANCE HIGHLIGHTS
|
Top contributors to performance:
|
|
|
↑
|
Interactive media and services stocks contributed to absolute returns, led by an exceptional return for Alphabet (Google). The stock surged on a rebound in digital advertising demand, strong operating leverage from cost discipline, and expanding margins that boosted earnings growth. It was further propelled by investor enthusiasm around Google’s artificial intelligence (AI) leadership and monetization opportunities across Search, Cloud, and other platforms.
|
|
↑
|
An overall decline in the information technology (IT) sector (averaging roughly 67% of total net assets) was kept in check by some outliers to the upside which contributed to absolute performance, including Cloudflare in IT services; Arista Networks in communications equipment; and CrowdStrike Holdings, AppLovin, Confluent (sold by period-end) and Life360 in software. Cloud-based network security platform provider Cloudflare, the Fund’s largest absolute contributor, rose sharply on accelerating enterprise demand, improving margins and operating leverage, and strong investor enthusiasm for its expanding role in AI infrastructure, cybersecurity, and edge computing.
|
|
↑
|
Elsewhere in the portfolio, streaming entertainment services provider Netflix advanced and contributed to absolute performance, as did key contributor Equinix in the specialized REITs (real estate investment trusts) industry. Equinix, a data center-focused company providing colocation and interconnection services for global digital infrastructure, rallied on elevated demand for data center capacity driven by cloud and AI workloads, resulting in steady recurring revenue growth throughout the period under review.
|
|
Top detractors from performance:
|
|
|
↓
|
Software industry holdings covered about half the portfolio and declined dramatically detracting from absolute performance in the latter half of the period, which translated into overall losses for most holdings, including key detractors Monday.com, Oracle (purchased during the period), Fair Isaac, Trend Micro, Zscaler and GitLab. Data-oriented software companies lagged as elevated interest rates compressed high-growth valuations just as enterprise customers tightened spending and optimized existing data stacks, while surging AI investment shifted budgets toward infrastructure and hyperscalers, intensifying competition and raising doubts about near-term revenue growth for standalone data platforms.
|
|
↓
|
All seven data-centric positions in the capital markets industry detracted from absolute performance, including large losses for digital trading platform providers such as Robinhood Markets and Coinbase Global, whose revenues are closely tied to transaction activity in volatile asset classes like cryptocurrencies and equities. They sold off amid regulatory uncertainty, and because trading volumes and crypto prices weakened, reducing their transaction-based revenues.
|
|
↓
|
China-based companies such as Tencent Holdings and Alibaba Group Holding detracted from absolute performance with sustained significant losses as persistent regulatory scrutiny, a weak domestic economy and consumer slowdown, and ongoing geopolitical tensions—including concerns over U.S.-China relations and potential delisting risks—undermined investor confidence and pressured growth expectations.
|
AVERAGE ANNUAL TOTAL RETURNS (%) Period Ended March 31, 2026
|
|
1 Year
|
5 Year
|
Since Inception
(1/12/2021) |
|
Franklin Exponential Data ETF (NAV)
|
-5.98
|
-2.00
|
-3.20
|
|
Russell 3000 Index
|
18.09
|
10.87
|
11.28
|
For current month-end performance, please call Franklin Templeton at (800) DIAL BEN/342-5236 or visit
https://www.franklintempleton.com/investments/options/exchange-traded-funds.
https://www.franklintempleton.com/investments/options/exchange-traded-funds.
Important data provider notices and terms available at www.franklintempletondatasources.com.
KEY FUND STATISTICS (as of March 31, 2026)
|
Total Net Assets
|
$3,160,115
|
|
Total Number of Portfolio Holdings
|
69
|
|
Total Management Fee Paid (based on a unitary fee)
|
$20,045
|
|
Portfolio Turnover Rate
|
31%
|
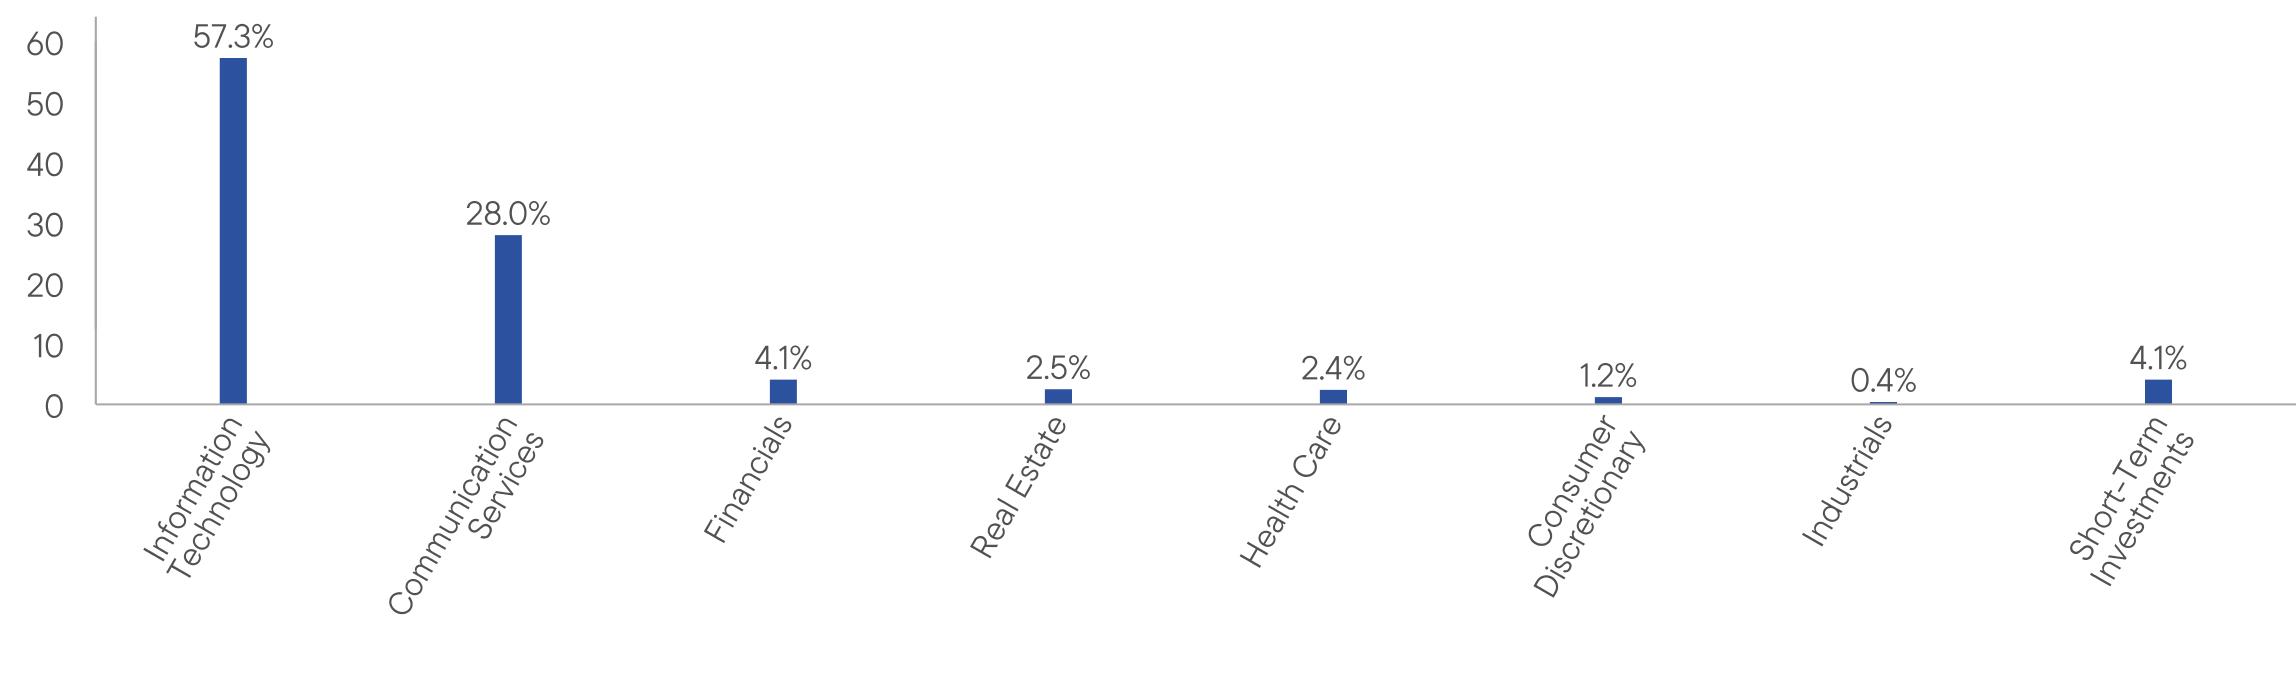
WHAT DID THE FUND INVEST IN? (as of March 31, 2026)
Portfolio Composition* (% of Total Investments)
WHAT WERE THE FUND COSTS FOR THE LAST YEAR? (based on a hypothetical $10,000 investment)
|
Fund Name
|
Costs of a $10,000 investment
|
Costs paid as a percentage of a $10,000 investment*
|
|
Franklin Focused Growth ETF
|
$60
|
0.55%
|
HOW DID THE FUND PERFORM LAST YEAR AND WHAT AFFECTED ITS PERFORMANCE?
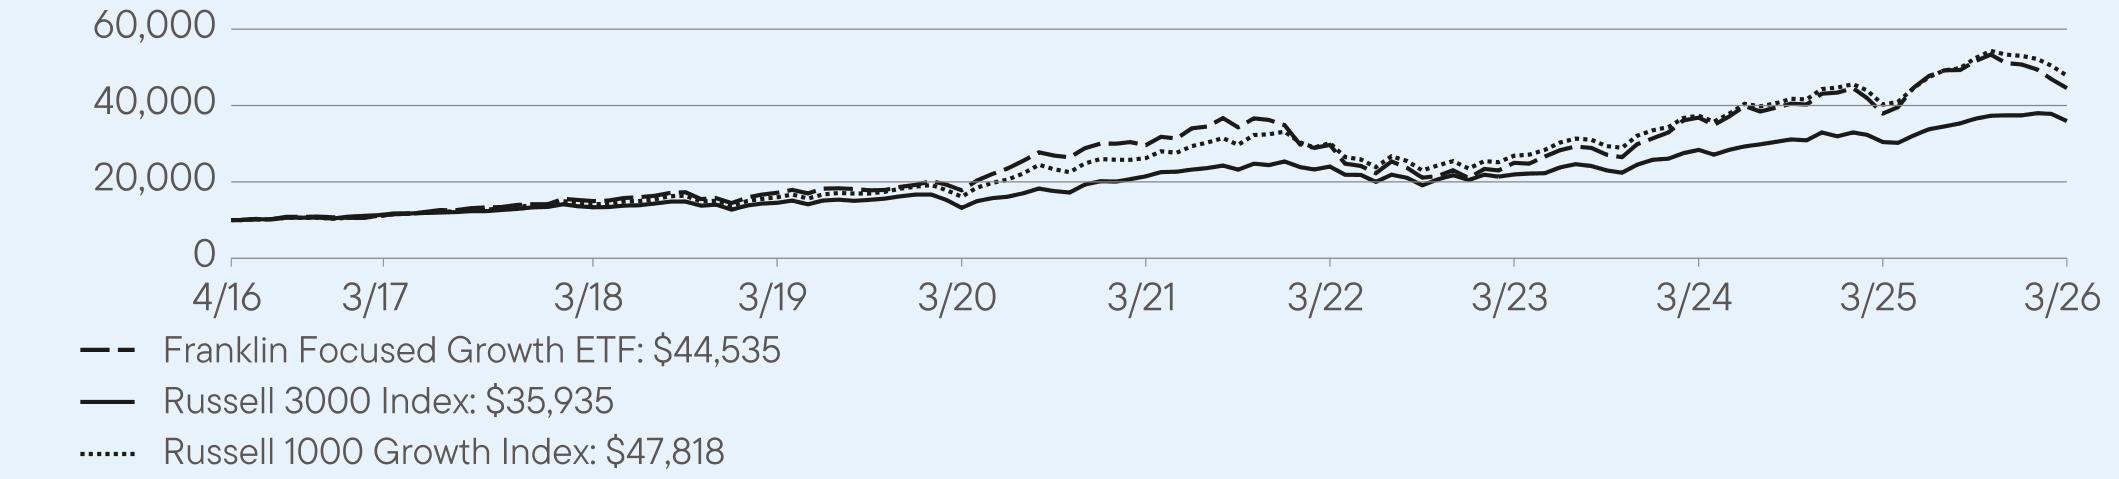
For the twelve months ended March 31, 2026, Franklin Focused Growth ETF returned 17.50%. The Fund compares its performance to the Russell 1000 Growth Index, which returned 18.81% for the same period.
PERFORMANCE HIGHLIGHTS
|
Top contributors to performance:
|
|
|
↑
|
Stong absolute returns were driven by semiconductor and semiconductor equipment stocks such as NVIDIA, Broadcom and Taiwan Semiconductor Manufacturing, backed by surging demand tied to artificial intelligence (AI) and data center buildouts, easing inventory corrections, accelerating profits and expectations of improving end-market growth.
|
|
↑
|
Mixed results in the software industry contributed to absolute performance buoyed by overall contributions from Microsoft, AppLovin, Cadence Design Systems and ServiceNow (sold by period-end) foremost. AppLovin was an outlier to the upside, driven by strong revenue and margin growth from its high-performing AXON AI advertising engine, improving profitability and cash flow, and investor enthusiasm for its expanding role in AI-powered ad optimization despite broader volatility in software stocks.
|
|
↑
|
Select consumer discretionary sector stocks fared well and contributed to absolute performance, including the Fund’s large positions in Amazon.com and Tesla. In the interactive media and services industry, tech giants Alphabet (Google) and Meta Platforms were also notable absolute contributors.
|
|
Top detractors from performance:
|
|
|
↓
|
Most financials sector holdings depreciated and detracted from absolute performance, including key detractors, Tradeweb Markets (capital markets; sold by period-end) and Affirm Holdings (financial services; bought and sold during the period). Aerospace and defense companies such as Kratos Defense & Security Solutions (purchased during the period) also fared poorly as elevated interest rates weighed on valuations; investor rotation favored larger, more established defense primes over smaller, higher-growth names; and concerns about uneven contract timing, budget visibility, and execution risks pressured sentiment.
|
|
↓
|
Health care sector holdings detracted from absolute performance, as gains in the biotechnology and pharmaceuticals industry were countered by overall declines in health care technology, health care equipment and supplies, and life sciences tools and services, where Thermo Fisher Scientific shed about one-fifth of its equity value before it was completely sold.
|
|
↓
|
The rest of the major detractors to absolute performance were scattered across different industries and held for only a portion of the period under review, including Roblox (bought and sold during the period) in entertainment; Constellation Software (bought and sold during the period) in software; Carvana (purchased during the period) in specialty retail; Apple (purchased during the period) in technology hardware, storage and peripherals; and Snowflake (bought and sold during the period) in information technology (IT) services.
|
AVERAGE ANNUAL TOTAL RETURNS (%) Period Ended March 31, 2026
|
|
1 Year
|
5 Year
|
Since Inception
(4/13/2016) |
|
Franklin Focused Growth ETF (NAV)
|
17.50
|
8.50
|
16.17
|
|
Russell 3000 Index
|
18.09
|
10.87
|
19.73
|
|
Russell 1000 Growth Index
|
18.81
|
12.76
|
16.77
|
For current month-end performance, please call Franklin Templeton at (800) DIAL BEN/342-5236 or visit
https://www.franklintempleton.com/investments/options/exchange-traded-funds.
https://www.franklintempleton.com/investments/options/exchange-traded-funds.
Important data provider notices and terms available at www.franklintempletondatasources.com.
KEY FUND STATISTICS (as of March 31, 2026)
|
Total Net Assets
|
$207,097,867
|
|
Total Number of Portfolio Holdings
|
41
|
|
Total Management Fee Paid (based on a unitary fee)
|
$970,658
|
|
Portfolio Turnover Rate
|
37%
|
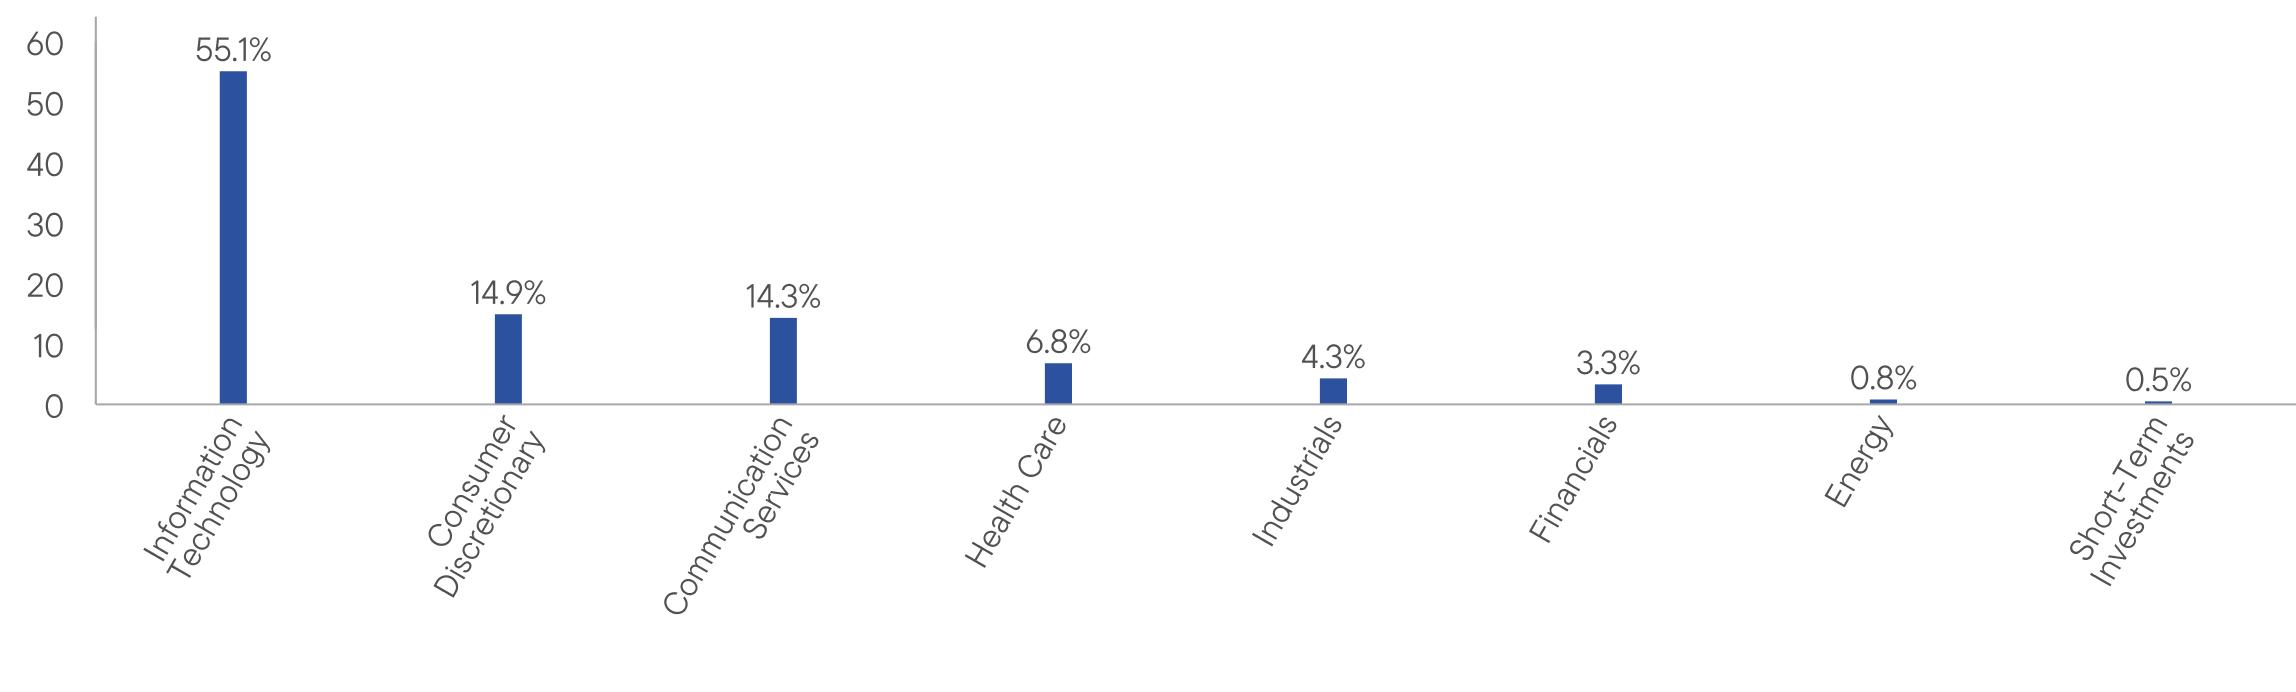
WHAT DID THE FUND INVEST IN? (as of March 31, 2026)
Portfolio Composition* (% of Total Investments)
WHAT WERE THE FUND COSTS FOR THE LAST YEAR? (based on a hypothetical $10,000 investment)
|
Fund Name
|
Costs of a $10,000 investment
|
Costs paid as a percentage of a $10,000 investment
|
|
Franklin Genomic Advancements ETF
|
$56
|
0.50%
|
HOW DID THE FUND PERFORM LAST YEAR AND WHAT AFFECTED ITS PERFORMANCE?
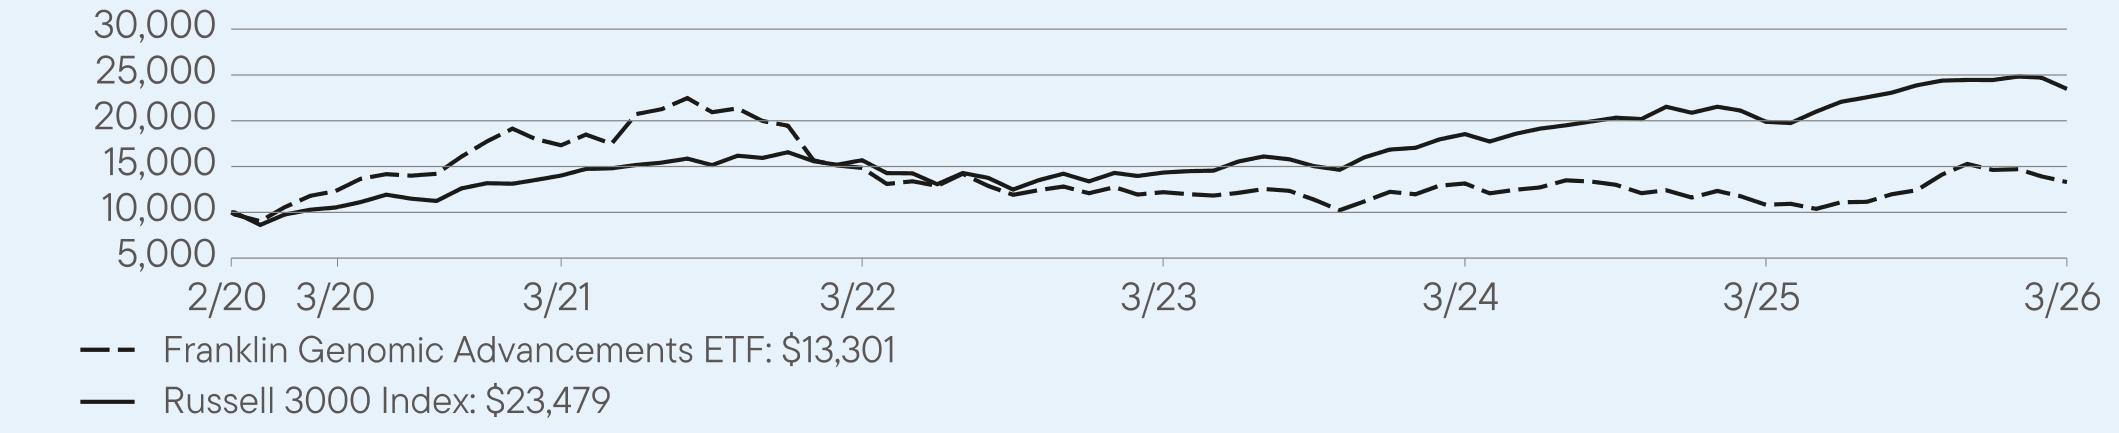
For the twelve months ended March 31, 2026, Franklin Genomic Advancements ETF returned 22.84%. The Fund compares its performance to the Russell 3000 Index, which returned 18.09% for the same period.
PERFORMANCE HIGHLIGHTS
|
Top contributors to performance:
|
|
|
↑
|
Biotechnology and pharmaceuticals stocks, led by key absolute contributors Insmed, United Therapeutics, Natera, BridgeBio Pharma, Exact Sciences (sold by period-end), Alnylam Pharmaceuticals, Ligand Pharmaceuticals and AstraZeneca. In general, both industries rallied on a combination of renewed investor appetite for defensive growth, strong drug pipelines, regulatory approvals, and company-specific drug development successes.
|
|
↑
|
To a lesser extent, select health care services stocks contributed to absolute performance such as Guardant Health, which more than doubled in value; and life sciences tools and services industry stocks such as Medpace Holdings and Adaptive Biotechnologies.
|
|
↑
|
A solitary position in the fertilizers and agricultural chemicals industry also contributed to absolute performance, where a major agricultural biotech company that provides genetically engineered crop seeds, conventional and hybrid (non-GMO) seeds, crop protection products and digital farming solutions rallied strongly. The company made progress using artificial intelligence across its operations, applying it to existing genetic modification and gene editing (e.g., CRISPR) tools and techniques alongside traditional breeding methods.
|
|
Top detractors from performance:
|
|
|
↓
|
Health care technology industry holdings detracted from absolute performance, where Doximity was a standout detractor. The Fund eliminated positions in all three related stocks by period-end.
|
|
↓
|
Mixed results in the biotech industry, where overall gains were reduced by a host of absolute detractors, including Vertex Pharmaceuticals, Ultragenyx Pharmaceutical, Sarepta Therapeutics (sold by period-end), BioMarin Pharmaceutical (sold by period-end), Recursion Pharmaceuticals and Twist Bioscience.
|
|
↓
|
Mixed results in the health care services industry, where the downside was anchored by a substantial selloff in GeneDx Holdings, a genomic testing company specializing in genetic diagnostics for rare diseases and inherited conditions. The company’s ongoing losses, cash burn, reimbursement and pricing pressures in genetic testing, and uncertainty around the pace of revenue growth and path to sustained profitability weighed on sentiment and detracted from absolute performance.
|
AVERAGE ANNUAL TOTAL RETURNS (%) Period Ended March 31, 2026
|
|
1 Year
|
5 Year
|
Since Inception
(2/25/2020) |
|
Franklin Genomic Advancements ETF (NAV)
|
22.84
|
-5.15
|
4.79
|
|
Russell 3000 Index
|
18.09
|
10.87
|
13.94
|
For current month-end performance, please call Franklin Templeton at (800) DIAL BEN/342-5236 or visit
https://www.franklintempleton.com/investments/options/exchange-traded-funds.
https://www.franklintempleton.com/investments/options/exchange-traded-funds.
Important data provider notices and terms available at www.franklintempletondatasources.com.
KEY FUND STATISTICS (as of March 31, 2026)
|
Total Net Assets
|
$21,448,484
|
|
Total Number of Portfolio Holdings
|
61
|
|
Total Management Fee Paid (based on a unitary fee)
|
$85,277
|
|
Portfolio Turnover Rate
|
29%
|
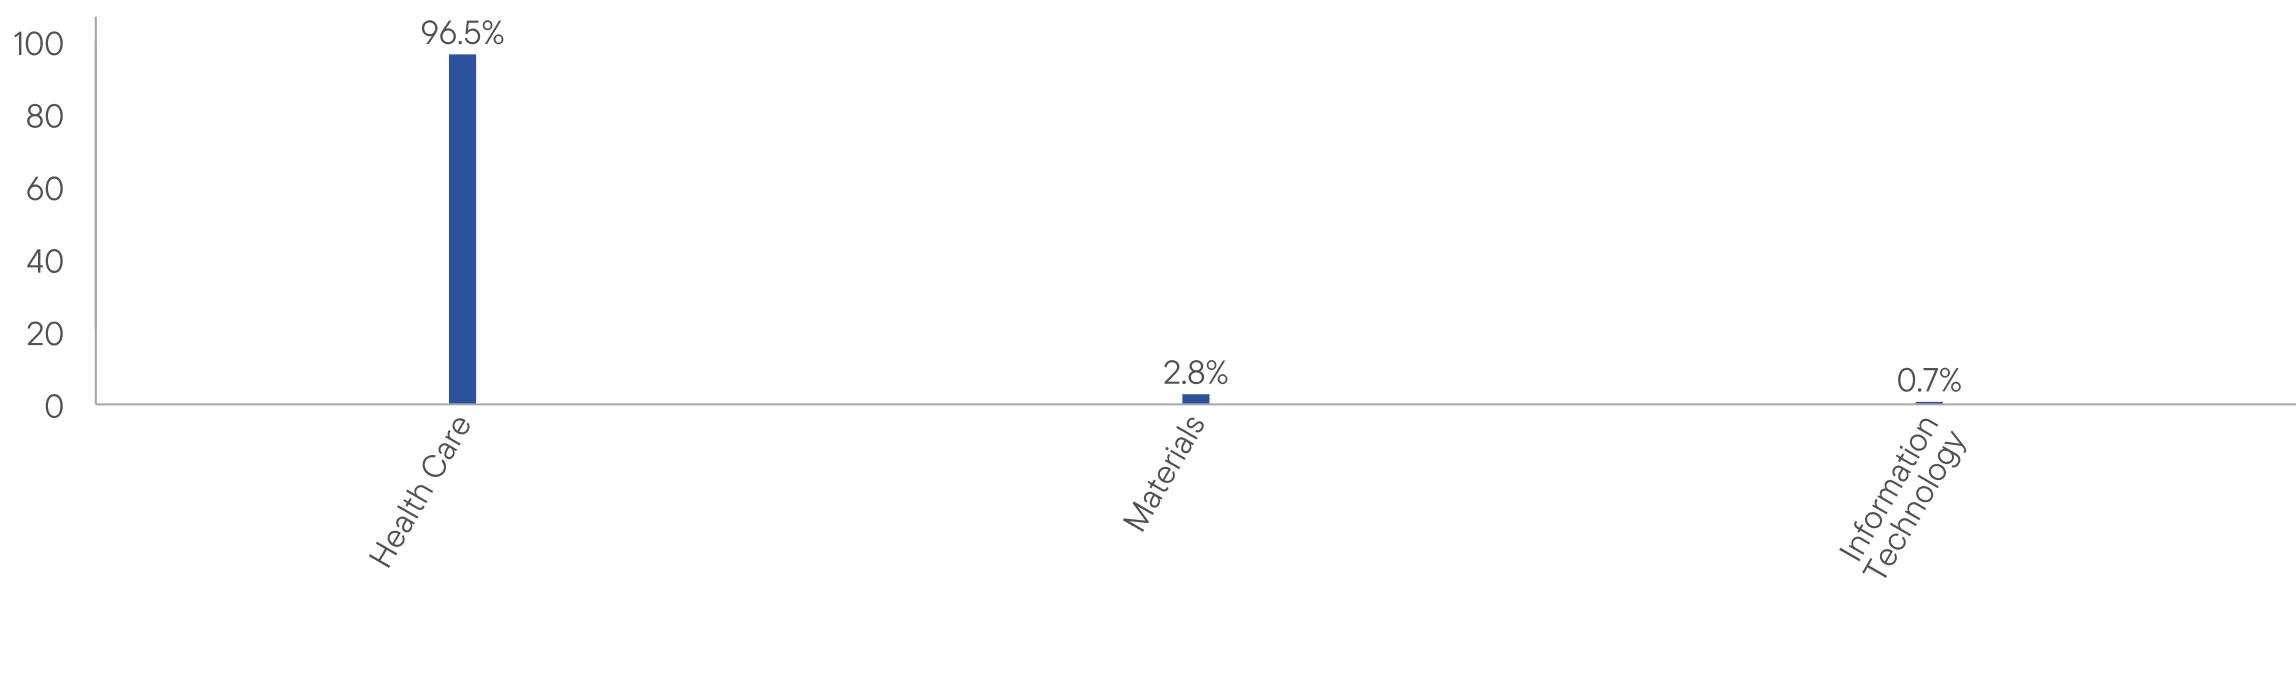
WHAT DID THE FUND INVEST IN? (as of March 31, 2026)
Portfolio Composition* (% of Total Investments)
WHAT WERE THE FUND COSTS FOR THE LAST YEAR? (based on a hypothetical $10,000 investment)
|
Fund Name
|
Costs of a $10,000 investment
|
Costs paid as a percentage of a $10,000 investment*
|
|
Franklin High Yield Corporate ETF
|
$42
|
0.40%
|
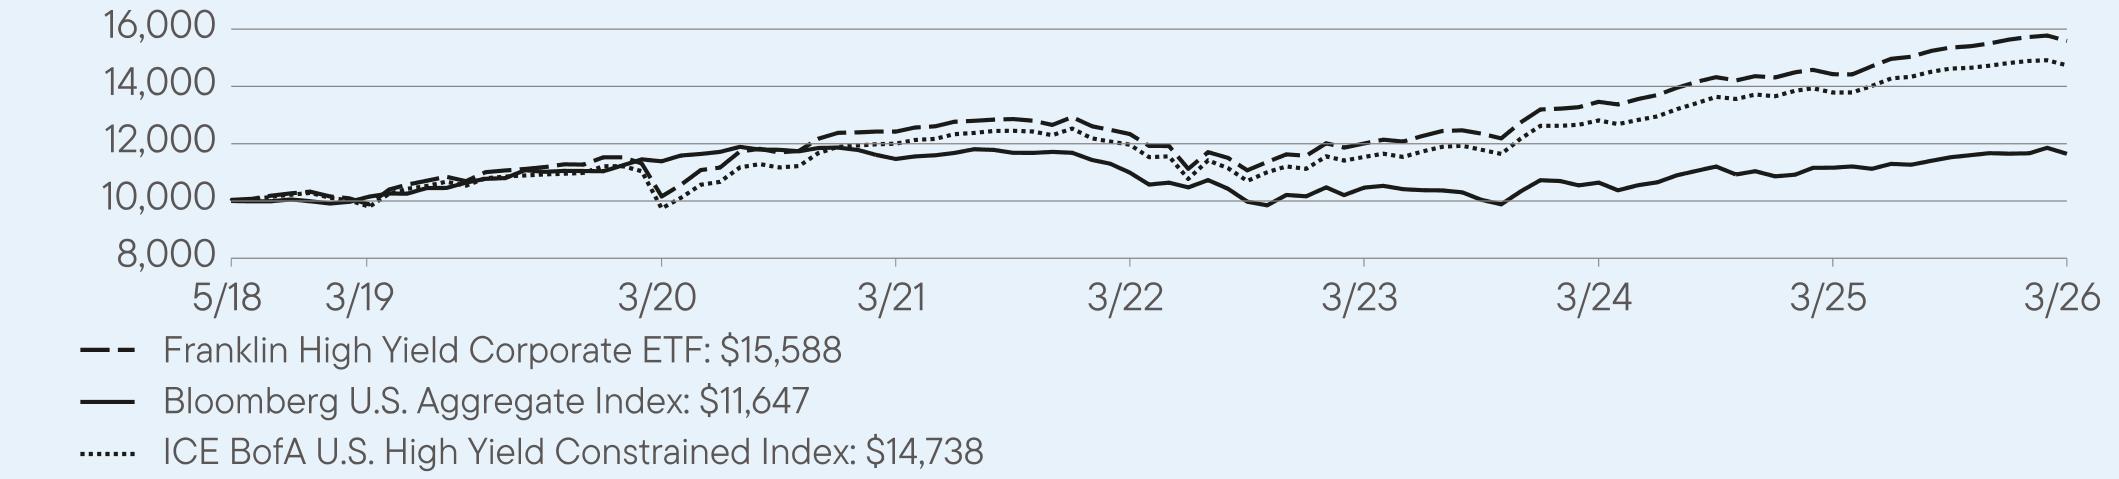
HOW DID THE FUND PERFORM LAST YEAR AND WHAT AFFECTED ITS PERFORMANCE?
For the twelve months ended March 31, 2026, Franklin High Yield Corporate ETF returned 8.05%. The Fund compares its performance to the ICE BofA U.S. High Yield Constrained Index, which returned 6.90% for the same period.
PERFORMANCE HIGHLIGHTS
|
Top contributors to performance:
|
|
|
↑
|
Security selection in the energy sector
|
|
↑
|
Ratings-quality tilt, primarily favoring Ca, C and Ba-rated bonds
|
|
↑
|
security selection in the technology sector
|
|
Top detractors from performance:
|
|
|
↓
|
Security selection in the chemicals sector
|
|
↓
|
Underweight positioning and security selection in the wired sector
|
|
↓
|
Yield curve positioning
|
AVERAGE ANNUAL TOTAL RETURNS (%) Period Ended March 31, 2026
|
|
1 Year
|
5 Year
|
Since Inception
(5/30/2018) |
|
Franklin High Yield Corporate ETF (NAV)
|
8.05
|
4.64
|
5.83
|
|
Bloomberg U.S. Aggregate Index
|
4.35
|
0.31
|
1.98
|
|
ICE BofA U.S. High Yield Constrained Index
|
6.90
|
4.20
|
5.09
|
For current month-end performance, please call Franklin Templeton at (800) DIAL BEN/342-5236 or visit
https://www.franklintempleton.com/investments/options/exchange-traded-funds.
https://www.franklintempleton.com/investments/options/exchange-traded-funds.
Important data provider notices and terms available at www.franklintempletondatasources.com.
KEY FUND STATISTICS (as of March 31, 2026)
|
Total Net Assets
|
$867,461,452
|
|
Total Number of Portfolio Holdings
|
268
|
|
Total Management Fee Paid (based on a unitary fee)
|
$2,685,741
|
|
Portfolio Turnover Rate
|
36%
|
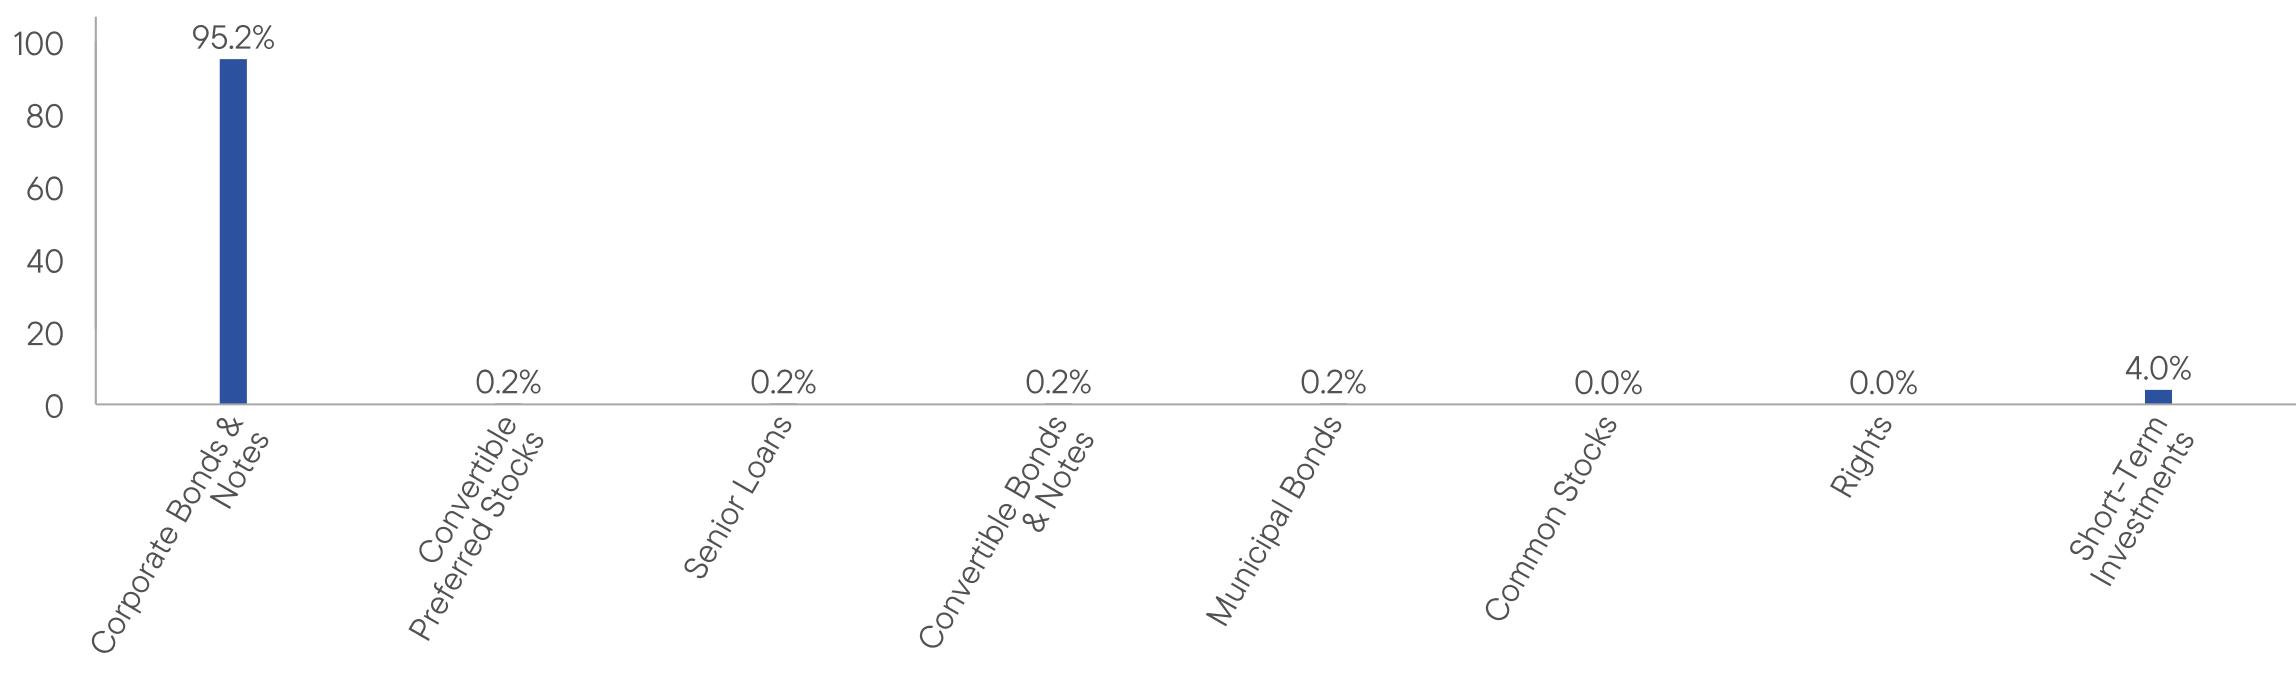
WHAT DID THE FUND INVEST IN? (as of March 31, 2026)
Portfolio Composition*,† (% of Total Investments)
WHAT WERE THE FUND COSTS FOR THE LAST YEAR? (based on a hypothetical $10,000 investment)
|
Fund Name
|
Costs of a $10,000 investment
|
Costs paid as a percentage of a $10,000 investment*
|
|
Franklin Income Equity Focus ETF
|
$32
|
0.29%
|
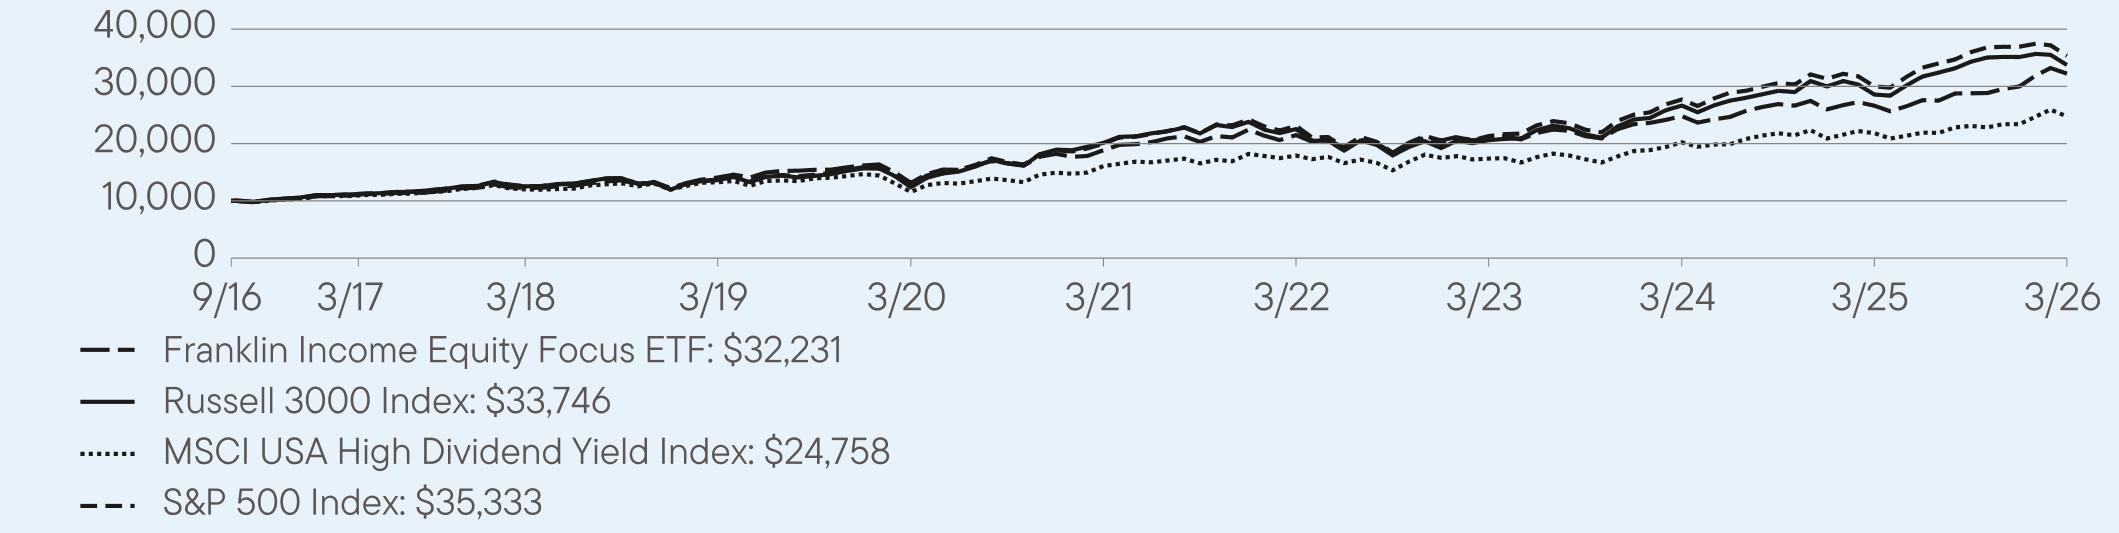
HOW DID THE FUND PERFORM LAST YEAR AND WHAT AFFECTED ITS PERFORMANCE?
For the twelve months ended March 31, 2026, Franklin Income Equity Focus ETF returned 21.01%. The Fund compares its performance to the MSCI USA High Dividend Yield Index and the S&P 500 Index, which returned 13.33% and 17.80%, respectively, for the same period.
PERFORMANCE HIGHLIGHTS
|
Top contributors to performance:
|
|
|
↑
|
Information technology (IT), industrials, and materials sectors led absolute performance during the period.
|
|
↑
|
On an individual issuer basis, returns were driven by Albemarle, Exxon Mobil, and Analog Devices.
|
|
↑
|
Relative returns benefited from stock selection within the materials and IT sectors, in addition to selection and an underweight allocation among health care securities.
|
|
Top detractors from performance:
|
|
|
↓
|
Within the Fund’s equity allocation, returns were hindered by the consumer discretionary sector.
|
|
↓
|
UnitedHealth Group, Procter & Gamble, and Comcast were among the Fund’s leading detractors.
|
|
↓
|
Stock selection and underweight positioning within the energy sector weakened relative performance.
|
AVERAGE ANNUAL TOTAL RETURNS (%) Period Ended March 31, 2026
|
|
1 Year
|
5 Year
|
Since Inception
(9/20/2016) |
|
Franklin Income Equity Focus ETF (NAV)
|
21.01
|
11.31
|
13.07
|
|
Russell 3000 Index
|
18.09
|
10.87
|
13.79
|
|
MSCI USA High Dividend Yield Index
|
13.33
|
9.00
|
10.15
|
|
S&P 500 Index
|
17.80
|
12.07
|
14.33
|
For current month-end performance, please call Franklin Templeton at (800) DIAL BEN/342-5236 or visit
https://www.franklintempleton.com/investments/options/exchange-traded-funds.
https://www.franklintempleton.com/investments/options/exchange-traded-funds.
Important data provider notices and terms available at www.franklintempletondatasources.com.
KEY FUND STATISTICS (as of March 31, 2026)
|
Total Net Assets
|
$113,154,213
|
|
Total Number of Portfolio Holdings
|
47
|
|
Total Management Fee Paid (based on a unitary fee)
|
$290,203
|
|
Portfolio Turnover Rate
|
69%
|
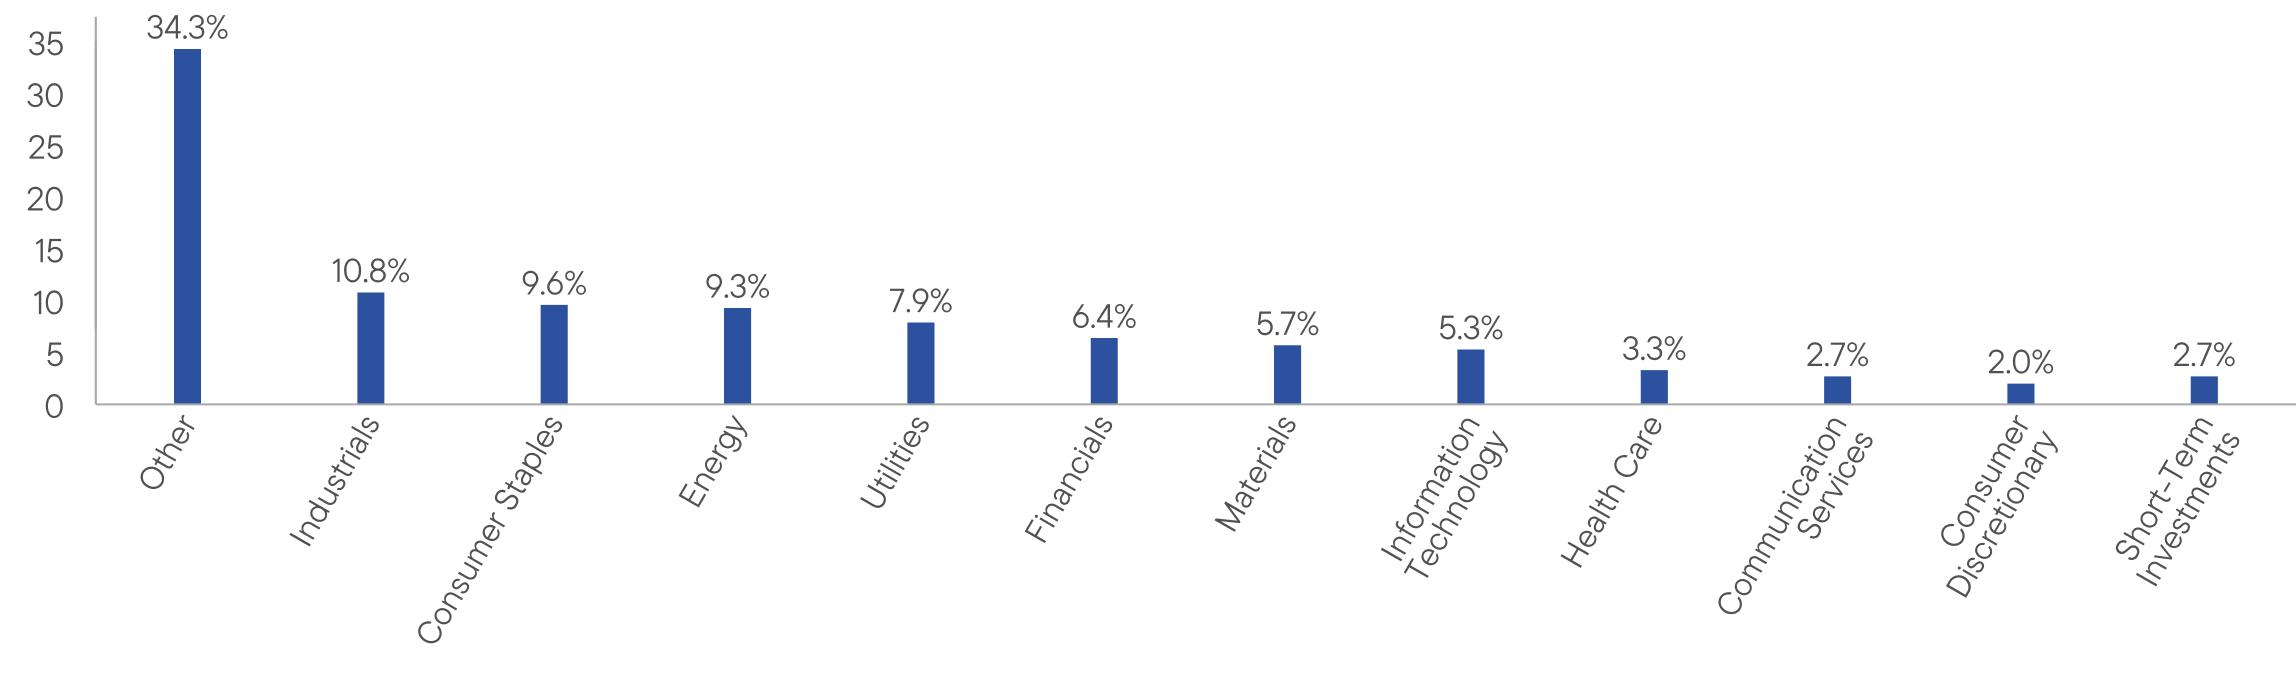
WHAT DID THE FUND INVEST IN? (as of March 31, 2026)
Portfolio Composition* (% of Total Investments)
WHAT WERE THE FUND COSTS FOR THE LAST YEAR? (based on a hypothetical $10,000 investment)
|
Fund Name
|
Costs of a $10,000 investment
|
Costs paid as a percentage of a $10,000 investment*
|
|
Franklin Income Focus ETF
|
$40
|
0.37%
|
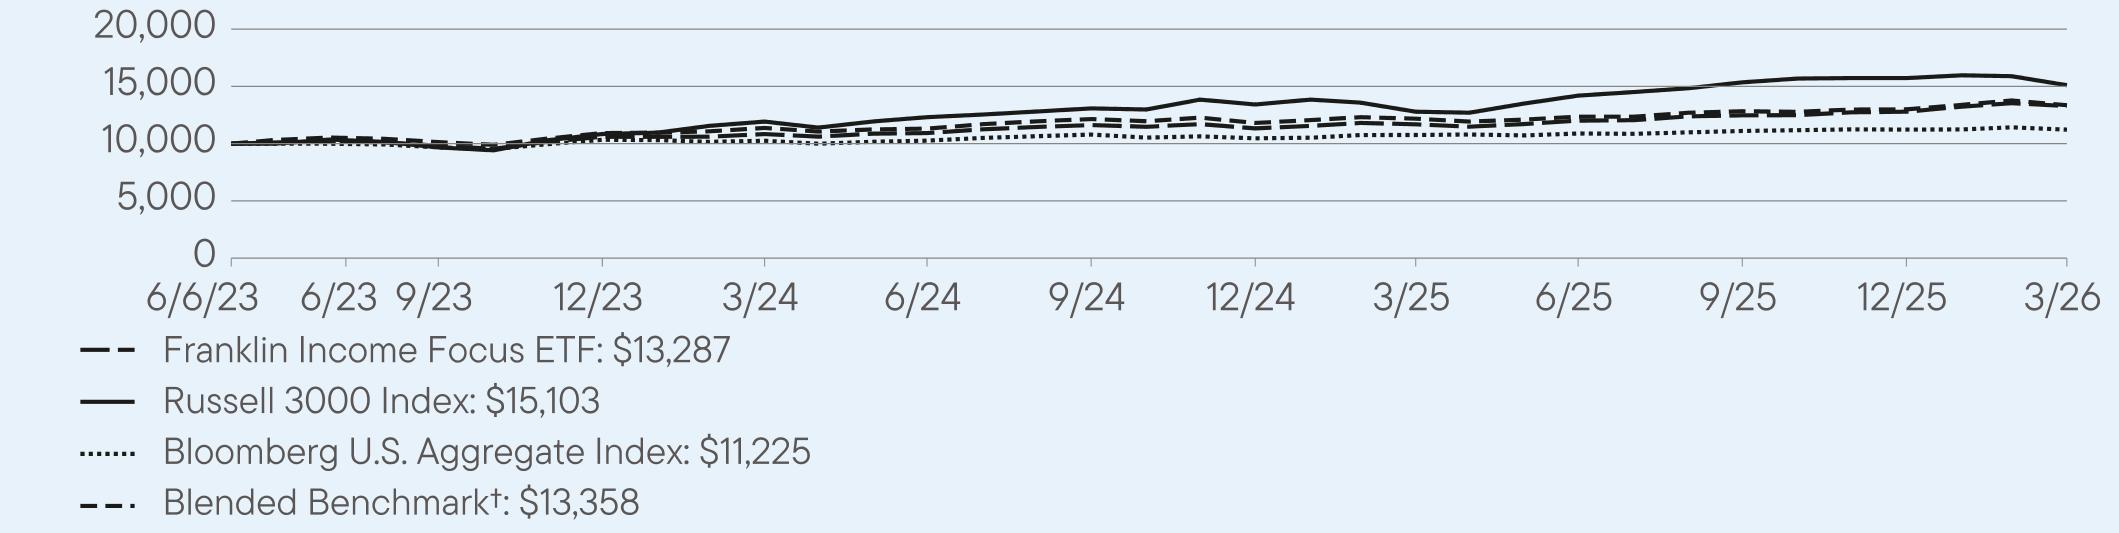
HOW DID THE FUND PERFORM LAST YEAR AND WHAT AFFECTED ITS PERFORMANCE?
For the twelve months ended March 31, 2026, Franklin Income Focus ETF returned 13.65%. The Fund compares its performance to the Blended Benchmark†, which returned 9.65% for the same period.
PERFORMANCE HIGHLIGHTS
|
Top contributors to performance:
|
|
|
↑
|
The health care, industrials, and consumer discretionary sectors led absolute fixed income performance. Community Health Systems was a top contributor within health care, while U.S. Treasuries (USTs) and Venture Global Partners II also assisted returns during the period.
|
|
↑
|
Among equities, returns were driven by the materials, industrials, and energy sectors. On an individual issuer basis, Albemarle, Johnson & Johnson, and Exxon Mobil added value.
|
|
↑
|
Underweight fixed income allocation to USTs and security selection among industrials assisted relative results. Meanwhile, equity returns benefited from selection within the materials and financials sectors.
|
|
Top detractors from performance:
|
|
|
↓
|
Among the Fund’s fixed income allocation, Coreweave was a slight detractor within the information technology (IT) sector.
|
|
↓
|
Consumer discretionary stocks modestly weighed on equity performance during the period. By issuer, Procter & Gamble, Qualcomm, and Accenture hindered results.
|
|
↓
|
Relative fixed income returns were weakened by selection within the health care sector. As for equities, selection among energy stocks and an overweight allocation to the IT sector detracted from relative returns.
|
Use of derivatives and the impact on performance:
The Fund utilized equity-linked notes to generate investment income for the portfolio while maintaining prospects for capital appreciation, as well as equity call and put options to sell and reduce positions and/or initiate and add to positions. In aggregate, these derivatives contributed to performance.
AVERAGE ANNUAL TOTAL RETURNS (%) Period Ended March 31, 2026
|
|
1 Year
|
Since Inception
(6/6/2023) |
|
Franklin Income Focus ETF (NAV)
|
13.65
|
10.61
|
|
Russell 3000 Index
|
18.09
|
17.32
|
|
Bloomberg U.S. Aggregate Index
|
4.35
|
4.22
|
|
Blended Benchmark†
|
9.65
|
10.32
|
For current month-end performance, please call Franklin Templeton at (800) DIAL BEN/342-5236 or visit
https://www.franklintempleton.com/investments/options/exchange-traded-funds.
https://www.franklintempleton.com/investments/options/exchange-traded-funds.
Important data provider notices and terms available at www.franklintempletondatasources.com.
KEY FUND STATISTICS (as of March 31, 2026)
|
Total Net Assets
|
$1,370,474,881
|
|
Total Number of Portfolio Holdings
|
301
|
|
Total Management Fee Paid (based on a unitary fee)
|
$3,368,092
|
|
Portfolio Turnover Rate
|
42%
|
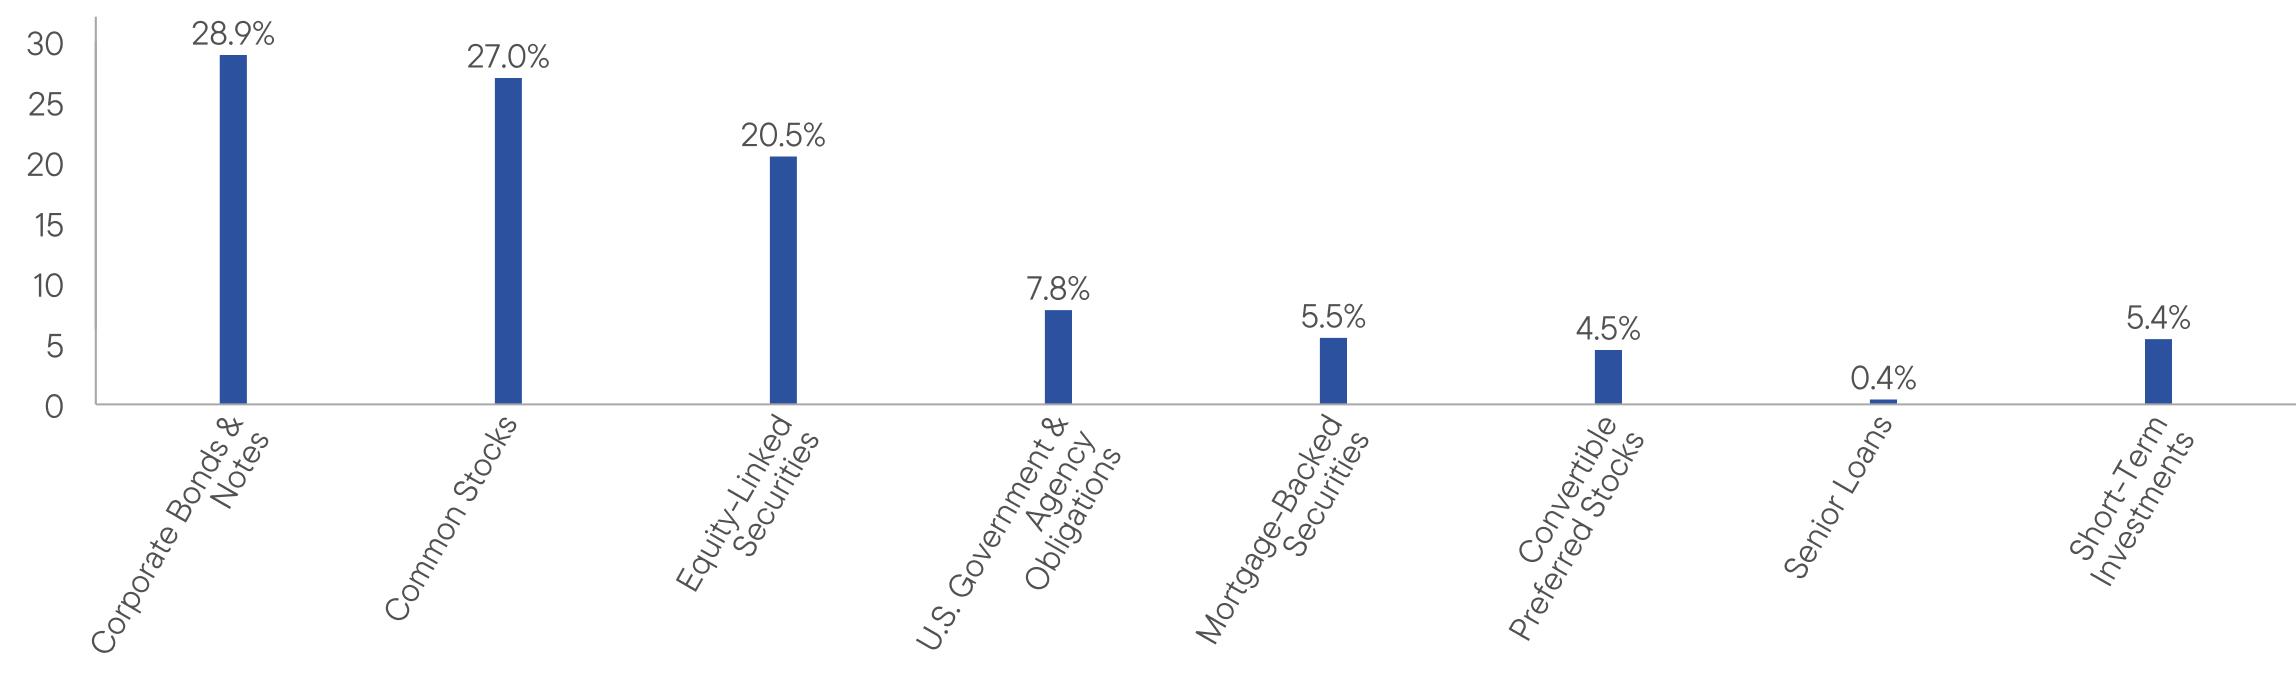
WHAT DID THE FUND INVEST IN? (as of March 31, 2026)
Portfolio Composition* (% of Total Investments)
WHAT WERE THE FUND COSTS FOR THE LAST YEAR? (based on a hypothetical $10,000 investment)
|
Fund Name
|
Costs of a $10,000 investment
|
Costs paid as a percentage of a $10,000 investment
|
|
Franklin Intelligent Machines ETF
|
$64
|
0.50%
|
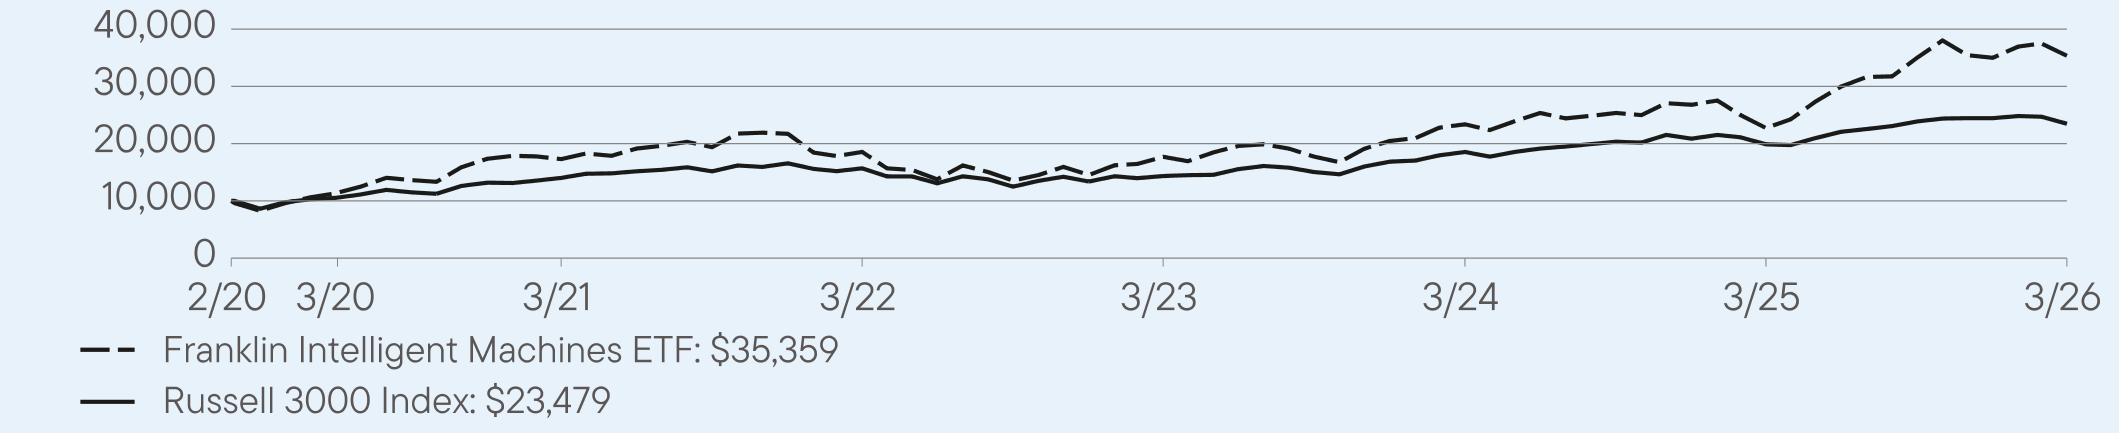
HOW DID THE FUND PERFORM LAST YEAR AND WHAT AFFECTED ITS PERFORMANCE?
For the twelve months ended March 31, 2026, Franklin Intelligent Machines ETF returned 55.55%. The Fund compares its performance to the Russell 3000 Index, which returned 18.09% for the same period.
PERFORMANCE HIGHLIGHTS
|
Top contributors to performance:
|
|
|
↑
|
Widespread absolute gains across 17 out of 19 industry allocations, led by semiconductor and semiconductor equipment stocks such as NVIDIA, Broadcom, Taiwan Semiconductor Manufacturing and Teradyne. Teradyne and several other semiconductor holdings more than doubled in value on surging demand tied to artificial intelligence (AI) and data center buildouts, easing inventory corrections, and expectations of improving end-market growth.
|
|
↑
|
Most of the holdings in the electrical equipment; and electronic equipment, instruments and components industries rallied along with semiconductor stocks amid the spike in global data center and power demand for large AI and cloud computing infrastructure projects. When combined, electrical equipment stocks rose more than 200%, led by key absolute contributors GE Vernova, while Celestica and Amphenol contributed to an absolute gain of more than 100% among makers of electronic instruments and components.
|
|
↑
|
High-tech construction and engineering firms like Quanta Services added solidly to overall absolute gains, as did aerospace and defense holdings such as Kratos Defense & Security Solutions. Select automobile and component companies also posted strong absolute gains, including electric vehicle (EV) manufacturer Tesla, which also benefited from rising demand for its battery storage and solar solutions.
|
|
Top detractors from performance:
|
|
|
↓
|
Most of the key individual detractors reduced overall absolute gains in the information technology (IT) sector and were not held for the entire period under review. These included newly purchased positions in SK Hynix and Advantest in semiconductors; Coherent in electronic equipment, instruments and components; Everpure in technology hardware, storage and peripherals; and both CoreWeave and Cloudflare in IT services, all of which had been viewed as opportunities for the longer term.
|
|
↓
|
The Fund also eliminated a few holdings that fell sharply, including key absolute detractors Oracle (bought and sold during the period), and Aurora Innovation.
|
|
↓
|
In the automobiles industry, BYD (purchased during the period) was the sole absolute detractor. Shares of BYD, a Chinese manufacturer of EVs, batteries, and renewable energy equipment, declined as intensifying EV price competition in China pressured margins, while slowing demand growth and investor concerns about profitability weighed on sentiment.
|
AVERAGE ANNUAL TOTAL RETURNS (%) Period Ended March 31, 2026
|
|
1 Year
|
5 Year
|
Since Inception
(2/25/2020) |
|
Franklin Intelligent Machines ETF (NAV)
|
55.55
|
15.37
|
23.02
|
|
Russell 3000 Index
|
18.09
|
10.87
|
13.94
|
For current month-end performance, please call Franklin Templeton at (800) DIAL BEN/342-5236 or visit
https://www.franklintempleton.com/investments/options/exchange-traded-funds.
https://www.franklintempleton.com/investments/options/exchange-traded-funds.
Important data provider notices and terms available at www.franklintempletondatasources.com.
KEY FUND STATISTICS (as of March 31, 2026)
|
Total Net Assets
|
$74,997,207
|
|
Total Number of Portfolio Holdings
|
86
|
|
Total Management Fee Paid (based on a unitary fee)
|
$246,412
|
|
Portfolio Turnover Rate
|
33%
|
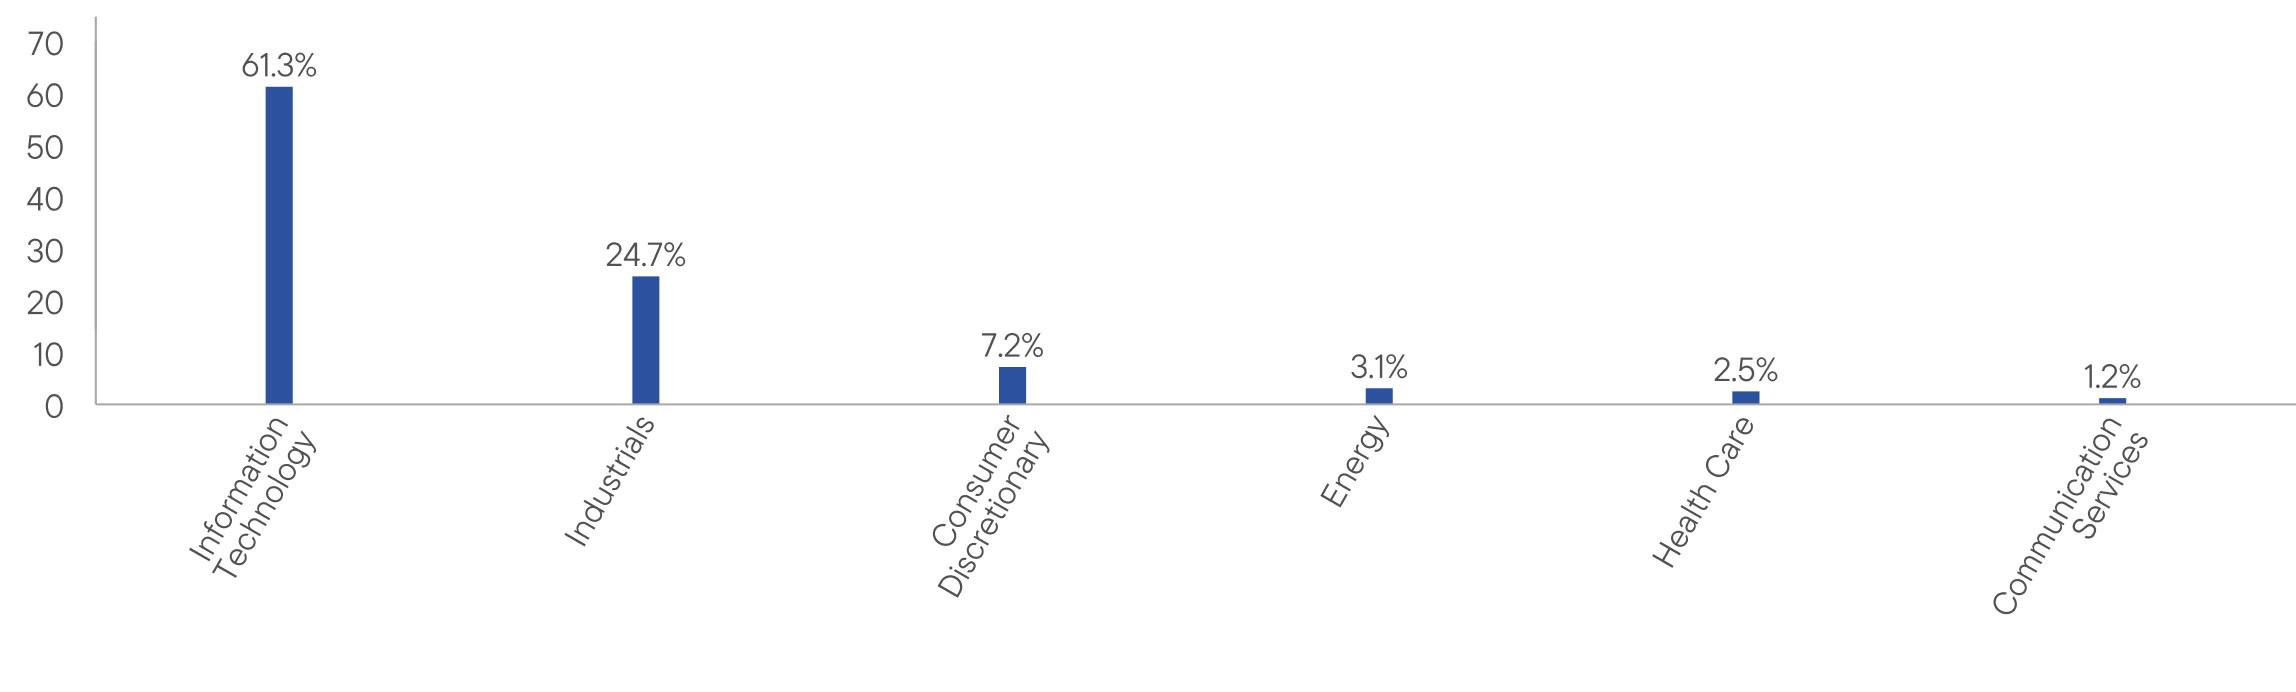
WHAT DID THE FUND INVEST IN? (as of March 31, 2026)
Portfolio Composition* (% of Total Investments)
This report describes changes to the Fund that occurred during the reporting period.
WHAT WERE THE FUND COSTS FOR THE LAST YEAR? (based on a hypothetical $10,000 investment)
|
Fund Name
|
Costs of a $10,000 investment
|
Costs paid as a percentage of a $10,000 investment*
|
|
Franklin International Aggregate Bond ETF
|
$25
|
0.25%
|
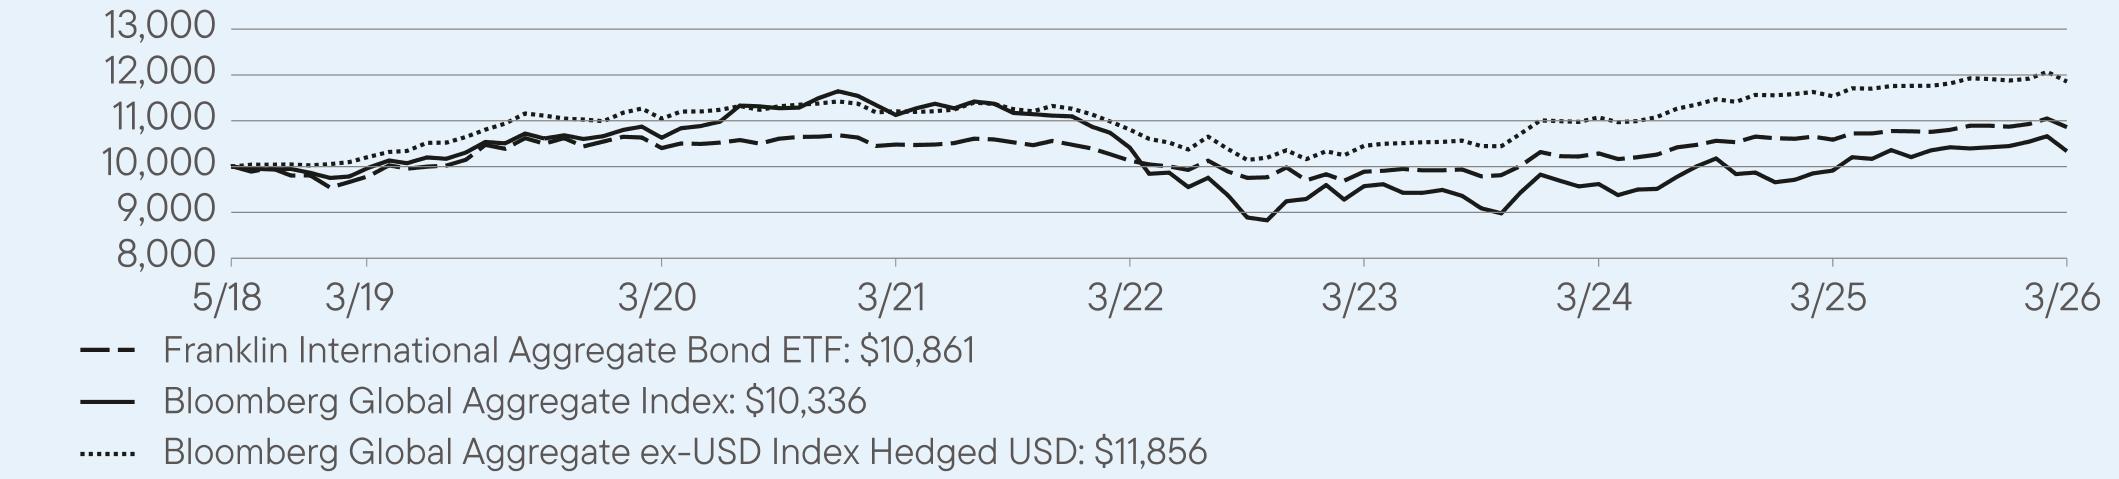
HOW DID THE FUND PERFORM LAST YEAR AND WHAT AFFECTED ITS PERFORMANCE?
For the twelve months ended March 31, 2026, Franklin International Aggregate Bond ETF returned 2.58%. The Fund compares its performance to the Bloomberg Global Aggregate ex-USD Index Hedged USD, which returned 2.77% for the same period.
PERFORMANCE HIGHLIGHTS
|
Top contributors to performance:
|
|
|
↑
|
Duration positioning in Japanese bonds
|
|
↑
|
Duration positioning in South Korean bonds
|
|
↑
|
Security selection in Italian government bonds
|
|
Top detractors from performance:
|
|
|
↓
|
Duration positioning in eurozone bonds
|
|
↓
|
U.S. market positioning
|
|
↓
|
Underweight allocation to the eurozone market
|
Use of derivatives and the impact on performance:
The Fund utilized currency forwards to hedge the portfolio, as it is benchmarked against a U.S.-dollar-hedged index, which detracted from performance.
AVERAGE ANNUAL TOTAL RETURNS (%) Period Ended March 31, 2026
|
|
1 Year
|
5 Year
|
Since Inception
(5/30/2018) |
|
Franklin International Aggregate Bond ETF (NAV)
|
2.58
|
0.72
|
1.06
|
|
Bloomberg Global Aggregate Index
|
4.26
|
-1.46
|
0.46
|
|
Bloomberg Global Aggregate ex-USD Index Hedged USD
|
2.77
|
1.13
|
2.22
|
For current month-end performance, please call Franklin Templeton at (800) DIAL BEN/342-5236 or visit
https://www.franklintempleton.com/investments/options/exchange-traded-funds.
https://www.franklintempleton.com/investments/options/exchange-traded-funds.
Important data provider notices and terms available at www.franklintempletondatasources.com.
KEY FUND STATISTICS (as of March 31, 2026)
|
Total Net Assets
|
$716,193,587
|
|
Total Number of Portfolio Holdings (excludes derivatives, except purchased options, if any)
|
59
|
|
Total Management Fee Paid (based on a unitary fee)
|
$1,664,069
|
|
Portfolio Turnover Rate
|
32%
|
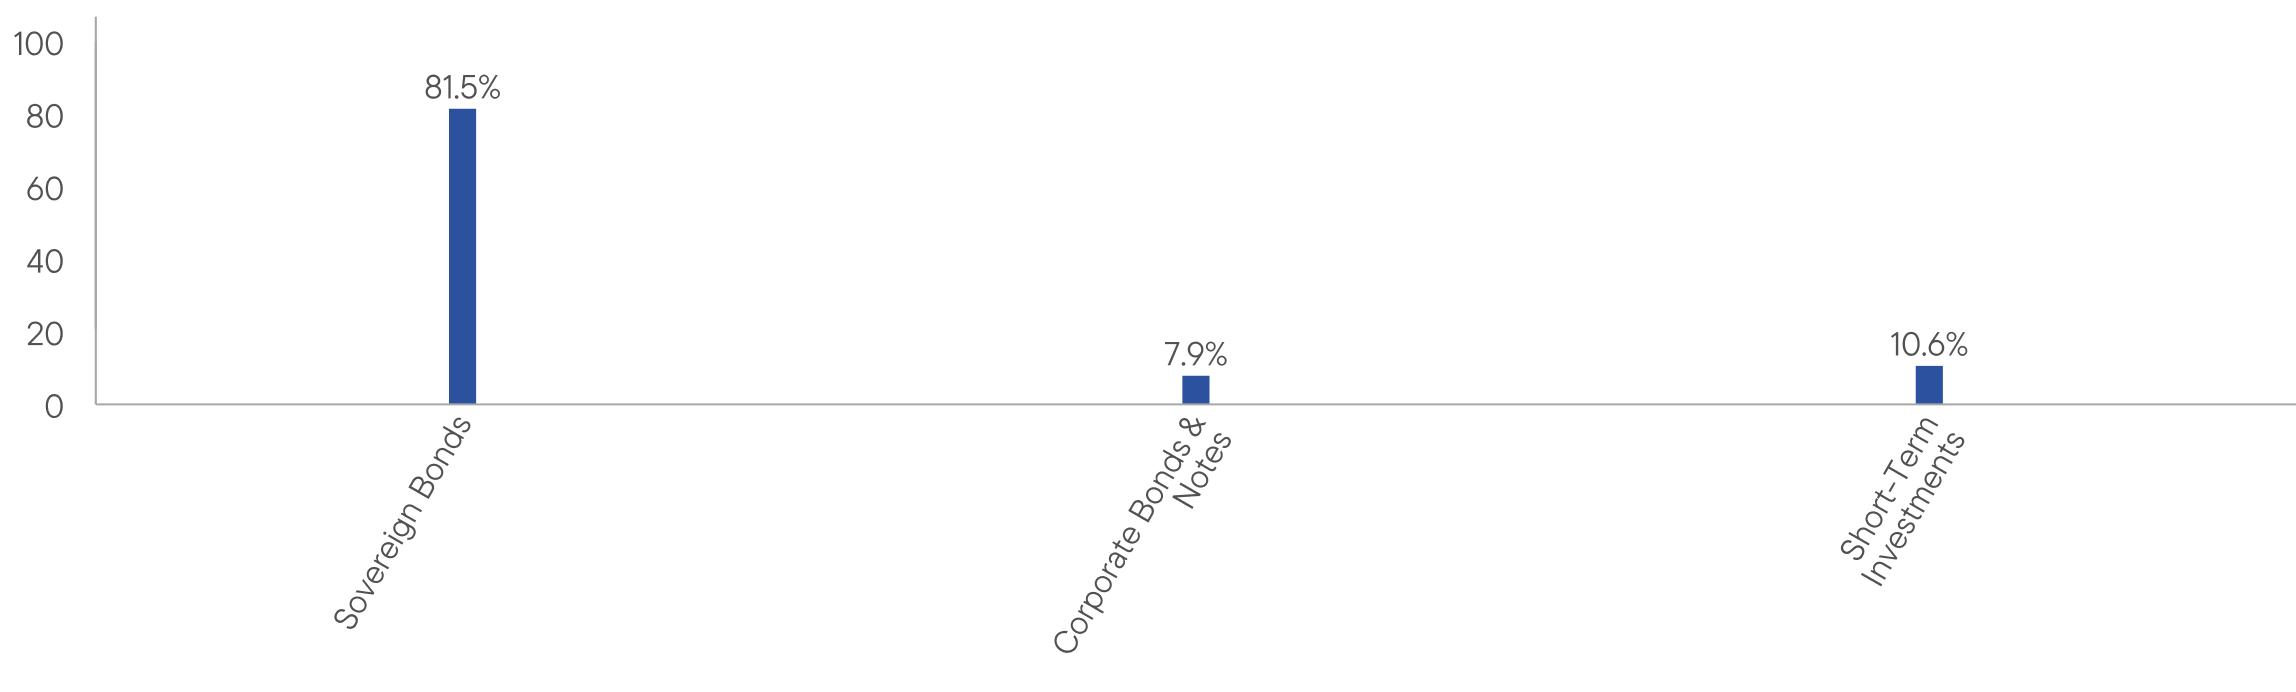
WHAT DID THE FUND INVEST IN? (as of March 31, 2026)
Portfolio Composition* (% of Total Investments)
HOW HAS THE FUND CHANGED?
Effective February 26, 2026, Sameer Kackar, CFA and Michael V. Salm were added as portfolio managers of the Fund.
This is a summary of certain changes to the Fund since April 1, 2025. For more complete information, you may review the Fund’s current prospectus and the Fund’s next prospectus, which we expect to be available by August 1, 2026, at https://www.franklintempleton.com/regulatory-fund-documents or upon request at (800) DIAL BEN/342-5236 or ETFs-Product@franklintempleton.com.
WHAT WERE THE FUND COSTS FOR THE LAST YEAR? (based on a hypothetical $10,000 investment)
|
Fund Name
|
Costs of a $10,000 investment
|
Costs paid as a percentage of a $10,000 investment*
|
|
Franklin Investment Grade Corporate ETF
|
$36
|
0.35%
|
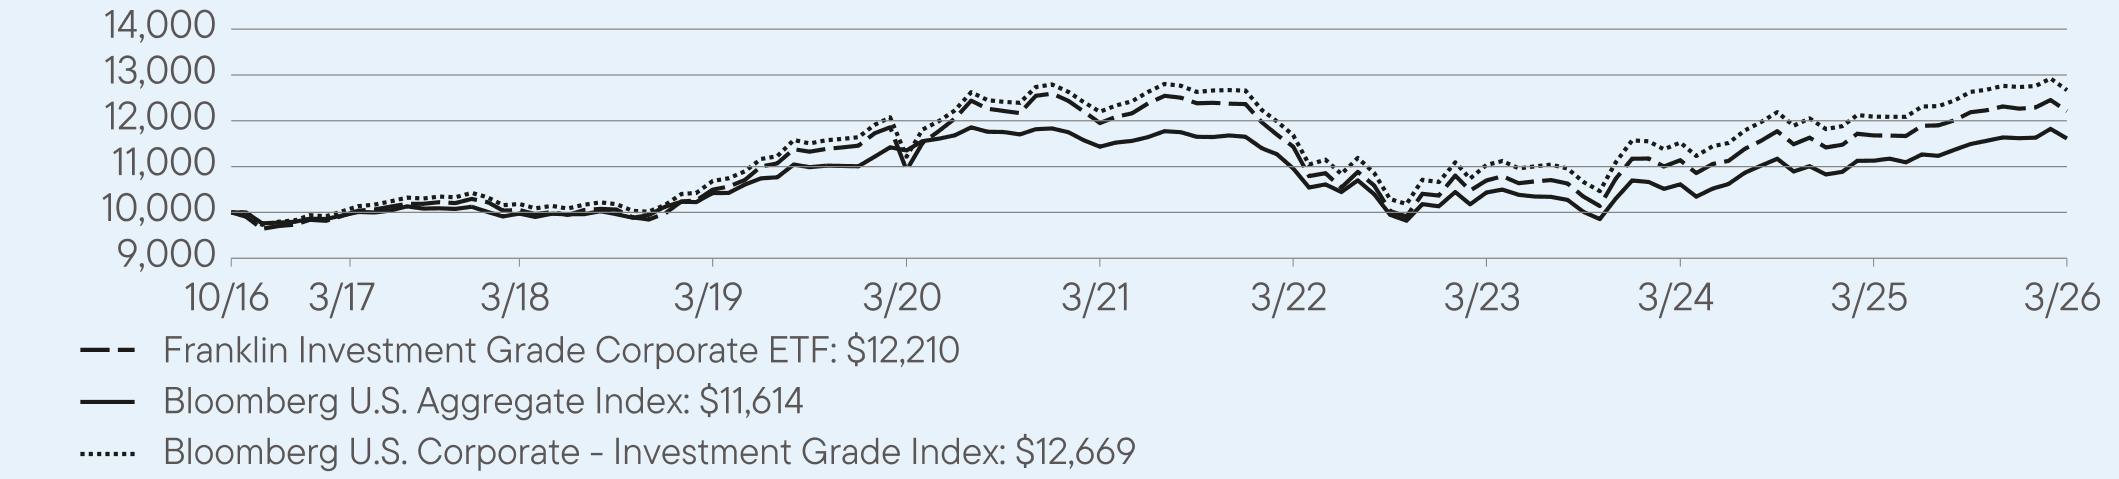
HOW DID THE FUND PERFORM LAST YEAR AND WHAT AFFECTED ITS PERFORMANCE?
For the twelve months ended March 31, 2026, Franklin Investment Grade Corporate ETF returned 4.53%. The Fund compares itsperformance to the Bloomberg U.S. Corporate - Investment Grade Index, which returned 4.78% for the same period.
PERFORMANCE HIGHLIGHTS
|
Top contributors to performance:
|
|
|
↑
|
Selection in the capital goods sector
|
|
↑
|
Selection in the communications sector
|
|
↑
|
Underweight allocation to the technology sector
|
|
Top detractors from performance:
|
|
|
↓
|
Selection in the banking sector
|
|
↓
|
Underweight allocation to the energy sector
|
|
↓
|
Overweight allocation to U.S. Treasuries
|
AVERAGE ANNUAL TOTAL RETURNS (%) Period Ended March 31, 2026
|
|
1 Year
|
5 Year
|
Since Inception
(10/3/2016) |
|
Franklin Investment Grade Corporate ETF (NAV)
|
4.53
|
0.43
|
2.13
|
|
Bloomberg U.S. Aggregate Index
|
4.35
|
0.31
|
1.51
|
|
Bloomberg U.S. Corporate - Investment Grade Index
|
4.78
|
0.76
|
2.44
|
For current month-end performance, please call Franklin Templeton at (800) DIAL BEN/342-5236 or visit
https://www.franklintempleton.com/investments/options/exchange-traded-funds.
https://www.franklintempleton.com/investments/options/exchange-traded-funds.
Important data provider notices and terms available at www.franklintempletondatasources.com.
KEY FUND STATISTICS (as of March 31, 2026)
|
Total Net Assets
|
$590,819,176
|
|
Total Number of Portfolio Holdings
|
225
|
|
Total Management Fee Paid (based on a unitary fee)
|
$2,042,957
|
|
Portfolio Turnover Rate
|
32%
|
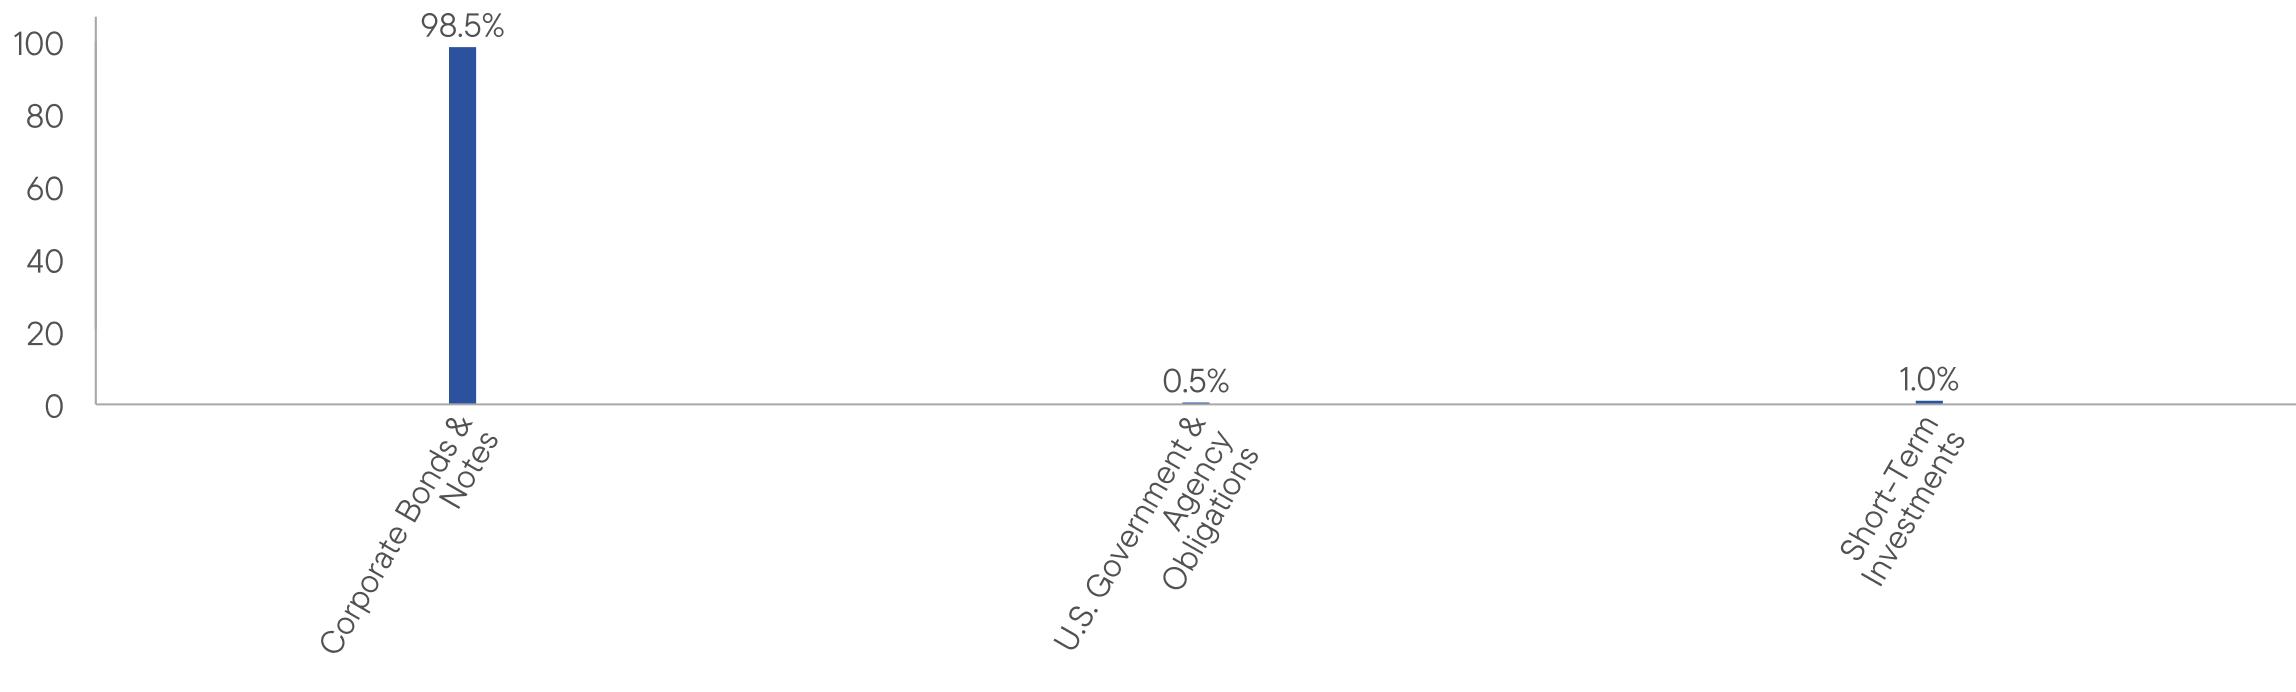
WHAT DID THE FUND INVEST IN? (as of March 31, 2026)
Portfolio Composition* (% of Total Investments)
WHAT WERE THE FUND COSTS FOR THE LAST YEAR? (based on a hypothetical $10,000 investment)
|
Fund Name
|
Costs of a $10,000 investment
|
Costs paid as a percentage of a $10,000 investment*
|
|
Franklin Multisector Income ETF1
|
$23
|
0.39%
|
HOW DID THE FUND PERFORM LAST YEAR AND WHAT AFFECTED ITS PERFORMANCE?
For the period August 26, 2025, to March 31, 2026, Franklin Multisector Income ETF returned 2.66%. The Fund compares its performance to the Bloomberg U.S. Aggregate Index, which returned 2.27% for the same period.
PERFORMANCE HIGHLIGHTS
|
Top contributors to performance:
|
|
|
↑
|
Underweight to the two- and 10-year portions of the U.S. Treasury yield curve
|
|
↑
|
Allocation to and security selection in high-yield corporate bonds
|
|
↑
|
Underweight exposure and security selection in investment-grade corporate bonds
|
|
Top detractors from performance:
|
|
|
↓
|
Overweight to the five-year segment of the U.S. Treasury yield curve
|
|
↓
|
Underweight exposure to agency mortgage-backed securities
|
|
↓
|
Security selection in the loans sector
|
Use of derivatives and the impact on performance:
The Fund utilized interest rate futures and swaps to manage duration exposure which, in aggregate, contributed modestly to performance.
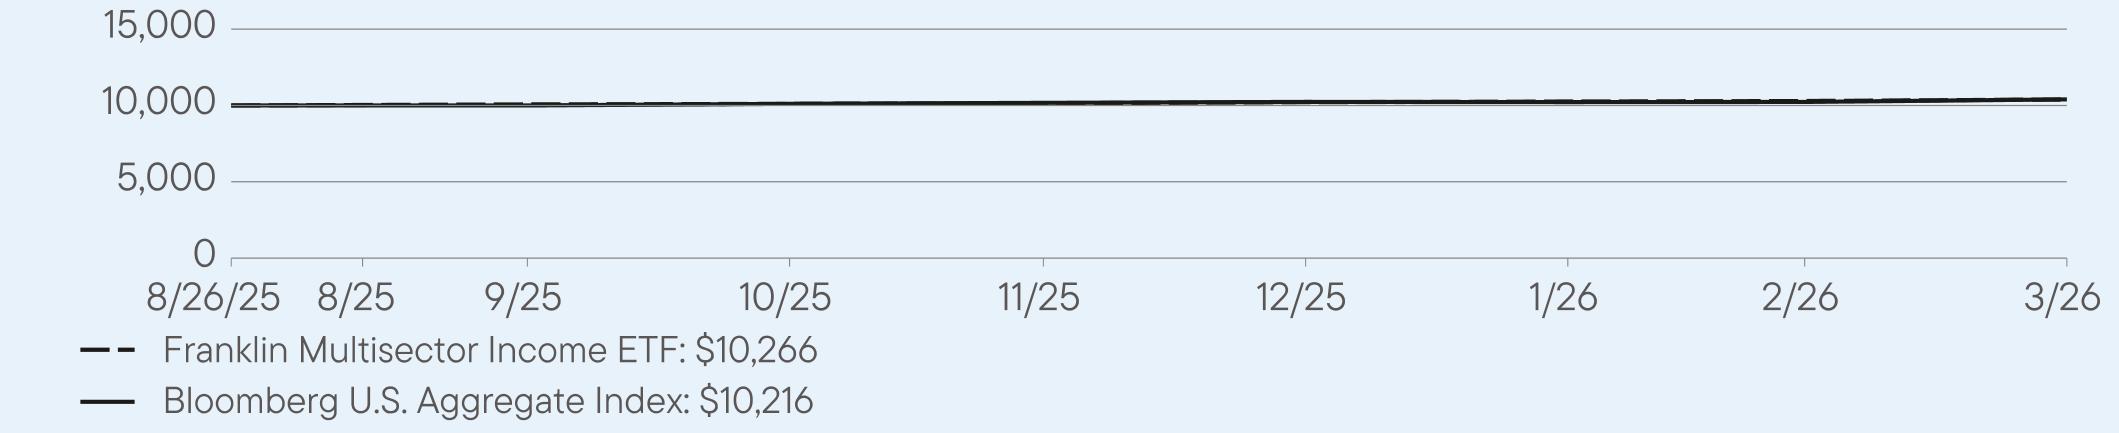
AVERAGE ANNUAL TOTAL RETURNS (%) Period Ended March 31, 2026
|
|
Since Inception
(8/26/2025) |
|
Franklin Multisector Income ETF (NAV)
|
2.66
|
|
Bloomberg U.S. Aggregate Index
|
2.27
|
For current month-end performance, please call Franklin Templeton at (800) DIAL BEN/342-5236 or visit
https://www.franklintempleton.com/investments/options/exchange-traded-funds.
https://www.franklintempleton.com/investments/options/exchange-traded-funds.
Important data provider notices and terms available at www.franklintempletondatasources.com.
KEY FUND STATISTICS (as of March 31, 2026)
|
Total Net Assets
|
$15,067,460
|
|
Total Number of Portfolio Holdings (excludes derivatives, except purchased options, if any)
|
293
|
|
Total Management Fee Paid (based on a unitary fee)
|
$34,752
|
|
Portfolio Turnover Rate
|
103%
|
WHAT DID THE FUND INVEST IN? (as of March 31, 2026)
Portfolio Composition* (% of Total Investments)
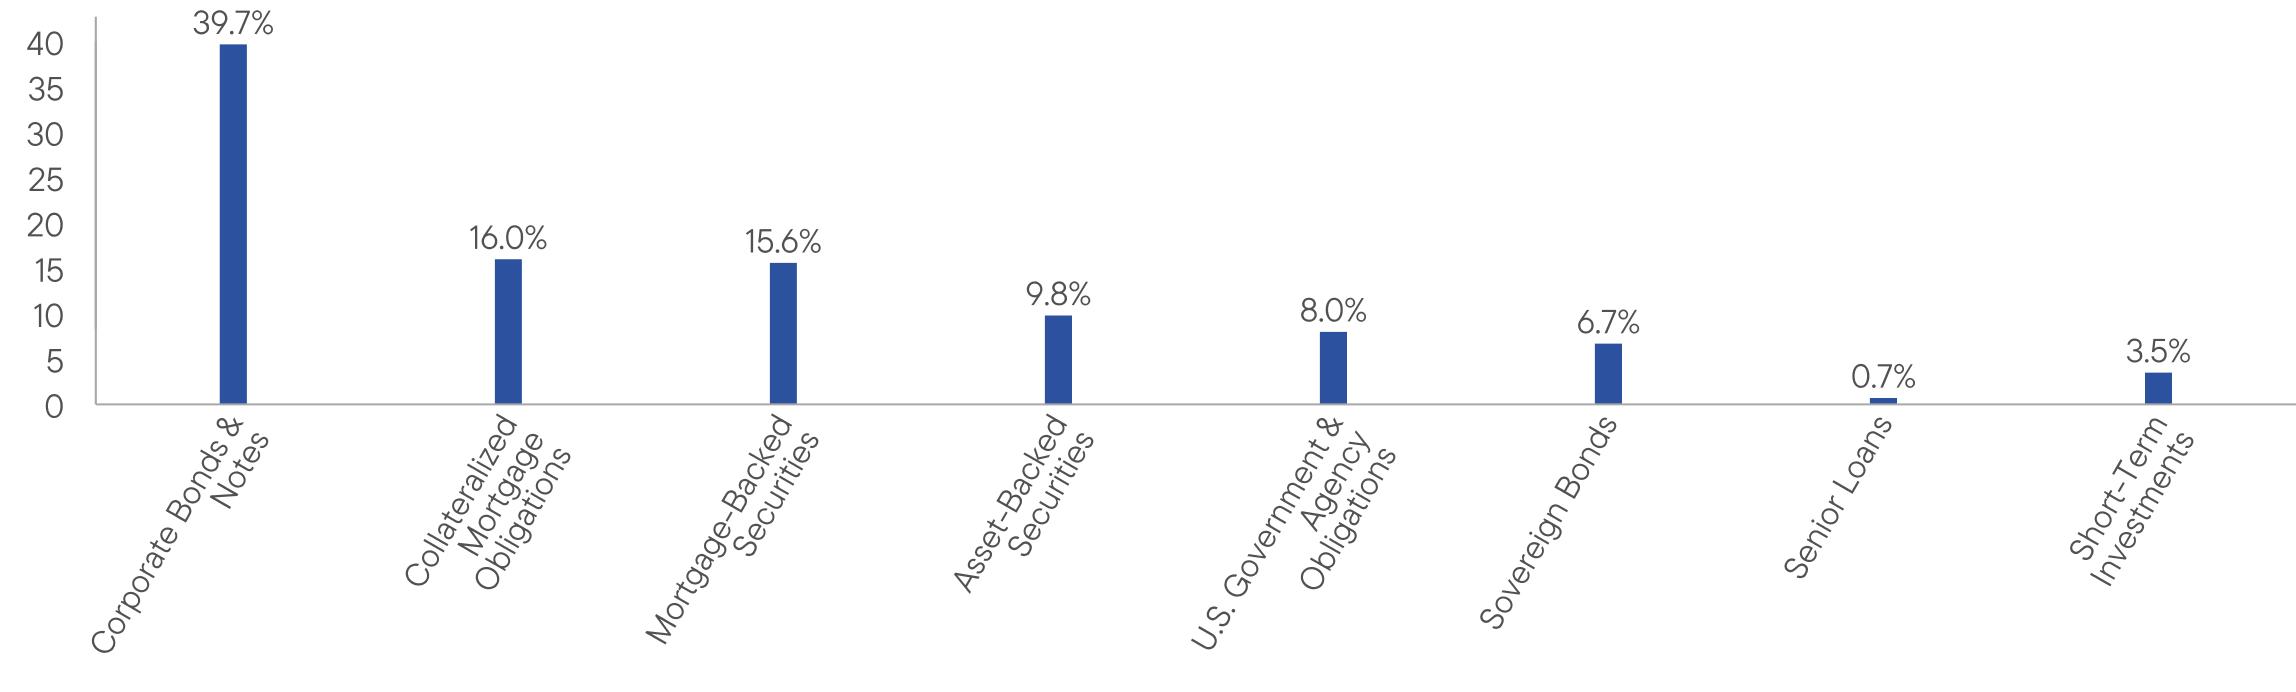
WHAT WERE THE FUND COSTS FOR THE LAST YEAR? (based on a hypothetical $10,000 investment)
|
Fund Name
|
Costs of a $10,000 investment
|
Costs paid as a percentage of a $10,000 investment
|
|
Franklin Municipal Green Bond ETF
|
$31
|
0.30%
|
HOW DID THE FUND PERFORM LAST YEAR AND WHAT AFFECTED ITS PERFORMANCE?
For the twelve months ended March 31, 2026, Franklin Municipal Green Bond ETF returned 4.62%. The Fund compares its performance to the Bloomberg Municipal Bond Index, which returned 4.29% for the same period.
PERFORMANCE HIGHLIGHTS
|
Top contributors to performance:
|
|
|
Selection in:
|
|
|
↑
|
AAA rated bonds
|
|
↑
|
A rated bonds
|
|
↑
|
BBB rated bonds
|
|
Top detractors from performance:
|
|
|
↓
|
Overweight allocation to bonds with 20 years to maturity
|
|
↓
|
Overweight allocation to bonds with 5 years to maturity
|
|
↓
|
Underweight allocation to bonds with 2 years to maturity
|
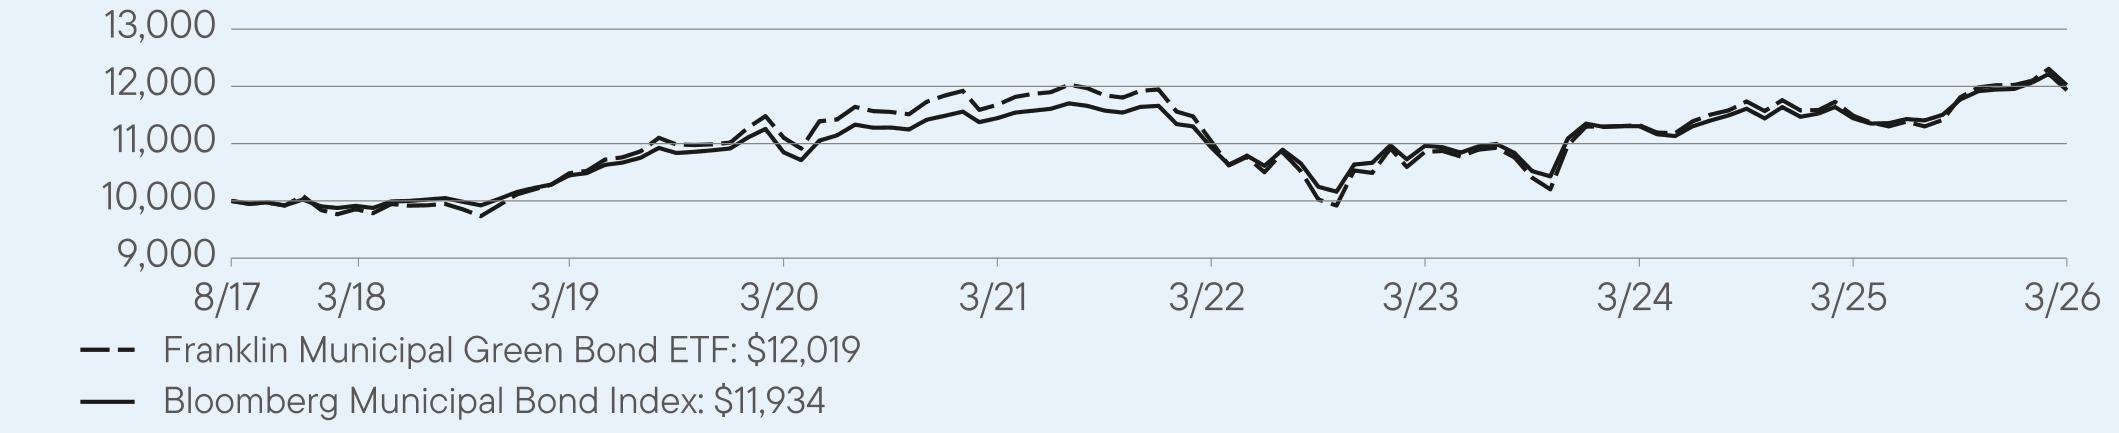
AVERAGE ANNUAL TOTAL RETURNS (%) Period Ended March 31, 2026
|
|
1 Year
|
5 Year
|
Since Inception
(8/31/2017) |
|
Franklin Municipal Green Bond ETF (NAV)
|
4.62
|
0.58
|
2.17
|
|
Bloomberg Municipal Bond Index
|
4.29
|
0.84
|
2.08
|
For current month-end performance, please call Franklin Templeton at (800) DIAL BEN/342-5236 or visit
https://www.franklintempleton.com/investments/options/exchange-traded-funds.
https://www.franklintempleton.com/investments/options/exchange-traded-funds.
Important data provider notices and terms available at www.franklintempletondatasources.com.
KEY FUND STATISTICS (as of March 31, 2026)
|
Total Net Assets
|
$86,320,410
|
|
Total Number of Portfolio Holdings
|
94
|
|
Total Management Fee Paid (based on a unitary fee)
|
$279,591
|
|
Portfolio Turnover Rate
|
24%
|
WHAT DID THE FUND INVEST IN? (as of March 31, 2026)
Portfolio Composition* (% of Total Investments)
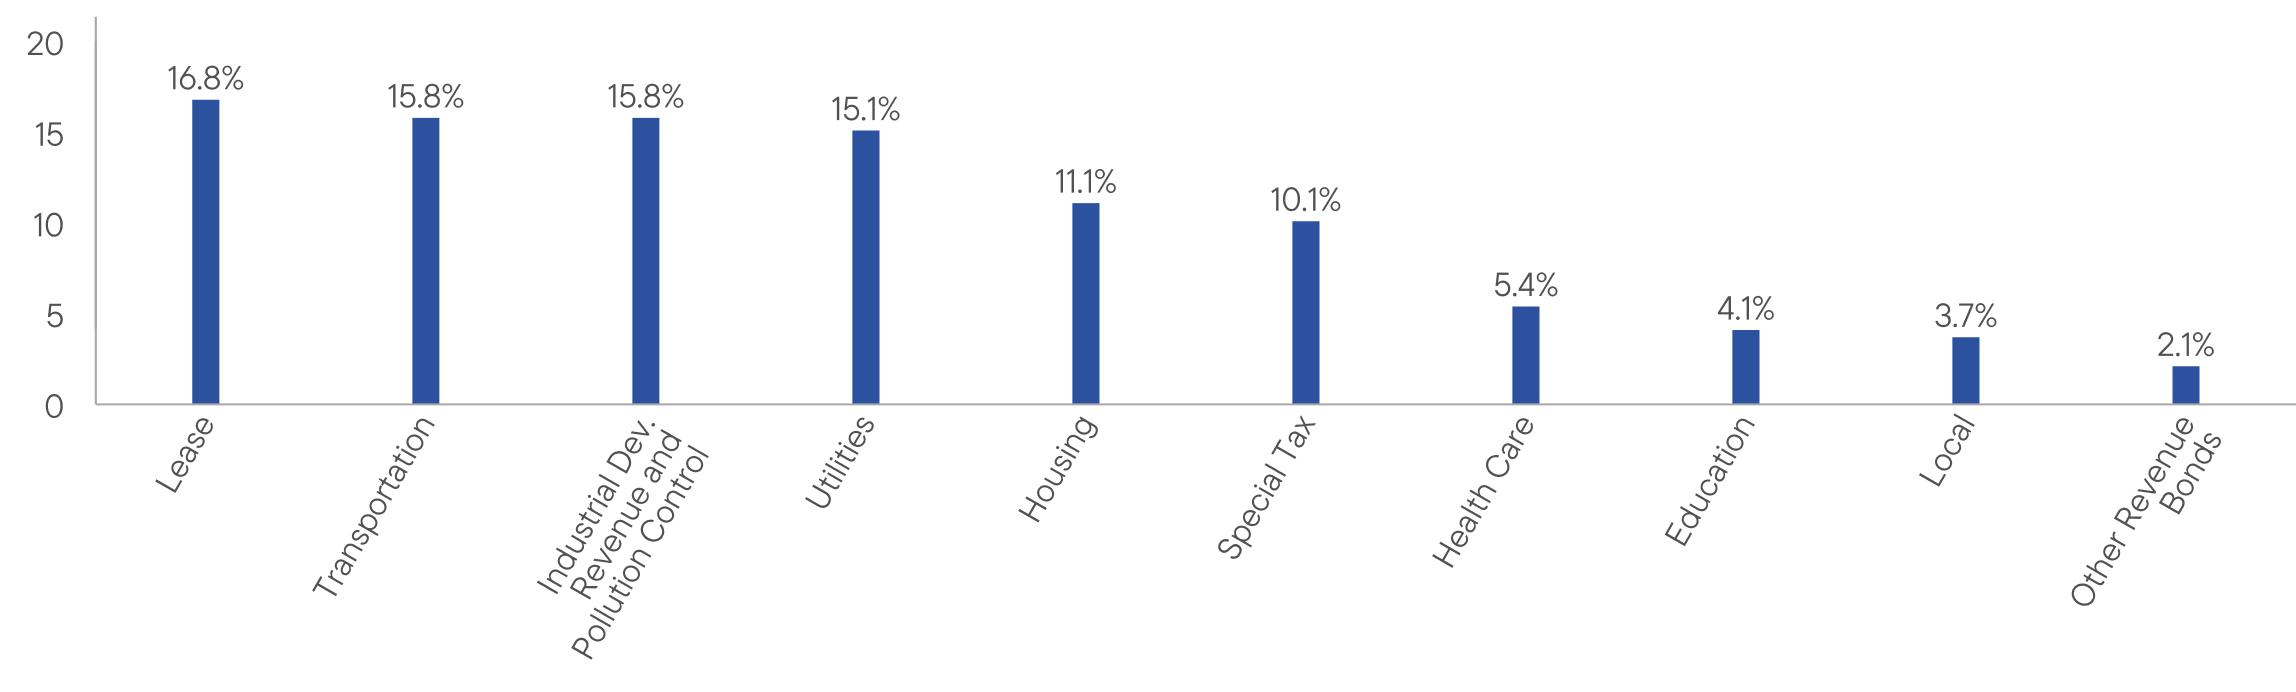
WHAT WERE THE FUND COSTS FOR THE LAST YEAR? (based on a hypothetical $10,000 investment)
|
Fund Name
|
Costs of a $10,000 investment
|
Costs paid as a percentage of a $10,000 investment*
|
|
Franklin Senior Loan ETF
|
$44
|
0.43%
|
HOW DID THE FUND PERFORM LAST YEAR AND WHAT AFFECTED ITS PERFORMANCE?
For the twelve months ended March 31, 2026, Franklin Senior Loan ETF returned 2.95%. The Fund compares its performance to the Morningstar LSTA U.S. Leveraged Loan 100 Index, which returned 5.94% for the same period.
PERFORMANCE HIGHLIGHTS
|
Top contributors to performance:
|
|
|
↑
|
Overweighted allocation to the media non-cable sector
|
|
↑
|
Underweighted allocation to retailers
|
|
↑
|
Security selection in the gaming industry
|
|
Top detractors from performance:
|
|
|
↓
|
Security selection in the media non-cable sector
|
|
↓
|
Underweight in lower-quality loans versus the benchmark
|
|
↓
|
Yield curve positioning
|
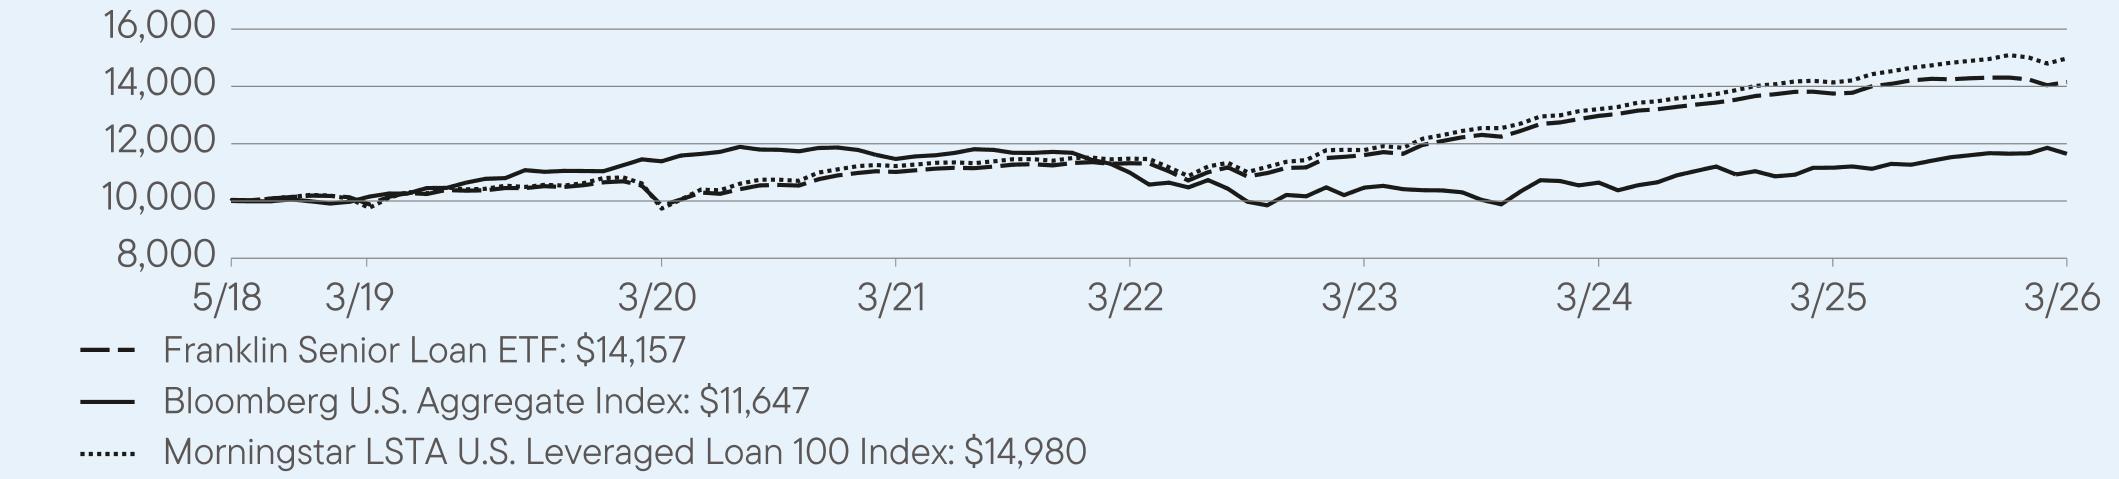
AVERAGE ANNUAL TOTAL RETURNS (%) Period Ended March 31, 2026
|
|
1 Year
|
5 Year
|
Since Inception
(5/30/2018) |
|
Franklin Senior Loan ETF (NAV)
|
2.95
|
5.15
|
4.54
|
|
Bloomberg U.S. Aggregate Index
|
4.35
|
0.31
|
1.98
|
|
Morningstar LSTA U.S. Leveraged Loan 100 Index
|
5.94
|
5.91
|
5.27
|
For current month-end performance, please call Franklin Templeton at (800) DIAL BEN/342-5236 or visit
https://www.franklintempleton.com/investments/options/exchange-traded-funds.
https://www.franklintempleton.com/investments/options/exchange-traded-funds.
Important data provider notices and terms available at www.franklintempletondatasources.com.
KEY FUND STATISTICS (as of March 31, 2026)
|
Total Net Assets
|
$802,610,628
|
|
Total Number of Portfolio Holdings
|
218
|
|
Total Management Fee Paid (based on a unitary fee)
|
$4,540,274
|
|
Portfolio Turnover Rate
|
37%
|
WHAT DID THE FUND INVEST IN? (as of March 31, 2026)
Portfolio Composition*,† (% of Total Investments)
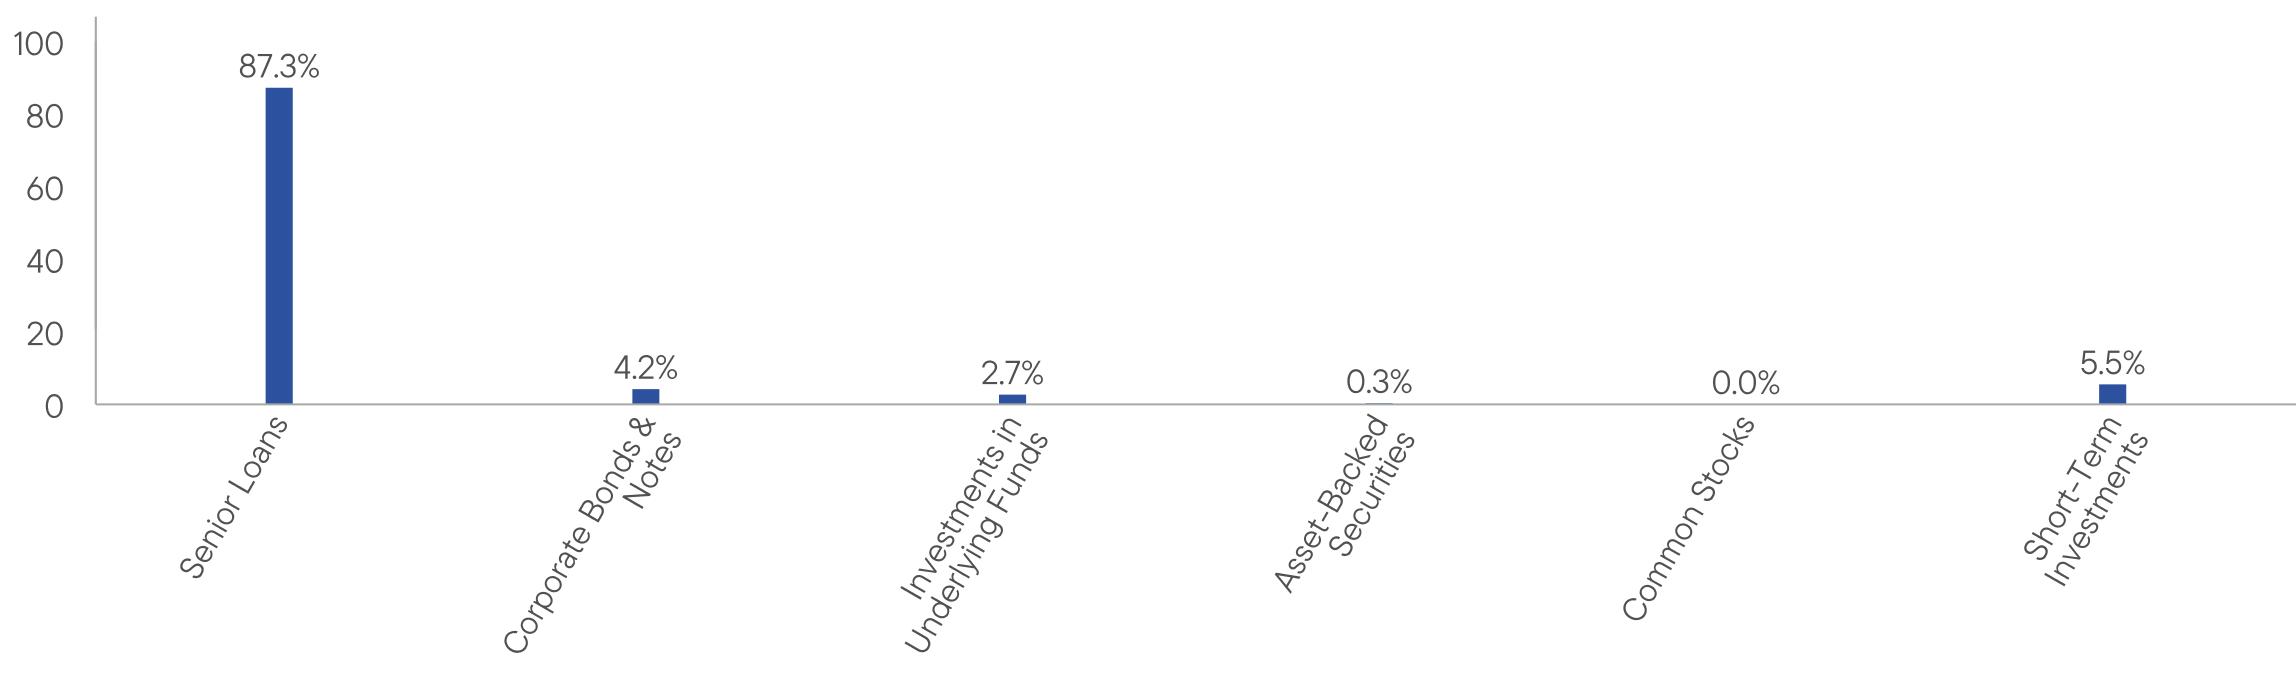
This report describes changes to the Fund that occurred during the reporting period.
WHAT WERE THE FUND COSTS FOR THE LAST YEAR? (based on a hypothetical $10,000 investment)
|
Fund Name
|
Costs of a $10,000 investment
|
Costs paid as a percentage of a $10,000 investment*
|
|
Franklin Systematic Style Premia ETF
|
$49
|
0.46%
|
HOW DID THE FUND PERFORM LAST YEAR AND WHAT AFFECTED ITS PERFORMANCE?
For the twelve months ended March 31, 2026, Franklin Systematic Style Premia ETF returned 13.73%. The Fund compares its performance to the ICE BofA U.S. 3-Month Treasury Bill Index, which returned 4.00% for the same period.
PERFORMANCE HIGHLIGHTS
|
Top contributors to performance:
|
|
|
↑
|
The long-short equity strategy was a key driver of performance, as momentum and value factors added to returns, reflecting favorable stock selection and systematic factor positioning across the portfolio.
|
|
↑
|
The macro strategy contributed positively, driven primarily by equities, where carry, value and momentum were broadly additive, further bolstered by commodities led by sulphur gasoil, silver and soybean oil, along with foreign exchange and a smaller positive contribution from rates.
|
|
↑
|
Country positioning within long-short equities also aided results, particularly in Japan and Hong Kong.
|
|
Top detractors from performance:
|
|
|
↓
|
The quality exposure detracted within long short equity, partially offsetting gains from momentum and value factors.
|
|
↓
|
Long positioning in software and short positioning in semiconductor-related industries weighed on results.
|
|
↓
|
Currency positioning also detracted, led by exposures to the Czech koruna, euro and Hungarian forint.
|
Use of derivatives and the impact on performance:
The Fund utilized interest rate futures, FX forwards, equity index futures, swap contracts and commodities futures contracts to positively position the portfolio and minimize risk in accordance with the Fund’s strategy. In aggregate, these derivatives contributed to performance.
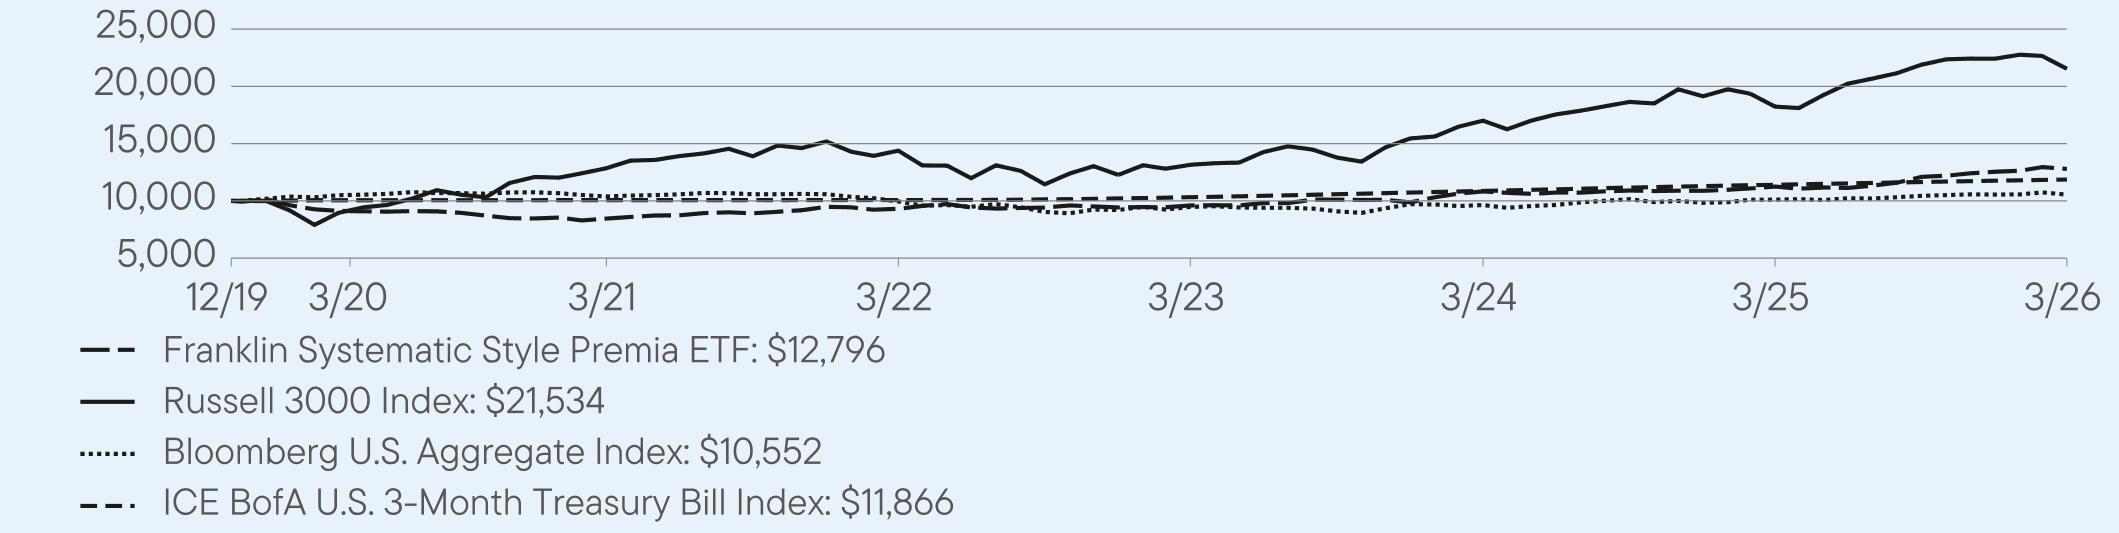
AVERAGE ANNUAL TOTAL RETURNS (%) Period Ended March 31, 2026
|
|
1 Year
|
5 Year
|
Since Inception
(12/18/2019) |
|
Franklin Systematic Style Premia ETF (NAV)
|
13.73
|
8.63
|
4.00
|
|
Russell 3000 Index
|
18.09
|
10.87
|
13.20
|
|
Bloomberg U.S. Aggregate Index
|
4.35
|
0.31
|
0.90
|
|
ICE BofA U.S. 3-Month Treasury Bill Index
|
4.00
|
3.34
|
2.77
|
For current month-end performance, please call Franklin Templeton at (800) DIAL BEN/342-5236 or visit
https://www.franklintempleton.com/investments/options/exchange-traded-funds.
https://www.franklintempleton.com/investments/options/exchange-traded-funds.
Important data provider notices and terms available at www.franklintempletondatasources.com.
KEY FUND STATISTICS (as of March 31, 2026)
|
Total Net Assets
|
$710,422,614
|
|
Total Number of Portfolio Holdings (excludes derivatives, except purchased options, if any)
|
277
|
|
Total Management Fee Paid (based on a unitary fee)
|
$2,108,853
|
|
Portfolio Turnover Rate
|
68%
|
WHAT DID THE FUND INVEST IN? (as of March 31, 2026)
Portfolio Composition* (% of Total Investments)
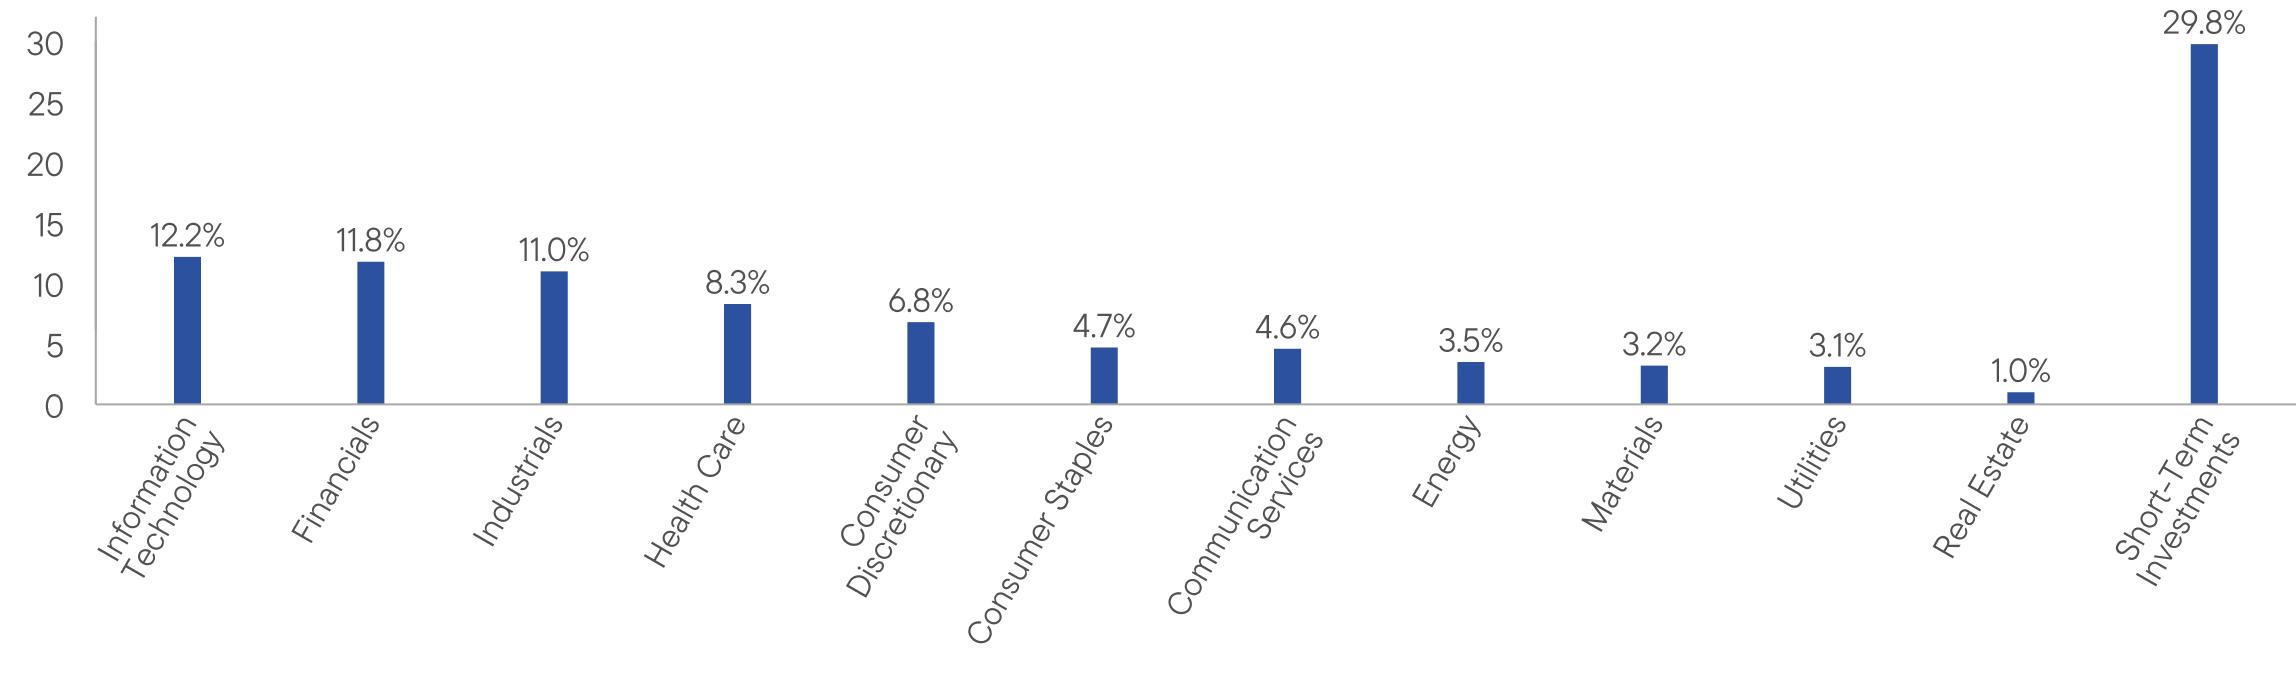
HOW HAS THE FUND CHANGED?
Effective December 16, 2025, the list of primary investments of the Fund’s top-down risk premia strategy was updated to include risk premia total return swaps, including total return swaps referencing proprietary or third-party indices designed to capture systematic factor exposures across equity, fixed income, commodity and currency asset classes. The Fund’s bottom-up long/short equity strategy was also updated to state that the Fund may also utilize risk premia total return swaps to obtain long or short equity index exposures or take long or short positions in individual equities. In addition, the list of derivatives the Fund may use, among other instruments, was updated to include risk premia total return swaps.
Effective January 1, 2026, the investment management services provided by the Fund’s sub-advisor, K2/D&S Management Co., L.L.C (“K2 Advisors”) and the personnel of K2 Advisors who provided such services for the Fund, were transferred to the Fund’s investment manager, Franklin Advisers, Inc. Therefore, the sub-advisory agreement with K2 Advisors with respect to the Fund was terminated.
In addition, effective September 30, 2025, Chandra Seethamraju, PhD stepped down as a member of the Fund’s portfolio management team.
During the period, a voluntary waiver was established for the Fund pursuant to which the investment manager waives a portion of the Fund’s unified management fee so that such fee decreases as Fund assets increase according to the following schedule: 0.65% of the value of the Fund’s total assets up to and including $250 million; 0.55% of the value of the Fund’s total assets over $250 million and up to and including $500 million; 0.45% of the value of the Fund’s total assets over $500 million and up to and including $1 billion; and 0.39% of the value of the Fund’s total assets over $1 billion. Effective December 16, 2025, the voluntary waiver was changed so that the investment manager waives a portion of the Fund’s unified management fee so that such fee decreases as Fund assets increase according to the following schedule: 0.55% of the value of the Fund’s total assets up to and including $500 million; 0.45% of the value of the Fund’s total assets over $500 million and up to and including $1 billion; and 0.39% of the value of the Fund’s total assets over $1 billion. This waiver is voluntary and may be modified or terminated at any time by the investment manager without notice.
This is a summary of certain changes to the Fund since April 1, 2025. For more complete information, you may review the Fund’s current prospectus and any applicable supplements and the Fund’s next prospectus, which we expect to be available by August 1, 2026, at https://www.franklintempleton.com/regulatory-fund-documents or upon request at (800) DIAL BEN/342-5236 or
ETFs-Product@franklintempleton.com.
ETFs-Product@franklintempleton.com.
WHAT WERE THE FUND COSTS FOR THE LAST YEAR? (based on a hypothetical $10,000 investment)
|
Fund Name
|
Costs of a $10,000 investment
|
Costs paid as a percentage of a $10,000 investment*
|
|
Franklin U.S. Core Bond ETF
|
$15
|
0.15%
|
HOW DID THE FUND PERFORM LAST YEAR AND WHAT AFFECTED ITS PERFORMANCE?
For the twelve months ended March 31, 2026, Franklin U.S. Core Bond ETF returned 4.33%. The Fund compares its performance to the Bloomberg U.S. Aggregate Index, which returned 4.35% for the same period.
PERFORMANCE HIGHLIGHTS
|
Top contributors to performance:
|
|
|
↑
|
Overweight exposure to and security selection in investment-grade corporate bonds
|
|
↑
|
Overweight exposure to agency mortgage-backed securities
|
|
↑
|
Underweight to the 10-year portion of the U.S. Treasury (UST) yield curve
|
|
Top detractors from performance:
|
|
|
↓
|
Security selection in commercial mortgage-backed securities
|
|
↓
|
Lack of exposure to sovereign emerging market bonds
|
|
↓
|
Overweight to the 20-year portion of the UST yield curve
|
Use of derivatives and the impact on performance:
The Fund utilized interest rate swaps to manage duration exposure, which detracted from performance.
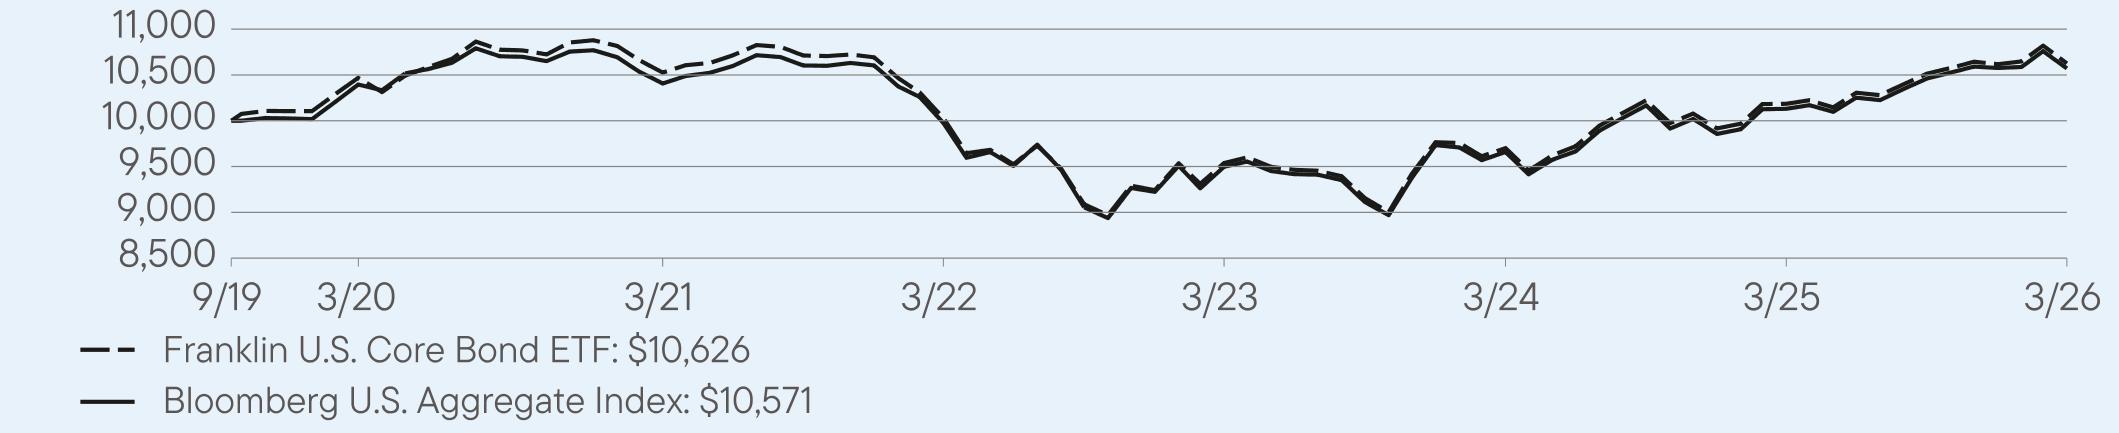
AVERAGE ANNUAL TOTAL RETURNS (%) Period Ended March 31, 2026
|
|
1 Year
|
5 Year
|
Since Inception
(9/17/2019) |
|
Franklin U.S. Core Bond ETF (NAV)
|
4.33
|
0.19
|
0.93
|
|
Bloomberg U.S. Aggregate Index
|
4.35
|
0.31
|
0.98
|
For current month-end performance, please call Franklin Templeton at (800) DIAL BEN/342-5236 or visit
https://www.franklintempleton.com/investments/options/exchange-traded-funds.
https://www.franklintempleton.com/investments/options/exchange-traded-funds.
Important data provider notices and terms available at www.franklintempletondatasources.com.
KEY FUND STATISTICS (as of March 31, 2026)
|
Total Net Assets
|
$2,882,937,224
|
|
Total Number of Portfolio Holdings (excludes derivatives, except purchased options, if any)
|
525
|
|
Total Management Fee Paid (based on a unitary fee)
|
$4,000,086
|
|
Portfolio Turnover Rate
|
42%
|
WHAT DID THE FUND INVEST IN? (as of March 31, 2026)
Portfolio Composition* (% of Total Investments)
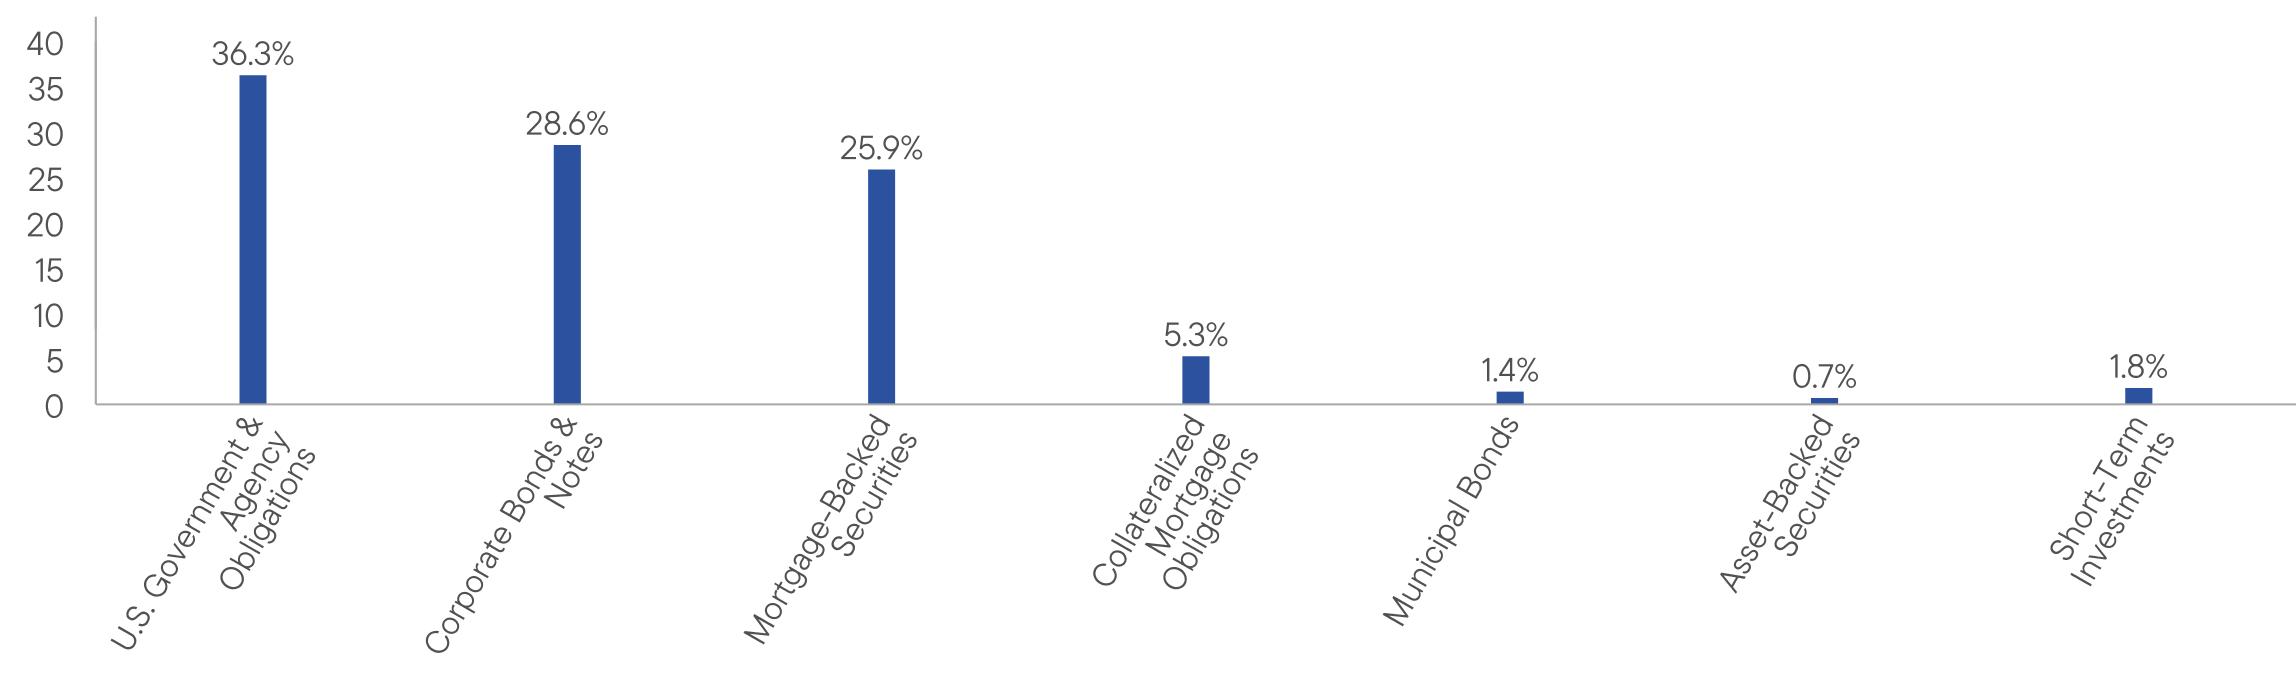
WHAT WERE THE FUND COSTS FOR THE LAST YEAR? (based on a hypothetical $10,000 investment)
|
Fund Name
|
Costs of a $10,000 investment
|
Costs paid as a percentage of a $10,000 investment*
|
|
Franklin U.S. Treasury Bond ETF
|
$9
|
0.09%
|
HOW DID THE FUND PERFORM LAST YEAR AND WHAT AFFECTED ITS PERFORMANCE?
For the twelve months ended March 31, 2026, Franklin U.S. Treasury Bond ETF returned 3.41%. The Fund compares its performance to the Bloomberg U.S. Treasury Index, which returned 3.25% for the same period.
PERFORMANCE HIGHLIGHTS
|
Top contributors to performance:
|
|
|
↑
|
Underweight exposure to the 30-year portion of the U.S. Treasury (UST) yield curve
|
|
↑
|
Underweight exposure to the 10-year segment of the UST yield curve
|
|
↑
|
Overweight exposure to the five-year portion of the UST yield curve
|
|
Top detractors from performance:
|
|
|
↓
|
Overweight exposure to the six-month portion of the UST yield curve
|
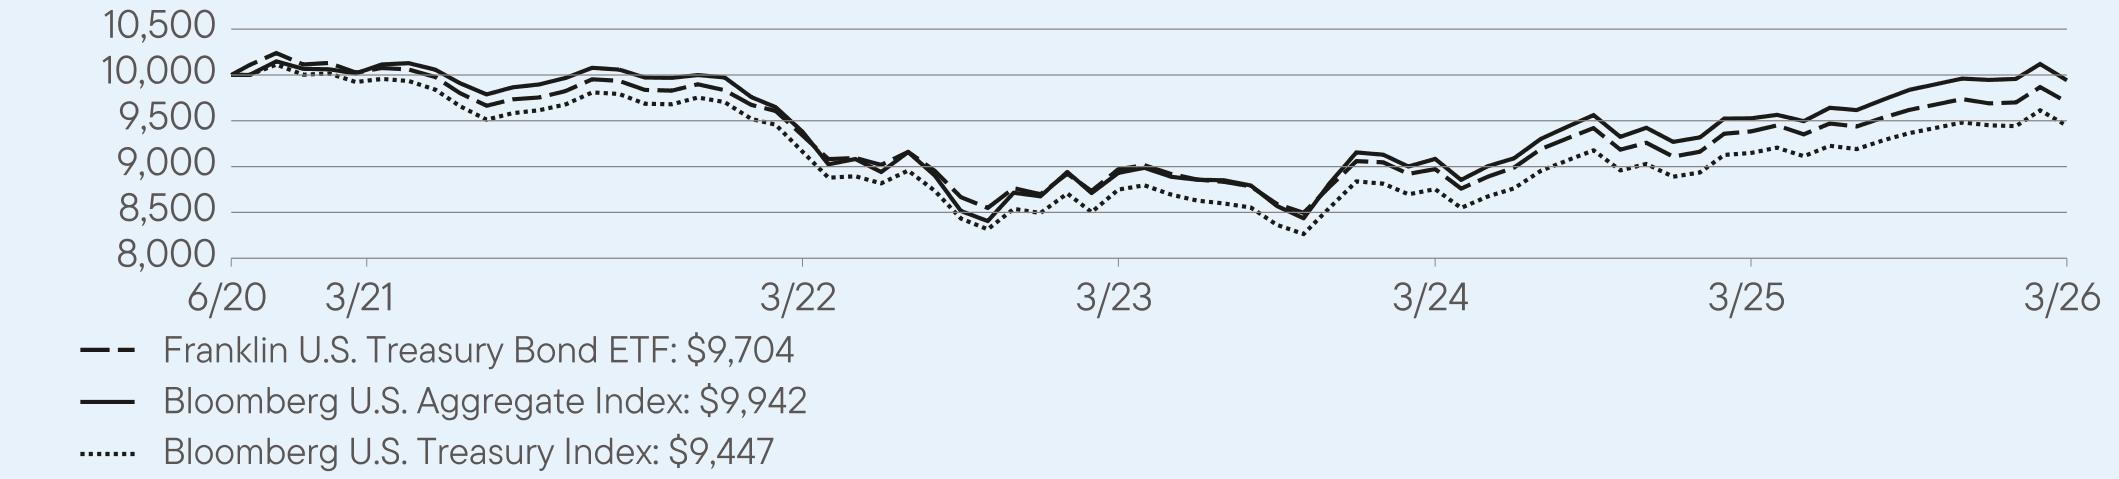
AVERAGE ANNUAL TOTAL RETURNS (%) Period Ended March 31, 2026
|
|
1 Year
|
5 Year
|
Since Inception
(6/9/2020) |
|
Franklin U.S. Treasury Bond ETF (NAV)
|
3.41
|
0.08
|
-0.52
|
|
Bloomberg U.S. Aggregate Index
|
4.35
|
0.31
|
0.02
|
|
Bloomberg U.S. Treasury Index
|
3.25
|
-0.14
|
-0.79
|
For current month-end performance, please call Franklin Templeton at (800) DIAL BEN/342-5236 or visit
https://www.franklintempleton.com/investments/options/exchange-traded-funds.
https://www.franklintempleton.com/investments/options/exchange-traded-funds.
Important data provider notices and terms available at www.franklintempletondatasources.com.
KEY FUND STATISTICS (as of March 31, 2026)
|
Total Net Assets
|
$1,006,822,740
|
|
Total Number of Portfolio Holdings
|
45
|
|
Total Management Fee Paid (based on a unitary fee)
|
$927,502
|
|
Portfolio Turnover Rate
|
24%
|
WHAT DID THE FUND INVEST IN? (as of March 31, 2026)
Portfolio Composition* (% of Total Investments)
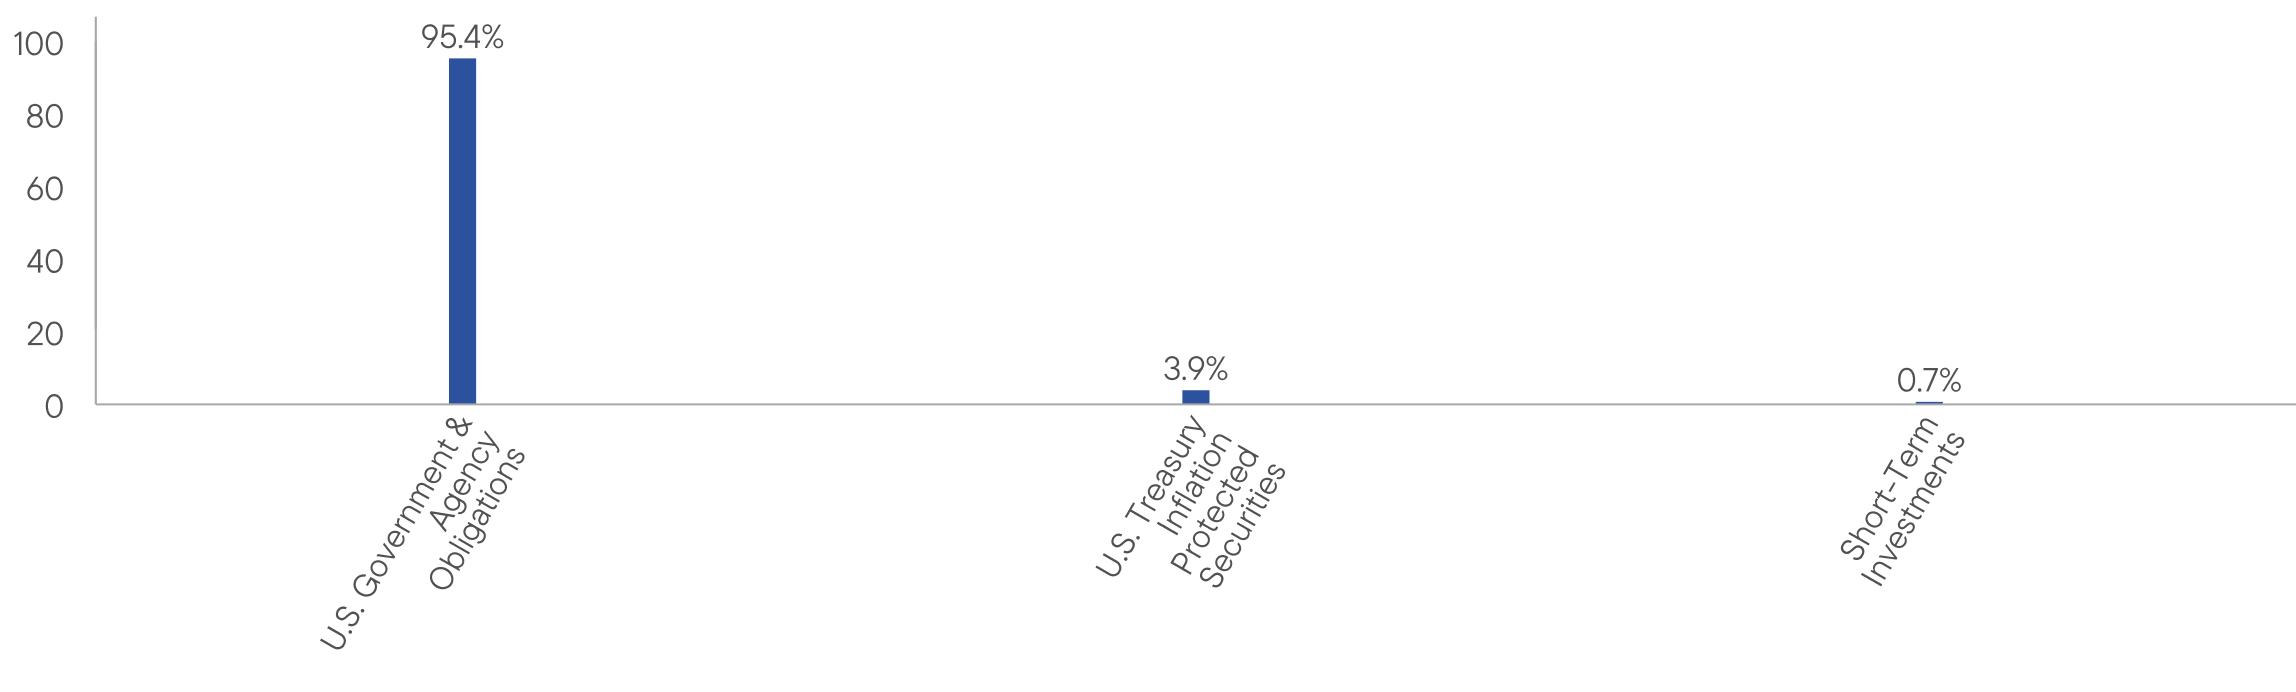
WHAT WERE THE FUND COSTS FOR THE LAST YEAR? (based on a hypothetical $10,000 investment)
|
Fund Name
|
Costs of a $10,000 investment
|
Costs paid as a percentage of a $10,000 investment*
|
|
Franklin Ultra Short Bond ETF
|
$15
|
0.15%
|
HOW DID THE FUND PERFORM LAST YEAR AND WHAT AFFECTED ITS PERFORMANCE?
For the twelve months ended March 31, 2026, Franklin Ultra Short Bond ETF returned 4.59%. The Fund compares its performance to the ICE BofA U.S. 3-Month Treasury Bill Index, which returned 4.00% for the same period.
PERFORMANCE HIGHLIGHTS
|
Top contributors to performance:
|
|
|
↑
|
Investment-grade (IG) corporate holdings in the banking industry contributed to relative performance
|
|
↑
|
IG holdings in consumer non-cyclical and cyclical segments supported results
|
There were no significant detractors from performance during the period.
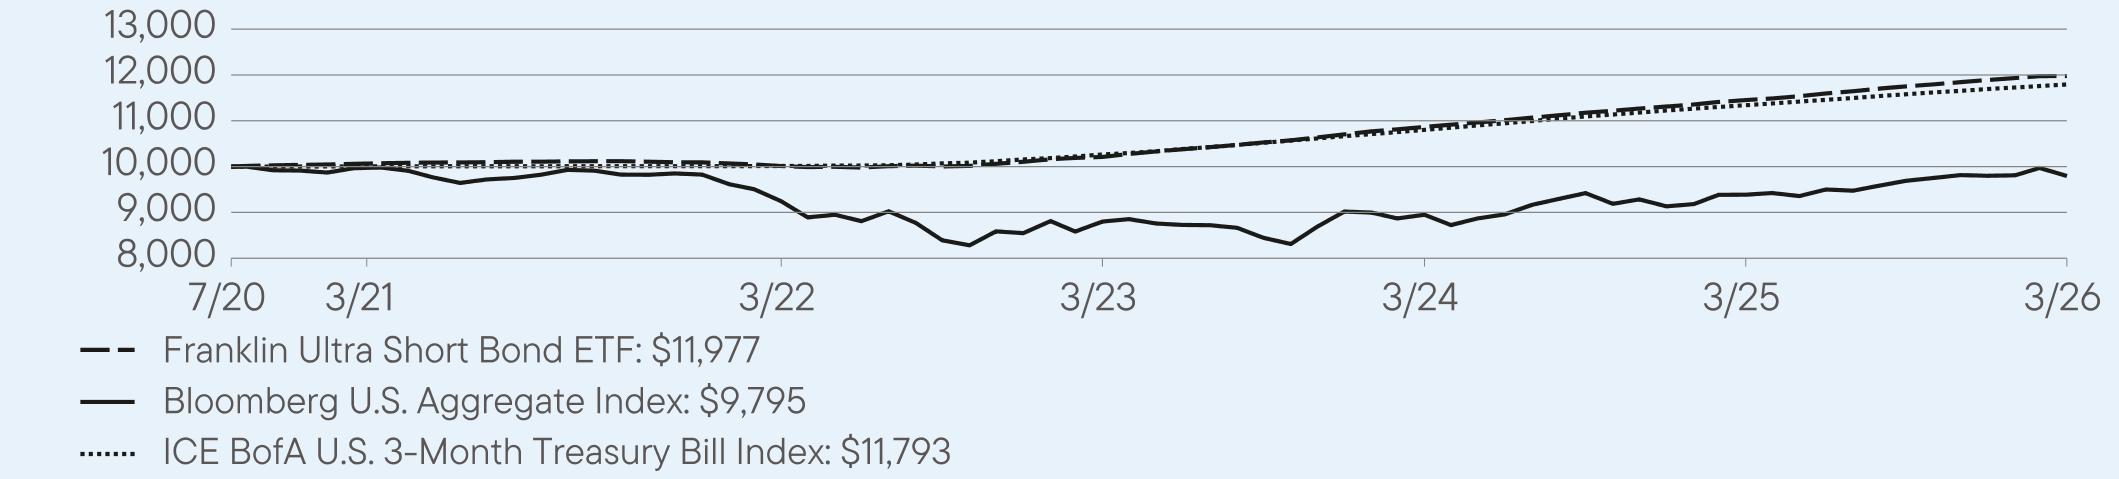
AVERAGE ANNUAL TOTAL RETURNS (%) Period Ended March 31, 2026
|
|
1 Year
|
5 Year
|
Since Inception
(7/14/2020) |
|
Franklin Ultra Short Bond ETF (NAV)
|
4.59
|
3.49
|
3.21
|
|
Bloomberg U.S. Aggregate Index
|
4.35
|
0.31
|
-0.22
|
|
ICE BofA U.S. 3-Month Treasury Bill Index
|
4.00
|
3.34
|
2.93
|
For current month-end performance, please call Franklin Templeton at (800) DIAL BEN/342-5236 or visit
https://www.franklintempleton.com/investments/options/exchange-traded-funds.
https://www.franklintempleton.com/investments/options/exchange-traded-funds.
Important data provider notices and terms available at www.franklintempletondatasources.com.
KEY FUND STATISTICS (as of March 31, 2026)
|
Total Net Assets
|
$232,498,330
|
|
Total Number of Portfolio Holdings
|
470
|
|
Total Management Fee Paid (based on a unitary fee)
|
$244,939
|
|
Portfolio Turnover Rate
|
34%
|
WHAT DID THE FUND INVEST IN? (as of March 31, 2026)
Portfolio Composition* (% of Total Investments)
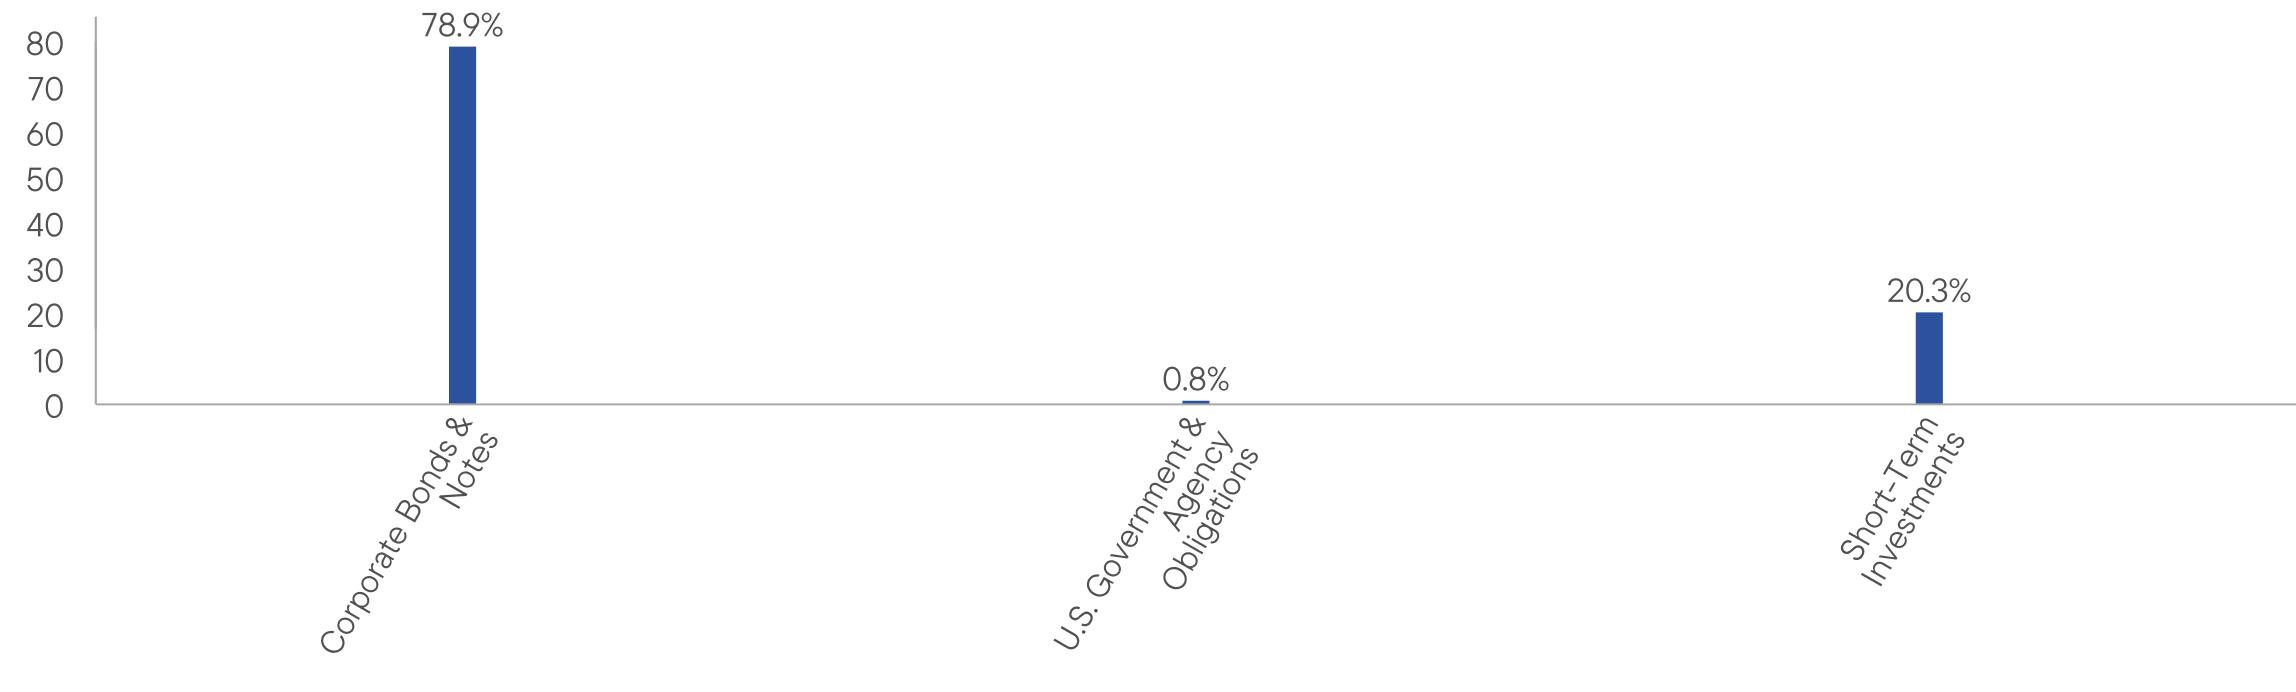
WHAT WERE THE FUND COSTS FOR THE LAST YEAR? (based on a hypothetical $10,000 investment)
|
Fund Name
|
Costs of a $10,000 investment
|
Costs paid as a percentage of a $10,000 investment*
|
|
Franklin FTSE Asia Ex Japan ETF
|
$22
|
0.19%
|
HOW DID THE FUND PERFORM LAST YEAR AND WHAT AFFECTED ITS PERFORMANCE?
For the twelve months ended March 31, 2026, Franklin FTSE Asia Ex Japan ETF returned 28.30%. The Fund compares its performance to the FTSE Asia ex Japan Capped Index-NR, which returned 28.19% for the same period..
PERFORMANCE HIGHLIGHTS
|
Top contributors to performance:
|
|
|
↑
|
The sectors that contributed most to absolute performance were information technology, financials and industrials.
|
|
↑
|
Individual holdings that contributed to absolute returns included Taiwan Semiconductor Manufacturing, Samsung Electronics, and SK Hynix.
|
|
Top detractors from performance:
|
|
|
↓
|
The only sector that detracted from absolute performance was consumer discretionary.
|
|
↓
|
Individual holdings that hindered absolute returns included Meituan, Xiaomi and HDFC Bank.
|
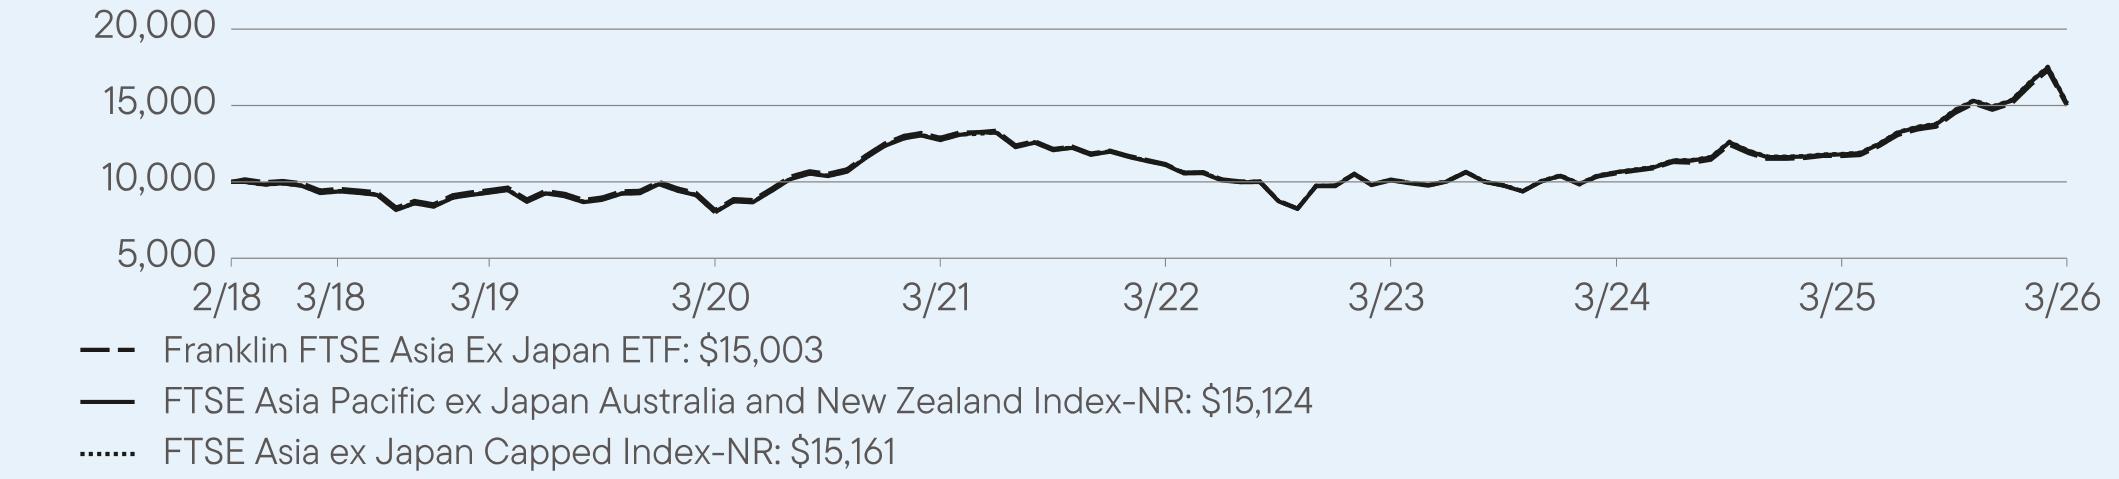
AVERAGE ANNUAL TOTAL RETURNS (%) Period Ended March 31, 2026
|
|
1 Year
|
5 Year
|
Since Inception
(2/6/2018) |
|
Franklin FTSE Asia Ex Japan ETF (NAV)
|
28.30
|
3.09
|
5.11
|
|
FTSE Asia Pacific ex Japan Australia and New Zealand Index-NR
|
28.19
|
3.50
|
5.42
|
|
FTSE Asia ex Japan Capped Index-NR
|
28.19
|
3.50
|
5.46
|
For current month-end performance, please call Franklin Templeton at (800) DIAL BEN/342-5236 or visit
https://www.franklintempleton.com/investments/options/exchange-traded-funds.
https://www.franklintempleton.com/investments/options/exchange-traded-funds.
Important data provider notices and terms available at www.franklintempletondatasources.com.
KEY FUND STATISTICS (as of March 31, 2026)
|
Total Net Assets
|
$40,994,006
|
|
Total Number of Portfolio Holdings
|
1596
|
|
Total Management Fee Paid (based on a unitary fee)
|
$65,702
|
|
Portfolio Turnover Rate
|
7%
|
WHAT DID THE FUND INVEST IN? (as of March 31, 2026)
Portfolio Composition* (% of Total Investments)
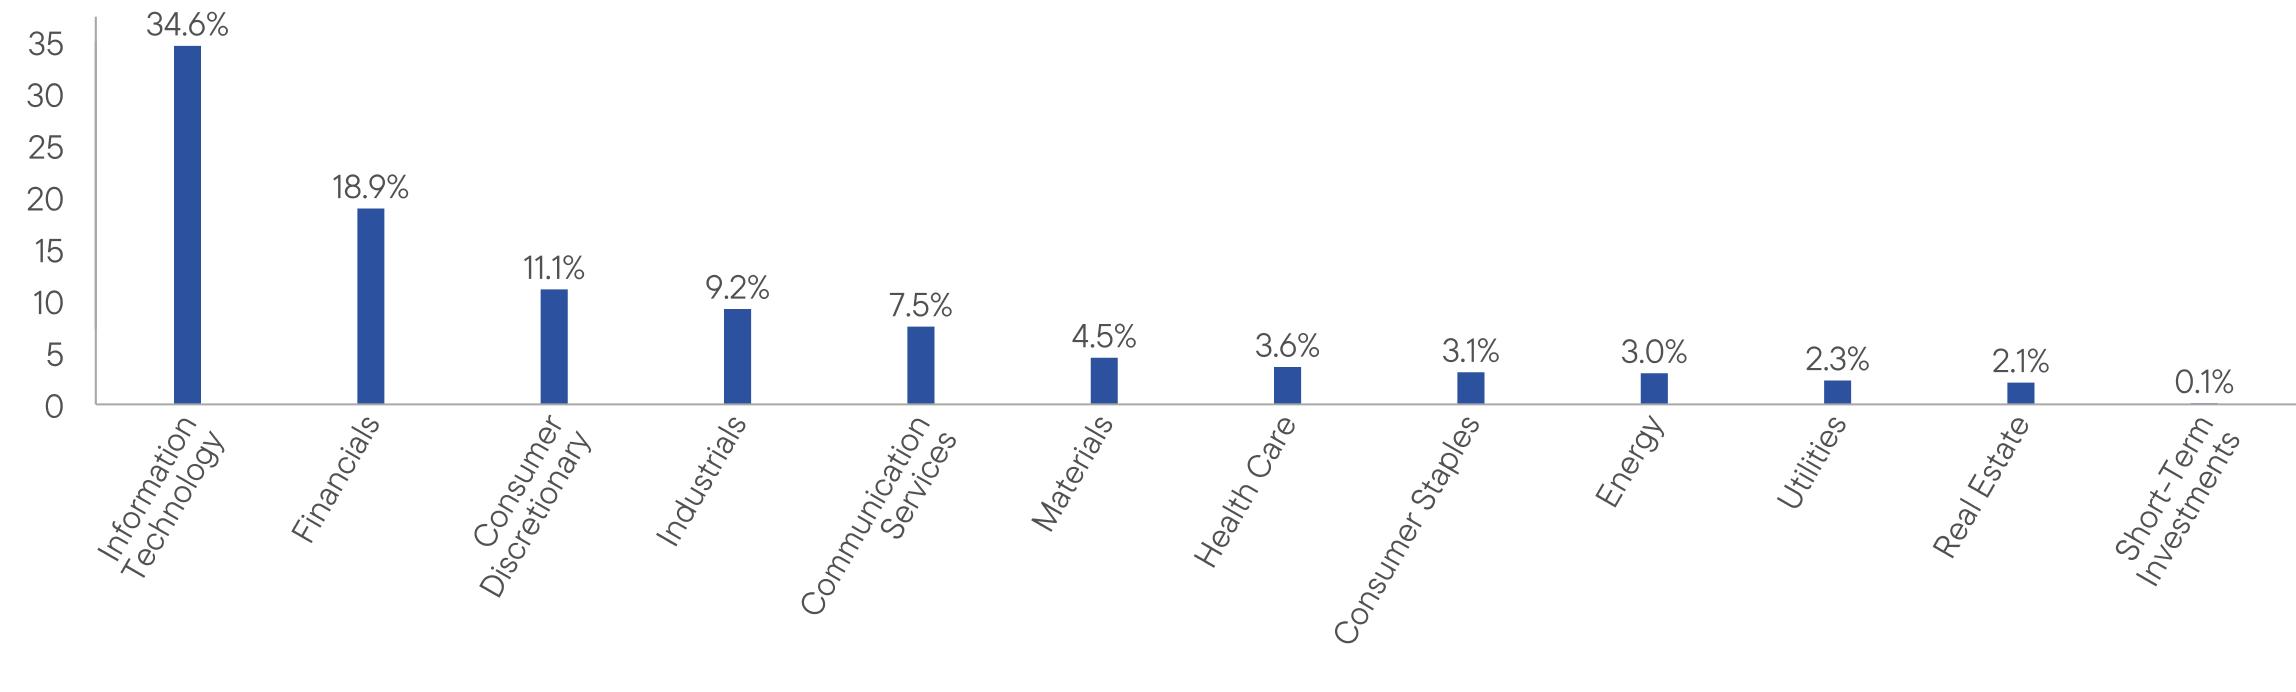
This report describes changes to the Fund that occurred during the reporting period.
WHAT WERE THE FUND COSTS FOR THE LAST YEAR? (based on a hypothetical $10,000 investment)
|
Fund Name
|
Costs of a $10,000 investment
|
Costs paid as a percentage of a $10,000 investment*
|
|
Franklin FTSE Australia ETF
|
$10
|
0.09%
|
HOW DID THE FUND PERFORM LAST YEAR AND WHAT AFFECTED ITS PERFORMANCE?
For the twelve months ended March 31, 2026, Franklin FTSE Australia ETF returned 22.01%. The Fund compares its performance to the FTSE Australia Capped Index-NR, which returned 22.04% for the same period.
PERFORMANCE HIGHLIGHTS
|
Top contributors to performance:
|
|
|
↑
|
The sectors that contributed most to absolute performance were financials, materials, and energy.
|
|
↑
|
Individual holdings that contributed to absolute returns were BHP Group Ltd., Commonwealth Bank of Australia, and Westpac Banking Corp.
|
|
Top detractors from performance:
|
|
|
↓
|
The only sector that detracted from absolute performance was health care.
|
|
↓
|
Individual holdings that hindered absolute returns included CSL Ltd., Xero Ltd., and James Hardie Industries Plc.
|
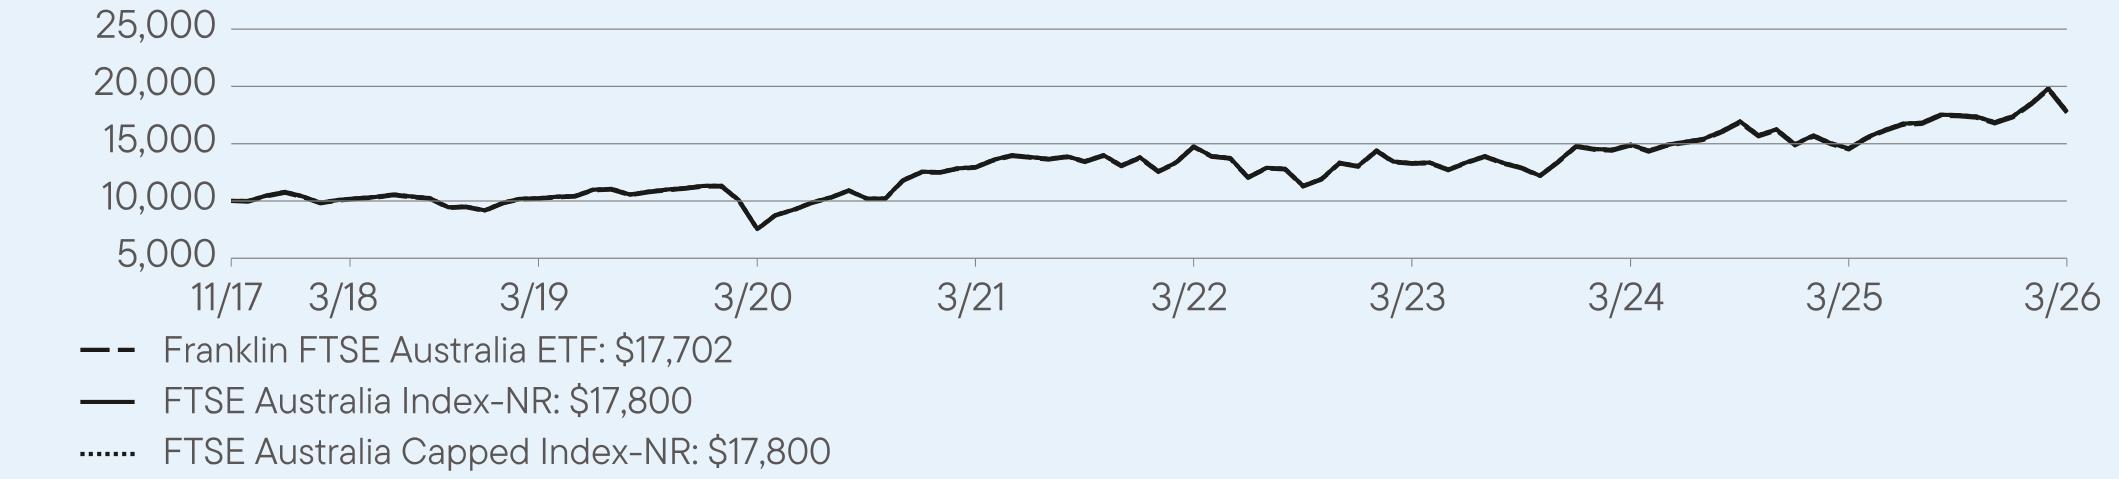
AVERAGE ANNUAL TOTAL RETURNS (%) Period Ended March 31, 2026
|
|
1 Year
|
5 Year
|
Since Inception
(11/2/2017) |
|
Franklin FTSE Australia ETF (NAV)
|
22.01
|
6.52
|
7.03
|
|
FTSE Australia Index-NR
|
22.04
|
6.56
|
7.02
|
|
FTSE Australia Capped Index-NR
|
22.04
|
6.56
|
7.02
|
For current month-end performance, please call Franklin Templeton at (800) DIAL BEN/342-5236 or visit
https://www.franklintempleton.com/investments/options/exchange-traded-funds.
https://www.franklintempleton.com/investments/options/exchange-traded-funds.
Important data provider notices and terms available at www.franklintempletondatasources.com.
KEY FUND STATISTICS (as of March 31, 2026)
|
Total Net Assets
|
$87,063,346
|
|
Total Number of Portfolio Holdings (excludes derivatives, except purchased options, if any)
|
108
|
|
Total Management Fee Paid (based on a unitary fee)
|
$63,574
|
|
Portfolio Turnover Rate
|
7%
|
WHAT DID THE FUND INVEST IN? (as of March 31, 2026)
Portfolio Composition*,† (% of Total Investments)
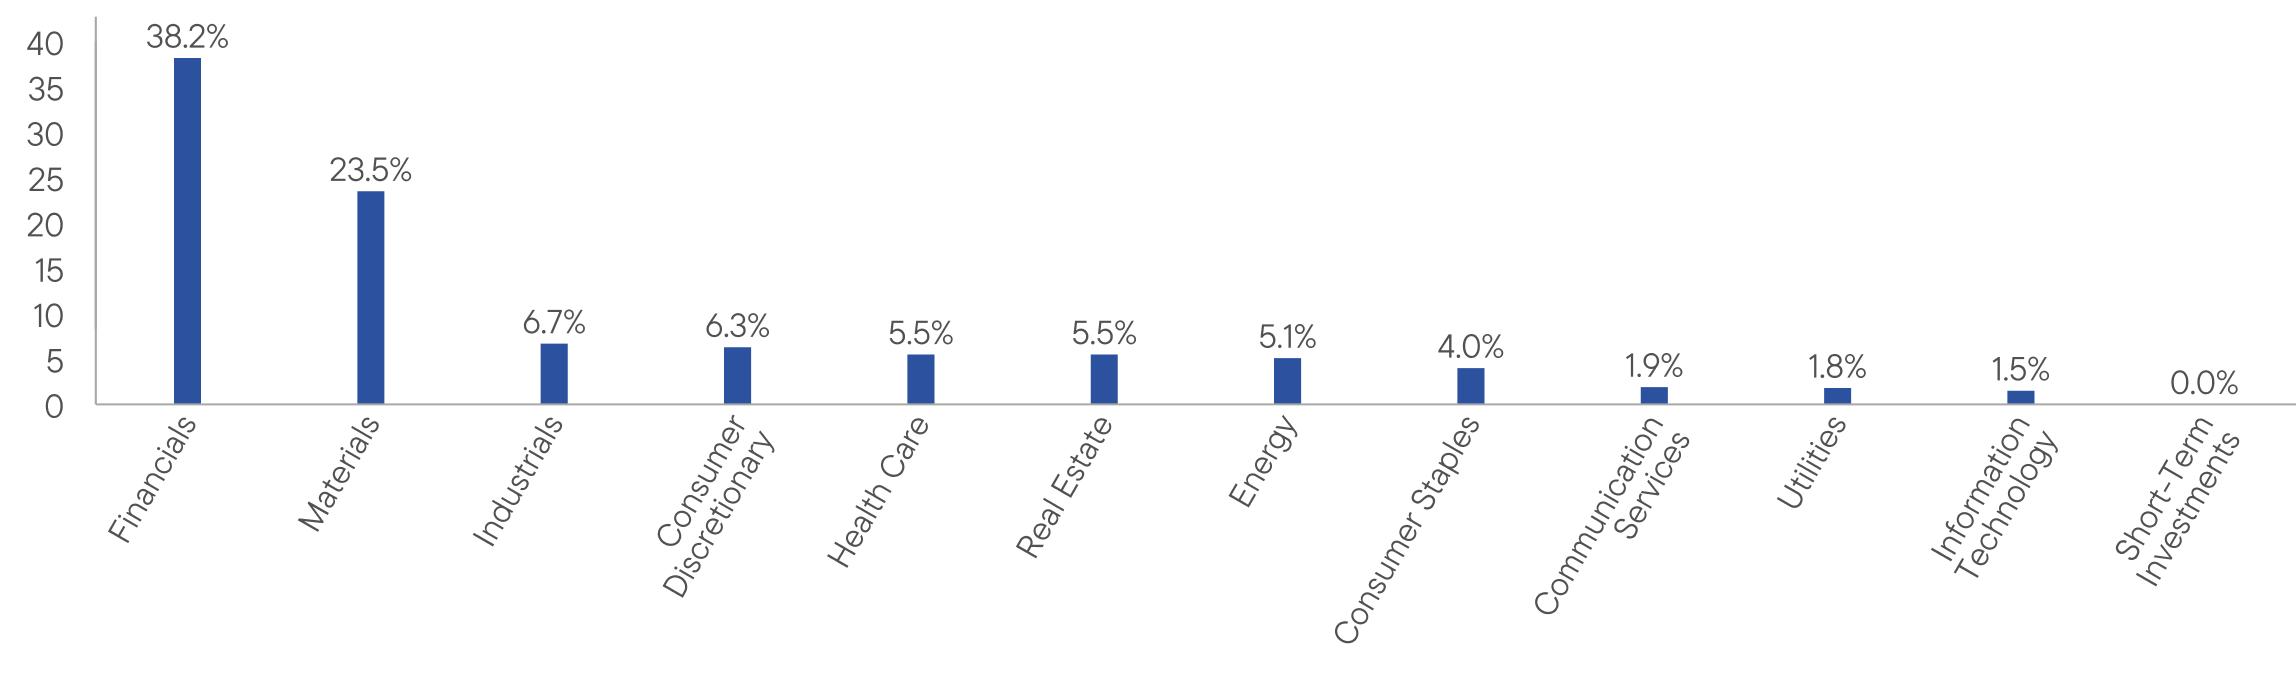
HOW HAS THE FUND CHANGED?
On August 1, 2025, the Fund’s principal investment strategies were revised to reflect the Underlying Index’s (and therefore the Fund’s) increased exposure to the banking industry and decreased exposure to the financial services sector.
Related disclosure regarding the risks of investing in the banking industry was added as a principal risk of the Fund and risk disclosure regarding the risks of the financial services sector was removed.
This is a summary of certain changes to the Fund since April 1, 2025. For more complete information, you may review the Fund’s current prospectus and any applicable supplements and the Fund’s next prospectus, which we expect to be available by August 1, 2026, at https://www.franklintempleton.com/regulatory-fund-documents or upon request at (800) DIAL BEN/342-5236 or
ETFs-Product@franklintempleton.com.
ETFs-Product@franklintempleton.com.
WHAT WERE THE FUND COSTS FOR THE LAST YEAR? (based on a hypothetical $10,000 investment)
|
Fund Name
|
Costs of a $10,000 investment
|
Costs paid as a percentage of a $10,000 investment*
|
|
Franklin FTSE Brazil ETF
|
$24
|
0.19%
|
HOW DID THE FUND PERFORM LAST YEAR AND WHAT AFFECTED ITS PERFORMANCE?
For the twelve months ended March 31, 2026, Franklin FTSE Brazil ETF returned 55.29%. The Fund compares its performance to the FTSE Brazil Capped Index-NR, which returned 55.63% for the same period.
PERFORMANCE HIGHLIGHTS
|
Top contributors to performance:
|
|
|
↑
|
The sectors that contributed most to absolute performance were financials, utilities and materials.
|
|
↑
|
Individual holdings that contributed to absolute returns were Vale SA, Itau Unibanco Holding SA and Petroleo Brasileiro SA - Petrobras.
|
|
Top detractors from performance:
|
|
|
↓
|
There were no sectors that detracted from absolute performance.
|
|
↓
|
Individual holdings that hindered absolute returns included Ambipar Participacoes e Empreendimentos SA, Banco do Brasil SA and Hapvida Participacoes e Investimentos SA.
|
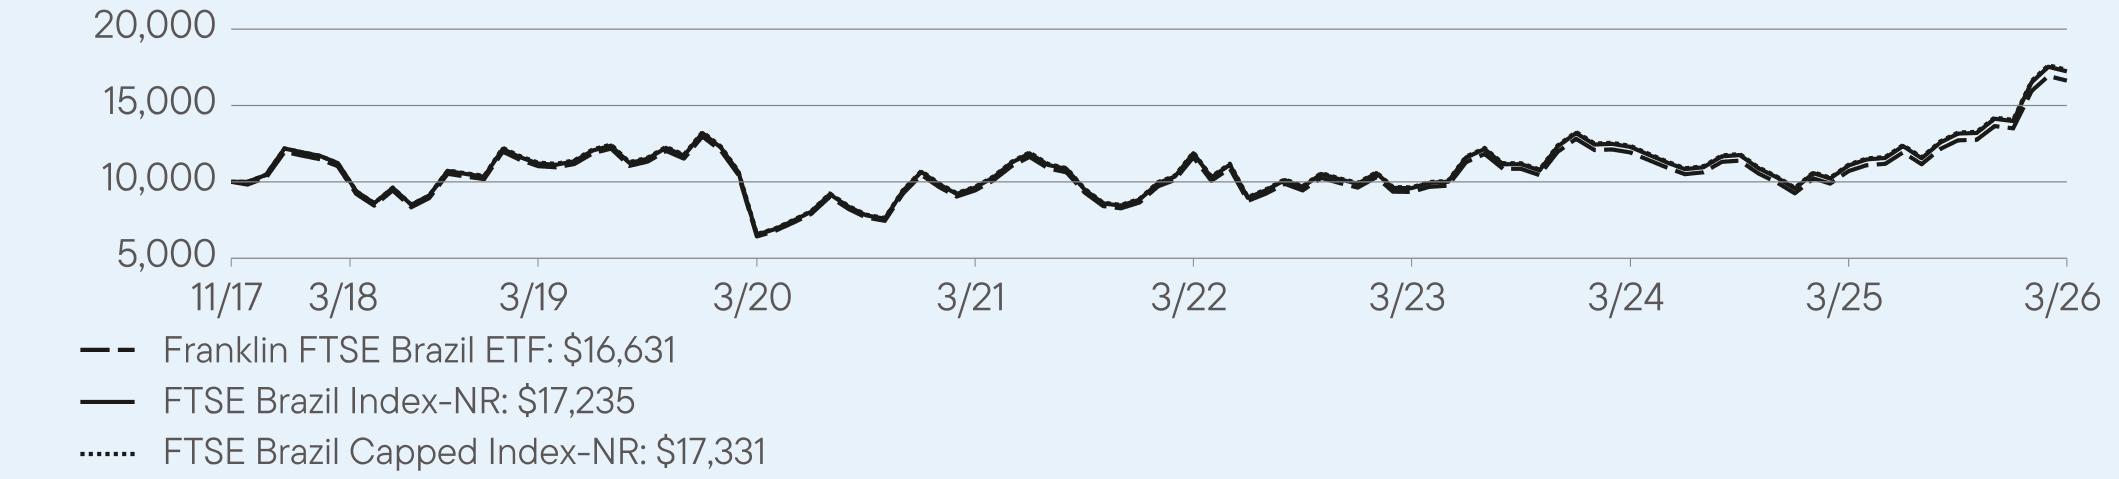
AVERAGE ANNUAL TOTAL RETURNS (%) Period Ended March 31, 2026
|
|
1 Year
|
5 Year
|
Since Inception
(11/3/2017) |
|
Franklin FTSE Brazil ETF (NAV)
|
55.29
|
11.99
|
6.24
|
|
FTSE Brazil Index-NR
|
55.63
|
12.36
|
6.47
|
|
FTSE Brazil Capped Index-NR
|
55.63
|
12.35
|
6.54
|
For current month-end performance, please call Franklin Templeton at (800) DIAL BEN/342-5236 or visit
https://www.franklintempleton.com/investments/options/exchange-traded-funds.
https://www.franklintempleton.com/investments/options/exchange-traded-funds.
Important data provider notices and terms available at www.franklintempletondatasources.com.
KEY FUND STATISTICS (as of March 31, 2026)
|
Total Net Assets
|
$501,933,414
|
|
Total Number of Portfolio Holdings (excludes derivatives, except purchased options, if any)
|
70
|
|
Total Management Fee Paid (based on a unitary fee)
|
$483,705
|
|
Portfolio Turnover Rate
|
14%
|
WHAT DID THE FUND INVEST IN? (as of March 31, 2026)
Portfolio Composition* (% of Total Investments)
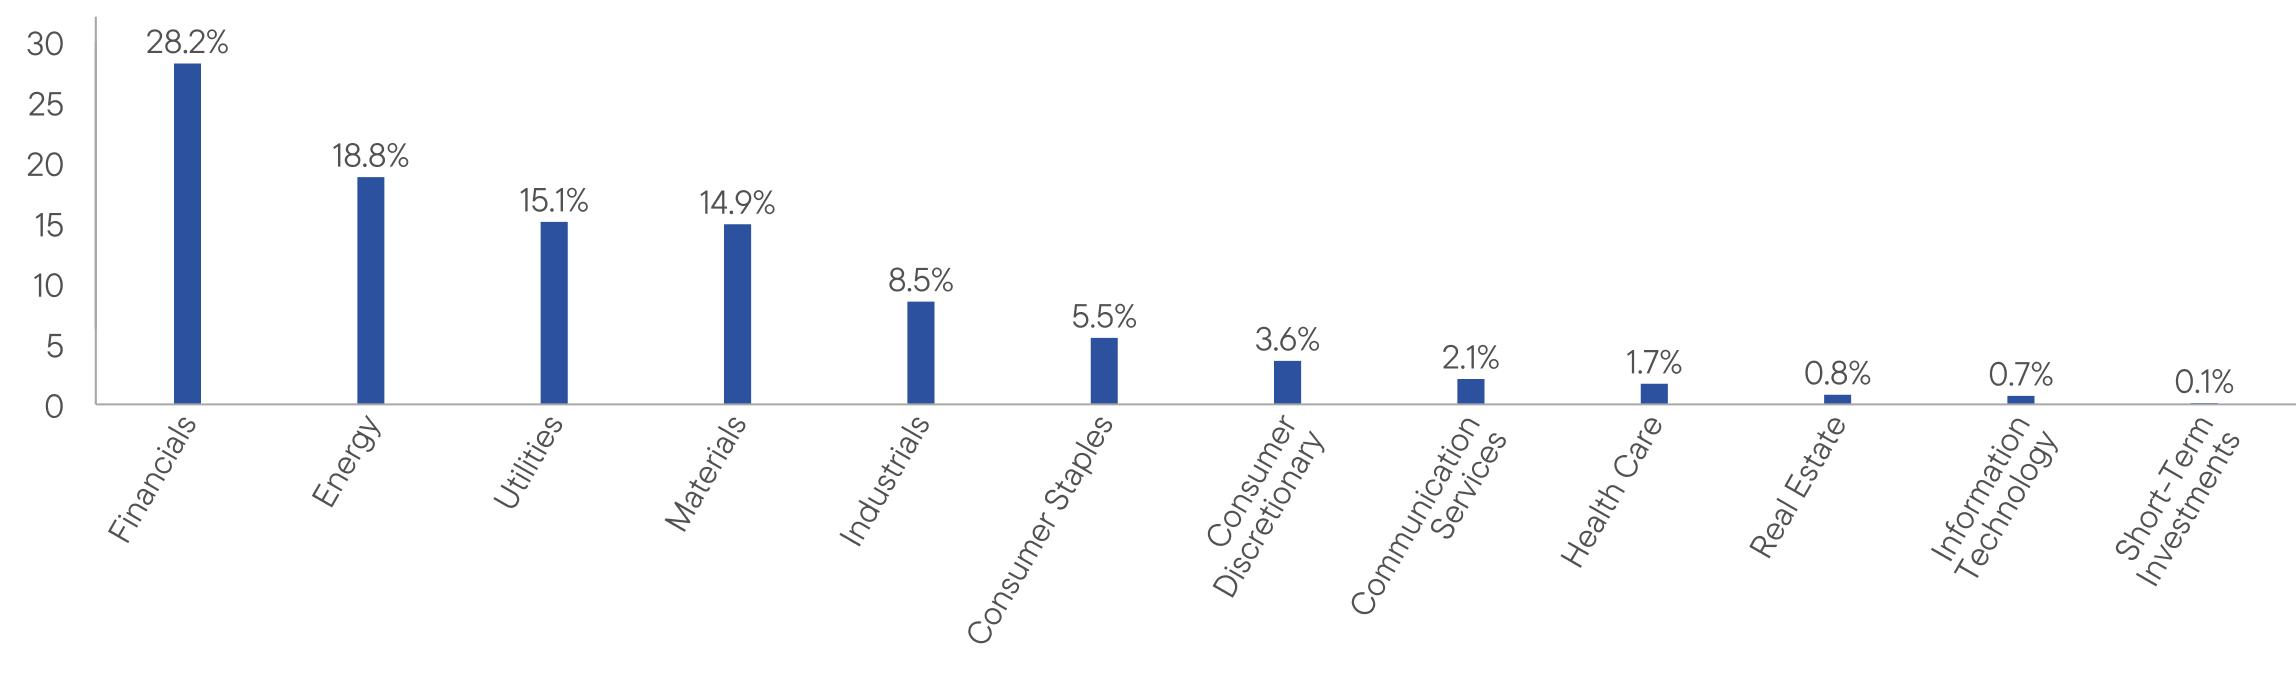
WHAT WERE THE FUND COSTS FOR THE LAST YEAR? (based on a hypothetical $10,000 investment)
|
Fund Name
|
Costs of a $10,000 investment
|
Costs paid as a percentage of a $10,000 investment*
|
|
Franklin FTSE Canada ETF
|
$11
|
0.09%
|
HOW DID THE FUND PERFORM LAST YEAR AND WHAT AFFECTED ITS PERFORMANCE?
For the twelve months ended March 31, 2026, Franklin FTSE Canada ETF returned 34.36%. The Fund compares its performance to the FTSE Canada Capped Index-NR, which returned 34.16% for the same period.
PERFORMANCE HIGHLIGHTS
|
Top contributors to performance:
|
|
|
↑
|
The sectors that contributed most to absolute performance were financials, materials and energy.
|
|
↑
|
Individual holdings that contributed to absolute returns were Royal Bank of Canada, Toronto-Dominion Bank and Shopify.
|
|
Top detractors from performance:
|
|
|
↓
|
The sectors that detracted most from absolute performance were industrials and real estate.
|
|
↓
|
Individual holdings that hindered absolute returns included Constellation Software, Thomas Reuters and Waste Connections.
|
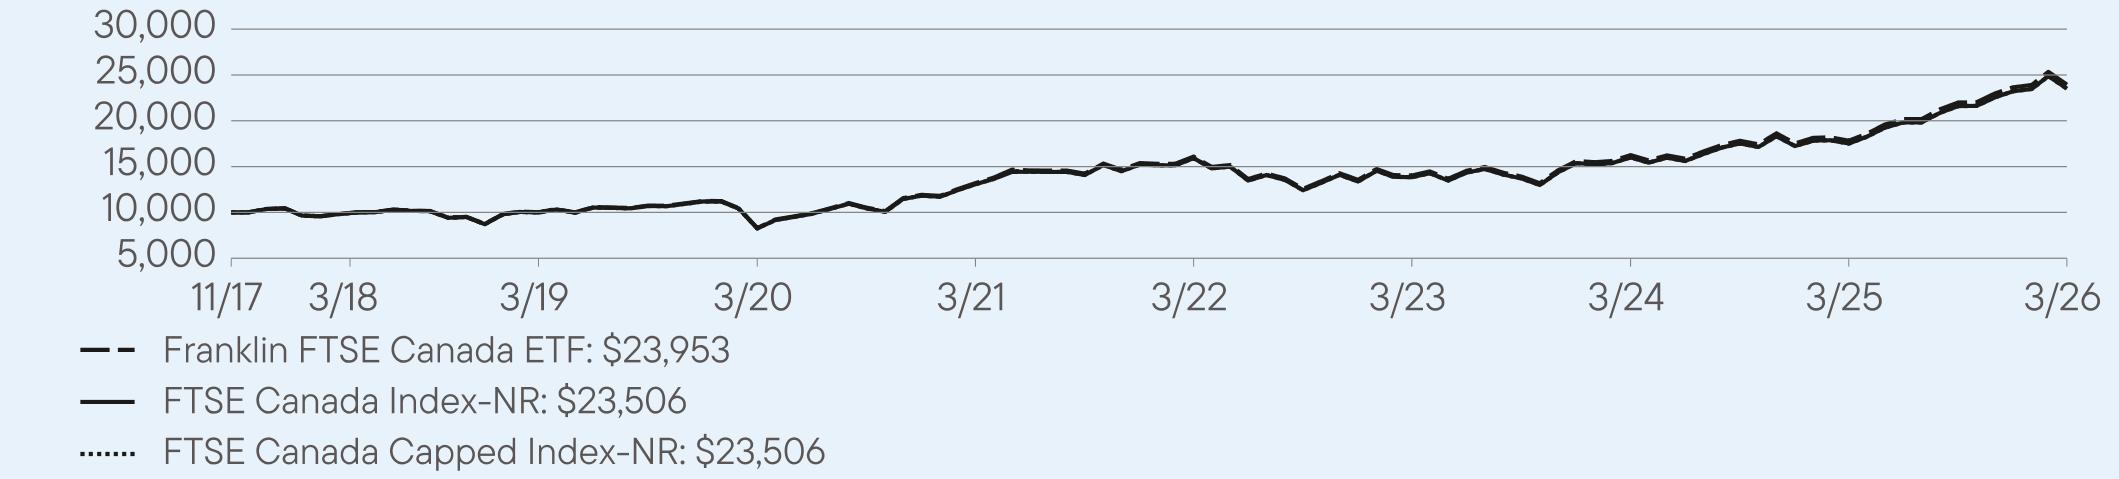
AVERAGE ANNUAL TOTAL RETURNS (%) Period Ended March 31, 2026
|
|
1 Year
|
5 Year
|
Since Inception
(11/2/2017) |
|
Franklin FTSE Canada ETF (NAV)
|
34.36
|
12.66
|
10.95
|
|
FTSE Canada Index-NR
|
34.16
|
12.45
|
10.71
|
|
FTSE Canada Capped Index-NR
|
34.16
|
12.45
|
10.71
|
For current month-end performance, please call Franklin Templeton at (800) DIAL BEN/342-5236 or visit
https://www.franklintempleton.com/investments/options/exchange-traded-funds.
https://www.franklintempleton.com/investments/options/exchange-traded-funds.
Important data provider notices and terms available at www.franklintempletondatasources.com.
KEY FUND STATISTICS (as of March 31, 2026)
|
Total Net Assets
|
$676,928,745
|
|
Total Number of Portfolio Holdings (excludes derivatives, except purchased options, if any)
|
87
|
|
Total Management Fee Paid (based on a unitary fee)
|
$457,777
|
|
Portfolio Turnover Rate
|
17%
|
WHAT DID THE FUND INVEST IN? (as of March 31, 2026)
Portfolio Composition* (% of Total Investments)
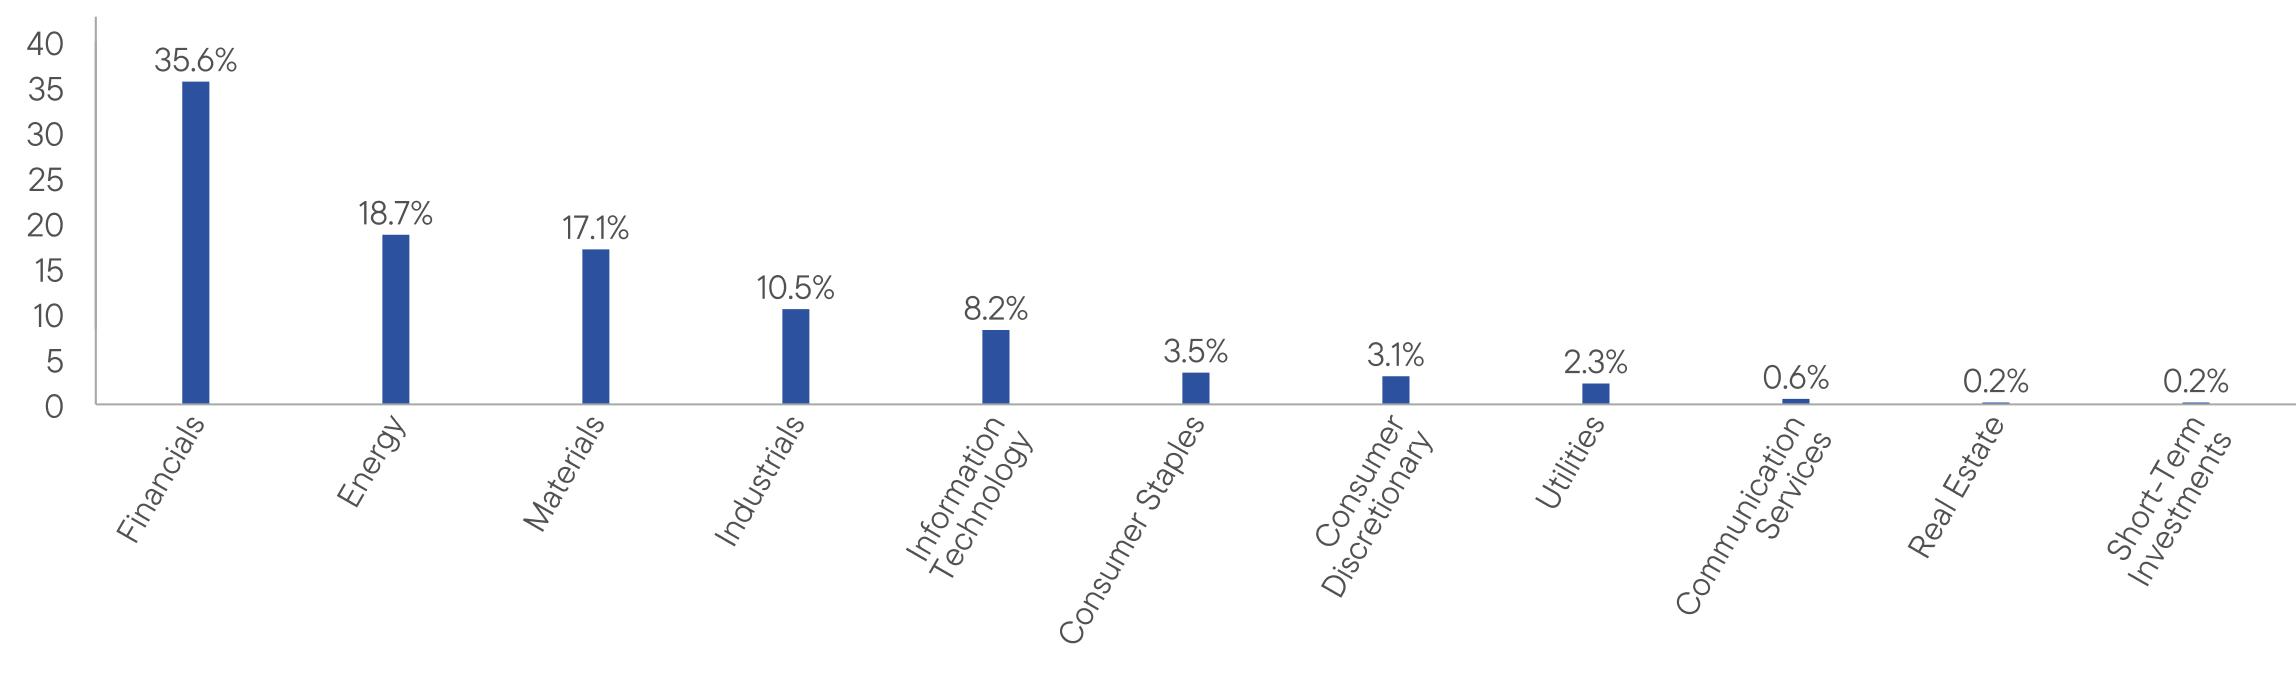
WHAT WERE THE FUND COSTS FOR THE LAST YEAR? (based on a hypothetical $10,000 investment)
|
Fund Name
|
Costs of a $10,000 investment
|
Costs paid as a percentage of a $10,000 investment*
|
|
Franklin FTSE China ETF
|
$20
|
0.19%
|
HOW DID THE FUND PERFORM LAST YEAR AND WHAT AFFECTED ITS PERFORMANCE?
For the twelve months ended March 31, 2026, Franklin FTSE China ETF returned 5.90%. The Fund compares its performance to the FTSE China Capped Index-NR, which returned 6.16% for the same period.
PERFORMANCE HIGHLIGHTS
|
Top contributors to performance:
|
|
|
↑
|
The sectors that contributed most to absolute performance were financials, materials and industrials.
|
|
↑
|
Individual holdings that contributed to absolute returns were China Construction Bank Corp., Industrial and Commercial Bank of China and Zijin Mining Group.
|
|
Top detractors from performance:
|
|
|
↓
|
The sectors that detracted most from absolute performance were consumer discretionary and real estate.
|
|
↓
|
Individual holdings that hindered absolute returns included Xiaomi Corp, Alibaba Group Holding and Meituan.
|
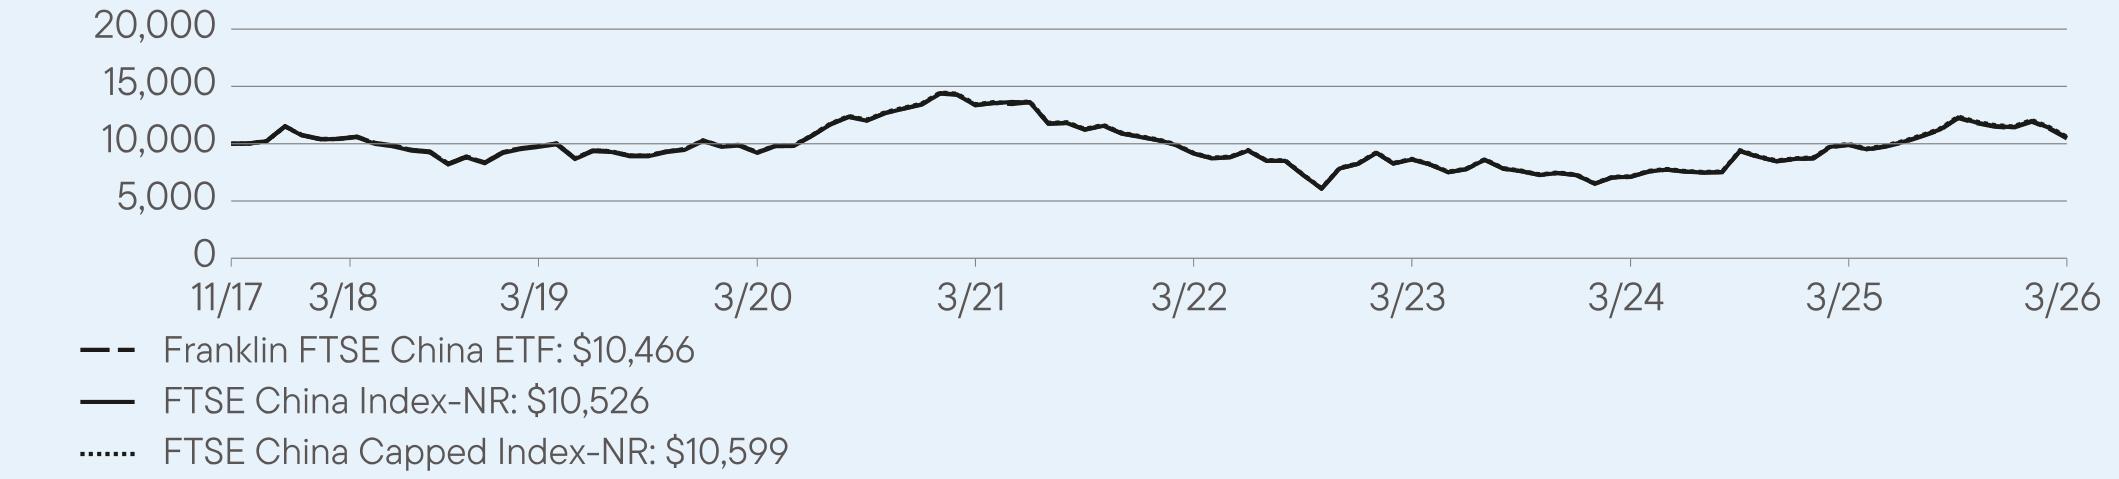
AVERAGE ANNUAL TOTAL RETURNS (%) Period Ended March 31, 2026
|
|
1 Year
|
5 Year
|
Since Inception
(11/2/2017) |
|
Franklin FTSE China ETF (NAV)
|
5.90
|
-4.79
|
0.54
|
|
FTSE China Index-NR
|
6.16
|
-4.64
|
0.69
|
|
FTSE China Capped Index-NR
|
6.16
|
-4.64
|
0.73
|
For current month-end performance, please call Franklin Templeton at (800) DIAL BEN/342-5236 or visit
https://www.franklintempleton.com/investments/options/exchange-traded-funds.
https://www.franklintempleton.com/investments/options/exchange-traded-funds.
Important data provider notices and terms available at www.franklintempletondatasources.com.
KEY FUND STATISTICS (as of March 31, 2026)
|
Total Net Assets
|
$271,927,786
|
|
Total Number of Portfolio Holdings
|
1022
|
|
Total Management Fee Paid (based on a unitary fee)
|
$438,867
|
|
Portfolio Turnover Rate
|
7%
|
WHAT DID THE FUND INVEST IN? (as of March 31, 2026)
Portfolio Composition* (% of Total Investments)
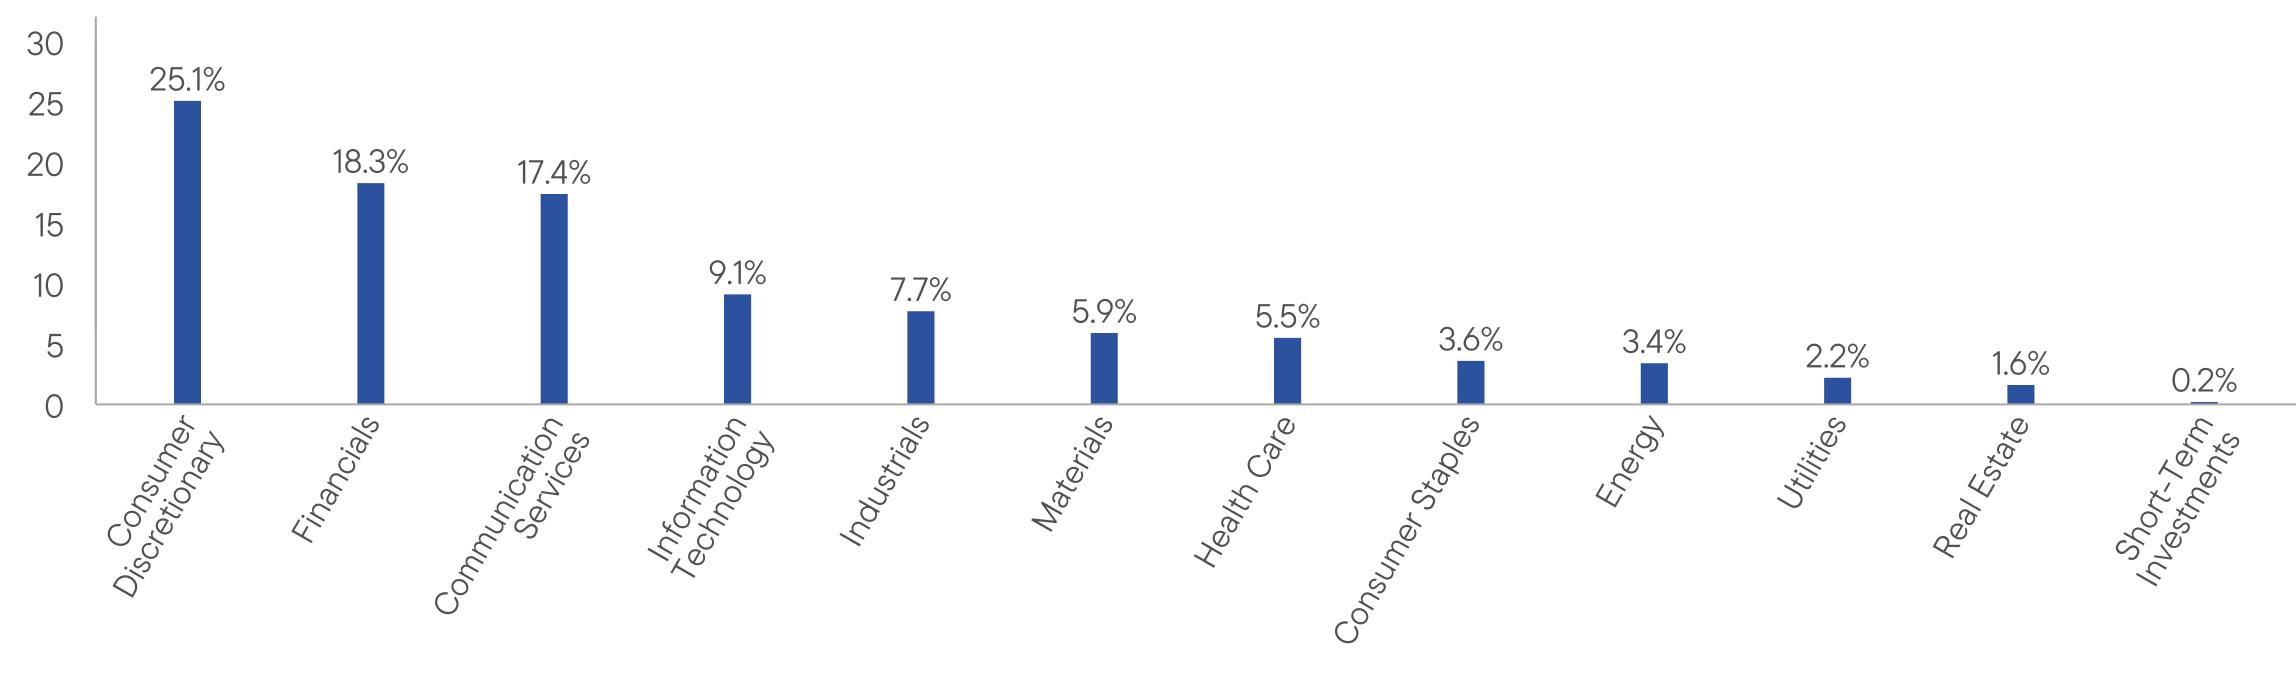
WHAT WERE THE FUND COSTS FOR THE LAST YEAR? (based on a hypothetical $10,000 investment)
|
Fund Name
|
Costs of a $10,000 investment
|
Costs paid as a percentage of a $10,000 investment*
|
|
Franklin FTSE Europe ETF
|
$10
|
0.09%
|
HOW DID THE FUND PERFORM LAST YEAR AND WHAT AFFECTED ITS PERFORMANCE?
For the twelve months ended March 31, 2026, Franklin FTSE Europe ETF returned 19.77%. The Fund compares its performance to the FTSE Developed Europe Capped Index-NR, which returned 19.42% for the same period.
PERFORMANCE HIGHLIGHTS
|
Top contributors to performance:
|
|
|
↑
|
The sectors that contributed most to absolute performance were financials, industrials and information technology.
|
|
↑
|
Individual holdings that contributed to absolute returns were ASML Holding NV, HSBC Holdings Plc and Banco Santander S.A.
|
|
Top detractors from performance:
|
|
|
↓
|
The only sector that detracted from absolute performance was consumer discretionary.
|
|
↓
|
Individual holdings that hindered absolute returns included Novo Nordisk A/S, SAP SE and Relx Plc.
|
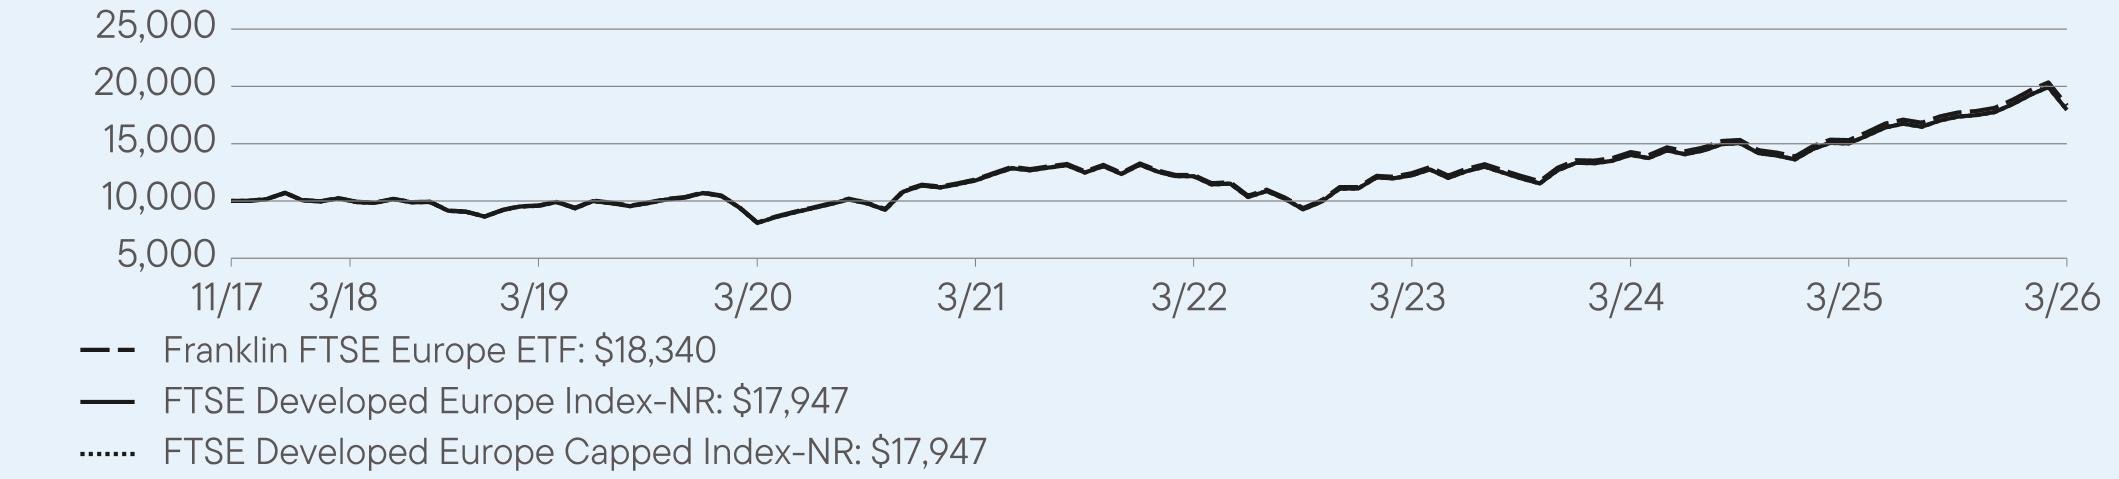
AVERAGE ANNUAL TOTAL RETURNS (%) Period Ended March 31, 2026
|
|
1 Year
|
5 Year
|
Since Inception
(11/2/2017) |
|
Franklin FTSE Europe ETF (NAV)
|
19.77
|
9.07
|
7.48
|
|
FTSE Developed Europe Index-NR
|
19.42
|
8.76
|
7.22
|
|
FTSE Developed Europe Capped Index-NR
|
19.42
|
8.76
|
7.22
|
For current month-end performance, please call Franklin Templeton at (800) DIAL BEN/342-5236 or visit
https://www.franklintempleton.com/investments/options/exchange-traded-funds.
https://www.franklintempleton.com/investments/options/exchange-traded-funds.
Important data provider notices and terms available at www.franklintempletondatasources.com.
KEY FUND STATISTICS (as of March 31, 2026)
|
Total Net Assets
|
$107,072,951
|
|
Total Number of Portfolio Holdings (excludes derivatives, except purchased options, if any)
|
500
|
|
Total Management Fee Paid (based on a unitary fee)
|
$101,144
|
|
Portfolio Turnover Rate
|
5%
|
WHAT DID THE FUND INVEST IN? (as of March 31, 2026)
Portfolio Composition*,† (% of Total Investments)
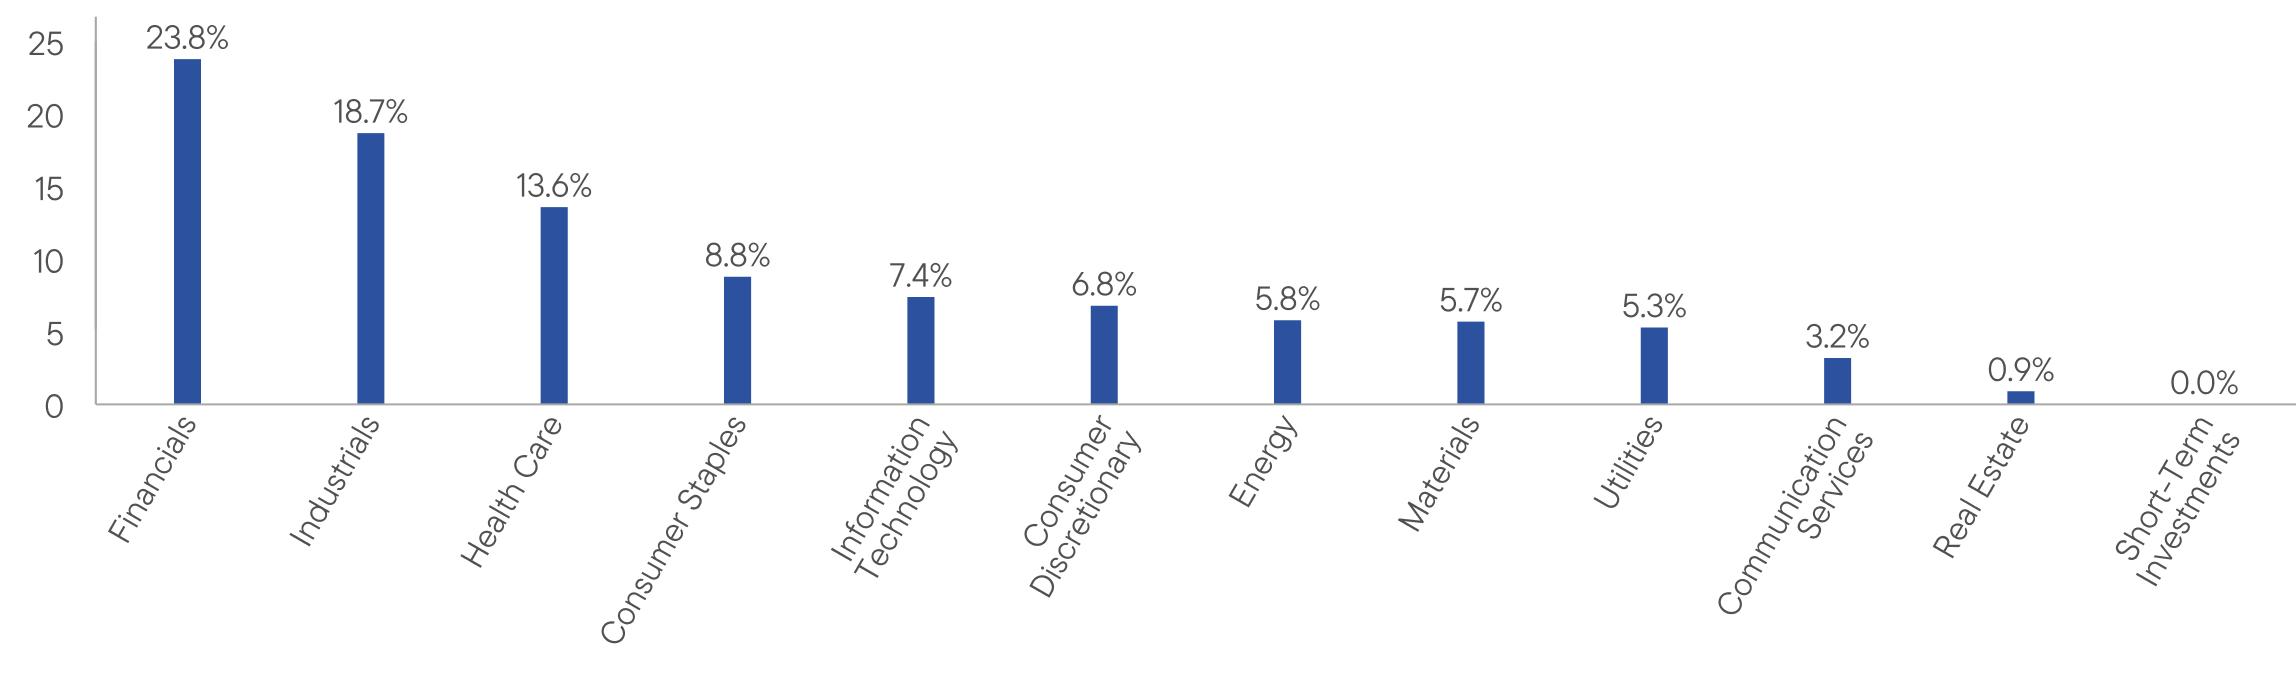
WHAT WERE THE FUND COSTS FOR THE LAST YEAR? (based on a hypothetical $10,000 investment)
|
Fund Name
|
Costs of a $10,000 investment
|
Costs paid as a percentage of a $10,000 investment*
|
|
Franklin FTSE Eurozone ETF
|
$10
|
0.09%
|
HOW DID THE FUND PERFORM LAST YEAR AND WHAT AFFECTED ITS PERFORMANCE?
For the twelve months ended March 31, 2026, Franklin FTSE Eurozone ETF returned 20.09%. The Fund compares its performance to the FTSE Developed Eurozone Index-NR and the Linked FTSE Developed Eurozone Index-NR†, which both returned 19.80% for the same period.
PERFORMANCE HIGHLIGHTS
|
Top contributors to performance:
|
|
|
↑
|
The sectors that most contributed to absolute performance were financials, industrials and information technology.
|
|
↑
|
The individual holdings that most contributed to absolute performance were ASML Holding NV, Siemens Energy AG and Banco Santander, SA.
|
|
Top detractors from performance:
|
|
|
↓
|
The only sector that detracted from absolute performance was consumer discretionary.
|
|
↓
|
The individual holdings that most detracted from absolute performance were SAP SE, Hermes International SCA and Sanofi SA.
|
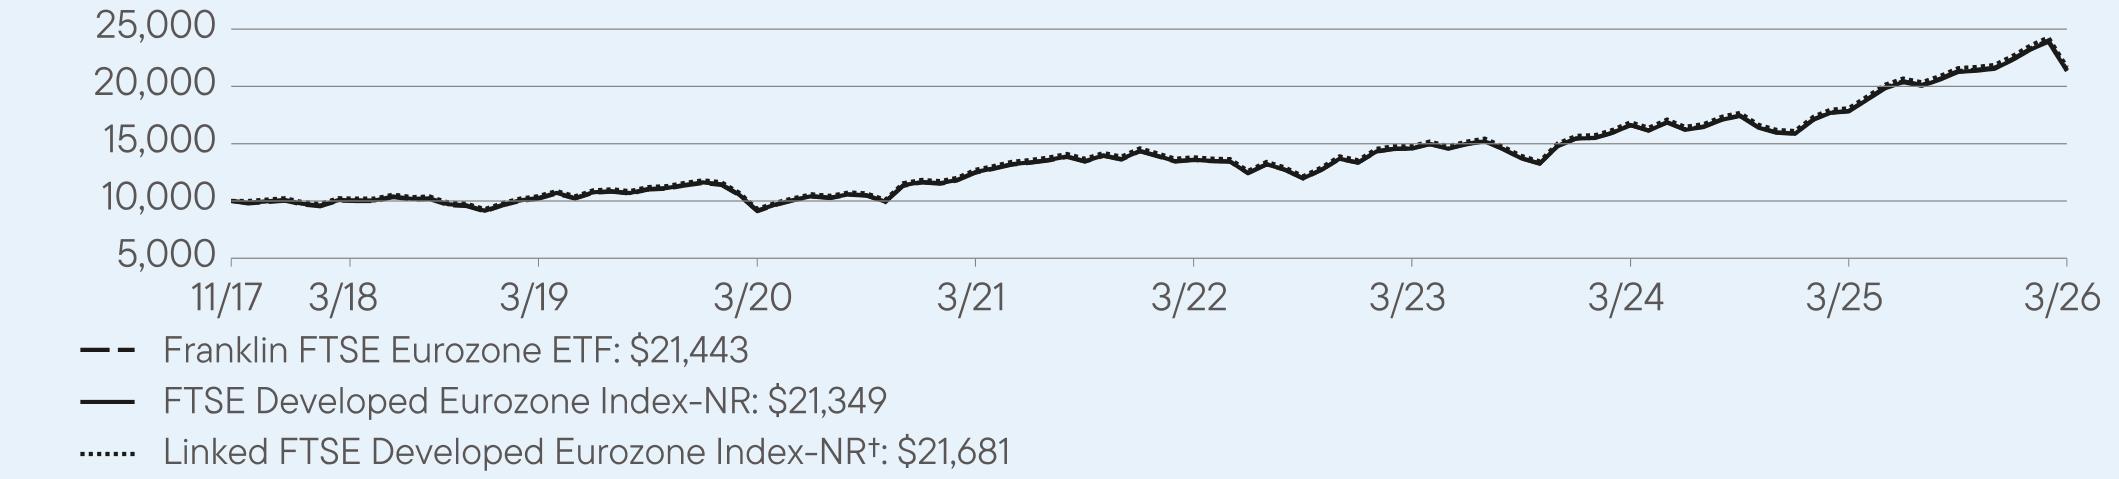
AVERAGE ANNUAL TOTAL RETURNS (%) Period Ended March 31, 2026
|
|
1 Year
|
5 Year
|
Since Inception
(11/2/2017) |
|
Franklin FTSE Eurozone ETF (NAV)
|
20.09
|
11.43
|
9.50
|
|
FTSE Developed Eurozone Index-NR
|
19.80
|
9.09
|
7.02
|
|
Linked FTSE Developed Eurozone Index-NR†
|
19.80
|
11.26
|
9.37
|
For current month-end performance, please call Franklin Templeton at (800) DIAL BEN/342-5236 or visit
https://www.franklintempleton.com/investments/options/exchange-traded-funds.
https://www.franklintempleton.com/investments/options/exchange-traded-funds.
Important data provider notices and terms available at www.franklintempletondatasources.com.
KEY FUND STATISTICS (as of March 31, 2026)
|
Total Net Assets
|
$63,599,483
|
|
Total Number of Portfolio Holdings (excludes derivatives, except purchased options, if any)
|
263
|
|
Total Management Fee Paid (based on a unitary fee)
|
$45,593
|
|
Portfolio Turnover Rate
|
6%
|
WHAT DID THE FUND INVEST IN? (as of March 31, 2026)
Portfolio Composition*,† (% of Total Investments)
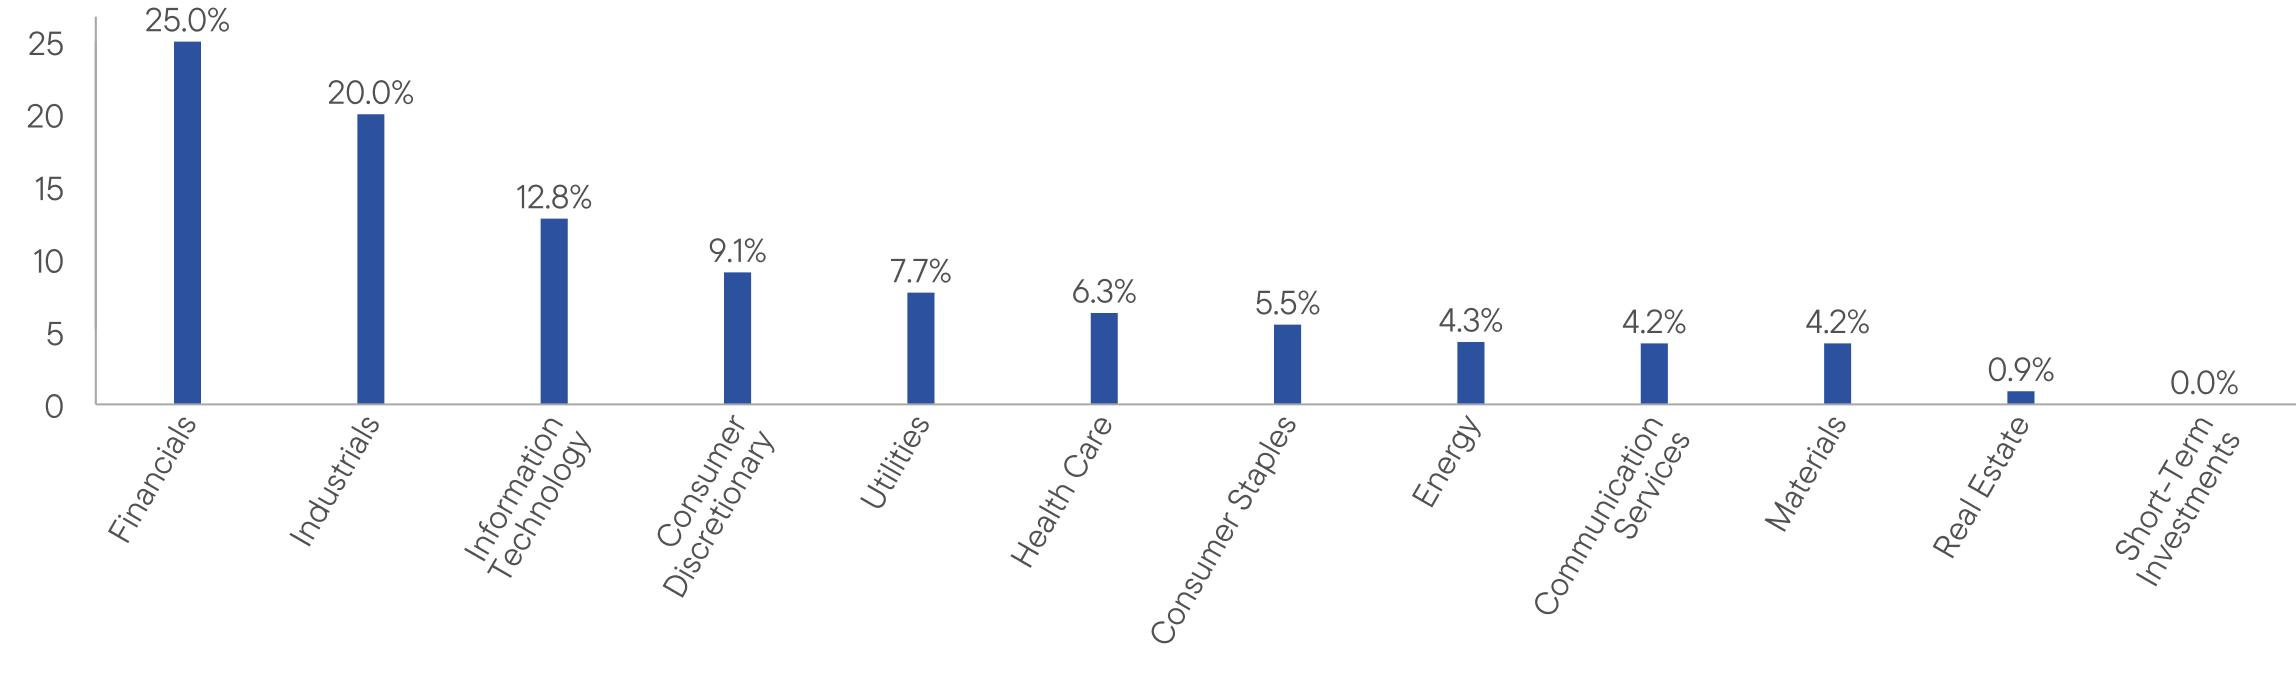
WHAT WERE THE FUND COSTS FOR THE LAST YEAR? (based on a hypothetical $10,000 investment)
|
Fund Name
|
Costs of a $10,000 investment
|
Costs paid as a percentage of a $10,000 investment*
|
|
Franklin FTSE Germany ETF
|
$9
|
0.09%
|
HOW DID THE FUND PERFORM LAST YEAR AND WHAT AFFECTED ITS PERFORMANCE?
For the twelve months ended March 31, 2026, Franklin FTSE Germany ETF returned 8.20%. The Fund compares its performance to the FTSE Germany Capped Index-NR, which returned 7.93% for the same period.
PERFORMANCE HIGHLIGHTS
|
Top contributors to performance:
|
|
|
↑
|
The sectors that contributed most to absolute performance were industrials, financials, and utilities.
|
|
↑
|
Individual holdings that contributed to absolute returns were Siemens Energy AG, Allianz SE, and Bayer AG.
|
|
Top detractors from performance:
|
|
|
↓
|
The sectors that detracted most from absolute performance were information technology, consumer staples, and consumer discretionary.
|
|
↓
|
Individual holdings that hindered absolute returns included SAP SE, Adidas AG, and Beiersdorf AG.
|
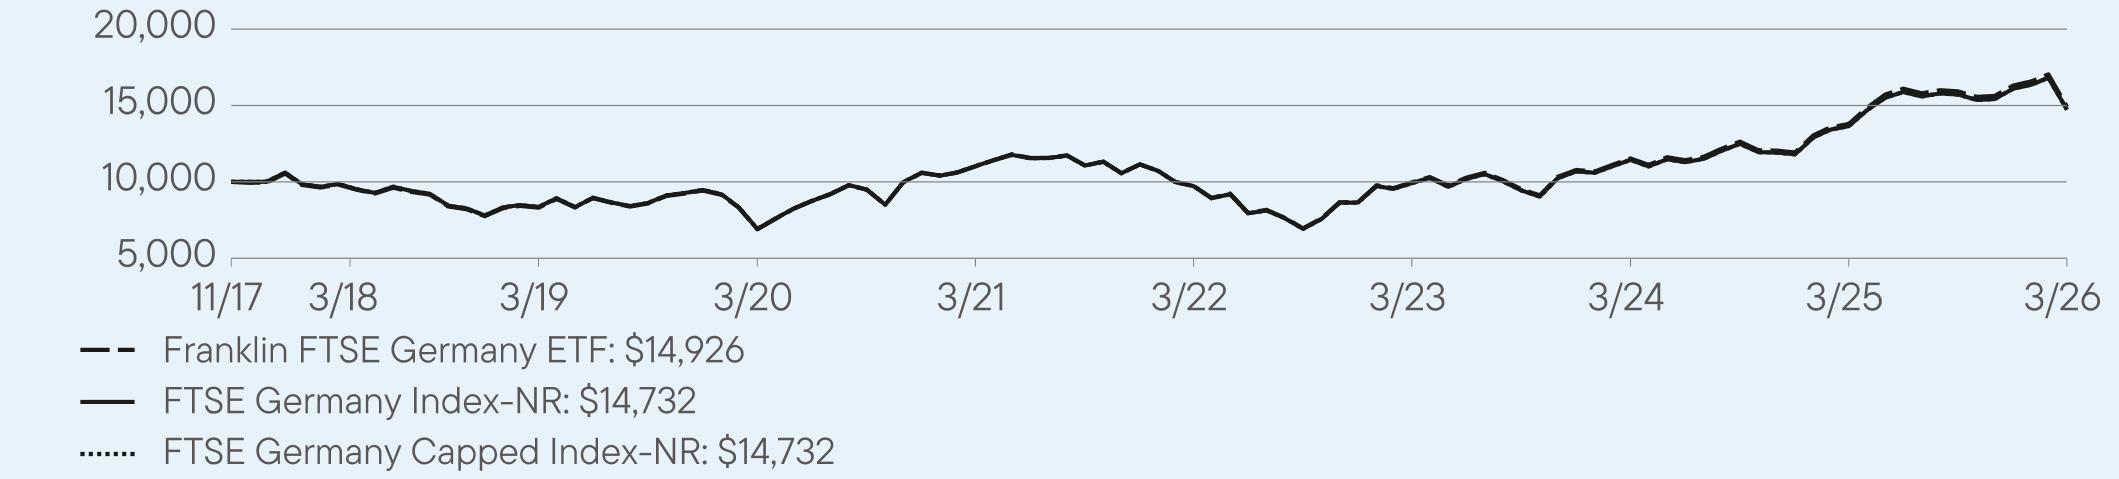
AVERAGE ANNUAL TOTAL RETURNS (%) Period Ended March 31, 2026
|
|
1 Year
|
5 Year
|
Since Inception
(11/2/2017) |
|
Franklin FTSE Germany ETF (NAV)
|
8.20
|
6.26
|
4.88
|
|
FTSE Germany Index-NR
|
7.93
|
5.96
|
4.67
|
|
FTSE Germany Capped Index-NR
|
7.93
|
5.96
|
4.67
|
For current month-end performance, please call Franklin Templeton at (800) DIAL BEN/342-5236 or visit
https://www.franklintempleton.com/investments/options/exchange-traded-funds.
https://www.franklintempleton.com/investments/options/exchange-traded-funds.
Important data provider notices and terms available at www.franklintempletondatasources.com.
KEY FUND STATISTICS (as of March 31, 2026)
|
Total Net Assets
|
$39,992,660
|
|
Total Number of Portfolio Holdings (excludes derivatives, except purchased options, if any)
|
64
|
|
Total Management Fee Paid (based on a unitary fee)
|
$45,152
|
|
Portfolio Turnover Rate
|
6%
|
WHAT DID THE FUND INVEST IN? (as of March 31, 2026)
Portfolio Composition* (% of Total Investments)
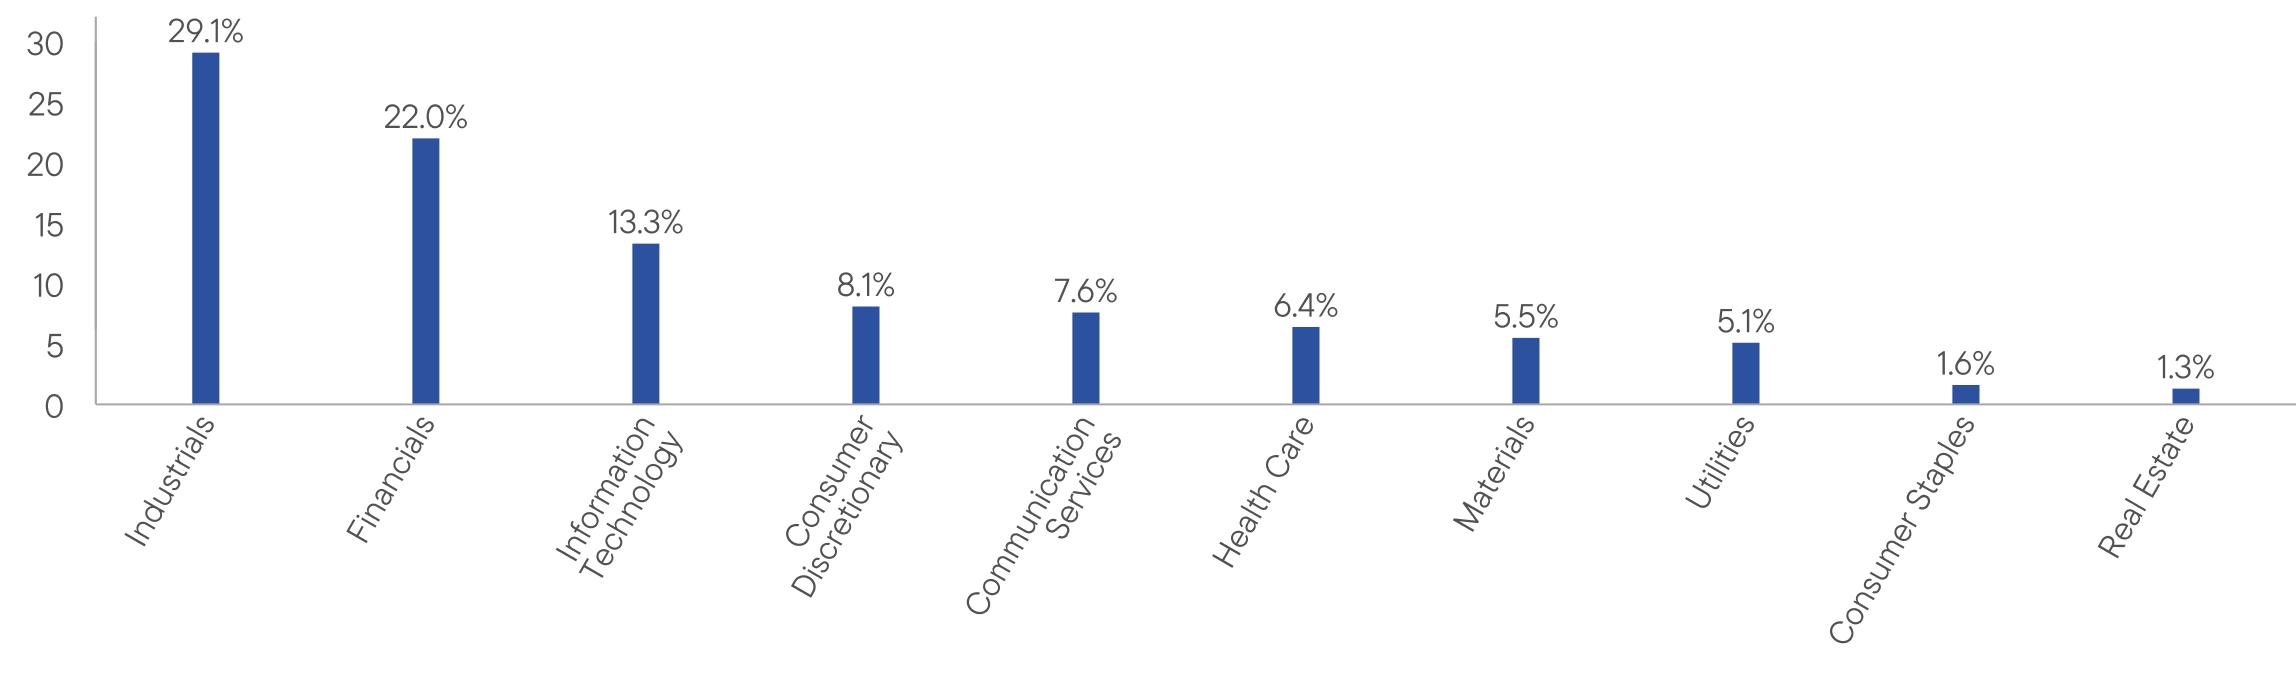
This report describes changes to the Fund that occurred during the reporting period.
WHAT WERE THE FUND COSTS FOR THE LAST YEAR? (based on a hypothetical $10,000 investment)
|
Fund Name
|
Costs of a $10,000 investment
|
Costs paid as a percentage of a $10,000 investment*
|
|
Franklin FTSE India ETF
|
$18
|
0.19%
|
HOW DID THE FUND PERFORM LAST YEAR AND WHAT AFFECTED ITS PERFORMANCE?
For the twelve months ended March 31, 2026, Franklin FTSE India ETF returned -12.17%. The Fund compares its performance to the FTSE India Capped Index-NR, which returned -12.08% for the same period.
PERFORMANCE HIGHLIGHTS
|
Top contributors to performance:
|
|
|
↑
|
On an absolute basis, there were no sectors that contributed to performance.
|
|
↑
|
Individual holdings that contributed to absolute return included Bharti Enterprises Holding PVT Ltd., GE Vernova T&D India Ltd. and Vedanta Ltd.
|
|
Top detractors from performance:
|
|
|
↓
|
The sectors that detracted most from absolute performance were financials, information technology and consumer staples.
|
|
↓
|
Individual holdings that detracted from absolute returns included HDFC Bank, Ltd., Infosys Ltd. and ICICI Bank Ltd.
|
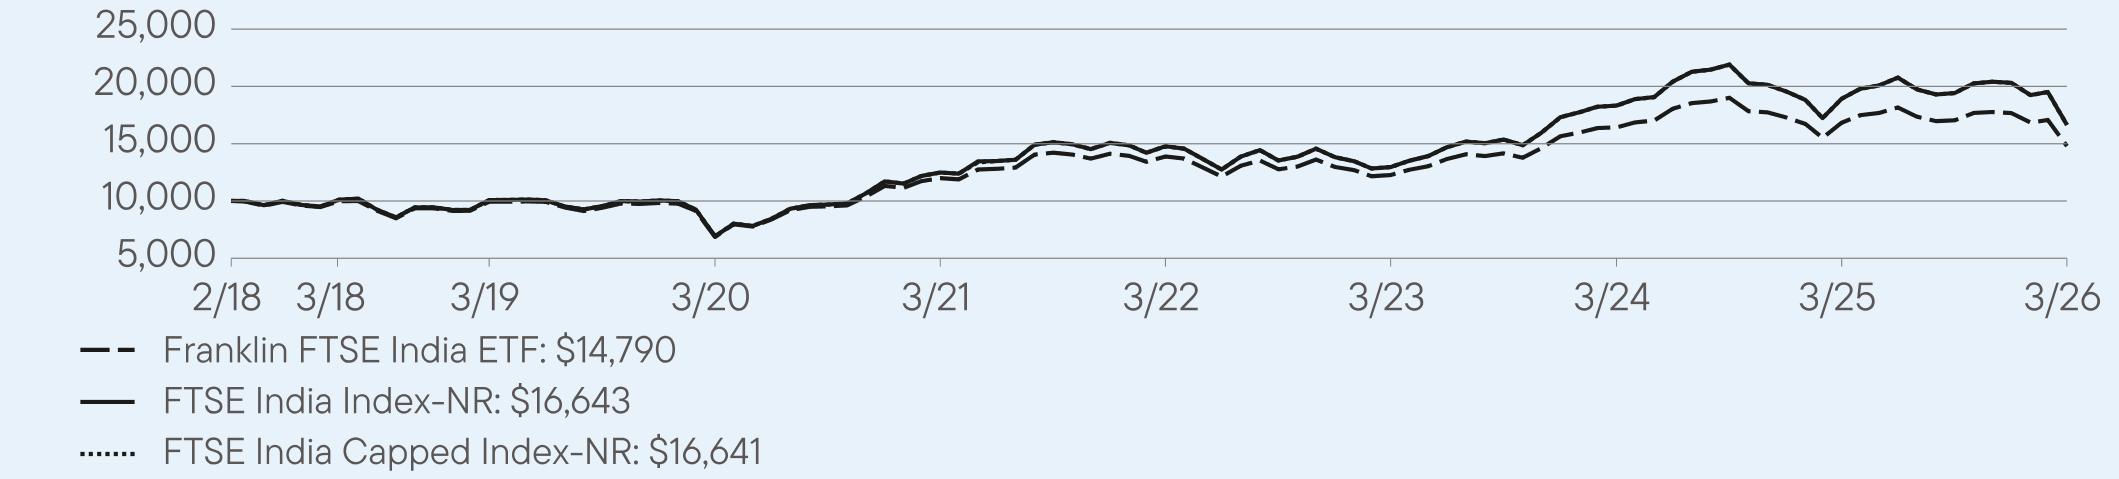
AVERAGE ANNUAL TOTAL RETURNS (%) Period Ended March 31, 2026
|
|
1 Year
|
5 Year
|
Since Inception
(2/6/2018) |
|
Franklin FTSE India ETF (NAV)
|
-12.17
|
4.28
|
4.92
|
|
FTSE India Index-NR
|
-12.08
|
5.91
|
6.40
|
|
FTSE India Capped Index-NR
|
-12.08
|
5.91
|
6.39
|
For current month-end performance, please call Franklin Templeton at (800) DIAL BEN/342-5236 or visit
https://www.franklintempleton.com/investments/options/exchange-traded-funds.
https://www.franklintempleton.com/investments/options/exchange-traded-funds.
Important data provider notices and terms available at www.franklintempletondatasources.com.
KEY FUND STATISTICS (as of March 31, 2026)
|
Total Net Assets
|
$2,456,752,876
|
|
Total Number of Portfolio Holdings (excludes derivatives, except purchased options, if any)
|
273
|
|
Total Management Fee Paid (based on a unitary fee)
|
$4,712,522
|
|
Portfolio Turnover Rate
|
14%
|
WHAT DID THE FUND INVEST IN? (as of March 31, 2026)
Portfolio Composition*,† (% of Total Investments)
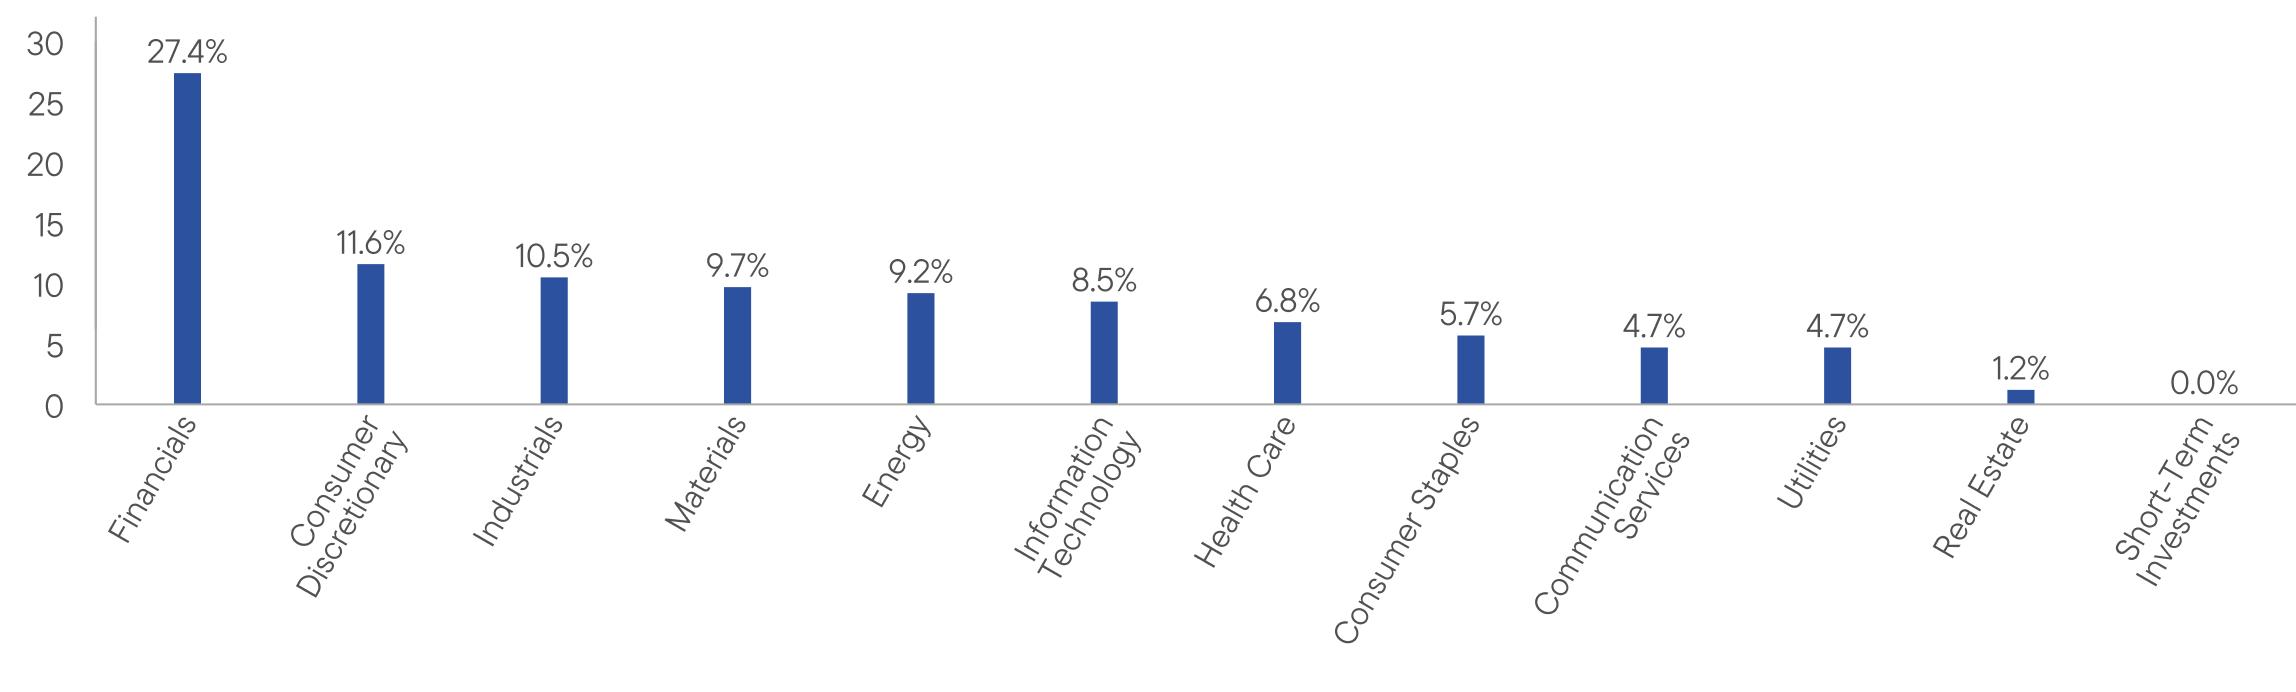
HOW HAS THE FUND CHANGED?
On August 1, 2025, the Fund’s principal investment strategies were revised to reflect the Underlying Index’s (and therefore the Fund’s) increased exposure to the financial services sector.
Related disclosure regarding the risks of investing in the financial services sector was added as a principal risk of the Fund.
This is a summary of certain changes to the Fund since April 1, 2025. For more complete information, you may review the Fund’s current prospectus and any applicable supplements and the Fund’s next prospectus, which we expect to be available by August 1, 2026, at https://www.franklintempleton.com/regulatory-fund-documents or upon request at (800) DIAL BEN/342-5236 or
ETFs-Product@franklintempleton.com.
ETFs-Product@franklintempleton.com.
WHAT WERE THE FUND COSTS FOR THE LAST YEAR? (based on a hypothetical $10,000 investment)
|
Fund Name
|
Costs of a $10,000 investment
|
Costs paid as a percentage of a $10,000 investment*
|
|
Franklin FTSE Japan ETF
|
$10
|
0.09%
|
HOW DID THE FUND PERFORM LAST YEAR AND WHAT AFFECTED ITS PERFORMANCE?
For the twelve months ended March 31, 2026, Franklin FTSE Japan ETF returned 26.40%. The Fund compares its performance to the FTSE Japan Capped Index-NR, which returned 26.36% for the same period.
PERFORMANCE HIGHLIGHTS
|
Top contributors to performance:
|
|
|
↑
|
The sectors that contributed most to absolute performance were industrials, information technology and financials.
|
|
↑
|
Individual holdings that contributed to absolute returns included Advantest, Softbank Group and Mitsubishi.
|
|
Top detractors from performance:
|
|
|
↓
|
There were no sectors that detracted from absolute performance.
|
|
↓
|
Individual holdings that detracted from absolute returns were Sony Group, Daiichi Sankyo and Keyence.
|
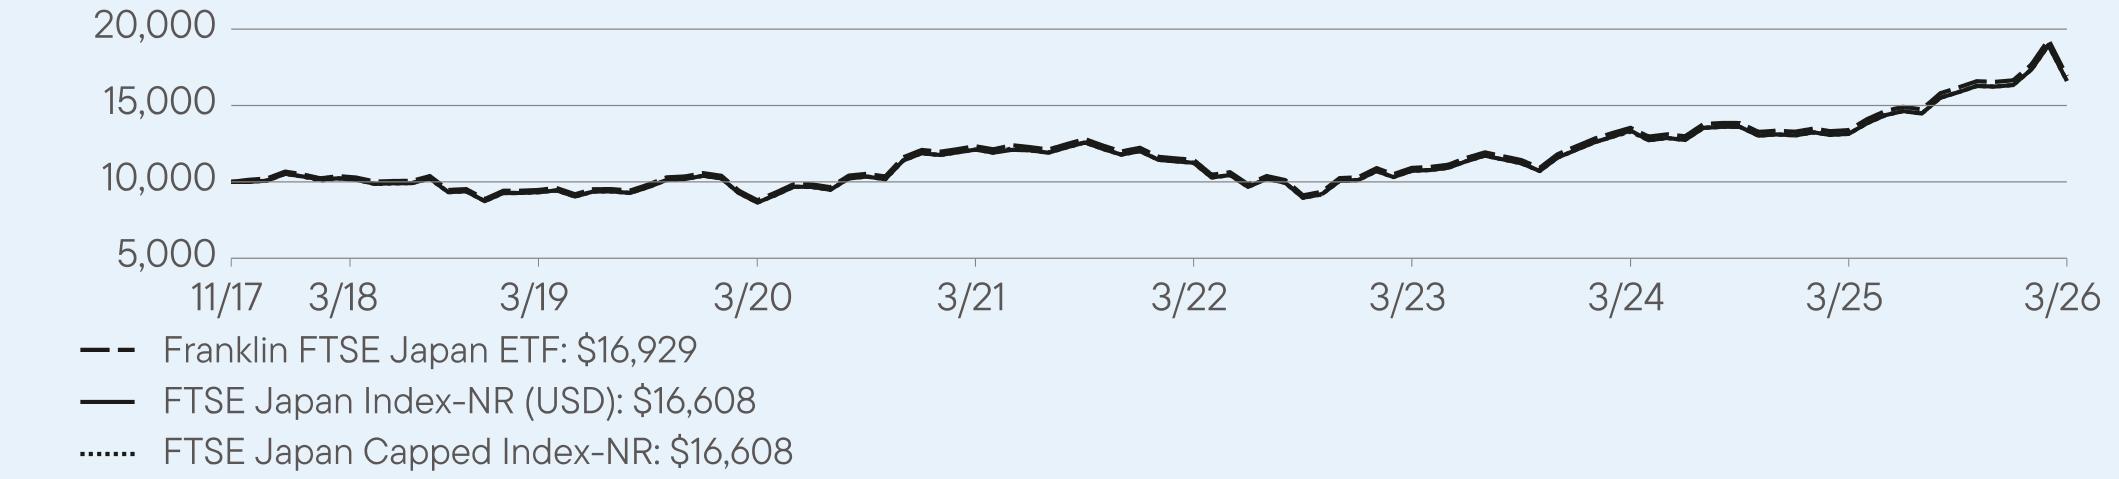
AVERAGE ANNUAL TOTAL RETURNS (%) Period Ended March 31, 2026
|
|
1 Year
|
5 Year
|
Since Inception
(11/2/2017) |
|
Franklin FTSE Japan ETF (NAV)
|
26.40
|
6.53
|
6.46
|
|
FTSE Japan Index-NR (USD)
|
26.36
|
6.52
|
6.41
|
|
FTSE Japan Capped Index-NR
|
26.36
|
6.52
|
6.41
|
For current month-end performance, please call Franklin Templeton at (800) DIAL BEN/342-5236 or visit
https://www.franklintempleton.com/investments/options/exchange-traded-funds.
https://www.franklintempleton.com/investments/options/exchange-traded-funds.
Important data provider notices and terms available at www.franklintempletondatasources.com.
KEY FUND STATISTICS (as of March 31, 2026)
|
Total Net Assets
|
$2,896,359,147
|
|
Total Number of Portfolio Holdings (excludes derivatives, except purchased options, if any)
|
478
|
|
Total Management Fee Paid (based on a unitary fee)
|
$2,187,146
|
|
Portfolio Turnover Rate
|
5%
|
WHAT DID THE FUND INVEST IN? (as of March 31, 2026)
Portfolio Composition* (% of Total Investments)
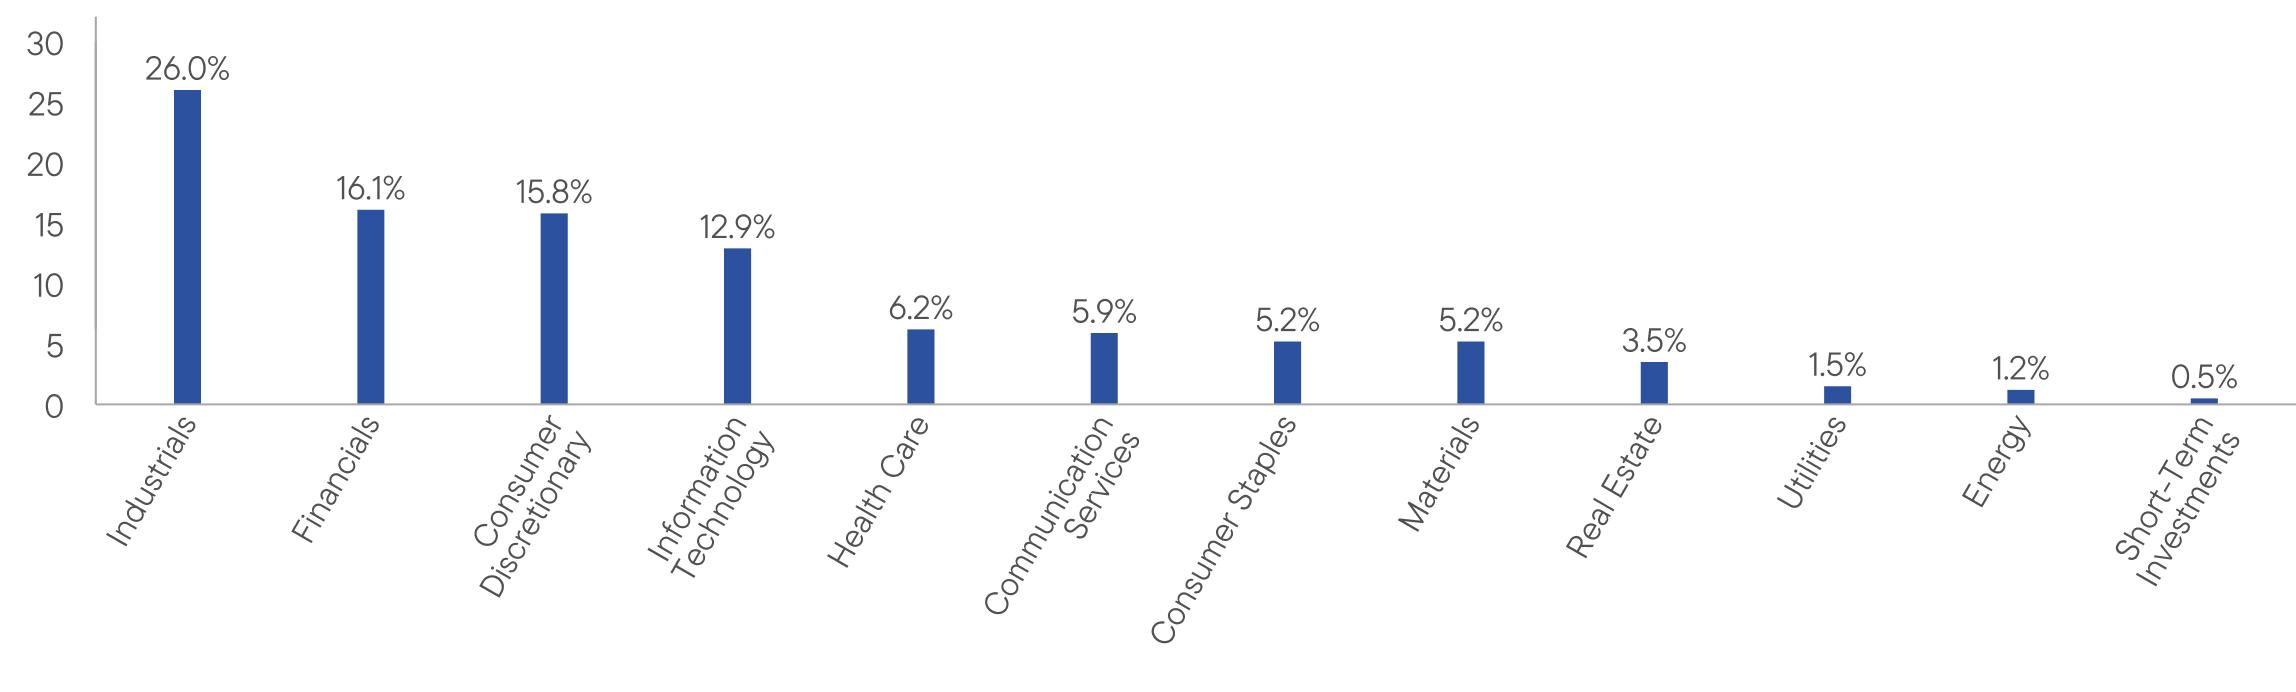
WHAT WERE THE FUND COSTS FOR THE LAST YEAR? (based on a hypothetical $10,000 investment)
|
Fund Name
|
Costs of a $10,000 investment
|
Costs paid as a percentage of a $10,000 investment*
|
|
Franklin FTSE Japan Hedged ETF
|
$11
|
0.09%
|
HOW DID THE FUND PERFORM LAST YEAR AND WHAT AFFECTED ITS PERFORMANCE?
For the twelve months ended March 31, 2026, Franklin FTSE Japan Hedged ETF returned 39.06%. The Fund compares its performance to the FTSE Japan Capped Hedged Index-NR, which returned 38.96% for the same period.
PERFORMANCE HIGHLIGHTS
|
Top contributors to performance:
|
|
|
↑
|
The sectors that contributed most to absolute performance were industrials, information technology and financials.
|
|
↑
|
Individual holdings that contributed to absolute returns were Advantest, Softbank Group and Mitsubishi.
|
|
Top detractors from performance:
|
|
|
↓
|
There were no sectors that detracted from absolute performance.
|
|
↓
|
Individual holdings that hindered absolute returns included Sony Group, Daiichi Sankyo and Terumo.
|
Use of derivatives and the impact on performance:
The Fund utilized cash forwards in order to seek to replicate the hedge impact incorporated in the calculation of the Underlying Index, which contributed to performance.
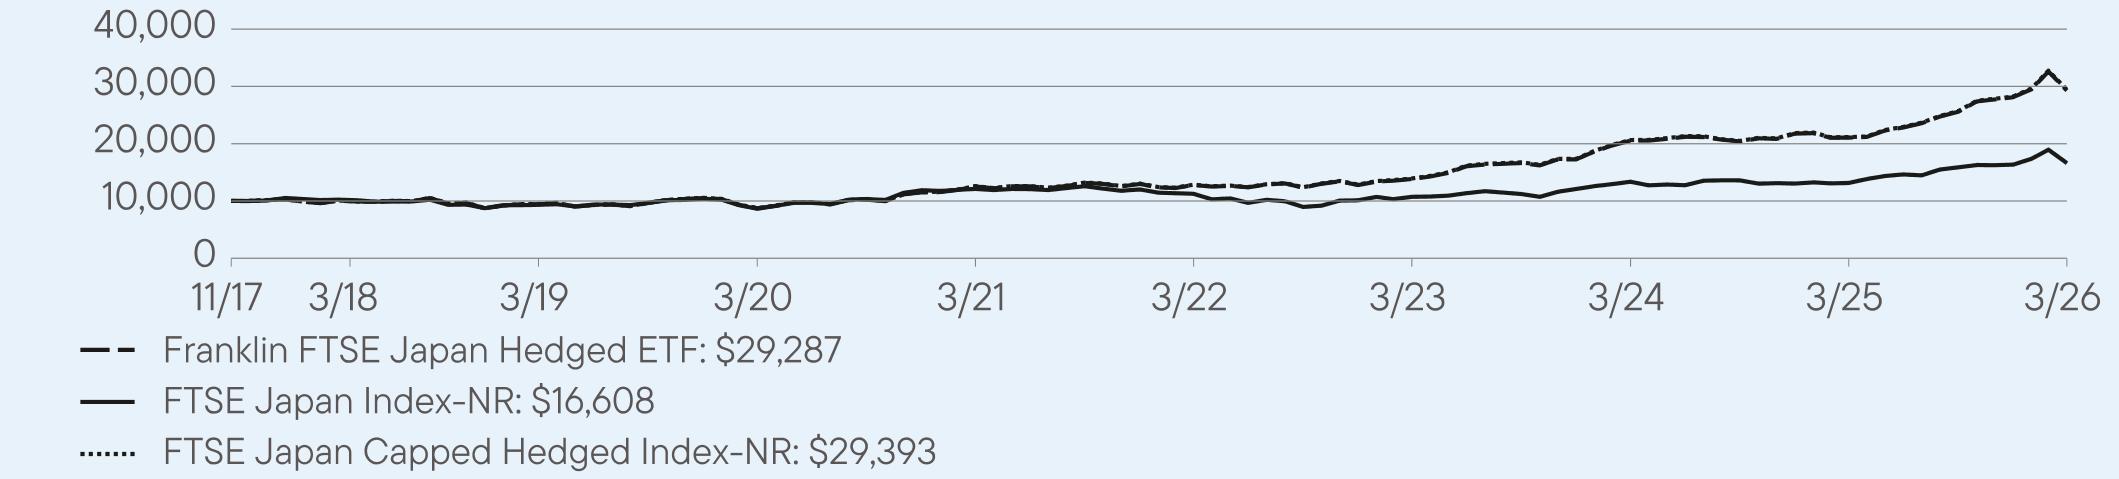
AVERAGE ANNUAL TOTAL RETURNS (%) Period Ended March 31, 2026
|
|
1 Year
|
5 Year
|
Since Inception
(11/2/2017) |
|
Franklin FTSE Japan Hedged ETF (NAV)
|
39.06
|
18.48
|
13.63
|
|
FTSE Japan Index-NR
|
26.36
|
6.52
|
6.41
|
|
FTSE Japan Capped Hedged Index-NR
|
38.96
|
18.47
|
13.67
|
For current month-end performance, please call Franklin Templeton at (800) DIAL BEN/342-5236 or visit
https://www.franklintempleton.com/investments/options/exchange-traded-funds.
https://www.franklintempleton.com/investments/options/exchange-traded-funds.
Important data provider notices and terms available at www.franklintempletondatasources.com.
KEY FUND STATISTICS (as of March 31, 2026)
|
Total Net Assets
|
$132,572,828
|
|
Total Number of Portfolio Holdings (excludes derivatives, except purchased options, if any)
|
478
|
|
Total Management Fee Paid (based on a unitary fee)
|
$93,834
|
|
Portfolio Turnover Rate
|
18%
|
WHAT DID THE FUND INVEST IN? (as of March 31, 2026)
Portfolio Composition* (% of Total Investments)
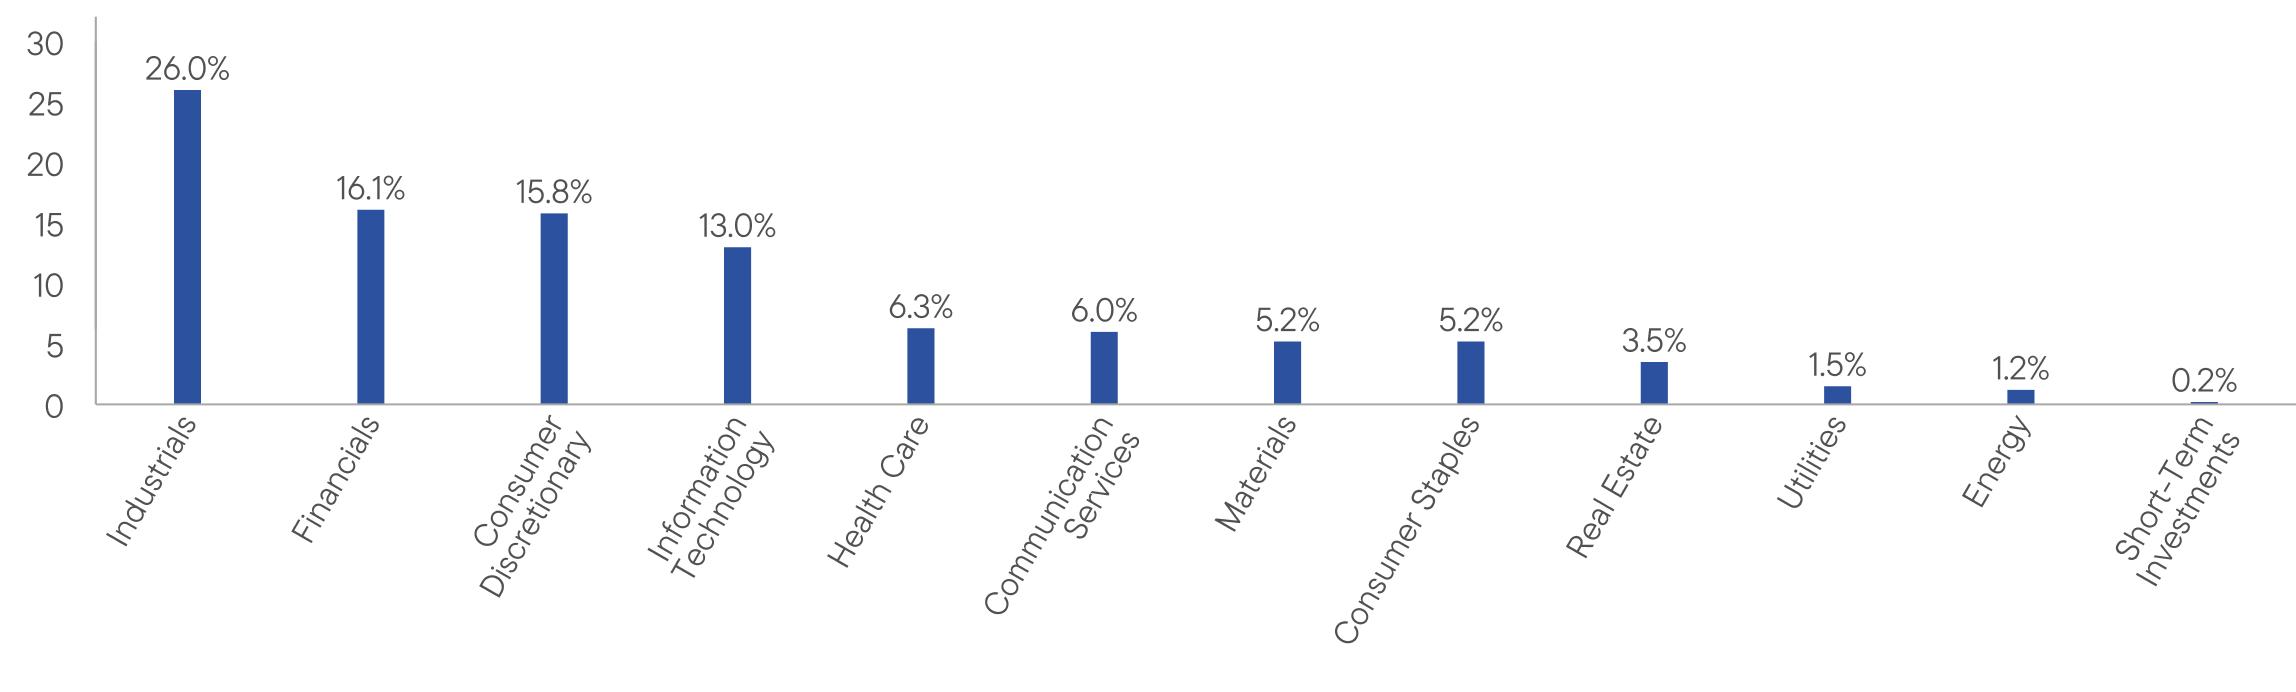
WHAT WERE THE FUND COSTS FOR THE LAST YEAR? (based on a hypothetical $10,000 investment)
|
Fund Name
|
Costs of a $10,000 investment
|
Costs paid as a percentage of a $10,000 investment*
|
|
Franklin FTSE Latin America ETF
|
$24
|
0.19%
|
HOW DID THE FUND PERFORM LAST YEAR AND WHAT AFFECTED ITS PERFORMANCE?
For the twelve months ended March 31, 2026, Franklin FTSE Latin America ETF returned 53.19%. The Fund compares its performance to the FTSE Latin America Capped Index-NR, which returned 53.49% for the same period.
PERFORMANCE HIGHLIGHTS
|
Top contributors to performance:
|
|
|
↑
|
The sectors that contributed most to absolute performance were financials, materials and utilities.
|
|
↑
|
Individual holdings that contributed to absolute returns were Itau Unibanco Holdings SA, Vale SA and Grupo Mexico SAB de CV.
|
|
Top detractors from performance:
|
|
|
↓
|
There were no sectors that detracted from absolute performance.
|
|
↓
|
Individual holdings that hindered absolute returns included Ambipar Participacoes e Empreendimentos SA, Banco do Brasil SA and Hapvida Participacoes e Investimentos SA.
|
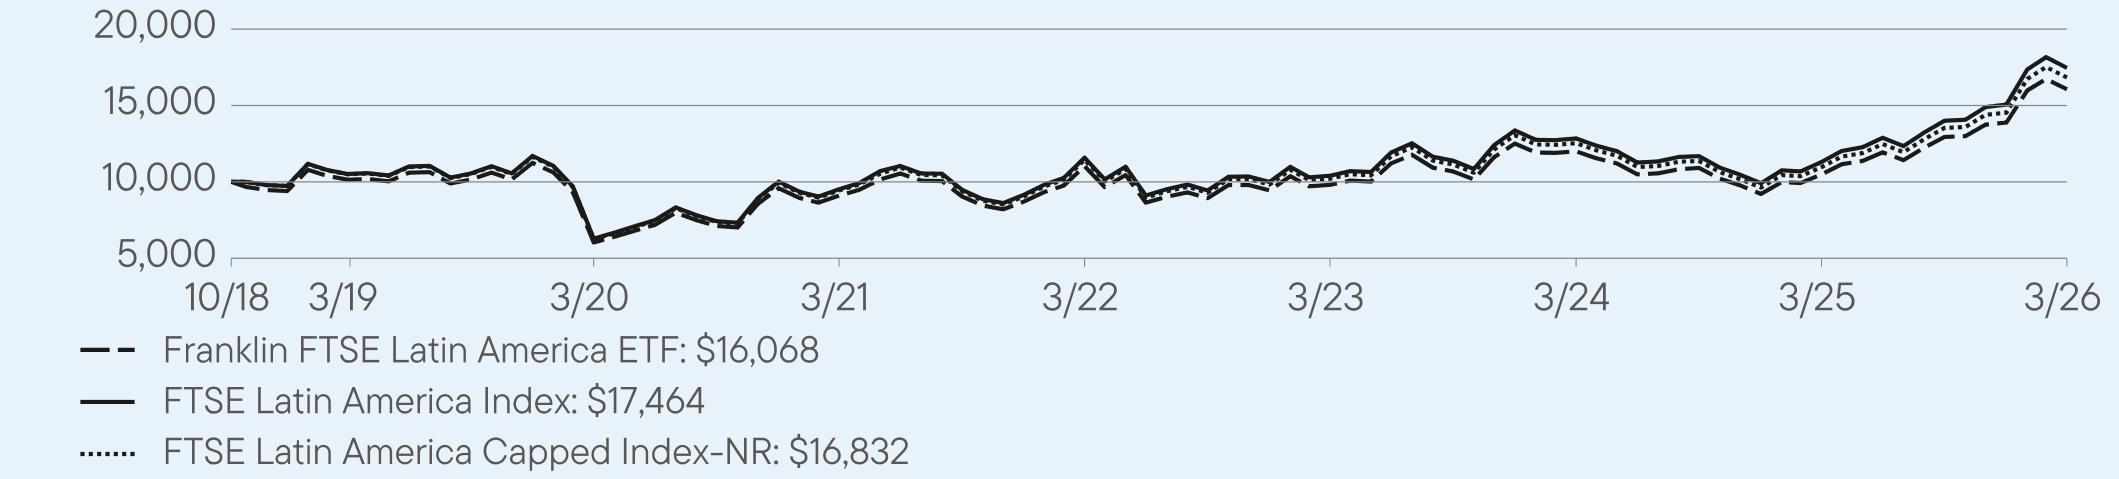
AVERAGE ANNUAL TOTAL RETURNS (%) Period Ended March 31, 2026
|
|
1 Year
|
5 Year
|
Since Inception
(10/9/2018) |
|
Franklin FTSE Latin America ETF (NAV)
|
53.19
|
12.04
|
6.55
|
|
FTSE Latin America Index
|
54.50
|
12.90
|
7.26
|
|
FTSE Latin America Capped Index-NR
|
53.49
|
12.26
|
6.73
|
For current month-end performance, please call Franklin Templeton at (800) DIAL BEN/342-5236 or visit
https://www.franklintempleton.com/investments/options/exchange-traded-funds.
https://www.franklintempleton.com/investments/options/exchange-traded-funds.
Important data provider notices and terms available at www.franklintempletondatasources.com.
KEY FUND STATISTICS (as of March 31, 2026)
|
Total Net Assets
|
$89,173,858
|
|
Total Number of Portfolio Holdings (excludes derivatives, except purchased options, if any)
|
131
|
|
Total Management Fee Paid (based on a unitary fee)
|
$85,493
|
|
Portfolio Turnover Rate
|
12%
|
WHAT DID THE FUND INVEST IN? (as of March 31, 2026)
Portfolio Composition*,† (% of Total Investments)
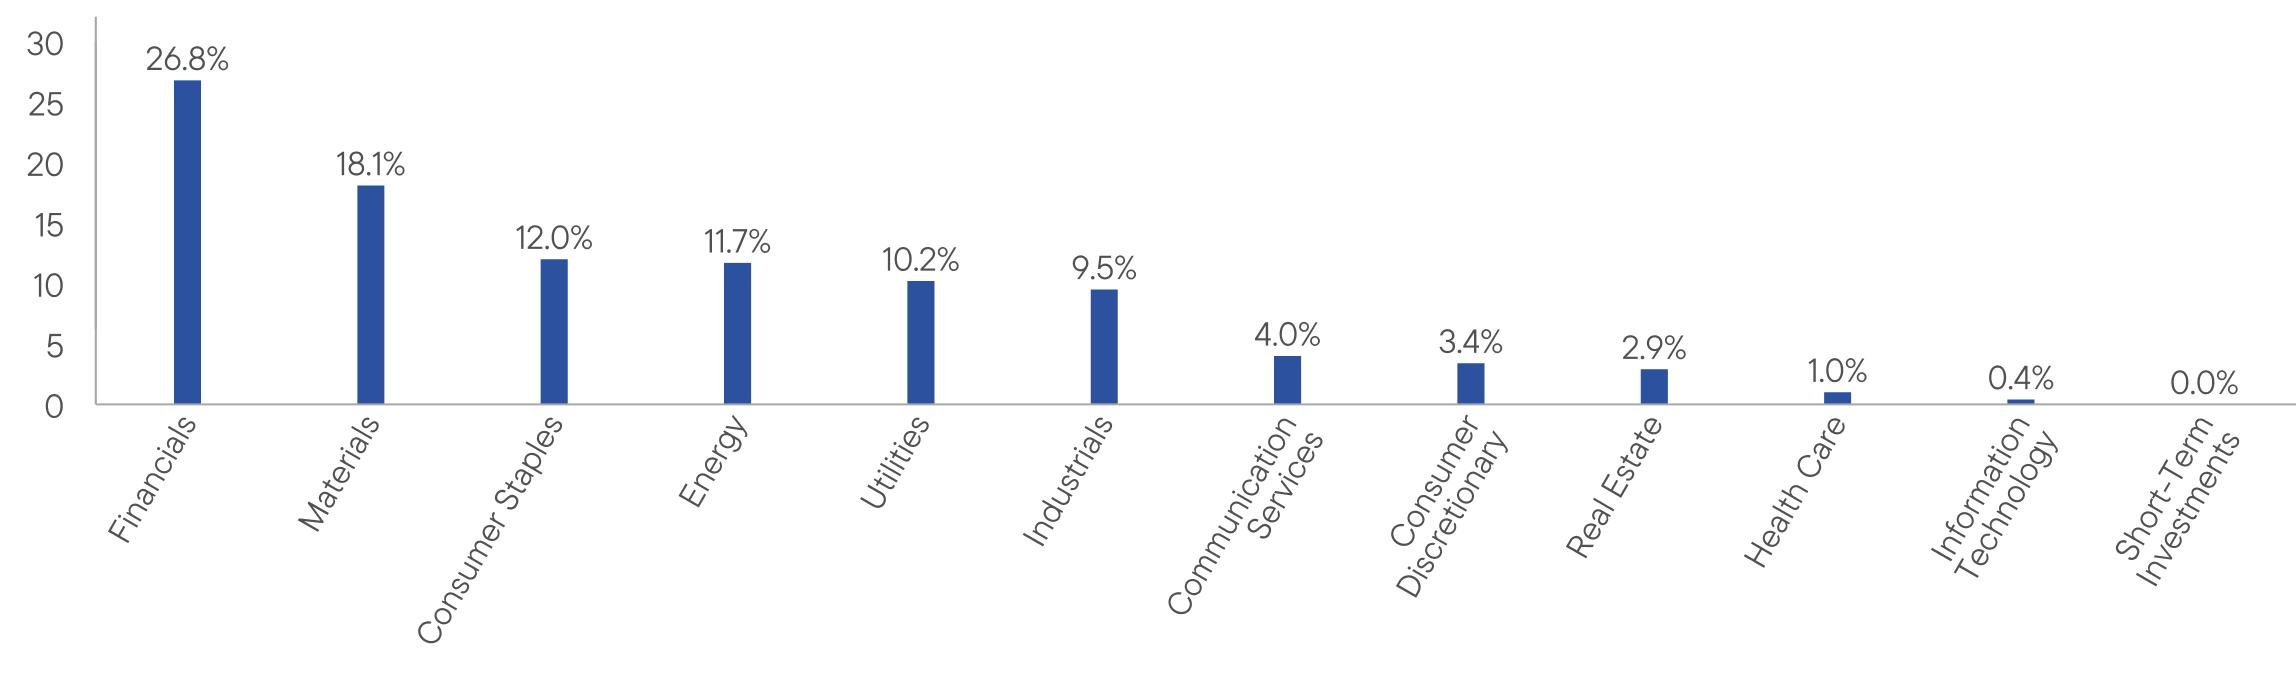
WHAT WERE THE FUND COSTS FOR THE LAST YEAR? (based on a hypothetical $10,000 investment)
|
Fund Name
|
Costs of a $10,000 investment
|
Costs paid as a percentage of a $10,000 investment*
|
|
Franklin FTSE Mexico ETF
|
$24
|
0.19%
|
HOW DID THE FUND PERFORM LAST YEAR AND WHAT AFFECTED ITS PERFORMANCE?
For the twelve months ended March 31, 2026, Franklin FTSE Mexico ETF returned 52.06%. The Fund compares its performance to the FTSE Mexico Capped Index-NR, which returned 52.46% for the same period.
PERFORMANCE HIGHLIGHTS
|
Top contributors to performance:
|
|
|
↑
|
The sectors that contributed most to absolute performance were materials, financials and consumer staples.
|
|
↑
|
Individual holdings that contributed to absolute returns included Grupo Mexico SAB de CV, Grupo Financiero Banorte SAB de CV and America Movil SAB de CV.
|
There were no significant detractors from performance during the period.
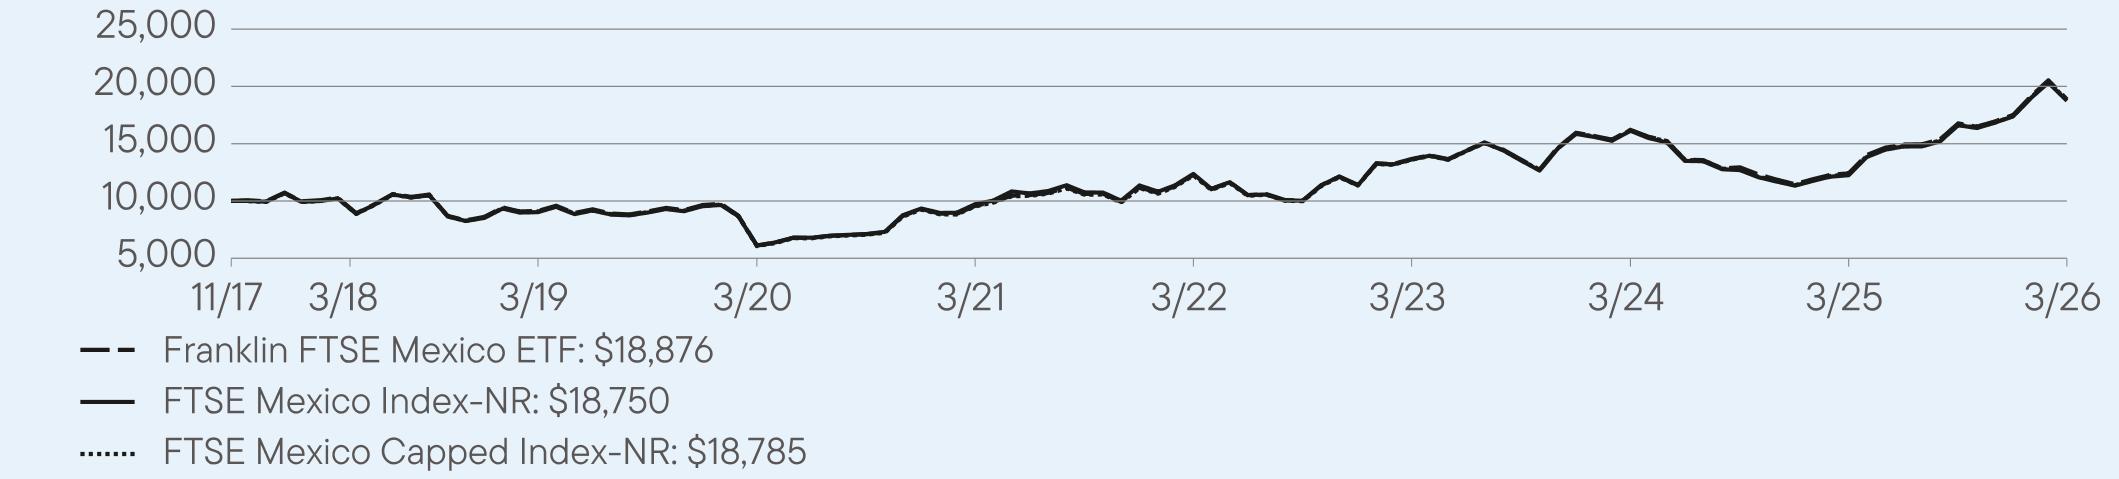
AVERAGE ANNUAL TOTAL RETURNS (%) Period Ended March 31, 2026
|
|
1 Year
|
5 Year
|
Since Inception
(11/3/2017) |
|
Franklin FTSE Mexico ETF (NAV)
|
52.06
|
14.53
|
7.85
|
|
FTSE Mexico Index-NR
|
53.04
|
14.05
|
7.82
|
|
FTSE Mexico Capped Index-NR
|
52.46
|
14.54
|
7.87
|
For current month-end performance, please call Franklin Templeton at (800) DIAL BEN/342-5236 or visit
https://www.franklintempleton.com/investments/options/exchange-traded-funds.
https://www.franklintempleton.com/investments/options/exchange-traded-funds.
Important data provider notices and terms available at www.franklintempletondatasources.com.
KEY FUND STATISTICS (as of March 31, 2026)
|
Total Net Assets
|
$87,555,308
|
|
Total Number of Portfolio Holdings
|
35
|
|
Total Management Fee Paid (based on a unitary fee)
|
$123,298
|
|
Portfolio Turnover Rate
|
21%
|
WHAT DID THE FUND INVEST IN? (as of March 31, 2026)
Portfolio Composition*,† (% of Total Investments)
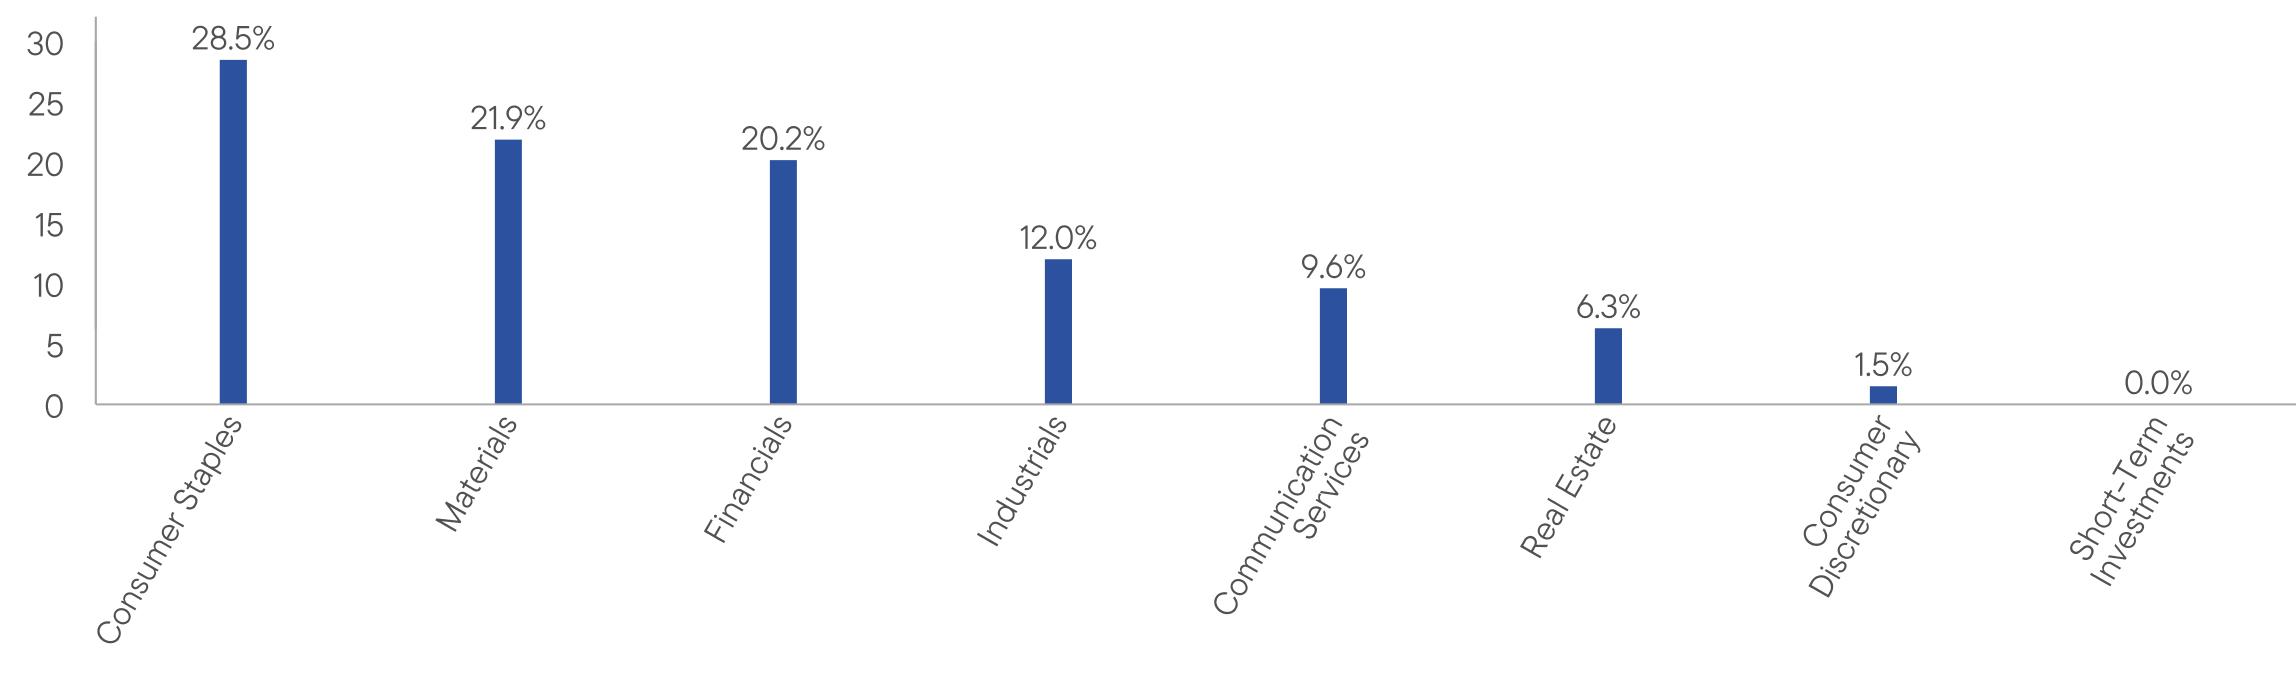
WHAT WERE THE FUND COSTS FOR THE LAST YEAR? (based on a hypothetical $10,000 investment)
|
Fund Name
|
Costs of a $10,000 investment
|
Costs paid as a percentage of a $10,000 investment*
|
|
Franklin FTSE Saudi Arabia ETF
|
$39
|
0.39%
|
HOW DID THE FUND PERFORM LAST YEAR AND WHAT AFFECTED ITS PERFORMANCE?
For the twelve months ended March 31, 2026, Franklin FTSE Saudi Arabia ETF returned -1.07%. The Fund compares its performance to the FTSE Saudi Arabia Capped Index-NR, which returned -0.72% for the same period.
PERFORMANCE HIGHLIGHTS
|
Top contributors to performance:
|
|
|
↑
|
The sectors that contributed most to absolute performance were materials, financials and energy.
|
|
↑
|
Individual holdings that contributed to absolute returns were Saudi Arabian Mining Co., Saudi National Bank and Al Rajhi Bank.
|
|
Top detractors from performance:
|
|
|
↓
|
The sectors that detracted most from absolute performance were utilities, information technology and consumer staples.
|
|
↓
|
Individual holdings that hindered absolute returns included ACWA Power Co., Elm Co. and Al Marai Co. JSC.
|
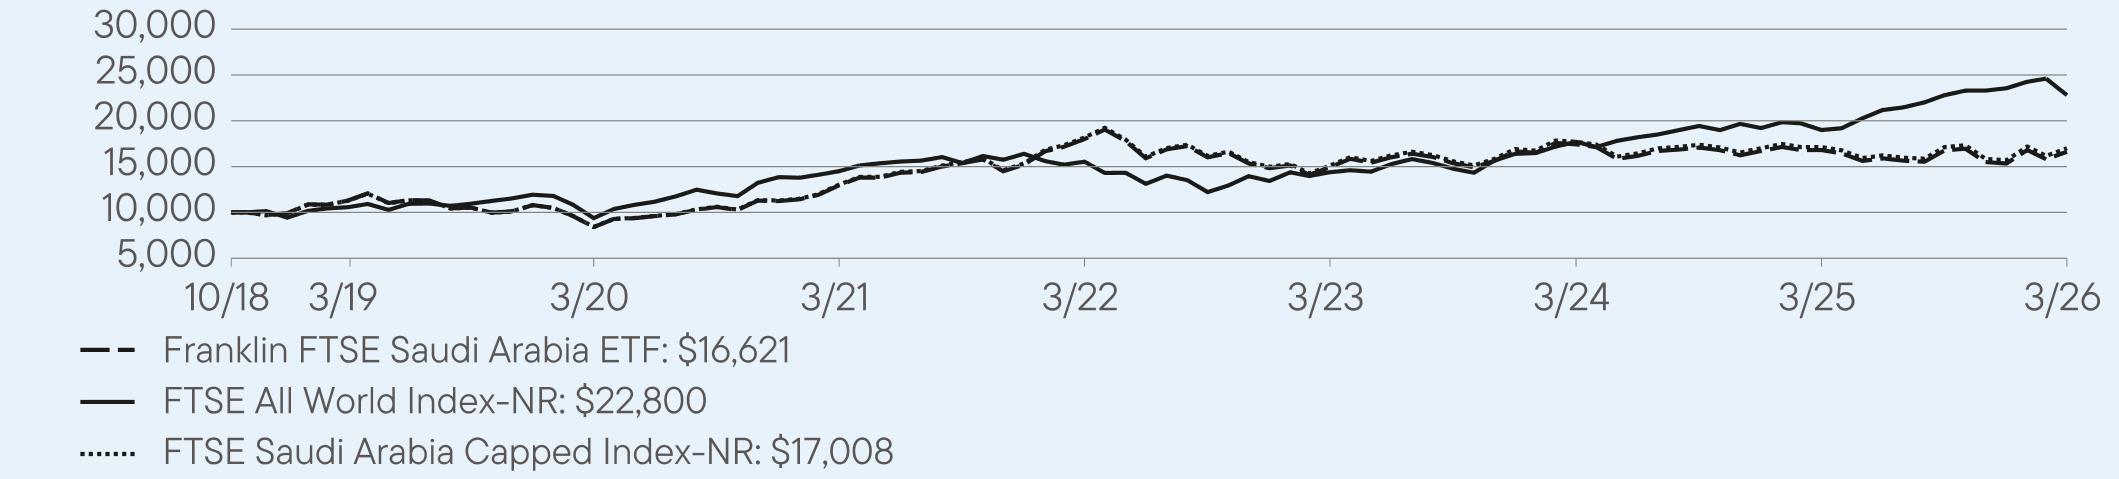
AVERAGE ANNUAL TOTAL RETURNS (%) Period Ended March 31, 2026
|
|
1 Year
|
5 Year
|
Since Inception
(10/9/2018) |
|
Franklin FTSE Saudi Arabia ETF (NAV)
|
-1.07
|
5.11
|
7.03
|
|
FTSE All World Index-NR
|
20.04
|
9.47
|
10.86
|
|
FTSE Saudi Arabia Capped Index-NR
|
-0.72
|
5.46
|
7.41
|
For current month-end performance, please call Franklin Templeton at (800) DIAL BEN/342-5236 or visit
https://www.franklintempleton.com/investments/options/exchange-traded-funds.
https://www.franklintempleton.com/investments/options/exchange-traded-funds.
Important data provider notices and terms available at www.franklintempletondatasources.com.
KEY FUND STATISTICS (as of March 31, 2026)
|
Total Net Assets
|
$5,071,498
|
|
Total Number of Portfolio Holdings (excludes derivatives, except purchased options, if any)
|
64
|
|
Total Management Fee Paid (based on a unitary fee)
|
$66,022
|
|
Portfolio Turnover Rate
|
60%
|
WHAT DID THE FUND INVEST IN? (as of March 31, 2026)
Portfolio Composition* (% of Total Investments)
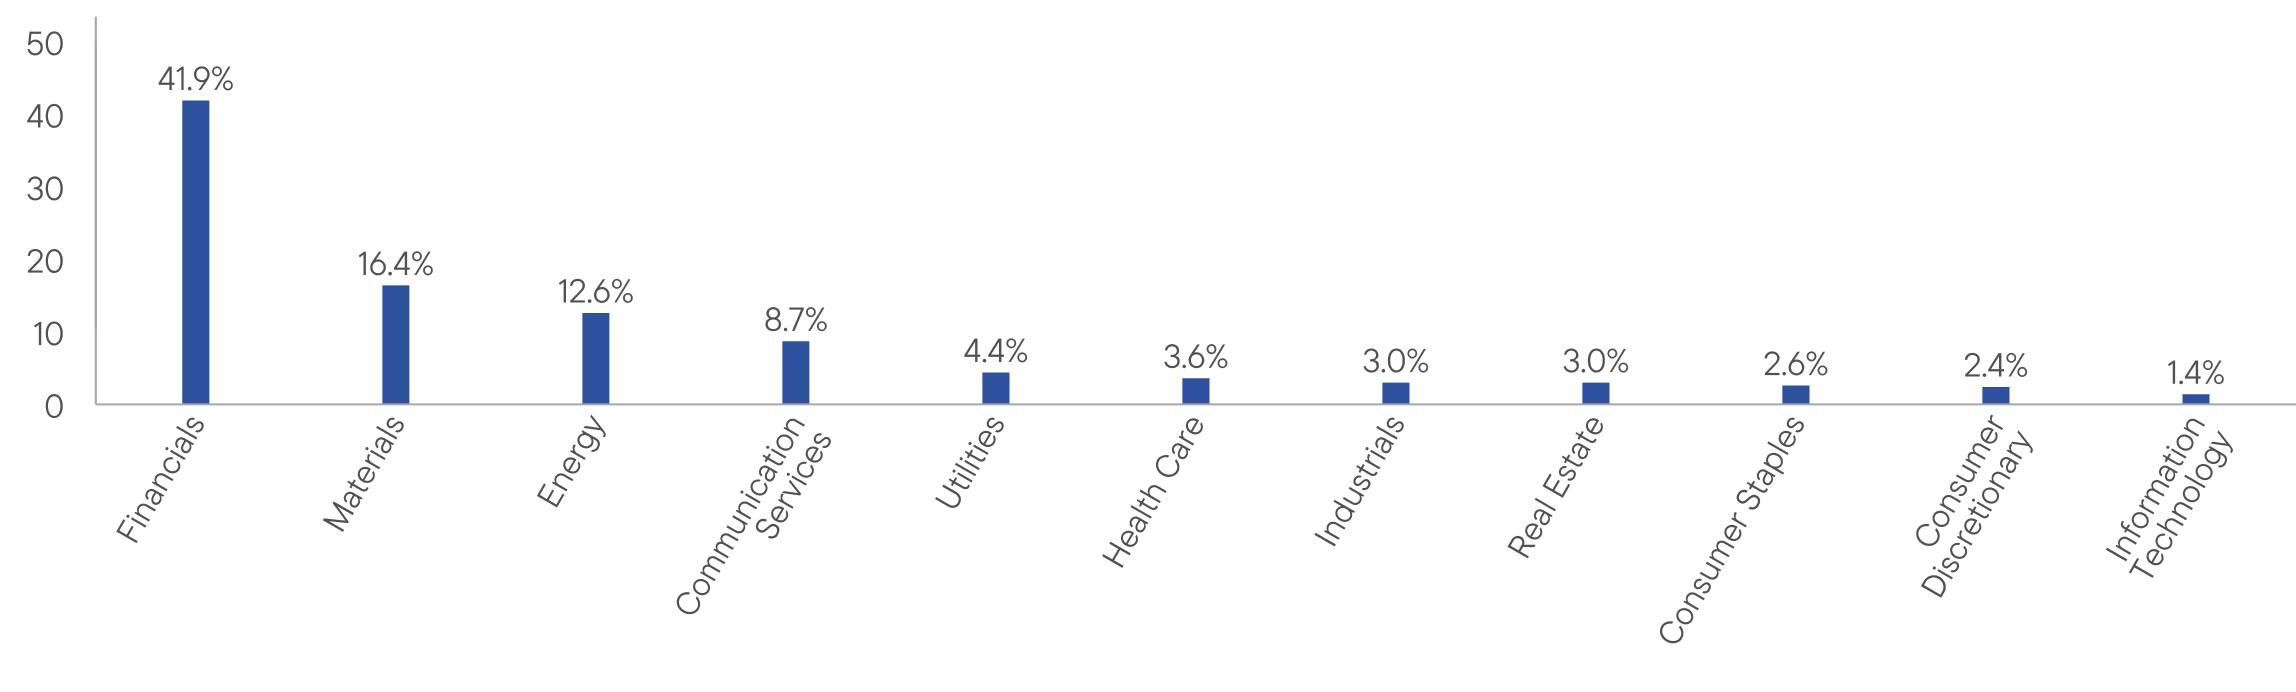
WHAT WERE THE FUND COSTS FOR THE LAST YEAR? (based on a hypothetical $10,000 investment)
|
Fund Name
|
Costs of a $10,000 investment
|
Costs paid as a percentage of a $10,000 investment*
|
|
Franklin FTSE South Korea ETF
|
$14
|
0.09%
|
HOW DID THE FUND PERFORM LAST YEAR AND WHAT AFFECTED ITS PERFORMANCE?
For the twelve months ended March 31, 2026, Franklin FTSE South Korea ETF returned 111.11%. The Fund compares its performance to the FTSE South Korea Capped Index-NR, which returned 111.39% for the same period.
PERFORMANCE HIGHLIGHTS
|
Top contributors to performance:
|
|
|
↑
|
The sectors that contributed most to absolute performance were information technology, industrials and financials.
|
|
↑
|
Individual holdings that contributed to absolute returns included Samsung Electronics, SK Hynix and Doosan Enerbility.
|
|
Top detractors from performance:
|
|
|
↓
|
There were no sectors that detracted from absolute performance.
|
|
↓
|
Individual holdings that hindered absolute returns included Hyundai Rotem, Samyang Foods and HLB.
|
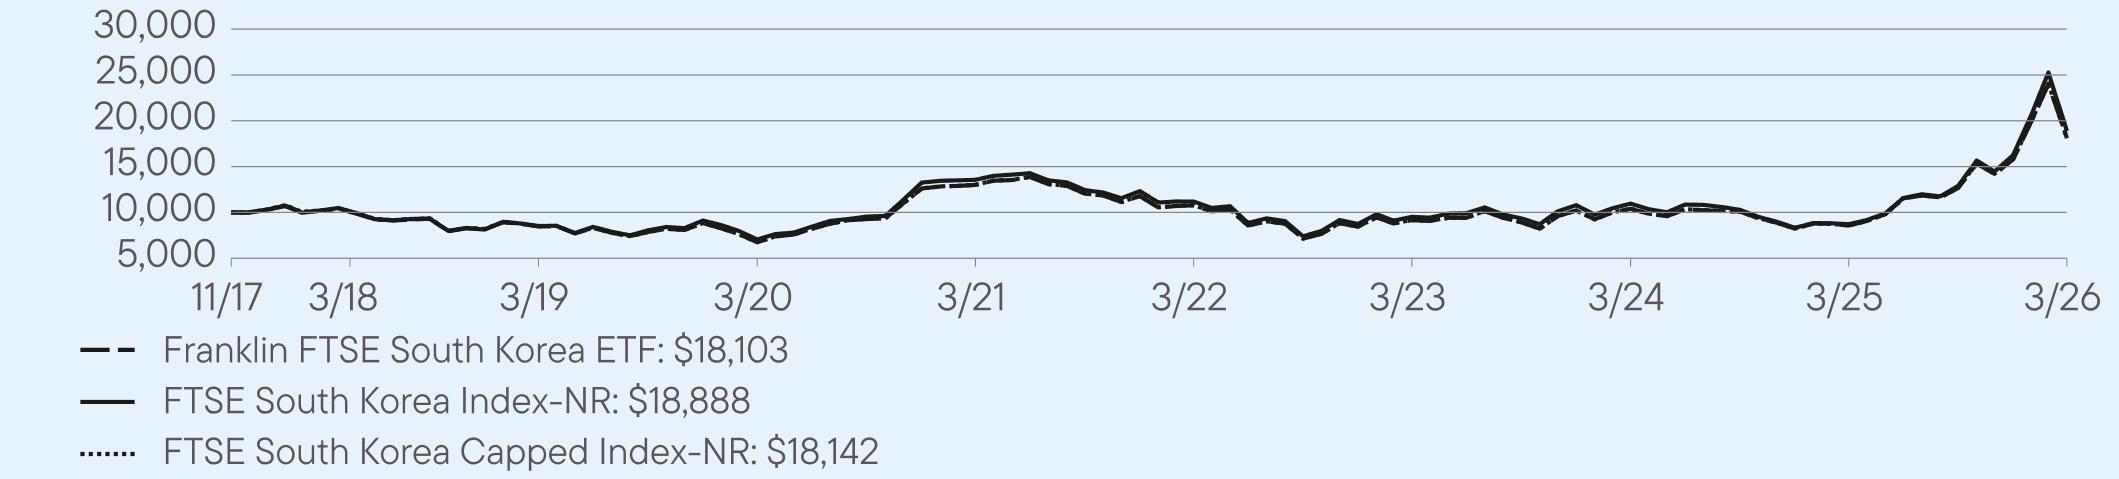
AVERAGE ANNUAL TOTAL RETURNS (%) Period Ended March 31, 2026
|
|
1 Year
|
5 Year
|
Since Inception
(11/2/2017) |
|
Franklin FTSE South Korea ETF (NAV)
|
111.11
|
6.83
|
7.31
|
|
FTSE South Korea Index-NR
|
116.73
|
6.85
|
7.65
|
|
FTSE South Korea Capped Index-NR
|
111.39
|
6.85
|
7.32
|
For current month-end performance, please call Franklin Templeton at (800) DIAL BEN/342-5236 or visit
https://www.franklintempleton.com/investments/options/exchange-traded-funds.
https://www.franklintempleton.com/investments/options/exchange-traded-funds.
Important data provider notices and terms available at www.franklintempletondatasources.com.
KEY FUND STATISTICS (as of March 31, 2026)
|
Total Net Assets
|
$420,781,815
|
|
Total Number of Portfolio Holdings (excludes derivatives, except purchased options, if any)
|
156
|
|
Total Management Fee Paid (based on a unitary fee)
|
$206,039
|
|
Portfolio Turnover Rate
|
30%
|
WHAT DID THE FUND INVEST IN? (as of March 31, 2026)
Portfolio Composition*,† (% of Total Investments)
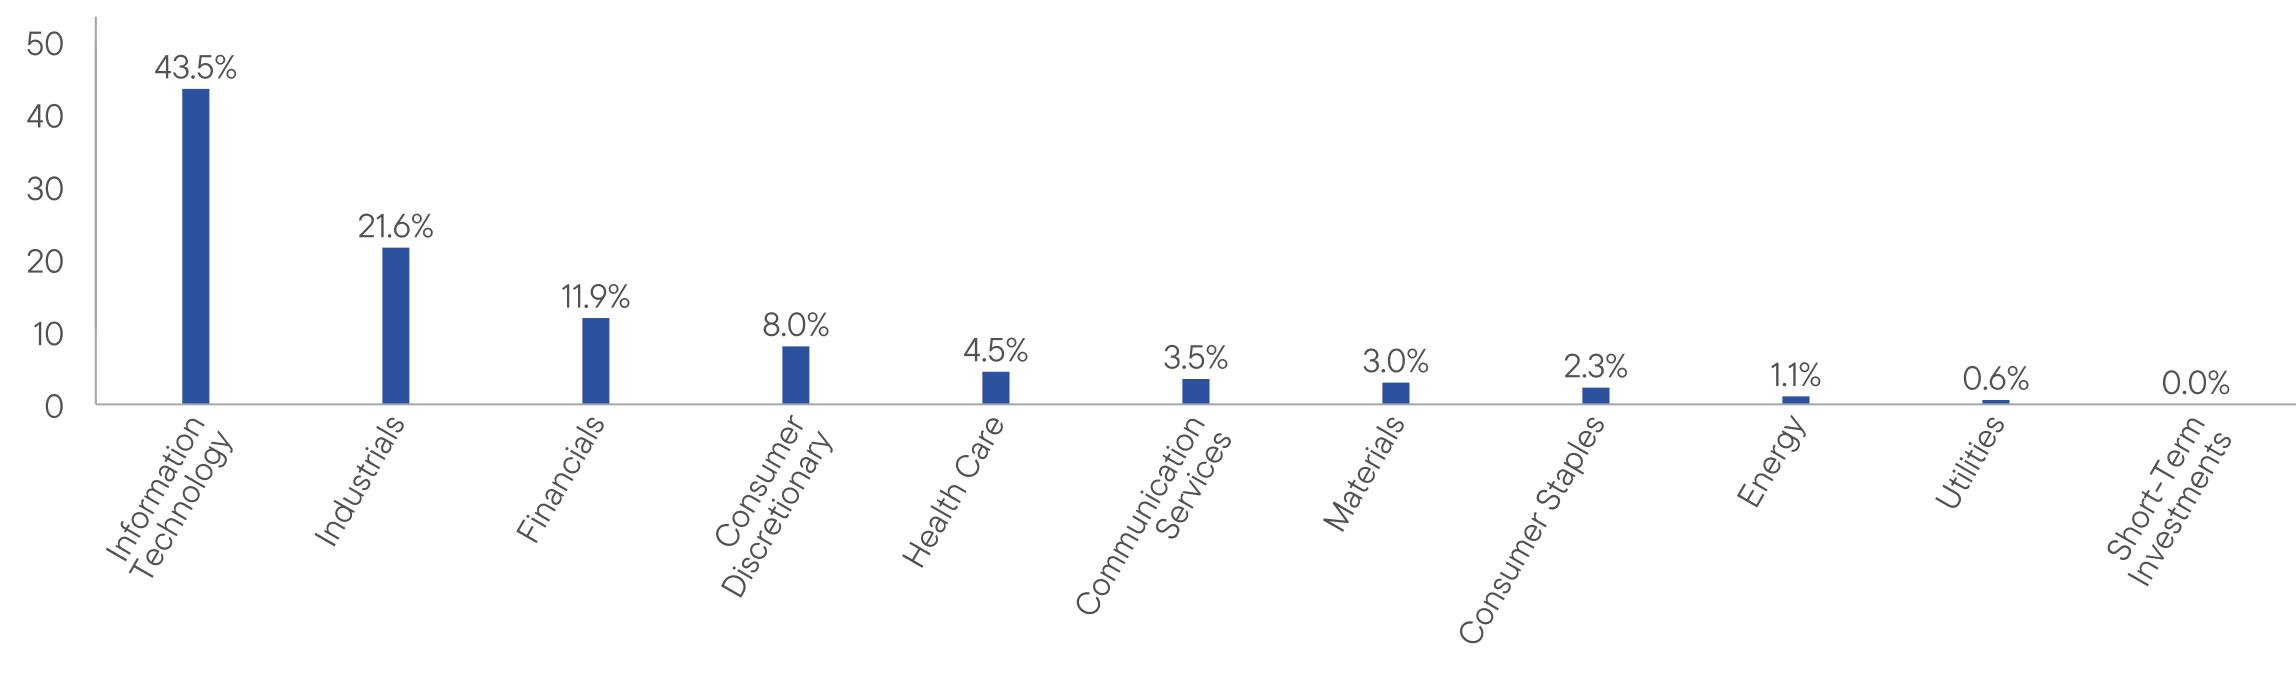
WHAT WERE THE FUND COSTS FOR THE LAST YEAR? (based on a hypothetical $10,000 investment)
|
Fund Name
|
Costs of a $10,000 investment
|
Costs paid as a percentage of a $10,000 investment*
|
|
Franklin FTSE Switzerland ETF
|
$10
|
0.09%
|
HOW DID THE FUND PERFORM LAST YEAR AND WHAT AFFECTED ITS PERFORMANCE?
For the twelve months ended March 31, 2026, Franklin FTSE Switzerland ETF returned 15.04%. The Fund compares its performance to the FTSE Switzerland Capped Index-NR, which returned 14.81% for the same period.
PERFORMANCE HIGHLIGHTS
|
Top contributors to performance:
|
|
|
↑
|
The sectors that contributed most to absolute performance were health care, industrials, and financials.
|
|
↑
|
Individual holdings that contributed to absolute returns were Novartis, Roche, and ABB.
|
|
Top detractors from performance:
|
|
|
↓
|
There were no sectors that detracted from absolute performance.
|
|
↓
|
Individual holdings that hindered absolute returns included Sika, Alcon, and Partners Group.
|
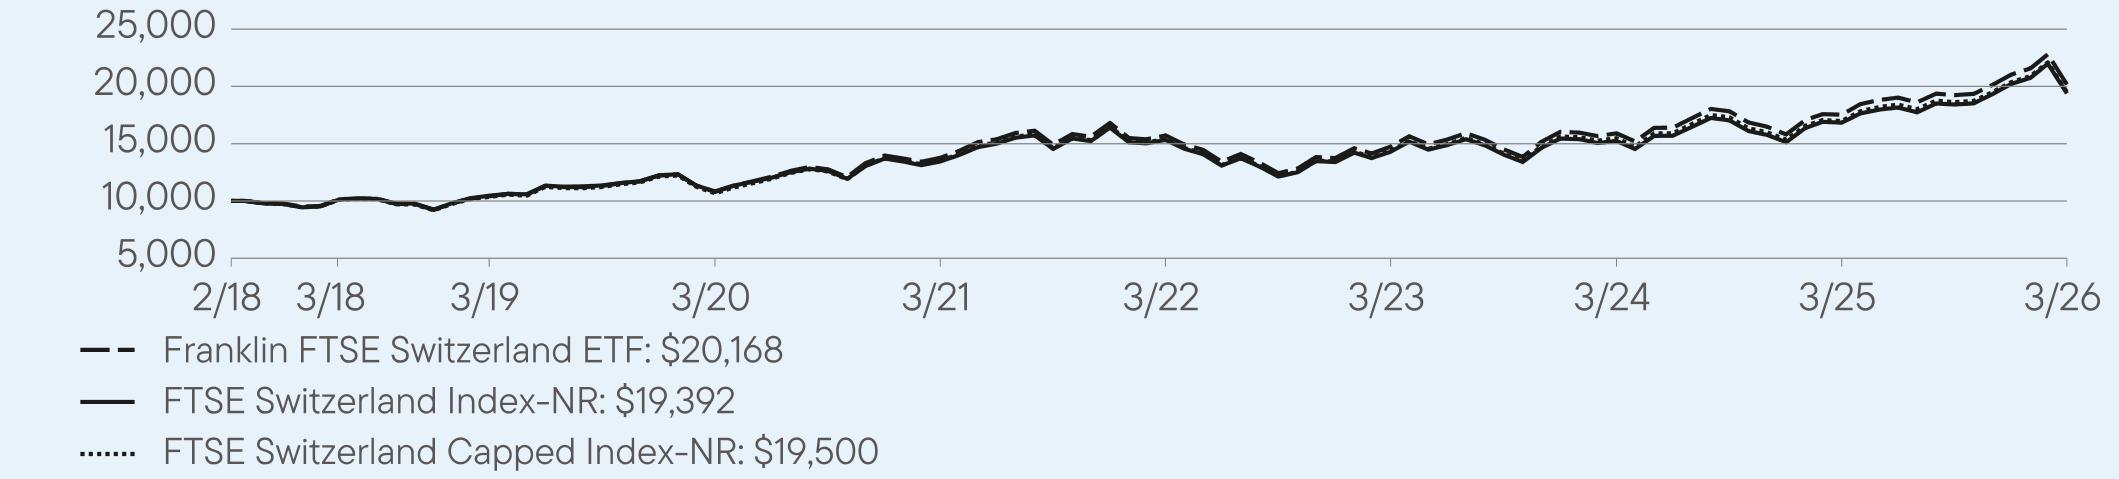
AVERAGE ANNUAL TOTAL RETURNS (%) Period Ended March 31, 2026
|
|
1 Year
|
5 Year
|
Since Inception
(2/6/2018) |
|
Franklin FTSE Switzerland ETF (NAV)
|
15.04
|
7.93
|
8.99
|
|
FTSE Switzerland Index-NR
|
15.20
|
7.60
|
8.46
|
|
FTSE Switzerland Capped Index-NR
|
14.81
|
7.59
|
8.55
|
For current month-end performance, please call Franklin Templeton at (800) DIAL BEN/342-5236 or visit
https://www.franklintempleton.com/investments/options/exchange-traded-funds.
https://www.franklintempleton.com/investments/options/exchange-traded-funds.
Important data provider notices and terms available at www.franklintempletondatasources.com.
KEY FUND STATISTICS (as of March 31, 2026)
|
Total Net Assets
|
$75,854,220
|
|
Total Number of Portfolio Holdings (excludes derivatives, except purchased options, if any)
|
50
|
|
Total Management Fee Paid (based on a unitary fee)
|
$53,549
|
|
Portfolio Turnover Rate
|
12%
|
WHAT DID THE FUND INVEST IN? (as of March 31, 2026)
Portfolio Composition*,† (% of Total Investments)
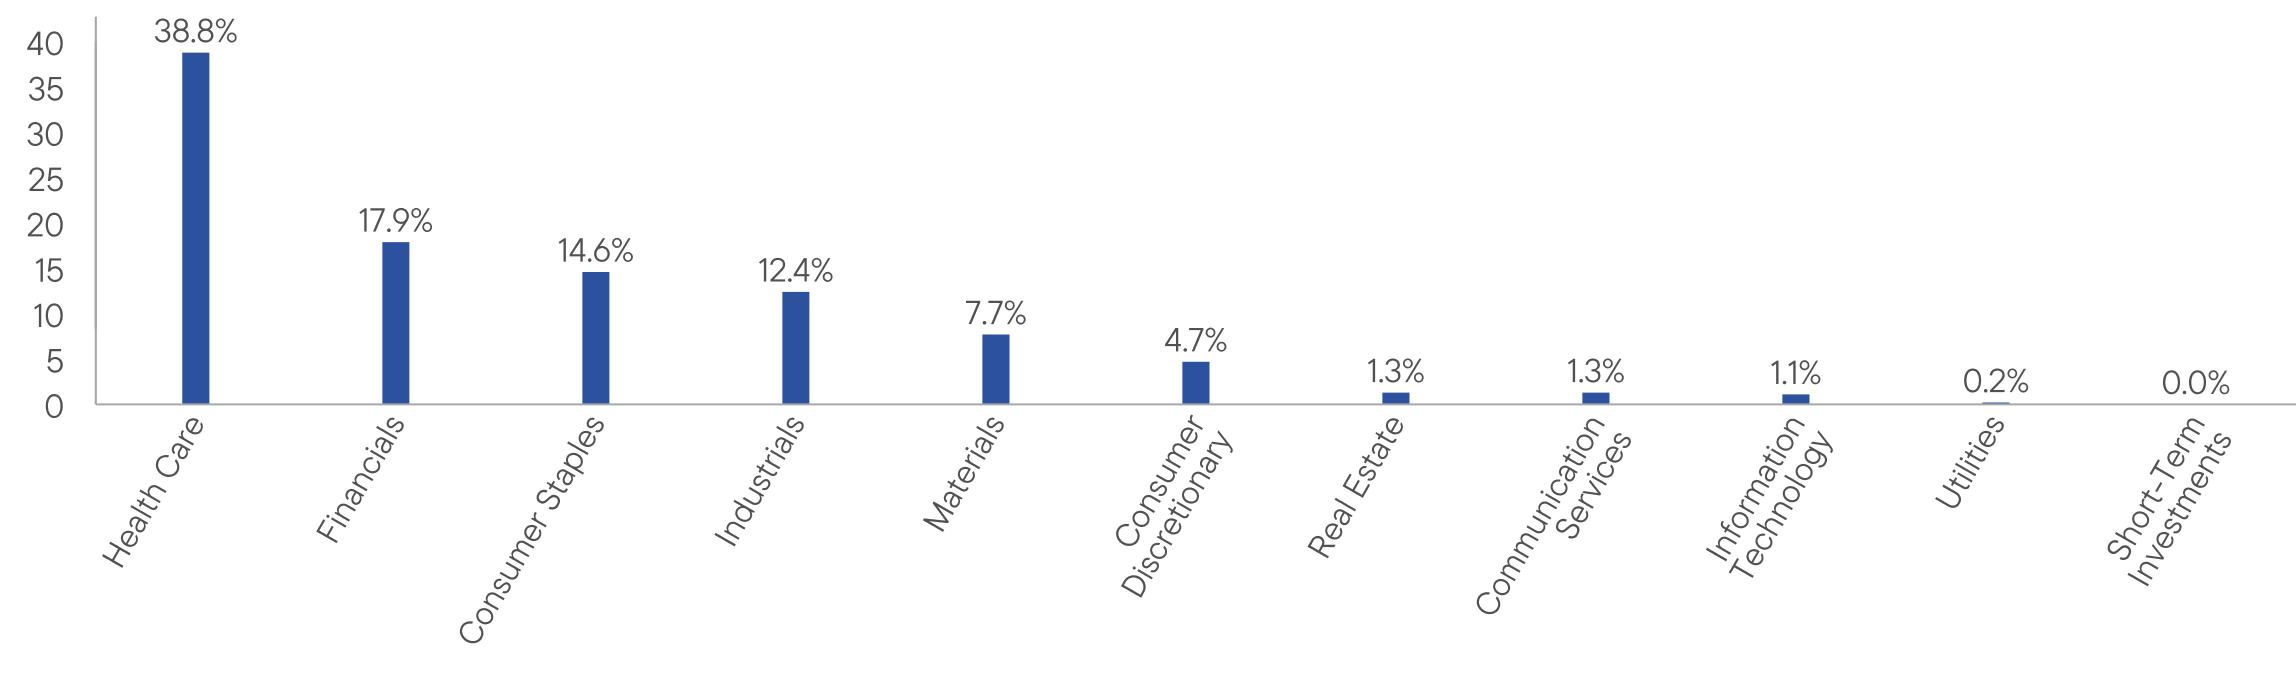
WHAT WERE THE FUND COSTS FOR THE LAST YEAR? (based on a hypothetical $10,000 investment)
|
Fund Name
|
Costs of a $10,000 investment
|
Costs paid as a percentage of a $10,000 investment*
|
|
Franklin FTSE Taiwan ETF
|
$24
|
0.19%
|
HOW DID THE FUND PERFORM LAST YEAR AND WHAT AFFECTED ITS PERFORMANCE?
For the twelve months ended March 31, 2026, Franklin FTSE Taiwan ETF returned 57.35%. The Fund compares its performance to the FTSE Taiwan Capped Index-NR, which returned 57.59% for the same period.
PERFORMANCE HIGHLIGHTS
|
Top contributors to performance:
|
|
|
↑
|
The sectors that contributed most to absolute performance were information technology, financials and industrials.
|
|
↑
|
Individual holdings that contributed to absolute returns were Taiwan Semiconductor Manufacturing, Delta Electronics and Hon Hai Precision Industry.
|
|
Top detractors from performance:
|
|
|
↓
|
The sectors that detracted most from absolute performance were consumer discretionary and health care.
|
|
↓
|
Individual holdings that detracted most from absolute returns were E Ink Holdings, Caliway Biopharmaceuticals, and Novatek Microelectronics.
|
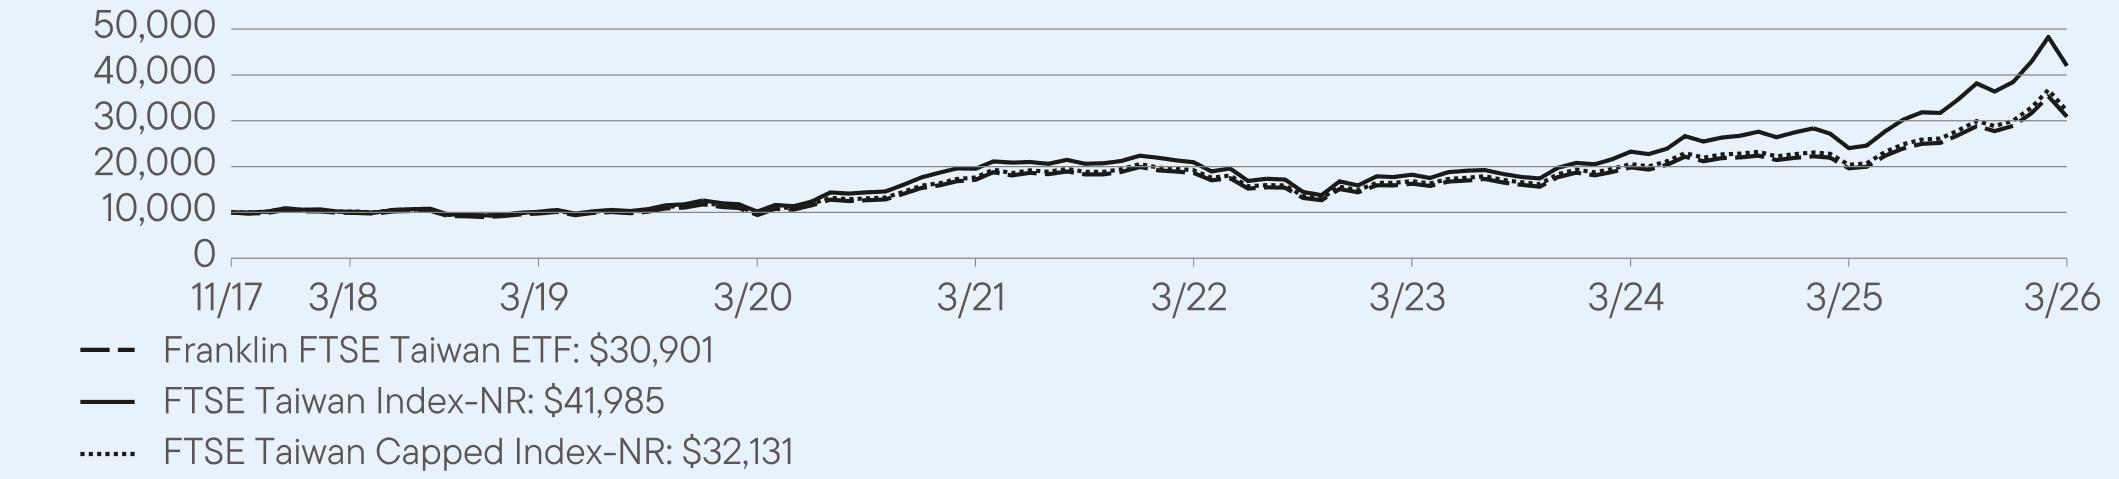
AVERAGE ANNUAL TOTAL RETURNS (%) Period Ended March 31, 2026
|
|
1 Year
|
5 Year
|
Since Inception
(11/2/2017) |
|
Franklin FTSE Taiwan ETF (NAV)
|
57.35
|
12.53
|
14.36
|
|
FTSE Taiwan Index-NR
|
74.67
|
16.53
|
18.18
|
|
FTSE Taiwan Capped Index-NR
|
57.59
|
12.77
|
14.53
|
For current month-end performance, please call Franklin Templeton at (800) DIAL BEN/342-5236 or visit
https://www.franklintempleton.com/investments/options/exchange-traded-funds.
https://www.franklintempleton.com/investments/options/exchange-traded-funds.
Important data provider notices and terms available at www.franklintempletondatasources.com.
KEY FUND STATISTICS (as of March 31, 2026)
|
Total Net Assets
|
$1,443,693,190
|
|
Total Number of Portfolio Holdings
|
133
|
|
Total Management Fee Paid (based on a unitary fee)
|
$1,216,522
|
|
Portfolio Turnover Rate
|
57%
|
WHAT DID THE FUND INVEST IN? (as of March 31, 2026)
Portfolio Composition*,† (% of Total Investments)
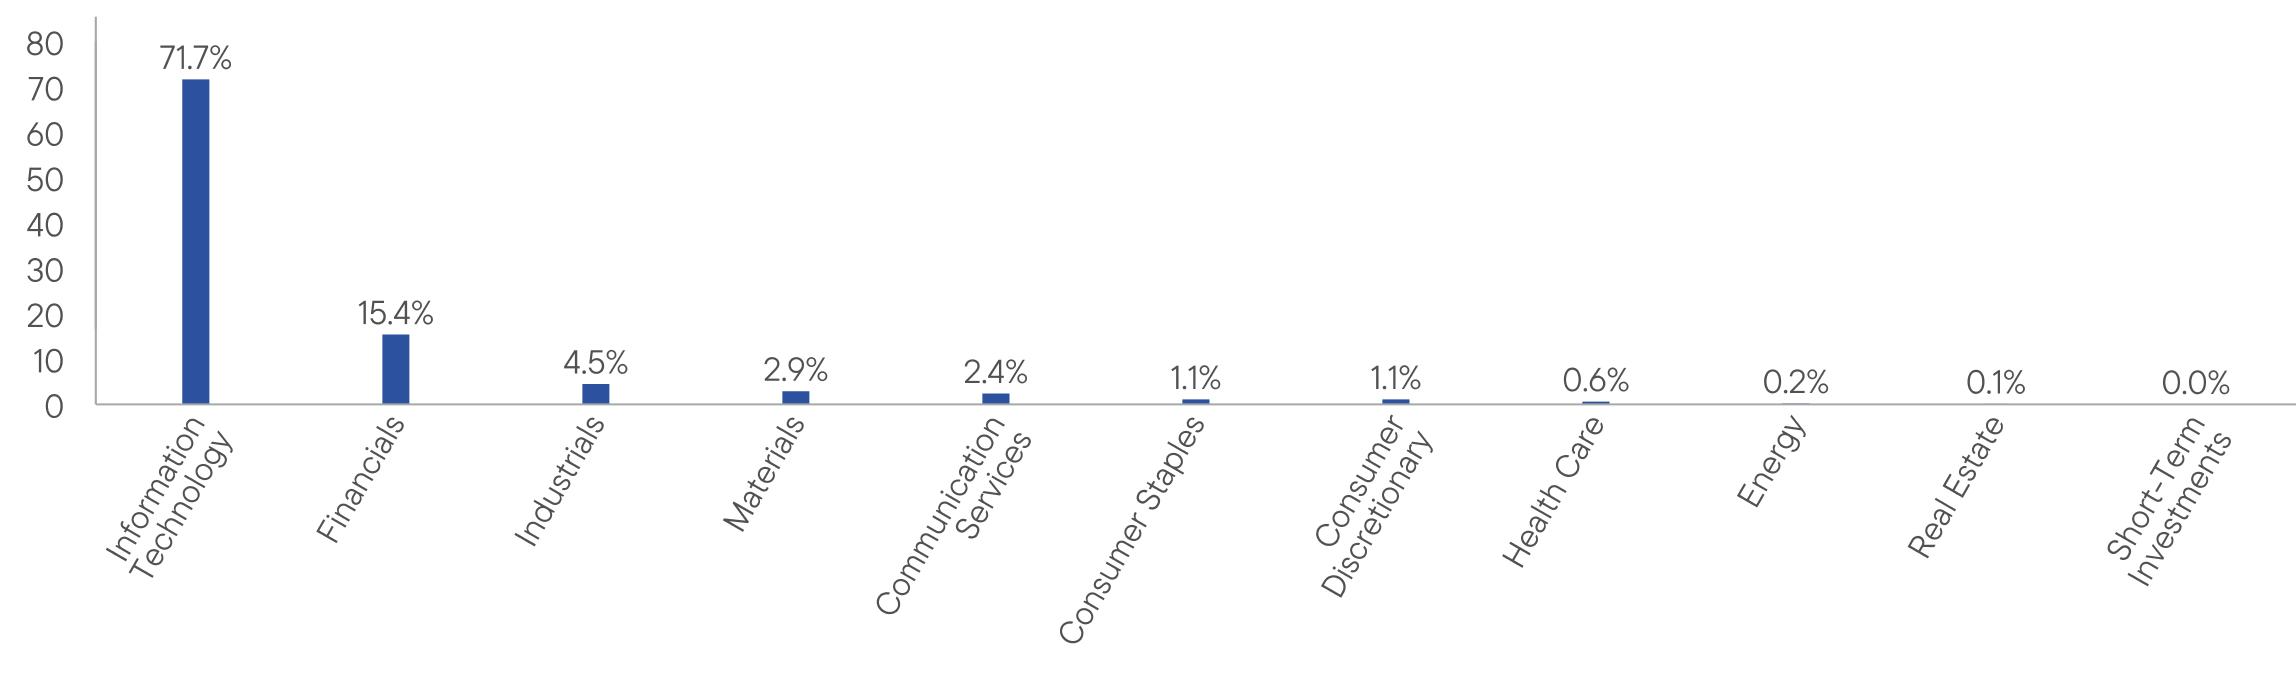
WHAT WERE THE FUND COSTS FOR THE LAST YEAR? (based on a hypothetical $10,000 investment)
|
Fund Name
|
Costs of a $10,000 investment
|
Costs paid as a percentage of a $10,000 investment*
|
|
Franklin FTSE United Kingdom ETF
|
$10
|
0.09%
|
HOW DID THE FUND PERFORM LAST YEAR AND WHAT AFFECTED ITS PERFORMANCE?
For the twelve months ended March 31, 2026, Franklin FTSE United Kingdom ETF returned 24.74%. The Fund compares its performance to the FTSE UK Capped Index-NR, which returned 24.86% for the same period.
PERFORMANCE HIGHLIGHTS
|
Top contributors to performance:
|
|
|
↑
|
The sectors that contributed most to absolute performance were financials, materials and health care.
|
|
↑
|
Individual holdings that contributed to absolute returns were HSBC Holdings Plc., AstraZeneca Plc. And Rolls-Royce Holdings.
|
|
Top detractors from performance:
|
|
|
↓
|
There were no sectors which materially detracted from absolute performance.
|
|
↓
|
Individual holdings that hindered absolute returns included Relx Plc., London Stock Exchange Group Plc. and Diageo Plc.
|
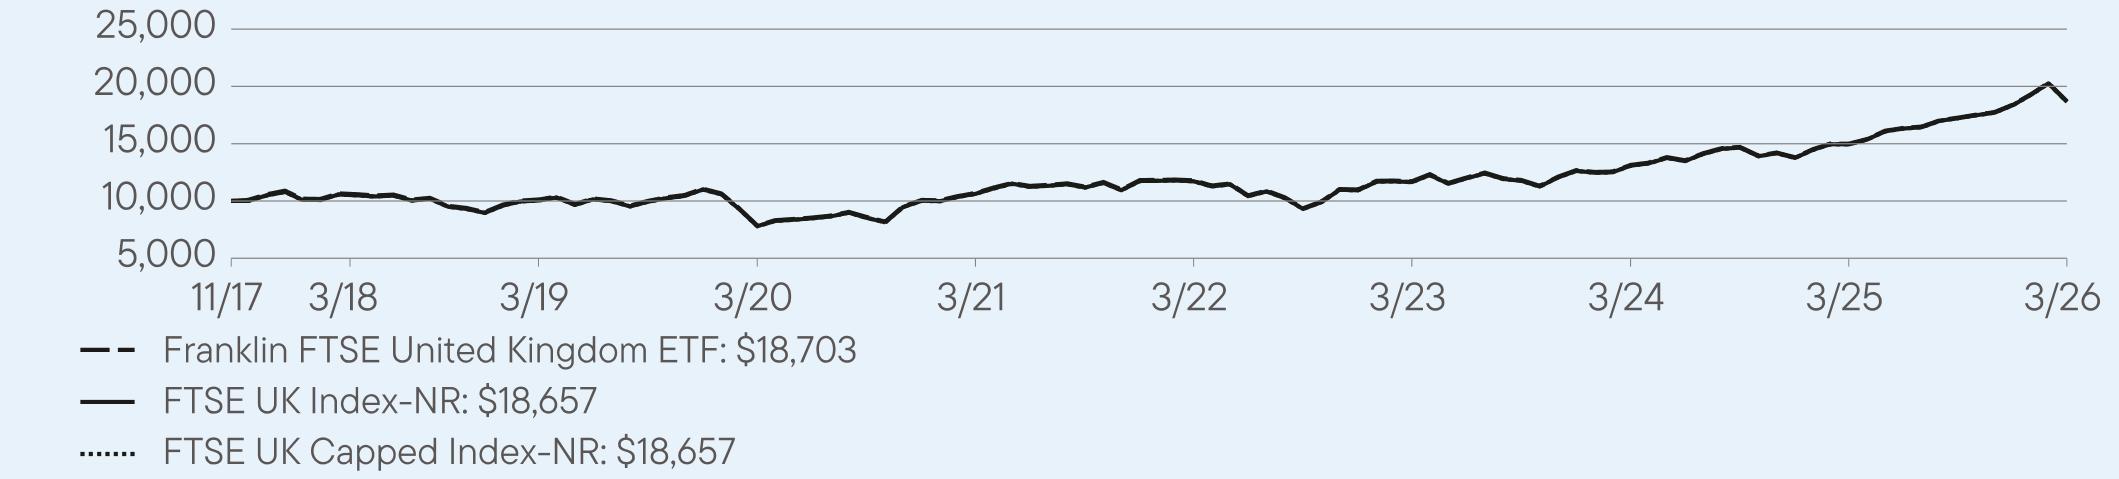
AVERAGE ANNUAL TOTAL RETURNS (%) Period Ended March 31, 2026
|
|
1 Year
|
5 Year
|
Since Inception
(11/2/2017) |
|
Franklin FTSE United Kingdom ETF (NAV)
|
24.74
|
11.81
|
7.73
|
|
FTSE UK Index-NR
|
24.86
|
11.92
|
7.82
|
|
FTSE UK Capped Index-NR
|
24.86
|
11.92
|
7.82
|
For current month-end performance, please call Franklin Templeton at (800) DIAL BEN/342-5236 or visit
https://www.franklintempleton.com/investments/options/exchange-traded-funds.
https://www.franklintempleton.com/investments/options/exchange-traded-funds.
Important data provider notices and terms available at www.franklintempletondatasources.com.
KEY FUND STATISTICS (as of March 31, 2026)
|
Total Net Assets
|
$820,507,922
|
|
Total Number of Portfolio Holdings (excludes derivatives, except purchased options, if any)
|
96
|
|
Total Management Fee Paid (based on a unitary fee)
|
$776,757
|
|
Portfolio Turnover Rate
|
5%
|
WHAT DID THE FUND INVEST IN? (as of March 31, 2026)
Portfolio Composition*,† (% of Total Investments)
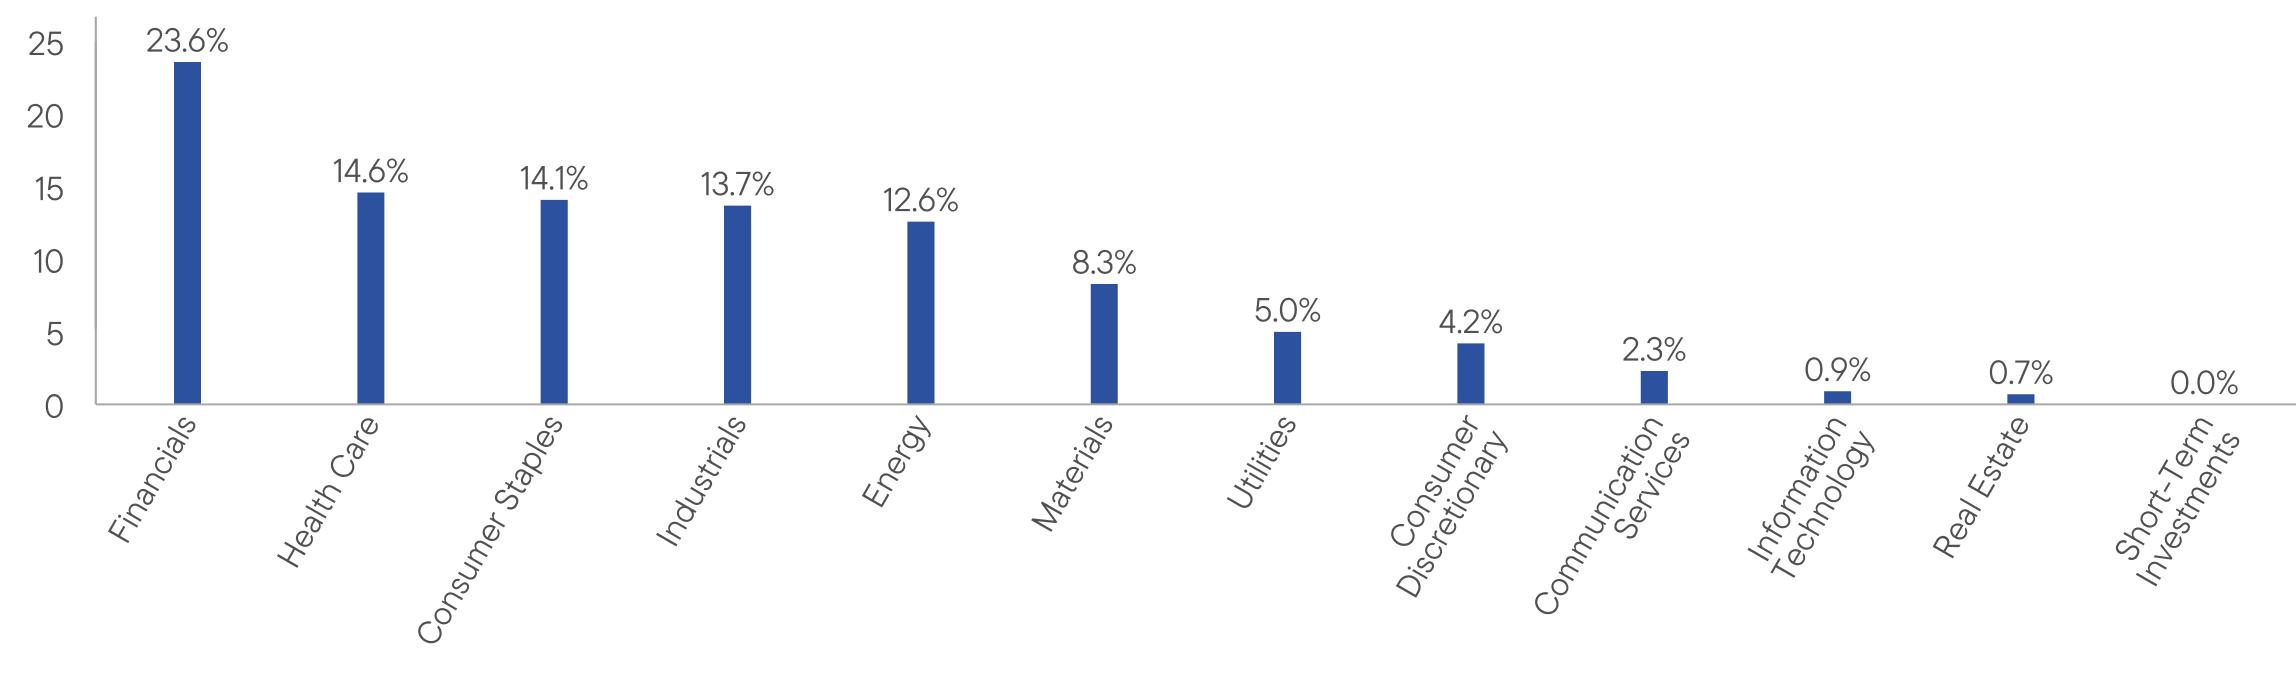
This report describes changes to the Fund that occurred during the reporting period.
WHAT WERE THE FUND COSTS FOR THE LAST YEAR? (based on a hypothetical $10,000 investment)
|
Fund Name
|
Costs of a $10,000 investment
|
Costs paid as a percentage of a $10,000 investment*
|
|
BrandywineGLOBAL-Dynamic US Large Cap Value ETF
|
$52
|
0.49%
|
HOW DID THE FUND PERFORM LAST YEAR AND WHAT AFFECTED ITS PERFORMANCE?
PERFORMANCE HIGHLIGHTS
|
Top contributors to performance:
|
|
|
↑
|
Underweight positions in healthcare providers & services and healthcare equipment & supplies within technology contributed positively.
|
|
↑
|
Within consumer discretionary, an overweight to automobiles and strong stock selection in broadline retail added value.
|
|
↑
|
Not owning real estate investment trusts resulted in no weight in real estate.
|
|
↑
|
From a factor perspective, the Fund’s net overweight companies with low share growth were a positive as share repurchasers outperformed share issuers.
|
|
Top detractors from performance:
|
|
|
↓
|
Being overweight wireless telecommunication services (T-Mobile US Inc.) and poor selection in diversified telecommunications (Comcast corporation) detracted as these industries and securities underperformed.
|
|
↓
|
Overweight in banks during the first quarter of 2026 and poor selection in the industry was a detractor within financials.
|
|
↓
|
Underweight semiconductors and semiconductor equipment was a negative within technology.
|
|
↓
|
From a factor perspective being underweight high 12-1 Month Momentum (a financial metric that measures a stock’s return from 12 months ago to 1 month ago) detracted as this group outperformed.
|
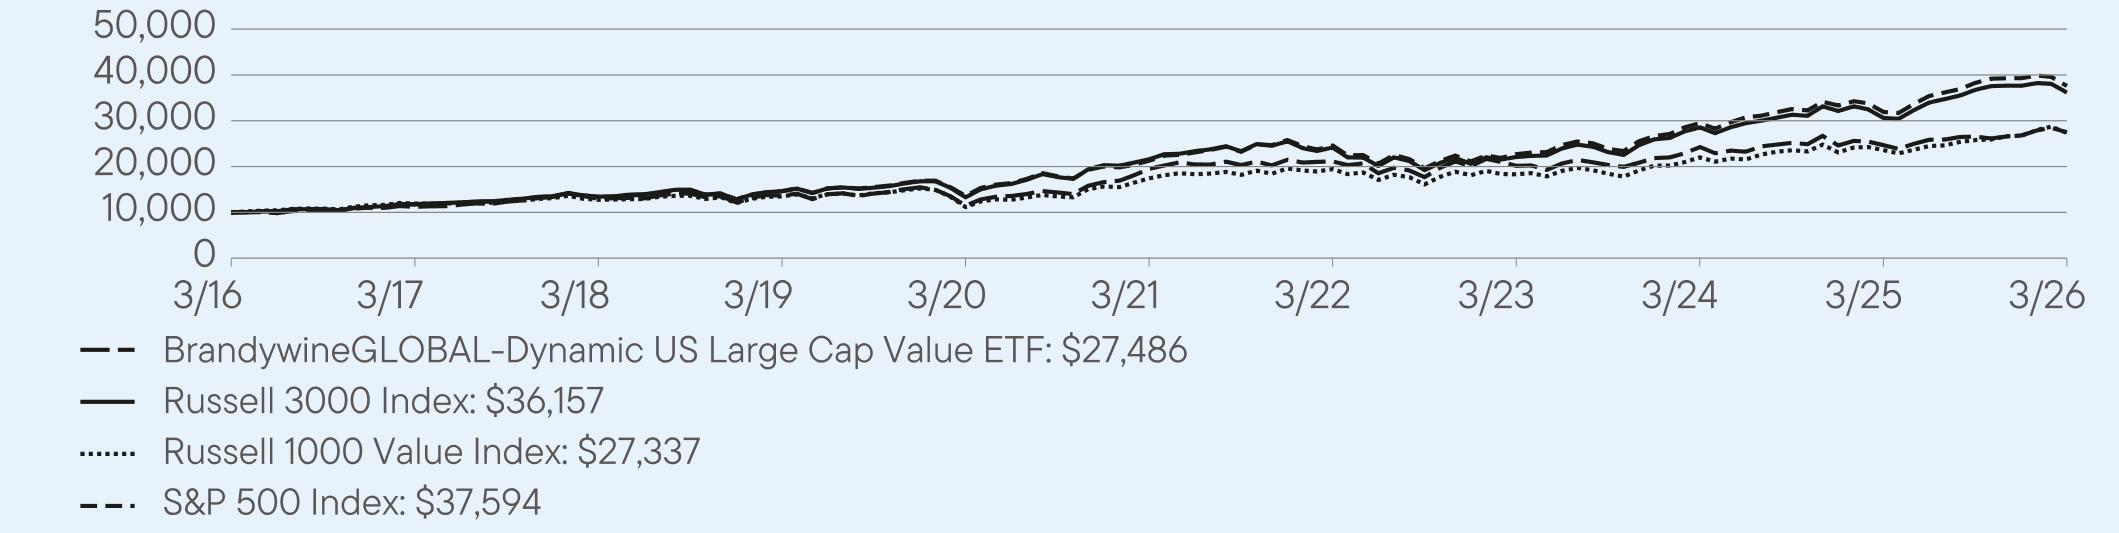
AVERAGE ANNUAL TOTAL RETURNS (%) Period Ended March 31, 2026
|
|
1 Year
|
5 Year
|
10 Year
|
|
BrandywineGLOBAL-Dynamic US Large Cap Value ETF (NAV)
|
11.43
|
7.12
|
10.64
|
|
Russell 3000 Index
|
18.09
|
10.87
|
13.72
|
|
Russell 1000 Value Index
|
15.87
|
9.43
|
10.58
|
|
S&P 500 Index
|
17.80
|
12.06
|
14.16
|
For current month-end performance, please call Franklin Templeton at (800) DIAL BEN/342-5236 or visit
https://www.franklintempleton.com/investments/options/exchange-traded-funds.
https://www.franklintempleton.com/investments/options/exchange-traded-funds.
Important data provider notices and terms available at www.franklintempletondatasources.com.
KEY FUND STATISTICS (as of March 31, 2026)
|
Total Net Assets
|
$81,956,311
|
|
Total Number of Portfolio Holdings
|
106
|
|
Total Management Fee Paid (based on a unitary fee)
|
$549,877
|
|
Portfolio Turnover Rate
|
80%
|
WHAT DID THE FUND INVEST IN? (as of March 31, 2026)
Portfolio Composition* (% of Total Investments)
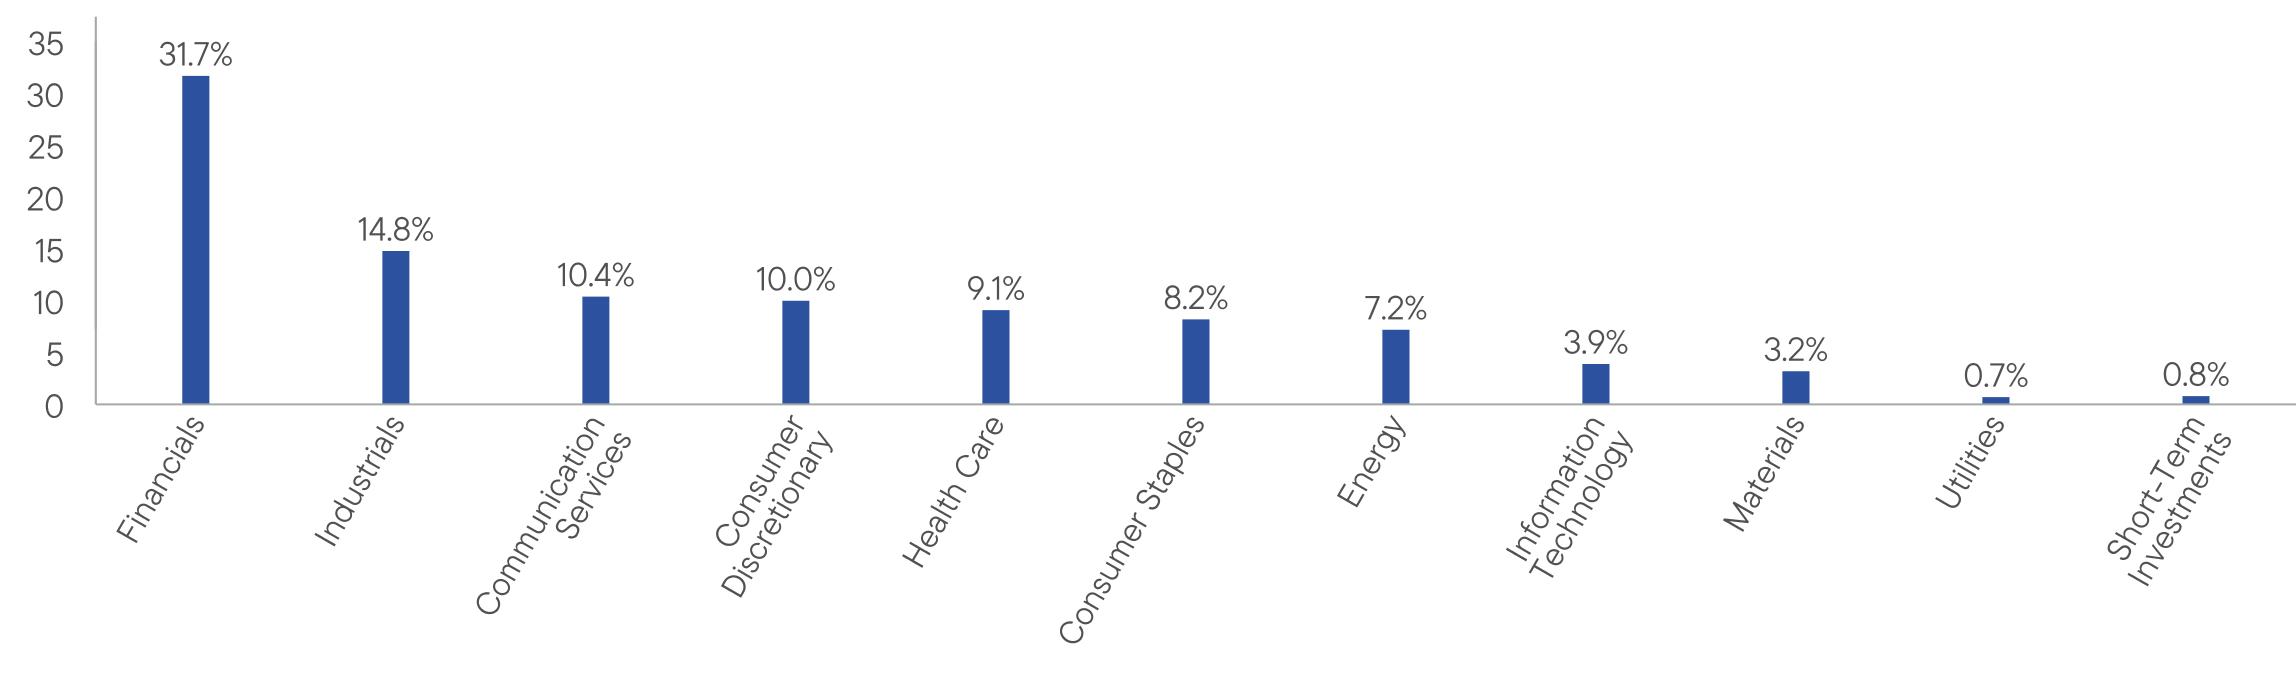
HOW HAS THE FUND CHANGED?
On August 1, 2025, the Fund’s principal investment strategies were revised to reflect the Fund’s decreased exposure to securities in the energy sector.
Related risk disclosure was removed from the Fund’s principal risks.
This is a summary of certain changes to the Fund since April 1, 2025. For more complete information, you may review the Fund’s current prospectus and any applicable supplements and the Fund’s next prospectus, which we expect to be available by August 1, 2026, at https://www.franklintempleton.com/regulatory-fund-documents or upon request at (800) DIAL BEN/342-5236 or
ETFs-Product@franklintempleton.com.
ETFs-Product@franklintempleton.com.
This report describes changes to the Fund that occurred during the reporting period.
WHAT WERE THE FUND COSTS FOR THE LAST YEAR? (based on a hypothetical $10,000 investment)
|
Fund Name
|
Costs of a $10,000 investment
|
Costs paid as a percentage of a $10,000 investment*
|
|
BrandywineGLOBAL - U.S. Fixed Income ETF
|
$40
|
0.39%
|
HOW DID THE FUND PERFORM LAST YEAR AND WHAT AFFECTED ITS PERFORMANCE?
For the twelve months ended March 31, 2026, BrandywineGLOBAL - U.S. Fixed Income ETF returned 4.87%. The Fund compares its performance to the Bloomberg U.S. Aggregate Index, which returned 4.35% for the same period.
PERFORMANCE HIGHLIGHTS
|
Top contributors to performance:
|
|
|
↑
|
U.S. Government sovereign duration was the largest contributor to performance, as the Fund stayed tactical with positioning over the period. Performance was largely driven by a decline in U.S. Treasury yields as growth moderated and inflation eased. Markets increasingly priced a shift away from peak policy restrictiveness toward eventual easing, while periodic risk-off sentiment linked to geopolitical tensions and slowing activity supported demand for high-quality duration.
|
|
↑
|
U.S. agency mortgage-backed securities contributed positively and benefited from yield advantage relative to treasuries and steady income generation, while investor demand for carry helped offset periods of mortgage spread widening tied to rate volatility and prepayment uncertainty.
|
|
Top detractors from performance:
|
|
|
↓
|
An underweight to U.S. investment-grade corporate credit was a detractor as the sector was supported by income and generally resilient corporate fundamentals.
|
Use of derivatives and the impact on performance:
The Fund utilized interest rate futures, for hedging and alpha purposes and to manage its duration, which contributed to performance.
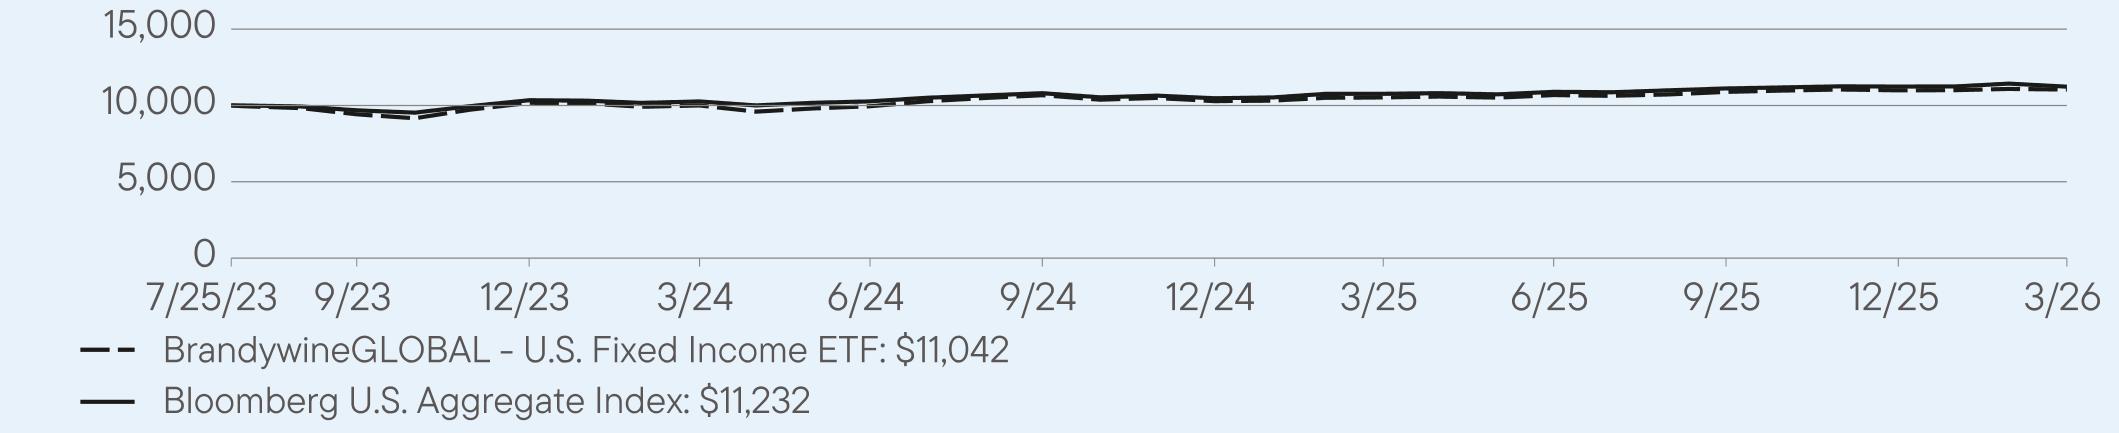
AVERAGE ANNUAL TOTAL RETURNS (%) Period Ended March 31, 2026
|
|
1 Year
|
Since Inception
(7/25/2023) |
|
BrandywineGLOBAL - U.S. Fixed Income ETF (NAV)
|
4.87
|
3.76
|
|
Bloomberg U.S. Aggregate Index
|
4.35
|
4.30
|
For current month-end performance, please call Franklin Templeton at (800) DIAL BEN/342-5236 or visit
https://www.franklintempleton.com/investments/options/exchange-traded-funds.
https://www.franklintempleton.com/investments/options/exchange-traded-funds.
Important data provider notices and terms available at www.franklintempletondatasources.com.
KEY FUND STATISTICS (as of March 31, 2026)
|
Total Net Assets
|
$13,537,931
|
|
Total Number of Portfolio Holdings
|
52
|
|
Total Management Fee Paid (based on a unitary fee)
|
$49,419
|
|
Portfolio Turnover Rate
|
199%
|
WHAT DID THE FUND INVEST IN? (as of March 31, 2026)
Portfolio Composition* (% of Total Investments)
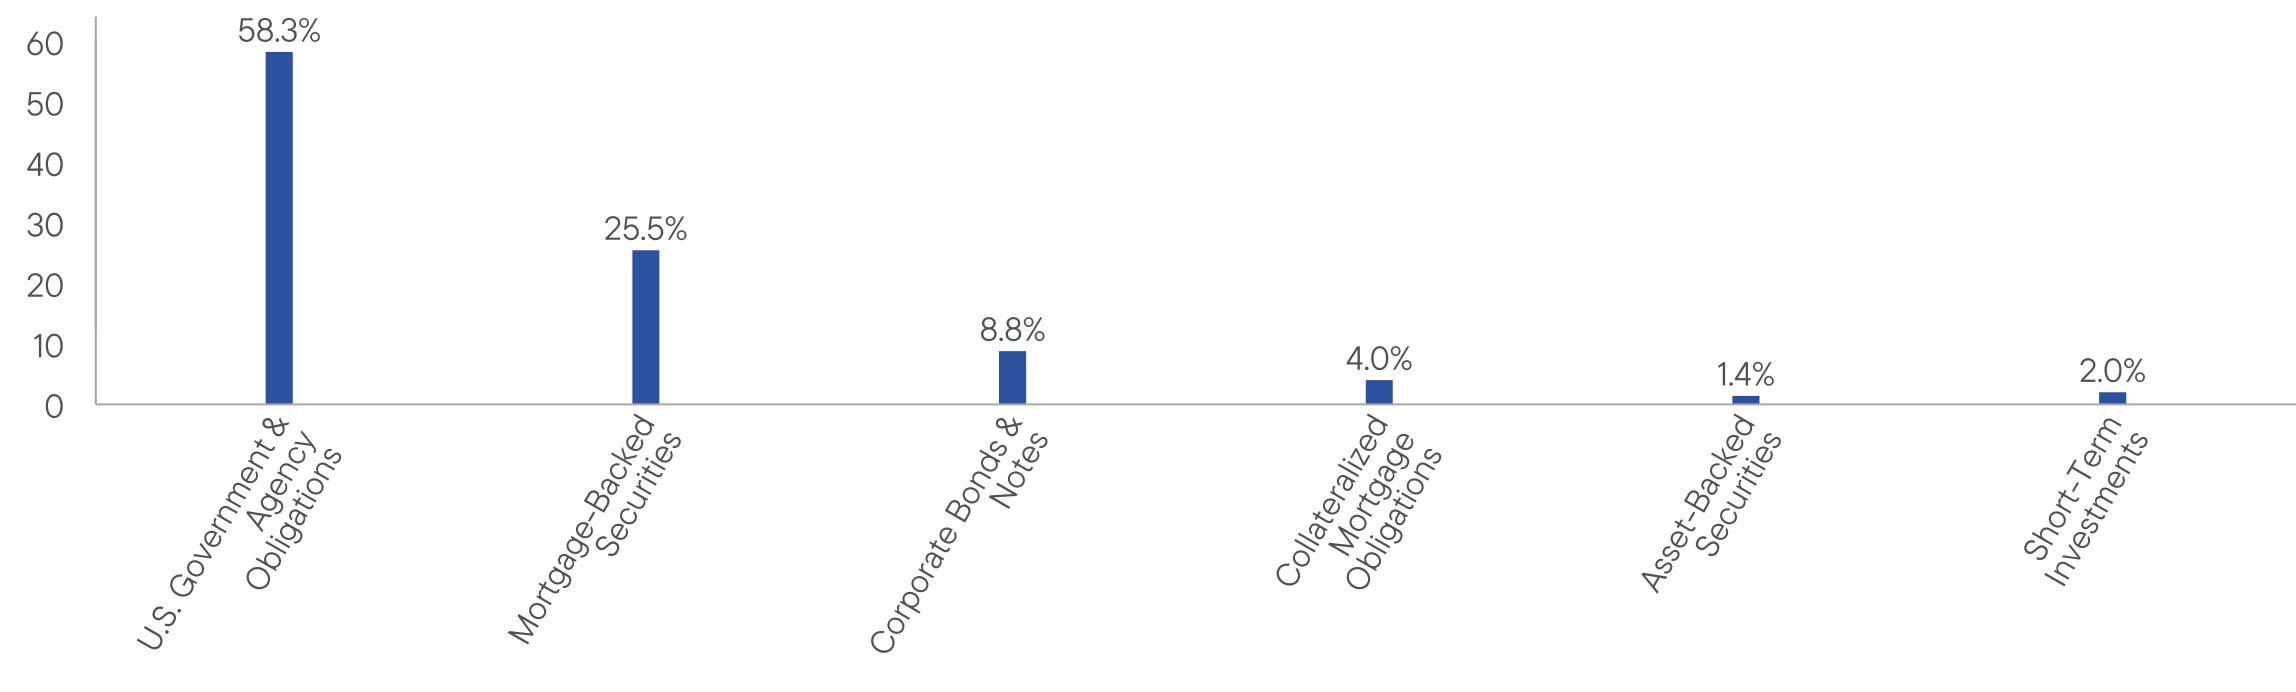
HOW HAS THE FUND CHANGED?
Effective August 1, 2025, Paul Mielczarski was added as a portfolio manager of the Fund.
This is a summary of a change to the Fund since April 1, 2025. For more complete information, you may review the Fund’s current prospectus and any applicable supplements and the Fund’s next prospectus, which we expect to be available by August 1, 2026, at https://www.franklintempleton.com/regulatory-fund-documents or upon request at (800) DIAL BEN/342-5236 or ETFs-Product@franklintempleton.com.
WHAT WERE THE FUND COSTS FOR THE LAST YEAR? (based on a hypothetical $10,000 investment)
|
Fund Name
|
Costs of a $10,000 investment
|
Costs paid as a percentage of a $10,000 investment*,**
|
|
Franklin FTSE Russia ETF
|
$0
|
0.00%
|
HOW DID THE FUND PERFORM LAST YEAR AND WHAT AFFECTED ITS PERFORMANCE?
The Fund sought to track the investment results of an index composed of Russian equities, as represented by the FTSE Russia RIC Capped Index-NR (the FTSE Russia Capped Index-NR or the Underlying Index). Effective February 28, 2024, the Fund’s Underlying Index was discontinued by the index provider FTSE Russell. Due to the discontinuation of the Fund’s underlying index and ongoing restrictions relating to Russian securities, the Fund will be unable to meet its investment objective. The Fund is in the process of liquidating its assets and winding up its business pursuant to a plan of liquidation.
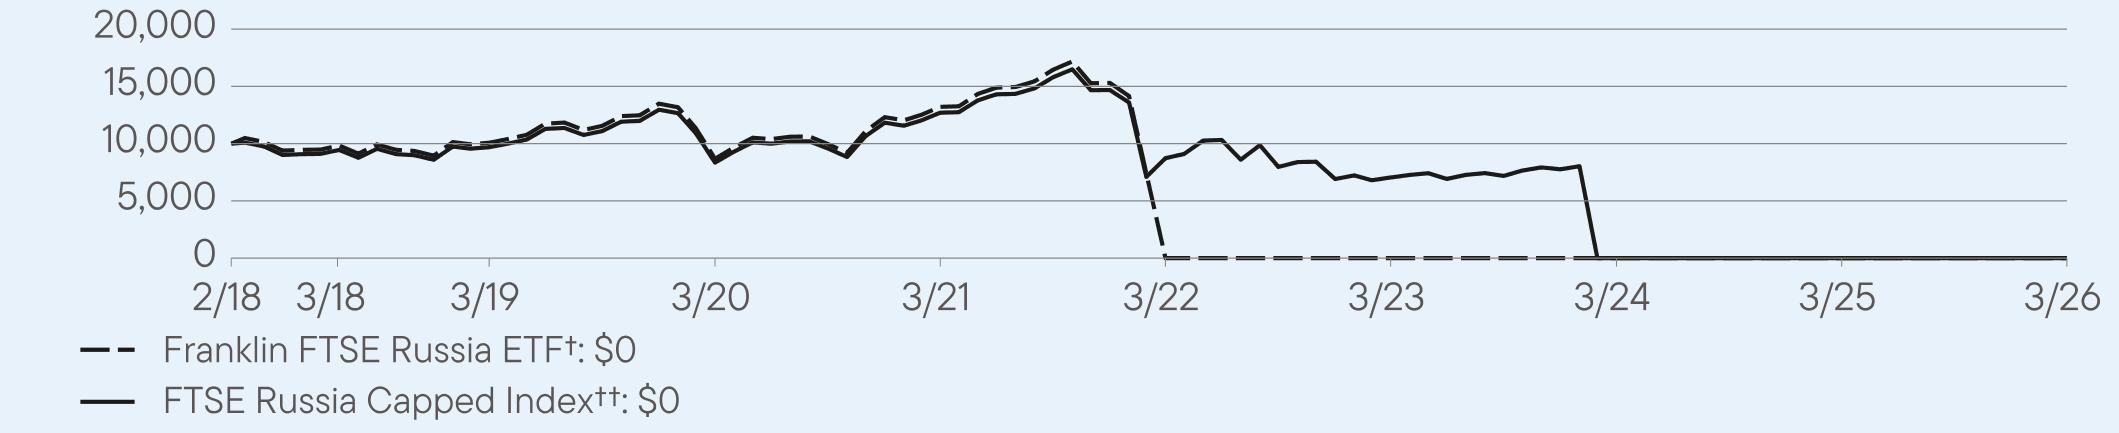
AVERAGE ANNUAL TOTAL RETURNS (%) Period Ended March 31, 2026
|
|
1 Year
|
5 Year
|
Since Inception
(2/6/2018) |
|
Franklin FTSE Russia ETF (NAV)†
|
--
|
-79.21
|
-60.54
|
|
FTSE Russia Capped Index††
|
--
|
--
|
--
|
For current month-end performance, please call Franklin Templeton at (800) DIAL BEN/342-5236 or visit
https://www.franklintempleton.com/investments/options/exchange-traded-funds.
https://www.franklintempleton.com/investments/options/exchange-traded-funds.
Important data provider notices and terms available at www.franklintempletondatasources.com.
KEY FUND STATISTICS (as of March 31, 2026)
|
Total Net Assets*
|
$4,949
|
|
Total Number of Portfolio Holdings
|
36
|
|
Total Management Fee Paid (based on a unitary fee)
|
$0
|
|
Portfolio Turnover Rate
|
0%
|
WHAT DID THE FUND INVEST IN? (as of March 31, 2026)
Portfolio Composition*,† (% of Total Net Assets)
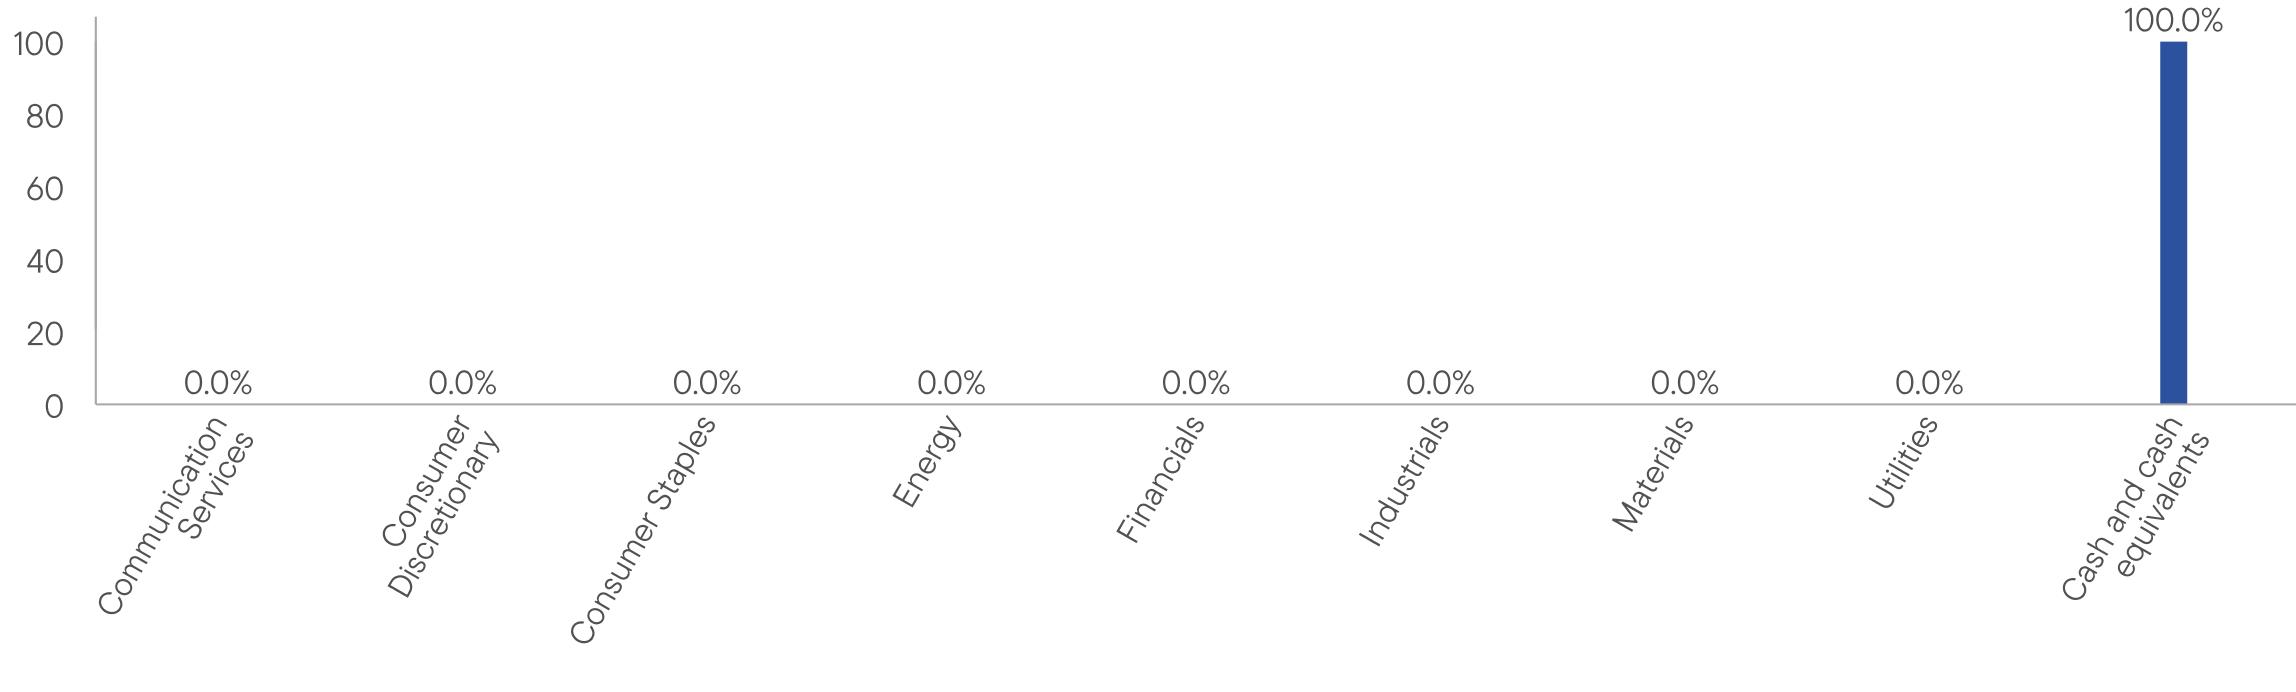
WHAT WERE THE FUND COSTS FOR THE LAST YEAR? (based on a hypothetical $10,000 investment)
|
Fund Name
|
Costs of a $10,000 investment
|
Costs paid as a percentage of a $10,000 investment*
|
|
Franklin Small Cap Enhanced ETF1
|
$14
|
0.45%
|
HOW DID THE FUND PERFORM LAST YEAR AND WHAT AFFECTED ITS PERFORMANCE?
For the period December 9, 2025, to March 31, 2026, Franklin Small Cap Enhanced ETF returned -0.90%. The Fund compares its performance to the Russell 2000 Index, which returned -0.77% for the same period.
PERFORMANCE HIGHLIGHTS
|
Top contributors to performance:
|
|
|
↑
|
Stock selection in the information technology sector.
|
|
↑
|
Security selection in the energy sector.
|
|
↑
|
Allocation to the information technology sector, which varied during the review period.
|
|
Top detractors from performance:
|
|
|
↓
|
Stock selection in the health care sector.
|
|
↓
|
Security selection in the real estate sector.
|
|
↓
|
Underweight allocation to the energy sector.
|
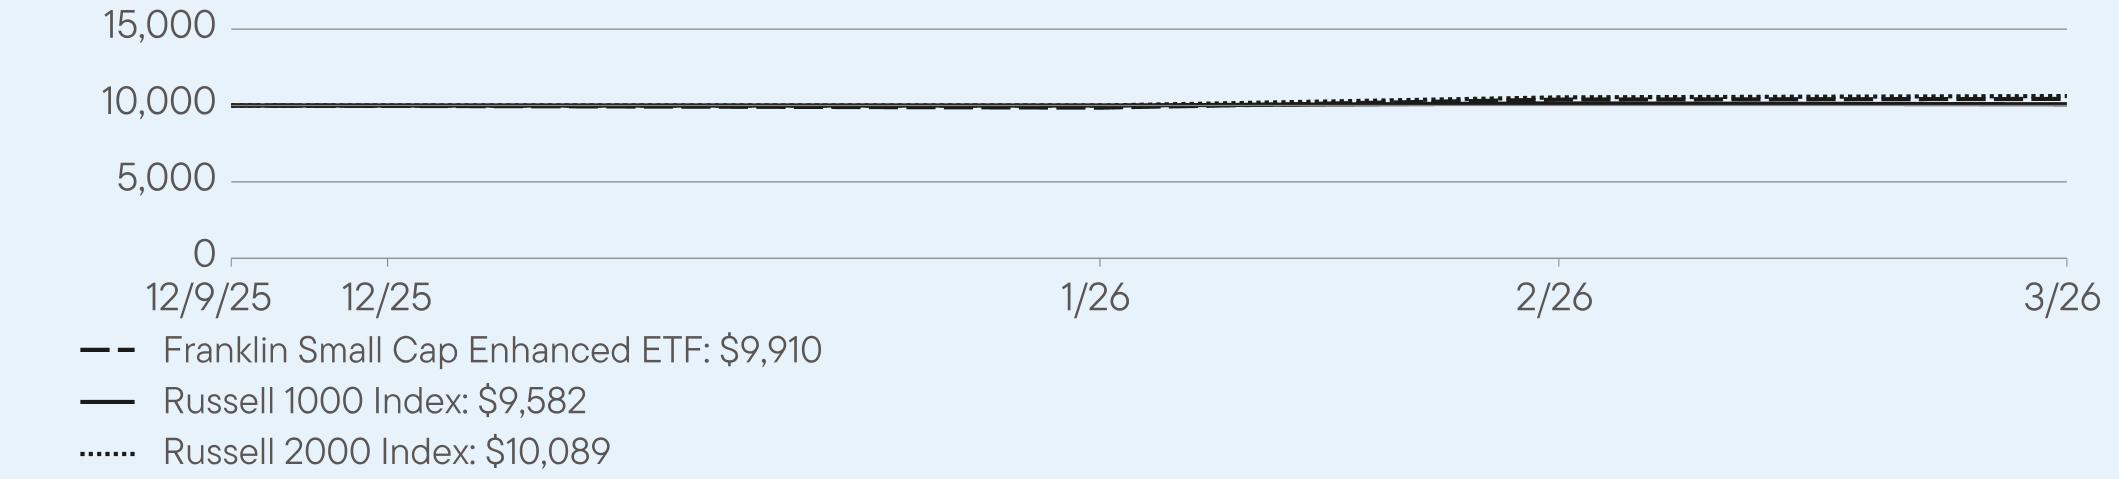
AVERAGE ANNUAL TOTAL RETURNS (%) Period Ended March 31, 2026
|
|
Since Inception
(12/9/2025) |
|
Franklin Small Cap Enhanced ETF (NAV)
|
-0.90
|
|
Russell 1000 Index
|
32.71
|
|
Russell 2000 Index
|
-0.77
|
For current month-end performance, please call Franklin Templeton at (800) DIAL BEN/342-5236 or visit
https://www.franklintempleton.com/investments/options/exchange-traded-funds.
https://www.franklintempleton.com/investments/options/exchange-traded-funds.
Important data provider notices and terms available at www.franklintempletondatasources.com.
KEY FUND STATISTICS (as of March 31, 2026)
|
Total Net Assets
|
$112,499,257
|
|
Total Number of Portfolio Holdings
|
300
|
|
Total Management Fee Paid (based on a unitary fee)
|
$100,028
|
|
Portfolio Turnover Rate
|
37%
|
WHAT DID THE FUND INVEST IN? (as of March 31, 2026)
Portfolio Composition* (% of Total Investments)
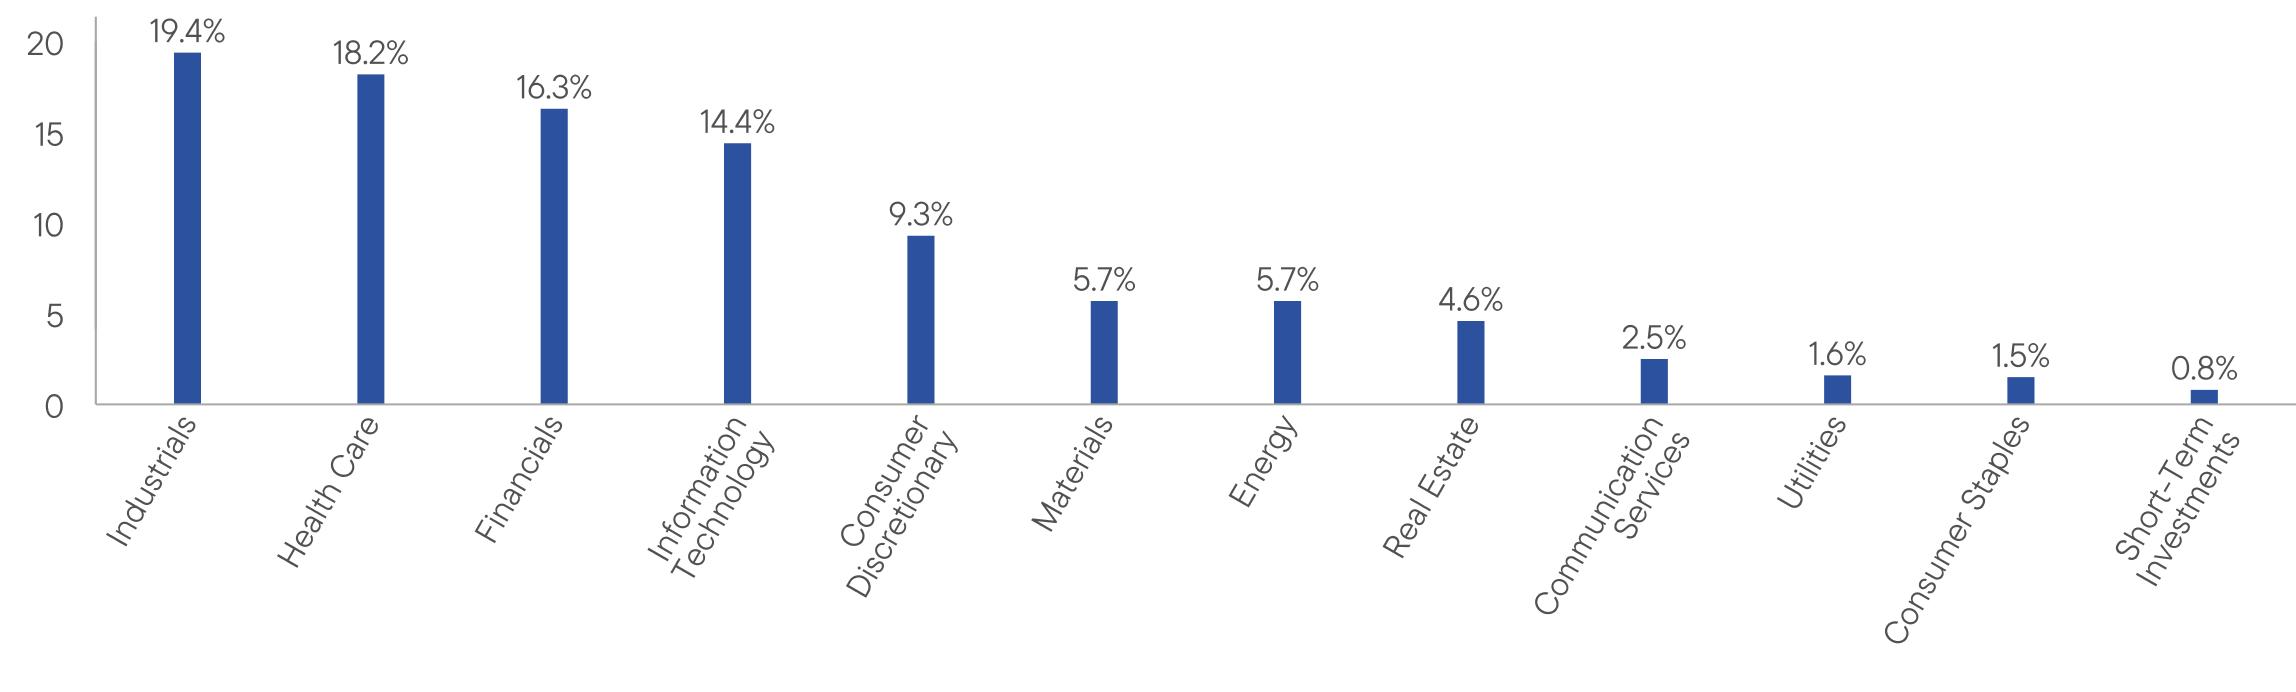
WHAT WERE THE FUND COSTS FOR THE LAST YEAR? (based on a hypothetical $10,000 investment)
|
Fund Name
|
Costs of a $10,000 investment
|
Costs paid as a percentage of a $10,000 investment*
|
|
Franklin U.S. Equity Index ETF
|
$3
|
0.03%
|
HOW DID THE FUND PERFORM LAST YEAR AND WHAT AFFECTED ITS PERFORMANCE?
For the twelve months ended March 31, 2026, Franklin U.S. Equity Index ETF returned 17.47%. The Fund compares its performance to the Morningstar US Target Market Exposure Index (the Underlying Index)† and the Linked Morningstar US Target Market Exposure Index††, which both returned 17.53% for the same period.
PERFORMANCE HIGHLIGHTS
|
Top contributors to performance:
|
|
|
↑
|
The sectors that contributed most to absolute performance include information technology, communication services and industrials.
|
|
↑
|
The individual holdings that contributed most to absolute performance included Nvidia, Broadcom, and Google.
|
|
Top detractors from performance:
|
|
|
↓
|
The only sector that detracted from absolute performance was health care.
|
|
↓
|
There were no individual holdings that detracted from absolute performance.
|
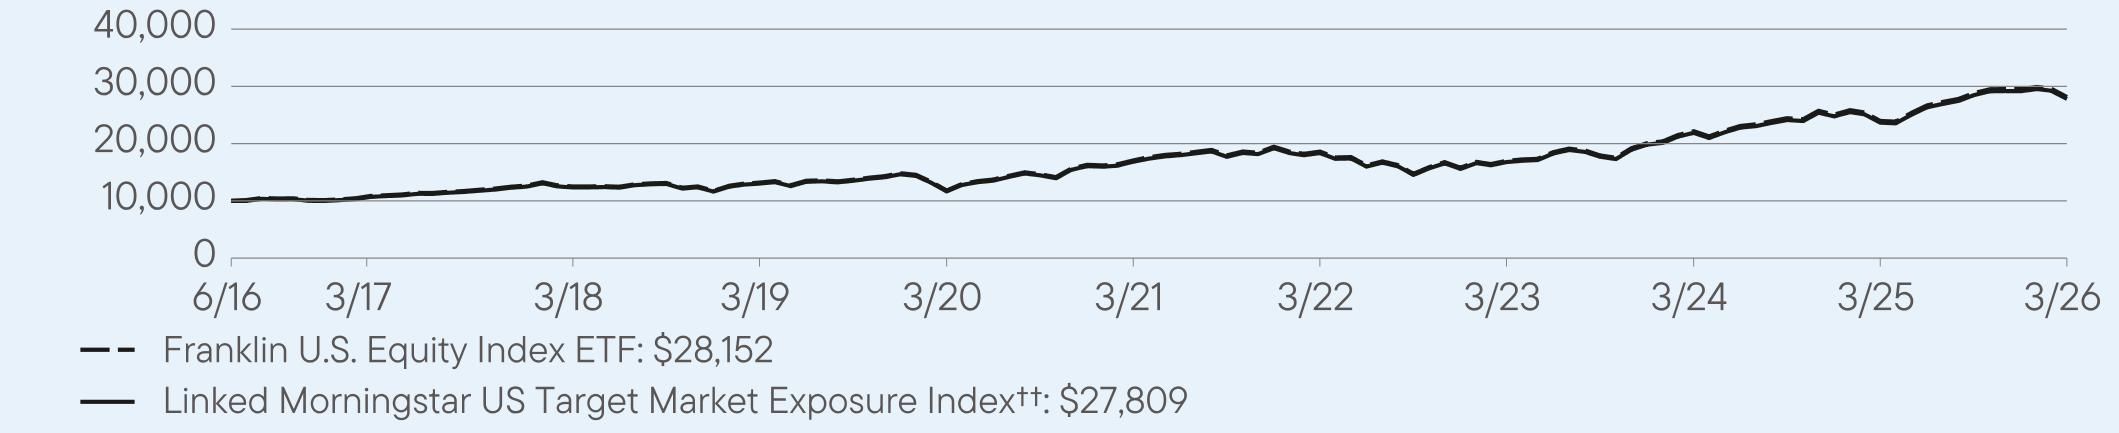
AVERAGE ANNUAL TOTAL RETURNS (%) Period Ended March 31, 2026
|
|
1 Year
|
5 Year
|
Since Inception
(6/1/2016) |
|
Franklin U.S. Equity Index ETF (NAV)
|
17.47
|
10.51
|
11.10
|
|
Morningstar US Target Market Exposure Index†
|
17.53
|
11.54
|
-
|
|
Linked Morningstar US Target Market Exposure Index††
|
17.53
|
10.56
|
11.12
|
For current month-end performance, please call Franklin Templeton at (800) DIAL BEN/342-5236 or visit
https://www.franklintempleton.com/investments/options/exchange-traded-funds.
https://www.franklintempleton.com/investments/options/exchange-traded-funds.
Important data provider notices and terms available at www.franklintempletondatasources.com.
KEY FUND STATISTICS (as of March 31, 2026)
|
Total Net Assets
|
$1,642,280,761
|
|
Total Number of Portfolio Holdings (excludes derivatives, except purchased options, if any)
|
507
|
|
Total Management Fee Paid (based on a unitary fee)
|
$435,055
|
|
Portfolio Turnover Rate
|
3%
|
WHAT DID THE FUND INVEST IN? (as of March 31, 2026)
Portfolio Composition* (% of Total Investments)
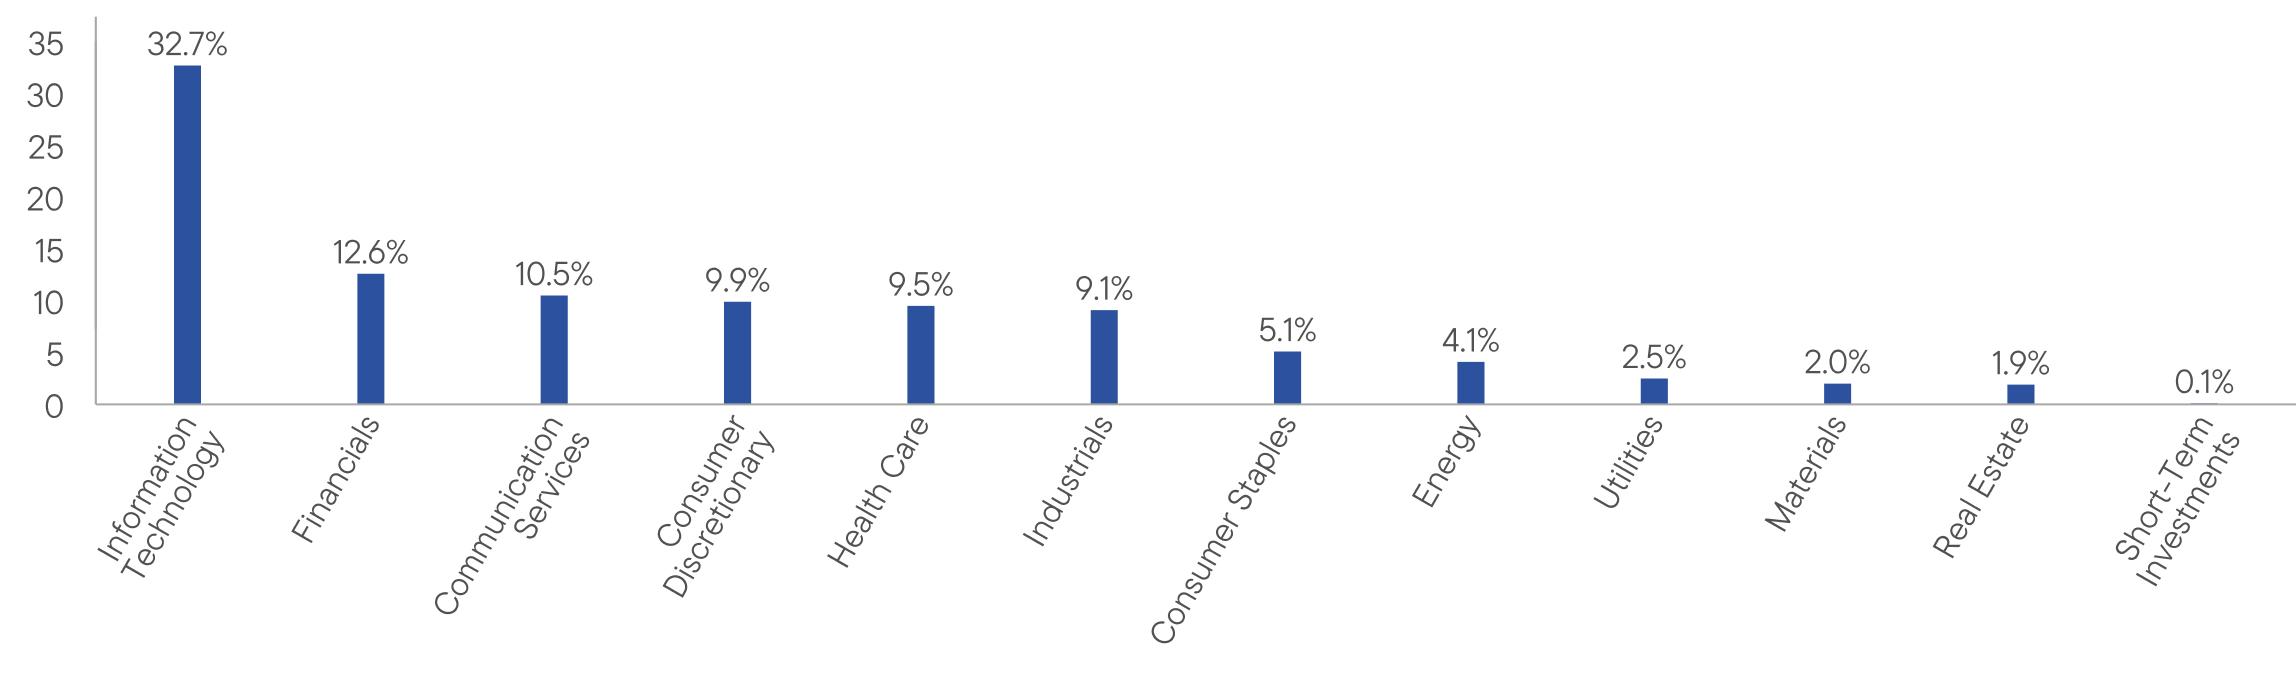
This report describes changes to the Fund that occurred during the reporting period.
WHAT WERE THE FUND COSTS FOR THE LAST YEAR? (based on a hypothetical $10,000 investment)
|
Fund Name
|
Costs of a $10,000 investment
|
Costs paid as a percentage of a $10,000 investment*
|
|
Putnam International Stock ETF1
|
$24
|
0.55%
|
HOW DID THE FUND PERFORM LAST YEAR AND WHAT AFFECTED ITS PERFORMANCE?
For the period October 21, 2025, to March 31, 2026, Putnam International Stock ETF returned -4.60%. The Fund compares its performance to the MSCI All Country World ex-US Growth Index-NR, which returned 7.23% for the same period.
PERFORMANCE HIGHLIGHTS
|
Top contributors to performance:
|
|
|
↑
|
Overweight position in Hoya, a Japanese manufacturer of optical products.
|
|
↑
|
Overweight position in AIA Group, an Asian life insurance company.
|
|
↑
|
Out-of-benchmark position in British American Tobacco, a multinational consumer goods company.
|
|
Top detractors from performance:
|
|
|
↓
|
Overweight position in Alibaba Group, a Chinese technology company.
|
|
↓
|
Overweight position in Airbus, a European aerospace corporation.
|
|
↓
|
Overweight position in Nintendo, a Japanese consumer electronics and video game company.
|
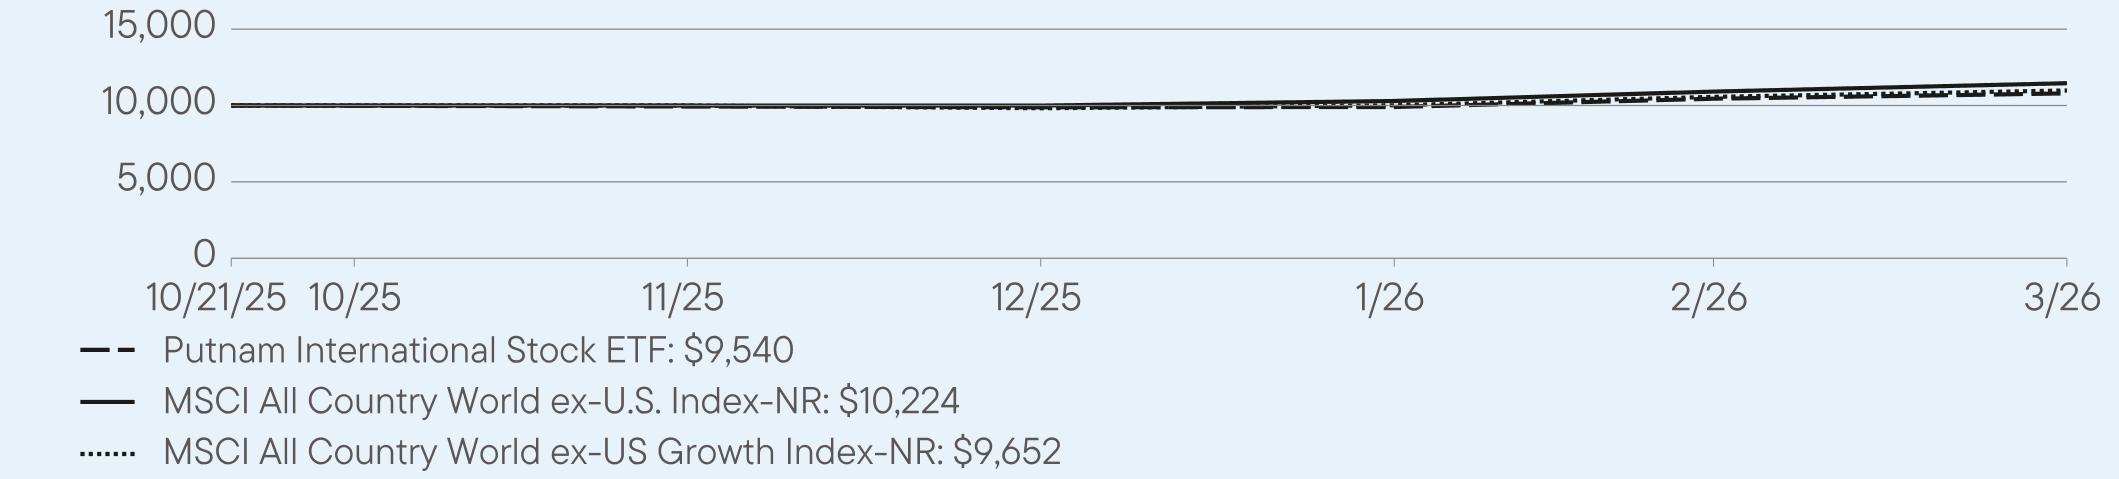
AVERAGE ANNUAL TOTAL RETURNS (%) Period Ended March 31, 2026
|
|
Since Inception
(10/21/2025) |
|
Putnam International Stock ETF (NAV)
|
-4.60
|
|
MSCI All Country World ex-U.S. Index-NR
|
2.34
|
|
MSCI All Country World ex-US Growth Index-NR
|
7.23
|
For current month-end performance, please call Franklin Templeton at (800) DIAL BEN/342-5236 or visit
https://www.franklintempleton.com/investments/options/exchange-traded-funds.
https://www.franklintempleton.com/investments/options/exchange-traded-funds.
Important data provider notices and terms available at www.franklintempletondatasources.com.
KEY FUND STATISTICS (as of March 31, 2026)
|
Total Net Assets
|
$4,763,145
|
|
Total Number of Portfolio Holdings
|
27
|
|
Total Management Fee Paid (based on a unitary fee)
|
$11,994
|
|
Portfolio Turnover Rate
|
21%
|
WHAT DID THE FUND INVEST IN? (as of March 31, 2026)
Portfolio Composition* (% of Total Investments)
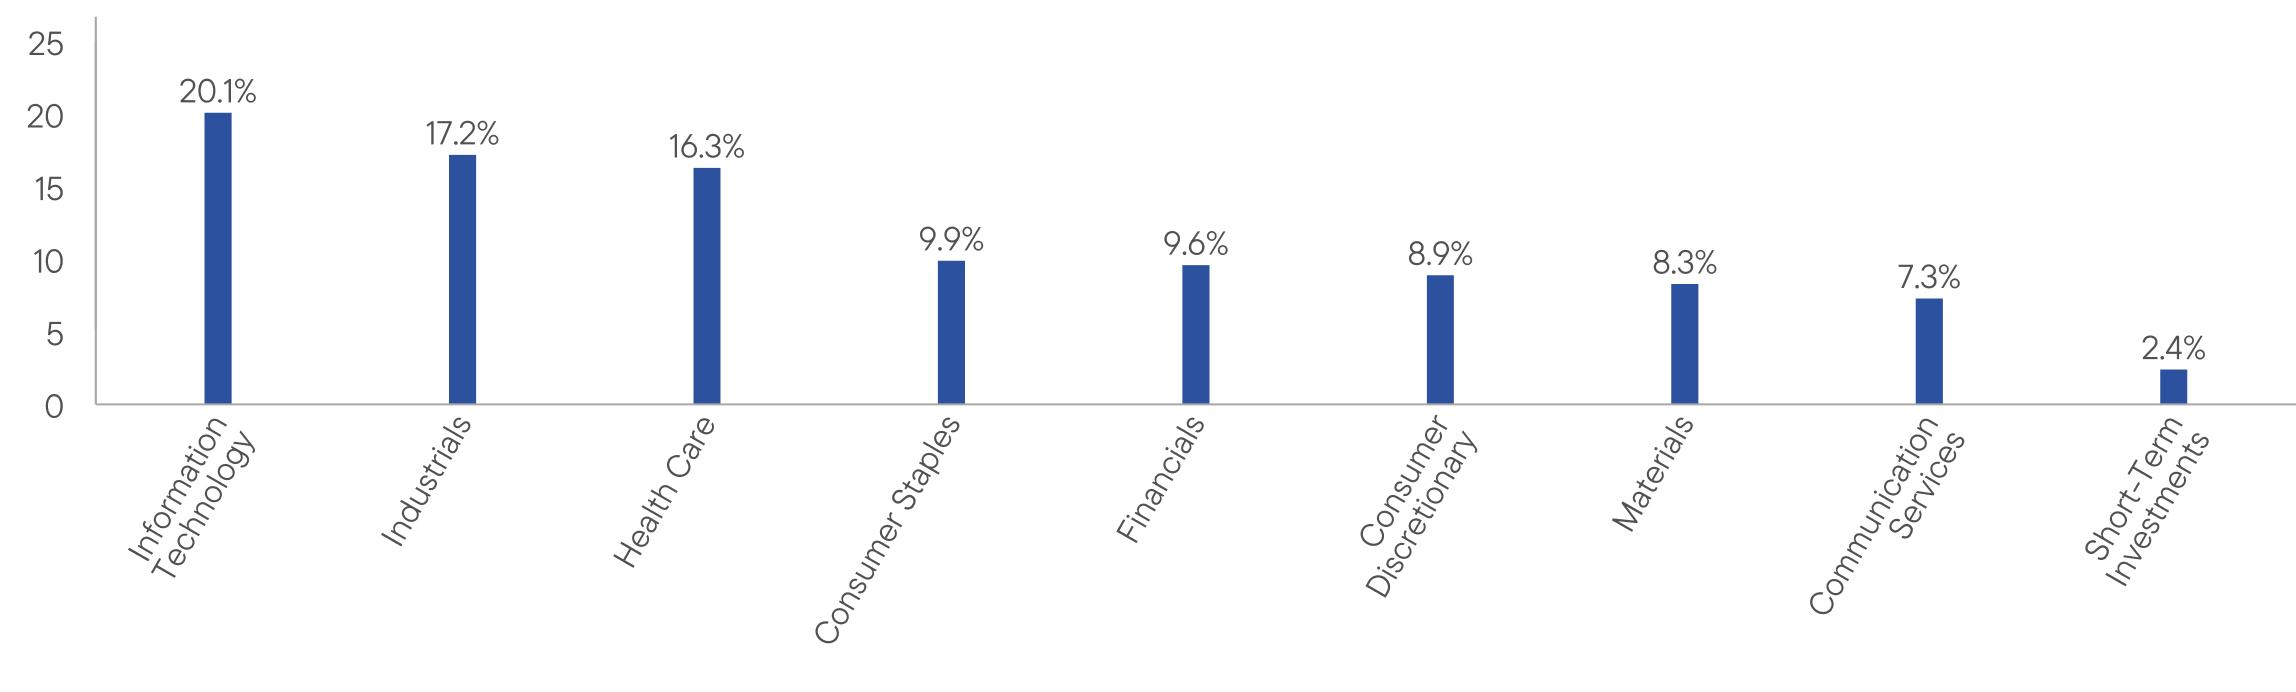
HOW HAS THE FUND CHANGED?
Effective November 17, 2025, the Fund’s principal investment strategies were revised to clarify that the Fund predominantly invests in “equity securities” of large and midsize companies located outside of the U.S. rather than in “common stocks” of large and midsize companies located outside of the U.S.
This is a summary of certain changes to the Fund since October 21, 2025. For more complete information, you may review the Fund’s current prospectus and any applicable supplements and the Fund’s next prospectus, which we expect to be available by August 1, 2026, at https://www.franklintempleton.com/regulatory-fund-documents or upon request at (800) DIAL BEN/342-5236 or
ETFs-Product@franklintempleton.com.
ETFs-Product@franklintempleton.com.
WHAT WERE THE FUND COSTS FOR THE LAST YEAR? (based on a hypothetical $10,000 investment)
|
Fund Name
|
Costs of a $10,000 investment
|
Costs paid as a percentage of a $10,000 investment*
|
|
Templeton Emerging Markets Debt ETF1
|
$8
|
0.44%
|
HOW DID THE FUND PERFORM LAST YEAR AND WHAT AFFECTED ITS PERFORMANCE?
For the period January 20, 2026, to March 31, 2026, Templeton Emerging Markets Debt ETF returned -1.46%. The Fund compares its performance to the JP Morgan EMBI Global Diversified Index, which returned -1.01% for the same period.
PERFORMANCE HIGHLIGHTS
|
Top contributors to performance:
|
|
|
↑
|
Sovereign credit exposures contributed to relative performance. Positioning in sub investment-grade sovereign credits in the Middle East/Africa contributed.
|
|
↑
|
Within currency positions, the Fund’s positions in the Brazilian real and South Korean won contributed to absolute performance.
|
|
↑
|
Within currency positions, the Fund’s overweighted position in the Brazilian real and underweighted position in the South Korean won contributed to relative performance.
|
|
Top detractors from performance:
|
|
|
↓
|
Sovereign credit exposures detracted from absolute performance. Select exposures to sub investment-grade sovereign credits in the Middle East/Africa and Asia detracted.
|
|
↓
|
Currency positions detracted from absolute performance, due to the Fund’s positions in the Egyptian pound and Indian rupee.
|
|
↓
|
Currency positions detracted from relative performance, due to the Fund’s overweighted positions in the Egyptian pound and Indian rupee.
|
Use of derivatives and the impact on performance:
The Fund utilized currency forward contracts to gain positive or negative exposure to select currencies for both investment and hedging purposes. In aggregate, these positions detracted from performance.
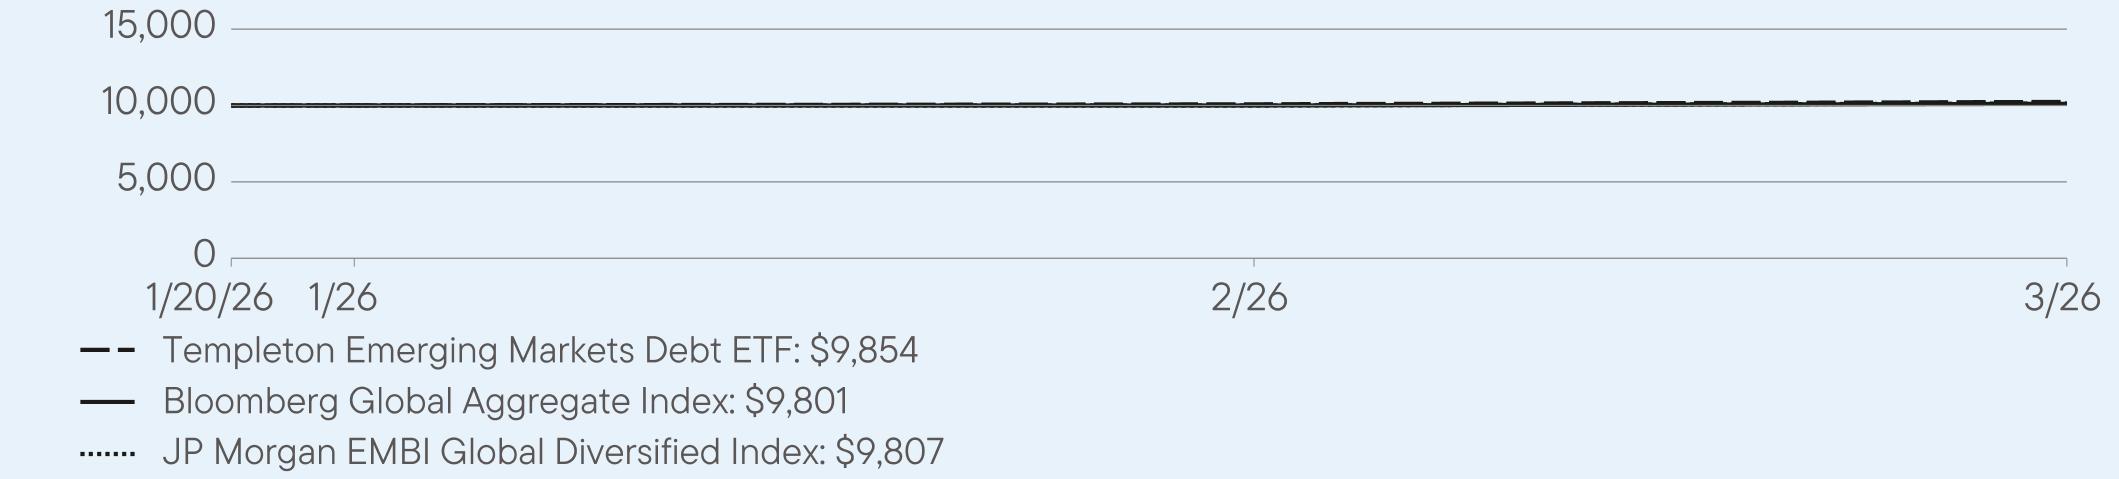
AVERAGE ANNUAL TOTAL RETURNS (%) Period Ended March 31, 2026
|
|
Since Inception
(1/20/2026) |
|
Templeton Emerging Markets Debt ETF (NAV)
|
-1.46
|
|
Bloomberg Global Aggregate Index
|
4.15
|
|
JP Morgan EMBI Global Diversified Index
|
-1.01
|
For current month-end performance, please call Franklin Templeton at (800) DIAL BEN/342-5236 or visit
https://www.franklintempleton.com/investments/options/exchange-traded-funds.
https://www.franklintempleton.com/investments/options/exchange-traded-funds.
Important data provider notices and terms available at www.franklintempletondatasources.com.
KEY FUND STATISTICS (as of March 31, 2026)
|
Total Net Assets
|
$48,963,228
|
|
Total Number of Portfolio Holdings (excludes derivatives, except purchased options, if any)
|
38
|
|
Total Management Fee Paid (based on a unitary fee)
|
$42,107
|
|
Portfolio Turnover Rate
|
0%
|
WHAT DID THE FUND INVEST IN? (as of March 31, 2026)
Portfolio Composition* (% of Total Investments)
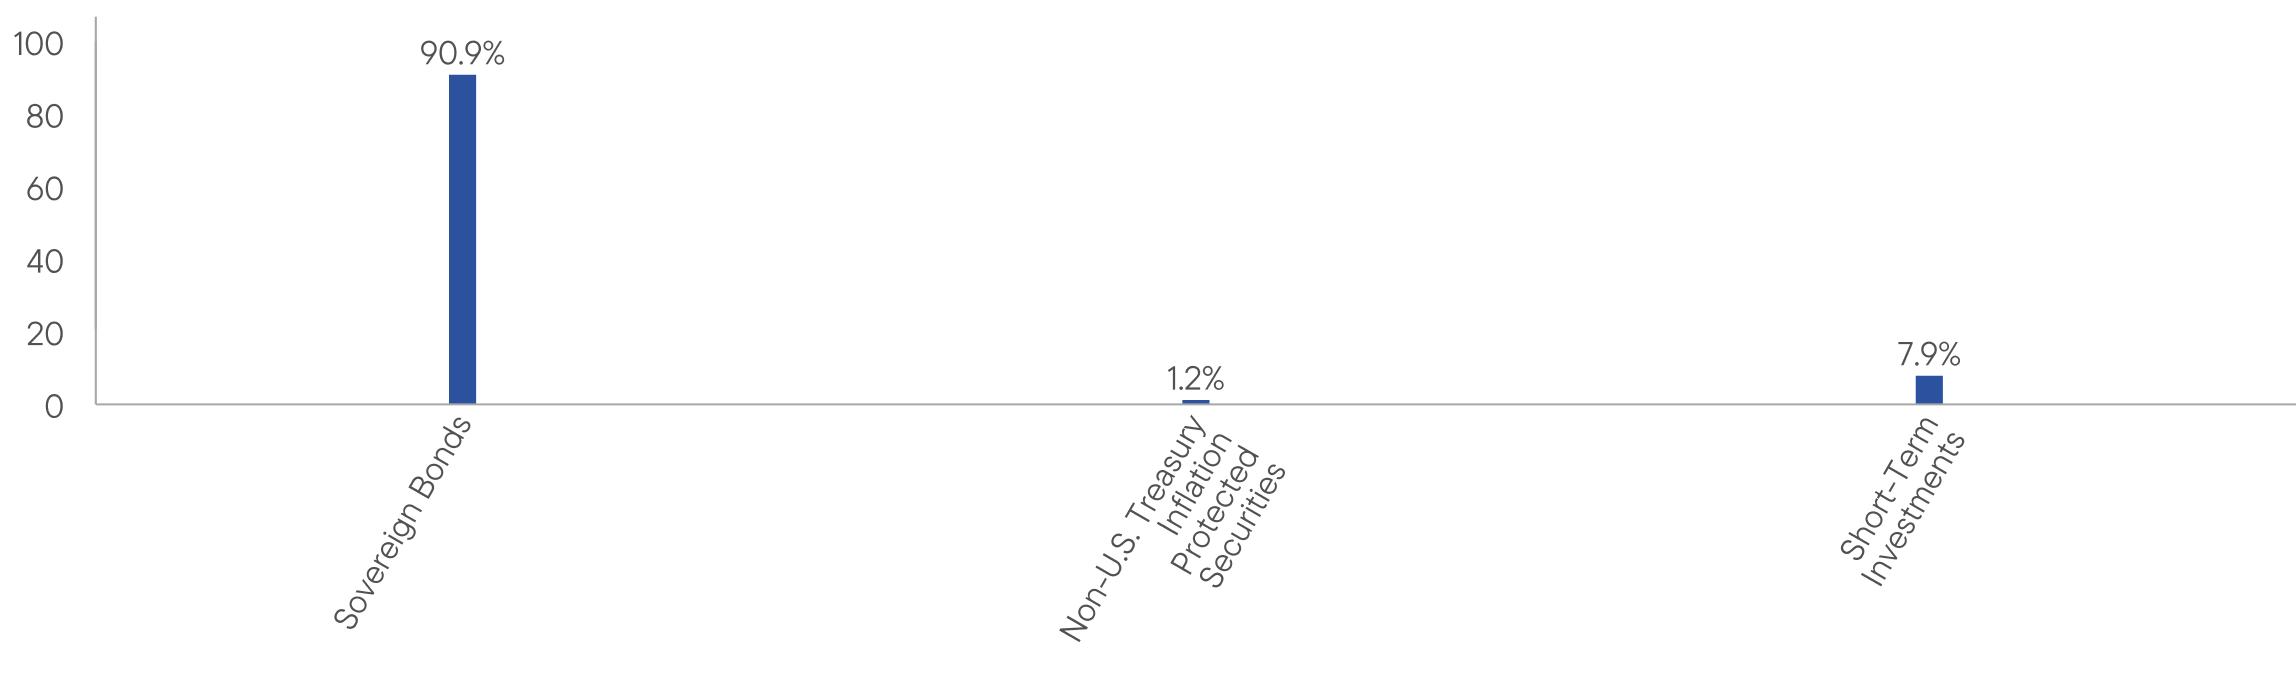
This report describes changes to the Fund that occurred during the reporting period.
WHAT WERE THE FUND COSTS FOR THE LAST YEAR? (based on a hypothetical $10,000 investment)
|
Fund Name
|
Costs of a $10,000 investment
|
Costs paid as a percentage of a $10,000 investment*
|
|
Templeton International Insights ETF1
|
$24
|
0.54%
|
HOW DID THE FUND PERFORM LAST YEAR AND WHAT AFFECTED ITS PERFORMANCE?
For the period January 20, 2026, to March 31, 2026, Templeton International Insights ETF returned 4.81%. The Fund compares its performance to the MSCI All Country World ex-U.S. Index-NR, which returned 2.62% for the same period.
PERFORMANCE HIGHLIGHTS
|
Top contributors to performance:
|
|
|
↑
|
Stock selection in the information technology sector was the top contributor to relative performance for the period. The pace of artificial intelligence (AI)-driven change continued to accelerate, requiring a more discriminating approach to both direct and indirect exposures. The Fund remained focused on semi-conductor companies that we believed would benefit from stronger demand for AI, electric vehicles, and green energy.
|
|
↑
|
Stock selection in the industrials sector also contributed. The Fund’s industrials positioning was skewed toward Europe, particularly Germany as we believed this cyclical sector would benefit from improving macroeconomic conditions, structural demand for electrification and AI-driven investment in capital-intensive sectors.
|
|
↑
|
Regionally, stock selection and an overweight in the U.K. contributed significantly to relative performance.
|
|
Top detractors from performance:
|
|
|
↓
|
Stock selection in the health care sector was the top detractor from relative performance.
|
|
↓
|
Stock selection and an underweight in the materials sector also detracted from relative performance.
|
|
↓
|
Regionally, stock selection in Ireland was the largest detractor from relative performance.
|
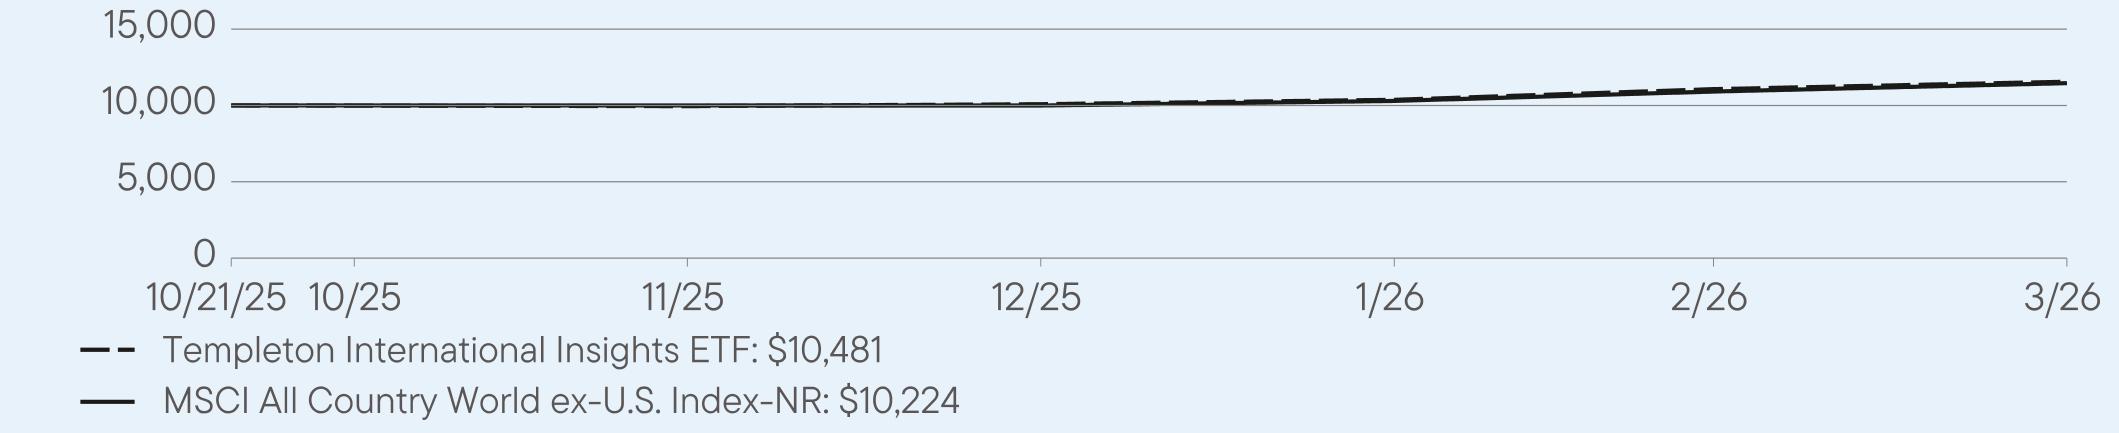
AVERAGE ANNUAL TOTAL RETURNS (%) Period Ended March 31, 2026
|
|
Since Inception
(10/21/2025) |
|
Templeton International Insights ETF (NAV)
|
4.81
|
|
MSCI All Country World ex-U.S. Index-NR
|
2.62
|
For current month-end performance, please call Franklin Templeton at (800) DIAL BEN/342-5236 or visit
https://www.franklintempleton.com/investments/options/exchange-traded-funds.
https://www.franklintempleton.com/investments/options/exchange-traded-funds.
Important data provider notices and terms available at www.franklintempletondatasources.com.
KEY FUND STATISTICS (as of March 31, 2026)
|
Total Net Assets
|
$5,229,054
|
|
Total Number of Portfolio Holdings
|
46
|
|
Total Management Fee Paid (based on a unitary fee)
|
$12,554
|
|
Portfolio Turnover Rate
|
20%
|
WHAT DID THE FUND INVEST IN? (as of March 31, 2026)
Portfolio Composition* (% of Total Investments)
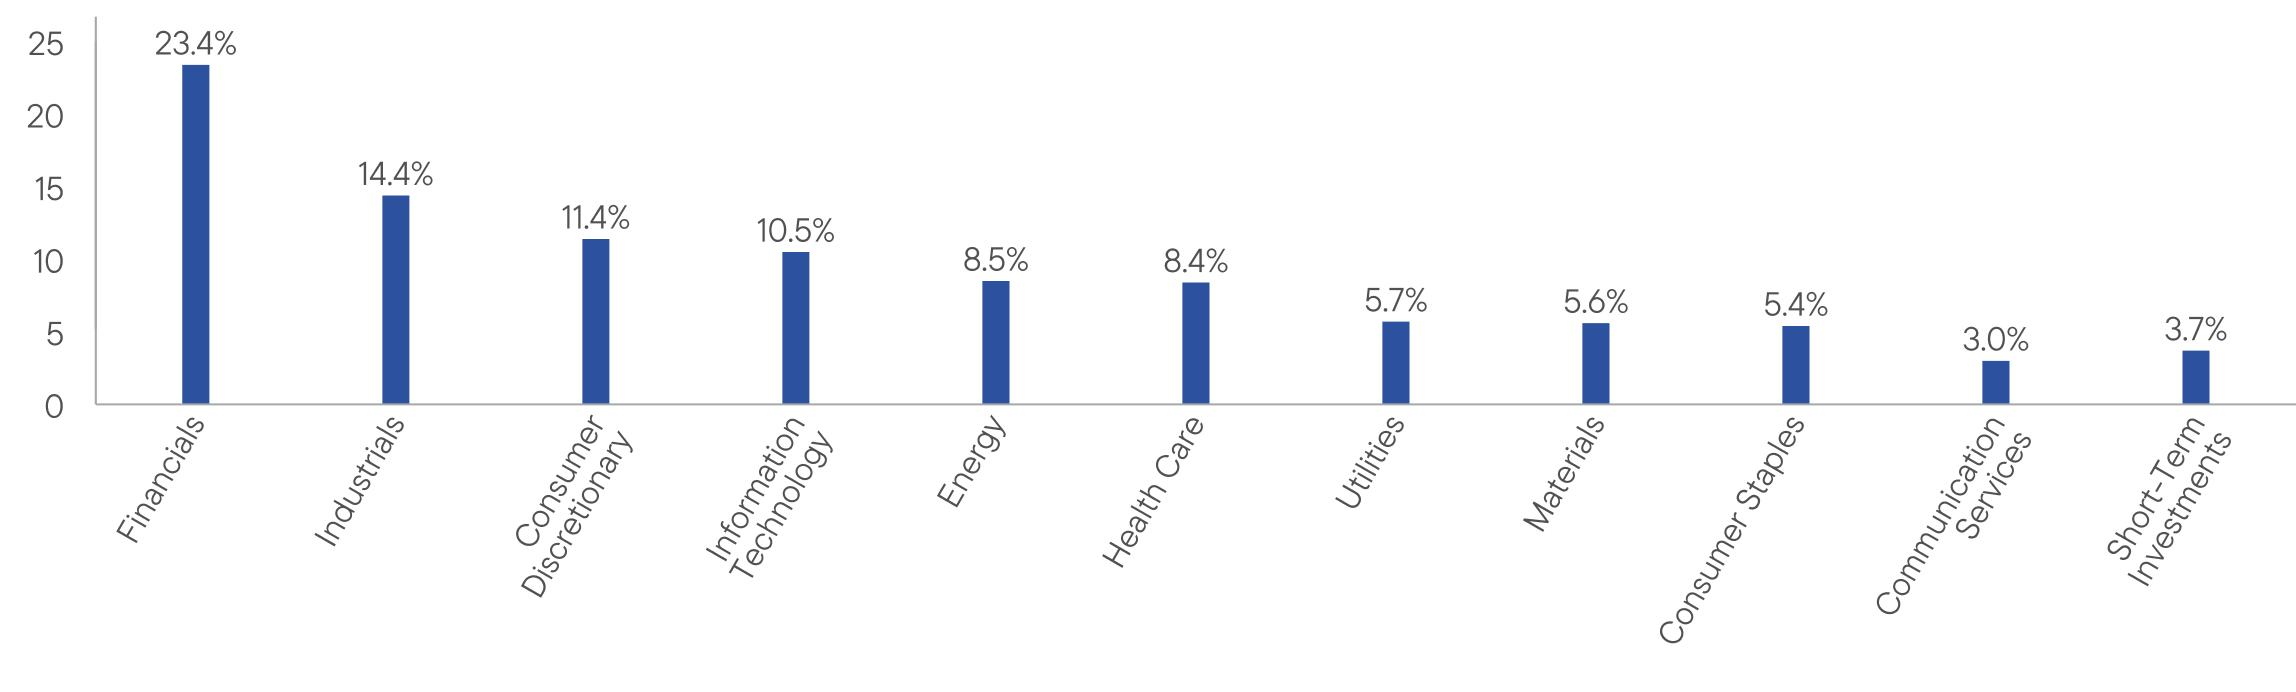
HOW HAS THE FUND CHANGED?
Effective December 15, 2025, Matthew R. Nagle, CFA stepped down as a member of the Fund’s portfolio management team.
This is a summary of certain changes to the Fund since October 21, 2025. For more complete information, you may review the Fund’s current prospectus and the Fund’s next prospectus, which we expect to be available by August 1, 2026, at https://www.franklintempleton.com/regulatory-fund-documents or upon request at (800) DIAL BEN/342-5236 or ETFs-Product@franklintempleton.com.
WHAT WERE THE FUND COSTS FOR THE LAST YEAR? (based on a hypothetical $10,000 investment)
|
Fund Name
|
Costs of a $10,000 investment
|
Costs paid as a percentage of a $10,000 investment*
|
|
Western Asset Bond ETF
|
$36
|
0.35%
|
HOW DID THE FUND PERFORM LAST YEAR AND WHAT AFFECTED ITS PERFORMANCE?
For the twelve months ended March 31, 2026, Western Asset Bond ETF returned 4.75%. The Fund compares its performance to the Bloomberg U.S. Aggregate Index, which returned 4.35% for the same period.
PERFORMANCE HIGHLIGHTS
|
Top contributors to performance:
|
|
|
↑
|
Investment-grade credit positioning
|
|
↑
|
Structured credit positioning
|
|
↑
|
Emerging market debt positioning
|
|
Top detractors from performance:
|
|
|
↓
|
Duration positioning
|
|
↓
|
Yield curve positioning
|
Use of derivatives and the impact on performance:
The Fund utilized Treasury futures, options, and swaps to manage duration, yield curve positioning and credit exposure. In aggregate, these derivatives detracted from performance.
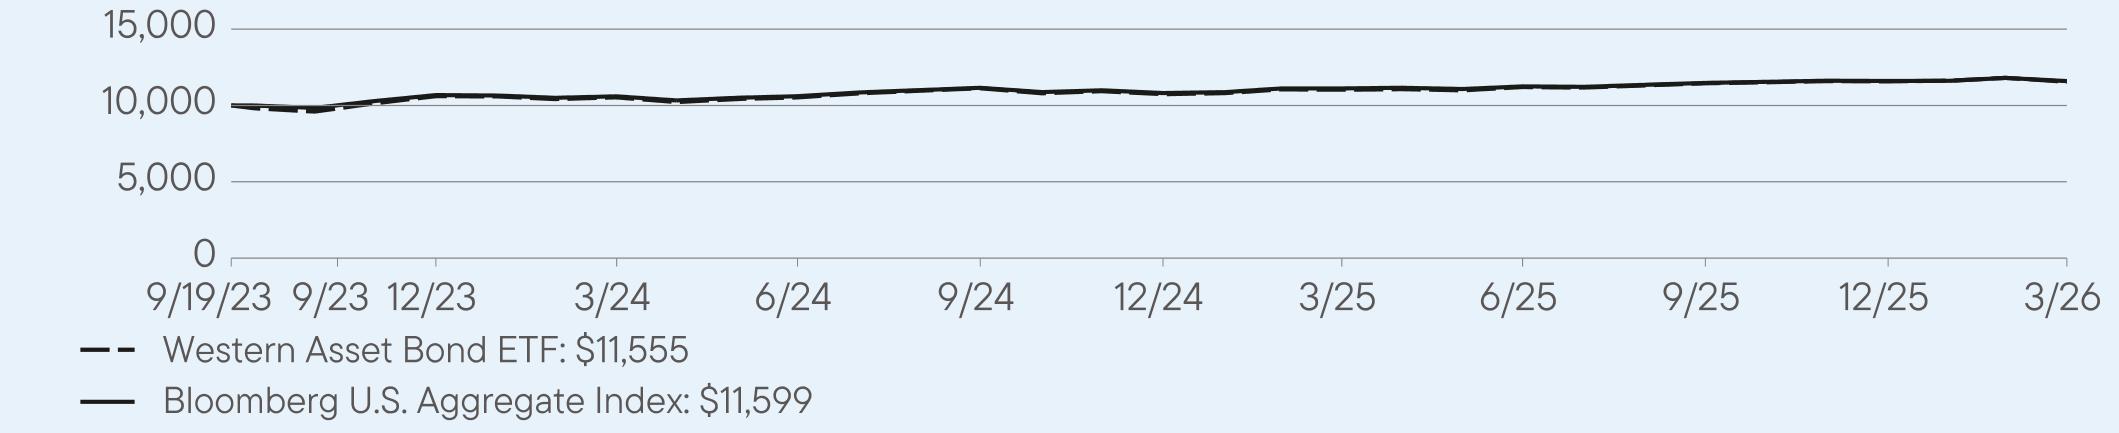
AVERAGE ANNUAL TOTAL RETURNS (%) Period Ended March 31, 2026
|
|
1 Year
|
Since Inception
(9/19/2023) |
|
Western Asset Bond ETF (NAV)
|
4.75
|
5.88
|
|
Bloomberg U.S. Aggregate Index
|
4.35
|
5.48
|
For current month-end performance, please call Franklin Templeton at (800) DIAL BEN/342-5236 or visit
https://www.franklintempleton.com/investments/options/exchange-traded-funds.
https://www.franklintempleton.com/investments/options/exchange-traded-funds.
Important data provider notices and terms available at www.franklintempletondatasources.com.
KEY FUND STATISTICS (as of March 31, 2026)
|
Total Net Assets
|
$16,359,043
|
|
Total Number of Portfolio Holdings (excludes derivatives, except purchased options, if any)
|
436
|
|
Total Management Fee Paid (based on a unitary fee)
|
$57,465
|
|
Portfolio Turnover Rate
|
336%
|
WHAT DID THE FUND INVEST IN? (as of March 31, 2026)
Portfolio Composition*,† (% of Total Investments)
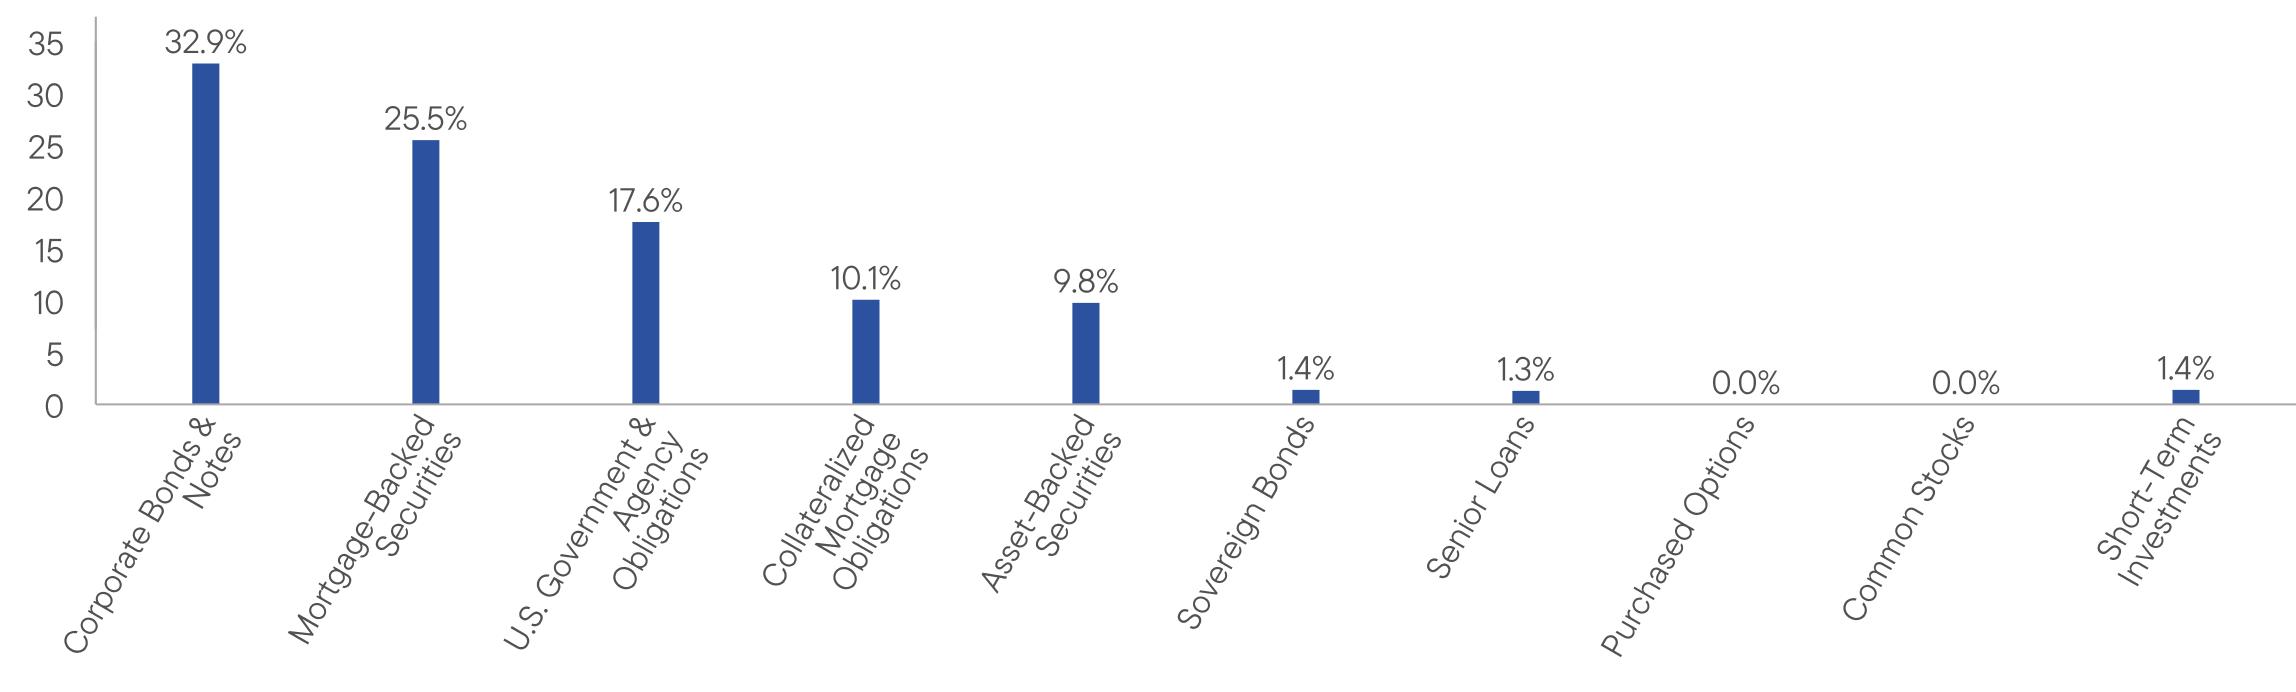
| [1] |
|
|||
| [2] |
|
|||
| [3] |
|
|||
| [4] |
|
|||
| [5] |
|
|||
| [6] |
|
|||
| [7] |
|
|||
| [8] |
|
|||
| [9] |
|
|||
| [10] |
|
|||
| [11] |
|
|||
| [12] |
|
|||
| [13] |
|
|||
| [14] |
|
|||
| [15] |
|
|||
| [16] |
|
|||
| [17] |
|
|||
| [18] |
|
|||
| [19] |
|
|||
| [20] |
|
|||
| [21] |
|
|||
| [22] |
|
|||
| [23] |
|
|||
| [24] |
|
|||
| [25] |
|
|||
| [26] |
|
|||
| [27] |
|
|||
| [28] |
|
|||
| [29] |
|
|||
| [30] |
|
|||
| [31] |
|
|||
| [32] |
|
|||
| [33] |
|
|||
| [34] |
|
|||
| [35] |
|
|||
| [36] |
|
|||
| [37] |
|
|||
| [38] |
|
|||
| [39] |
|
|||
| [40] |
|
|||
| [41] |
|
|||
| [42] |
|
|||
| [43] |
|
|||
| [44] |
|
|||
| [45] |
|
|||
| [46] |
|
|||
| [47] |
|
|||
| [48] |
|
|||
| [49] |
|
|||
| [50] |
|
|||
| [51] |
|
|||
| [52] |
|
|||
| [53] |
|
|||
| [54] |
|
|||
| [55] |
|
|||
| [56] |
|
|||
| [57] |
|
|||
| [58] |
|
|||
| [59] |
|
|||
| [60] |
|
|||
| [61] |
|
|||
| [62] |
|
|||
| [63] |
|
|||
| [64] |
|
|||
| [65] |
|
|||
| [66] |
|
|||
| [67] |
|
|||
| [68] |
|
|||
| [69] |
|
|||
| [70] |
|
|||
| [71] |
|
|||
| [72] |
|
|||
| [73] |
|
|||
| [74] |
|
|||
| [75] |
|
|||
| [76] |
|
|||
| [77] |
|
|||
| [78] |
|
|||
| [79] |
|
|||
| [80] |
|
|||
| [81] |
|
|||
| [82] |
|
|||
| [83] |
|
|||
| [84] |
|
|||
| [85] |
|
|||
| [86] |
|
|||
| [87] |
|
|||
| [88] |
|
|||
| [89] |
|
|||
| [90] |
|
|||
| [91] |
|
|||
| [92] |
|
|||
| [93] |
|
|||
| [94] |
|
|||
| [95] |
|
|||
| [96] |
|
|||
| [97] |
|
|||
| [98] |
|
|||
| [99] |
|
|||
| [100] |
|
|||
| [101] |
|
|||
| [102] |
|
|||
| [103] |
|
|||
| [104] |
|
|||
| [105] |
|
|||
| [106] |
|
|||
| [107] |
|
|||
| [108] |
|
|||
| [109] |
|
|||
| [110] |
|
|||
| [111] |
|
|||
| [112] |
|
|||
| [113] |
|
|||
| [114] |
|
|||
| [115] |
|
|||
| [116] |
|
|||
| [117] |
|
|||
| [118] |
|
|||
| [119] |
|
|||
| [120] |
|
|||
| [121] |
|
|||
| [122] |
|
|||
| [123] |
|
|||
| [124] |
|
|||
| [125] |
|
|||
| [126] |
|
|||
| [127] |
|
|||
| [128] |
|
|||
| [129] |
|
|||
| [130] |
|
|||
| [131] |
|
|||
| [132] |
|
|||
| [133] |
|
|||
| [134] |
|
|||
| [135] |
|
|||
| [136] |
|
|||
| [137] |
|
|||
| [138] |
|
|||
| [139] |
|
|||
| [140] |
|
|||
| [141] |
|
|||
| [142] |
|
|||
| [143] |
|
|||
| [144] |
|
|||
| [145] |
|