Shareholder Report
|
6 Months Ended |
|
Mar. 31, 2026
USD ($)
Holding
|
|---|
| Shareholder Report [Line Items] |
|
|
| Document Type |
N-CSRS
|
|
| Amendment Flag |
false
|
|
| Registrant Name |
Northern Lights Fund Trust III
|
|
| Entity Central Index Key |
0001537140
|
|
| Entity Investment Company Type |
N-1A
|
|
| Document Period End Date |
Mar. 31, 2026
|
|
| Shareholder Report Annual or Semi-Annual |
Semi-Annual Shareholder Report
|
|
| C000134182 |
|
|
| Shareholder Report [Line Items] |
|
|
| Fund Name |
RESQ Dynamic Allocation Fund
|
|
| Class Name |
Class A
|
|
| Trading Symbol |
RQEAX
|
|
| Annual or Semi-Annual Statement [Text Block] |
This semi-annual shareholder report contains important information about RESQ Dynamic Allocation Fund for the period of October 1, 2025 to March 31, 2026.
|
|
| Additional Information [Text Block] |
You can find additional information about the Fund at https://www.resqfunds.com/shareholder_reports. You can also request this information by contacting us at 1-877-940-2526.
|
|
| Additional Information Phone Number |
1-877-940-2526
|
|
| Additional Information Website |
https://www.resqfunds.com/shareholder_reports
|
|
| Expenses [Text Block] |
What were the Fund’s costs for the last six months?(based on a hypothetical $10,000 investment) Table SummaryClass Name | Costs of a $10,000 investment | Costs paid as a percentage of a $10,000 investment |
|---|
Class A | $110 | 2.20%Footnote Reference* |
|---|
| Footnote | Description | Footnote* | Annualized |
|
|
| Expenses Paid, Amount |
$ 110
|
|
| Expense Ratio, Percent |
2.20%
|
[1] |
| AssetsNet |
$ 35,422,510
|
|
| Holdings Count | Holding |
19
|
|
| Advisory Fees Paid, Amount |
$ 189,667
|
|
| InvestmentCompanyPortfolioTurnover |
44.00%
|
|
| Additional Fund Statistics [Text Block] |
Table SummaryNet Assets | $35,422,510 |
|---|
Number of Portfolio Holdings | 19 |
|---|
Advisory Fee (net of waivers) | $189,667 |
|---|
Portfolio Turnover | 44% |
|---|
|
|
| Holdings [Text Block] |
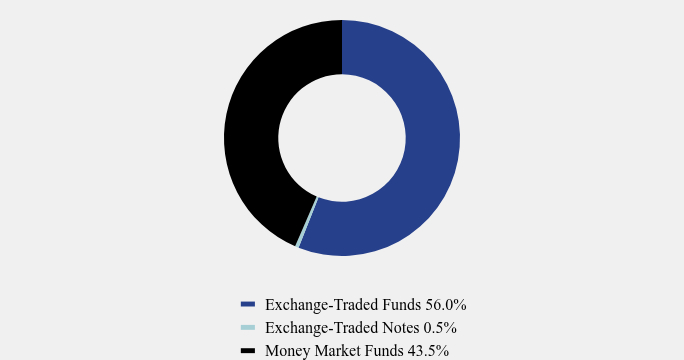
Asset Weighting (% of total investments)Table SummaryValue | Value |
|---|
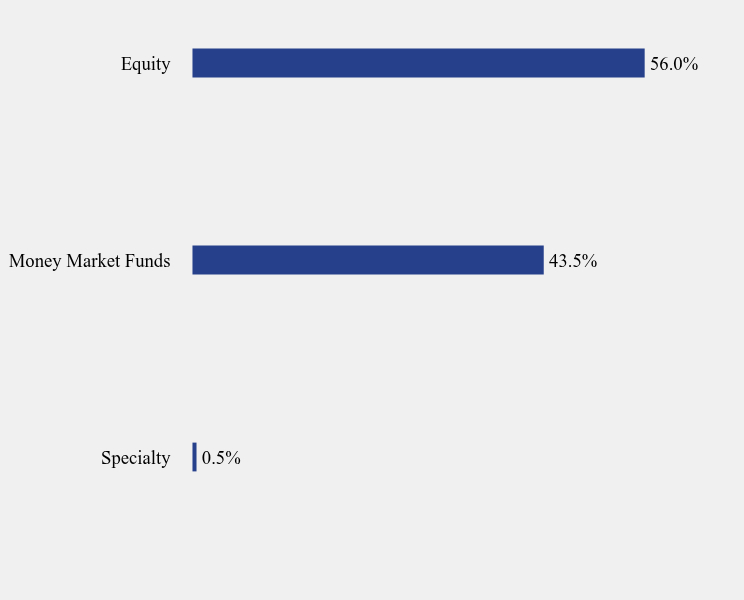
Exchange-Traded Funds | 56.0% | Exchange-Traded Notes | 0.5% | Money Market Funds | 43.5% | Asset Weighting (% of net assets)Table SummaryValue | Value |
|---|
Specialty | 0.5% | Money Market Funds | 43.5% | Equity | 56.0% | Top 10 Holdings (% of net assets)Table SummaryHolding Name | % of Net Assets |
|---|
First American Government Obligations Fund, Class X | 43.5% |
|---|
iShares MSCI ACWI ETF | 10.6% |
|---|
State Street Technology Select Sector SPDR ETF | 8.5% |
|---|
Vanguard S&P 500 ETF | 6.7% |
|---|
Direxion Daily S&P 500 Bear 3X ETF | 4.6% |
|---|
State Street Financial Select Sector SPDR ETF | 3.7% |
|---|
State Street Consumer Discretionary Select Sector SPDR ETF | 3.0% |
|---|
State Street Health Care Select Sector SPDR ETF | 3.0% |
|---|
iShares U.S. Utilities ETF | 3.0% |
|---|
State Street Industrial Select Sector SPDR ETF | 2.7% |
|---|
|
|
| C000145676 |
|
|
| Shareholder Report [Line Items] |
|
|
| Fund Name |
RESQ Dynamic Allocation Fund
|
|
| Class Name |
Class C
|
|
| Trading Symbol |
RQECX
|
|
| Annual or Semi-Annual Statement [Text Block] |
This semi-annual shareholder report contains important information about RESQ Dynamic Allocation Fund for the period of October 1, 2025 to March 31, 2026.
|
|
| Additional Information [Text Block] |
You can find additional information about the Fund at https://www.resqfunds.com/shareholder_reports. You can also request this information by contacting us at 1-877-940-2526.
|
|
| Additional Information Phone Number |
1-877-940-2526
|
|
| Additional Information Website |
https://www.resqfunds.com/shareholder_reports
|
|
| Expenses [Text Block] |
What were the Fund’s costs for the last six months?(based on a hypothetical $10,000 investment) Table SummaryClass Name | Costs of a $10,000 investment | Costs paid as a percentage of a $10,000 investment |
|---|
Class C | $139 | 2.80%Footnote Reference* |
|---|
| Footnote | Description | Footnote* | Annualized |
|
|
| Expenses Paid, Amount |
$ 139
|
|
| Expense Ratio, Percent |
2.80%
|
[2] |
| AssetsNet |
$ 35,422,510
|
|
| Holdings Count | Holding |
19
|
|
| Advisory Fees Paid, Amount |
$ 189,667
|
|
| InvestmentCompanyPortfolioTurnover |
44.00%
|
|
| Additional Fund Statistics [Text Block] |
Table SummaryNet Assets | $35,422,510 |
|---|
Number of Portfolio Holdings | 19 |
|---|
Advisory Fee (net of waivers) | $189,667 |
|---|
Portfolio Turnover | 44% |
|---|
|
|
| Holdings [Text Block] |
Asset Weighting (% of total investments)Table SummaryValue | Value |
|---|
Exchange-Traded Funds | 56.0% | Exchange-Traded Notes | 0.5% | Money Market Funds | 43.5% | Asset Weighting (% of net assets)Table SummaryValue | Value |
|---|
Specialty | 0.5% | Money Market Funds | 43.5% | Equity | 56.0% | Top 10 Holdings (% of net assets)Table SummaryHolding Name | % of Net Assets |
|---|
First American Government Obligations Fund, Class X | 43.5% |
|---|
iShares MSCI ACWI ETF | 10.6% |
|---|
State Street Technology Select Sector SPDR ETF | 8.5% |
|---|
Vanguard S&P 500 ETF | 6.7% |
|---|
Direxion Daily S&P 500 Bear 3X ETF | 4.6% |
|---|
State Street Financial Select Sector SPDR ETF | 3.7% |
|---|
State Street Consumer Discretionary Select Sector SPDR ETF | 3.0% |
|---|
State Street Health Care Select Sector SPDR ETF | 3.0% |
|---|
iShares U.S. Utilities ETF | 3.0% |
|---|
State Street Industrial Select Sector SPDR ETF | 2.7% |
|---|
|
|
| C000134183 |
|
|
| Shareholder Report [Line Items] |
|
|
| Fund Name |
RESQ Dynamic Allocation Fund
|
|
| Class Name |
Class I
|
|
| Trading Symbol |
RQEIX
|
|
| Annual or Semi-Annual Statement [Text Block] |
This semi-annual shareholder report contains important information about RESQ Dynamic Allocation Fund for the period of October 1, 2025 to March 31, 2026.
|
|
| Additional Information [Text Block] |
You can find additional information about the Fund at https://www.resqfunds.com/shareholder_reports. You can also request this information by contacting us at 1-877-940-2526.
|
|
| Additional Information Phone Number |
1-877-940-2526
|
|
| Additional Information Website |
https://www.resqfunds.com/shareholder_reports
|
|
| Expenses [Text Block] |
What were the Fund’s costs for the last six months?(based on a hypothetical $10,000 investment) Table SummaryClass Name | Costs of a $10,000 investment | Costs paid as a percentage of a $10,000 investment |
|---|
Class I | $90 | 1.80%Footnote Reference* |
|---|
| Footnote | Description | Footnote* | Annualized |
|
|
| Expenses Paid, Amount |
$ 90
|
|
| Expense Ratio, Percent |
1.80%
|
[3] |
| AssetsNet |
$ 35,422,510
|
|
| Holdings Count | Holding |
19
|
|
| Advisory Fees Paid, Amount |
$ 189,667
|
|
| InvestmentCompanyPortfolioTurnover |
44.00%
|
|
| Additional Fund Statistics [Text Block] |
Table SummaryNet Assets | $35,422,510 |
|---|
Number of Portfolio Holdings | 19 |
|---|
Advisory Fee (net of waivers) | $189,667 |
|---|
Portfolio Turnover | 44% |
|---|
|
|
| Holdings [Text Block] |
Asset Weighting (% of total investments)Table SummaryValue | Value |
|---|
Exchange-Traded Funds | 56.0% | Exchange-Traded Notes | 0.5% | Money Market Funds | 43.5% | Asset Weighting (% of net assets)Table SummaryValue | Value |
|---|
Specialty | 0.5% | Money Market Funds | 43.5% | Equity | 56.0% | Top 10 Holdings (% of net assets)Table SummaryHolding Name | % of Net Assets |
|---|
First American Government Obligations Fund, Class X | 43.5% |
|---|
iShares MSCI ACWI ETF | 10.6% |
|---|
State Street Technology Select Sector SPDR ETF | 8.5% |
|---|
Vanguard S&P 500 ETF | 6.7% |
|---|
Direxion Daily S&P 500 Bear 3X ETF | 4.6% |
|---|
State Street Financial Select Sector SPDR ETF | 3.7% |
|---|
State Street Consumer Discretionary Select Sector SPDR ETF | 3.0% |
|---|
State Street Health Care Select Sector SPDR ETF | 3.0% |
|---|
iShares U.S. Utilities ETF | 3.0% |
|---|
State Street Industrial Select Sector SPDR ETF | 2.7% |
|---|
|
|
| C000134180 |
|
|
| Shareholder Report [Line Items] |
|
|
| Fund Name |
RESQ Strategic Income Fund
|
|
| Class Name |
Class A
|
|
| Trading Symbol |
RQIAX
|
|
| Annual or Semi-Annual Statement [Text Block] |
This semi-annual shareholder report contains important information about RESQ Strategic Income Fund for the period of October 1, 2025 to March 31, 2026.
|
|
| Additional Information [Text Block] |
You can find additional information about the Fund at https://www.resqfunds.com/shareholder_reports. You can also request this information by contacting us at 1-877-940-2526.
|
|
| Additional Information Phone Number |
1-877-940-2526
|
|
| Additional Information Website |
https://www.resqfunds.com/shareholder_reports
|
|
| Expenses [Text Block] |
What were the Fund’s costs for the last six months?(based on a hypothetical $10,000 investment) Table SummaryClass Name | Costs of a $10,000 investment | Costs paid as a percentage of a $10,000 investment |
|---|
Class A | $110 | 2.20%Footnote Reference* |
|---|
| Footnote | Description | Footnote* | Annualized |
|
|
| Expenses Paid, Amount |
$ 110
|
|
| Expense Ratio, Percent |
2.20%
|
[4] |
| AssetsNet |
$ 29,299,186
|
|
| Holdings Count | Holding |
9
|
|
| Advisory Fees Paid, Amount |
$ 119,526
|
|
| InvestmentCompanyPortfolioTurnover |
278.00%
|
|
| Additional Fund Statistics [Text Block] |
Table SummaryNet Assets | $29,299,186 |
|---|
Number of Portfolio Holdings | 9 |
|---|
Advisory Fee (net of waivers) | $119,526 |
|---|
Portfolio Turnover | 278% |
|---|
|
|
| Holdings [Text Block] |
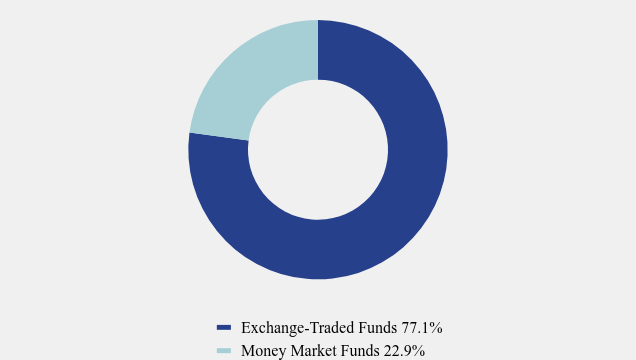
Asset Weighting (% of total investments)Table SummaryValue | Value |
|---|
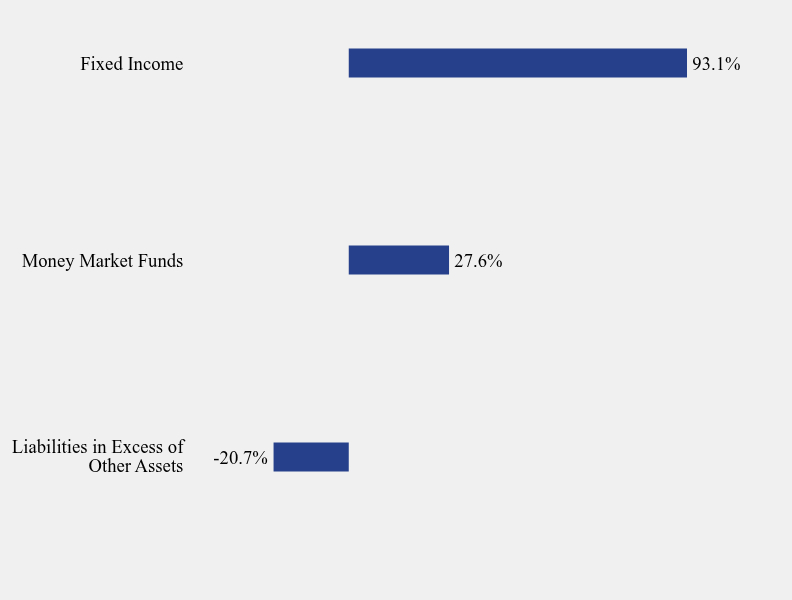
Exchange-Traded Funds | 77.1% | Money Market Funds | 22.9% | Asset Weighting (% of net assets)Table SummaryValue | Value |
|---|
Liabilities in Excess of Other Assets | -20.7% | Money Market Funds | 27.6% | Fixed Income | 93.1% | Top 10 Holdings (% of net assets)Table SummaryHolding Name | % of Net Assets |
|---|
First American Government Obligations Fund, Class X | 27.6% |
|---|
JPMorgan Ultra-Short Income ETF | 13.8% |
|---|
iShares 0-3 Month Treasury Bond ETF | 13.7% |
|---|
iShares 1-3 Year Treasury Bond ETF | 13.7% |
|---|
iShares 0-1 Year Treasury Bond ETF | 13.6% |
|---|
Vanguard Short-Term Treasury ETF | 12.0% |
|---|
iShares 20+ Year Treasury Bond ETF | 10.4% |
|---|
SPDR Portfolio Long Term Treasury ETF | 10.2% |
|---|
Vanguard Long-Term Treasury ETF | 5.7% |
|---|
|
|
| C000134181 |
|
|
| Shareholder Report [Line Items] |
|
|
| Fund Name |
RESQ Strategic Income Fund
|
|
| Class Name |
Class I
|
|
| Trading Symbol |
RQIIX
|
|
| Annual or Semi-Annual Statement [Text Block] |
This semi-annual shareholder report contains important information about RESQ Strategic Income Fund for the period of October 1, 2025 to March 31, 2026.
|
|
| Additional Information [Text Block] |
You can find additional information about the Fund at https://www.resqfunds.com/shareholder_reports. You can also request this information by contacting us at 1-877-940-2526.
|
|
| Additional Information Phone Number |
1-877-940-2526
|
|
| Additional Information Website |
https://www.resqfunds.com/shareholder_reports
|
|
| Expenses [Text Block] |
What were the Fund’s costs for the last six months?(based on a hypothetical $10,000 investment) Table SummaryClass Name | Costs of a $10,000 investment | Costs paid as a percentage of a $10,000 investment |
|---|
Class I | $90 | 1.80%Footnote Reference* |
|---|
| Footnote | Description | Footnote* | Annualized |
|
|
| Expenses Paid, Amount |
$ 90
|
|
| Expense Ratio, Percent |
1.80%
|
[5] |
| AssetsNet |
$ 29,299,186
|
|
| Holdings Count | Holding |
9
|
|
| Advisory Fees Paid, Amount |
$ 119,526
|
|
| InvestmentCompanyPortfolioTurnover |
278.00%
|
|
| Additional Fund Statistics [Text Block] |
Table SummaryNet Assets | $29,299,186 |
|---|
Number of Portfolio Holdings | 9 |
|---|
Advisory Fee (net of waivers) | $119,526 |
|---|
Portfolio Turnover | 278% |
|---|
|
|
| Holdings [Text Block] |
Asset Weighting (% of total investments)Table SummaryValue | Value |
|---|
Exchange-Traded Funds | 77.1% | Money Market Funds | 22.9% | Asset Weighting (% of net assets)Table SummaryValue | Value |
|---|
Liabilities in Excess of Other Assets | -20.7% | Money Market Funds | 27.6% | Fixed Income | 93.1% | Top 10 Holdings (% of net assets)Table SummaryHolding Name | % of Net Assets |
|---|
First American Government Obligations Fund, Class X | 27.6% |
|---|
JPMorgan Ultra-Short Income ETF | 13.8% |
|---|
iShares 0-3 Month Treasury Bond ETF | 13.7% |
|---|
iShares 1-3 Year Treasury Bond ETF | 13.7% |
|---|
iShares 0-1 Year Treasury Bond ETF | 13.6% |
|---|
Vanguard Short-Term Treasury ETF | 12.0% |
|---|
iShares 20+ Year Treasury Bond ETF | 10.4% |
|---|
SPDR Portfolio Long Term Treasury ETF | 10.2% |
|---|
Vanguard Long-Term Treasury ETF | 5.7% |
|---|
|
|
|
|