Shareholder Report
Mar. 31, 2026
USD ($)
Holding
| [1] | Annualized |
| [2] | Annualized |
Shareholder Report |
6 Months Ended | |||||
|---|---|---|---|---|---|---|
|
Mar. 31, 2026
USD ($)
Holding
| ||||||
| Shareholder Report [Line Items] | ||||||
| Document Type | N-CSRS | |||||
| Amendment Flag | false | |||||
| Registrant Name | Northern Lights Fund Trust III | |||||
| Entity Central Index Key | 0001537140 | |||||
| Entity Investment Company Type | N-1A | |||||
| Document Period End Date | Mar. 31, 2026 | |||||
| Shareholder Report Annual or Semi-Annual | Semi-Annual Shareholder Report | |||||
| C000246525 | ||||||
| Shareholder Report [Line Items] | ||||||
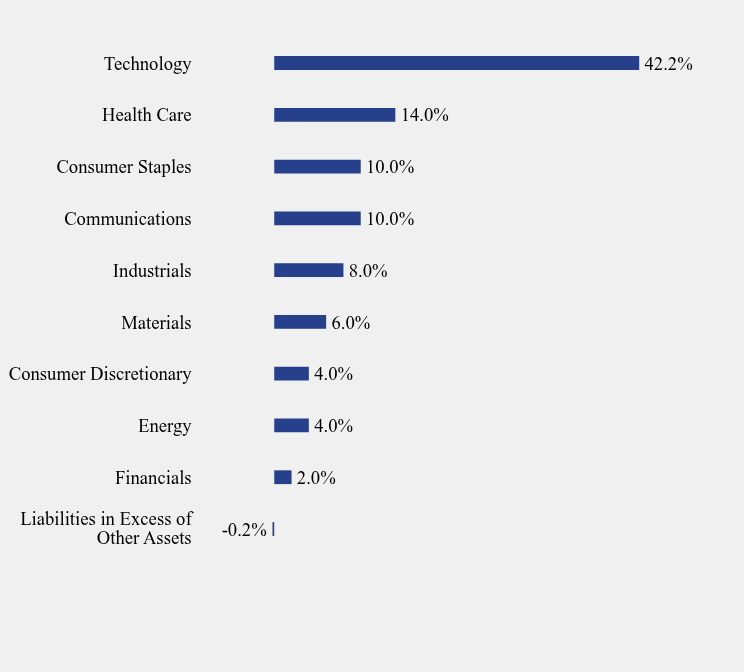
| Fund Name | Counterpoint Quantitative Equity ETF | |||||
| Trading Symbol | CPAI | |||||
| Security Exchange Name | NYSE | |||||
| Annual or Semi-Annual Statement [Text Block] | This semi-annual shareholder report contains important information about Counterpoint Quantitative Equity ETF for the period of October 1, 2025 to March 31, 2026. | |||||
| Additional Information [Text Block] | You can find additional information about the Fund at https://counterpointfunds.com/resources/. You can also request this information by contacting us at 1-844-509-2775. | |||||
| Additional Information Phone Number | 1-844-509-2775 | |||||
| Additional Information Website | https://counterpointfunds.com/resources/ | |||||
| Expenses [Text Block] | ||||||
| Expenses Paid, Amount | $ 39 | |||||
| Expense Ratio, Percent | 0.75% | [1] | ||||
| AssetsNet | $ 209,750,510 | |||||
| Holdings Count | Holding | 50 | |||||
| Advisory Fees Paid, Amount | $ 456,485 | |||||
| InvestmentCompanyPortfolioTurnover | 194.00% | |||||
| Additional Fund Statistics [Text Block] | ||||||
| Holdings [Text Block] | ||||||
| C000216396 | ||||||
| Shareholder Report [Line Items] | ||||||
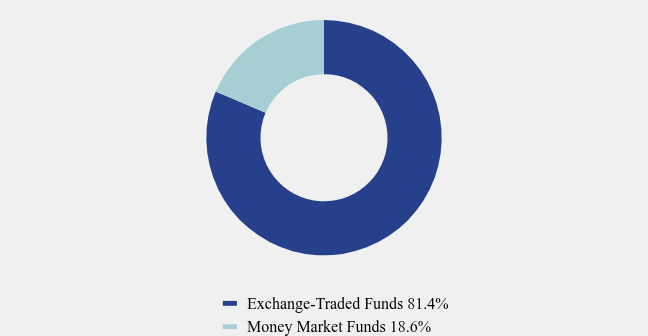
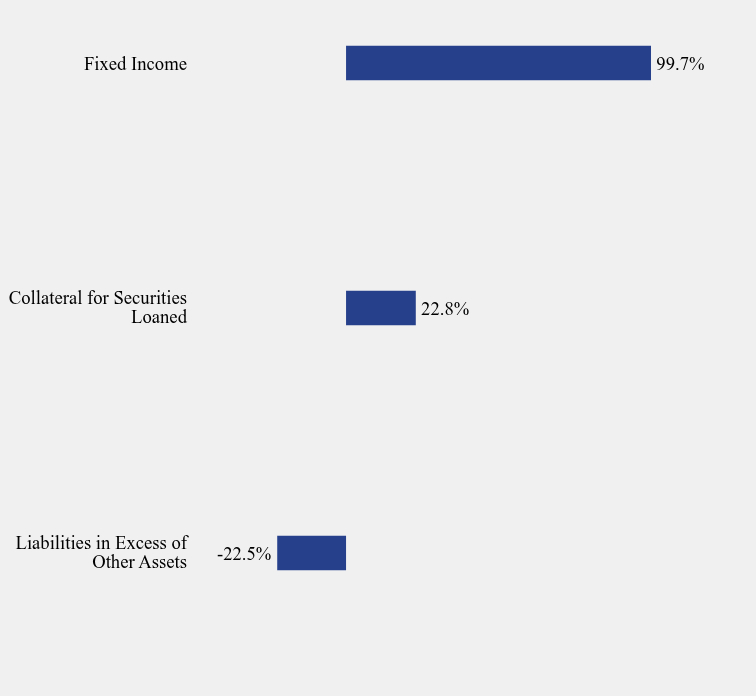
| Fund Name | Counterpoint High Yield Trend ETF | |||||
| Trading Symbol | HYTR | |||||
| Security Exchange Name | NYSE | |||||
| Annual or Semi-Annual Statement [Text Block] | This semi-annual shareholder report contains important information about Counterpoint High Yield Trend ETF for the period of October 1, 2025 to March 31, 2026. | |||||
| Additional Information [Text Block] | You can find additional information about the Fund at https://counterpointfunds.com/resources/. You can also request this information by contacting us at 1-844-509-2775. | |||||
| Additional Information Phone Number | 1-844-509-2775 | |||||
| Additional Information Website | https://counterpointfunds.com/resources/ | |||||
| Expenses [Text Block] | ||||||
| Expenses Paid, Amount | $ 30 | |||||
| Expense Ratio, Percent | 0.60% | [2] | ||||
| AssetsNet | $ 253,853,611 | |||||
| Holdings Count | Holding | 4 | |||||
| Advisory Fees Paid, Amount | $ 530,353 | |||||
| InvestmentCompanyPortfolioTurnover | 175.00% | |||||
| Additional Fund Statistics [Text Block] | ||||||
| Holdings [Text Block] | ||||||
| Material Fund Change [Text Block] | ||||||
| ||||||