Shareholder Report
Mar. 31, 2026
USD ($)
$ / shares
WHAT WERE THE FUND COSTS FOR THE LAST YEAR? (based on a hypothetical $10,000 investment)
|
Fund Name
|
Costs of a $10,000 investment
|
Costs paid as a percentage of a $10,000 investment
|
|
Royce Quant Small-Cap Quality Value ETF
|
$65
|
0.60%
|
HOW DID THE FUND PERFORM LAST YEAR AND WHAT AFFECTED ITS PERFORMANCE?
For the twelve months ended March 31, 2026, Royce Quant Small-Cap Quality Value ETF returned 18.14%. The Fund compares its performance to the Russell 2000 Index, which returned 25.72% for the same period.
PERFORMANCE HIGHLIGHTS
|
Top contributors to performance:
|
|
|
↑
|
Stock selection in the financials and consumer discretionary sectors, as well as an underweight in real estate, contributed most to relative performance.
|
|
↑
|
At the industry level, software (information technology (IT)), insurance (financials), and construction & engineering (industrials) contributed most to relative performance.
|
|
↑
|
At the position level, Argan (industrials), Bel Fuse (IT), and Monte Rosa Therapeutics (health care) contributed most to relative performance.
|
|
Top detractors from performance:
|
|
|
↓
|
Stock selection in the health care, industrials, and communication services sectors detracted most from relative performance.
|
|
↓
|
At the industry level, biotechnology (health care), pharmaceuticals (health care), and metals & mining (materials) detracted most from relative performance.
|
|
↓
|
At the position level, Organon (health care), Accendra Health (health care), and Torrid Holdings (consumer discretionary) detracted most from relative performance.
|
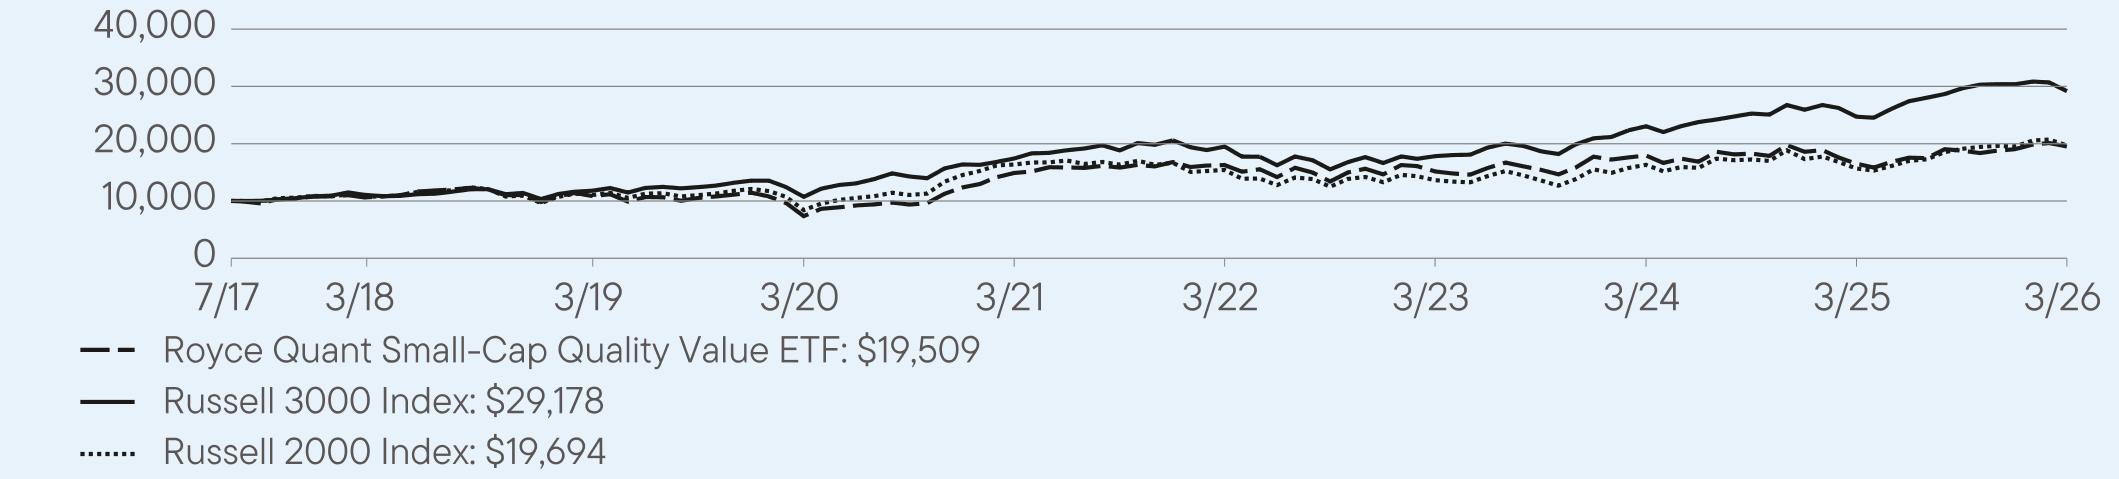
AVERAGE ANNUAL TOTAL RETURNS (%) Period Ended March 31, 2026
|
|
1 Year
|
5 Year
|
Since Inception
(7/12/2017) |
|
Royce Quant Small-Cap Quality Value ETF (NAV)
|
18.14
|
5.54
|
7.96
|
|
Russell 3000 Index
|
18.09
|
10.87
|
13.20
|
|
Russell 2000 Index
|
25.72
|
3.77
|
8.09
|
For current month-end performance, please call Franklin Templeton at (800) DIAL BEN/342-5236 or visit
https://www.franklintempleton.com/investments/options/exchange-traded-funds.
https://www.franklintempleton.com/investments/options/exchange-traded-funds.
Important data provider notices and terms available at www.franklintempletondatasources.com.
KEY FUND STATISTICS (as of March 31, 2026)
|
Total Net Assets
|
$24,255,736
|
|
Total Number of Portfolio Holdings
|
311
|
|
Total Management Fee Paid (based on a unitary fee)
|
$150,234
|
|
Portfolio Turnover Rate
|
57%
|
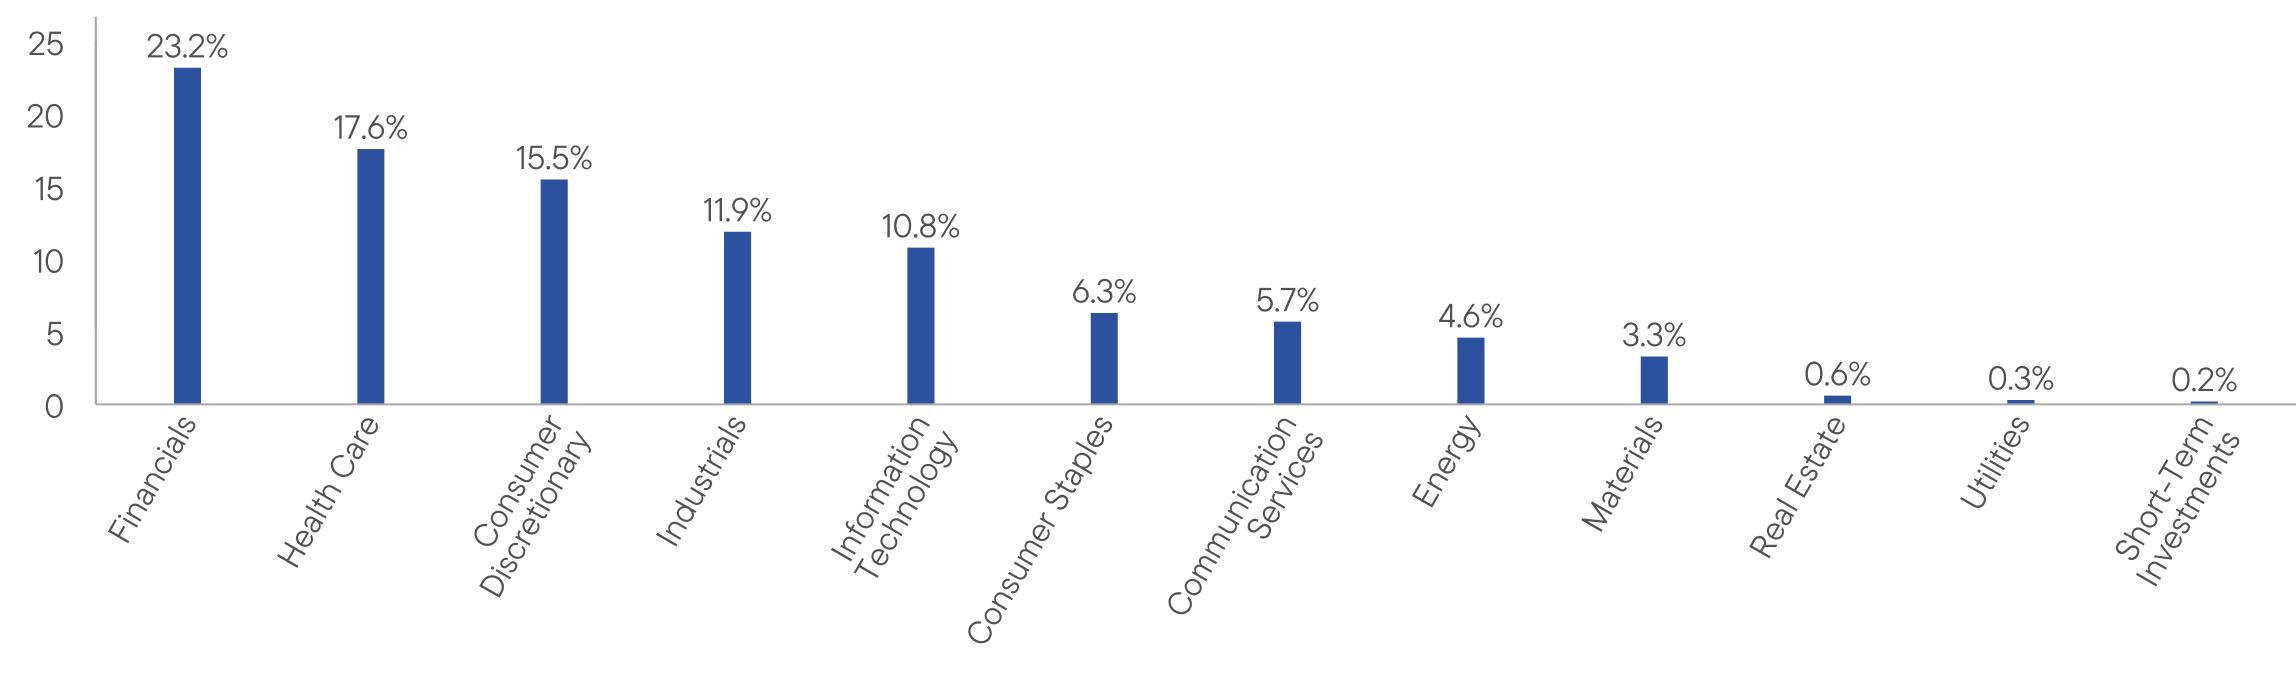
WHAT DID THE FUND INVEST IN? (as of March 31, 2026)
Portfolio Composition* (% of Total Investments)
| [1] |
|