Pay vs Performance Disclosure - USD ($)
Dec. 31, 2025
Dec. 31, 2024
Dec. 31, 2023
Dec. 31, 2022
Dec. 31, 2021
| Value of Initial Fixed $100 Investment Based on: | ||||||||||||||||||||||||||
| Year | Summary Compensation Table (SCT) Total for CEO(1) | Compensation Actually Paid to CEO(2) | Average SCT Total for Non-CEO NEOs | Average Compensation Actually Paid to Non-CEO NEOs(2) | Total Shareholder Return(3) | Peer Group Total Shareholder Return(3)(4) | Net Loss(5) (in thousands) | Adjusted EBITDA(6) (in thousands) | ||||||||||||||||||
| 2025 | $ | 3,991,159 | $ | 268,056 | $ | 1,987,692 | $ | 748,250 | $ | 5 | $ | 99 | $ | (177,974) | $ | 41,408 | ||||||||||
| 2024 | 5,494,141 | 4,170,561 | 1,446,203 | 930,823 | 20 | 105 | (69,502) | 26,105 | ||||||||||||||||||
| 2023 | — | (59,146) | 1,222,403 | 735,127 | 27 | 106 | (118,147) | 11,021 | ||||||||||||||||||
| 2022 | 4,435,013 | (8,154,225) | 3,189,684 | (766,685) | 31 | 100 | (137,403) | (2,487) | ||||||||||||||||||
| 2021 | 5,961,043 | 5,615,764 | 3,297,583 | 2,846,251 | 114 | 125 | (153,210) | (11,248) | ||||||||||||||||||
For purposes of the tables below, our CEO and non-CEO named executive officers for 2021, 2022, 2023, 2024 and 2025 are the following:
| Year | CEO | Non-CEO Named Executive Officers | ||||||
| 2025 | Daniel Burton | Jason Alger, Benjamin Albert, Kevin Freeman, Benjamin Landry, Dan LeSueur | ||||||
| 2024 | Daniel Burton | Jason Alger, Kevin Freeman, Benjamin Landry, Linda Llewelyn, and Bryan Hunt | ||||||
| 2023 | Daniel Burton | Bryan Hunt, Jason Alger, Benjamin Landry, Linda Llewelyn, and Daniel Orenstein | ||||||
| 2022 | Daniel Burton | Bryan Hunt, Kevin Freeman, Paul Horstmeier, Daniel Orenstein, and Patrick Nelli | ||||||
| 2021 | Daniel Burton | Bryan Hunt, Patrick Nelli, Paul Horstmeier, and Daniel Orenstein | ||||||
As permitted by SEC rules, the peer group referenced for purposes of “Peer Group Total Shareholder Return” is that of the Nasdaq Health Care Index, which is the industry index reported in our annual report on Form 10-K for 2025 in accordance with Regulation S-K Item 201(e).
| 2025 | |||||||||||||||||
| CEO | Avg. Non-CEO NEOs | ||||||||||||||||
| Summary Compensation Table Total | $ | 3,991,159 | $ | 1,987,692 | |||||||||||||
| - | Grant date fair value of awards granted in fiscal year | (3,444,040) | (1,486,432) | ||||||||||||||
| + | Year-end fair value of outstanding and unvested awards granted in fiscal year | 997,277 | 550,127 | ||||||||||||||
| + | Change in fair value of outstanding and unvested awards granted in prior fiscal years | (978,916) | (214,060) | ||||||||||||||
| + | Change in fair value as of vesting date of awards granted in prior years that vested in fiscal year | (584,545) | (152,777) | ||||||||||||||
| + | Fair value as of vesting date of awards granted and vested in fiscal year | 287,121 | 109,319 | ||||||||||||||
| - | Fair value as of prior fiscal year-end of awards granted in prior years that were forfeited in fiscal year | — | (45,619) | ||||||||||||||
| Compensation Actually Paid | $ | 268,056 | $ | 748,250 | |||||||||||||
The table above reconciles Summary Compensation Table pay to Compensation Actually Paid in accordance with the required methodology from Item 402(v) of Regulation S-K, meaning that outstanding awards have been valued prior to vesting based on fair values. The change in fair values of RSUs across measurement dates is attributable to the change in stock prices. The change in the fair values of stock options is measured using a Black-Scholes model and is driven by changes in stock price and the expected life of the stock options as well as the prevailing stock price volatility, risk-free rate, and dividend yield at the measurement date.
The change in the fair values of the PRSUs reflects our projected payout factors relative to the performance metric and stock price as at fiscal year-end.
Description of Relationships Between Information Presented
In accordance with Item 402(v) of Regulation S-K, we are providing the following descriptions of the relationships between information presented in the Pay versus Performance table.
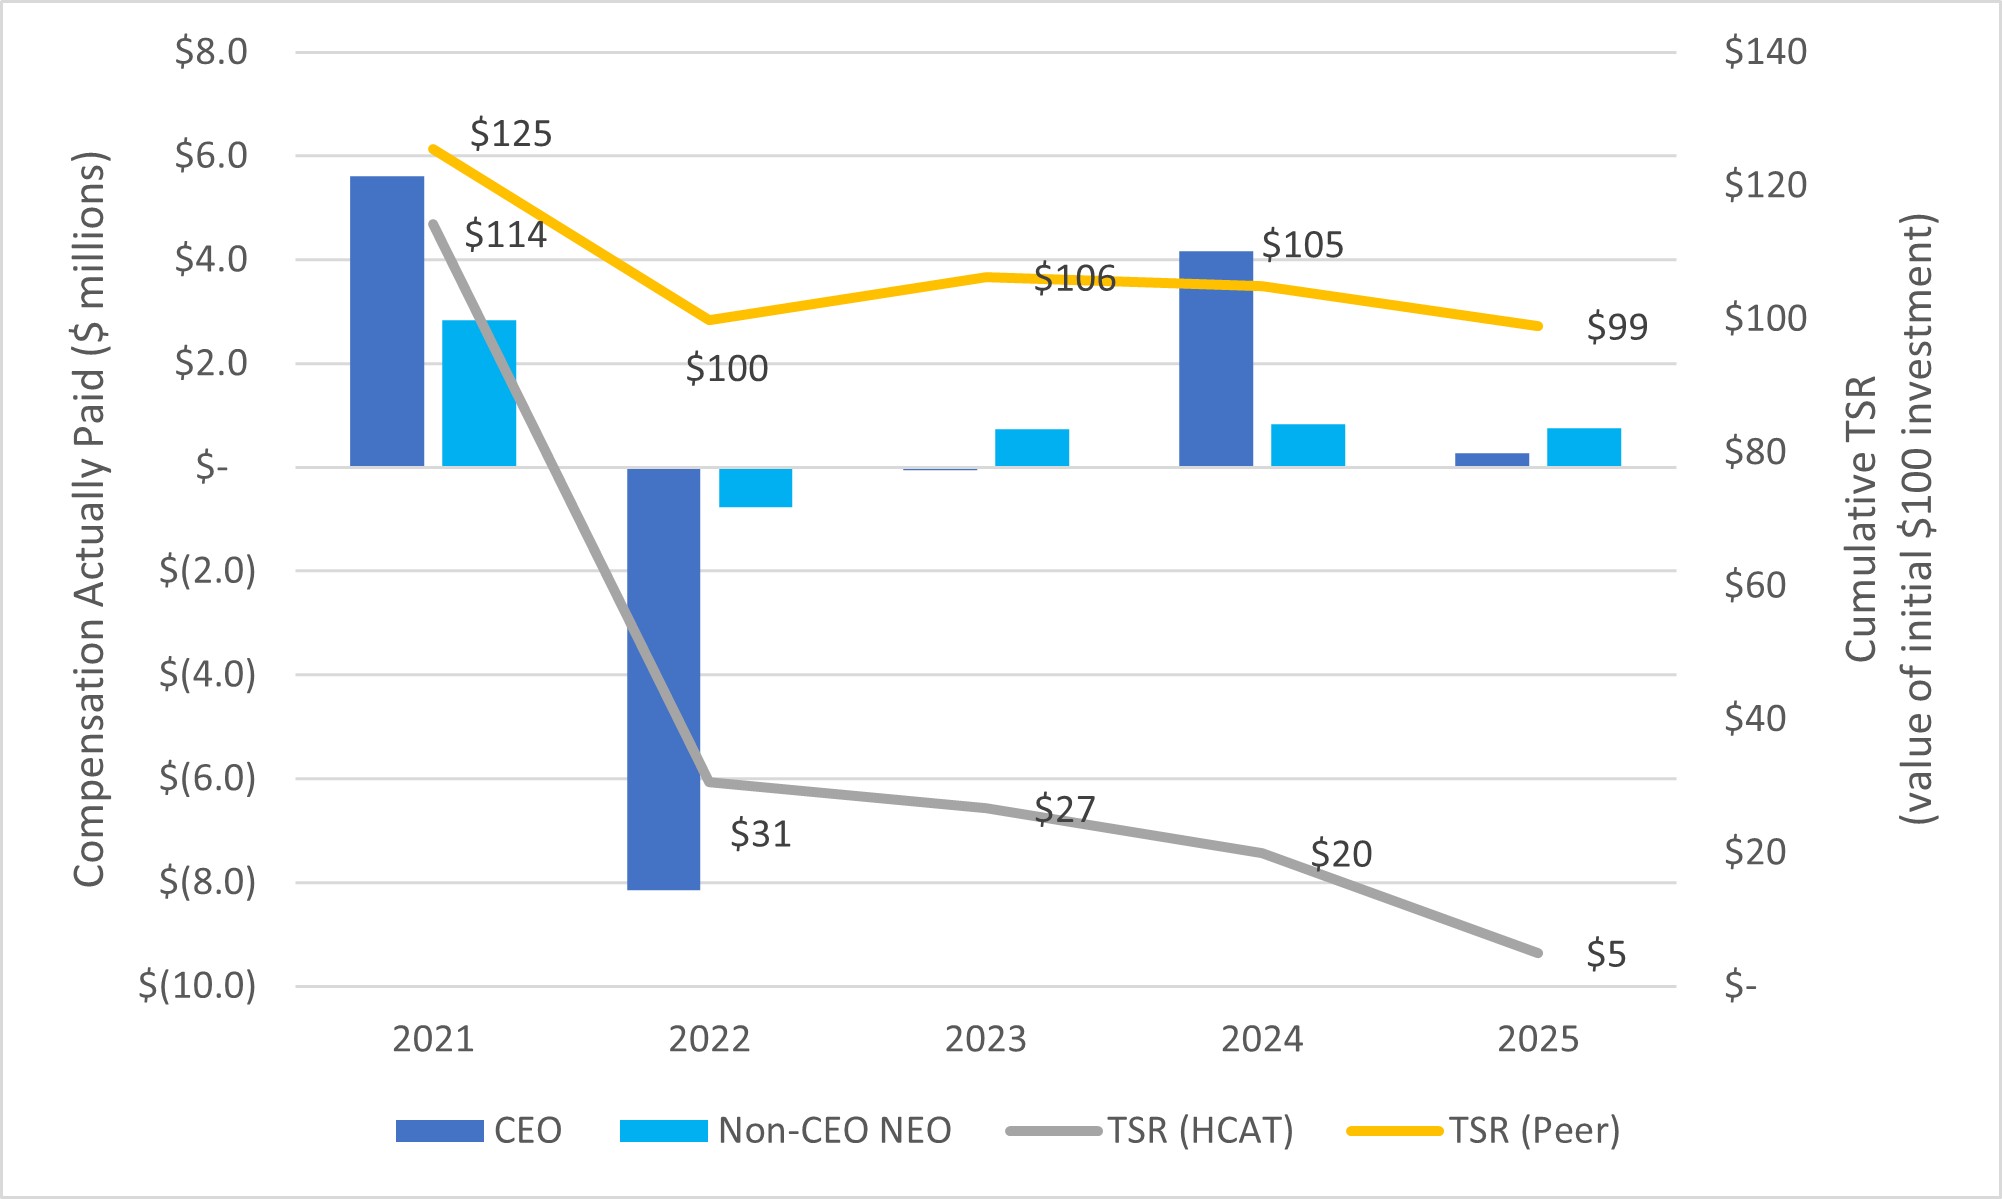
| Compensation Actually Paid and Cumulative TSR | ||
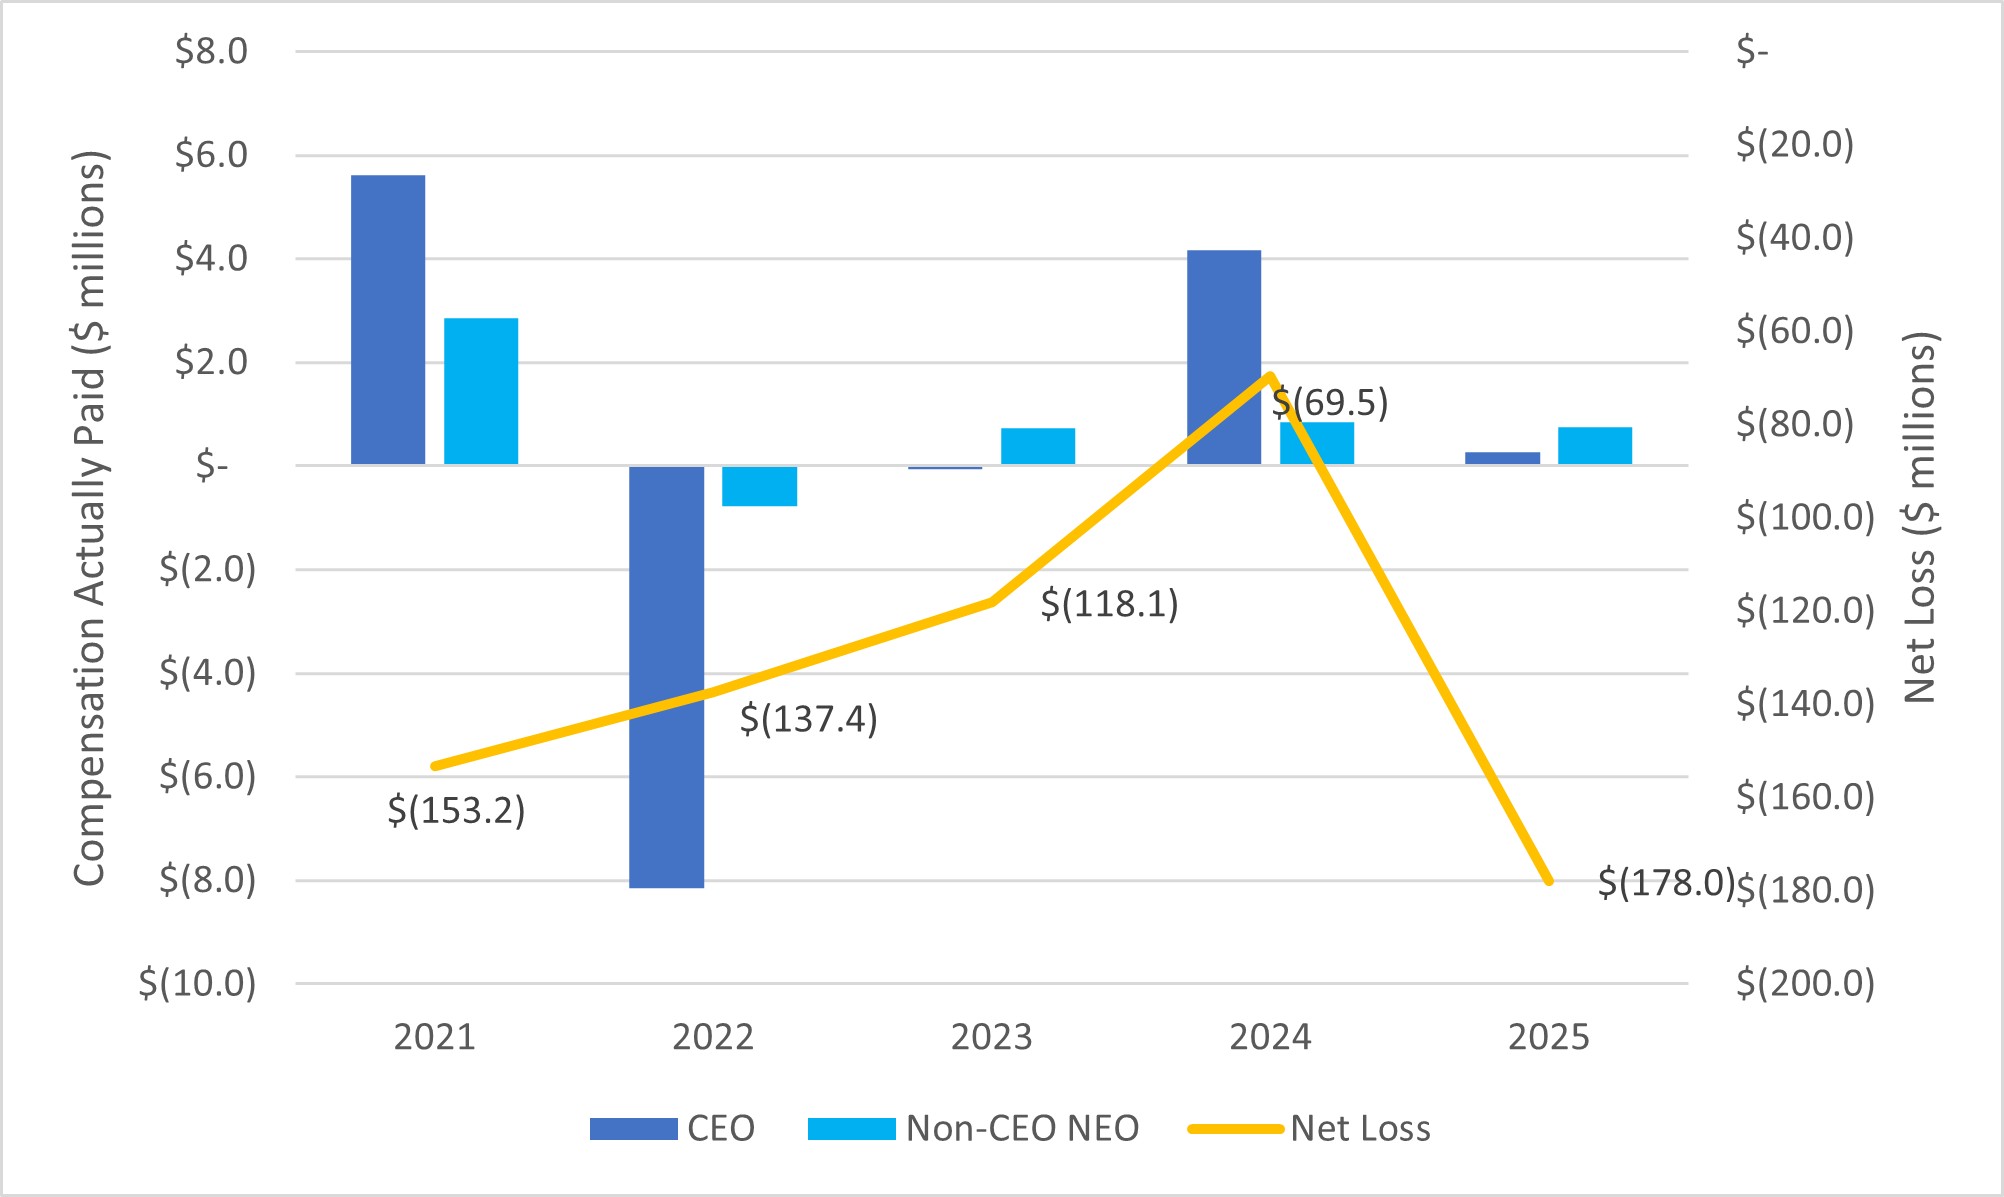
| Compensation Actually Paid and Net Loss | ||
| Compensation Actually Paid and Adjusted EBITDA | ||
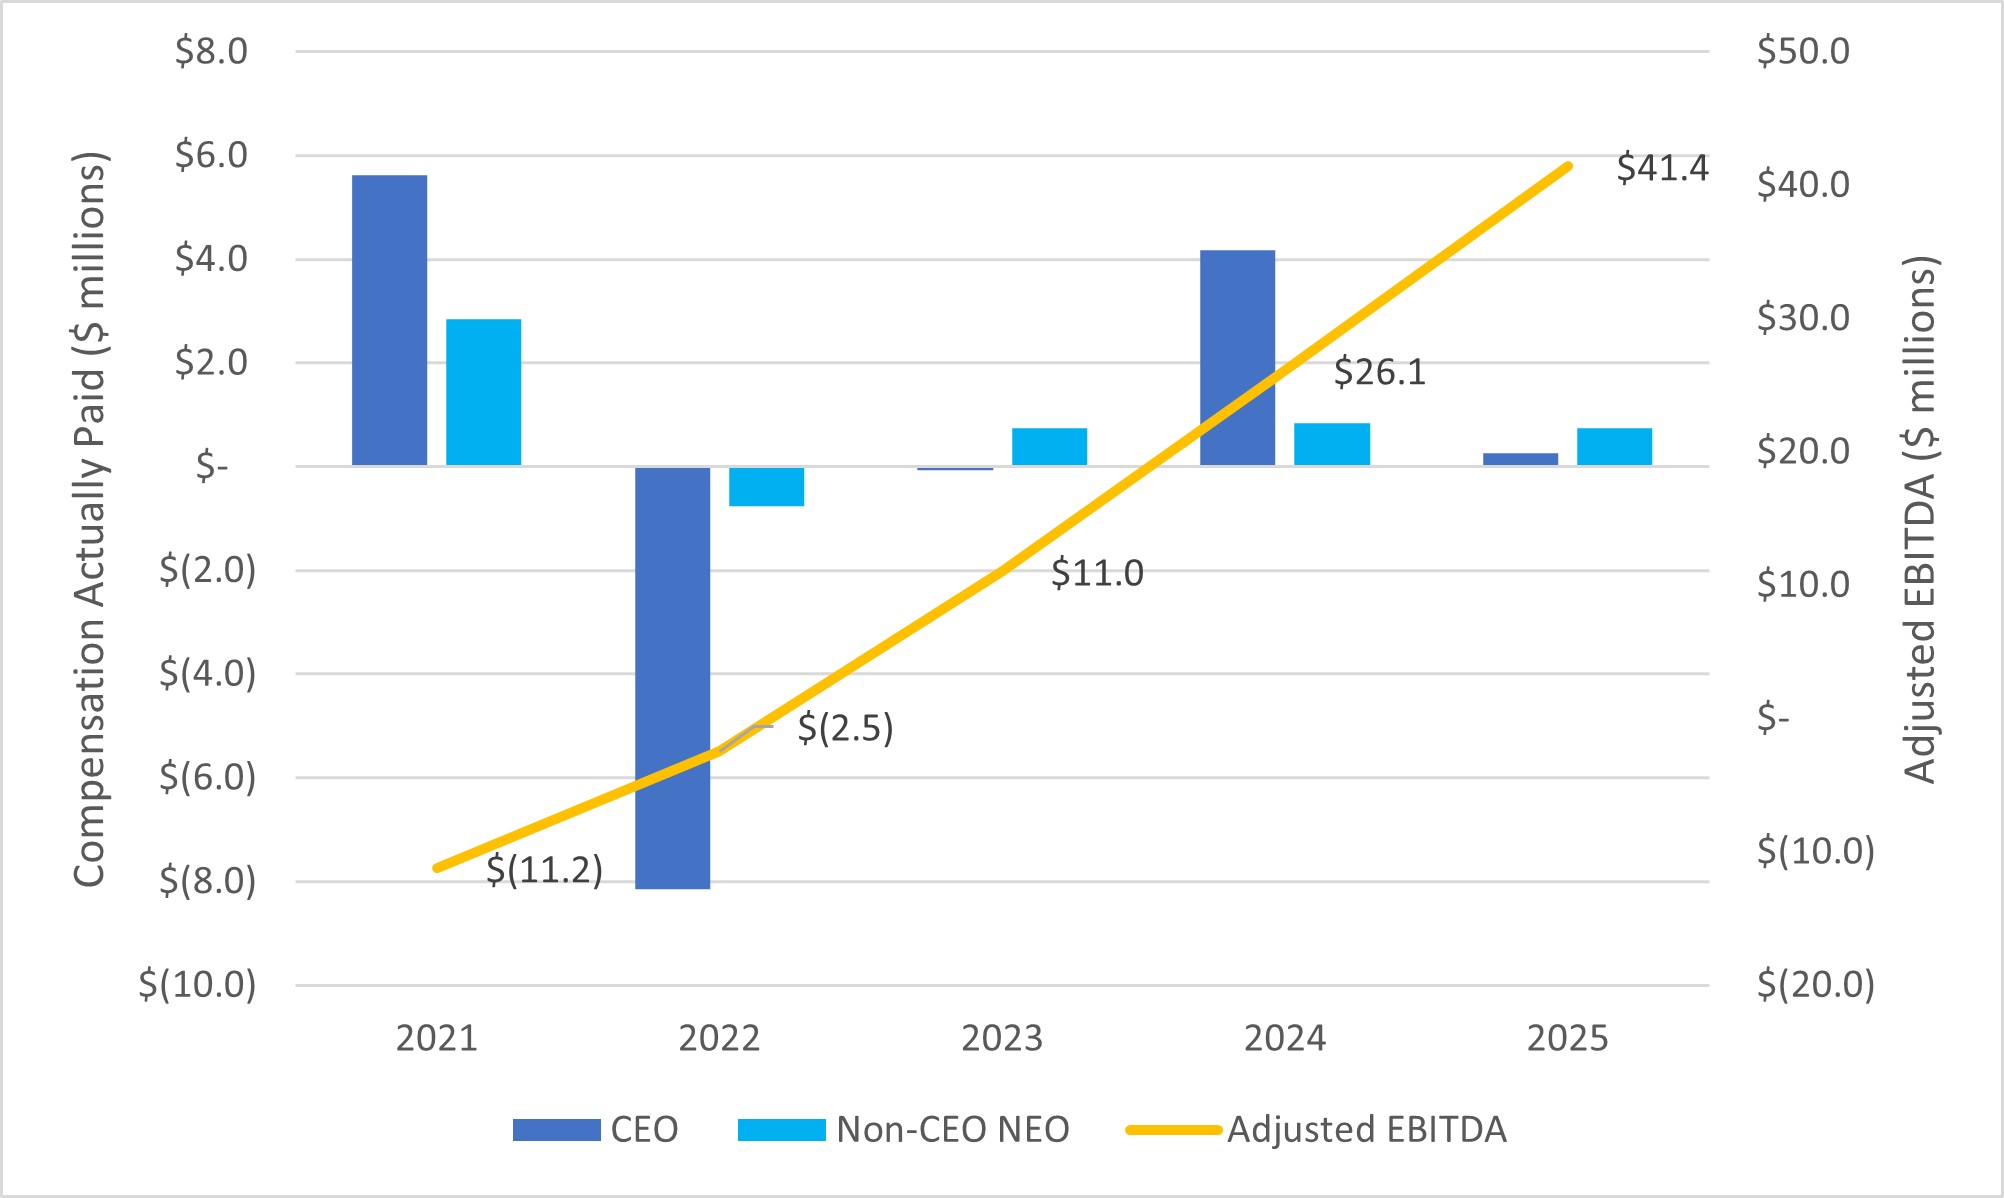
Adjusted EBITDA is an important financial performance measure that we use in the compensation program design for our named executive officers, including the main metric used in determining the fiscal year 2023 and 2024 cash bonus and a key performance target for 2025 annual bonus PRSUs. During the earlier fiscal years presented in the Pay versus Performance Table there is minimal correlation between compensation actually paid to named executive officers and our Adjusted EBITDA performance primarily due to a significantly larger portion of the target named executive officer pay opportunity being tied to our stock performance, however, there is a stronger correlation for fiscal 2023, 2024, and 2025 compared to fiscal 2021 and 2022. Looking ahead to fiscal year 2026, we expect more alignment between Adjusted EBITDA performance and the compensation actually paid to named executive officers.
Adjusted EBITDA is a non-GAAP financial measure. For an explanation of our management’s use of Adjusted EBITDA and a reconciliation of net loss, the most directly comparable financial measure calculated in accordance with GAAP, to Adjusted EBITDA, please see Appendix A to this Proxy Statement.
Description of Relationships Between Information Presented
In accordance with Item 402(v) of Regulation S-K, we are providing the following descriptions of the relationships between information presented in the Pay versus Performance table.
| Compensation Actually Paid and Cumulative TSR | ||
| • | Adjusted EBITDA | ||||
| • | GAAP Revenue | ||||
| • | Dollar-based Retention Rate (legacy) | ||||
| • | Net New / Total Platform Clients (legacy) | ||||
Adjusted EBITDA is the financial measure from the tabular list of most important performance measures below, which represents the most important measure used to link compensation actually paid to our named executive officers in fiscal 2025 to the Company’s performance. Adjusted EBITDA is a non-GAAP financial measure. For an explanation of our management’s use of Adjusted EBITDA and a reconciliation of net loss, the most directly comparable financial measure calculated in accordance with GAAP, to Adjusted EBITDA, please see Appendix A to this Proxy Statement.