Shareholder Report
|
12 Months Ended |
|
Mar. 31, 2026
USD ($)
Holding
|
|---|
| Shareholder Report [Line Items] |
|
| Document Type |
N-CSR
|
| Amendment Flag |
false
|
| Registrant Name |
WILLIAMSBURG INVESTMENT TRUST
|
| Entity Central Index Key |
0000842512
|
| Entity Investment Company Type |
N-1A
|
| Document Period End Date |
Mar. 31, 2026
|
| Shareholder Report Annual or Semi-Annual |
Annual Shareholder Report
|
| C000004223 |
|
| Shareholder Report [Line Items] |
|
| Fund Name |
The Jamestown Equity Fund
|
| Trading Symbol |
JAMEX
|
| Annual or Semi-Annual Statement [Text Block] |
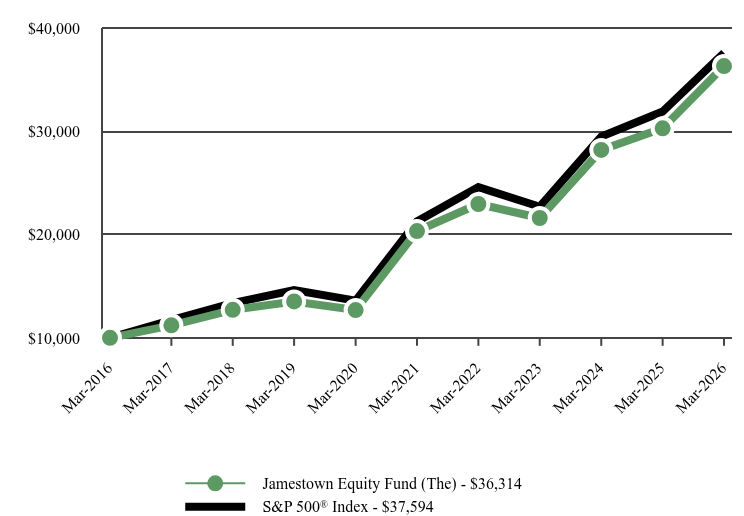
This annual shareholder report contains important information about The Jamestown Equity Fund (the "Fund") for the period of April 1, 2025 to March 31, 2026.
|
| Additional Information [Text Block] |
You can find additional information about the Fund at https://funddocs.filepoint.com/jamestown/. You can also request this information by contacting us at (866) 738-1126.
|
| Additional Information Phone Number |
(866) 738-1126
|
| Additional Information Website |
<span style="font-weight: 700; box-sizing: border-box; color: rgb(0, 0, 0); display: inline; flex-wrap: nowrap; font-size: 12px; grid-area: auto; line-height: 18px; margin: 0px; overflow: visible; text-align: left; text-align-last: left; white-space-collapse: preserve-breaks;">https://funddocs.filepoint.com/jamestown/</span>
|
| Expenses [Text Block] |
What were the Fund’s annualized costs for the last year?(based on a hypothetical $10,000 investment) Table SummaryFund Name | Costs of a $10,000 investment | Costs paid as a percentage of a $10,000 investment |
|---|
Jamestown Equity Fund (The) | $104 | 0.95% |
|---|
|
| Expenses Paid, Amount |
$ 104
|
| Expense Ratio, Percent |
0.95%
|
| Performance Past Does Not Indicate Future [Text] |
The Fund’s past performance is not a good predictor of how the Fund will perform in the future.
|
| Line Graph [Table Text Block] |
Table Summary | Jamestown Equity Fund (The) | S&P 500® Index |
|---|
Mar-2016 | $10,000 | $10,000 |
|---|
Mar-2017 | $11,214 | $11,717 |
|---|
Mar-2018 | $12,711 | $13,357 |
|---|
Mar-2019 | $13,525 | $14,625 |
|---|
Mar-2020 | $12,691 | $13,605 |
|---|
Mar-2021 | $20,335 | $21,271 |
|---|
Mar-2022 | $22,960 | $24,599 |
|---|
Mar-2023 | $21,607 | $22,698 |
|---|
Mar-2024 | $28,193 | $29,480 |
|---|
Mar-2025 | $30,284 | $31,913 |
|---|
Mar-2026 | $36,314 | $37,594 |
|---|
|
| Average Annual Return [Table Text Block] |
Average Annual Total Returns Table Summary | 1 Year | 5 Years | 10 Years |
|---|
Jamestown Equity Fund (The) | 19.91% | 12.30% | 13.76% |
|---|
S&P 500® Index | 17.80% | 12.06% | 14.16% |
|---|
The Fund’s past performance is not a good predictor of how the Fund will perform in the future. The graph and table do not reflect the deduction of taxes that a shareholder would pay on fund distributions or redemption of fund shares. For updated performance call (866) 738-1126. |
| No Deduction of Taxes [Text Block] |
The graph and table do not reflect the deduction of taxes that a shareholder would pay on fund distributions or redemption of fund shares.
|
| AssetsNet |
$ 62,756,704
|
| Holdings Count | Holding |
48
|
| Advisory Fees Paid, Amount |
$ 407,141
|
| InvestmentCompanyPortfolioTurnover |
7.00%
|
| Additional Fund Statistics [Text Block] |
- Net Assets$62,756,704
- Number of Portfolio Holdings48
- Advisory Fee $407,141
- Portfolio Turnover7%
|
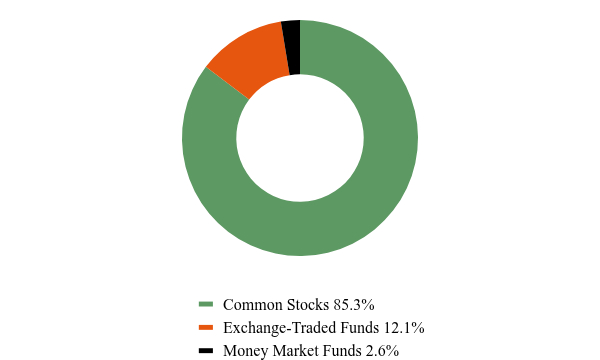
| Holdings [Text Block] |
Asset Weighting (% of total investments)Table SummaryValue | Value |
|---|
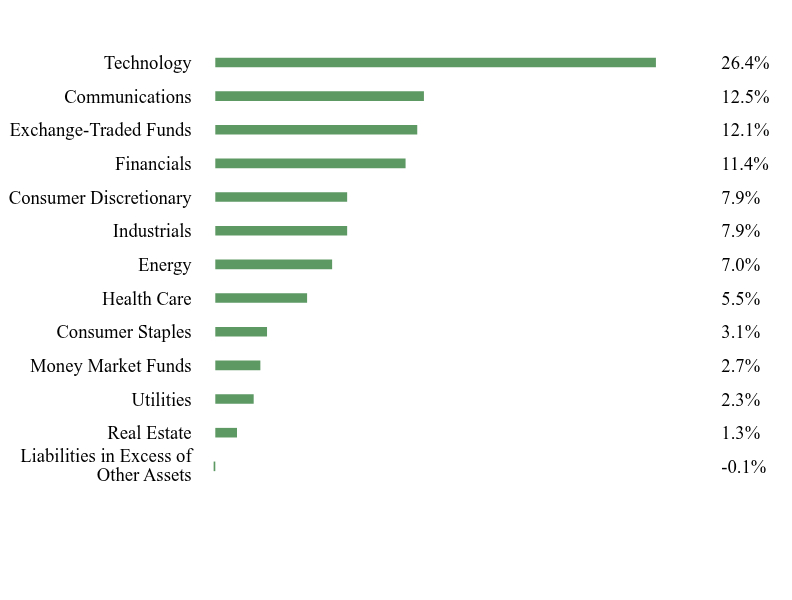
Common Stocks | 85.3% | Exchange-Traded Funds | 12.1% | Money Market Funds | 2.6% | Sector Weighting (% of net assets)Table SummaryValue | Value |
|---|
Liabilities in Excess of Other Assets | -0.1% | Real Estate | 1.3% | Utilities | 2.3% | Money Market Funds | 2.7% | Consumer Staples | 3.1% | Health Care | 5.5% | Energy | 7.0% | Industrials | 7.9% | Consumer Discretionary | 7.9% | Financials | 11.4% | Exchange-Traded Funds | 12.1% | Communications | 12.5% | Technology | 26.4% | Top 10 Holdings (% of net assets)Table SummaryHolding Name | % of Net Assets |
|---|
Alphabet, Inc. - Class C | 7.0% |
|---|
NVIDIA Corporation | 6.2% |
|---|
Microsoft Corporation | 5.0% |
|---|
Apple, Inc. | 4.8% |
|---|
Amazon.com, Inc. | 4.0% |
|---|
Meta Platforms, Inc. - Class A | 3.8% |
|---|
Vanguard Information Technology ETF | 3.7% |
|---|
JPMorgan Chase & Company | 3.3% |
|---|
Broadcom, Inc. | 3.2% |
|---|
State Street Health Care Select Sector SPDR ETF | 2.9% |
|---|
|
| Material Fund Change [Text Block] |
No material changes occurred during the year ended March 31, 2026. |
| C000004216 |
|
| Shareholder Report [Line Items] |
|
| Fund Name |
The Government Street Equity Fund
|
| Trading Symbol |
GVEQX
|
| Annual or Semi-Annual Statement [Text Block] |
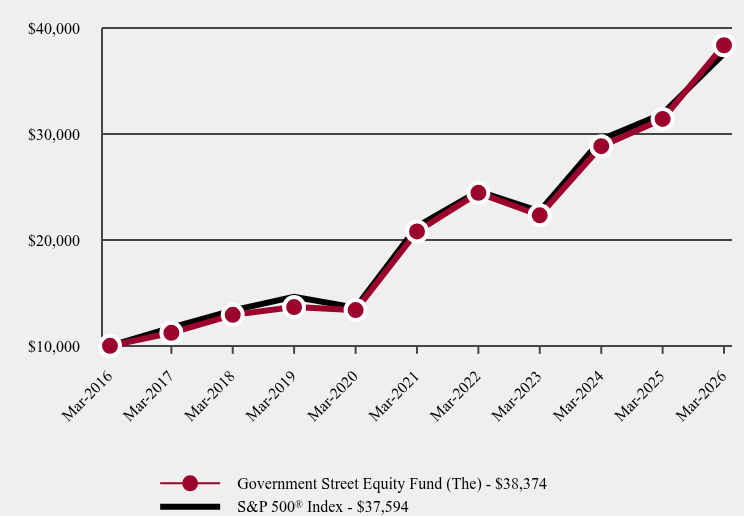
This annual shareholder report contains important information about The Government Street Equity Fund (the "Fund") for the period of April 1, 2025 to March 31, 2026.
|
| Additional Information [Text Block] |
You can find additional information about the Fund at https://funddocs.filepoint.com/govstreet/. You can also request this information by contacting us at (866) 738-1125.
|
| Additional Information Phone Number |
(866) 738-1125
|
| Additional Information Website |
<span style="font-weight: 700; box-sizing: border-box; color: rgb(0, 0, 0); display: inline; flex-wrap: nowrap; font-size: 12px; grid-area: auto; line-height: 18px; margin: 0px; overflow: visible; text-align: left; text-align-last: left; white-space-collapse: preserve-breaks;">https://funddocs.filepoint.com/govstreet/</span>
|
| Expenses [Text Block] |
What were the Fund’s annualized costs for the last year?(based on a hypothetical $10,000 investment) Table SummaryFund Name | Costs of a $10,000 investment | Costs paid as a percentage of a $10,000 investment |
|---|
Government Street Equity Fund (The) | $94 | 0.85% |
|---|
|
| Expenses Paid, Amount |
$ 94
|
| Expense Ratio, Percent |
0.85%
|
| Performance Past Does Not Indicate Future [Text] |
The Fund’s past performance is not a good predictor of how the Fund will perform in the future.
|
| Line Graph [Table Text Block] |
Table Summary | Government Street Equity Fund (The) | S&P 500® Index |
|---|
Mar-2016 | $10,000 | $10,000 |
|---|
Mar-2017 | $11,232 | $11,717 |
|---|
Mar-2018 | $12,926 | $13,357 |
|---|
Mar-2019 | $13,657 | $14,625 |
|---|
Mar-2020 | $13,378 | $13,605 |
|---|
Mar-2021 | $20,797 | $21,271 |
|---|
Mar-2022 | $24,439 | $24,599 |
|---|
Mar-2023 | $22,317 | $22,698 |
|---|
Mar-2024 | $28,843 | $29,480 |
|---|
Mar-2025 | $31,417 | $31,913 |
|---|
Mar-2026 | $38,374 | $37,594 |
|---|
|
| Average Annual Return [Table Text Block] |
Average Annual Total Returns Table Summary | 1 Year | 5 Years | 10 Years |
|---|
Government Street Equity Fund (The) | 22.14% | 13.03% | 14.39% |
|---|
S&P 500® Index | 17.80% | 12.06% | 14.16% |
|---|
The Fund’s past performance is not a good predictor of how the Fund will perform in the future. The graph and table do not reflect the deduction of taxes that a shareholder would pay on fund distributions or redemption of fund shares. For
updated performance call (866) 738-1125. |
| No Deduction of Taxes [Text Block] |
The graph and table do not reflect the deduction of taxes that a shareholder would pay on fund distributions or redemption of fund shares.
|
| AssetsNet |
$ 100,967,079
|
| Holdings Count | Holding |
80
|
| Advisory Fees Paid, Amount |
$ 609,142
|
| InvestmentCompanyPortfolioTurnover |
19.00%
|
| Additional Fund Statistics [Text Block] |
- Net Assets$100,967,079
- Number of Portfolio Holdings80
- Advisory Fee $609,142
- Portfolio Turnover19%
|
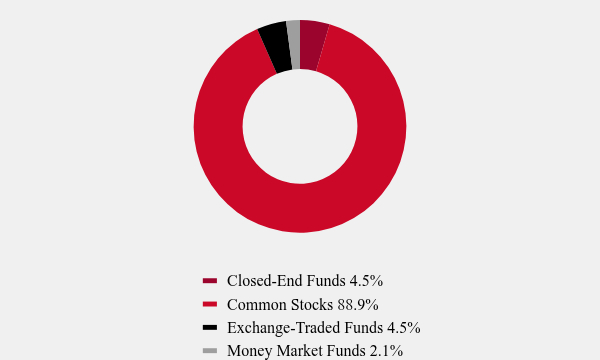
| Holdings [Text Block] |
Asset Weighting (% of total investments)Table SummaryValue | Value |
|---|
Closed-End Funds | 4.5% | Common Stocks | 88.9% | Exchange-Traded Funds | 4.5% | Money Market Funds | 2.1% | Sector Weighting (% of net assets)Table SummaryValue | Value |
|---|
Liabilities in Excess of Other Assets | -0.1% | Real Estate | 1.2% | Utilities | 1.6% | Money Market Funds | 2.1% | Materials | 2.8% | Energy | 4.0% | Consumer Staples | 4.3% | Commodity | 4.5% | Exchange-Traded Funds | 4.6% | Health Care | 6.3% | Consumer Discretionary | 6.6% | Communications | 7.9% | Financials | 12.1% | Industrials | 15.5% | Technology | 26.6% | Top 10 Holdings (% of net assets)Table SummaryHolding Name | % of Net Assets |
|---|
NVIDIA Corporation | 14.7% |
|---|
Alphabet, Inc. - Classes A & C | 5.0% |
|---|
JPMorgan Chase & Company | 4.7% |
|---|
Walmart, Inc. | 3.4% |
|---|
Sprott Physical Gold Trust | 2.7% |
|---|
RTX Corporation | 2.7% |
|---|
Microsoft Corporation | 2.6% |
|---|
AbbVie, Inc. | 2.5% |
|---|
Amazon.com, Inc. | 2.5% |
|---|
Quanta Services, Inc. | 2.2% |
|---|
|
| Material Fund Change [Text Block] |
No material changes occurred during the year ended March 31, 2026. |
| C000004221 |
|
| Shareholder Report [Line Items] |
|
| Fund Name |
The Government Street Opportunities Fund
|
| Trading Symbol |
GVMCX
|
| Annual or Semi-Annual Statement [Text Block] |
This annual shareholder report contains important information about The Government Street Opportunities Fund (the "Fund") for the period of April 1, 2025 to March 31, 2026.
|
| Additional Information [Text Block] |
You can find additional information about the Fund at https://funddocs.filepoint.com/govstreet/. You can also request this information by contacting us at (866) 738-1125.
|
| Additional Information Phone Number |
(866) 738-1125
|
| Additional Information Website |
<span style="font-weight: 700; box-sizing: border-box; color: rgb(0, 0, 0); display: inline; flex-wrap: nowrap; font-size: 12px; grid-area: auto; line-height: 18px; margin: 0px; overflow: visible; text-align: left; text-align-last: left; white-space-collapse: preserve-breaks;">https://funddocs.filepoint.com/govstreet/</span>
|
| Expenses [Text Block] |
What were the Fund’s annualized costs for the last year?(based on a hypothetical $10,000 investment) Table SummaryFund Name | Costs of a $10,000 investment | Costs paid as a percentage of a $10,000 investment |
|---|
Government Street Opportunities Fund (The) | $112 | 1.03% |
|---|
|
| Expenses Paid, Amount |
$ 112
|
| Expense Ratio, Percent |
1.03%
|
| Performance Past Does Not Indicate Future [Text] |
The Fund’s past performance is not a good predictor of how the Fund will perform in the future.
|
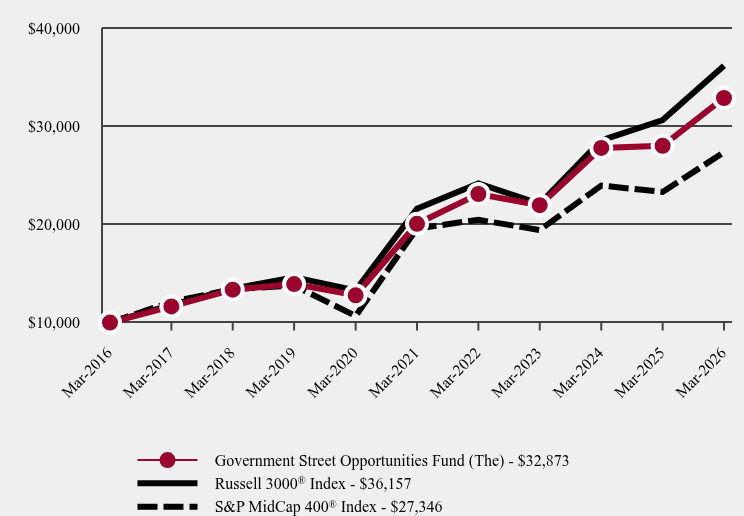
| Line Graph [Table Text Block] |
Table Summary | Government Street Opportunities Fund (The) | Russell 3000® Index | S&P MidCap 400® Index |
|---|
Mar-2016 | $10,000 | $10,000 | $10,000 |
|---|
Mar-2017 | $11,644 | $11,807 | $12,092 |
|---|
Mar-2018 | $13,351 | $13,438 | $13,419 |
|---|
Mar-2019 | $13,913 | $14,616 | $13,767 |
|---|
Mar-2020 | $12,775 | $13,282 | $10,668 |
|---|
Mar-2021 | $20,057 | $21,587 | $19,571 |
|---|
Mar-2022 | $23,089 | $24,161 | $20,469 |
|---|
Mar-2023 | $21,955 | $22,088 | $19,420 |
|---|
Mar-2024 | $27,784 | $28,558 | $23,951 |
|---|
Mar-2025 | $28,007 | $30,620 | $23,303 |
|---|
Mar-2026 | $32,873 | $36,157 | $27,346 |
|---|
|
| Average Annual Return [Table Text Block] |
Average Annual Total Returns Table Summary | 1 Year | 5 Years | 10 Years |
|---|
Government Street Opportunities Fund (The) | 17.37% | 10.39% | 12.64% |
|---|
Russell 3000® Index | 18.09% | 10.87% | 13.72% |
|---|
S&P MidCap 400® Index | 17.35% | 6.92% | 10.58% |
|---|
The Fund’s past performance is not a good predictor of how the Fund will perform in the future. The graph and table do not reflect the deduction of taxes that a shareholder would pay on fund distributions or redemption of fund shares. For updated performance call (866) 738-1125. |
| No Deduction of Taxes [Text Block] |
The graph and table do not reflect the deduction of taxes that a shareholder would pay on fund distributions or redemption of fund shares.
|
| AssetsNet |
$ 83,731,987
|
| Holdings Count | Holding |
88
|
| Advisory Fees Paid, Amount |
$ 605,250
|
| InvestmentCompanyPortfolioTurnover |
20.00%
|
| Additional Fund Statistics [Text Block] |
- Net Assets$83,731,987
- Number of Portfolio Holdings88
- Advisory Fee $605,250
- Portfolio Turnover20%
|
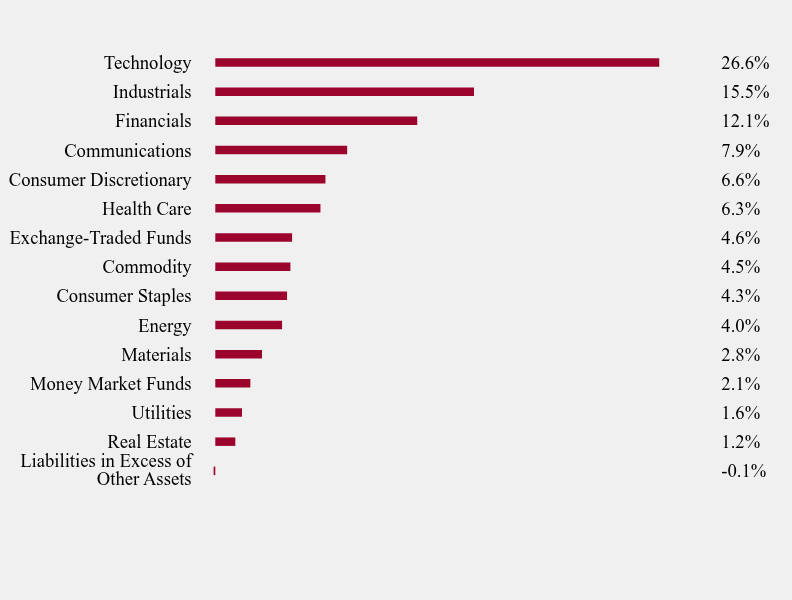
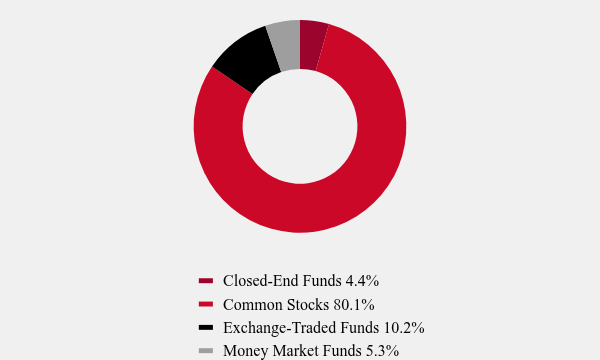
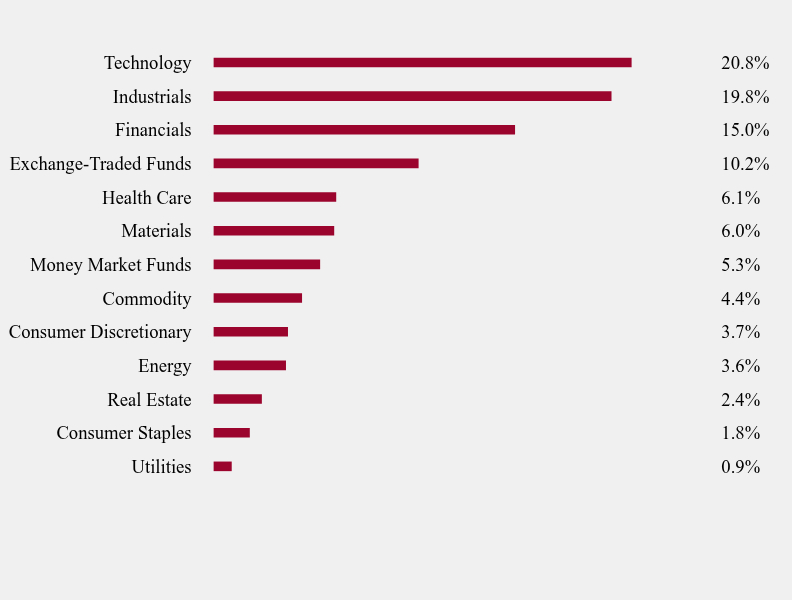
| Holdings [Text Block] |
Asset Weighting (% of total investments)Table SummaryValue | Value |
|---|
Closed-End Funds | 4.4% | Common Stocks | 80.1% | Exchange-Traded Funds | 10.2% | Money Market Funds | 5.3% | Sector Weighting (% of net assets)Table SummaryValue | Value |
|---|
Utilities | 0.9% | Consumer Staples | 1.8% | Real Estate | 2.4% | Energy | 3.6% | Consumer Discretionary | 3.7% | Commodity | 4.4% | Money Market Funds | 5.3% | Materials | 6.0% | Health Care | 6.1% | Exchange-Traded Funds | 10.2% | Financials | 15.0% | Industrials | 19.8% | Technology | 20.8% | Top 10 Holdings (% of net assets)Table SummaryHolding Name | % of Net Assets |
|---|
NVIDIA Corporation | 9.9% |
|---|
iShares Core S&P Mid-Cap ETF | 4.0% |
|---|
State Street SPDR S&P MidCap 400® ETF Trust | 3.8% |
|---|
Lam Research Corporation | 3.0% |
|---|
Sprott Physical Gold Trust | 2.8% |
|---|
Argan, Inc. | 2.4% |
|---|
Nasdaq, Inc. | 2.2% |
|---|
L3Harris Technologies, Inc. | 2.2% |
|---|
Woodward, Inc. | 2.1% |
|---|
CME Group, Inc. | 2.1% |
|---|
|
| Material Fund Change [Text Block] |
No material changes occurred during the year ended March 31, 2026. |
| C000004218 |
|
| Shareholder Report [Line Items] |
|
| Fund Name |
Davenport Core Leaders Fund
|
| Trading Symbol |
DAVPX
|
| Annual or Semi-Annual Statement [Text Block] |
This annual shareholder report contains important information about Davenport Core Leaders Fund (the "Fund") for the period of April 1, 2025 to March 31, 2026.
|
| Additional Information [Text Block] |
You can find additional information about the Fund at https://www.investdavenport.com/davenport-asset-management/documents-applications/. You can also request this information by contacting us at (800) 281-3217.
|
| Additional Information Phone Number |
(800) 281-3217
|
| Additional Information Website |
<span style="font-weight: 700; box-sizing: border-box; color: rgb(0, 0, 0); display: inline; flex-wrap: nowrap; font-size: 12px; grid-area: auto; line-height: 18px; margin: 0px; overflow: visible; text-align: left; text-align-last: left; white-space-collapse: preserve-breaks;">https://www.investdavenport.com/davenport-asset-management/documents-applications/</span>
|
| Expenses [Text Block] |
What were the Fund’s annualized costs for the last year?(based on a hypothetical $10,000 investment) Table SummaryFund Name | Costs of a $10,000 investment | Costs paid as a percentage of a $10,000 investment |
|---|
Davenport Core Leaders Fund | $88 | 0.85% |
|---|
|
| Expenses Paid, Amount |
$ 88
|
| Expense Ratio, Percent |
0.85%
|
| Performance Past Does Not Indicate Future [Text] |
The Fund’s past performance is not a good predictor of how the Fund will perform in the future.
|
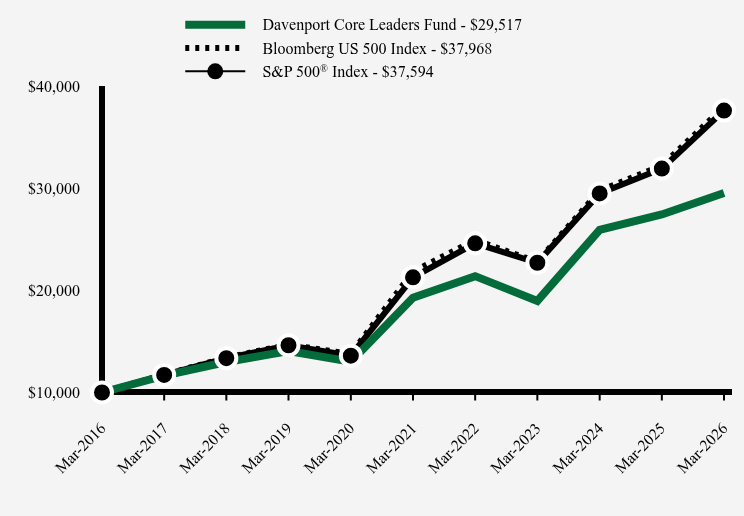
| Line Graph [Table Text Block] |
Table Summary | Davenport Core Leaders Fund | Bloomberg US 500 Index | S&P 500® Index |
|---|
Mar-2016 | $10,000 | $10,000 | $10,000 |
|---|
Mar-2017 | $11,656 | $11,745 | $11,717 |
|---|
Mar-2018 | $12,983 | $13,411 | $13,357 |
|---|
Mar-2019 | $14,048 | $14,696 | $14,625 |
|---|
Mar-2020 | $13,014 | $13,773 | $13,605 |
|---|
Mar-2021 | $19,286 | $21,829 | $21,271 |
|---|
Mar-2022 | $21,387 | $24,917 | $24,599 |
|---|
Mar-2023 | $18,956 | $22,792 | $22,698 |
|---|
Mar-2024 | $25,924 | $29,758 | $29,480 |
|---|
Mar-2025 | $27,429 | $32,218 | $31,913 |
|---|
Mar-2026 | $29,517 | $37,968 | $37,594 |
|---|
|
| Average Annual Return [Table Text Block] |
Average Annual Total Returns Table Summary | 1 Year | 5 Years | 10 Years |
|---|
Davenport Core Leaders Fund | 7.61% | 8.88% | 11.43% |
|---|
Bloomberg US 500 Index | 17.84% | 11.71% | 14.27% |
|---|
S&P 500® Index | 17.80% | 12.06% | 14.16% |
|---|
The Fund’s past performance is not a good predictor of how the Fund will perform in the future. The graph and table do not reflect the deduction of taxes that a shareholder would pay on fund distributions or redemption of fund shares. For updated performance call (800) 281-3217. |
| No Deduction of Taxes [Text Block] |
The graph and table do not reflect the deduction of taxes that a shareholder would pay on fund distributions or redemption of fund shares.
|
| AssetsNet |
$ 1,157,530,138
|
| Holdings Count | Holding |
40
|
| Advisory Fees Paid, Amount |
$ 8,988,261
|
| InvestmentCompanyPortfolioTurnover |
16.00%
|
| Additional Fund Statistics [Text Block] |
- Net Assets$1,157,530,138
- Number of Portfolio Holdings40
- Advisory Fee $8,988,261
- Portfolio Turnover16%
|
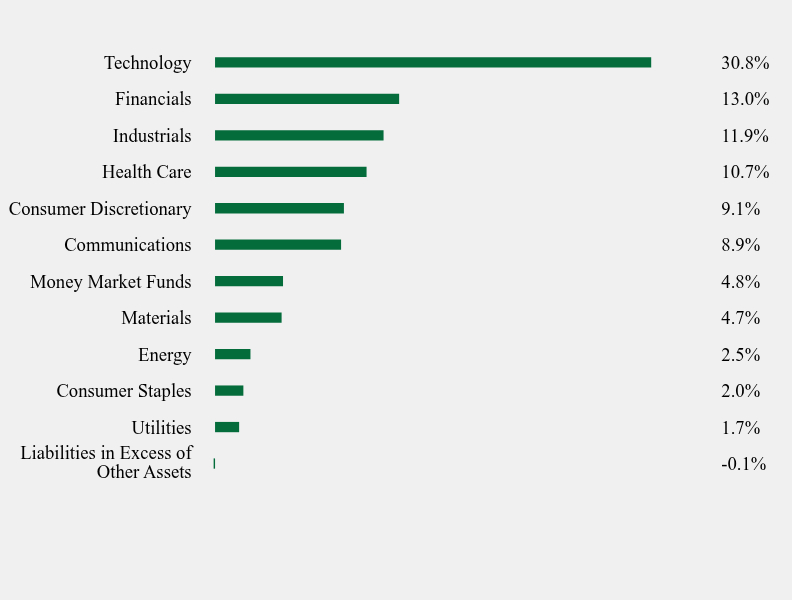
| Holdings [Text Block] |
Asset Weighting (% of total investments)Table SummaryValue | Value |
|---|
Common Stocks | 95.2% | Money Market Funds | 4.8% | Sector Weighting (% of net assets)Table SummaryValue | Value |
|---|
Liabilities in Excess of Other Assets | -0.1% | Utilities | 1.7% | Consumer Staples | 2.0% | Energy | 2.5% | Materials | 4.7% | Money Market Funds | 4.8% | Communications | 8.9% | Consumer Discretionary | 9.1% | Health Care | 10.7% | Industrials | 11.9% | Financials | 13.0% | Technology | 30.8% | Top 10 Holdings (% of net assets)Table SummaryHolding Name | % of Net Assets |
|---|
Amazon.com, Inc. | 5.4% |
|---|
NVIDIA Corporation | 5.4% |
|---|
Microsoft Corporation | 4.6% |
|---|
Brookfield Corporation | 4.5% |
|---|
Apple, Inc. | 4.2% |
|---|
Rockwell Automation, Inc. | 3.1% |
|---|
UnitedHealth Group, Inc. | 3.1% |
|---|
Alphabet, Inc. - Class A | 2.9% |
|---|
Analog Devices, Inc. | 2.7% |
|---|
TJX Companies, Inc. (The) | 2.7% |
|---|
|
| Material Fund Change [Text Block] |
No material changes occurred during the year ended March 31, 2026. |
| C000094748 |
|
| Shareholder Report [Line Items] |
|
| Fund Name |
Davenport Value & Income Fund
|
| Trading Symbol |
DVIPX
|
| Annual or Semi-Annual Statement [Text Block] |
This annual shareholder report contains important information about Davenport Value & Income Fund (the "Fund") for the period of April 1, 2025 to March 31, 2026.
|
| Additional Information [Text Block] |
You can find additional information about the Fund at https://www.investdavenport.com/davenport-asset-management/documents-applications/. You can also request this information by contacting us at (800) 281-3217.
|
| Additional Information Phone Number |
(800) 281-3217
|
| Additional Information Website |
<span style="font-weight: 700; box-sizing: border-box; color: rgb(0, 0, 0); display: inline; flex-wrap: nowrap; font-size: 12px; grid-area: auto; line-height: 18px; margin: 0px; overflow: visible; text-align: left; text-align-last: left; white-space-collapse: preserve-breaks;">https://www.investdavenport.com/davenport-asset-management/documents-applications/</span>
|
| Expenses [Text Block] |
What were the Fund’s annualized costs for the last year?(based on a hypothetical $10,000 investment) Table SummaryFund Name | Costs of a $10,000 investment | Costs paid as a percentage of a $10,000 investment |
|---|
Davenport Value & Income Fund | $91 | 0.86% |
|---|
|
| Expenses Paid, Amount |
$ 91
|
| Expense Ratio, Percent |
0.86%
|
| Performance Past Does Not Indicate Future [Text] |
The Fund’s past performance is not a good predictor of how the Fund will perform in the future.
|
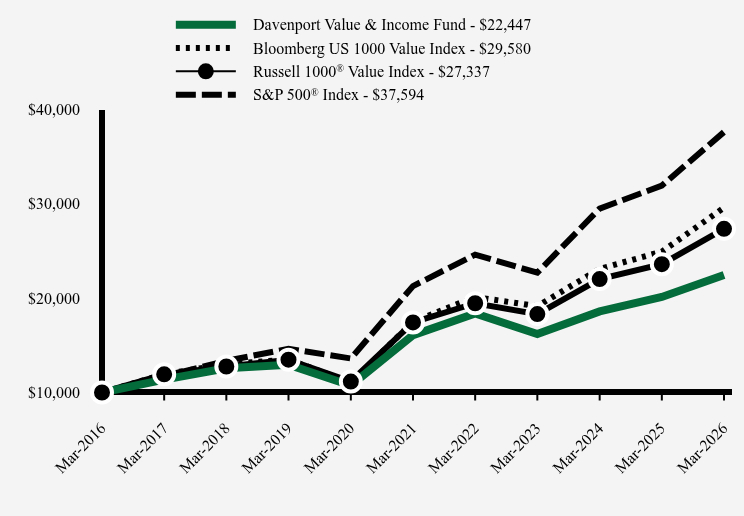
| Line Graph [Table Text Block] |
Table Summary | Davenport Value & Income Fund | Bloomberg US 1000 Value Index | Russell 1000® Value Index | S&P 500® Index |
|---|
Mar-2016 | $10,000 | $10,000 | $10,000 | $10,000 |
|---|
Mar-2017 | $11,360 | $11,944 | $11,922 | $11,717 |
|---|
Mar-2018 | $12,572 | $13,000 | $12,751 | $13,357 |
|---|
Mar-2019 | $12,944 | $13,496 | $13,474 | $14,625 |
|---|
Mar-2020 | $10,748 | $11,036 | $11,161 | $13,605 |
|---|
Mar-2021 | $16,073 | $17,502 | $17,421 | $21,271 |
|---|
Mar-2022 | $18,362 | $20,118 | $19,454 | $24,599 |
|---|
Mar-2023 | $16,193 | $19,143 | $18,303 | $22,698 |
|---|
Mar-2024 | $18,587 | $23,095 | $22,013 | $29,480 |
|---|
Mar-2025 | $20,120 | $24,917 | $23,593 | $31,913 |
|---|
Mar-2026 | $22,447 | $29,580 | $27,337 | $37,594 |
|---|
|
| Average Annual Return [Table Text Block] |
Average Annual Total Returns Table Summary | 1 Year | 5 Years | 10 Years |
|---|
Davenport Value & Income Fund | 11.57% | 6.91% | 8.42% |
|---|
Bloomberg US 1000 Value Index | 18.71% | 11.07% | 11.45% |
|---|
Russell 1000® Value Index | 15.87% | 9.43% | 10.58% |
|---|
S&P 500® Index | 17.80% | 12.06% | 14.16% |
|---|
The Fund’s past performance is not a good predictor of how the Fund will perform in the future. The graph and table do not reflect the deduction of taxes that a shareholder would pay on fund distributions or redemption of fund shares. For updated performance call (800) 281-3217. |
| No Deduction of Taxes [Text Block] |
The graph and table do not reflect the deduction of taxes that a shareholder would pay on fund distributions or redemption of fund shares.
|
| AssetsNet |
$ 1,010,396,324
|
| Holdings Count | Holding |
44
|
| Advisory Fees Paid, Amount |
$ 7,272,731
|
| InvestmentCompanyPortfolioTurnover |
30.00%
|
| Additional Fund Statistics [Text Block] |
- Net Assets$1,010,396,324
- Number of Portfolio Holdings44
- Advisory Fee $7,272,731
- Portfolio Turnover30%
|
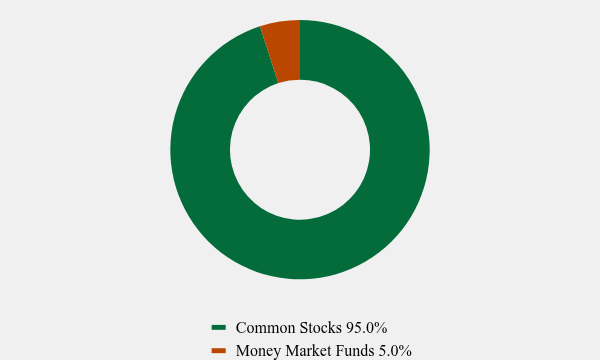
| Holdings [Text Block] |
Asset Weighting (% of total investments)Table SummaryValue | Value |
|---|
Common Stocks | 95.0% | Money Market Funds | 5.0% | Sector Weighting (% of net assets)Table SummaryValue | Value |
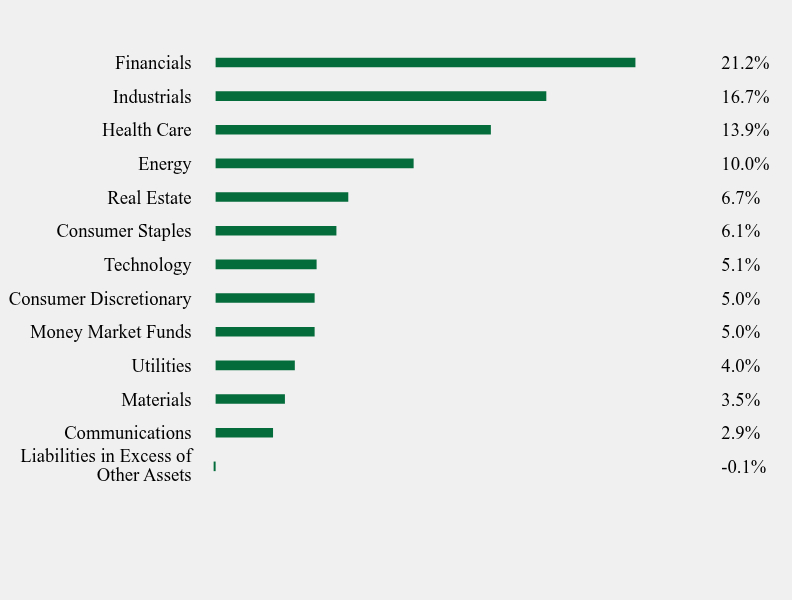
|---|
Liabilities in Excess of Other Assets | -0.1% | Communications | 2.9% | Materials | 3.5% | Utilities | 4.0% | Money Market Funds | 5.0% | Consumer Discretionary | 5.0% | Technology | 5.1% | Consumer Staples | 6.1% | Real Estate | 6.7% | Energy | 10.0% | Health Care | 13.9% | Industrials | 16.7% | Financials | 21.2% | Top 10 Holdings (% of net assets)Table SummaryHolding Name | % of Net Assets |
|---|
NextEra Energy, Inc. | 4.0% |
|---|
Johnson & Johnson | 3.5% |
|---|
Chevron Corporation | 3.2% |
|---|
Anheuser-Busch InBev S.A./N.V. - ADR | 3.1% |
|---|
American Tower Corporation | 3.1% |
|---|
Berkshire Hathaway, Inc. - Class B | 3.0% |
|---|
TE Connectivity plc | 3.0% |
|---|
Comcast Corporation - Class A | 2.9% |
|---|
Watsco, Inc. | 2.8% |
|---|
L3Harris Technologies, Inc. | 2.6% |
|---|
|
| Material Fund Change [Text Block] |
No material changes occurred during the year ended March 31, 2026. |
| C000094749 |
|
| Shareholder Report [Line Items] |
|
| Fund Name |
Davenport Equity Opportunities Fund
|
| Trading Symbol |
DEOPX
|
| Annual or Semi-Annual Statement [Text Block] |
This annual shareholder report contains important information about Davenport Equity Opportunities Fund (the "Fund") for the period of April 1, 2025 to March 31, 2026.
|
| Additional Information [Text Block] |
You can find additional information about the Fund at https://www.investdavenport.com/davenport-asset-management/documents-applications/. You can also request this information by contacting us at (800) 281-3217.
|
| Additional Information Phone Number |
(800) 281-3217
|
| Additional Information Website |
<span style="font-weight: 700; box-sizing: border-box; color: rgb(0, 0, 0); display: inline; flex-wrap: nowrap; font-size: 12px; grid-area: auto; line-height: 18px; margin: 0px; overflow: visible; text-align: left; text-align-last: left; white-space-collapse: preserve-breaks;">https://www.investdavenport.com/davenport-asset-management/documents-applications/</span>
|
| Expenses [Text Block] |
What were the Fund’s annualized costs for the last year?(based on a hypothetical $10,000 investment) Table SummaryFund Name | Costs of a $10,000 investment | Costs paid as a percentage of a $10,000 investment |
|---|
Davenport Equity Opportunities Fund | $86 | 0.87% |
|---|
|
| Expenses Paid, Amount |
$ 86
|
| Expense Ratio, Percent |
0.87%
|
| Performance Past Does Not Indicate Future [Text] |
The Fund’s past performance is not a good predictor of how the Fund will perform in the future.
|
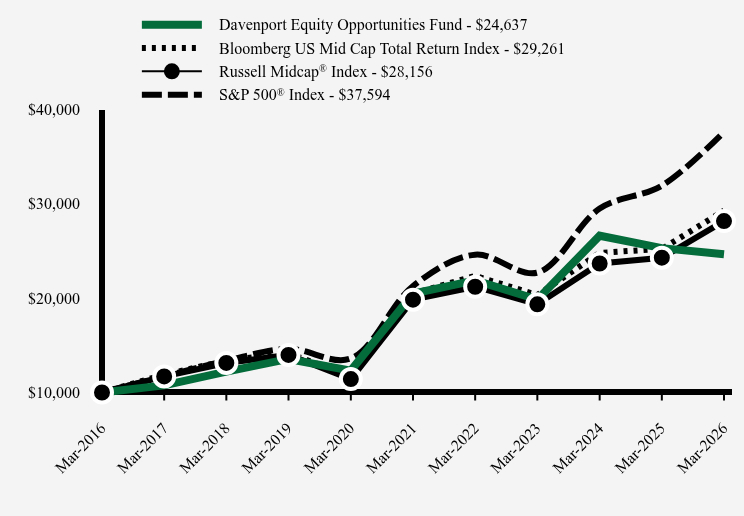
| Line Graph [Table Text Block] |
Table Summary | Davenport Equity Opportunities Fund | Bloomberg US Mid Cap Total Return Index | Russell Midcap® Index | S&P 500® Index |
|---|
Mar-2016 | $10,000 | $10,000 | $10,000 | $10,000 |
|---|
Mar-2017 | $10,757 | $11,887 | $11,703 | $11,717 |
|---|
Mar-2018 | $12,208 | $13,376 | $13,130 | $13,357 |
|---|
Mar-2019 | $13,553 | $14,162 | $13,980 | $14,625 |
|---|
Mar-2020 | $12,316 | $11,698 | $11,421 | $13,605 |
|---|
Mar-2021 | $20,470 | $20,464 | $19,831 | $21,271 |
|---|
Mar-2022 | $21,879 | $22,352 | $21,203 | $24,599 |
|---|
Mar-2023 | $19,855 | $20,316 | $19,341 | $22,698 |
|---|
Mar-2024 | $26,607 | $24,787 | $23,663 | $29,480 |
|---|
Mar-2025 | $25,289 | $25,210 | $24,277 | $31,913 |
|---|
Mar-2026 | $24,637 | $29,261 | $28,156 | $37,594 |
|---|
|
| Average Annual Return [Table Text Block] |
Average Annual Total Returns Table Summary | 1 Year | 5 Years | 10 Years |
|---|
Davenport Equity Opportunities Fund | -2.58% | 3.78% | 9.44% |
|---|
Bloomberg US Mid Cap Total Return Index | 16.07% | 7.41% | 11.33% |
|---|
Russell Midcap® Index | 15.98% | 7.26% | 10.91% |
|---|
S&P 500® Index | 17.80% | 12.06% | 14.16% |
|---|
The Fund’s past performance is not a good predictor of how the Fund will perform in the future. The graph and table do not reflect the deduction of taxes that a shareholder would pay on fund distributions or redemption of fund shares. For updated performance call (800) 281-3217. |
| No Deduction of Taxes [Text Block] |
The graph and table do not reflect the deduction of taxes that a shareholder would pay on fund distributions or redemption of fund shares.
|
| AssetsNet |
$ 754,534,063
|
| Holdings Count | Holding |
32
|
| Advisory Fees Paid, Amount |
$ 6,434,889
|
| InvestmentCompanyPortfolioTurnover |
29.00%
|
| Additional Fund Statistics [Text Block] |
- Net Assets$754,534,063
- Number of Portfolio Holdings32
- Advisory Fee $6,434,889
- Portfolio Turnover29%
|
| Holdings [Text Block] |
Asset Weighting (% of total investments)Table SummaryValue | Value |
|---|
Common Stocks | 94.8% | Money Market Funds | 5.2% | Sector Weighting (% of net assets)Table SummaryValue | Value |
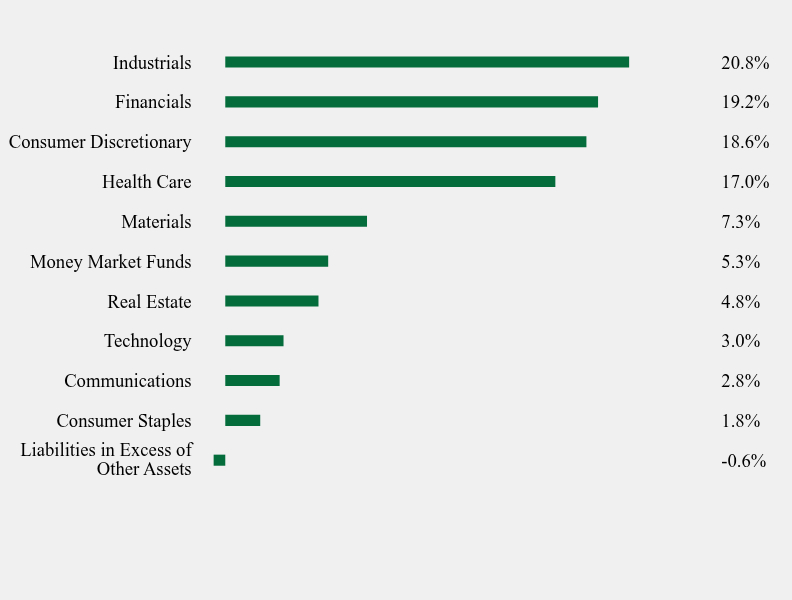
|---|
Liabilities in Excess of Other Assets | -0.6% | Consumer Staples | 1.8% | Communications | 2.8% | Technology | 3.0% | Real Estate | 4.8% | Money Market Funds | 5.3% | Materials | 7.3% | Health Care | 17.0% | Consumer Discretionary | 18.6% | Financials | 19.2% | Industrials | 20.8% | Top 10 Holdings (% of net assets)Table SummaryHolding Name | % of Net Assets |
|---|
Live Nation Entertainment, Inc. | 5.7% |
|---|
Clean Harbors, Inc. | 5.6% |
|---|
Kinsale Capital Group, Inc. | 5.5% |
|---|
Martin Marietta Materials, Inc. | 4.3% |
|---|
Align Technology, Inc. | 4.2% |
|---|
Fairfax Financial Holdings Ltd. | 4.0% |
|---|
Carrier Global Corporation | 3.8% |
|---|
Markel Group, Inc. | 3.7% |
|---|
Brookfield Corporation | 3.5% |
|---|
O'Reilly Automotive, Inc. | 3.5% |
|---|
|
| Material Fund Change Expenses [Text Block] |
No material changes occurred during the year ended March 31, 2026. |
| C000150331 |
|
| Shareholder Report [Line Items] |
|
| Fund Name |
Davenport Small Cap Focus Fund
|
| Trading Symbol |
DSCPX
|
| Annual or Semi-Annual Statement [Text Block] |
This annual shareholder report contains important information about Davenport Small Cap Focus Fund (the "Fund") for the period of April 1, 2025 to March 31, 2026.
|
| Additional Information [Text Block] |
You can find additional information about the Fund at https://www.investdavenport.com/davenport-asset-management/documents-applications/. You can also request this information by contacting us at (800) 281-3217.
|
| Additional Information Phone Number |
(800) 281-3217
|
| Additional Information Website |
<span style="font-weight: 700; box-sizing: border-box; color: rgb(0, 0, 0); display: inline; flex-wrap: nowrap; font-size: 12px; grid-area: auto; line-height: 18px; margin: 0px; overflow: visible; text-align: left; text-align-last: left; white-space-collapse: preserve-breaks;">https://www.investdavenport.com/davenport-asset-management/documents-applications/</span>
|
| Expenses [Text Block] |
What were the Fund’s annualized costs for the last year?(based on a hypothetical $10,000 investment) Table SummaryFund Name | Costs of a $10,000 investment | Costs paid as a percentage of a $10,000 investment |
|---|
Davenport Small Cap Focus Fund | $89 | 0.88% |
|---|
|
| Expenses Paid, Amount |
$ 89
|
| Expense Ratio, Percent |
0.88%
|
| Performance Past Does Not Indicate Future [Text] |
The Fund’s past performance is not a good predictor of how the Fund will perform in the future.
|
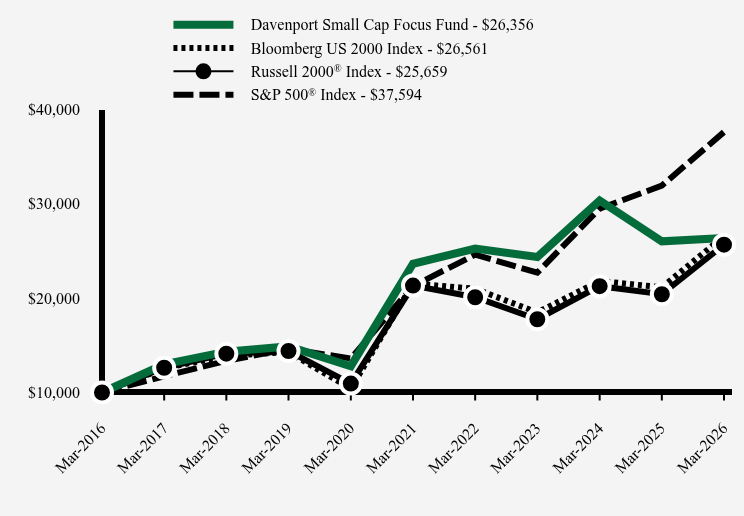
| Line Graph [Table Text Block] |
Table Summary | Davenport Small Cap Focus Fund | Bloomberg US 2000 Index | Russell 2000® Index | S&P 500® Index |
|---|
Mar-2016 | $10,000 | $10,000 | $10,000 | $10,000 |
|---|
Mar-2017 | $12,987 | $12,571 | $12,622 | $11,717 |
|---|
Mar-2018 | $14,322 | $13,873 | $14,110 | $13,357 |
|---|
Mar-2019 | $14,881 | $14,279 | $14,399 | $14,625 |
|---|
Mar-2020 | $12,786 | $10,409 | $10,945 | $13,605 |
|---|
Mar-2021 | $23,633 | $21,548 | $21,326 | $21,271 |
|---|
Mar-2022 | $25,253 | $20,984 | $20,092 | $24,599 |
|---|
Mar-2023 | $24,353 | $18,476 | $17,760 | $22,698 |
|---|
Mar-2024 | $30,342 | $21,812 | $21,260 | $29,480 |
|---|
Mar-2025 | $26,011 | $21,143 | $20,409 | $31,913 |
|---|
Mar-2026 | $26,356 | $26,561 | $25,659 | $37,594 |
|---|
|
| Average Annual Return [Table Text Block] |
Average Annual Total Returns Table Summary | 1 Year | 5 Years | 10 Years |
|---|
Davenport Small Cap Focus Fund | 1.33% | 2.20% | 10.18% |
|---|
Bloomberg US 2000 Index | 25.63% | 4.27% | 10.26% |
|---|
Russell 2000® Index | 25.72% | 3.77% | 9.88% |
|---|
S&P 500® Index | 17.80% | 12.06% | 14.16% |
|---|
The Fund’s past performance is not a good predictor of how the Fund will perform in the future. The graph and table do not reflect the deduction of taxes that a shareholder would pay on fund distributions or redemption of fund shares. For updated performance call (800) 281-3217. |
| No Deduction of Taxes [Text Block] |
The graph and table do not reflect the deduction of taxes that a shareholder would pay on fund distributions or redemption of fund shares.
|
| AssetsNet |
$ 595,208,820
|
| Holdings Count | Holding |
29
|
| Advisory Fees Paid, Amount |
$ 5,867,700
|
| InvestmentCompanyPortfolioTurnover |
39.00%
|
| Additional Fund Statistics [Text Block] |
- Net Assets$595,208,820
- Number of Portfolio Holdings29
- Advisory Fee $5,867,700
- Portfolio Turnover39%
|
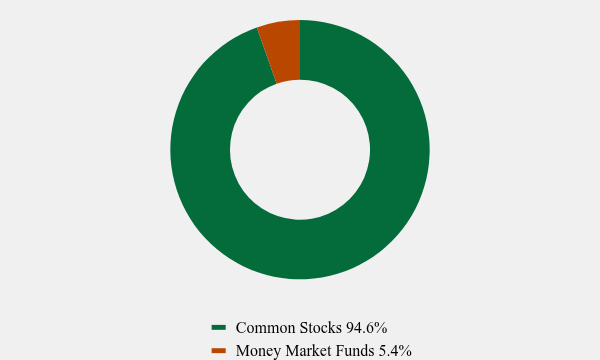
| Holdings [Text Block] |
Asset Weighting (% of total investments)Table SummaryValue | Value |
|---|
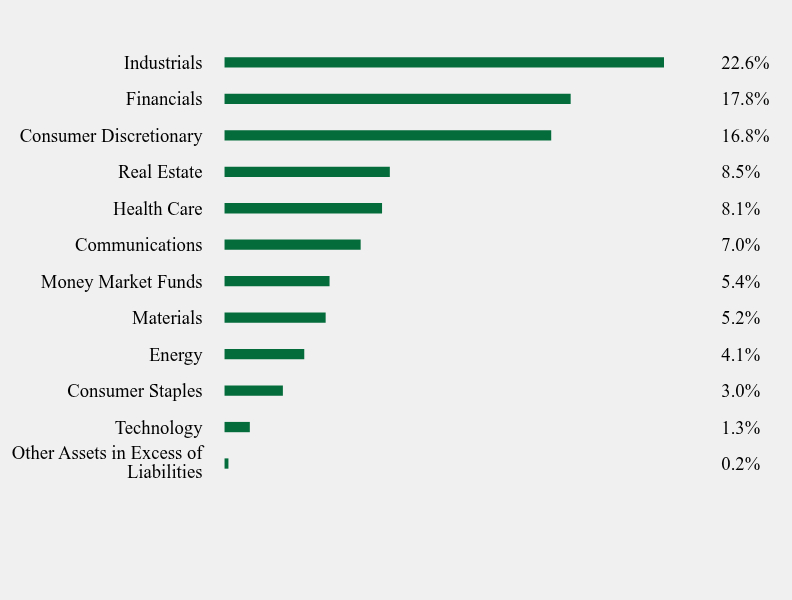
Common Stocks | 94.6% | Money Market Funds | 5.4% | Sector Weighting (% of net assets)Table SummaryValue | Value |
|---|
Other Assets in Excess of Liabilities | 0.2% | Technology | 1.3% | Consumer Staples | 3.0% | Energy | 4.1% | Materials | 5.2% | Money Market Funds | 5.4% | Communications | 7.0% | Health Care | 8.1% | Real Estate | 8.5% | Consumer Discretionary | 16.8% | Financials | 17.8% | Industrials | 22.6% | Top 10 Holdings (% of net assets)Table SummaryHolding Name | % of Net Assets |
|---|
Monarch Casino & Resort, Inc. | 8.2% |
|---|
Kinsale Capital Group, Inc. | 6.5% |
|---|
Caesars Entertainment, Inc. | 5.1% |
|---|
Americold Realty Trust, Inc. | 4.8% |
|---|
Kirby Corporation | 4.4% |
|---|
HealthEquity, Inc. | 4.3% |
|---|
Stewart Information Services Corporation | 4.0% |
|---|
Hexcel Corporation | 3.8% |
|---|
Enovis Corporation | 3.8% |
|---|
Rayonier, Inc. | 3.7% |
|---|
|
| Material Fund Change [Text Block] |
No material changes occurred during the year ended March 31, 2026. |
| C000164143 |
|
| Shareholder Report [Line Items] |
|
| Fund Name |
Davenport Balanced Income Fund
|
| Trading Symbol |
DBALX
|
| Annual or Semi-Annual Statement [Text Block] |
This annual shareholder report contains important information about Davenport Balanced Income Fund (the "Fund") for the period of April 1, 2025 to March 31, 2026.
|
| Additional Information [Text Block] |
You can find additional information about the Fund at https://www.investdavenport.com/davenport-asset-management/documents-applications/. You can also request this information by contacting us at (800) 281-3217.
|
| Additional Information Phone Number |
(800) 281-3217
|
| Additional Information Website |
<span style="font-weight: 700; box-sizing: border-box; color: rgb(0, 0, 0); display: inline; flex-wrap: nowrap; font-size: 12px; grid-area: auto; line-height: 18px; margin: 0px; overflow: visible; text-align: left; text-align-last: left; white-space-collapse: preserve-breaks;">https://www.investdavenport.com/davenport-asset-management/documents-applications/</span>
|
| Expenses [Text Block] |
What were the Fund’s annualized costs for the last year?(based on a hypothetical $10,000 investment) Table SummaryFund Name | Costs of a $10,000 investment | Costs paid as a percentage of a $10,000 investment |
|---|
Davenport Balanced Income Fund | $96 | 0.92% |
|---|
|
| Expenses Paid, Amount |
$ 96
|
| Expense Ratio, Percent |
0.92%
|
| Performance Past Does Not Indicate Future [Text] |
The Fund’s past performance is not a good predictor of how the Fund will perform in the future.
|
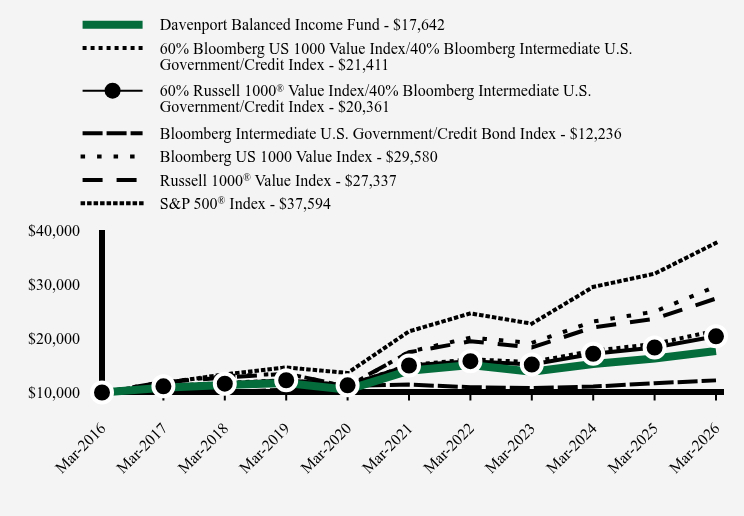
| Line Graph [Table Text Block] |
Table Summary | Davenport Balanced Income Fund | 60% Bloomberg US 1000 Value Index/40% Bloomberg Intermediate U.S. Government/Credit Index | 60% Russell 1000® Value Index/40% Bloomberg Intermediate U.S. Government/Credit Index | Bloomberg Intermediate U.S. Government/Credit Bond Index | Bloomberg US 1000 Value Index | Russell 1000® Value Index | S&P 500® Index |
|---|
Mar-2016 | $10,000 | $10,000 | $10,000 | $10,000 | $10,000 | $10,000 | $10,000 |
|---|
Mar-2017 | $10,859 | $11,156 | $11,143 | $10,042 | $11,944 | $11,922 | $11,717 |
|---|
Mar-2018 | $11,382 | $11,767 | $11,628 | $10,078 | $13,000 | $12,751 | $13,357 |
|---|
Mar-2019 | $11,763 | $12,273 | $12,256 | $10,505 | $13,496 | $13,474 | $14,625 |
|---|
Mar-2020 | $10,518 | $11,272 | $11,330 | $11,228 | $11,036 | $11,161 | $13,605 |
|---|
Mar-2021 | $14,004 | $15,057 | $14,984 | $11,453 | $17,502 | $17,421 | $21,271 |
|---|
Mar-2022 | $15,054 | $16,123 | $15,771 | $10,984 | $20,118 | $19,454 | $24,599 |
|---|
Mar-2023 | $13,823 | $15,614 | $15,158 | $10,801 | $19,143 | $18,303 | $22,698 |
|---|
Mar-2024 | $15,251 | $17,698 | $17,148 | $11,092 | $23,095 | $22,013 | $29,480 |
|---|
Mar-2025 | $16,279 | $18,963 | $18,302 | $11,719 | $24,917 | $23,593 | $31,913 |
|---|
Mar-2026 | $17,642 | $21,411 | $20,361 | $12,236 | $29,580 | $27,337 | $37,594 |
|---|
|
| Average Annual Return [Table Text Block] |
Average Annual Total Returns Table Summary | 1 Year | 5 Years | 10 Years |
|---|
Davenport Balanced Income Fund | 8.37% | 4.73% | 5.84% |
|---|
60% Bloomberg US 1000 Value Index/40% Bloomberg Intermediate U.S. Government/Credit Index | 12.91% | 7.30% | 7.91% |
|---|
60% Russell 1000® Value Index/40% Bloomberg Intermediate U.S. Government/Credit Index | 11.25% | 6.32% | 7.37% |
|---|
Bloomberg Intermediate U.S. Government/Credit Bond Index | 4.41% | 1.33% | 2.04% |
|---|
Bloomberg US 1000 Value Index | 18.71% | 11.07% | 11.45% |
|---|
Russell 1000® Value Index | 15.87% | 9.43% | 10.58% |
|---|
S&P 500® Index | 17.80% | 12.06% | 14.16% |
|---|
The Fund’s past performance is not a good predictor of how the Fund will perform in the future. The graph and table do not reflect the deduction of taxes that a shareholder would pay on fund distributions or redemption of fund shares. For updated performance call (800) 281-3217. |
| No Deduction of Taxes [Text Block] |
The graph and table do not reflect the deduction of taxes that a shareholder would pay on fund distributions or redemption of fund shares.
|
| AssetsNet |
$ 279,922,882
|
| Holdings Count | Holding |
82
|
| Advisory Fees Paid, Amount |
$ 1,990,013
|
| InvestmentCompanyPortfolioTurnover |
36.00%
|
| Additional Fund Statistics [Text Block] |
- Net Assets$279,922,882
- Number of Portfolio Holdings82
- Advisory Fee $1,990,013
- Portfolio Turnover36%
|
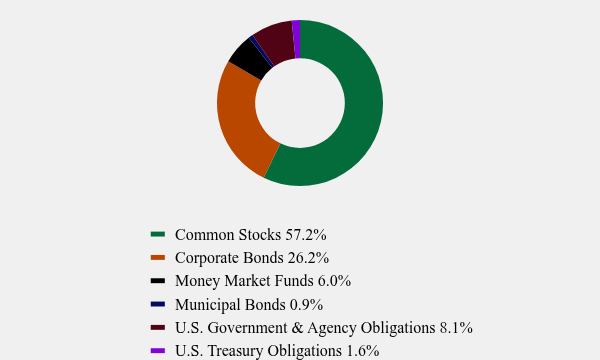
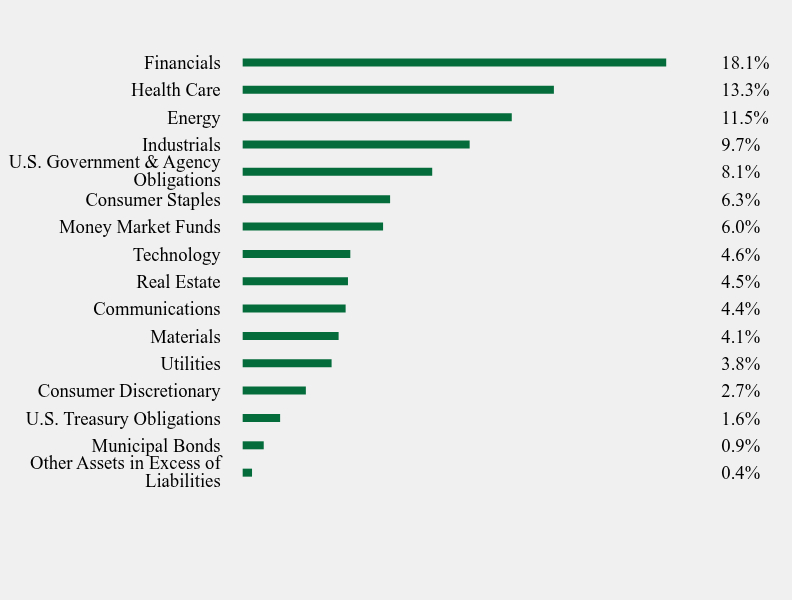
| Holdings [Text Block] |
Asset Weighting (% of total investments)Table SummaryValue | Value |
|---|
Common Stocks | 57.2% | Corporate Bonds | 26.2% | Money Market Funds | 6.0% | Municipal Bonds | 0.9% | U.S. Government & Agency Obligations | 8.1% | U.S. Treasury Obligations | 1.6% | Sector Weighting (% of net assets)Table SummaryValue | Value |
|---|
Other Assets in Excess of Liabilities | 0.4% | Municipal Bonds | 0.9% | U.S. Treasury Obligations | 1.6% | Consumer Discretionary | 2.7% | Utilities | 3.8% | Materials | 4.1% | Communications | 4.4% | Real Estate | 4.5% | Technology | 4.6% | Money Market Funds | 6.0% | Consumer Staples | 6.3% | U.S. Government & Agency Obligations | 8.1% | Industrials | 9.7% | Energy | 11.5% | Health Care | 13.3% | Financials | 18.1% | Top 10 Holdings (% of net assets)Table SummaryHolding Name | % of Net Assets |
|---|
NextEra Energy, Inc. | 2.1% |
|---|
Johnson & Johnson | 1.9% |
|---|
Meta Platforms, Inc., 4.950%, due 05/15/33 | 1.8% |
|---|
Federal Farm Credit Bank, 5.330%, due 10/17/39 | 1.8% |
|---|
Federal Farm Credit Bank, 5.000%, due 10/29/35 | 1.8% |
|---|
Federal Farm Credit Bank, 5.030%, due 10/15/35 | 1.8% |
|---|
Federal Farm Credit Bank, 4.940%, due 03/24/34 | 1.7% |
|---|
Abbott Laboratories, 4.650%, due 03/15/36 | 1.7% |
|---|
Chevron Corporation | 1.7% |
|---|
Anheuser-Busch InBev S.A./N.V. - ADR | 1.7% |
|---|
|
| Material Fund Change [Text Block] |
No material changes occurred during the year ended March 31, 2026. |
| C000246245 |
|
| Shareholder Report [Line Items] |
|
| Fund Name |
Davenport Insider Buying Fund
|
| Trading Symbol |
DBUYX
|
| Annual or Semi-Annual Statement [Text Block] |
This annual shareholder report contains important information about Davenport Insider Buying Fund (the "Fund") for the period of April 1, 2025 to March 31, 2026.
|
| Additional Information [Text Block] |
You can find additional information about the Fund at https://www.investdavenport.com/davenport-asset-management/documents-applications/. You can also request this information by contacting us at (800) 281-3217.
|
| Additional Information Phone Number |
(800) 281-3217
|
| Additional Information Website |
<span style="font-weight: 700; box-sizing: border-box; color: rgb(0, 0, 0); display: inline; flex-wrap: nowrap; font-size: 12px; grid-area: auto; line-height: 18px; margin: 0px; overflow: visible; text-align: left; text-align-last: left; white-space-collapse: preserve-breaks;">https://www.investdavenport.com/davenport-asset-management/documents-applications/</span>
|
| Expenses [Text Block] |
What were the Fund’s annualized costs for the last year?(based on a hypothetical $10,000 investment) Table SummaryFund Name | Costs of a $10,000 investment | Costs paid as a percentage of a $10,000 investment |
|---|
Davenport Insider Buying Fund | $108 | 1.01% |
|---|
|
| Expenses Paid, Amount |
$ 108
|
| Expense Ratio, Percent |
1.01%
|
| Performance Past Does Not Indicate Future [Text] |
The Fund’s past performance is not a good predictor of how the Fund will perform in the future.
|
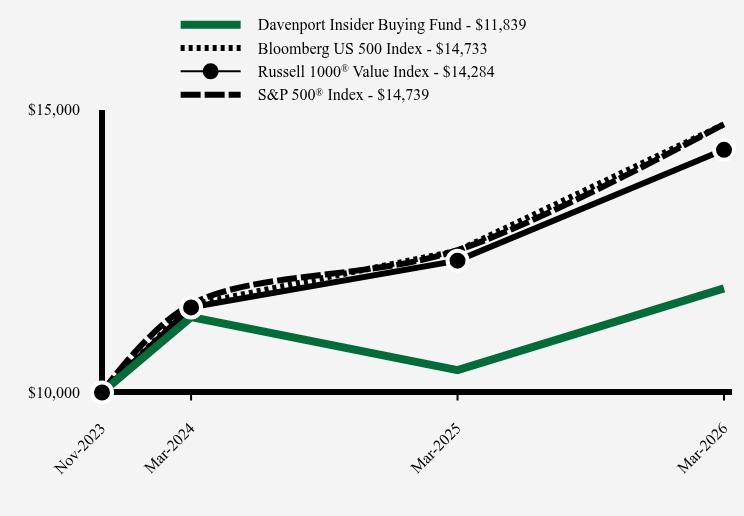
| Line Graph [Table Text Block] |
Table Summary | Davenport Insider Buying Fund | Bloomberg US 500 Index | Russell 1000® Value Index | S&P 500® Index |
|---|
Nov-2023 | $10,000 | $10,000 | $10,000 | $10,000 |
|---|
Mar-2024 | $11,331 | $11,547 | $11,502 | $11,558 |
|---|
Mar-2025 | $10,394 | $12,502 | $12,328 | $12,512 |
|---|
Mar-2026 | $11,839 | $14,733 | $14,284 | $14,739 |
|---|
|
| Average Annual Return [Table Text Block] |
Average Annual Total Returns Table Summary | 1 Year | Since Inception (November 30, 2023) |
|---|
Davenport Insider Buying Fund | 13.90% | 7.50% |
|---|
Bloomberg US 500 Index | 17.84% | 18.06% |
|---|
Russell 1000® Value Index | 15.87% | 16.50% |
|---|
S&P 500® Index | 17.80% | 18.08% |
|---|
The Fund’s past performance is not a good predictor of how the Fund will perform in the future. The graph and table do not reflect the deduction of taxes that a shareholder would pay on fund distributions or redemption of fund shares. For updated performance call (800) 281-3217. |
| Performance Inception Date |
Nov. 30, 2023
|
| No Deduction of Taxes [Text Block] |
The graph and table do not reflect the deduction of taxes that a shareholder would pay on fund distributions or redemption of fund shares.
|
| AssetsNet |
$ 88,406,117
|
| Holdings Count | Holding |
39
|
| Advisory Fees Paid, Amount |
$ 670,596
|
| InvestmentCompanyPortfolioTurnover |
42.00%
|
| Additional Fund Statistics [Text Block] |
- Net Assets$88,406,117
- Number of Portfolio Holdings39
- Advisory Fee $670,596
- Portfolio Turnover42%
|
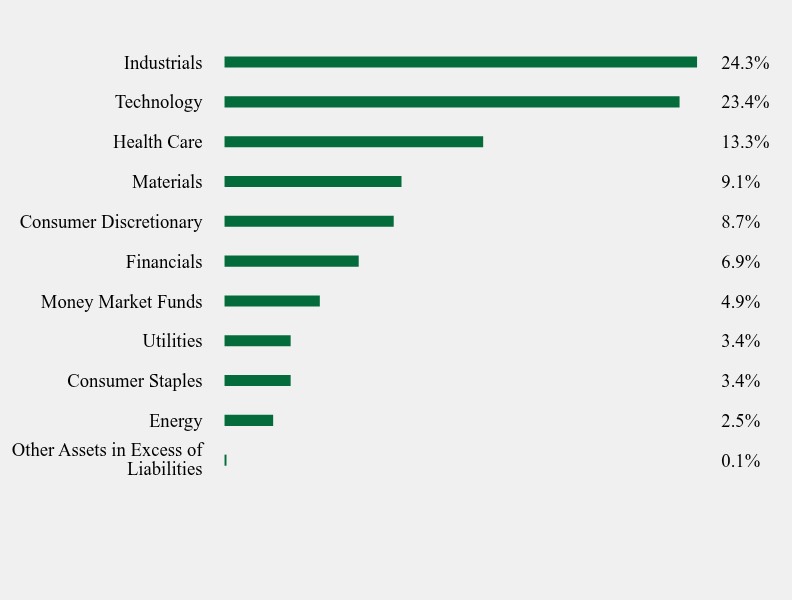
| Holdings [Text Block] |
Asset Weighting (% of total investments)Table SummaryValue | Value |
|---|
Common Stocks | 95.1% | Money Market Funds | 4.9% | Sector Weighting (% of net assets)Table SummaryValue | Value |
|---|
Other Assets in Excess of Liabilities | 0.1% | Energy | 2.5% | Consumer Staples | 3.4% | Utilities | 3.4% | Money Market Funds | 4.9% | Financials | 6.9% | Consumer Discretionary | 8.7% | Materials | 9.1% | Health Care | 13.3% | Technology | 23.4% | Industrials | 24.3% | Top 10 Holdings (% of net assets)Table SummaryHolding Name | % of Net Assets |
|---|
Keysight Technologies, Inc. | 3.5% |
|---|
Aon plc - Class A | 3.5% |
|---|
Charles Schwab Corporation (The) | 3.4% |
|---|
International Flavors & Fragrances, Inc. | 3.4% |
|---|
NextEra Energy, Inc. | 3.4% |
|---|
Clean Harbors, Inc. | 3.4% |
|---|
Marvell Technology, Inc. | 3.4% |
|---|
Darling Ingredients, Inc. | 3.4% |
|---|
Martin Marietta Materials, Inc. | 3.3% |
|---|
Eaton Corporation plc | 3.2% |
|---|
|
| Material Fund Change [Text Block] |
No material changes occurred during the year ended March 31, 2026. |