Pay versus Performance
We are required by SEC rules to disclose the following information regarding compensation paid to our Principal Executive Officer (the “PEO”) and our other Named Executive Officers (such other Named Executive Officers collectively referred to hereinafter as the “Non-PEO NEOs”). The amounts set forth below under the headings “Compensation Actually Paid to PEO” and “Average Compensation Actually Paid to Non-PEO NEOs” have been calculated in a manner prescribed by the SEC rules and do not necessarily align with how we or the compensation committee views the link between our performance and pay of our named executive officers. The footnotes below set forth the adjustments from the total compensation for each of our NEOs reported in the Summary Compensation Table above. As permitted under the rules applicable to smaller reporting companies, we are including two years of data and are not including a peer group total shareholder return or company-selected measure, as contemplated under Item 402(v) of Regulation S-K. For further information concerning our executive compensation philosophy and how executive compensation is aligned with the Company’s performance, refer to the section entitled “Executive Compensation” included in this proxy statement.
PEO and Non-PEO NEOs’ compensation is designed to provide a mix of compensation to reward Officers for individual and company performance as well as to align their interests with the interests of shareholders. To achieve our goal of appropriately rewarding our Officers for their efforts, the compensation generally includes: (i) annual base salary, benefits and perquisites; (ii) annual bonus based on target and above-target performance; and (iii) equity-based compensation and retirement benefits.
For the years 2024 and 2025, in order to preserve Company’s cash, PEO and Non-PEO NEOs were granted RSUs in lieu of an annual cash bonus and a portion of their respective salary increase.
A significant portion of the PEO and Non-PEO NEOs total compensation is “at-risk” in the form of equity compensation and is directly tied to the Company’s share performance. As a result, this component of compensation aligns the PEO and Non-PEO NEOs interests with those of shareholders by linking potential rewards to long-term stock price appreciation.
The following table sets forth additional compensation information of our PEO and Non-PEO NEOs, along with total shareholder return, and net loss results for the years ended December 31, 2025 and 2024:
| Value of | |||||||||||||||||||||||||
| Average | Initial Fixed | ||||||||||||||||||||||||
| Summary | Average | $100 | |||||||||||||||||||||||
| Summary | Compensation | Compensation | Investment | ||||||||||||||||||||||
| Compensation | Compensation | Table Total | Actually Paid | Based on | |||||||||||||||||||||
| Table Total | Actually Paid | for Non-PEO | to Non-PEO | Total | |||||||||||||||||||||
| for PEO | to PEO | NEOs | NEOs | Shareholder | Net Loss | ||||||||||||||||||||
| Year(1) | (in 000s)(2) | (in 000s)(3) | (in 000s)(4) | (in 000s)(3) | Return(5) | (in 000s)(6) | |||||||||||||||||||
| 2025 | $ | 1,482 | $ | 1,351 | $ | 518 | $ | 437 | $ | 223 | $ | (11,439 | ) | ||||||||||||
| 2024 | $ | 1,149 | $ | 2,187 | $ | 485 | $ | 849 | $ | 212 | $ | (9,541 | ) | ||||||||||||
(1) The Non-PEO NEOs for 2024 are Hillel Galitzer and Dana Yaacov-Garbeli. The non-PEO NEOs for 2025 are Hillel Galitzer and Gregory Burstein.
(2) The dollar amounts reported herein represent the amount of total compensation reported for each covered fiscal year in the “Total” column of the Summary Compensation Table for each applicable year.
(3) The dollar amounts reported below represent the amount of “compensation actually paid” to our PEO and Non-PEO NEOs (as an average) as computed in accordance with Item 402(v) of Regulation S-K, for each covered fiscal year. The dollar amounts do not reflect the actual amount of compensation earned or received by or paid to the PEOs and Non-PEO NEOs during the applicable fiscal year. For purposes of the equity award adjustments shown below, no equity awards were cancelled due to a failure to meet vesting conditions and no dividends or other earnings paid on share or option awards in the covered fiscal year prior to the vesting date were not otherwise included in the total compensation for the covered fiscal year. In calculating the “compensation actually paid” amounts reflected in these columns, the fair value or change in fair value, as applicable, of the equity award adjustments included in such calculations was computed in accordance with FASB ASC Topic 718. The valuation assumptions used to calculate such fair values did not materially differ from those disclosed at the time of grant. The following table details the applicable adjustments that were made to the determine “compensation actually paid” (all amounts are averages for Non-PEO NEOs).
The below figures are represented in thousands.
(4) The dollar amounts reported herein represent the average of the amounts of total compensation reported for our Non-PEO NEOs as a group for each covered fiscal year in the “Total” column of the Summary Compensation Table for each applicable year.
(5) Cumulative total stockholder return (“TSR”) assumes $100 was invested on December 31, 2023 and is calculated by dividing the sum of the cumulative amount of dividends for the measurement period, assuming dividend reinvestment, and the difference between our share price at the end and the beginning of the measurement period (December 31, 2023) by our stock price at the beginning of the measurement period. At December 31, 2025, 2024 and 2023, the per share closing prices for our Ordinary Shares were $1.94, $2.28 and $0.60, respectively. No dividends were paid on share or option awards for all periods presented.
(6) Net loss is reflected as reported in our audited consolidated financial statements for the applicable fiscal year.
| PEO | Non-PEO NEO Average | |||||||||||||||
| 2025 | 2024 | 2025 | 2024 | |||||||||||||
| Summary Compensation Table Total | $ | 1,482 | $ | 1,149 | $ | 518 | $ | 485 | ||||||||
| -the fair value of equity awards granted that are reported in the Summary Compensation Table | (889 | ) | (742 | ) | (238 | ) | (246 | ) | ||||||||
| + Fair value as of the end of all awards granted during the covered fiscal year that are outstanding and unvested at the end of the covered year | 791 | 360 | 210 | 245 | ||||||||||||
| +/- Change in fair value as of the end of the covered fiscal year (from the end of the prior fiscal year) of any awards granted in any prior fiscal year that are outstanding and unvested as of the end of the covered fiscal year | (151 | ) | 863 | (47 | ) | 222 | ||||||||||
| Fair Value as of Vesting Date of Equity Awards Granted and Vested in the Year | 207 | 112 | 30 | 28 | ||||||||||||
| +/- Change in fair value as of the vesting date (from | ||||||||||||||||
| the end of the prior fiscal year) of any awards | ||||||||||||||||
| granted in any prior fiscal year for which all | ||||||||||||||||
| applicable vesting conditions were satisfied at the | ||||||||||||||||
| end of or during the covered fiscal year | (89 | ) | 445 | (35 | ) | 115 | ||||||||||
| Compensation Actually Paid | $ | 1,351 | $ | 2,187 | $ | 437 | $ | 849 | ||||||||
Pay versus Performance Comparative Disclosure
In accordance with SEC rules, the Company is providing the following narrative disclosure regarding the relationships between information presented in the pay versus performance tables above.
Compensation Actually Paid and Cumulative Total Shareholder Return
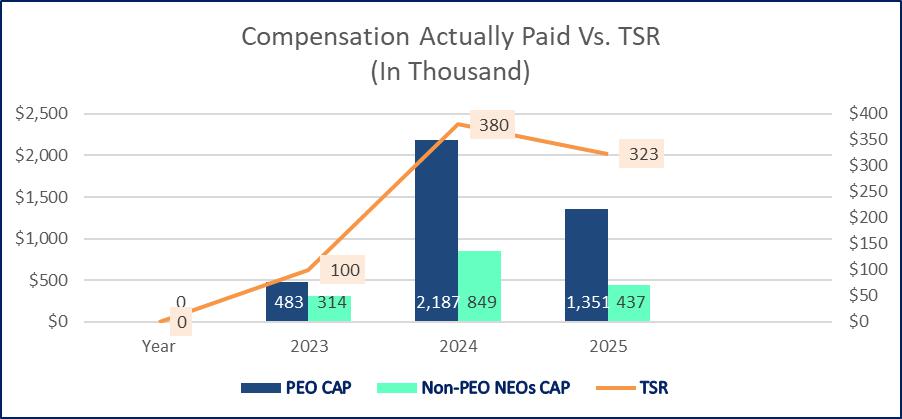
During 2024 and 2025, compensation actually paid (“CAP”) to our PEO decreased from $2,187 thousand in fiscal year 2024 to $1,351 thousands in fiscal year 2025. Average compensation actually paid to our Non-PEO NEOs decreased from $849 in fiscal year 2024 to $437 thousand in fiscal year 2025. Over the same period, the value of an investment of $100 in our Ordinary Shares on the last trading day of 2023 increased by $280 to $380 during fiscal 2024 and decreased by $57 to $323 during fiscal 2025.
The following graph sets forth the relationship between CAP to our PEO, the average of CAP to our Non-PEO NEOs, and our cumulative TSR over the three most recently completed fiscal years.
Compensation Actually Paid and Net Loss
During 2024 and 2025, CAP to our PEO decreased from $2,187 thousand in fiscal year 2024 to $1,351 thousands in fiscal year 2025. Average compensation actually paid to our Non-PEO NEOs decreased from $849 in fiscal year 2024 to $437 thousand in fiscal year 2025. Over the same period, our net loss increased by $1,898 thousand during fiscal year 2025 (from a net loss in fiscal year 2024 of $9,541 thousand to a net loss in fiscal year 2025 of $11,439 thousand).
| PEO | Non-PEO NEO Average | |||||||||||||||
| 2025 | 2024 | 2025 | 2024 | |||||||||||||
| Summary Compensation Table Total | $ | 1,482 | $ | 1,149 | $ | 518 | $ | 485 | ||||||||
| -the fair value of equity awards granted that are reported in the Summary Compensation Table | (889 | ) | (742 | ) | (238 | ) | (246 | ) | ||||||||
| + Fair value as of the end of all awards granted during the covered fiscal year that are outstanding and unvested at the end of the covered year | 791 | 360 | 210 | 245 | ||||||||||||
| +/- Change in fair value as of the end of the covered fiscal year (from the end of the prior fiscal year) of any awards granted in any prior fiscal year that are outstanding and unvested as of the end of the covered fiscal year | (151 | ) | 863 | (47 | ) | 222 | ||||||||||
| Fair Value as of Vesting Date of Equity Awards Granted and Vested in the Year | 207 | 112 | 30 | 28 | ||||||||||||
| +/- Change in fair value as of the vesting date (from | ||||||||||||||||
| the end of the prior fiscal year) of any awards | ||||||||||||||||
| granted in any prior fiscal year for which all | ||||||||||||||||
| applicable vesting conditions were satisfied at the | ||||||||||||||||
| end of or during the covered fiscal year | (89 | ) | 445 | (35 | ) | 115 | ||||||||||
| Compensation Actually Paid | $ | 1,351 | $ | 2,187 | $ | 437 | $ | 849 | ||||||||
Compensation Actually Paid and Cumulative Total Shareholder Return
During 2024 and 2025, compensation actually paid (“CAP”) to our PEO decreased from $2,187 thousand in fiscal year 2024 to $1,351 thousands in fiscal year 2025. Average compensation actually paid to our Non-PEO NEOs decreased from $849 in fiscal year 2024 to $437 thousand in fiscal year 2025. Over the same period, the value of an investment of $100 in our Ordinary Shares on the last trading day of 2023 increased by $280 to $380 during fiscal 2024 and decreased by $57 to $323 during fiscal 2025.
The following graph sets forth the relationship between CAP to our PEO, the average of CAP to our Non-PEO NEOs, and our cumulative TSR over the three most recently completed fiscal years.
Compensation Actually Paid and Net Loss
During 2024 and 2025, CAP to our PEO decreased from $2,187 thousand in fiscal year 2024 to $1,351 thousands in fiscal year 2025. Average compensation actually paid to our Non-PEO NEOs decreased from $849 in fiscal year 2024 to $437 thousand in fiscal year 2025. Over the same period, our net loss increased by $1,898 thousand during fiscal year 2025 (from a net loss in fiscal year 2024 of $9,541 thousand to a net loss in fiscal year 2025 of $11,439 thousand).
The table and summary below outline the compensation granted to our named executive officers (“Named Executive Officers”) during our fiscal years ended December 31, 2025 and December 31, 2024. As a “smaller reporting company,” we are required to provide executive compensation information for the following individuals: (i) all individuals who served as the Company’s principal executive officer (“PEO”), during the last completed fiscal year, regardless of compensation; (ii) the two most highly compensated executive officers (other than the PEO) who were serving as executive officers of the Company at the end of the last completed fiscal year and whose total compensation was greater than $100,000; and (iii) up to two additional persons who served as executive officers (other than as the PEO) during the last completed fiscal year but who were not serving in that capacity at the end of the fiscal year if their total compensation is higher than any of the other two Named Executive Officers in the preceding group.
The below figures are represented in thousands.
| Option | RSUs | All Other | ||||||||||||||||||||||||||
| Name and Principal | Award(s) | Award(s) | Compensation | |||||||||||||||||||||||||
| Position | Year | Salary ($) | Bonus ($) | ($)(1) | ($)(2) | ($) | Total ($) | |||||||||||||||||||||
| Miranda Toledano | 2025 | 490 | - | 590 | 330 | 72 | 1,482 | |||||||||||||||||||||
| Chief Executive | ||||||||||||||||||||||||||||
| Officer and | ||||||||||||||||||||||||||||
| director | 2024 | 419 | - | 538 | 156 | 36 | 1,149 | |||||||||||||||||||||
| Hillel Galitzer | 2025 | 282 | - | 176 | 48 | 25 | 531 | |||||||||||||||||||||
| Chief Operating | ||||||||||||||||||||||||||||
| Officer | 2024 | 259 | - | 175 | 54 | 43 | 531 | |||||||||||||||||||||
| Gregory Burshtein | 2025 | 217 | - | 202 | 48 | 37 | 504 | |||||||||||||||||||||
| Chief of Research | ||||||||||||||||||||||||||||
| and Development | 2024 | 172 | - | 92 | 45 | 28 | 337 | |||||||||||||||||||||
| (1) | Reflects the associated annual expense recorded in our financial statements based on the grant date fair value of the share-based compensation granted in exchange for the directors’ and officers’ services computed in accordance with Financial Accounting Standards Board (“FASB”) Accounting Standards Codification (“ASC”) Topic 718, Compensation - Stock Compensation (“ASC Topic 718”). The assumptions used in calculating the amounts are discussed in Note 6 to the Company’s audited financial statements for the year ended December 31, 2025 included in our 2025 Annual Report. The fair value amount is recognized as an expense over the course of the vesting period of the options (subject to any applicable accounting adjustments during that period). |
| (2) | Reflects the associate annual expenses for RSUs granted in place of annual bonus in cash recorded in our financial statements based on the fair value of the share-based compensation grant date market computed in accordance with ASC Topic 718. The fair value amount is recognized as an expense over the course of the vesting period of the RSUs in the Company’s audited financial statements for the year ended December 31, 2025 included in our 2025 Annual Report. |
The following table sets forth the outstanding equity awards at December 31, 2025 for our Named Executive Officers.
| Number of Securities | ||||||||||||
| Underlying | ||||||||||||
| Unexercised Options and | Option | |||||||||||
| Unvested RSUs | Expiration | |||||||||||
| Name | Exercisable | Unexercisable | Date | |||||||||
| Miranda Toledano | 33,638 | - | 1/17/2029 | |||||||||
| Chief Executive Officer and director | 35,852 | - | 1/1/2032 | |||||||||
| 107,557 | - | 1/1/2032 | ||||||||||
| 437,500 | 62,500 | (1) | 05/16/2032 | |||||||||
| 487,500 | 112,500 | (2) | 07/15/2032 | |||||||||
| 218,750 | 131,250 | (3) | 04/24/2033 | |||||||||
| 250,000 | 250,000 | (4) | 04/19/2034 | |||||||||
| - | 500,000 | (5) | 28/04/2035 | |||||||||
| - | 90,351 | (6) | N/A | |||||||||
| Gregory Burshtein | 20,000 | - | 01/17/2029 | |||||||||
| Chief of Research and Development | 18,900 | - | 03/16/2030 | |||||||||
| 51,000 | - | 04/07/2031 | ||||||||||
| 39,375 | 5,625 | (7) | 04/28/2032 | |||||||||
| 40,625 | 24,375 | (8) | 04/24/2033 | |||||||||
| 75,000 | 75,000 | (9) | 04/19/2034 | |||||||||
| 200,000 | (10) | 28/04/2035 | ||||||||||
| - | 13,158 | (11) | N/A | |||||||||
| Hillel Galitzer | 175,000 | - | 03/16/2030 | |||||||||
| Chief Operating Officer | 125,000 | - | 04/21/2031 | |||||||||
| 56,250 | 3,750 | (12) | 03/24/2032 | |||||||||
| 131,250 | 78,750 | (13) | 04/24/2033 | |||||||||
| 65,000 | 65,000 | (14) | 04/19/2034 | |||||||||
| 100,000 | (15) | 28/04/2035 | ||||||||||
| 13,158 | (16) | N/A | ||||||||||
| [1] | The Non-PEO NEOs for 2024 are Hillel Galitzer and Dana Yaacov-Garbeli. The non-PEO NEOs for 2025 are Hillel Galitzer and Gregory Burstein. |
| [2] | The dollar amounts reported herein represent the amount of total compensation reported for each covered fiscal year in the “Total” column of the Summary Compensation Table for each applicable year. |
| [3] | The dollar amounts reported below represent the amount of “compensation actually paid” to our PEO and Non-PEO NEOs (as an average) as computed in accordance with Item 402(v) of Regulation S-K, for each covered fiscal year. The dollar amounts do not reflect the actual amount of compensation earned or received by or paid to the PEOs and Non-PEO NEOs during the applicable fiscal year. For purposes of the equity award adjustments shown below, no equity awards were cancelled due to a failure to meet vesting conditions and no dividends or other earnings paid on share or option awards in the covered fiscal year prior to the vesting date were not otherwise included in the total compensation for the covered fiscal year. In calculating the “compensation actually paid” amounts reflected in these columns, the fair value or change in fair value, as applicable, of the equity award adjustments included in such calculations was computed in accordance with FASB ASC Topic 718. The valuation assumptions used to calculate such fair values did not materially differ from those disclosed at the time of grant. The following table details the applicable adjustments that were made to the determine “compensation actually paid” (all amounts are averages for Non-PEO NEOs). |
| [4] | The dollar amounts reported herein represent the average of the amounts of total compensation reported for our Non-PEO NEOs as a group for each covered fiscal year in the “Total” column of the Summary Compensation Table for each applicable year. |
| [5] | Cumulative total stockholder return (“TSR”) assumes $100 was invested on December 31, 2023 and is calculated by dividing the sum of the cumulative amount of dividends for the measurement period, assuming dividend reinvestment, and the difference between our share price at the end and the beginning of the measurement period (December 31, 2023) by our stock price at the beginning of the measurement period. At December 31, 2025, 2024 and 2023, the per share closing prices for our Ordinary Shares were $1.94, $2.28 and $0.60, respectively. No dividends were paid on share or option awards for all periods presented. |
| [6] | Net loss is reflected as reported in our audited consolidated financial statements for the applicable fiscal year. |