Shareholder Report
Mar. 31, 2026
USD ($)
$ / shares
WHAT WERE THE FUND COSTS FOR THE PAST YEAR? (based on a hypothetical $10,000 investment)
|
Class Name
|
Costs of a $10,000 investment
|
Costs paid as a percentage of a $10,000 investment
|
|
Investor Class
|
$98
|
0.90%
|
HOW DID THE FUND PERFORM OVER THE PAST YEAR AND WHAT AFFECTED PERFORMANCE?
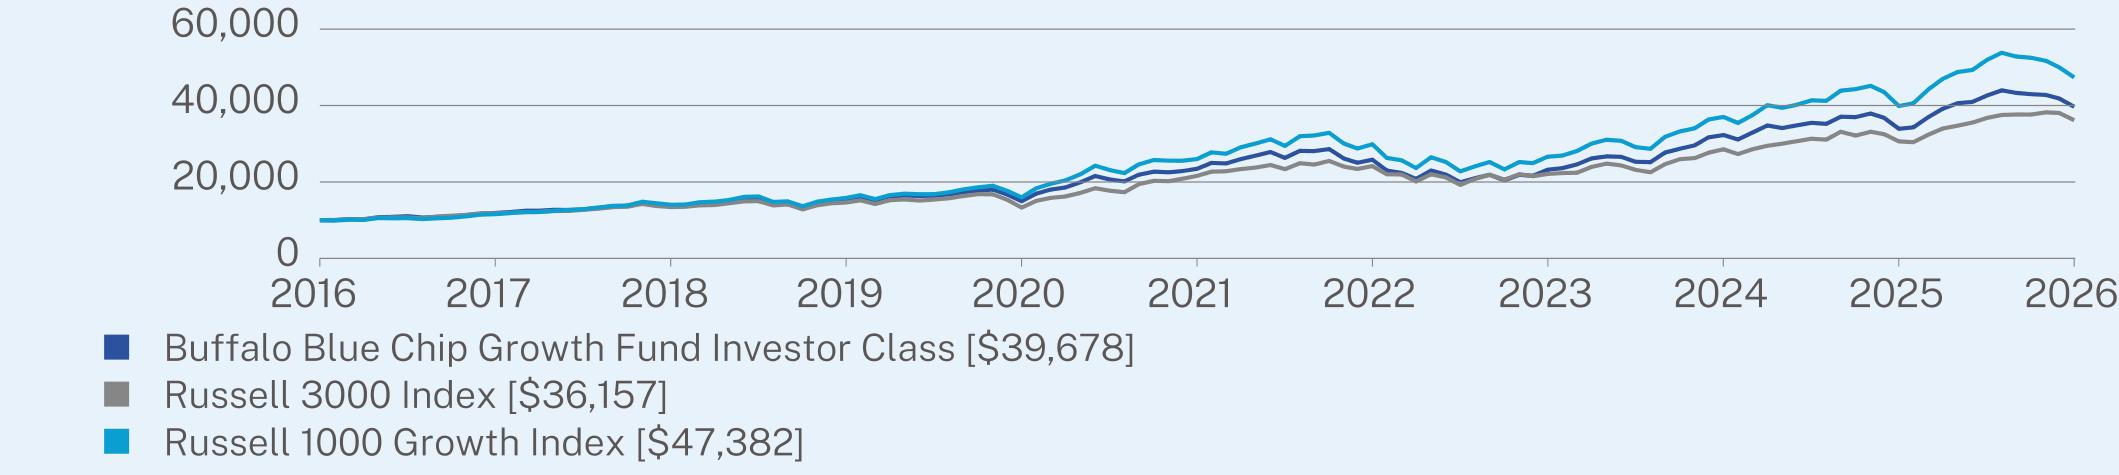
For the 12-month period ended March 31, 2026, the Fund produced a positive total return on an absolute basis, but underperformed its preferred benchmark, the Russell 1000® Growth Index (the “Index”).
WHAT FACTORS INFLUENCED PERFORMANCE?
U.S. equity markets advanced meaningfully for the 12-month period, fueled by robust corporate earnings, U.S. Gross Domestic Product (GDP) growth, and a resilient labor market. Megacap technology companies continued to dominate the headlines and led the market rally.
The Fund’s investments in Information Technology and Communication Services contributed to positive absolute performance during the period. Shares of NVIDIA, Alphabet, and Broadcom moved sharply higher, propelling the Fund’s performance over the 12-month period. However, performance compared to the Index lagged slightly due to weaker stock selection among the Fund’s Health Care and Consumer Discretionary investments. Within Consumer Discretionary, the Fund was underweight Tesla, which was a significant gainer for the Index. Within Health Care, the Fund’s investments in Abbott Laboratories, UnitedHealth Group, Boston Scientific, and others declined in value over the 12-month period, negatively impacting relative performance compared to the Index.
|
Top Contributors
|
|
|
↑
|
NVIDIA Corporation
|
|
↑
|
Alphabet, Inc.
|
|
↑
|
Broadcom, Inc.
|
|
↑
|
GE Vernova, Inc.
|
|
↑
|
Amazon.com, Inc.
|
|
Top Detractors
|
|
|
↓
|
UnitedHealth Group, Inc.
|
|
↓
|
Intuit, Inc.
|
|
↓
|
Arthur J. Gallagher & Co.
|
|
↓
|
ServiceNow, Inc.
|
|
↓
|
Zscaler, Inc.
|
ANNUAL AVERAGE TOTAL RETURN (%)
|
|
1 Year
|
5 Year
|
10 Year
|
|
Buffalo Blue Chip Growth Fund Investor Class
|
17.00
|
11.11
|
14.78
|
|
Russell 3000 Index
|
18.09
|
10.87
|
13.72
|
|
Russell 1000 Growth Index
|
18.81
|
12.76
|
16.83
|
Visit https://buffalofunds.com/overview/#performance-table for more recent performance information.
KEY FUND STATISTICS (as of March 31, 2026)
|
Net Assets
|
$159,055,130
|
|
Number of Holdings
|
88
|
|
Net Advisory Fee
|
$1,208,057
|
|
Portfolio Turnover Rate
|
52%
|
|
Weighted Average Market Capitalization
|
$1,789.18B
|
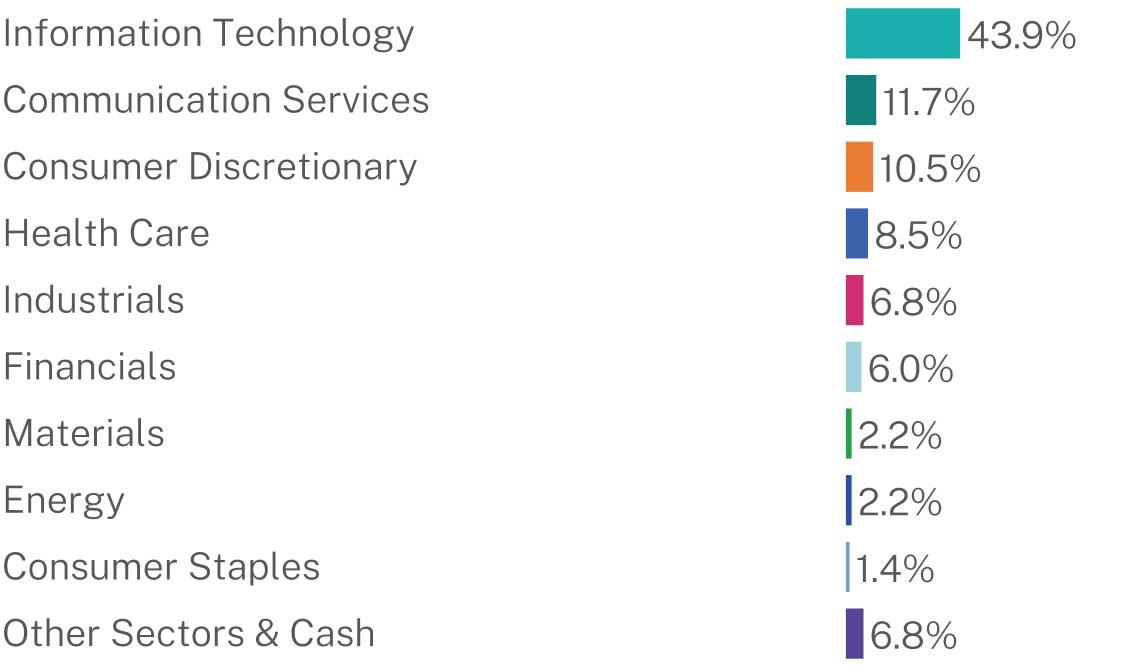
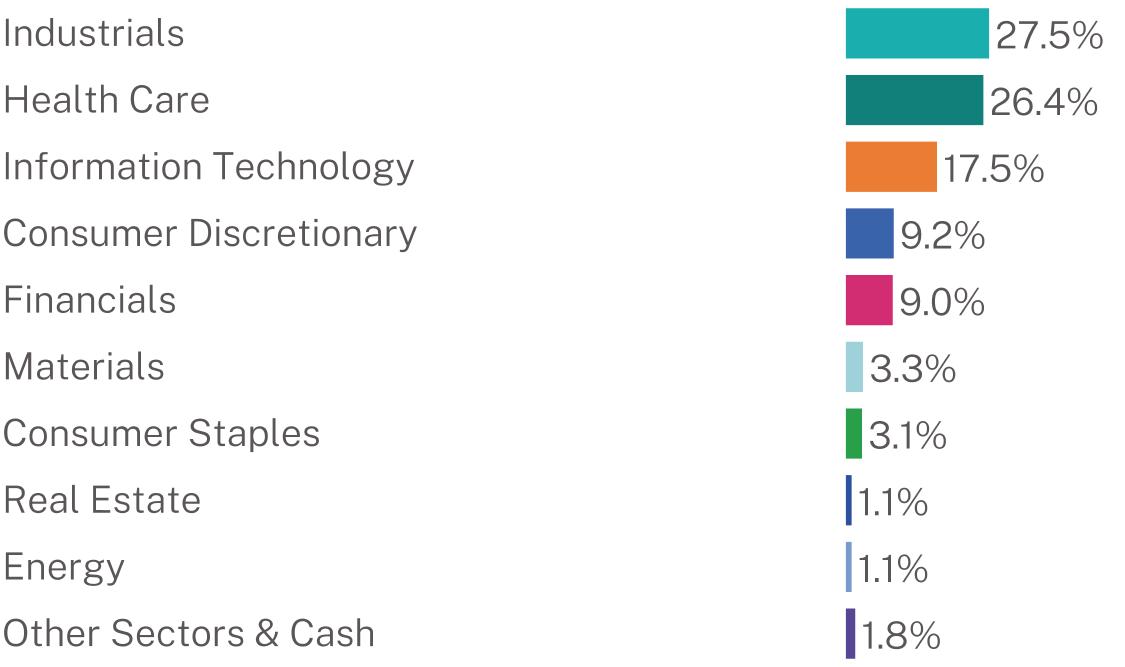
WHAT DID THE FUND INVEST IN? (% of net assets as of March 31, 2026)
|
Top 10 Issuers
|
(%)
|
|
NVIDIA Corp.
|
12.7%
|
|
Apple, Inc.
|
9.0%
|
|
Microsoft Corp.
|
7.9%
|
|
Alphabet, Inc.
|
6.3%
|
|
Fidelity Money Market Government Portfolio
|
5.4%
|
|
Amazon.com, Inc.
|
5.2%
|
|
Broadcom, Inc.
|
4.0%
|
|
Meta Platforms, Inc.
|
3.2%
|
|
Eli Lilly & Co.
|
2.4%
|
|
Mastercard, Inc.
|
1.6%
|
Sector Breakdown (%)†
WHAT WERE THE FUND COSTS FOR THE PAST YEAR? (based on a hypothetical $10,000 investment)
|
Class Name
|
Costs of a $10,000 investment
|
Costs paid as a percentage of a $10,000 investment
|
|
Institutional Class
|
$84
|
0.77%
|
HOW DID THE FUND PERFORM OVER THE PAST YEAR AND WHAT AFFECTED PERFORMANCE?
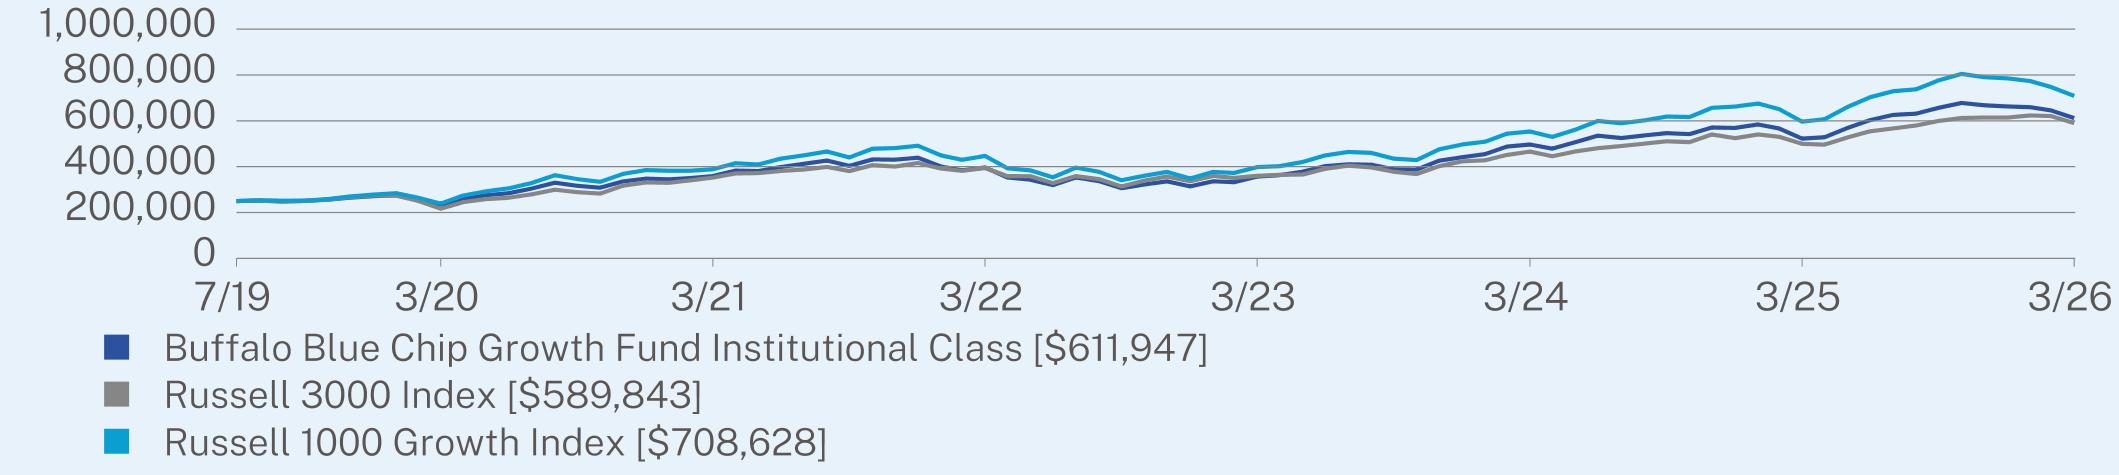
For the 12-month period ended March 31, 2026, the Fund produced a positive total return on an absolute basis, but underperformed its preferred benchmark, the Russell 1000® Growth Index (the “Index”).
WHAT FACTORS INFLUENCED PERFORMANCE?
U.S. equity markets advanced meaningfully for the 12-month period, fueled by robust corporate earnings, U.S. Gross Domestic Product (GDP) growth, and a resilient labor market. Megacap technology companies continued to dominate the headlines and led the market rally.
The Fund’s investments in Information Technology and Communication Services contributed to positive absolute performance during the period. Shares of NVIDIA, Alphabet, and Broadcom moved sharply higher, propelling the Fund’s performance over the 12-month period. However, performance compared to the Index lagged slightly due to weaker stock selection among the Fund’s Health Care and Consumer Discretionary investments. Within Consumer Discretionary, the Fund was underweight Tesla, which was a significant gainer for the Index. Within Health Care, the Fund’s investments in Abbott Laboratories, UnitedHealth Group, Boston Scientific, and others declined in value over the 12-month period, negatively impacting relative performance compared to the Index.
|
Top Contributors
|
|
|
↑
|
NVIDIA Corporation
|
|
↑
|
Alphabet, Inc.
|
|
↑
|
Broadcom, Inc.
|
|
↑
|
GE Vernova, Inc.
|
|
↑
|
Amazon.com, Inc.
|
|
Top Detractors
|
|
|
↓
|
UnitedHealth Group, Inc.
|
|
↓
|
Intuit, Inc.
|
|
↓
|
Arthur J. Gallagher & Co.
|
|
↓
|
ServiceNow, Inc.
|
|
↓
|
Zscaler, Inc.
|
ANNUAL AVERAGE TOTAL RETURN (%)
|
|
1 Year
|
5 Year
|
Since Inception
(07/01/2019) |
|
Buffalo Blue Chip Growth Fund Institutional Class
|
17.15
|
11.26
|
14.18
|
|
Russell 3000 Index
|
18.09
|
10.87
|
13.56
|
|
Russell 1000 Growth Index
|
18.81
|
12.76
|
16.69
|
Visit https://buffalofunds.com/overview/#performance-table for more recent performance information.
KEY FUND STATISTICS (as of March 31, 2026)
|
Net Assets
|
$159,055,130
|
|
Number of Holdings
|
88
|
|
Net Advisory Fee
|
$1,208,057
|
|
Portfolio Turnover Rate
|
52%
|
|
Weighted Average Market Capitalization
|
$1,789.18B
|
WHAT DID THE FUND INVEST IN? (% of net assets as of March 31, 2026)
|
Top 10 Issuers
|
(%)
|
|
NVIDIA Corp.
|
12.7%
|
|
Apple, Inc.
|
9.0%
|
|
Microsoft Corp.
|
7.9%
|
|
Alphabet, Inc.
|
6.3%
|
|
Fidelity Money Market Government Portfolio
|
5.4%
|
|
Amazon.com, Inc.
|
5.2%
|
|
Broadcom, Inc.
|
4.0%
|
|
Meta Platforms, Inc.
|
3.2%
|
|
Eli Lilly & Co.
|
2.4%
|
|
Mastercard, Inc.
|
1.6%
|
Sector Breakdown (%)†

This report describes changes to the Fund that occurred during the reporting period.
WHAT WERE THE FUND COSTS FOR THE PAST YEAR? (based on a hypothetical $10,000 investment)
|
Class Name
|
Costs of a $10,000 investment
|
Costs paid as a percentage of a $10,000 investment
|
|
Investor Class
|
$154
|
1.48%
|
HOW DID THE FUND PERFORM OVER THE PAST YEAR AND WHAT AFFECTED PERFORMANCE?
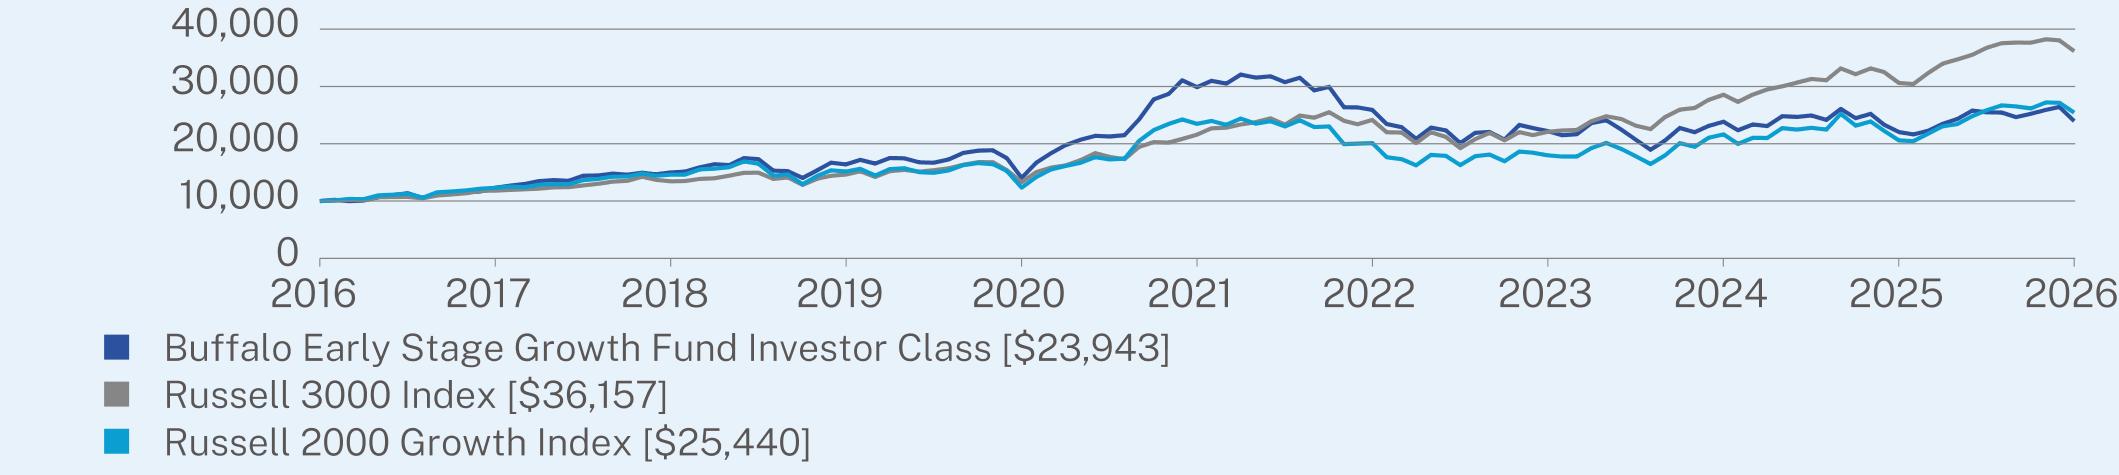
For the 12-month period ended March 31, 2026, the Fund delivered a positive total return on an absolute basis, but underperformed its preferred benchmark, the Russell 2000® Growth Index (the “Index”).
WHAT FACTORS INFLUENCED PERFORMANCE?
Quality, as a performance factor, continued to struggle during the review period. Leading contributors to the Index returns over the trailing 12-months were from companies that we consider speculative, and trading at valuations that are not digestible for professional, fundamental investors. The Fund’s underweight to these companies led to much of the underperformance compared to the Index.
The Fund’s investments within the Industrials sector were the largest contributors to positive absolute performance throughout the year with meaningful impact from Willdan Group, Sterling Infrastructure, and Kratos Defense & Security Solutions. However, performance compared to the Index lagged predominantly due to weak stock selection with the Fund’s Health Care holdings, which detracted from absolute and relative results during the period.
|
Top Contributors
|
|
|
↑
|
Applied Optoelectronics, Inc.
|
|
↑
|
Willdan Group, Inc.
|
|
↑
|
Sterling Infrastructure, Inc.
|
|
↑
|
nLIGHT, Inc.
|
|
↑
|
Kratos Defense & Security Solutions, Inc.
|
|
Top Detractors
|
|
|
↓
|
Compass Diversified Holdings
|
|
↓
|
Vertex, Inc.
|
|
↓
|
Grid Dynamics Holdings, Inc.
|
|
↓
|
HealthStream, Inc.
|
|
↓
|
Phreesia, Inc.
|
ANNUAL AVERAGE TOTAL RETURN (%)
|
|
1 Year
|
5 Year
|
10 Year
|
|
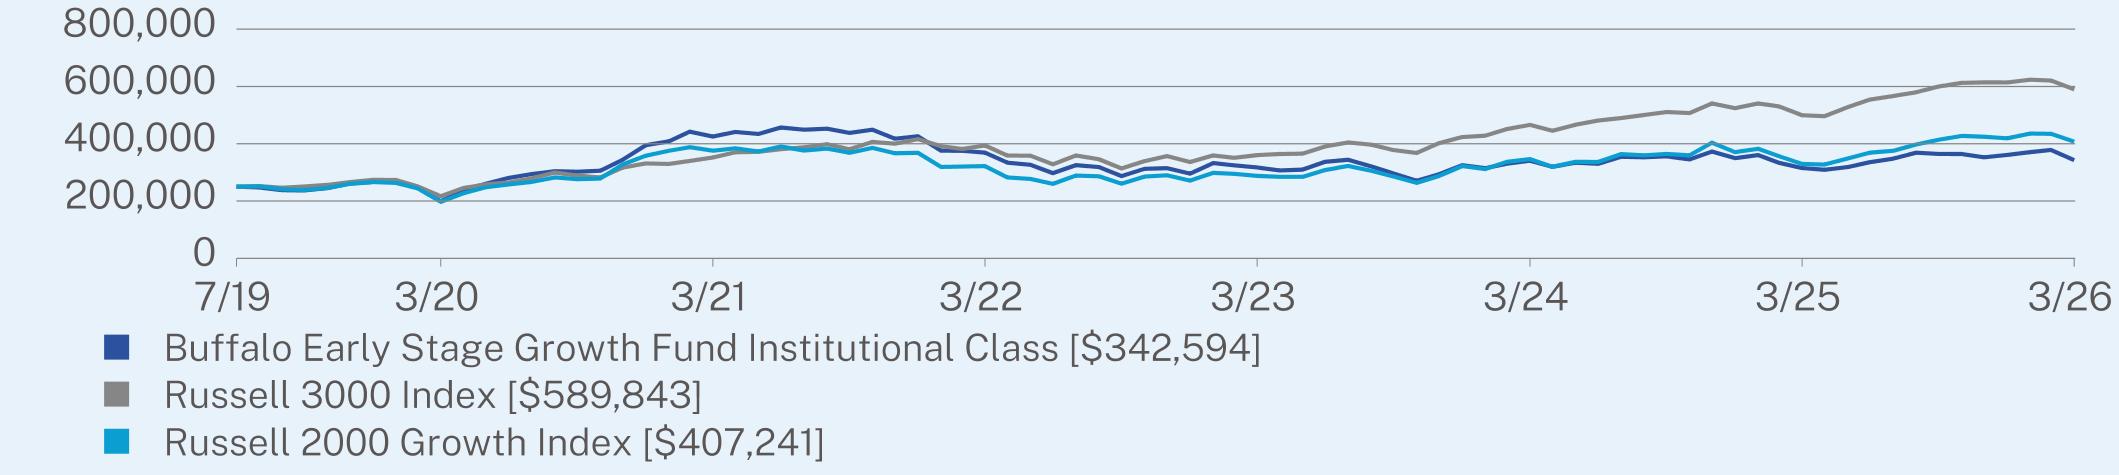
Buffalo Early Stage Growth Fund Investor Class
|
8.60
|
-4.33
|
9.12
|
|
Russell 3000 Index
|
18.09
|
10.87
|
13.72
|
|
Russell 2000 Growth Index
|
23.58
|
1.62
|
9.79
|
Visit https://buffalofunds.com/overview/#performance-table for more recent performance information.
KEY FUND STATISTICS (as of March 31, 2026)
|
Net Assets
|
$61,185,554
|
|
Number of Holdings
|
73
|
|
Net Advisory Fee
|
$856,925
|
|
Portfolio Turnover Rate
|
48%
|
|
Weighted Average Market Capitalization
|
$1.99B
|
WHAT DID THE FUND INVEST IN? (% of net assets as of March 31, 2026)
|
Top 10 Issuers
|
(%)
|
|
OneSpaWorld Holdings Ltd.
|
2.7%
|
|
WisdomTree, Inc.
|
2.6%
|
|
Guardian Pharmacy Services, Inc.
|
2.6%
|
|
LeMaitre Vascular, Inc.
|
2.3%
|
|
Cardinal Infrastructure Group, Inc.
|
2.2%
|
|
Transcat, Inc.
|
2.2%
|
|
Patrick Industries, Inc.
|
2.0%
|
|
Champion Homes, Inc.
|
2.0%
|
|
TAT Technologies Ltd.
|
2.0%
|
|
American Superconductor Corp.
|
1.9%
|
Sector Breakdown (%)†
HOW HAS THE FUND CHANGED?
This is a summary of certain changes to the Fund since March 31, 2025. For more complete information, you may review the Fund’s prospectus at https://buffalofunds.com/wp-content/uploads/pdf/Buffalo-Prospectus-Final.pdf. You may also obtain a copy of the prospectus by calling 800-492-8332.
FUND PORTFOLIO MANAGER CHANGES
Effective May 5, 2025, Mr. Tim Miller was named portfolio manager of the Fund. Concurrently, Messrs. Craig Richard and Doug Cartwright ceased serving as co-portfolio managers of the Fund.
This report describes changes to the Fund that occurred during the reporting period.
WHAT WERE THE FUND COSTS FOR THE PAST YEAR? (based on a hypothetical $10,000 investment)
|
Class Name
|
Costs of a $10,000 investment
|
Costs paid as a percentage of a $10,000 investment
|
|
Institutional Class
|
$141
|
1.35%
|
HOW DID THE FUND PERFORM OVER THE PAST YEAR AND WHAT AFFECTED PERFORMANCE?
For the 12-month period ended March 31, 2026, the Fund delivered a positive total return on an absolute basis, but underperformed its preferred benchmark, the Russell 2000® Growth Index (the “Index”).
WHAT FACTORS INFLUENCED PERFORMANCE?
Quality, as a performance factor, continued to struggle during the review period. Leading contributors to the Index returns over the trailing 12-months were from companies that we consider speculative, and trading at valuations that are not digestible for professional, fundamental investors. The Fund’s underweight to these companies led to much of the underperformance compared to the Index.
The Fund’s investments within the Industrials sector were the largest contributors to positive absolute performance throughout the year with meaningful impact from Willdan Group, Sterling Infrastructure, and Kratos Defense & Security Solutions. However, performance compared to the Index lagged predominantly due to weak stock selection with the Fund’s Health Care holdings, which detracted from absolute and relative results during the period.
|
Top Contributors
|
|
|
↑
|
Applied Optoelectronics, Inc.
|
|
↑
|
Willdan Group, Inc.
|
|
↑
|
Sterling Infrastructure, Inc.
|
|
↑
|
nLIGHT, Inc.
|
|
↑
|
Kratos Defense & Security Solutions, Inc.
|
|
Top Detractors
|
|
|
↓
|
Compass Diversified Holdings
|
|
↓
|
Vertex, Inc.
|
|
↓
|
Grid Dynamics Holdings, Inc.
|
|
↓
|
HealthStream, Inc.
|
|
↓
|
Phreesia, Inc.
|
ANNUAL AVERAGE TOTAL RETURN (%)
|
|
1 Year
|
5 Year
|
Since Inception
(07/01/2019) |
|
Buffalo Early Stage Growth Fund Institutional Class
|
8.73
|
-4.23
|
4.78
|
|
Russell 3000 Index
|
18.09
|
10.87
|
13.56
|
|
Russell 2000 Growth Index
|
23.58
|
1.62
|
7.50
|
Visit https://buffalofunds.com/overview/#performance-table for more recent performance information.
KEY FUND STATISTICS (as of March 31, 2026)
|
Net Assets
|
$61,185,554
|
|
Number of Holdings
|
73
|
|
Net Advisory Fee
|
$856,925
|
|
Portfolio Turnover Rate
|
48%
|
|
Weighted Average Market Capitalization
|
$1.99B
|
WHAT DID THE FUND INVEST IN? (% of net assets as of March 31, 2026)
|
Top 10 Issuers
|
(%)
|
|
OneSpaWorld Holdings Ltd.
|
2.7%
|
|
WisdomTree, Inc.
|
2.6%
|
|
Guardian Pharmacy Services, Inc.
|
2.6%
|
|
LeMaitre Vascular, Inc.
|
2.3%
|
|
Cardinal Infrastructure Group, Inc.
|
2.2%
|
|
Transcat, Inc.
|
2.2%
|
|
Patrick Industries, Inc.
|
2.0%
|
|
Champion Homes, Inc.
|
2.0%
|
|
TAT Technologies Ltd.
|
2.0%
|
|
American Superconductor Corp.
|
1.9%
|
Sector Breakdown (%)†

HOW HAS THE FUND CHANGED?
This is a summary of certain changes to the Fund since March 31, 2025. For more complete information, you may review the Fund’s prospectus at https://buffalofunds.com/wp-content/uploads/pdf/Buffalo-Prospectus-Final.pdf. You may also obtain a copy of the prospectus by calling 800-492-8332.
FUND PORTFOLIO MANAGER CHANGES
Effective May 5, 2025, Mr. Tim Miller was named portfolio manager of the Fund. Concurrently, Messrs. Craig Richard and Doug Cartwright ceased serving as co-portfolio managers of the Fund.
WHAT WERE THE FUND COSTS FOR THE PAST YEAR? (based on a hypothetical $10,000 investment)
|
Class Name
|
Costs of a $10,000 investment
|
Costs paid as a percentage of a $10,000 investment
|
|
Investor Class
|
$107
|
1.00%
|
HOW DID THE FUND PERFORM OVER THE PAST YEAR AND WHAT AFFECTED PERFORMANCE?
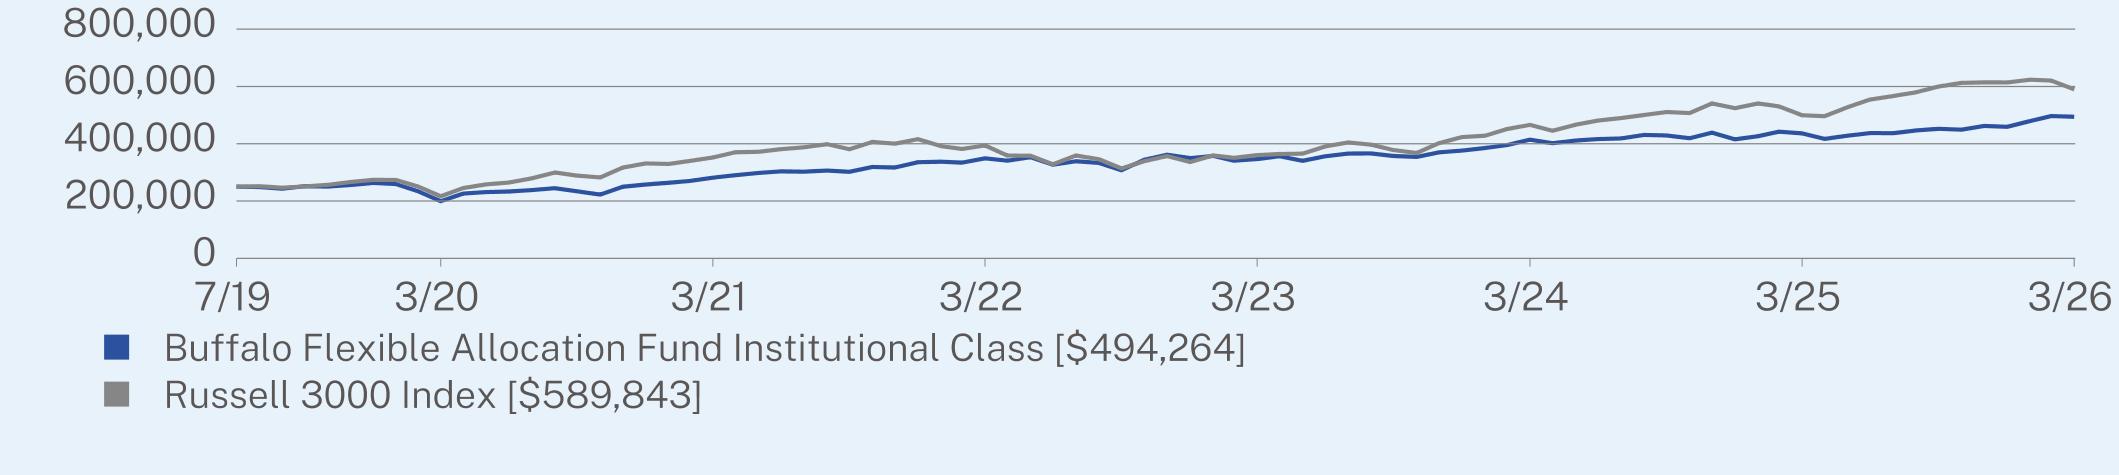
For the 12-month period ended March 31, 2026, the Fund produced a positive total return on an absolute basis, but underperformed the preferred benchmark, the Russell 3000® Index (the “Index”).
WHAT FACTORS INFLUENCED PERFORMANCE?
U.S. equity markets advanced meaningfully for the 12-month period, fueled by robust corporate earnings, U.S. Gross Domestic Product (GDP) growth, and a resilient labor market. Megacap technology companies continued to dominate the headlines and led the market rally.
The Fund’s investments within the Energy sector were the largest contributors to positive absolute performance throughout the fiscal year with meaningful impact from specific energy companies like Chevron, Exxon Mobil, and APA Corporation, among others. However, performance compared to the Index lagged largely due to structural portfolio construction differences. The Fund has dividend income characteristics which impacted relative performance compared to the Index, which included a concentration of growth stocks inappropriate for this portfolio.
|
Top Contributors
|
|
|
↑
|
Chevron Corporation
|
|
↑
|
Exxon Mobil Corporation
|
|
↑
|
APA Corporation
|
|
↑
|
Johnson & Johnson
|
|
↑
|
Eli Lilly and Company
|
|
Top Detractors
|
|
|
↓
|
Arthur J. Gallagher & Co.
|
|
↓
|
General Mills, Inc.
|
|
↓
|
Kimberly-Clark Corporation
|
|
↓
|
Clorox Company
|
|
↓
|
Abbott Laboratories
|
ANNUAL AVERAGE TOTAL RETURN (%)
|
|
1 Year
|
5 Year
|
10 Year
|
|
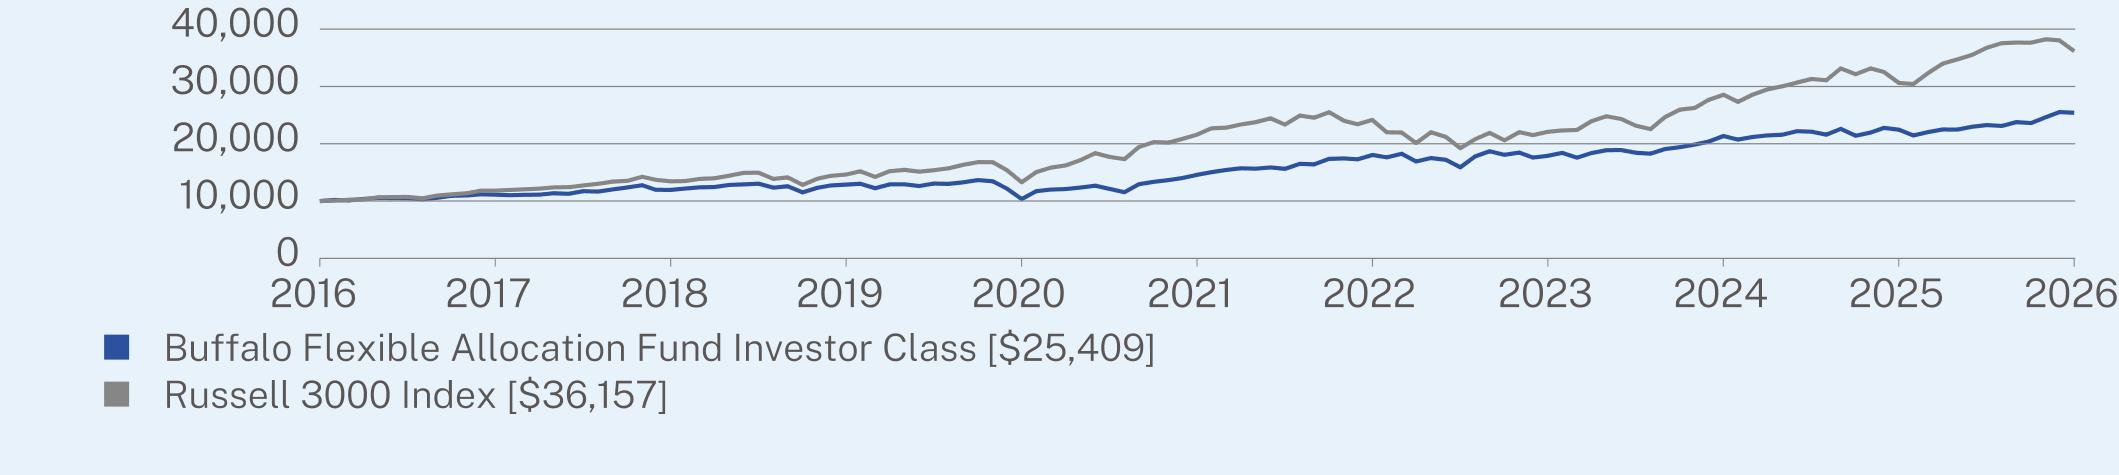
Buffalo Flexible Allocation Fund Investor Class
|
13.15
|
11.76
|
9.77
|
|
Russell 3000 Index
|
18.09
|
10.87
|
13.72
|
Visit https://buffalofunds.com/overview/#performance-table for more recent performance information.
KEY FUND STATISTICS (as of March 31, 2026)
|
Net Assets
|
$463,995,476
|
|
Number of Holdings
|
43
|
|
Net Advisory Fee
|
$3,836,214
|
|
Portfolio Turnover Rate
|
0%
|
|
Weighted Average Market Capitalization
|
$448.44B
|
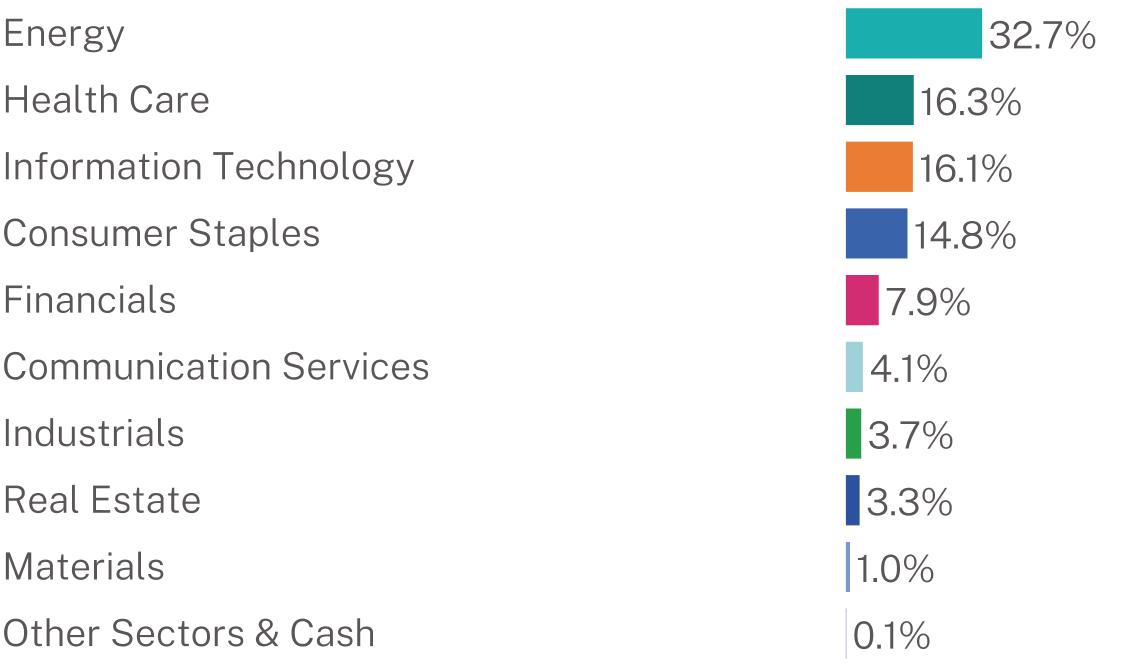
WHAT DID THE FUND INVEST IN? (% of net assets as of March 31, 2026)
|
Top 10 Issuers
|
(%)
|
|
Chevron Corp.
|
9.6%
|
|
Microsoft Corp.
|
7.2%
|
|
Exxon Mobil Corp.
|
5.7%
|
|
Eli Lilly & Co.
|
5.2%
|
|
Costco Wholesale Corp.
|
4.3%
|
|
ConocoPhillips
|
4.3%
|
|
Kinder Morgan, Inc.
|
4.0%
|
|
International Business Machines Corp.
|
3.7%
|
|
Johnson & Johnson
|
3.6%
|
|
Allstate Corp.
|
3.6%
|
Sector Breakdown (%)†
WHAT WERE THE FUND COSTS FOR THE PAST YEAR? (based on a hypothetical $10,000 investment)
|
Class Name
|
Costs of a $10,000 investment
|
Costs paid as a percentage of a $10,000 investment
|
|
Institutional Class
|
$92
|
0.86%
|
HOW DID THE FUND PERFORM OVER THE PAST YEAR AND WHAT AFFECTED PERFORMANCE?
For the 12-month period ended March 31, 2026, the Fund produced a positive total return on an absolute basis, but underperformed the preferred benchmark, the Russell 3000® Index (the “Index”).
WHAT FACTORS INFLUENCED PERFORMANCE?
U.S. equity markets advanced meaningfully for the 12-month period, fueled by robust corporate earnings, U.S. Gross Domestic Product (GDP) growth, and a resilient labor market. Megacap technology companies continued to dominate the headlines and led the market rally.
The Fund’s investments within the Energy sector were the largest contributors to positive absolute performance throughout the fiscal year with meaningful impact from specific energy companies like Chevron, Exxon Mobil, and APA Corporation, among others. However, performance compared to the Index lagged largely due to structural portfolio construction differences. The Fund has dividend income characteristics which impacted relative performance compared to the Index, which included a concentration of growth stocks inappropriate for this portfolio.
|
Top Contributors
|
|
|
↑
|
Chevron Corporation
|
|
↑
|
Exxon Mobil Corporation
|
|
↑
|
APA Corporation
|
|
↑
|
Johnson & Johnson
|
|
↑
|
Eli Lilly and Company
|
|
Top Detractors
|
|
|
↓
|
Arthur J. Gallagher & Co.
|
|
↓
|
General Mills, Inc.
|
|
↓
|
Kimberly-Clark Corporation
|
|
↓
|
Clorox Company
|
|
↓
|
Abbott Laboratories
|
ANNUAL AVERAGE TOTAL RETURN (%)
|
|
1 Year
|
5 Year
|
Since Inception
(07/01/2019) |
|
Buffalo Flexible Allocation Fund Institutional Class
|
13.30
|
11.91
|
10.62
|
|
Russell 3000 Index
|
18.09
|
10.87
|
13.56
|
Visit https://buffalofunds.com/overview/#performance-table for more recent performance information.
KEY FUND STATISTICS (as of March 31, 2026)
|
Net Assets
|
$463,995,476
|
|
Number of Holdings
|
43
|
|
Net Advisory Fee
|
$3,836,214
|
|
Portfolio Turnover Rate
|
0%
|
|
Weighted Average Market Capitalization
|
$448.44B
|
WHAT DID THE FUND INVEST IN? (% of net assets as of March 31, 2026)
|
Top 10 Issuers
|
(%)
|
|
Chevron Corp.
|
9.6%
|
|
Microsoft Corp.
|
7.2%
|
|
Exxon Mobil Corp.
|
5.7%
|
|
Eli Lilly & Co.
|
5.2%
|
|
Costco Wholesale Corp.
|
4.3%
|
|
ConocoPhillips
|
4.3%
|
|
Kinder Morgan, Inc.
|
4.0%
|
|
International Business Machines Corp.
|
3.7%
|
|
Johnson & Johnson
|
3.6%
|
|
Allstate Corp.
|
3.6%
|
Sector Breakdown (%)†

This report describes changes to the Fund that occurred during the reporting period.
WHAT WERE THE FUND COSTS FOR THE PAST YEAR? (based on a hypothetical $10,000 investment)
|
Class Name
|
Costs of a $10,000 investment
|
Costs paid as a percentage of a $10,000 investment
|
|
Investor Class
|
$94
|
0.90%
|
HOW DID THE FUND PERFORM OVER THE PAST YEAR AND WHAT AFFECTED PERFORMANCE?
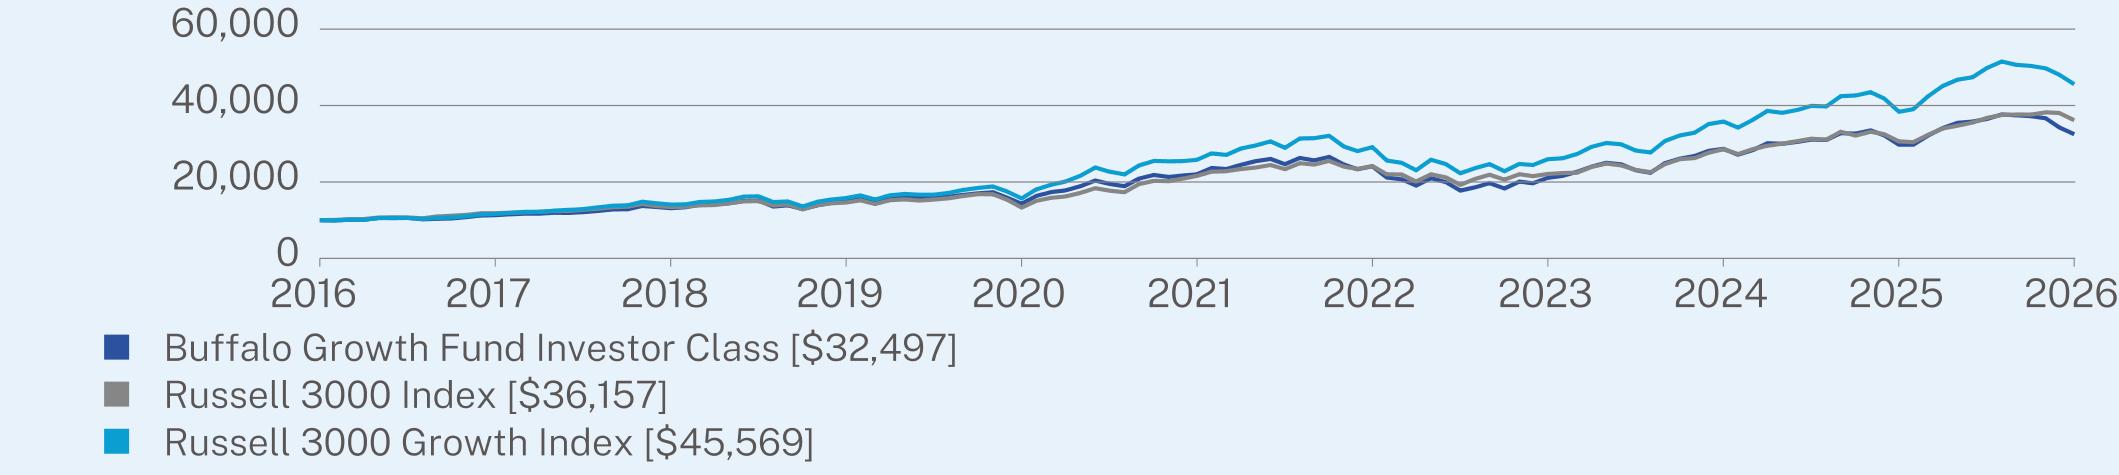
For the 12-month period ended March 31, 2026, the Fund produced a positive total return on an absolute basis, but underperformed its preferred benchmark, the Russell 3000® Growth Index (the “Index”).
WHAT FACTORS INFLUENCED PERFORMANCE?
U.S. equity markets advanced meaningfully for the 12-month period, fueled by robust corporate earnings, U.S. Gross Domestic Product (GDP) growth, and a resilient labor market. Megacap technology companies continued to dominate the headlines and led the market rally.
The Fund’s investments in Information Technology and Communication Services contributed to positive absolute performance during the period. Shares of NVIDIA, Alphabet, and Broadcom moved sharply higher, propelling the Fund’s performance over the 12-month period. However, performance compared to the Index lagged slightly due to weaker stock selection among the Fund’s Information Technology, Industrials, and Health Care investments. In Information Technology, the Fund had a positive absolute return, but was underweight Broadcom, which was a significant gainer for the Index. Within Industrials, the Fund’s investments in TransUnion, Copart, and Verisk Analytics declined in value over the 12-month period. Within Health Care, the Fund’s investments in UnitedHealth Group and others also experienced share price declines, negatively impacting relative performance compared to the Index.
|
Top Contributors
|
|
|
↑
|
NVIDIA Corporation
|
|
↑
|
Alphabet, Inc. Class A
|
|
↑
|
Alphabet, Inc. Class C
|
|
↑
|
Broadcom, Inc.
|
|
↑
|
Microsoft Corporation
|
|
Top Detractors
|
|
|
↓
|
UnitedHealth Group, Inc.
|
|
↓
|
Gartner, Inc.
|
|
↓
|
CoStar Group, Inc.
|
|
↓
|
Shift4 Payments, Inc.
|
|
↓
|
Copart, Inc.
|
ANNUAL AVERAGE TOTAL RETURN (%)
|
|
1 Year
|
5 Year
|
10 Year
|
|
Buffalo Growth Fund Investor Class
|
9.21
|
8.11
|
12.51
|
|
Russell 3000 Index
|
18.09
|
10.87
|
13.72
|
|
Russell 3000 Growth Index
|
18.75
|
12.05
|
16.38
|
Visit https://buffalofunds.com/overview/#performance-table for more recent performance information.
KEY FUND STATISTICS (as of March 31, 2026)
|
Net Assets
|
$161,245,953
|
|
Number of Holdings
|
39
|
|
Net Advisory Fee
|
$1,358,206
|
|
Portfolio Turnover Rate
|
10%
|
|
Weighted Average Market Capitalization
|
$1,900.11B
|
WHAT DID THE FUND INVEST IN? (% of net assets as of March 31, 2026)
|
Top 10 Issuers
|
(%)
|
|
NVIDIA Corp.
|
13.5%
|
|
Microsoft Corp.
|
10.2%
|
|
Alphabet, Inc.
|
10.2%
|
|
Amazon.com, Inc.
|
9.4%
|
|
Apple, Inc.
|
9.1%
|
|
Meta Platforms, Inc.
|
5.6%
|
|
Broadcom, Inc.
|
3.8%
|
|
Visa, Inc.
|
2.8%
|
|
Mastercard, Inc.
|
2.6%
|
|
Uber Technologies, Inc.
|
1.8%
|
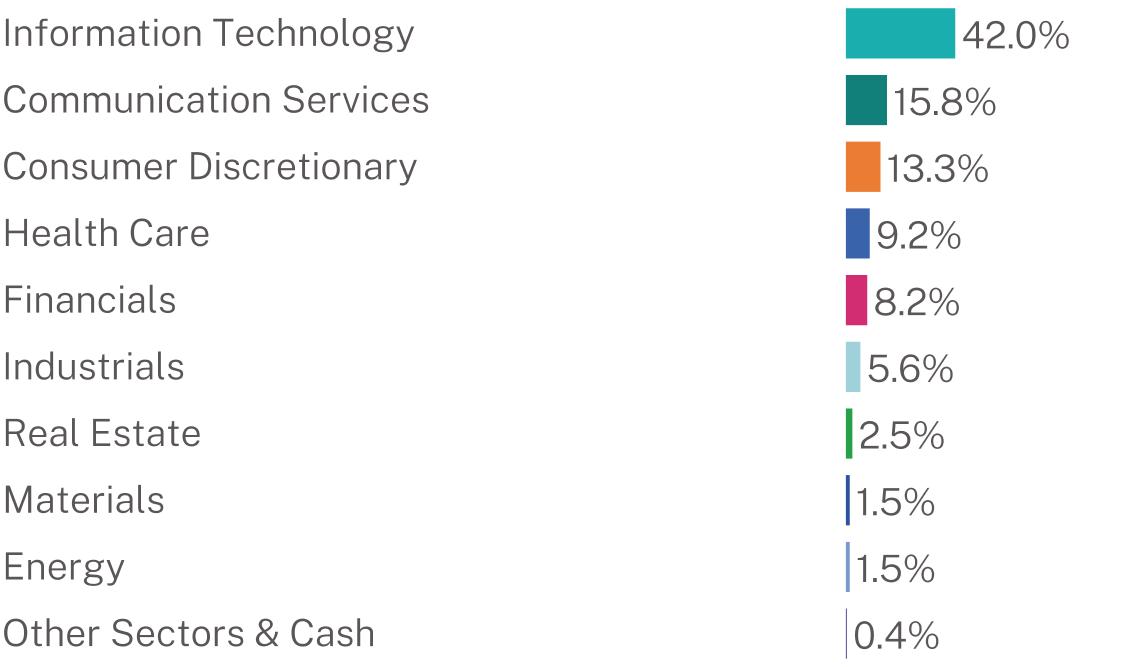
Sector Breakdown (%)†

HOW HAS THE FUND CHANGED?
This is a summary of certain changes to the Fund since March 31, 2025. For more complete information, you may review the Fund’s prospectus at https://buffalofunds.com/wp-content/uploads/pdf/Buffalo-Prospectus-Final.pdf. You may also obtain a copy of the prospectus by calling 800-492-8332.
FUND PORTFOLIO MANAGER CHANGES
Effective January 2, 2026, Mr. Doug Cartwright replaced Mr. Dave Carlsen as a co-portfolio manager of the Fund. Effective March 9, 2026, Mr. Cartwright no longer serves in that role. Mr. Josh West continues to serve as a portfolio manager of the Fund.
This report describes changes to the Fund that occurred during the reporting period.
WHAT WERE THE FUND COSTS FOR THE PAST YEAR? (based on a hypothetical $10,000 investment)
|
Class Name
|
Costs of a $10,000 investment
|
Costs paid as a percentage of a $10,000 investment
|
|
Institutional Class
|
$81
|
0.77%
|
HOW DID THE FUND PERFORM OVER THE PAST YEAR AND WHAT AFFECTED PERFORMANCE?
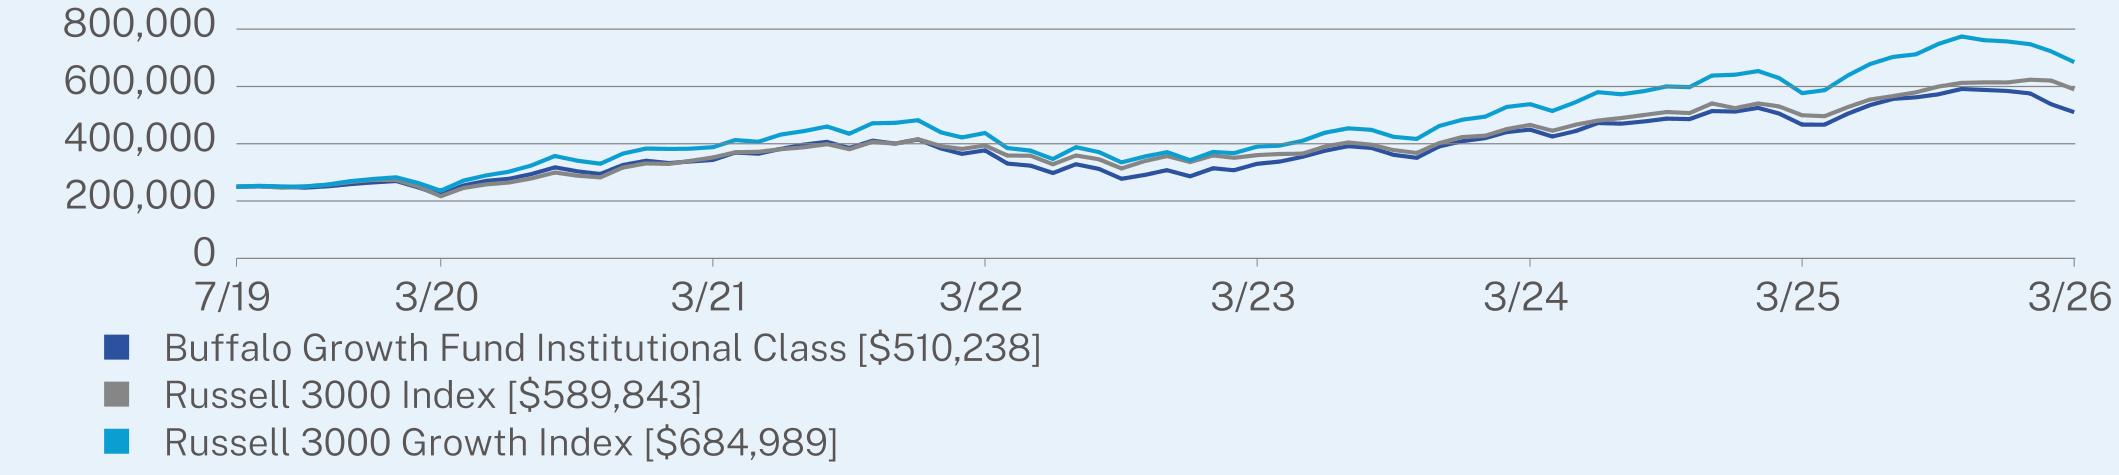
For the 12-month period ended March 31, 2026, the Fund produced a positive total return on an absolute basis, but underperformed its preferred benchmark, the Russell 3000® Growth Index (the “Index”).
WHAT FACTORS INFLUENCED PERFORMANCE?
U.S. equity markets advanced meaningfully for the 12-month period, fueled by robust corporate earnings, U.S. Gross Domestic Product (GDP) growth, and a resilient labor market. Megacap technology companies continued to dominate the headlines and led the market rally.
The Fund’s investments in Information Technology and Communication Services contributed to positive absolute performance during the period. Shares of NVIDIA, Alphabet, and Broadcom moved sharply higher, propelling the Fund’s performance over the 12-month period. However, performance compared to the Index lagged slightly due to weaker stock selection among the Fund’s Information Technology, Industrials, and Health Care investments. In Information Technology, the Fund had a positive absolute return, but was underweight Broadcom, which was a significant gainer for the Index. Within Industrials, the Fund’s investments in TransUnion, Copart, and Verisk Analytics declined in value over the 12-month period. Within Health Care, the Fund’s investments in UnitedHealth Group and others also experienced share price declines, negatively impacting relative performance compared to the Index.
|
Top Contributors
|
|
|
↑
|
NVIDIA Corporation
|
|
↑
|
Alphabet, Inc. Class A
|
|
↑
|
Alphabet, Inc. Class C
|
|
↑
|
Broadcom, Inc.
|
|
↑
|
Microsoft Corporation
|
|
Top Detractors
|
|
|
↓
|
UnitedHealth Group, Inc.
|
|
↓
|
Gartner, Inc.
|
|
↓
|
CoStar Group, Inc.
|
|
↓
|
Shift4 Payments, Inc.
|
|
↓
|
Copart, Inc.
|
ANNUAL AVERAGE TOTAL RETURN (%)
|
|
1 Year
|
5 Year
|
Since Inception
(07/01/2019) |
|
Buffalo Growth Fund Institutional Class
|
9.32
|
8.23
|
11.15
|
|
Russell 3000 Index
|
18.09
|
10.87
|
13.56
|
|
Russell 3000 Growth Index
|
18.75
|
12.05
|
16.10
|
Visit https://buffalofunds.com/overview/#performance-table for more recent performance information.
KEY FUND STATISTICS (as of March 31, 2026)
|
Net Assets
|
$161,245,953
|
|
Number of Holdings
|
39
|
|
Net Advisory Fee
|
$1,358,206
|
|
Portfolio Turnover Rate
|
10%
|
|
Weighted Average Market Capitalization
|
$1,900.11B
|
WHAT DID THE FUND INVEST IN? (% of net assets as of March 31, 2026)
|
Top 10 Issuers
|
(%)
|
|
NVIDIA Corp.
|
13.5%
|
|
Microsoft Corp.
|
10.2%
|
|
Alphabet, Inc.
|
10.2%
|
|
Amazon.com, Inc.
|
9.4%
|
|
Apple, Inc.
|
9.1%
|
|
Meta Platforms, Inc.
|
5.6%
|
|
Broadcom, Inc.
|
3.8%
|
|
Visa, Inc.
|
2.8%
|
|
Mastercard, Inc.
|
2.6%
|
|
Uber Technologies, Inc.
|
1.8%
|
Sector Breakdown (%)†
HOW HAS THE FUND CHANGED?
This is a summary of certain changes to the Fund since March 31, 2025. For more complete information, you may review the Fund’s prospectus at https://buffalofunds.com/wp-content/uploads/pdf/Buffalo-Prospectus-Final.pdf. You may also obtain a copy of the prospectus by calling 800-492-8332.
FUND PORTFOLIO MANAGER CHANGES
Effective January 2, 2026, Mr. Doug Cartwright replaced Mr. Dave Carlsen as a co-portfolio manager of the Fund. Effective March 9, 2026, Mr. Cartwright no longer serves in that role. Mr. Josh West continues to serve as a portfolio manager of the Fund.
WHAT WERE THE FUND COSTS FOR THE PAST YEAR? (based on a hypothetical $10,000 investment)
|
Class Name
|
Costs of a $10,000 investment
|
Costs paid as a percentage of a $10,000 investment
|
|
Investor Class
|
$95
|
0.91%
|
HOW DID THE FUND PERFORM OVER THE PAST YEAR AND WHAT AFFECTED PERFORMANCE?
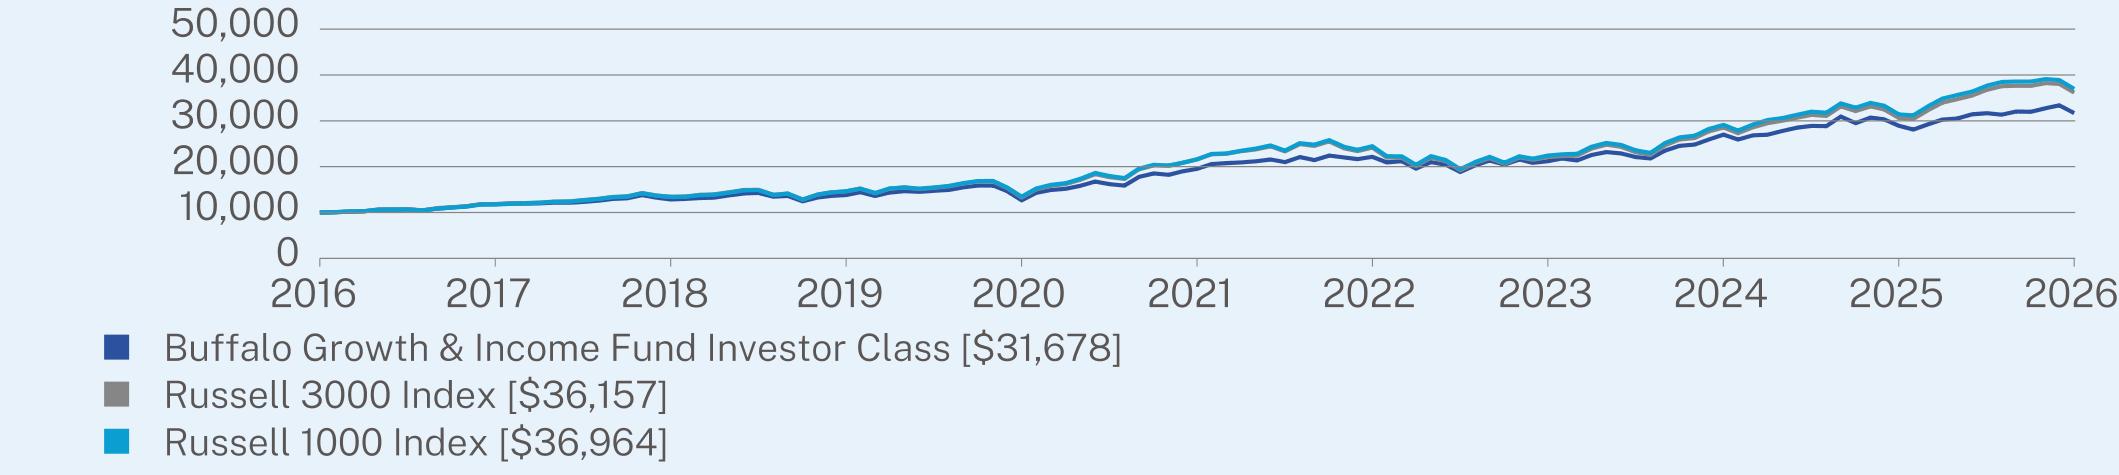
For the 12-month period ended March 31, 2026, the Fund produced a positive total return on an absolute basis, but underperformed its preferred benchmark, the Russell 1000® Index (the “Index”).
WHAT FACTORS INFLUENCED PERFORMANCE?
U.S. equity markets advanced meaningfully for the 12-month period, fueled by robust corporate earnings, U.S. Gross Domestic Product (GDP) growth, and a resilient labor market. Megacap technology companies continued to dominate the headlines and led the market rally.
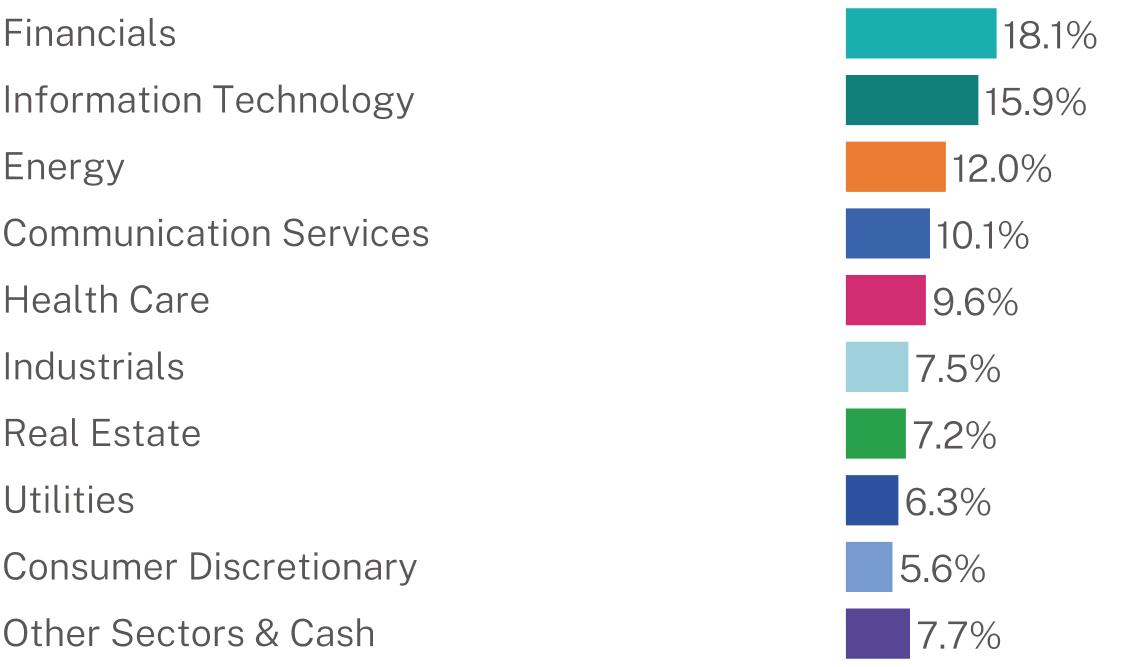
The Fund’s investments within the Information Technology, Communication Services, and Energy sectors were the largest contributors to positive absolute performance throughout the fiscal year. The Fund had a meaningful positive impact from companies like Apple, NVIDIA, Marathon Petroleum, Valero Energy, and Alphabet. However, performance compared to the Index lagged due to structural portfolio construction differences. The Fund has dividend income characteristics which impacted relative performance compared to the Index, which included a concentration of growth stocks inappropriate for this portfolio.
|
Top Contributors
|
|
|
↑
|
Lumentum Holdings, Inc. 0.5% 15-Dec-2026
|
|
↑
|
Alphabet, Inc. Class C
|
|
↑
|
Alphabet, Inc. Class A
|
|
↑
|
Parker-Hannifin Corporation
|
|
↑
|
Marathon Petroleum Corporation
|
|
Top Detractors
|
|
|
↓
|
UnitedHealth Group, Inc.
|
|
↓
|
Primo Brands Corporation
|
|
↓
|
Burford Capital Limited
|
|
↓
|
Arthur J. Gallagher & Co.
|
|
↓
|
Compass Diversified Holdings
|
ANNUAL AVERAGE TOTAL RETURN (%)
|
|
1 Year
|
5 Year
|
10 Year
|
|
Buffalo Growth & Income Fund Investor Class
|
9.54
|
10.16
|
12.22
|
|
Russell 3000 Index
|
18.09
|
10.87
|
13.72
|
|
Russell 1000 Index
|
17.74
|
11.34
|
13.97
|
Visit https://buffalofunds.com/overview/#performance-table for more recent performance information.
KEY FUND STATISTICS (as of March 31, 2026)
|
Net Assets
|
$166,751,114
|
|
Number of Holdings
|
86
|
|
Net Advisory Fee
|
$1,301,809
|
|
Portfolio Turnover Rate
|
4%
|
|
Weighted Average Market Capitalization
|
$698.81B
|
WHAT DID THE FUND INVEST IN? (% of net assets as of March 31, 2026)
|
Top 10 Issuers
|
(%)
|
|
Apple, Inc.
|
4.7%
|
|
Meta Platforms, Inc.
|
4.6%
|
|
Alphabet, Inc.
|
4.4%
|
|
Microsoft Corp.
|
4.1%
|
|
Royal Caribbean Cruises Ltd.
|
2.8%
|
|
Lumentum Holdings, Inc.
|
2.8%
|
|
Viper Energy, Inc.
|
2.5%
|
|
JPMorgan Chase & Co.
|
2.5%
|
|
Visa, Inc.
|
2.3%
|
|
HCA Healthcare, Inc.
|
2.3%
|
Sector Breakdown (%)†
WHAT WERE THE FUND COSTS FOR THE PAST YEAR? (based on a hypothetical $10,000 investment)
|
Class Name
|
Costs of a $10,000 investment
|
Costs paid as a percentage of a $10,000 investment
|
|
Institutional Class
|
$81
|
0.77%
|
HOW DID THE FUND PERFORM OVER THE PAST YEAR AND WHAT AFFECTED PERFORMANCE?
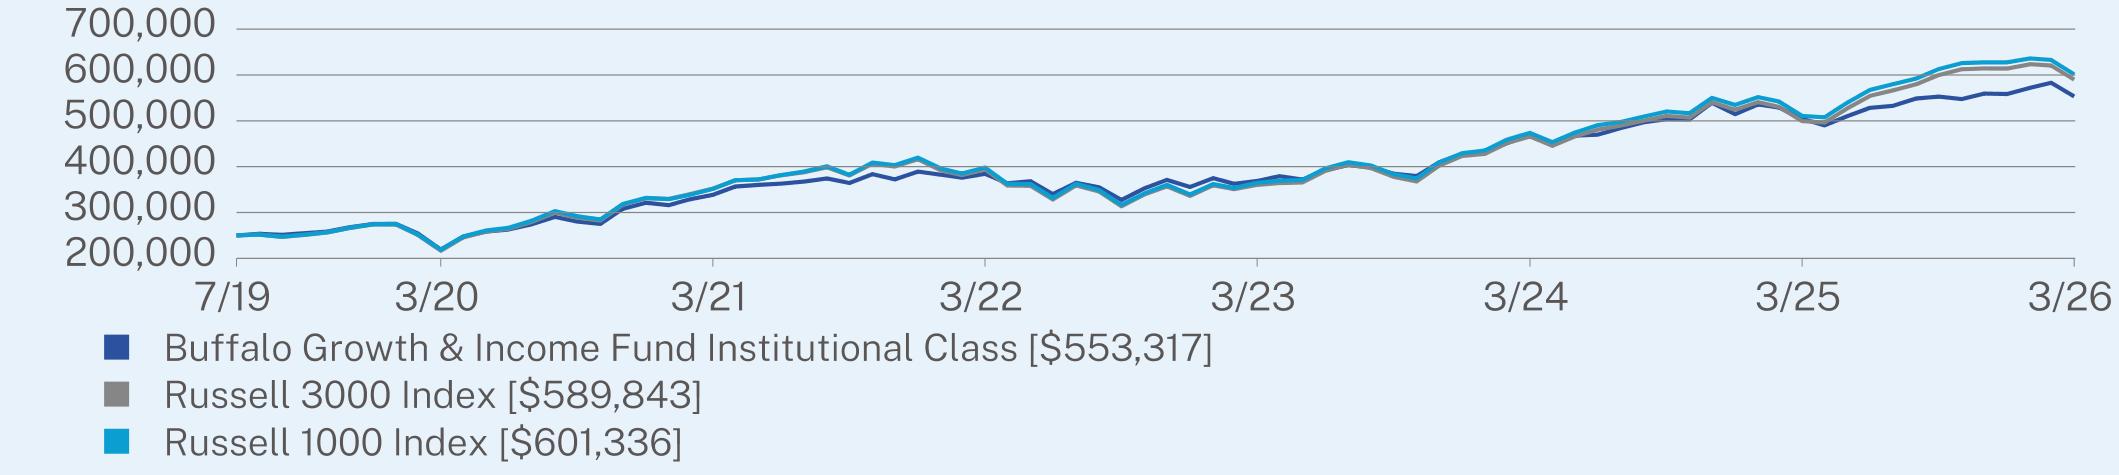
For the 12-month period ended March 31, 2026, the Fund produced a positive total return on an absolute basis, but underperformed its preferred benchmark, the Russell 1000® Index (the “Index”).
WHAT FACTORS INFLUENCED PERFORMANCE?
U.S. equity markets advanced meaningfully for the 12-month period, fueled by robust corporate earnings, U.S. Gross Domestic Product (GDP) growth, and a resilient labor market. Megacap technology companies continued to dominate the headlines and led the market rally.
The Fund’s investments within the Information Technology, Communication Services, and Energy sectors were the largest contributors to positive absolute performance throughout the fiscal year. The Fund had a meaningful positive impact from companies like Apple, NVIDIA, Marathon Petroleum, Valero Energy, and Alphabet. However, performance compared to the Index lagged due to structural portfolio construction differences. The Fund has dividend income characteristics which impacted relative performance compared to the Index, which included a concentration of growth stocks inappropriate for this portfolio.
|
Top Contributors
|
|
|
↑
|
Lumentum Holdings, Inc. 0.5% 15-Dec-2026
|
|
↑
|
Alphabet, Inc. Class C
|
|
↑
|
Alphabet, Inc. Class A
|
|
↑
|
Parker-Hannifin Corporation
|
|
↑
|
Marathon Petroleum Corporation
|
|
Top Detractors
|
|
|
↓
|
UnitedHealth Group, Inc.
|
|
↓
|
Primo Brands Corporation
|
|
↓
|
Burford Capital Limited
|
|
↓
|
Arthur J. Gallagher & Co.
|
|
↓
|
Compass Diversified Holdings
|
ANNUAL AVERAGE TOTAL RETURN (%)
|
|
1 Year
|
5 Year
|
Since Inception
(07/01/2019) |
|
Buffalo Growth & Income Fund Institutional Class
|
9.68
|
10.32
|
12.49
|
|
Russell 3000 Index
|
18.09
|
10.87
|
13.56
|
|
Russell 1000 Index
|
17.74
|
11.34
|
13.88
|
Visit https://buffalofunds.com/overview/#performance-table for more recent performance information.
KEY FUND STATISTICS (as of March 31, 2026)
|
Net Assets
|
$166,751,114
|
|
Number of Holdings
|
86
|
|
Net Advisory Fee
|
$1,301,809
|
|
Portfolio Turnover Rate
|
4%
|
|
Weighted Average Market Capitalization
|
$698.81B
|
WHAT DID THE FUND INVEST IN? (% of net assets as of March 31, 2026)
|
Top 10 Issuers
|
(%)
|
|
Apple, Inc.
|
4.7%
|
|
Meta Platforms, Inc.
|
4.6%
|
|
Alphabet, Inc.
|
4.4%
|
|
Microsoft Corp.
|
4.1%
|
|
Royal Caribbean Cruises Ltd.
|
2.8%
|
|
Lumentum Holdings, Inc.
|
2.8%
|
|
Viper Energy, Inc.
|
2.5%
|
|
JPMorgan Chase & Co.
|
2.5%
|
|
Visa, Inc.
|
2.3%
|
|
HCA Healthcare, Inc.
|
2.3%
|
Sector Breakdown (%)†

WHAT WERE THE FUND COSTS FOR THE PAST YEAR? (based on a hypothetical $10,000 investment)
|
Class Name
|
Costs of a $10,000 investment
|
Costs paid as a percentage of a $10,000 investment
|
|
Investor Class
|
$103
|
1.01%
|
HOW DID THE FUND PERFORM OVER THE PAST YEAR AND WHAT AFFECTED PERFORMANCE?
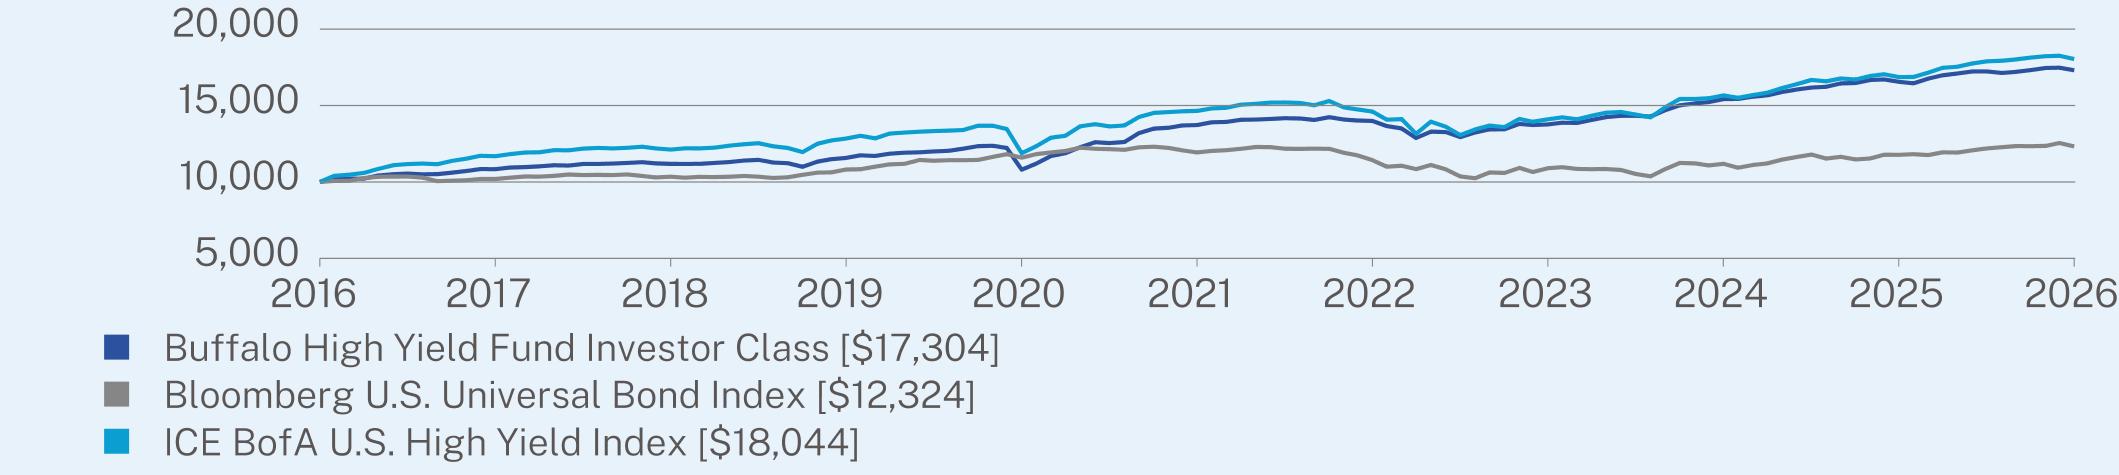
For the 12-month period ended March 31, 2026, the Fund produced a positive total return on an absolute basis, but underperformed the preferred benchmark, the ICE BofA U.S. High Yield Index.
WHAT FACTORS INFLUENCED PERFORMANCE?
U.S. high yield bonds, as an asset class, delivered a positive total return for the 12-month period. Positive macroeconomic data, cooling inflation pressure throughout much of the period, and interest rate cuts from the Federal Reserve supported gains for high yield bonds throughout the 12-month period. However, during the first quarter of 2026, the final quarter of the 12-month period, the conflict in the Middle East caused crude oil prices to spike, pushed interest rates higher, and generated large retail outflows in the high yield space, which muted gains for high yield bonds during the 12-month period.
|
Top Contributors
|
|
|
↑
|
Saturn Oil & Gas, Inc. 9.625% 15-Jun-2029
|
|
↑
|
Mirum Pharmaceuticals, Inc. 4.0% 01-May-2029
|
|
↑
|
Amneal Pharmaceuticals LLC Term Loan 04-May-2028
|
|
↑
|
Verde Purchaser LLC Term Loan 30-Nov-2030
|
|
↑
|
Viking Baked Goods Acquisition Corporation 8.625% 01-Nov-2031
|
|
Top Detractors
|
|
|
↓
|
OT Midco, Inc. 10.0% 15-Feb-2030
|
|
↓
|
First Brands Group LLC Term Loan 30-Mar-2027
|
|
↓
|
Kronos Acquisition Holdings, Inc. 10.75% 30-Jun-2032
|
|
↓
|
Stride, Inc. 1.125% 01-Sep-2027
|
|
↓
|
Townsquare Media, Inc. Term Loan 19-Feb-2030
|
ANNUAL AVERAGE TOTAL RETURN (%)
|
|
1 Year
|
5 Year
|
10 Year
|
|
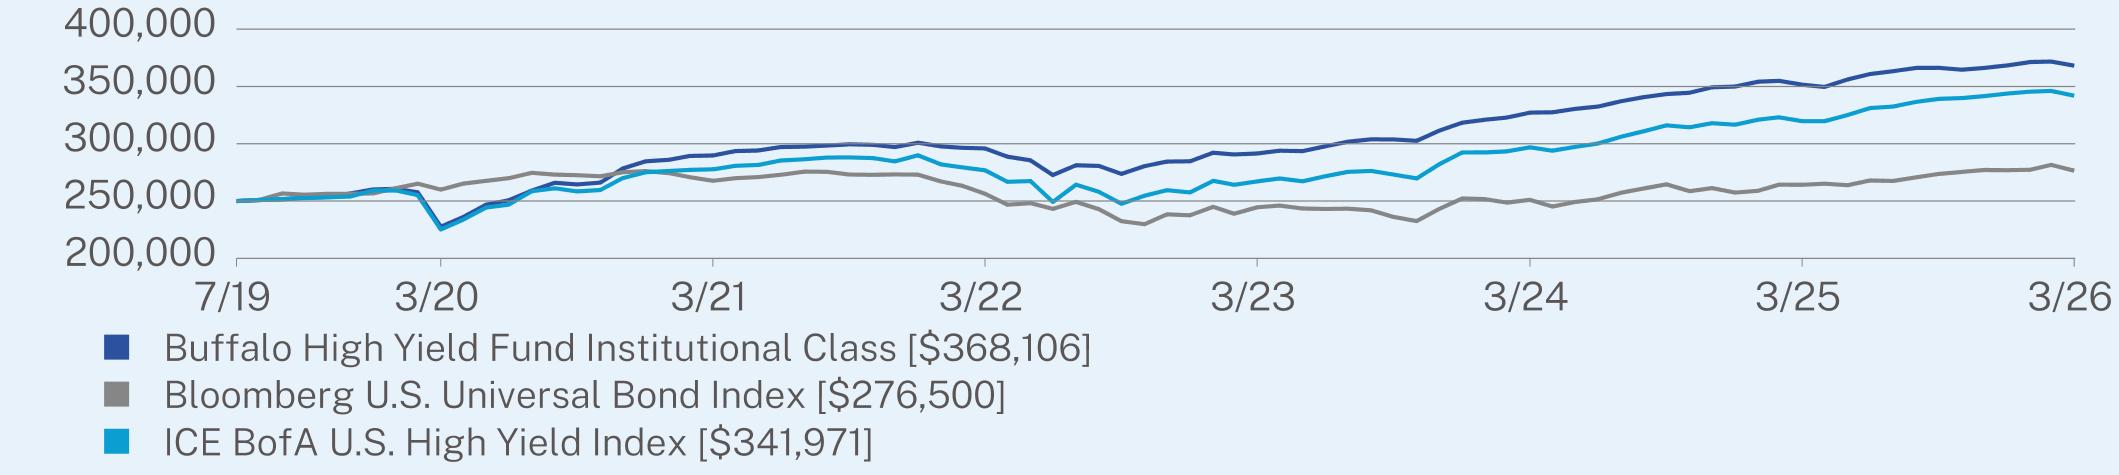
Buffalo High Yield Fund Investor Class
|
4.55
|
4.75
|
5.64
|
|
Bloomberg U.S. Universal Bond Index
|
4.64
|
0.65
|
2.11
|
|
ICE BofA U.S. High Yield Index
|
6.98
|
4.25
|
6.08
|
Visit https://buffalofunds.com/overview/#performance-table for more recent performance information.
KEY FUND STATISTICS (as of March 31, 2026)
|
Net Assets
|
$661,053,833
|
|
Number of Holdings
|
170
|
|
Net Advisory Fee
|
$5,810,056
|
|
Portfolio Turnover Rate
|
39%
|
|
Average Duration
|
2.04 years
|
|
Average Maturity
|
4.46 years
|
|
30-Day SEC Yield
|
6.78%
|
WHAT DID THE FUND INVEST IN? (% of net assets as of March 31, 2026)
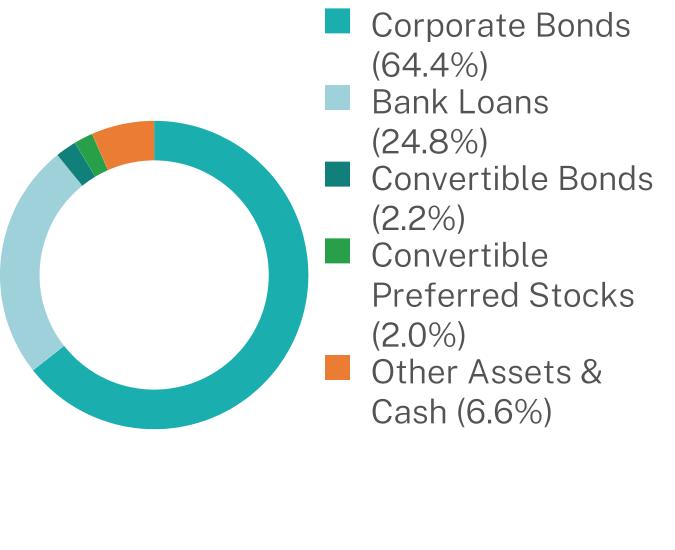
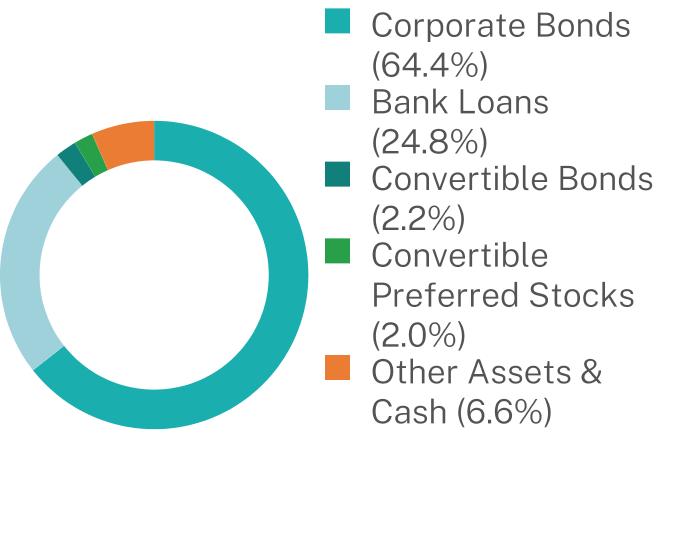
Asset Allocation (%)
Sector Breakdown (%)†

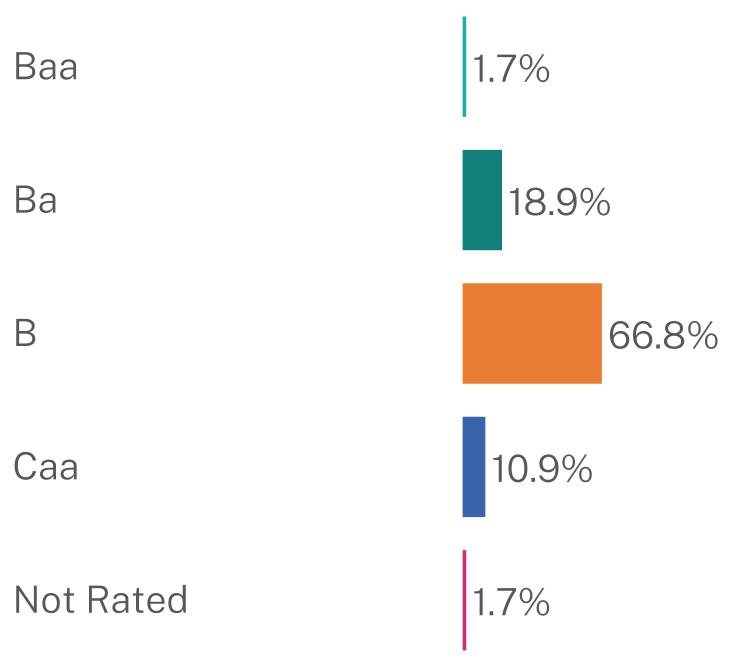
Credit Quality Breakdown (%)‡
WHAT WERE THE FUND COSTS FOR THE PAST YEAR? (based on a hypothetical $10,000 investment)
|
Class Name
|
Costs of a $10,000 investment
|
Costs paid as a percentage of a $10,000 investment
|
|
Institutional Class
|
$88
|
0.86%
|
HOW DID THE FUND PERFORM OVER THE PAST YEAR AND WHAT AFFECTED PERFORMANCE?
For the 12-month period ended March 31, 2026, the Fund produced a positive total return on an absolute basis, but underperformed the preferred benchmark, the ICE BofA U.S. High Yield Index.
WHAT FACTORS INFLUENCED PERFORMANCE?
U.S. high yield bonds, as an asset class, delivered a positive total return for the 12-month period. Positive macroeconomic data, cooling inflation pressure throughout much of the period, and interest rate cuts from the Federal Reserve supported gains for high yield bonds throughout the 12-month period. However, during the first quarter of 2026, the final quarter of the 12-month period, the conflict in the Middle East caused crude oil prices to spike, pushed interest rates higher, and generated large retail outflows in the high yield space, which muted gains for high yield bonds during the 12-month period.
|
Top Contributors
|
|
|
↑
|
Saturn Oil & Gas, Inc. 9.625% 15-Jun-2029
|
|
↑
|
Mirum Pharmaceuticals, Inc. 4.0% 01-May-2029
|
|
↑
|
Amneal Pharmaceuticals LLC Term Loan 04-May-2028
|
|
↑
|
Verde Purchaser LLC Term Loan 30-Nov-2030
|
|
↑
|
Viking Baked Goods Acquisition Corporation 8.625% 01-Nov-2031
|
|
Top Detractors
|
|
|
↓
|
OT Midco, Inc. 10.0% 15-Feb-2030
|
|
↓
|
First Brands Group LLC Term Loan 30-Mar-2027
|
|
↓
|
Kronos Acquisition Holdings, Inc. 10.75% 30-Jun-2032
|
|
↓
|
Stride, Inc. 1.125% 01-Sep-2027
|
|
↓
|
Townsquare Media, Inc. Term Loan 19-Feb-2030
|
ANNUAL AVERAGE TOTAL RETURN (%)
|
|
1 Year
|
5 Year
|
Since Inception
(07/01/2019) |
|
Buffalo High Yield Fund Institutional Class
|
4.70
|
4.90
|
5.90
|
|
Bloomberg U.S. Universal Bond Index
|
4.64
|
0.65
|
1.50
|
|
ICE BofA U.S. High Yield Index
|
6.98
|
4.25
|
4.75
|
Visit https://buffalofunds.com/overview/#performance-table for more recent performance information.
KEY FUND STATISTICS (as of March 31, 2026)
|
Net Assets
|
$661,053,833
|
|
Number of Holdings
|
170
|
|
Net Advisory Fee
|
$5,810,056
|
|
Portfolio Turnover Rate
|
39%
|
|
Average Duration
|
2.04 years
|
|
Average Maturity
|
4.46 years
|
|
30-Day SEC Yield
|
6.93%
|
WHAT DID THE FUND INVEST IN? (% of net assets as of March 31, 2026)
Asset Allocation (%)
Sector Breakdown (%)†
Credit Quality Breakdown (%)‡

WHAT WERE THE FUND COSTS FOR THE PAST YEAR? (based on a hypothetical $10,000 investment)
|
Class Name
|
Costs of a $10,000 investment
|
Costs paid as a percentage of a $10,000 investment
|
|
Investor Class
|
$108
|
1.03%
|
HOW DID THE FUND PERFORM OVER THE PAST YEAR AND WHAT AFFECTED PERFORMANCE?
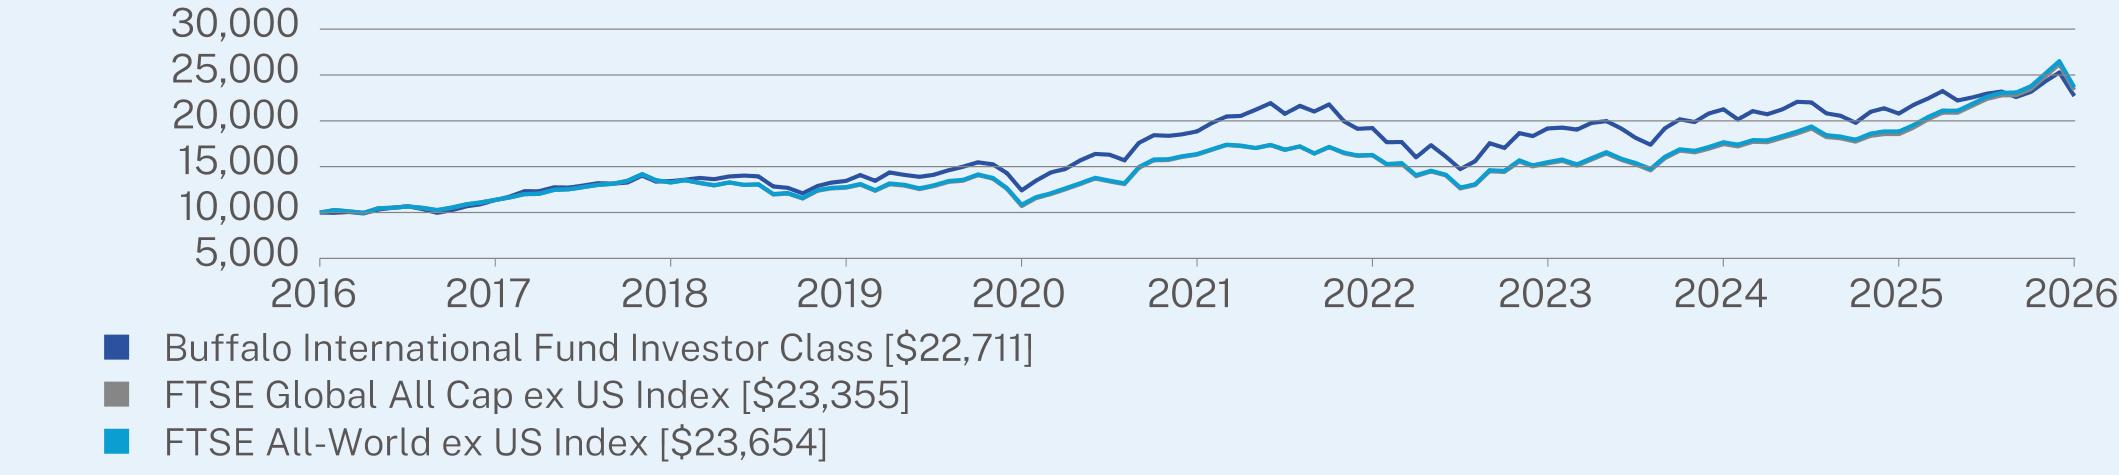
For the 12-month period ended March 31, 2026, the Fund produced a positive total return on an absolute basis, but underperformed the preferred benchmark, the FTSE All-World ex US Index (the “Index”).
WHAT FACTORS INFLUENCED PERFORMANCE?
The Fund’s investments within the Information Technology and Industrials sectors were the largest contributors to positive absolute performance throughout the year. Semiconductor companies SK hynix, Taiwan Semiconductor, and ASML were standout performers. Shares of Disco Corporation within Industrials also advanced sharply throughout the year. However, performance compared to the Index lagged due to weak stock selection in other areas of the portfolio, such as Financials. Shares of insurer Aon declined during period as did London Stock Exchange Group in Capital Markets. The Fund was also significantly underweight Banks compared to the Index which was a headwind to relative performance as that group rallied significantly across the 12-month period. By and large, the Fund’s growth profile detracted from relative results. Cyclical sectors of the Index advanced including Energy and Financials where the Fund is traditionally underweight.
|
Top Contributors
|
|
|
↑
|
SK hynix, Inc.
|
|
↑
|
Taiwan Semiconductor Manufacturing Co. Ltd. Sponsored ADR
|
|
↑
|
ASML Holding NV Sponsored ADR
|
|
↑
|
Samsung Electronics Co. Ltd.
|
|
↑
|
Disco Corporation
|
|
Top Detractors
|
|
|
↓
|
SAP SE Sponsored ADR
|
|
↓
|
Constellation Software, Inc.
|
|
↓
|
BayCurrent, Inc.
|
|
↓
|
Novo Nordisk A/S Sponsored ADR
|
|
↓
|
Adyen NV
|
ANNUAL AVERAGE TOTAL RETURN (%)
|
|
1 Year
|
5 Year
|
10 Year
|
|
Buffalo International Fund Investor Class
|
9.21
|
3.80
|
8.55
|
|
FTSE Global All Cap ex US Index
|
25.86
|
7.45
|
8.85
|
|
FTSE All-World ex US Index
|
25.56
|
7.63
|
8.99
|
Visit https://buffalofunds.com/overview/#performance-table for more recent performance information.
KEY FUND STATISTICS (as of March 31, 2026)
|
Net Assets
|
$797,692,203
|
|
Number of Holdings
|
75
|
|
Net Advisory Fee
|
$7,653,958
|
|
Portfolio Turnover Rate
|
16%
|
|
Weighted Average Market Capitalization
|
$211.87B
|
WHAT DID THE FUND INVEST IN? (% of net assets as of March 31, 2026)
|
Top 10 Issuers
|
(%)
|
|
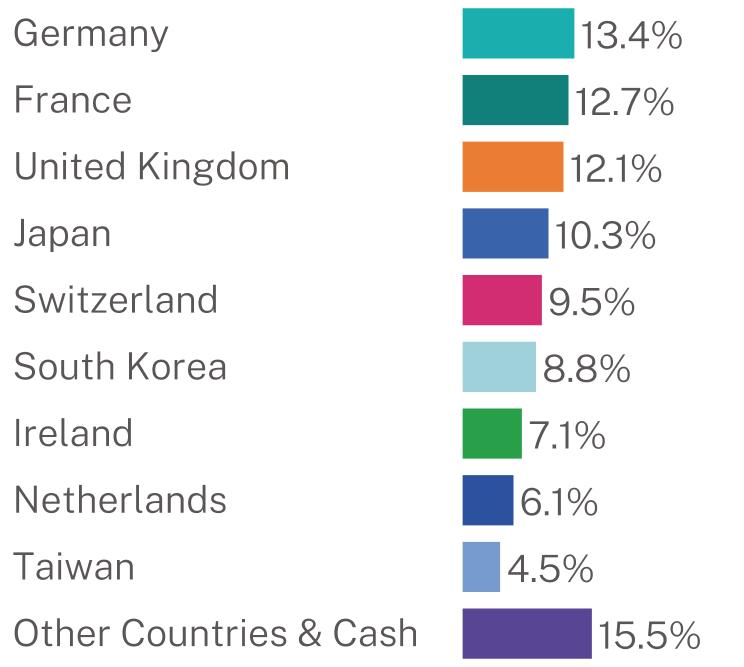
SK hynix, Inc.
|
5.6%
|
|
Taiwan Semiconductor Manufacturing Co. Ltd.
|
4.5%
|
|
Fidelity Money Market Government Portfolio
|
3.7%
|
|
Samsung Electronics Co. Ltd.
|
3.2%
|
|
Schneider Electric SE
|
3.0%
|
|
ASML Holding NV - NY Shares
|
2.9%
|
|
AstraZeneca PLC
|
2.8%
|
|
Lonza Group AG
|
2.6%
|
|
MercadoLibre, Inc.
|
2.4%
|
|
Siemens AG
|
2.3%
|
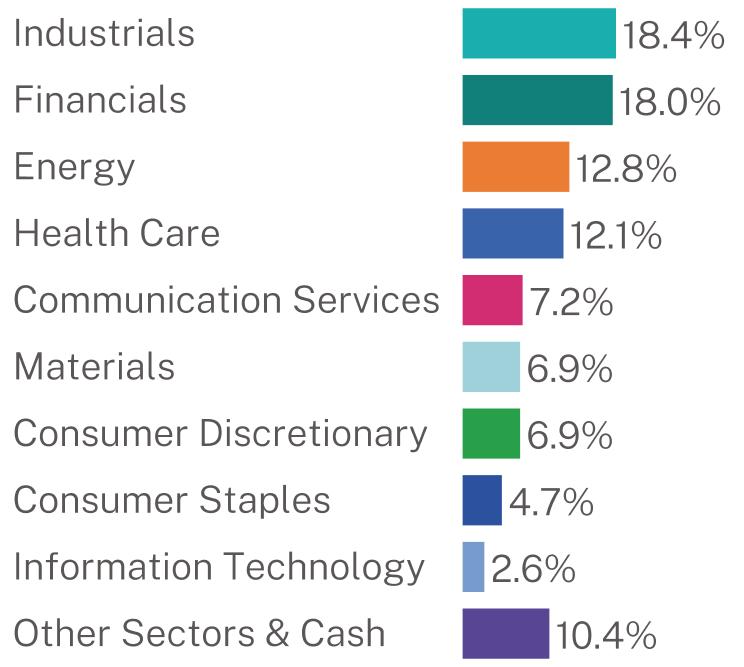
Sector Breakdown (%)†

Geographic Breakdown (%)

WHAT WERE THE FUND COSTS FOR THE PAST YEAR? (based on a hypothetical $10,000 investment)
|
Class Name
|
Costs of a $10,000 investment
|
Costs paid as a percentage of a $10,000 investment
|
|
Institutional Class
|
$92
|
0.88%
|
HOW DID THE FUND PERFORM OVER THE PAST YEAR AND WHAT AFFECTED PERFORMANCE?
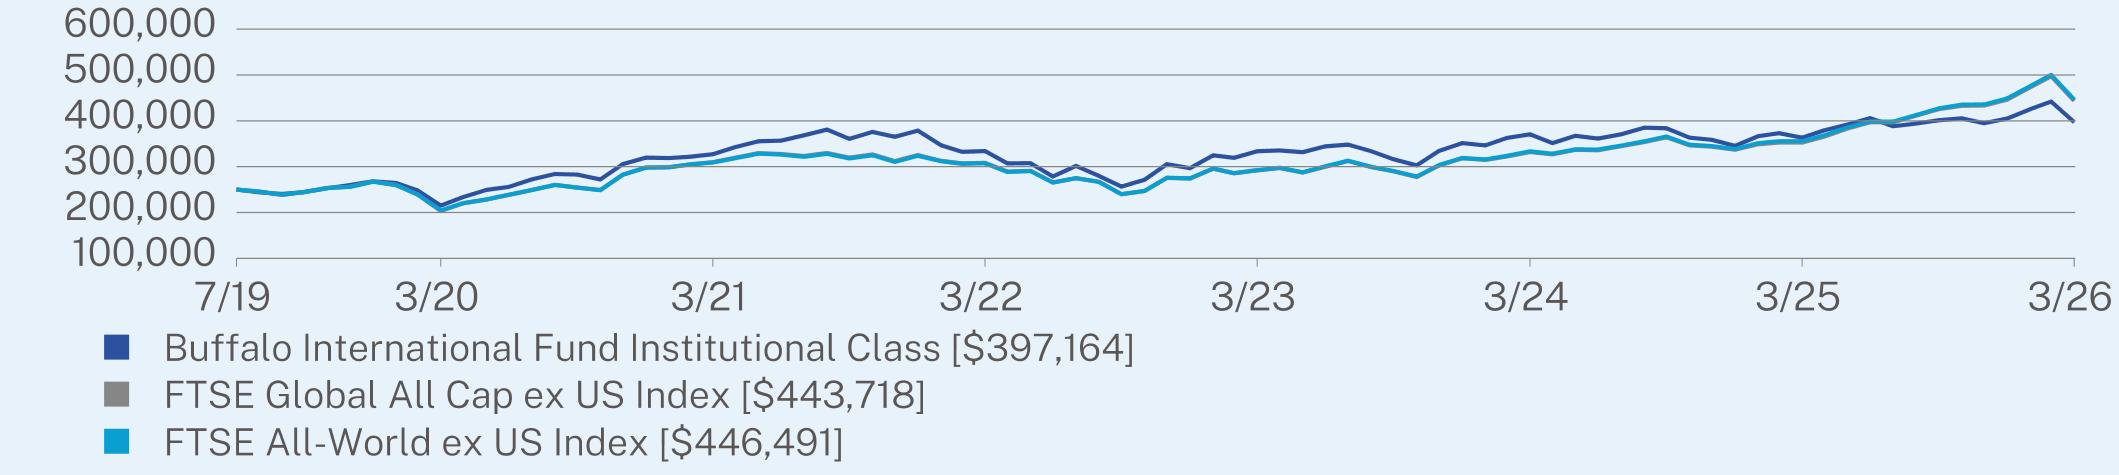
For the 12-month period ended March 31, 2026, the Fund produced a positive total return on an absolute basis, but underperformed the preferred benchmark, the FTSE All-World ex US Index (the “Index”).
WHAT FACTORS INFLUENCED PERFORMANCE?
The Fund’s investments within the Information Technology and Industrials sectors were the largest contributors to positive absolute performance throughout the year. Semiconductor companies SK hynix, Taiwan Semiconductor, and ASML were standout performers. Shares of Disco Corporation within Industrials also advanced sharply throughout the year. However, performance compared to the Index lagged due to weak stock selection in other areas of the portfolio, such as Financials. Shares of insurer Aon declined during period as did London Stock Exchange Group in Capital Markets. The Fund was also significantly underweight Banks compared to the Index which was a headwind to relative performance as that group rallied significantly across the 12-month period. By and large, the Fund’s growth profile detracted from relative results. Cyclical sectors of the Index advanced including Energy and Financials where the Fund is traditionally underweight.
|
Top Contributors
|
|
|
↑
|
SK hynix, Inc.
|
|
↑
|
Taiwan Semiconductor Manufacturing Co. Ltd. Sponsored ADR
|
|
↑
|
ASML Holding NV Sponsored ADR
|
|
↑
|
Samsung Electronics Co. Ltd.
|
|
↑
|
Disco Corporation
|
|
Top Detractors
|
|
|
↓
|
SAP SE Sponsored ADR
|
|
↓
|
Constellation Software, Inc.
|
|
↓
|
BayCurrent, Inc.
|
|
↓
|
Novo Nordisk A/S Sponsored ADR
|
|
↓
|
Adyen NV
|
ANNUAL AVERAGE TOTAL RETURN (%)
|
|
1 Year
|
5 Year
|
Since Inception
(07/01/2019) |
|
Buffalo International Fund Institutional Class
|
9.34
|
3.95
|
7.10
|
|
FTSE Global All Cap ex US Index
|
25.86
|
7.45
|
8.87
|
|
FTSE All-World ex US Index
|
25.56
|
7.63
|
8.97
|
Visit https://buffalofunds.com/overview/#performance-table for more recent performance information.
KEY FUND STATISTICS (as of March 31, 2026)
|
Net Assets
|
$797,692,203
|
|
Number of Holdings
|
75
|
|
Net Advisory Fee
|
$7,653,958
|
|
Portfolio Turnover Rate
|
16%
|
|
Weighted Average Market Capitalization
|
$211.87B
|
WHAT DID THE FUND INVEST IN? (% of net assets as of March 31, 2026)
|
Top 10 Issuers
|
(%)
|
|
SK hynix, Inc.
|
5.6%
|
|
Taiwan Semiconductor Manufacturing Co. Ltd.
|
4.5%
|
|
Fidelity Money Market Government Portfolio
|
3.7%
|
|
Samsung Electronics Co. Ltd.
|
3.2%
|
|
Schneider Electric SE
|
3.0%
|
|
ASML Holding NV - NY Shares
|
2.9%
|
|
AstraZeneca PLC
|
2.8%
|
|
Lonza Group AG
|
2.6%
|
|
MercadoLibre, Inc.
|
2.4%
|
|
Siemens AG
|
2.3%
|
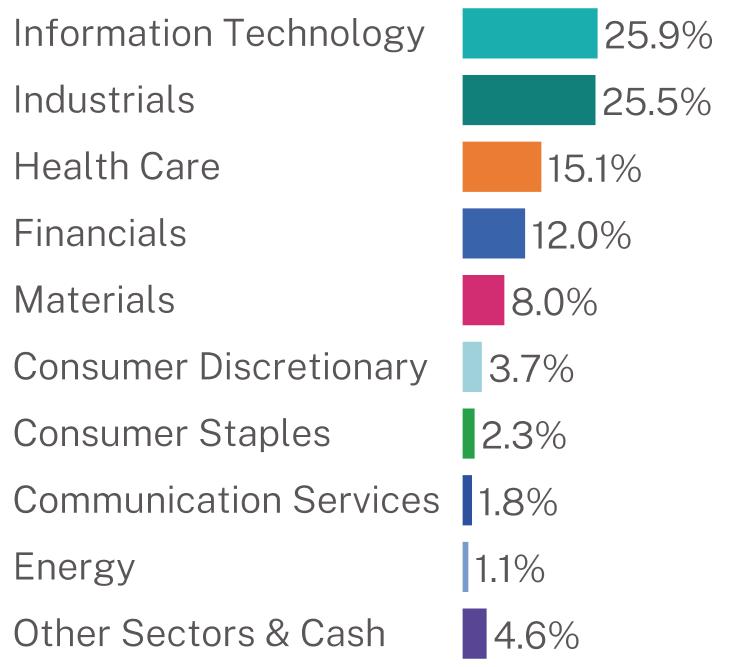
Sector Breakdown (%)†
Geographic Breakdown (%)
This report describes changes to the Fund that occurred during the reporting period.
WHAT WERE THE FUND COSTS FOR THE PAST YEAR? (based on a hypothetical $10,000 investment)
|
Class Name
|
Costs of a $10,000 investment
|
Costs paid as a percentage of a $10,000 investment
|
|
Investor Class
|
$98
|
1.01%
|
HOW DID THE FUND PERFORM OVER THE PAST YEAR AND WHAT AFFECTED PERFORMANCE?
For the 12-month period ended March 31, 2026, the Fund delivered a negative total return on an absolute basis, and underperformed its preferred benchmark, the Russell Midcap® Growth Index (the “Index”).
WHAT FACTORS INFLUENCED PERFORMANCE?
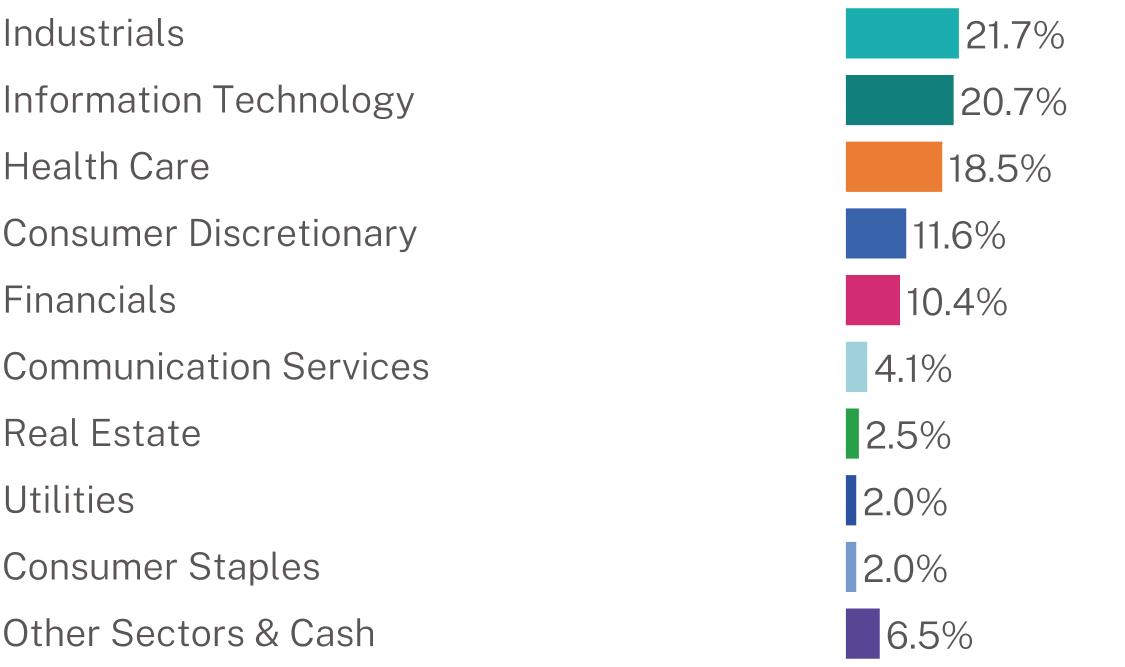
Results within the mid cap growth market for the 12-month period were defined by three dominant narratives: a sharp upward revision in AI infrastructure capital spending, a wave of indiscriminate selling in software and data-oriented business models on fears of AI disruption, and the conflict with Iran in the Middle East late in the fiscal year, which sent oil prices sharply higher and drove a rotation into Energy.
The Fund’s performance compared to the Index lagged due to weak stock selection in Information Technology, Industrials, and Health Care, where fears of AI disruption drove a broad sell-off in software, data processing, risk decisioning systems, drug development, clinical research organizations, and drug trial processes throughout the fiscal year. The Fund’s exposure to companies tied to the physical buildout of AI infrastructure—power, cooling, data center construction, and semiconductors—only partially offset these headwinds, which led to relative underperformance compared to the Index.
|
Top Contributors
|
|
|
↑
|
Vertiv Holdings Co.
|
|
↑
|
Comfort Systems USA, Inc.
|
|
↑
|
Amphenol Corporation
|
|
↑
|
e.l.f. Beauty, Inc.
|
|
↑
|
Vistra Corporation
|
|
Top Detractors
|
|
|
↓
|
Gartner, Inc.
|
|
↓
|
Verisk Analytics, Inc.
|
|
↓
|
CoStar Group, Inc.
|
|
↓
|
Copart, Inc.
|
|
↓
|
Roblox Corporation
|
ANNUAL AVERAGE TOTAL RETURN (%)
|
|
1 Year
|
5 Year
|
10 Year
|
|
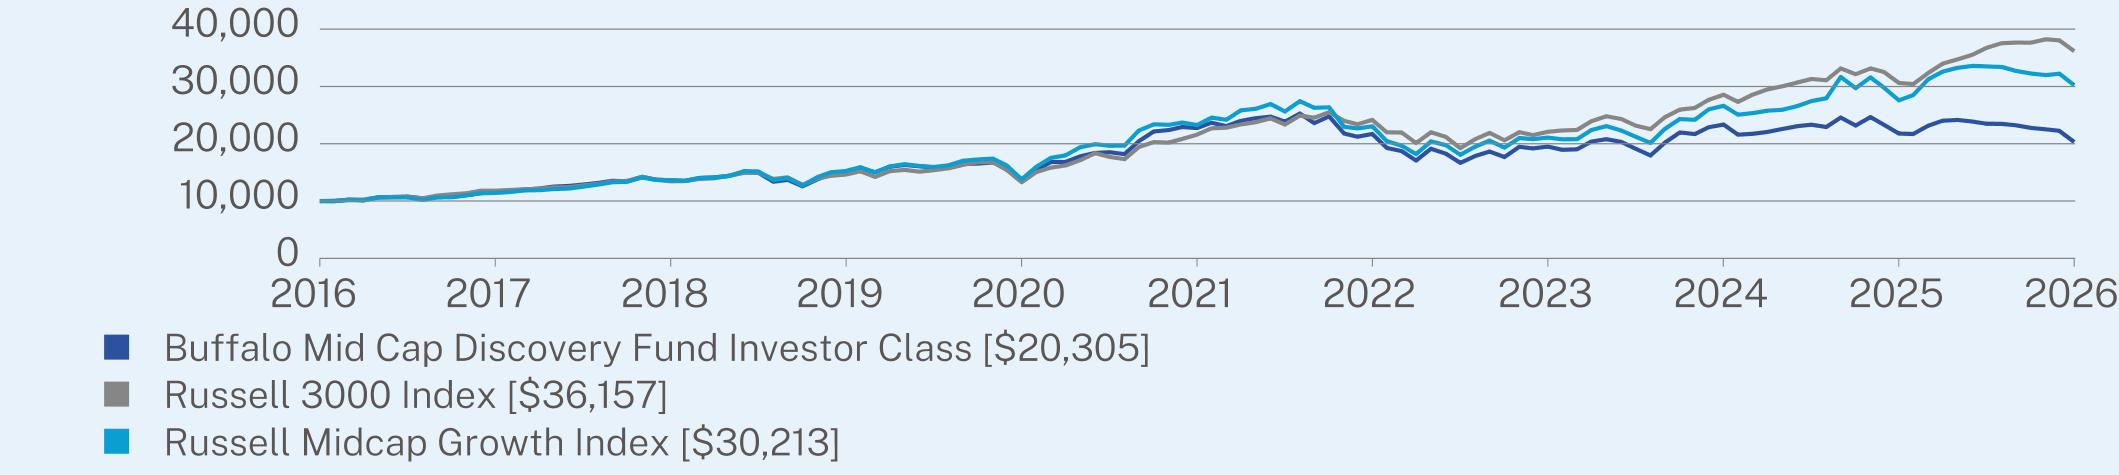
Buffalo Mid Cap Discovery Fund Investor Class
|
-6.79
|
-2.25
|
7.34
|
|
Russell 3000 Index
|
18.09
|
10.87
|
13.72
|
|
Russell Midcap Growth Index
|
9.56
|
5.37
|
11.69
|
Visit https://buffalofunds.com/overview/#performance-table for more recent performance information.
KEY FUND STATISTICS (as of March 31, 2026)
|
Net Assets
|
$332,327,820
|
|
Number of Holdings
|
73
|
|
Net Advisory Fee
|
$4,282,014
|
|
Portfolio Turnover Rate
|
74%
|
|
Weighted Average Market Capitalization
|
$39.15B
|
WHAT DID THE FUND INVEST IN? (% of net assets as of March 31, 2026)
|
Top 10 Issuers
|
(%)
|
|
Fidelity Money Market Government Portfolio
|
5.8%
|
|
Hilton Worldwide Holdings, Inc.
|
3.5%
|
|
Verisk Analytics, Inc.
|
3.3%
|
|
Vertiv Holdings Co.
|
3.3%
|
|
MSCI, Inc.
|
3.1%
|
|
Veeva Systems, Inc.
|
2.3%
|
|
Cencora, Inc.
|
2.1%
|
|
Tyler Technologies, Inc.
|
2.1%
|
|
AMETEK, Inc.
|
2.1%
|
|
Comfort Systems USA, Inc.
|
2.0%
|
Sector Breakdown (%)†

HOW HAS THE FUND CHANGED?
This is a summary of certain changes to the Fund since March 31, 2025. For more complete information, you may review the Fund’s prospectus at https://buffalofunds.com/wp-content/uploads/pdf/Buffalo-Prospectus-Final.pdf. You may also obtain a copy of the prospectus by calling 800-492-8332.
FUND PORTFOLIO MANAGER CHANGES
Effective January 2, 2026, Mr. Josh West no longer serves as a co-portfolio manager of the Fund. Effective March 9, 2026, Mr. Doug Cartwright no longer serves as a co-portfolio manager of the Fund. Mr. Dave Carlsen continues to serve as a portfolio manager of the Fund.
This report describes changes to the Fund that occurred during the reporting period.
WHAT WERE THE FUND COSTS FOR THE PAST YEAR? (based on a hypothetical $10,000 investment)
|
Class Name
|
Costs of a $10,000 investment
|
Costs paid as a percentage of a $10,000 investment
|
|
Institutional Class
|
$83
|
0.86%
|
HOW DID THE FUND PERFORM OVER THE PAST YEAR AND WHAT AFFECTED PERFORMANCE?
For the 12-month period ended March 31, 2026, the Fund delivered a negative total return on an absolute basis, and underperformed its preferred benchmark, the Russell Midcap® Growth Index (the “Index”).
WHAT FACTORS INFLUENCED PERFORMANCE?
Results within the mid cap growth market for the 12-month period were defined by three dominant narratives: a sharp upward revision in AI infrastructure capital spending, a wave of indiscriminate selling in software and data-oriented business models on fears of AI disruption, and the conflict with Iran in the Middle East late in the fiscal year, which sent oil prices sharply higher and drove a rotation into Energy.
The Fund’s performance compared to the Index lagged due to weak stock selection in Information Technology, Industrials, and Health Care, where fears of AI disruption drove a broad sell-off in software, data processing, risk decisioning systems, drug development, clinical research organizations, and drug trial processes throughout the fiscal year. The Fund’s exposure to companies tied to the physical buildout of AI infrastructure—power, cooling, data center construction, and semiconductors—only partially offset these headwinds, which led to relative underperformance compared to the Index.
|
Top Contributors
|
|
|
↑
|
Vertiv Holdings Co.
|
|
↑
|
Comfort Systems USA, Inc.
|
|
↑
|
Amphenol Corporation
|
|
↑
|
e.l.f. Beauty, Inc.
|
|
↑
|
Vistra Corporation
|
|
Top Detractors
|
|
|
↓
|
Gartner, Inc.
|
|
↓
|
Verisk Analytics, Inc.
|
|
↓
|
CoStar Group, Inc.
|
|
↓
|
Copart, Inc.
|
|
↓
|
Roblox Corporation
|
ANNUAL AVERAGE TOTAL RETURN (%)
|
|
1 Year
|
5 Year
|
Since Inception
(07/01/2019) |
|
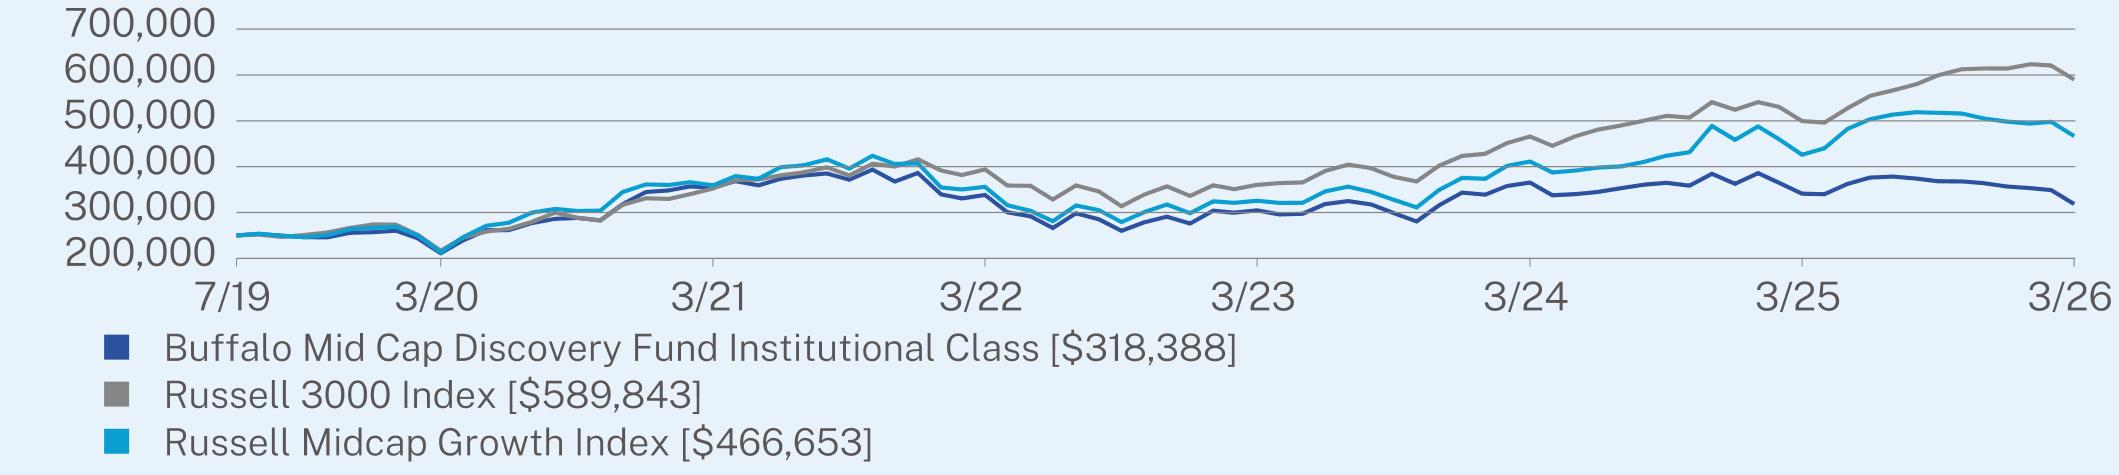
Buffalo Mid Cap Discovery Fund Institutional Class
|
-6.63
|
-2.11
|
3.65
|
|
Russell 3000 Index
|
18.09
|
10.87
|
13.56
|
|
Russell Midcap Growth Index
|
9.56
|
5.37
|
9.69
|
Visit https://buffalofunds.com/overview/#performance-table for more recent performance information.
KEY FUND STATISTICS (as of March 31, 2026)
|
Net Assets
|
$332,327,820
|
|
Number of Holdings
|
73
|
|
Net Advisory Fee
|
$4,282,014
|
|
Portfolio Turnover Rate
|
74%
|
|
Weighted Average Market Capitalization
|
$39.15B
|
WHAT DID THE FUND INVEST IN? (% of net assets as of March 31, 2026)
|
Top 10 Issuers
|
(%)
|
|
Fidelity Money Market Government Portfolio
|
5.8%
|
|
Hilton Worldwide Holdings, Inc.
|
3.5%
|
|
Verisk Analytics, Inc.
|
3.3%
|
|
Vertiv Holdings Co.
|
3.3%
|
|
MSCI, Inc.
|
3.1%
|
|
Veeva Systems, Inc.
|
2.3%
|
|
Cencora, Inc.
|
2.1%
|
|
Tyler Technologies, Inc.
|
2.1%
|
|
AMETEK, Inc.
|
2.1%
|
|
Comfort Systems USA, Inc.
|
2.0%
|
Sector Breakdown (%)†
HOW HAS THE FUND CHANGED?
This is a summary of certain changes to the Fund since March 31, 2025. For more complete information, you may review the Fund’s prospectus at https://buffalofunds.com/wp-content/uploads/pdf/Buffalo-Prospectus-Final.pdf. You may also obtain a copy of the prospectus by calling 800-492-8332.
FUND PORTFOLIO MANAGER CHANGES
Effective January 2, 2026, Mr. Josh West no longer serves as a co-portfolio manager of the Fund. Effective March 9, 2026, Mr. Doug Cartwright no longer serves as a co-portfolio manager of the Fund. Mr. Dave Carlsen continues to serve as a portfolio manager of the Fund.
This report describes changes to the Fund that occurred during the reporting period.
WHAT WERE THE FUND COSTS FOR THE PAST YEAR? (based on a hypothetical $10,000 investment)
|
Class Name
|
Costs of a $10,000 investment
|
Costs paid as a percentage of a $10,000 investment
|
|
Investor Class
|
$99
|
1.02%
|
HOW DID THE FUND PERFORM OVER THE PAST YEAR AND WHAT AFFECTED PERFORMANCE?
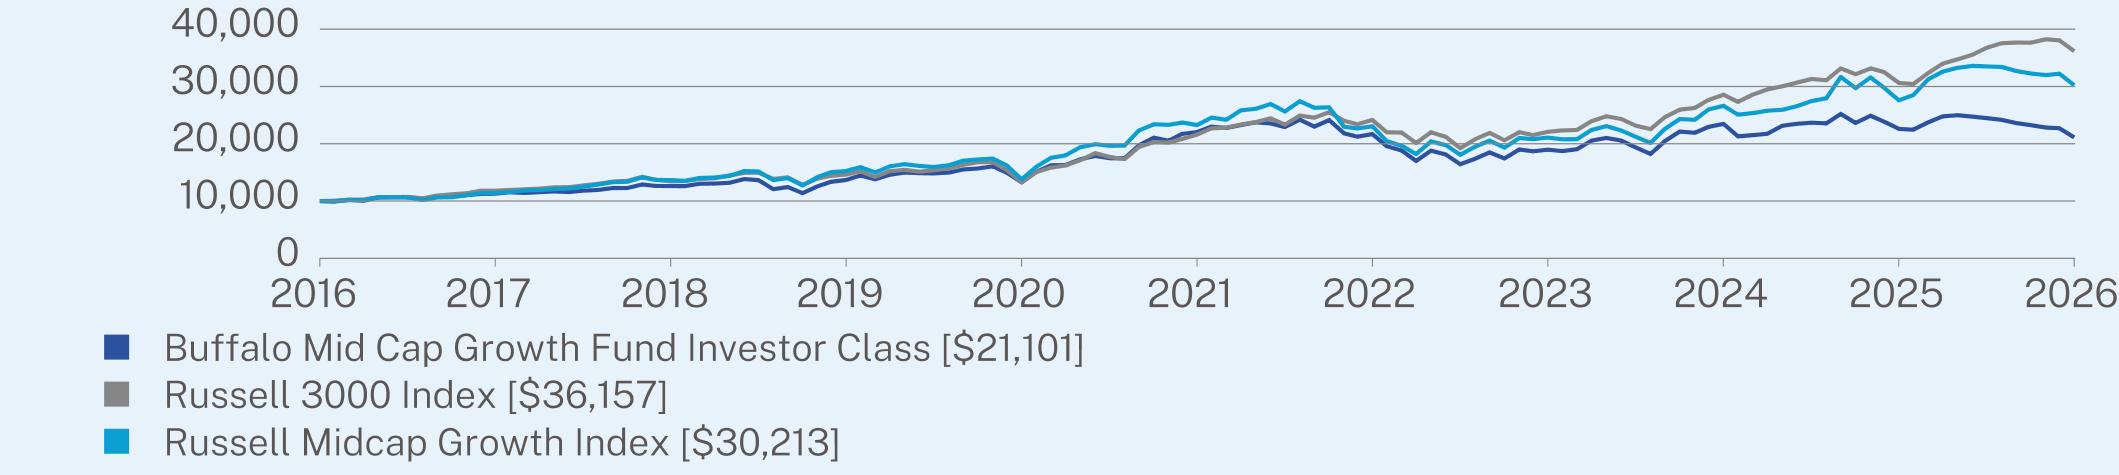
For the 12-month period ended March 31, 2026, the Fund delivered a negative total return on an absolute basis, and underperformed its preferred benchmark, the Russell Midcap® Growth Index (the “Index”).
WHAT FACTORS INFLUENCED PERFORMANCE?
It was a difficult period for the Fund with investors bidding up expensive and speculative segments of the mid cap market for much of the past year. Momentum and low quality (e.g., high debt, lower profitability, and volatile earnings) led as investment factors and the Fund’s quality bias and valuation sensitivity remained out of favor overall. Performance compared to the Index was weak within Information Technology and Industrials. Larger investments within Industrials, specifically Copart and Verisk, declined in value as did shares of Gartner and Varonis Systems among the Fund’s Information Technology investments. The portfolio’s exposure to asset-light, data, software or services business models were a drag on performance as the market deemed these business models to be under threat from AI. The Energy sector was an added headwind to relative performance during the end of the 12-month period as the geopolitical conflict in the Middle East caused a significant oil shock and a sharp rally among energy stocks, to which the Fund had no exposure.
|
Top Contributors
|
|
|
↑
|
Vertiv Holdings Co.
|
|
↑
|
Comfort Systems USA, Inc.
|
|
↑
|
e.l.f. Beauty, Inc.
|
|
↑
|
ON Semiconductor Corporation
|
|
↑
|
AMETEK, Inc.
|
|
Top Detractors
|
|
|
↓
|
Gartner, Inc.
|
|
↓
|
Copart, Inc.
|
|
↓
|
Verisk Analytics, Inc.
|
|
↓
|
CoStar Group, Inc.
|
|
↓
|
Kinsale Capital Group, Inc.
|
ANNUAL AVERAGE TOTAL RETURN (%)
|
|
1 Year
|
5 Year
|
10 Year
|
|
Buffalo Mid Cap Growth Fund Investor Class
|
-6.59
|
-0.86
|
7.75
|
|
Russell 3000 Index
|
18.09
|
10.87
|
13.72
|
|
Russell Midcap Growth Index
|
9.56
|
5.37
|
11.69
|
Visit https://buffalofunds.com/overview/#performance-table for more recent performance information.
KEY FUND STATISTICS (as of March 31, 2026)
|
Net Assets
|
$109,119,920
|
|
Number of Holdings
|
54
|
|
Net Advisory Fee
|
$1,122,219
|
|
Portfolio Turnover Rate
|
39%
|
|
Weighted Average Market Capitalization
|
$31.09B
|
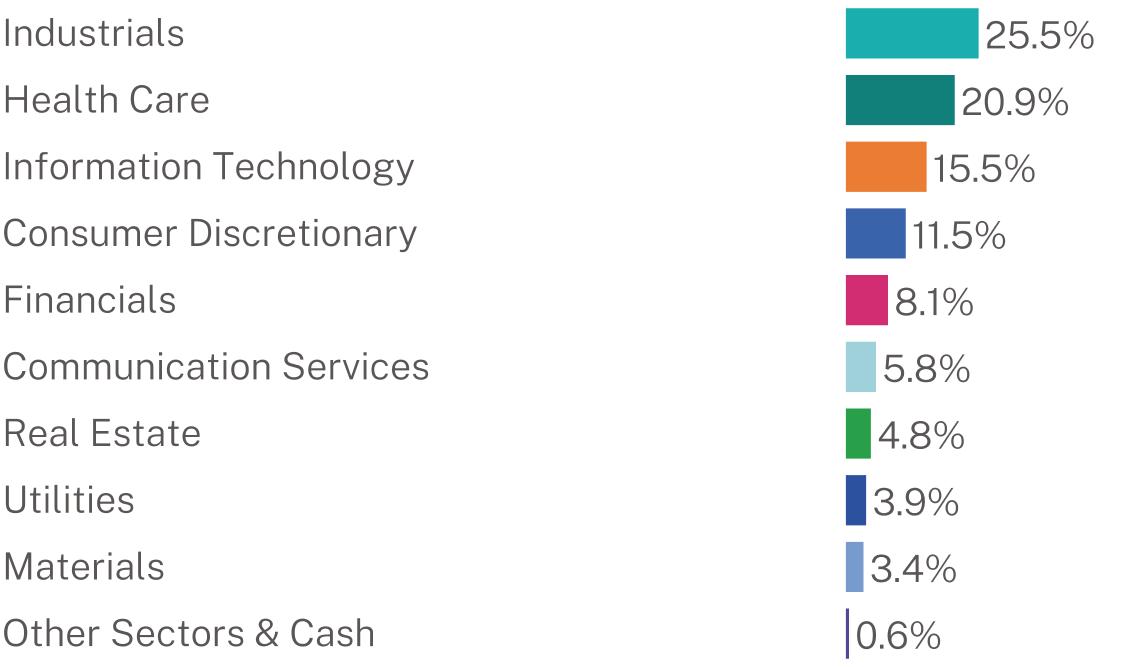
WHAT DID THE FUND INVEST IN? (% of net assets as of March 31, 2026)
|
Top 10 Issuers
|
(%)
|
|
MSCI, Inc.
|
4.2%
|
|
Vertiv Holdings Co.
|
3.9%
|
|
Equifax, Inc.
|
3.5%
|
|
CBRE Group, Inc.
|
3.4%
|
|
Hilton Worldwide Holdings, Inc.
|
3.2%
|
|
Verisk Analytics, Inc.
|
3.1%
|
|
Procore Technologies, Inc.
|
2.9%
|
|
Veeva Systems, Inc.
|
2.7%
|
|
Tyler Technologies, Inc.
|
2.7%
|
|
Copart, Inc.
|
2.6%
|
Sector Breakdown (%)†
HOW HAS THE FUND CHANGED?
This is a summary of certain changes to the Fund since March 31, 2025. For more complete information, you may review the Fund’s prospectus at https://buffalofunds.com/wp-content/uploads/pdf/Buffalo-Prospectus-Final.pdf. You may also obtain a copy of the prospectus by calling 800-492-8332.
FUND PORTFOLIO MANAGER CHANGES
Effective January 2, 2026, Mr. Darren Schryer was added as a co-portfolio manager of the Fund. Concurrently, Messrs. Doug Cartwright and Dave Carlsen ceased serving in that role. Mr. Josh West continues to serve as a co-portfolio manager of the Fund.
This report describes changes to the Fund that occurred during the reporting period.
WHAT WERE THE FUND COSTS FOR THE PAST YEAR? (based on a hypothetical $10,000 investment)
|
Class Name
|
Costs of a $10,000 investment
|
Costs paid as a percentage of a $10,000 investment
|
|
Institutional Class
|
$85
|
0.88%
|
HOW DID THE FUND PERFORM OVER THE PAST YEAR AND WHAT AFFECTED PERFORMANCE?
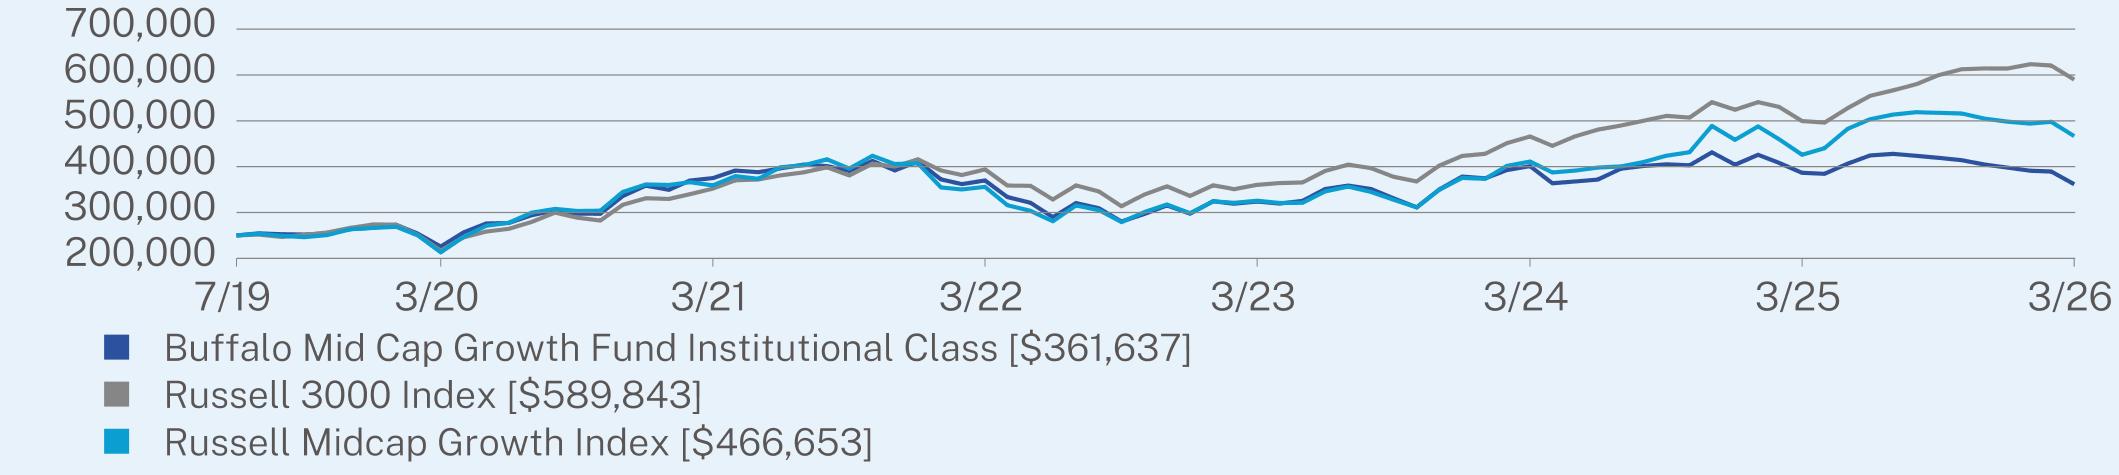
For the 12-month period ended March 31, 2026, the Fund delivered a negative total return on an absolute basis, and underperformed its preferred benchmark, the Russell Midcap® Growth Index (the “Index”).
WHAT FACTORS INFLUENCED PERFORMANCE?
It was a difficult period for the Fund with investors bidding up expensive and speculative segments of the mid cap market for much of the past year. Momentum and low quality (e.g., high debt, lower profitability, and volatile earnings) led as investment factors and the Fund’s quality bias and valuation sensitivity remained out of favor overall. Performance compared to the Index was weak within Information Technology and Industrials. Larger investments within Industrials, specifically Copart and Verisk, declined in value as did shares of Gartner and Varonis Systems among the Fund’s Information Technology investments. The portfolio’s exposure to asset-light, data, software or services business models were a drag on performance as the market deemed these business models to be under threat from AI. The Energy sector was an added headwind to relative performance during the end of the 12-month period as the geopolitical conflict in the Middle East caused a significant oil shock and a sharp rally among energy stocks, to which the Fund had no exposure.
|
Top Contributors
|
|
|
↑
|
Vertiv Holdings Co.
|
|
↑
|
Comfort Systems USA, Inc.
|
|
↑
|
e.l.f. Beauty, Inc.
|
|
↑
|
ON Semiconductor Corporation
|
|
↑
|
AMETEK, Inc.
|
|
Top Detractors
|
|
|
↓
|
Gartner, Inc.
|
|
↓
|
Copart, Inc.
|
|
↓
|
Verisk Analytics, Inc.
|
|
↓
|
CoStar Group, Inc.
|
|
↓
|
Kinsale Capital Group, Inc.
|
ANNUAL AVERAGE TOTAL RETURN (%)
|
|
1 Year
|
5 Year
|
Since Inception
(07/01/2019) |
|
Buffalo Mid Cap Growth Fund Institutional Class
|
-6.46
|
-0.73
|
5.62
|
|
Russell 3000 Index
|
18.09
|
10.87
|
13.56
|
|
Russell Midcap Growth Index
|
9.56
|
5.37
|
9.69
|
Visit https://buffalofunds.com/overview/#performance-table for more recent performance information.
KEY FUND STATISTICS (as of March 31, 2026)
|
Net Assets
|
$109,119,920
|
|
Number of Holdings
|
54
|
|
Net Advisory Fee
|
$1,122,219
|
|
Portfolio Turnover Rate
|
39%
|
|
Weighted Average Market Capitalization
|
$31.09B
|
WHAT DID THE FUND INVEST IN? (% of net assets as of March 31, 2026)
|
Top 10 Issuers
|
(%)
|
|
MSCI, Inc.
|
4.2%
|
|
Vertiv Holdings Co.
|
3.9%
|
|
Equifax, Inc.
|
3.5%
|
|
CBRE Group, Inc.
|
3.4%
|
|
Hilton Worldwide Holdings, Inc.
|
3.2%
|
|
Verisk Analytics, Inc.
|
3.1%
|
|
Procore Technologies, Inc.
|
2.9%
|
|
Veeva Systems, Inc.
|
2.7%
|
|
Tyler Technologies, Inc.
|
2.7%
|
|
Copart, Inc.
|
2.6%
|
Sector Breakdown (%)†

HOW HAS THE FUND CHANGED?
This is a summary of certain changes to the Fund since March 31, 2025. For more complete information, you may review the Fund’s prospectus at https://buffalofunds.com/wp-content/uploads/pdf/Buffalo-Prospectus-Final.pdf. You may also obtain a copy of the prospectus by calling 800-492-8332.
FUND PORTFOLIO MANAGER CHANGES
Effective January 2, 2026, Mr. Darren Schryer was added as a co-portfolio manager of the Fund. Concurrently, Messrs. Doug Cartwright and Dave Carlsen ceased serving in that role. Mr. Josh West continues to serve as a co-portfolio manager of the Fund.
WHAT WERE THE FUND COSTS FOR THE PAST YEAR? (based on a hypothetical $10,000 investment)
|
Class Name
|
Costs of a $10,000 investment
|
Costs paid as a percentage of a $10,000 investment
|
|
Investor Class
|
$101
|
0.98%
|
HOW DID THE FUND PERFORM OVER THE PAST YEAR AND WHAT AFFECTED PERFORMANCE?
For the 12-month period ended March 31, 2026, the Fund delivered a positive total return on an absolute basis, but underperformed its preferred benchmark, the Russell 2000® Growth Index (the “Index”).
WHAT FACTORS INFLUENCED PERFORMANCE?
Leading contributors to the Index return over the trailing 12-months were from companies that we consider speculative, and trading at valuations that are not digestible for professional, fundamental investors. The Fund’s underweight to these companies led to underperformance compared to the Index.
The Fund’s investments in Industrials and Information Technology contributed to positive absolute performance during the period. Shares of Sterling Infrastructure and MYR Group within Industrials moved sharply higher, while Ciena, Silicon Laboratories, and SiTime were positive contributors to performance within Information Technology. However, weak stock selection among the Fund’s Health Care, Financial, and Consumer Discretionary areas detracted from performance relative to the Index.
|
Top Contributors
|
|
|
↑
|
Sterling Infrastructure, Inc.
|
|
↑
|
Ciena Corporation
|
|
↑
|
Ligand Pharmaceuticals, Inc.
|
|
↑
|
Silicon Laboratories, Inc.
|
|
↑
|
MYR Group, Inc.
|
|
Top Detractors
|
|
|
↓
|
Vertex, Inc.
|
|
↓
|
BellRing Brands, Inc.
|
|
↓
|
Baldwin Insurance Group, Inc.
|
|
↓
|
Commvault Systems, Inc.
|
|
↓
|
Intapp, Inc.
|
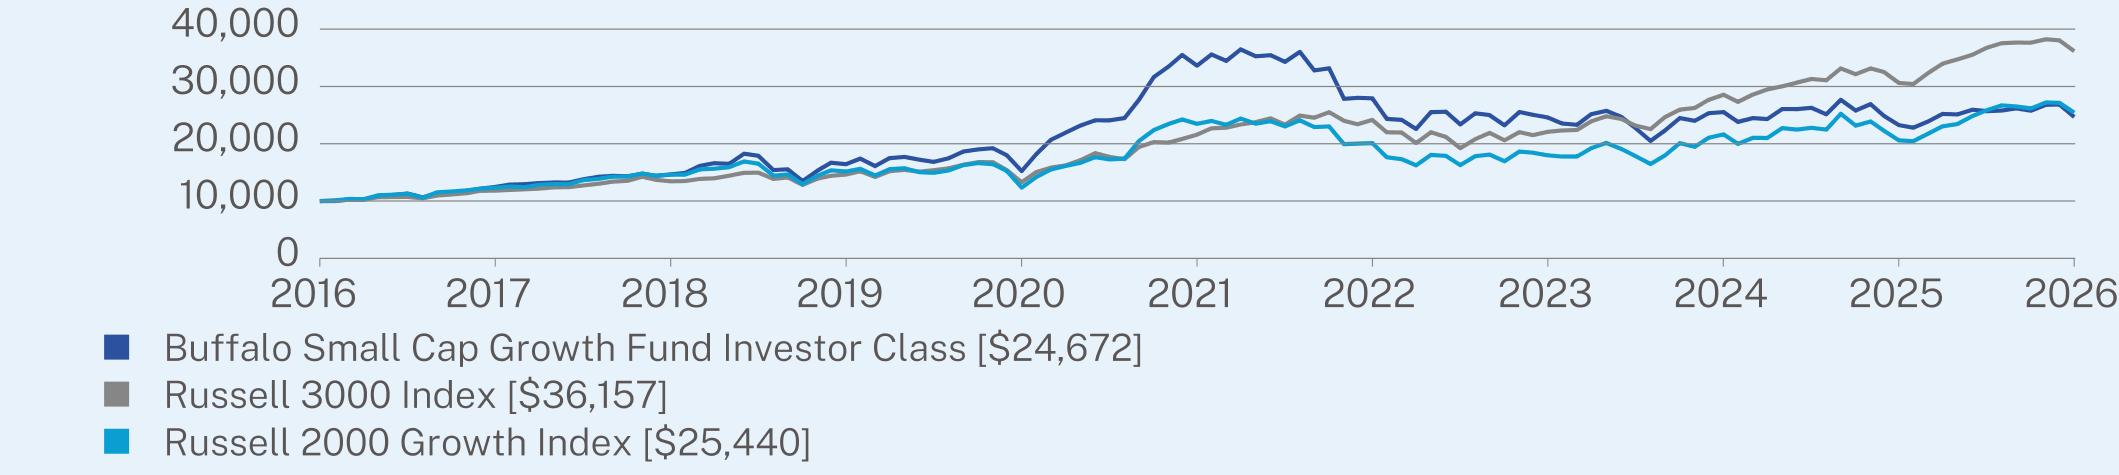
ANNUAL AVERAGE TOTAL RETURN (%)
|
|
1 Year
|
5 Year
|
10 Year
|
|
Buffalo Small Cap Growth Fund Investor Class
|
6.11
|
-6.00
|
9.45
|
|
Russell 3000 Index
|
18.09
|
10.87
|
13.72
|
|
Russell 2000 Growth Index
|
23.58
|
1.62
|
9.79
|
Visit https://buffalofunds.com/overview/#performance-table for more recent performance information.
KEY FUND STATISTICS (as of March 31, 2026)
|
Net Assets
|
$388,529,571
|
|
Number of Holdings
|
82
|
|
Net Advisory Fee
|
$4,037,489
|
|
Portfolio Turnover Rate
|
37%
|
|
Weighted Average Market Capitalization
|
$6.60B
|
WHAT DID THE FUND INVEST IN? (% of net assets as of March 31, 2026)
|
Top 10 Issuers
|
(%)
|
|
Fidelity Money Market Government Portfolio
|
3.8%
|
|
Silicon Laboratories, Inc.
|
3.3%
|
|
WisdomTree, Inc.
|
3.2%
|
|
Ligand Pharmaceuticals, Inc.
|
3.1%
|
|
JBT Marel Corp.
|
2.5%
|
|
MYR Group, Inc.
|
2.3%
|
|
ESCO Technologies, Inc.
|
2.2%
|
|
Option Care Health, Inc.
|
2.0%
|
|
Palomar Holdings, Inc.
|
2.0%
|
|
Advanced Drainage Systems, Inc.
|
1.9%
|
Sector Breakdown (%)†
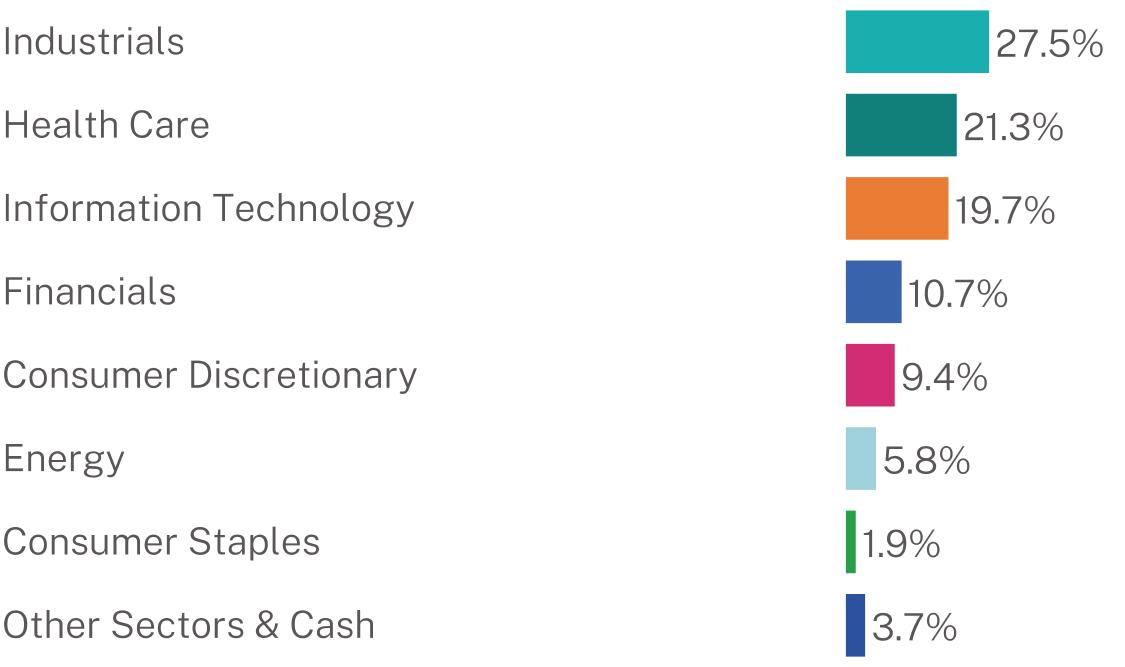
WHAT WERE THE FUND COSTS FOR THE PAST YEAR? (based on a hypothetical $10,000 investment)
|
Class Name
|
Costs of a $10,000 investment
|
Costs paid as a percentage of a $10,000 investment
|
|
Institutional Class
|
$89
|
0.86%
|
HOW DID THE FUND PERFORM OVER THE PAST YEAR AND WHAT AFFECTED PERFORMANCE?
For the 12-month period ended March 31, 2026, the Fund delivered a positive total return on an absolute basis, but underperformed its preferred benchmark, the Russell 2000® Growth Index (the “Index”).
WHAT FACTORS INFLUENCED PERFORMANCE?
Leading contributors to the Index return over the trailing 12-months were from companies that we consider speculative, and trading at valuations that are not digestible for professional, fundamental investors. The Fund’s underweight to these companies led to underperformance compared to the Index.
The Fund’s investments in Industrials and Information Technology contributed to positive absolute performance during the period. Shares of Sterling Infrastructure and MYR Group within Industrials moved sharply higher, while Ciena, Silicon Laboratories, and SiTime were positive contributors to performance within Information Technology. However, weak stock selection among the Fund’s Health Care, Financial, and Consumer Discretionary areas detracted from performance relative to the Index.
|
Top Contributors
|
|
|
↑
|
Sterling Infrastructure, Inc.
|
|
↑
|
Ciena Corporation
|
|
↑
|
Ligand Pharmaceuticals, Inc.
|
|
↑
|
Silicon Laboratories, Inc.
|
|
↑
|
MYR Group, Inc.
|
|
Top Detractors
|
|
|
↓
|
Vertex, Inc.
|
|
↓
|
BellRing Brands, Inc.
|
|
↓
|
Baldwin Insurance Group, Inc.
|
|
↓
|
Commvault Systems, Inc.
|
|
↓
|
Intapp, Inc.
|
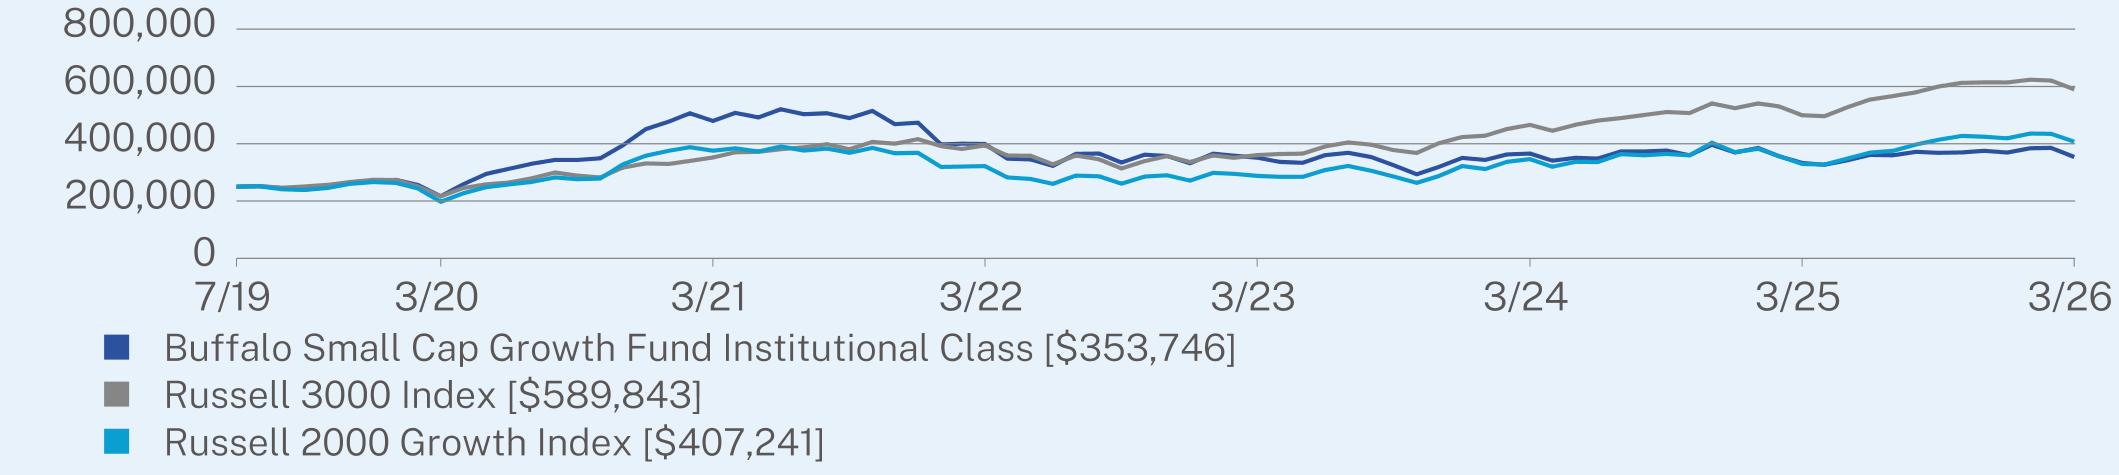
ANNUAL AVERAGE TOTAL RETURN (%)
|
|
1 Year
|
5 Year
|
Since Inception
(07/01/2019) |
|
Buffalo Small Cap Growth Fund Institutional Class
|
6.22
|
-5.91
|
5.28
|
|
Russell 3000 Index
|
18.09
|
10.87
|
13.56
|
|
Russell 2000 Growth Index
|
23.58
|
1.62
|
7.50
|
Visit https://buffalofunds.com/overview/#performance-table for more recent performance information.
KEY FUND STATISTICS (as of March 31, 2026)
|
Net Assets
|
$388,529,571
|
|
Number of Holdings
|
82
|
|
Net Advisory Fee
|
$4,037,489
|
|
Portfolio Turnover Rate
|
37%
|
|
Weighted Average Market Capitalization
|
$6.60B
|
WHAT DID THE FUND INVEST IN? (% of net assets as of March 31, 2026)
|
Top 10 Issuers
|
(%)
|
|
Fidelity Money Market Government Portfolio
|
3.8%
|
|
Silicon Laboratories, Inc.
|
3.3%
|
|
WisdomTree, Inc.
|
3.2%
|
|
Ligand Pharmaceuticals, Inc.
|
3.1%
|
|
JBT Marel Corp.
|
2.5%
|
|
MYR Group, Inc.
|
2.3%
|
|
ESCO Technologies, Inc.
|
2.2%
|
|
Option Care Health, Inc.
|
2.0%
|
|
Palomar Holdings, Inc.
|
2.0%
|
|
Advanced Drainage Systems, Inc.
|
1.9%
|
Sector Breakdown (%)†

| [1] |
|
||
| [2] |
|
||
| [3] |
|
||
| [4] |
|
||
| [5] |
|
||
| [6] |
|
||
| [7] |
|
||
| [8] |
|
||
| [9] |
|
||
| [10] |
|
||
| [11] |
|
||
| [12] |
|
||
| [13] |
|
||
| [14] |
|
||
| [15] |
|
||
| [16] |
|
||
| [17] |
|
||
| [18] |
|
||
| [19] |
|
||
| [20] |
|
||
| [21] |
|
||
| [22] |
|