Shareholder Report
Mar. 31, 2026
USD ($)
$ / shares
WHAT WERE THE FUND COSTS FOR THE PAST YEAR? (based on a hypothetical $10,000 investment)
|
Class Name
|
Costs of a $10,000 investment
|
Costs paid as a percentage of a $10,000 investment
|
|
Class I
|
$51
|
0.50%
|
HOW DID THE FUND PERFORM LAST YEAR AND WHAT AFFECTED ITS PERFORMANCE?
For the 12-month period ended March 31, 2026, the DoubleLine Total Return Bond Fund outperformed the benchmark Bloomberg U.S. Aggregate Bond Index return of 4.35% on a net asset value basis.
WHAT FACTORS INFLUENCED PERFORMANCE?
The Fund’s overweight to Agency mortgage-backed securities relative to the benchmark contributed positively to performance, as Agency mortgages outperformed U.S. Treasuries and corporate bonds during the period. The Fund’s allocation to out-of-benchmark securitized credit also supported returns, as these sectors generally outperformed investment grade corporate bonds.
POSITIONING
The Fund maintained a high-quality profile, with approximately 56% of the portfolio allocated to government-backed mortgages and U.S. Treasuries. The Fund rotated up in quality during the period, reinvesting proceeds from maturing positions into higher-rated bonds. The Fund’s average duration remained modestly shorter than that of its benchmark, and its average credit quality was A+.
|
Top Contributors
|
|
|
↑
|
Agency Mortgage-Backed Securities (MBS)
|
|
↑
|
Non-Agency Residential MBS
|
|
↑
|
Non-Agency Commercial MBS
|
|
Top Detractors
|
|
|
↓
|
U.S. Government Securities
|
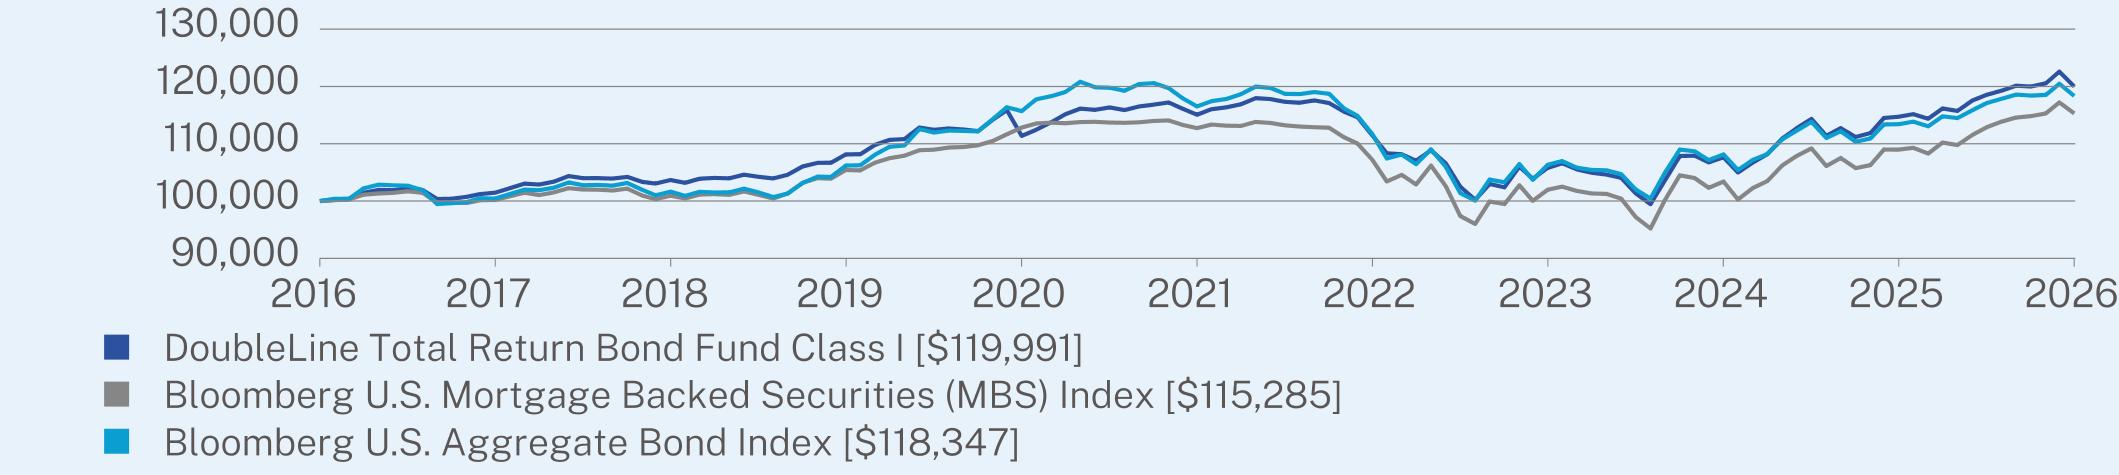
ANNUAL AVERAGE TOTAL RETURN (%)
|
|
1 Year
|
5 Year
|
10 Year
|
|
Class I (without sales charge)
|
4.59
|
0.84
|
1.84
|
|
Bloomberg U.S. Mortgage Backed Securities (MBS) Index
|
5.79
|
0.45
|
1.43
|
|
Bloomberg U.S. Aggregate Bond Index
|
4.35
|
0.31
|
1.70
|
Visit https://doubleline.com/fund-documents/ for more recent performance information.
KEY FUND STATISTICS
|
Net Assets
|
$31,163,011,513
|
|
Number of Holdings
|
3,137
|
|
Total Advisory Fees Paid
|
$121,679,835
|
|
Portfolio Turnover
|
26%
|
|
Effective Duration
|
5.52 years
|
|
Weighted Average Life
|
5.78 years
|
WHAT DID THE FUND INVEST IN?
|
Credit Quality Breakdown*
|
(% of Net Assets)
|
|
Government
|
13.4
|
|
Agency
|
40.4
|
|
AAA
|
16.0
|
|
AA
|
2.3
|
|
A
|
5.5
|
|
BBB
|
5.0
|
|
BB
|
0.8
|
|
B and Below
|
6.4
|
|
Not Rated
|
7.9
|
|
Other
|
2.3
|
|
Sector Breakdown
|
(% of Net Assets)
|
|
U.S. Government and Agency Mortgage Backed Obligations
|
48.9
|
|
Non-Agency Residential Collateralized Mortgage Obligations
|
24.9
|
|
Non-Agency Commercial Mortgage Backed Obligations
|
8.1
|
|
Asset Backed Obligations
|
6.1
|
|
U.S. Government and Agency Obligations
|
5.3
|
|
Collateralized Loan Obligations
|
4.7
|
|
Money Market Funds
|
2.7
|
|
Cash & Other
|
-0.2
|
|
Futures Contracts
|
-0.5
|
The DoubleLine fund complex has historically used multiple firms to serve as the independent registered public accounting firms across the fund complex in the United States. On August 19, 2025, the Board of Trustees of the Trust considered and approved a proposal to consolidate that work for the entire fund complex with a single firm, Deloitte & Touche LLP, and Deloitte was appointed to serve as the independent registered public accounting firm of each series of the Trust (each, a “Fund”) for the fiscal year ending March 31, 2026. In connection with that transition, PricewaterhouseCoopers LLP, each Fund’s prior independent registered public accounting firm, was dismissed effective as of August 5, 2025.
WHAT WERE THE FUND COSTS FOR THE PAST YEAR? (based on a hypothetical $10,000 investment)
|
Class Name
|
Costs of a $10,000 investment
|
Costs paid as a percentage of a $10,000 investment*,**
|
|
Class I2
|
$22
|
0.54%
|
HOW DID THE FUND PERFORM LAST YEAR AND WHAT AFFECTED ITS PERFORMANCE?
For the 12-month period ended March 31, 2026, the DoubleLine Total Return Bond Fund outperformed the benchmark Bloomberg U.S. Aggregate Bond Index return of 4.35% on a net asset value basis.
WHAT FACTORS INFLUENCED PERFORMANCE?
The Fund’s overweight to Agency mortgage-backed securities relative to the benchmark contributed positively to performance, as Agency mortgages outperformed U.S. Treasuries and corporate bonds during the period. The Fund’s allocation to out-of-benchmark securitized credit also supported returns, as these sectors generally outperformed investment grade corporate bonds.
POSITIONING
The Fund maintained a high-quality profile, with approximately 56% of the portfolio allocated to government-backed mortgages and U.S. Treasuries. The Fund rotated up in quality during the period, reinvesting proceeds from maturing positions into higher-rated bonds. The Fund’s average duration remained modestly shorter than that of its benchmark, and its average credit quality was A+.
|
Top Contributors
|
|
|
↑
|
Agency Mortgage-Backed Securities (MBS)
|
|
↑
|
Non-Agency Residential MBS
|
|
↑
|
Non-Agency Commercial MBS
|
|
Top Detractors
|
|
|
↓
|
U.S. Government Securities
|
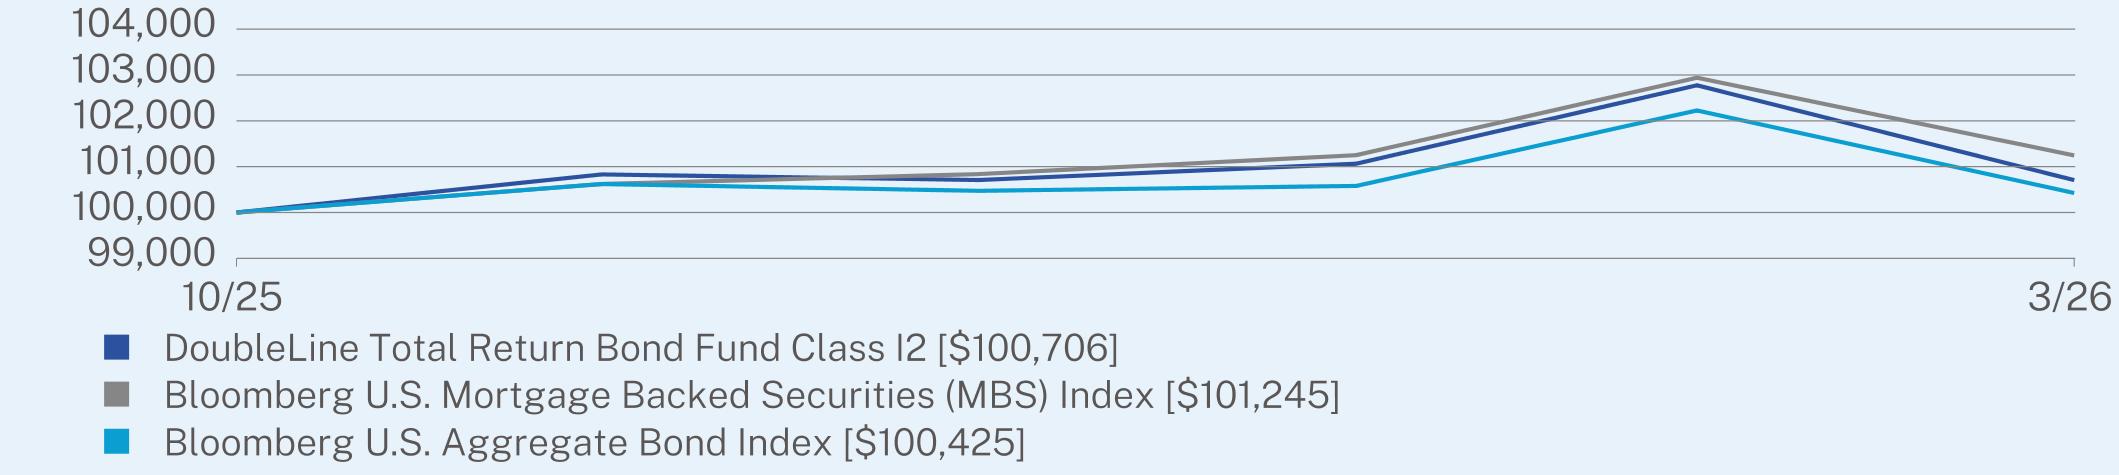
AVERAGE TOTAL RETURN (%)
|
|
Since Inception
(10/31/2025) |
|
Class I2 (without sales charge)
|
0.71
|
|
Bloomberg U.S. Mortgage Backed Securities (MBS) Index
|
1.24
|
|
Bloomberg U.S. Aggregate Bond Index
|
0.43
|
Visit https://doubleline.com/fund-documents/ for more recent performance information.
KEY FUND STATISTICS
|
Net Assets
|
$31,163,011,513
|
|
Number of Holdings
|
3,137
|
|
Total Advisory Fees Paid
|
$121,679,835
|
|
Portfolio Turnover
|
26%
|
|
Effective Duration
|
5.52 years
|
|
Weighted Average Life
|
5.78 years
|
WHAT DID THE FUND INVEST IN?
|
Credit Quality Breakdown*
|
(% of Net Assets)
|
|
Government
|
13.4
|
|
Agency
|
40.4
|
|
AAA
|
16.0
|
|
AA
|
2.3
|
|
A
|
5.5
|
|
BBB
|
5.0
|
|
BB
|
0.8
|
|
B and Below
|
6.4
|
|
Not Rated
|
7.9
|
|
Other
|
2.3
|
|
Sector Breakdown
|
(% of Net Assets)
|
|
U.S. Government and Agency Mortgage Backed Obligations
|
48.9
|
|
Non-Agency Residential Collateralized Mortgage Obligations
|
24.9
|
|
Non-Agency Commercial Mortgage Backed Obligations
|
8.1
|
|
Asset Backed Obligations
|
6.1
|
|
U.S. Government and Agency Obligations
|
5.3
|
|
Collateralized Loan Obligations
|
4.7
|
|
Money Market Funds
|
2.7
|
|
Cash & Other
|
-0.2
|
|
Futures Contracts
|
-0.5
|
The DoubleLine fund complex has historically used multiple firms to serve as the independent registered public accounting firms across the fund complex in the United States. On August 19, 2025, the Board of Trustees of the Trust considered and approved a proposal to consolidate that work for the entire fund complex with a single firm, Deloitte & Touche LLP, and Deloitte was appointed to serve as the independent registered public accounting firm of each series of the Trust (each, a “Fund”) for the fiscal year ending March 31, 2026. In connection with that transition, PricewaterhouseCoopers LLP, each Fund’s prior independent registered public accounting firm, was dismissed effective as of August 5, 2025.
WHAT WERE THE FUND COSTS FOR THE PAST YEAR? (based on a hypothetical $10,000 investment)
|
Class Name
|
Costs of a $10,000 investment
|
Costs paid as a percentage of a $10,000 investment
|
|
Class N
|
$77
|
0.75%
|
HOW DID THE FUND PERFORM LAST YEAR AND WHAT AFFECTED ITS PERFORMANCE?
For the 12-month period ended March 31, 2026, the DoubleLine Total Return Bond Fund outperformed the benchmark Bloomberg U.S. Aggregate Bond Index return of 4.35% on a net asset value basis.
WHAT FACTORS INFLUENCED PERFORMANCE?
The Fund’s overweight to Agency mortgage-backed securities relative to the benchmark contributed positively to performance, as Agency mortgages outperformed U.S. Treasuries and corporate bonds during the period. The Fund’s allocation to out-of-benchmark securitized credit also supported returns, as these sectors generally outperformed investment grade corporate bonds.
POSITIONING
The Fund maintained a high-quality profile, with approximately 56% of the portfolio allocated to government-backed mortgages and U.S. Treasuries. The Fund rotated up in quality during the period, reinvesting proceeds from maturing positions into higher-rated bonds. The Fund’s average duration remained modestly shorter than that of its benchmark, and its average credit quality was A+.
|
Top Contributors
|
|
|
↑
|
Agency Mortgage-Backed Securities (MBS)
|
|
↑
|
Non-Agency Residential MBS
|
|
↑
|
Non-Agency Commercial MBS
|
|
Top Detractors
|
|
|
↓
|
U.S. Government Securities
|
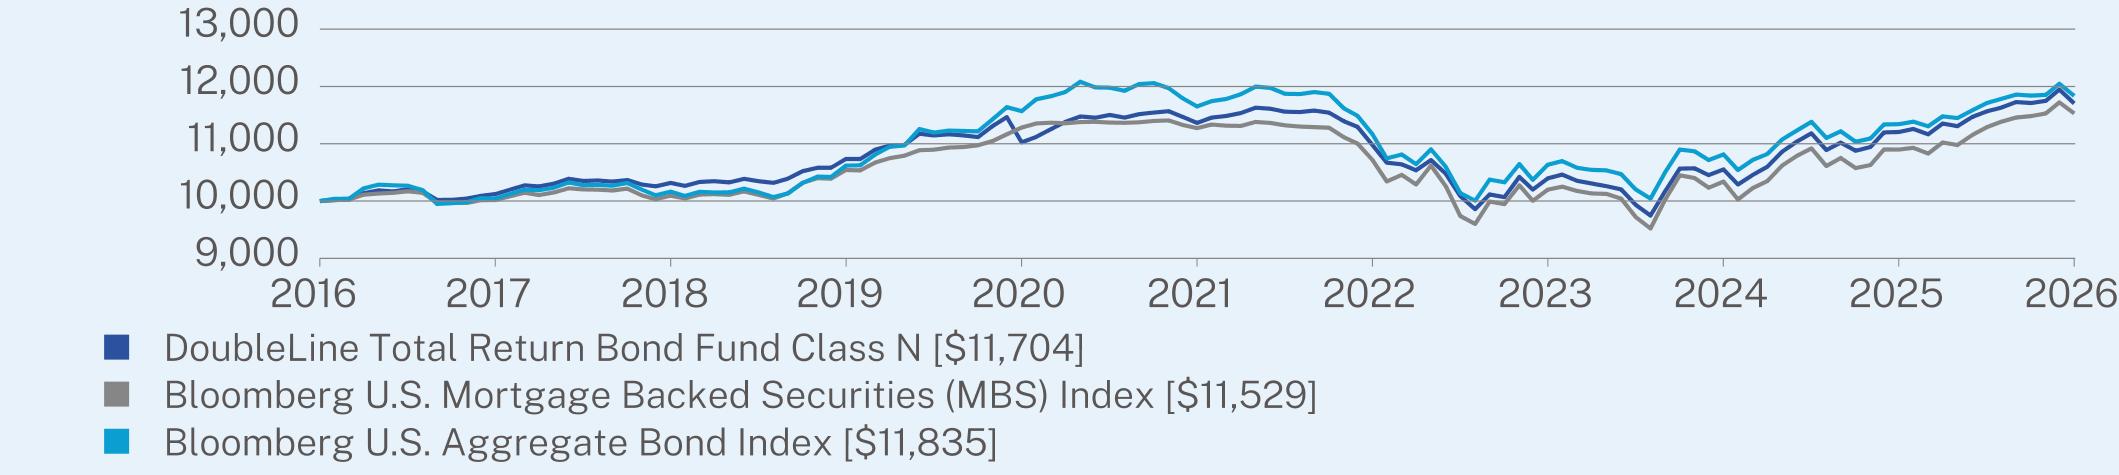
ANNUAL AVERAGE TOTAL RETURN (%)
|
|
1 Year
|
5 Year
|
10 Year
|
|
Class N (without sales charge)
|
4.45
|
0.59
|
1.59
|
|
Bloomberg U.S. Mortgage Backed Securities (MBS) Index
|
5.79
|
0.45
|
1.43
|
|
Bloomberg U.S. Aggregate Bond Index
|
4.35
|
0.31
|
1.70
|
Visit https://doubleline.com/fund-documents/ for more recent performance information.
KEY FUND STATISTICS
|
Net Assets
|
$31,163,011,513
|
|
Number of Holdings
|
3,137
|
|
Total Advisory Fees Paid
|
$121,679,835
|
|
Portfolio Turnover
|
26%
|
|
Effective Duration
|
5.52 years
|
|
Weighted Average Life
|
5.78 years
|
WHAT DID THE FUND INVEST IN?
|
Credit Quality Breakdown*
|
(% of Net Assets)
|
|
Government
|
13.4
|
|
Agency
|
40.4
|
|
AAA
|
16.0
|
|
AA
|
2.3
|
|
A
|
5.5
|
|
BBB
|
5.0
|
|
BB
|
0.8
|
|
B and Below
|
6.4
|
|
Not Rated
|
7.9
|
|
Other
|
2.3
|
|
Sector Breakdown
|
(% of Net Assets)
|
|
U.S. Government and Agency Mortgage Backed Obligations
|
48.9
|
|
Non-Agency Residential Collateralized Mortgage Obligations
|
24.9
|
|
Non-Agency Commercial Mortgage Backed Obligations
|
8.1
|
|
Asset Backed Obligations
|
6.1
|
|
U.S. Government and Agency Obligations
|
5.3
|
|
Collateralized Loan Obligations
|
4.7
|
|
Money Market Funds
|
2.7
|
|
Cash & Other
|
-0.2
|
|
Futures Contracts
|
-0.5
|
The DoubleLine fund complex has historically used multiple firms to serve as the independent registered public accounting firms across the fund complex in the United States. On August 19, 2025, the Board of Trustees of the Trust considered and approved a proposal to consolidate that work for the entire fund complex with a single firm, Deloitte & Touche LLP, and Deloitte was appointed to serve as the independent registered public accounting firm of each series of the Trust (each, a “Fund”) for the fiscal year ending March 31, 2026. In connection with that transition, PricewaterhouseCoopers LLP, each Fund’s prior independent registered public accounting firm, was dismissed effective as of August 5, 2025.
WHAT WERE THE FUND COSTS FOR THE PAST YEAR? (based on a hypothetical $10,000 investment)
|
Class Name
|
Costs of a $10,000 investment
|
Costs paid as a percentage of a $10,000 investment
|
|
Class R6
|
$44
|
0.43%
|
HOW DID THE FUND PERFORM LAST YEAR AND WHAT AFFECTED ITS PERFORMANCE?
For the 12-month period ended March 31, 2026, the DoubleLine Total Return Bond Fund outperformed the benchmark Bloomberg U.S. Aggregate Bond Index return of 4.35% on a net asset value basis.
WHAT FACTORS INFLUENCED PERFORMANCE?
The Fund’s overweight to Agency mortgage-backed securities relative to the benchmark contributed positively to performance, as Agency mortgages outperformed U.S. Treasuries and corporate bonds during the period. The Fund’s allocation to out-of-benchmark securitized credit also supported returns, as these sectors generally outperformed investment grade corporate bonds.
POSITIONING
The Fund maintained a high-quality profile, with approximately 56% of the portfolio allocated to government-backed mortgages and U.S. Treasuries. The Fund rotated up in quality during the period, reinvesting proceeds from maturing positions into higher-rated bonds. The Fund’s average duration remained modestly shorter than that of its benchmark, and its average credit quality was A+.
|
Top Contributors
|
|
|
↑
|
Agency Mortgage-Backed Securities (MBS)
|
|
↑
|
Non-Agency Residential MBS
|
|
↑
|
Non-Agency Commercial MBS
|
|
Top Detractors
|
|
|
↓
|
U.S. Government Securities
|
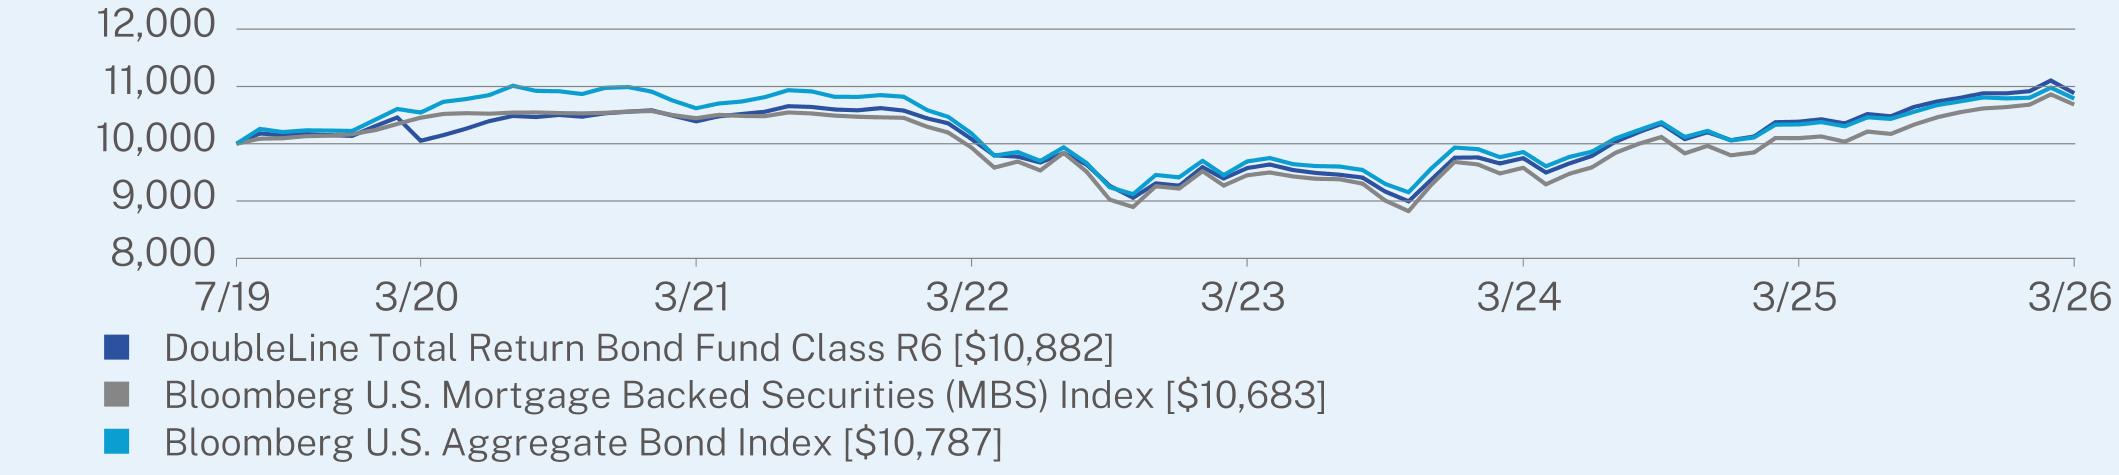
ANNUAL AVERAGE TOTAL RETURN (%)
|
|
1 Year
|
5 Year
|
Since Inception
(07/31/2019) |
|
Class R6 (without sales charge)
|
4.78
|
0.93
|
1.28
|
|
Bloomberg U.S. Mortgage Backed Securities (MBS) Index
|
5.79
|
0.45
|
1.00
|
|
Bloomberg U.S. Aggregate Bond Index
|
4.35
|
0.31
|
1.14
|
Visit https://doubleline.com/fund-documents/ for more recent performance information.
KEY FUND STATISTICS
|
Net Assets
|
$31,163,011,513
|
|
Number of Holdings
|
3,137
|
|
Total Advisory Fees Paid
|
$121,679,835
|
|
Portfolio Turnover
|
26%
|
|
Effective Duration
|
5.52 years
|
|
Weighted Average Life
|
5.78 years
|
WHAT DID THE FUND INVEST IN?
|
Credit Quality Breakdown*
|
(% of Net Assets)
|
|
Government
|
13.4
|
|
Agency
|
40.4
|
|
AAA
|
16.0
|
|
AA
|
2.3
|
|
A
|
5.5
|
|
BBB
|
5.0
|
|
BB
|
0.8
|
|
B and Below
|
6.4
|
|
Not Rated
|
7.9
|
|
Other
|
2.3
|
|
Sector Breakdown
|
(% of Net Assets)
|
|
U.S. Government and Agency Mortgage Backed Obligations
|
48.9
|
|
Non-Agency Residential Collateralized Mortgage Obligations
|
24.9
|
|
Non-Agency Commercial Mortgage Backed Obligations
|
8.1
|
|
Asset Backed Obligations
|
6.1
|
|
U.S. Government and Agency Obligations
|
5.3
|
|
Collateralized Loan Obligations
|
4.7
|
|
Money Market Funds
|
2.7
|
|
Cash & Other
|
-0.2
|
|
Futures Contracts
|
-0.5
|
The DoubleLine fund complex has historically used multiple firms to serve as the independent registered public accounting firms across the fund complex in the United States. On August 19, 2025, the Board of Trustees of the Trust considered and approved a proposal to consolidate that work for the entire fund complex with a single firm, Deloitte & Touche LLP, and Deloitte was appointed to serve as the independent registered public accounting firm of each series of the Trust (each, a “Fund”) for the fiscal year ending March 31, 2026. In connection with that transition, PricewaterhouseCoopers LLP, each Fund’s prior independent registered public accounting firm, was dismissed effective as of August 5, 2025.
WHAT WERE THE FUND COSTS FOR THE PAST YEAR? (based on a hypothetical $10,000 investment)
|
Class Name
|
Costs of a $10,000 investment
|
Costs paid as a percentage of a $10,000 investment
|
|
Class I
|
$47
|
0.46%
|
HOW DID THE FUND PERFORM LAST YEAR AND WHAT AFFECTED ITS PERFORMANCE?
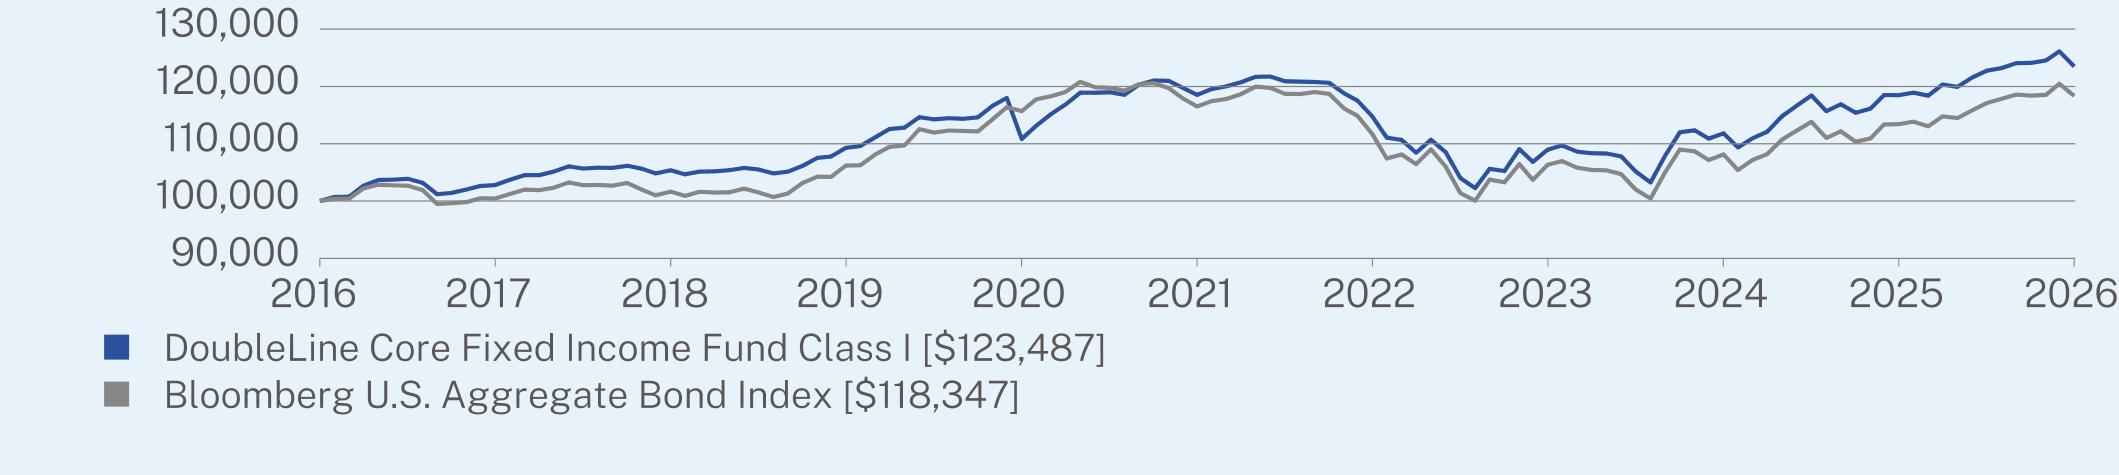
For the 12-month period ended March 31, 2026, the DoubleLine Core Fixed Income Fund underperformed the benchmark Bloomberg U.S. Aggregate Bond Index return of 4.35% on a net asset value basis.
WHAT FACTORS INFLUENCED PERFORMANCE?
The Fund’s overweight to Agency mortgage-backed securities relative to the benchmark contributed positively to performance, as Agency mortgages outperformed U.S. Treasuries and corporate bonds during the period. In addition, the Fund’s allocation to out-of-benchmark credit supported returns, as these sectors generally outperformed investment grade (IG) corporate bonds. The Fund’s active management and bottom-up security selection also contributed to performance as each credit sleeve outperformed the return of the IG corporate bond index and their own relative benchmark. The Fund’s allocation to U.S. government securities detracted from performance due to duration differences between the Fund and benchmark.
POSITIONING
The Fund invested in U.S. government-guaranteed and high-credit-quality credit assets. The Fund rotated up in credit quality during the period, reinvesting cash from maturing positions into higher-rated bonds. The Fund added marginally to non-U.S. dollar positions via global and emerging markets local currency bonds. The Fund’s average duration remained modestly shorter than that of its benchmark, and its average credit quality was A.
|
Top Contributors
|
|
|
↑
|
Agency Mortgage-Backed Securities (MBS)
|
|
↑
|
Investment Grade Corporate Bonds
|
|
↑
|
Non-Agency Residential MBS
|
|
Top Detractors
|
|
|
↓
|
U.S. Government Securities
|
ANNUAL AVERAGE TOTAL RETURN (%)
|
|
1 Year
|
5 Year
|
10 Year
|
|
Class I (without sales charge)
|
4.23
|
0.82
|
2.13
|
|
Bloomberg U.S. Aggregate Bond Index
|
4.35
|
0.31
|
1.70
|
Visit https://doubleline.com/fund-documents/ for more recent performance information.
KEY FUND STATISTICS
|
Net Assets
|
$6,851,314,066
|
|
Number of Holdings
|
1,700
|
|
Total Advisory Fees Paid
|
$23,662,104
|
|
Portfolio Turnover
|
43%
|
|
Effective Duration
|
5.52 years
|
|
Weighted Average Life
|
6.34 years
|
WHAT DID THE FUND INVEST IN?
|
Credit Quality Breakdown*
|
(% of Net Assets)
|
|
Government
|
24.3
|
|
Agency
|
18.6
|
|
AAA
|
8.6
|
|
AA
|
4.0
|
|
A
|
9.3
|
|
BBB
|
17.3
|
|
BB
|
6.0
|
|
B and Below
|
7.0
|
|
Not Rated
|
2.4
|
|
Other
|
2.5
|
|
Sector Breakdown
|
(% of Net Assets)
|
|
U.S. Government and Agency Mortgage Backed Obligations
|
21.8
|
|
U.S. Corporate Bonds
|
14.6
|
|
U.S. Government and Agency Obligations
|
14.2
|
|
Non-Agency Residential Collateralized Mortgage Obligations
|
10.5
|
|
Affiliated Mutual Funds
|
9.4
|
|
Money Market Funds
|
7.7
|
|
Non-Agency Commercial Mortgage Backed Obligations
|
6.6
|
|
Foreign Corporate Bonds
|
6.1
|
|
U.S. Treasury Bills
|
5.7
|
|
Cash & Other
|
3.4
|
The DoubleLine fund complex has historically used multiple firms to serve as the independent registered public accounting firms across the fund complex in the United States. On August 19, 2025, the Board of Trustees of the Trust considered and approved a proposal to consolidate that work for the entire fund complex with a single firm, Deloitte & Touche LLP, and Deloitte was appointed to serve as the independent registered public accounting firm of each series of the Trust (each, a “Fund”) for the fiscal year ending March 31, 2026. In connection with that transition, PricewaterhouseCoopers LLP, each Fund’s prior independent registered public accounting firm, was dismissed effective as of August 5, 2025.
WHAT WERE THE FUND COSTS FOR THE PAST YEAR? (based on a hypothetical $10,000 investment)
|
Class Name
|
Costs of a $10,000 investment
|
Costs paid as a percentage of a $10,000 investment*,**
|
|
Class I2
|
$21
|
0.50%
|
HOW DID THE FUND PERFORM LAST YEAR AND WHAT AFFECTED ITS PERFORMANCE?
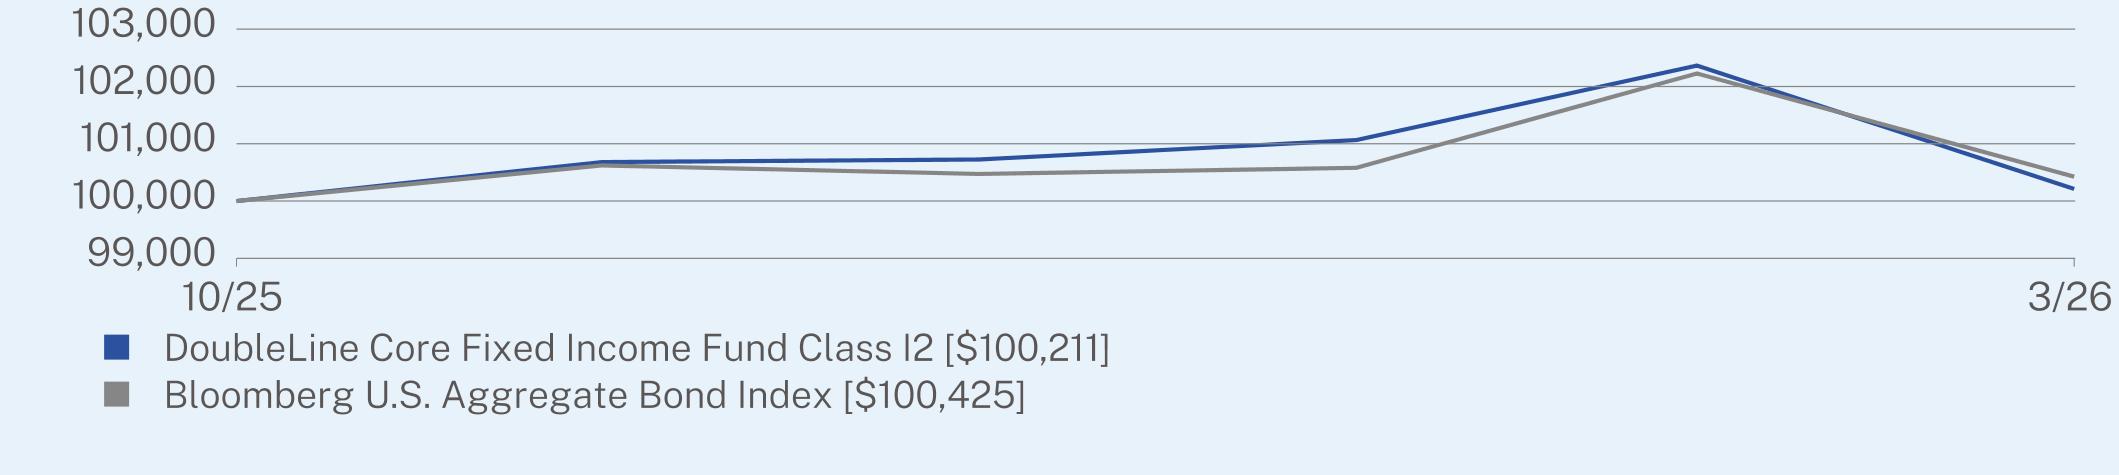
For the 12-month period ended March 31, 2026, the DoubleLine Core Fixed Income Fund underperformed the benchmark Bloomberg U.S. Aggregate Bond Index return of 4.35% on a net asset value basis.
WHAT FACTORS INFLUENCED PERFORMANCE?
The Fund’s overweight to Agency mortgage-backed securities relative to the benchmark contributed positively to performance, as Agency mortgages outperformed U.S. Treasuries and corporate bonds during the period. In addition, the Fund’s allocation to out-of-benchmark credit supported returns, as these sectors generally outperformed investment grade (IG) corporate bonds. The Fund’s active management and bottom-up security selection also contributed to performance as each credit sleeve outperformed the return of the IG corporate bond index and their own relative benchmark. The Fund’s allocation to U.S. government securities detracted from performance due to duration differences between the Fund and benchmark.
POSITIONING
The Fund invested in U.S. government-guaranteed and high-credit-quality credit assets. The Fund rotated up in credit quality during the period, reinvesting cash from maturing positions into higher-rated bonds. The Fund added marginally to non-U.S. dollar positions via global and emerging markets local currency bonds. The Fund’s average duration remained modestly shorter than that of its benchmark, and its average credit quality was A.
|
Top Contributors
|
|
|
↑
|
Agency Mortgage-Backed Securities (MBS)
|
|
↑
|
Investment Grade Corporate Bonds
|
|
↑
|
Non-Agency Residential MBS
|
|
Top Detractors
|
|
|
↓
|
U.S. Government Securities
|
AVERAGE TOTAL RETURN (%)
|
|
Since Inception
(10/31/2025) |
|
Class I2 (without sales charge)
|
0.21
|
|
Bloomberg U.S. Aggregate Bond Index
|
0.43
|
Visit https://doubleline.com/fund-documents/ for more recent performance information.
KEY FUND STATISTICS
|
Net Assets
|
$6,851,314,066
|
|
Number of Holdings
|
1,700
|
|
Total Advisory Fees Paid
|
$23,662,104
|
|
Portfolio Turnover
|
43%
|
|
Effective Duration
|
5.52 years
|
|
Weighted Average Life
|
6.34 years
|
WHAT DID THE FUND INVEST IN?
|
Credit Quality Breakdown*
|
(% of Net Assets)
|
|
Government
|
24.3
|
|
Agency
|
18.6
|
|
AAA
|
8.6
|
|
AA
|
4.0
|
|
A
|
9.3
|
|
BBB
|
17.3
|
|
BB
|
6.0
|
|
B and Below
|
7.0
|
|
Not Rated
|
2.4
|
|
Other
|
2.5
|
|
Sector Breakdown
|
(% of Net Assets)
|
|
U.S. Government and Agency Mortgage Backed Obligations
|
21.8
|
|
U.S. Corporate Bonds
|
14.6
|
|
U.S. Government and Agency Obligations
|
14.2
|
|
Non-Agency Residential Collateralized Mortgage Obligations
|
10.5
|
|
Affiliated Mutual Funds
|
9.4
|
|
Money Market Funds
|
7.7
|
|
Non-Agency Commercial Mortgage Backed Obligations
|
6.6
|
|
Foreign Corporate Bonds
|
6.1
|
|
U.S. Treasury Bills
|
5.7
|
|
Cash & Other
|
3.4
|
The DoubleLine fund complex has historically used multiple firms to serve as the independent registered public accounting firms across the fund complex in the United States. On August 19, 2025, the Board of Trustees of the Trust considered and approved a proposal to consolidate that work for the entire fund complex with a single firm, Deloitte & Touche LLP, and Deloitte was appointed to serve as the independent registered public accounting firm of each series of the Trust (each, a “Fund”) for the fiscal year ending March 31, 2026. In connection with that transition, PricewaterhouseCoopers LLP, each Fund’s prior independent registered public accounting firm, was dismissed effective as of August 5, 2025.
WHAT WERE THE FUND COSTS FOR THE PAST YEAR? (based on a hypothetical $10,000 investment)
|
Class Name
|
Costs of a $10,000 investment
|
Costs paid as a percentage of a $10,000 investment
|
|
Class N
|
$72
|
0.71%
|
HOW DID THE FUND PERFORM LAST YEAR AND WHAT AFFECTED ITS PERFORMANCE?
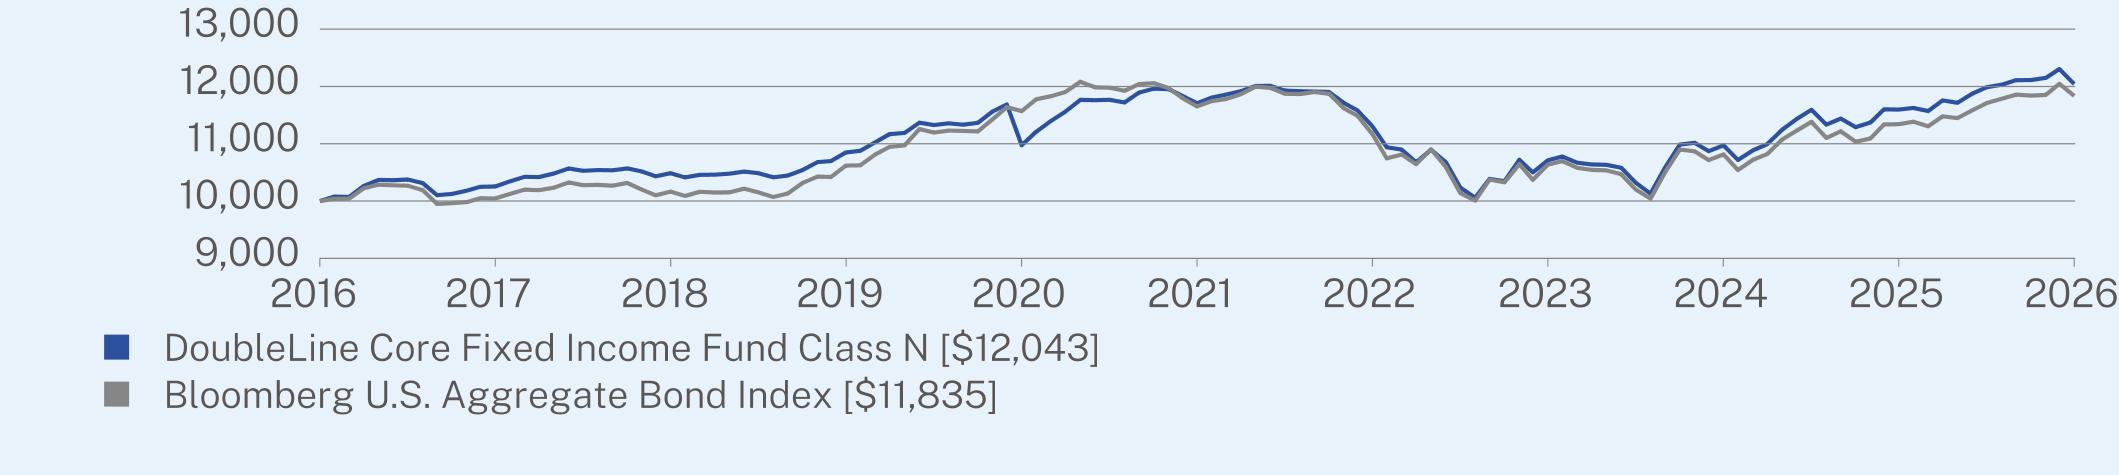
For the 12-month period ended March 31, 2026, the DoubleLine Core Fixed Income Fund underperformed the benchmark Bloomberg U.S. Aggregate Bond Index return of 4.35% on a net asset value basis.
WHAT FACTORS INFLUENCED PERFORMANCE?
The Fund’s overweight to Agency mortgage-backed securities relative to the benchmark contributed positively to performance, as Agency mortgages outperformed U.S. Treasuries and corporate bonds during the period. In addition, the Fund’s allocation to out-of-benchmark credit supported returns, as these sectors generally outperformed investment grade (IG) corporate bonds. The Fund’s active management and bottom-up security selection also contributed to performance as each credit sleeve outperformed the return of the IG corporate bond index and their own relative benchmark. The Fund’s allocation to U.S. government securities detracted from performance due to duration differences between the Fund and benchmark.
POSITIONING
The Fund invested in U.S. government-guaranteed and high-credit-quality credit assets. The Fund rotated up in credit quality during the period, reinvesting cash from maturing positions into higher-rated bonds. The Fund added marginally to non-U.S. dollar positions via global and emerging markets local currency bonds. The Fund’s average duration remained modestly shorter than that of its benchmark, and its average credit quality was A.
|
Top Contributors
|
|
|
↑
|
Agency Mortgage-Backed Securities (MBS)
|
|
↑
|
Investment Grade Corporate Bonds
|
|
↑
|
Non-Agency Residential MBS
|
|
Top Detractors
|
|
|
↓
|
U.S. Government Securities
|
ANNUAL AVERAGE TOTAL RETURN (%)
|
|
1 Year
|
5 Year
|
10 Year
|
|
Class N (without sales charge)
|
3.85
|
0.57
|
1.88
|
|
Bloomberg U.S. Aggregate Bond Index
|
4.35
|
0.31
|
1.70
|
Visit https://doubleline.com/fund-documents/ for more recent performance information.
KEY FUND STATISTICS
|
Net Assets
|
$6,851,314,066
|
|
Number of Holdings
|
1,700
|
|
Total Advisory Fees Paid
|
$23,662,104
|
|
Portfolio Turnover
|
43%
|
|
Effective Duration
|
5.52 years
|
|
Weighted Average Life
|
6.34 years
|
WHAT DID THE FUND INVEST IN?
|
Credit Quality Breakdown*
|
(% of Net Assets)
|
|
Government
|
24.3
|
|
Agency
|
18.6
|
|
AAA
|
8.6
|
|
AA
|
4.0
|
|
A
|
9.3
|
|
BBB
|
17.3
|
|
BB
|
6.0
|
|
B and Below
|
7.0
|
|
Not Rated
|
2.4
|
|
Other
|
2.5
|
|
Sector Breakdown
|
(% of Net Assets)
|
|
U.S. Government and Agency Mortgage Backed Obligations
|
21.8
|
|
U.S. Corporate Bonds
|
14.6
|
|
U.S. Government and Agency Obligations
|
14.2
|
|
Non-Agency Residential Collateralized Mortgage Obligations
|
10.5
|
|
Affiliated Mutual Funds
|
9.4
|
|
Money Market Funds
|
7.7
|
|
Non-Agency Commercial Mortgage Backed Obligations
|
6.6
|
|
Foreign Corporate Bonds
|
6.1
|
|
U.S. Treasury Bills
|
5.7
|
|
Cash & Other
|
3.4
|
The DoubleLine fund complex has historically used multiple firms to serve as the independent registered public accounting firms across the fund complex in the United States. On August 19, 2025, the Board of Trustees of the Trust considered and approved a proposal to consolidate that work for the entire fund complex with a single firm, Deloitte & Touche LLP, and Deloitte was appointed to serve as the independent registered public accounting firm of each series of the Trust (each, a “Fund”) for the fiscal year ending March 31, 2026. In connection with that transition, PricewaterhouseCoopers LLP, each Fund’s prior independent registered public accounting firm, was dismissed effective as of August 5, 2025.
WHAT WERE THE FUND COSTS FOR THE PAST YEAR? (based on a hypothetical $10,000 investment)
|
Class Name
|
Costs of a $10,000 investment
|
Costs paid as a percentage of a $10,000 investment
|
|
Class R6
|
$40
|
0.39%
|
HOW DID THE FUND PERFORM LAST YEAR AND WHAT AFFECTED ITS PERFORMANCE?
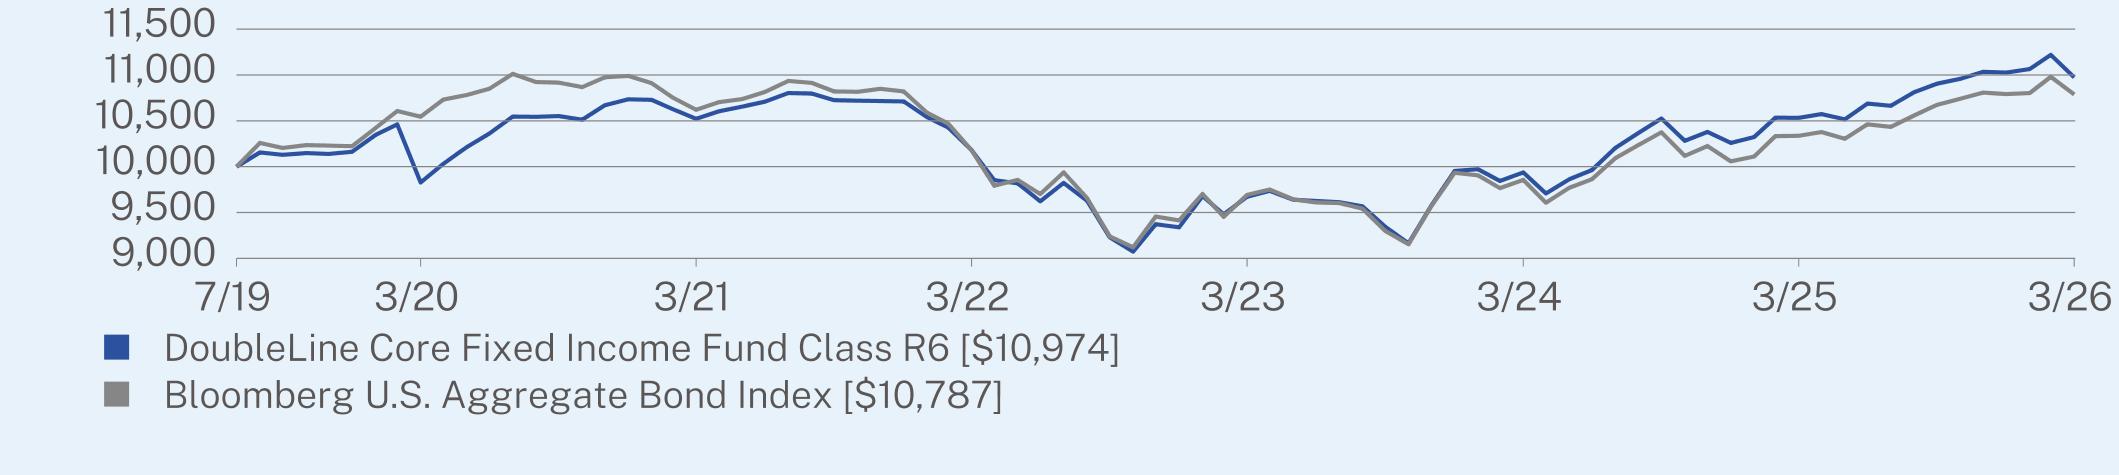
For the 12-month period ended March 31, 2026, the DoubleLine Core Fixed Income Fund underperformed the benchmark Bloomberg U.S. Aggregate Bond Index return of 4.35% on a net asset value basis.
WHAT FACTORS INFLUENCED PERFORMANCE?
The Fund’s overweight to Agency mortgage-backed securities relative to the benchmark contributed positively to performance, as Agency mortgages outperformed U.S. Treasuries and corporate bonds during the period. In addition, the Fund’s allocation to out-of-benchmark credit supported returns, as these sectors generally outperformed investment grade (IG) corporate bonds. The Fund’s active management and bottom-up security selection also contributed to performance as each credit sleeve outperformed the return of the IG corporate bond index and their own relative benchmark. The Fund’s allocation to U.S. government securities detracted from performance due to duration differences between the Fund and benchmark.
POSITIONING
The Fund invested in U.S. government-guaranteed and high-credit-quality credit assets. The Fund rotated up in credit quality during the period, reinvesting cash from maturing positions into higher-rated bonds. The Fund added marginally to non-U.S. dollar positions via global and emerging markets local currency bonds. The Fund’s average duration remained modestly shorter than that of its benchmark, and its average credit quality was A.
|
Top Contributors
|
|
|
↑
|
Agency Mortgage-Backed Securities (MBS)
|
|
↑
|
Investment Grade Corporate Bonds
|
|
↑
|
Non-Agency Residential MBS
|
|
Top Detractors
|
|
|
↓
|
U.S. Government Securities
|
ANNUAL AVERAGE TOTAL RETURN (%)
|
|
1 Year
|
5 Year
|
Since Inception
(07/31/2019) |
|
Class R6 (without sales charge)
|
4.18
|
0.84
|
1.40
|
|
Bloomberg U.S. Aggregate Bond Index
|
4.35
|
0.31
|
1.14
|
Visit https://doubleline.com/fund-documents/ for more recent performance information.
KEY FUND STATISTICS
|
Net Assets
|
$6,851,314,066
|
|
Number of Holdings
|
1,700
|
|
Total Advisory Fees Paid
|
$23,662,104
|
|
Portfolio Turnover
|
43%
|
|
Effective Duration
|
5.52 years
|
|
Weighted Average Life
|
6.34 years
|
WHAT DID THE FUND INVEST IN?
|
Credit Quality Breakdown*
|
(% of Net Assets)
|
|
Government
|
24.3
|
|
Agency
|
18.6
|
|
AAA
|
8.6
|
|
AA
|
4.0
|
|
A
|
9.3
|
|
BBB
|
17.3
|
|
BB
|
6.0
|
|
B and Below
|
7.0
|
|
Not Rated
|
2.4
|
|
Other
|
2.5
|
|
Sector Breakdown
|
(% of Net Assets)
|
|
U.S. Government and Agency Mortgage Backed Obligations
|
21.8
|
|
U.S. Corporate Bonds
|
14.6
|
|
U.S. Government and Agency Obligations
|
14.2
|
|
Non-Agency Residential Collateralized Mortgage Obligations
|
10.5
|
|
Affiliated Mutual Funds
|
9.4
|
|
Money Market Funds
|
7.7
|
|
Non-Agency Commercial Mortgage Backed Obligations
|
6.6
|
|
Foreign Corporate Bonds
|
6.1
|
|
U.S. Treasury Bills
|
5.7
|
|
Cash & Other
|
3.4
|
The DoubleLine fund complex has historically used multiple firms to serve as the independent registered public accounting firms across the fund complex in the United States. On August 19, 2025, the Board of Trustees of the Trust considered and approved a proposal to consolidate that work for the entire fund complex with a single firm, Deloitte & Touche LLP, and Deloitte was appointed to serve as the independent registered public accounting firm of each series of the Trust (each, a “Fund”) for the fiscal year ending March 31, 2026. In connection with that transition, PricewaterhouseCoopers LLP, each Fund’s prior independent registered public accounting firm, was dismissed effective as of August 5, 2025.
WHAT WERE THE FUND COSTS FOR THE PAST YEAR? (based on a hypothetical $10,000 investment)
|
Class Name
|
Costs of a $10,000 investment
|
Costs paid as a percentage of a $10,000 investment
|
|
Class I
|
$95
|
0.93%
|
HOW DID THE FUND PERFORM LAST YEAR AND WHAT AFFECTED ITS PERFORMANCE?
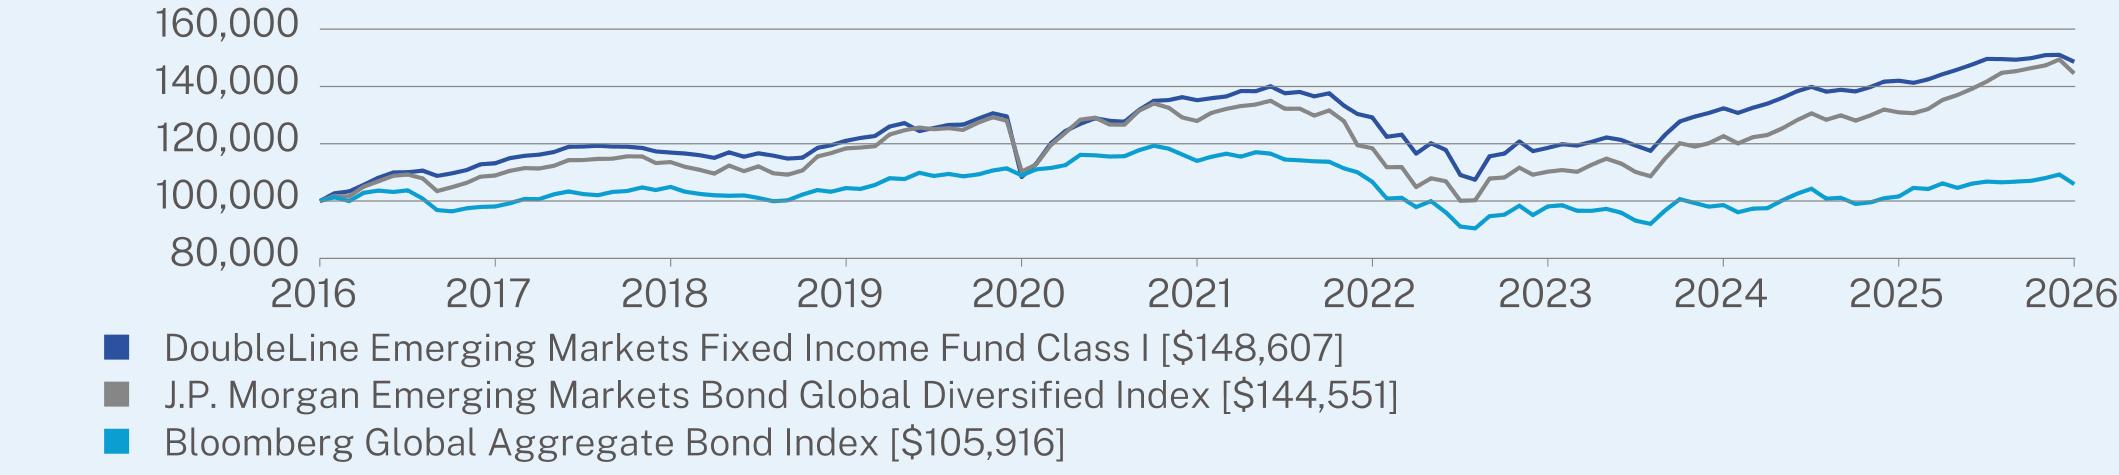
For the 12-month period ended March 31, 2026, the DoubleLine Emerging Markets Fixed Income Fund underperformed the benchmark J.P. Morgan Emerging Markets Bond Global Diversified Index return of 10.38% on a net asset value basis.
WHAT FACTORS INFLUENCED PERFORMANCE?
The Fund’s underweight relative to the benchmark to the Middle East and Europe contributed to performance. The Fund’s overweight to emerging markets corporate debt and underweight to Venezuela detracted from performance.
POSITIONING
The Fund maintained a shorter duration than that of the benchmark. The Fund was overweight emerging markets corporate debt and slightly overweight investment grade credit relative to the benchmark. In terms of regional allocation, the Fund was overweight Latin America and underweight Central and Eastern Europe, the Middle East and Africa (CEEMEA).
|
Top Contributors
|
|
|
↑
|
Corporate Debt Exposure
|
|
↑
|
Venezuela Allocation
|
|
Top Detractors
|
|
|
↓
|
Corporate Debt Exposure
|
|
↓
|
Venezuela Allocation
|
ANNUAL AVERAGE TOTAL RETURN (%)
|
|
1 Year
|
5 Year
|
10 Year
|
|
Class I (without sales charge)
|
4.63
|
1.91
|
4.04
|
|
J.P. Morgan Emerging Markets Bond Global Diversified Index
|
10.38
|
2.47
|
3.75
|
|
Bloomberg Global Aggregate Bond Index
|
4.26
|
-1.46
|
0.58
|
Visit https://doubleline.com/fund-documents/ for more recent performance information.
KEY FUND STATISTICS
|
Net Assets
|
$337,806,624
|
|
Number of Holdings
|
142
|
|
Total Advisory Fees Paid
|
$2,961,408
|
|
Portfolio Turnover
|
46%
|
WHAT DID THE FUND INVEST IN?
|
Credit Quality Breakdown*
|
(% of Net Assets)
|
|
A
|
8.0
|
|
BBB
|
49.2
|
|
BB
|
34.5
|
|
B and Below
|
3.9
|
|
Not Rated
|
0.5
|
|
Other
|
3.9
|
|
Top Ten Holdings
|
(% of Net Assets)
|
|
Banco de Credito del Peru SA, 3.25%, 09/30/2031
|
2.9
|
|
Cemex SAB de CV, 5.13%, 06/08/2026
|
2.4
|
|
Mexico Government International Bond, 4.40%, 02/12/2052
|
2.3
|
|
Chile Electricity PEC SpA, 01/25/2028
|
2.2
|
|
Perusahaan Perseroan Persero PT Perusahaan Listrik Negara, 4.13%, 05/15/2027
|
2.1
|
|
JSW Hydro Energy Ltd., 4.13%, 05/18/2031
|
1.9
|
|
Ecopetrol SA, 5.88%, 11/02/2051
|
1.9
|
|
AL Candelaria Spain SA, 5.75%, 06/15/2033
|
1.9
|
|
Oversea-Chinese Banking Corp. Ltd., 4.60%, 06/15/2032
|
1.8
|
|
OCP SA, 6.75%, 05/02/2034
|
1.8
|
The DoubleLine fund complex has historically used multiple firms to serve as the independent registered public accounting firms across the fund complex in the United States. On August 19, 2025, the Board of Trustees of the Trust considered and approved a proposal to consolidate that work for the entire fund complex with a single firm, Deloitte & Touche LLP, and Deloitte was appointed to serve as the independent registered public accounting firm of each series of the Trust (each, a “Fund”) for the fiscal year ending March 31, 2026. In connection with that transition, PricewaterhouseCoopers LLP, each Fund’s prior independent registered public accounting firm, was dismissed effective as of August 5, 2025.
WHAT WERE THE FUND COSTS FOR THE PAST YEAR? (based on a hypothetical $10,000 investment)
|
Class Name
|
Costs of a $10,000 investment
|
Costs paid as a percentage of a $10,000 investment*,**
|
|
Class I2
|
$40
|
0.97%
|
HOW DID THE FUND PERFORM LAST YEAR AND WHAT AFFECTED ITS PERFORMANCE?
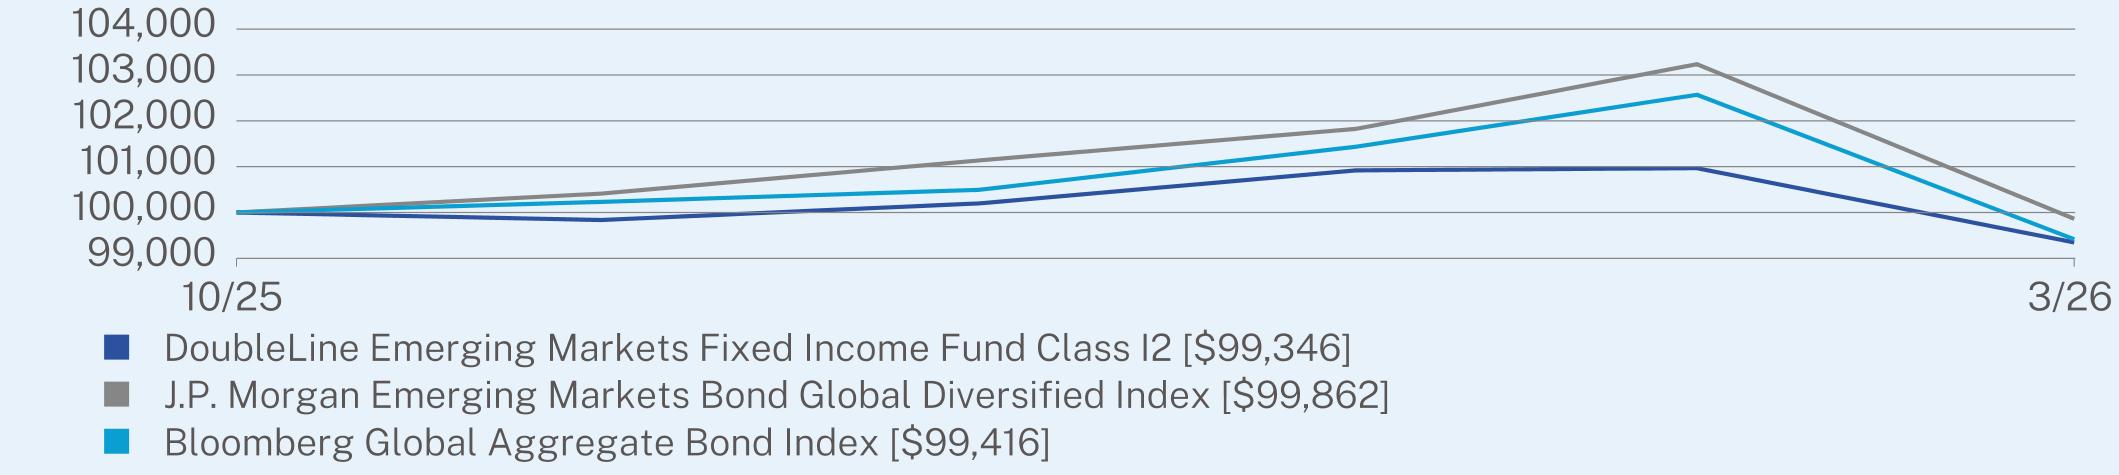
For the 12-month period ended March 31, 2026, the DoubleLine Emerging Markets Fixed Income Fund underperformed the benchmark J.P. Morgan Emerging Markets Bond Global Diversified Index return of 10.38% on a net asset value basis.
WHAT FACTORS INFLUENCED PERFORMANCE?
The Fund’s underweight relative to the benchmark to the Middle East and Europe contributed to performance. The Fund’s overweight to emerging markets corporate debt and underweight to Venezuela detracted from performance.
POSITIONING
The Fund maintained a shorter duration than that of the benchmark. The Fund was overweight emerging markets corporate debt and slightly overweight investment grade credit relative to the benchmark. In terms of regional allocation, the Fund was overweight Latin America and underweight Central and Eastern Europe, the Middle East and Africa (CEEMEA).
|
Top Contributors
|
|
|
↑
|
Corporate Debt Exposure
|
|
↑
|
Venezuela Allocation
|
|
Top Detractors
|
|
|
↓
|
Corporate Debt Exposure
|
|
↓
|
Venezuela Allocation
|
AVERAGE TOTAL RETURN (%)
|
|
Since Inception
(10/31/2025) |
|
Class I2 (without sales charge)
|
-0.65
|
|
J.P. Morgan Emerging Markets Bond Global Diversified Index
|
-0.14
|
|
Bloomberg Global Aggregate Bond Index
|
-0.58
|
Visit https://doubleline.com/fund-documents/ for more recent performance information.
KEY FUND STATISTICS
|
Net Assets
|
$337,806,624
|
|
Number of Holdings
|
142
|
|
Total Advisory Fees Paid
|
$2,961,408
|
|
Portfolio Turnover
|
46%
|
WHAT DID THE FUND INVEST IN?
|
Credit Quality Breakdown*
|
(% of Net Assets)
|
|
A
|
8.0
|
|
BBB
|
49.2
|
|
BB
|
34.5
|
|
B and Below
|
3.9
|
|
Not Rated
|
0.5
|
|
Other
|
3.9
|
|
Top Ten Holdings
|
(% of Net Assets)
|
|
Banco de Credito del Peru SA, 3.25%, 09/30/2031
|
2.9
|
|
Cemex SAB de CV, 5.13%, 06/08/2026
|
2.4
|
|
Mexico Government International Bond, 4.40%, 02/12/2052
|
2.3
|
|
Chile Electricity PEC SpA, 01/25/2028
|
2.2
|
|
Perusahaan Perseroan Persero PT Perusahaan Listrik Negara, 4.13%, 05/15/2027
|
2.1
|
|
JSW Hydro Energy Ltd., 4.13%, 05/18/2031
|
1.9
|
|
Ecopetrol SA, 5.88%, 11/02/2051
|
1.9
|
|
AL Candelaria Spain SA, 5.75%, 06/15/2033
|
1.9
|
|
Oversea-Chinese Banking Corp. Ltd., 4.60%, 06/15/2032
|
1.8
|
|
OCP SA, 6.75%, 05/02/2034
|
1.8
|
The DoubleLine fund complex has historically used multiple firms to serve as the independent registered public accounting firms across the fund complex in the United States. On August 19, 2025, the Board of Trustees of the Trust considered and approved a proposal to consolidate that work for the entire fund complex with a single firm, Deloitte & Touche LLP, and Deloitte was appointed to serve as the independent registered public accounting firm of each series of the Trust (each, a “Fund”) for the fiscal year ending March 31, 2026. In connection with that transition, PricewaterhouseCoopers LLP, each Fund’s prior independent registered public accounting firm, was dismissed effective as of August 5, 2025.
WHAT WERE THE FUND COSTS FOR THE PAST YEAR? (based on a hypothetical $10,000 investment)
|
Class Name
|
Costs of a $10,000 investment
|
Costs paid as a percentage of a $10,000 investment
|
|
Class N
|
$122
|
1.19%
|
HOW DID THE FUND PERFORM LAST YEAR AND WHAT AFFECTED ITS PERFORMANCE?
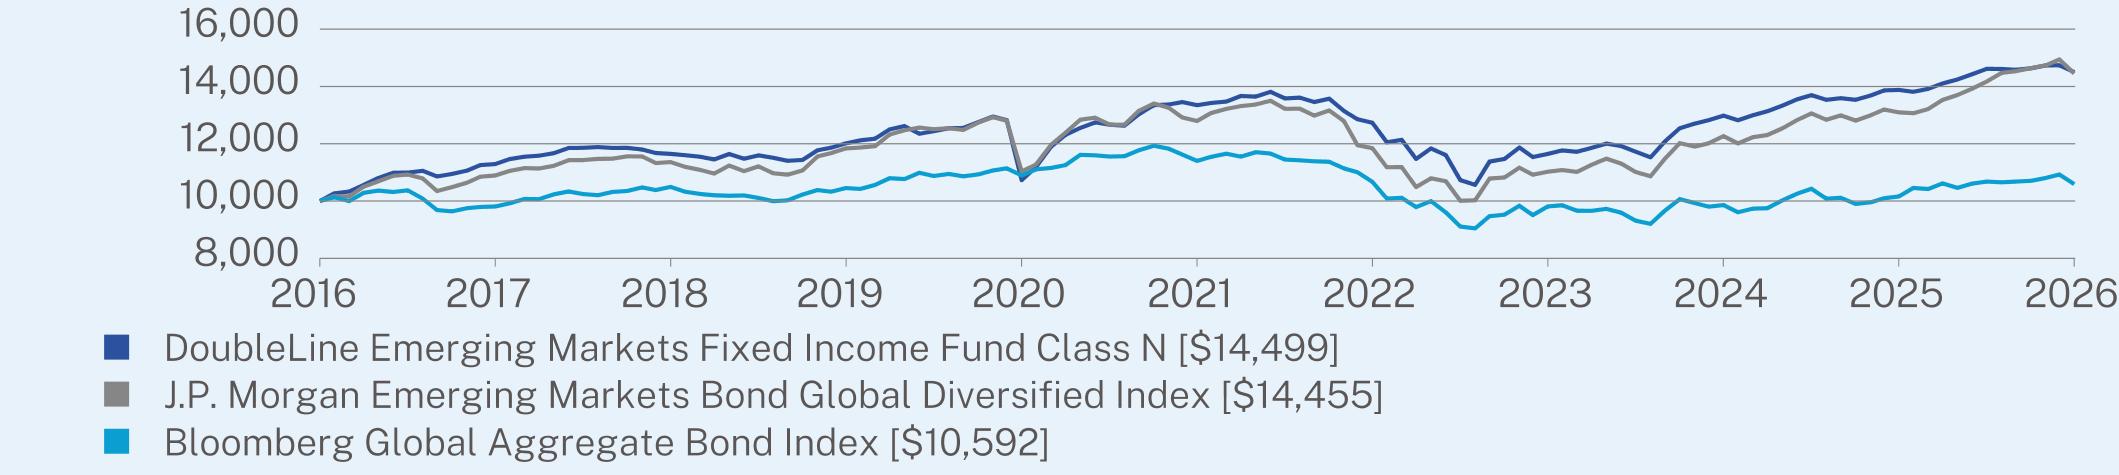
For the 12-month period ended March 31, 2026, the DoubleLine Emerging Markets Fixed Income Fund underperformed the benchmark J.P. Morgan Emerging Markets Bond Global Diversified Index return of 10.38% on a net asset value basis.
WHAT FACTORS INFLUENCED PERFORMANCE?
The Fund’s underweight relative to the benchmark to the Middle East and Europe contributed to performance. The Fund’s overweight to emerging markets corporate debt and underweight to Venezuela detracted from performance.
POSITIONING
The Fund maintained a shorter duration than that of the benchmark. The Fund was overweight emerging markets corporate debt and slightly overweight investment grade credit relative to the benchmark. In terms of regional allocation, the Fund was overweight Latin America and underweight Central and Eastern Europe, the Middle East and Africa (CEEMEA).
|
Top Contributors
|
|
|
↑
|
Corporate Debt Exposure
|
|
↑
|
Venezuela Allocation
|
|
Top Detractors
|
|
|
↓
|
Corporate Debt Exposure
|
|
↓
|
Venezuela Allocation
|
ANNUAL AVERAGE TOTAL RETURN (%)
|
|
1 Year
|
5 Year
|
10 Year
|
|
Class N (without sales charge)
|
4.47
|
1.67
|
3.78
|
|
J.P. Morgan Emerging Markets Bond Global Diversified Index
|
10.38
|
2.47
|
3.75
|
|
Bloomberg Global Aggregate Bond Index
|
4.26
|
-1.46
|
0.58
|
Visit https://doubleline.com/fund-documents/ for more recent performance information.
KEY FUND STATISTICS
|
Net Assets
|
$337,806,624
|
|
Number of Holdings
|
142
|
|
Total Advisory Fees Paid
|
$2,961,408
|
|
Portfolio Turnover
|
46%
|
WHAT DID THE FUND INVEST IN?
|
Credit Quality Breakdown*
|
(% of Net Assets)
|
|
A
|
8.0
|
|
BBB
|
49.2
|
|
BB
|
34.5
|
|
B and Below
|
3.9
|
|
Not Rated
|
0.5
|
|
Other
|
3.9
|
|
Top Ten Holdings
|
(% of Net Assets)
|
|
Banco de Credito del Peru SA, 3.25%, 09/30/2031
|
2.9
|
|
Cemex SAB de CV, 5.13%, 06/08/2026
|
2.4
|
|
Mexico Government International Bond, 4.40%, 02/12/2052
|
2.3
|
|
Chile Electricity PEC SpA, 01/25/2028
|
2.2
|
|
Perusahaan Perseroan Persero PT Perusahaan Listrik Negara, 4.13%, 05/15/2027
|
2.1
|
|
JSW Hydro Energy Ltd., 4.13%, 05/18/2031
|
1.9
|
|
Ecopetrol SA, 5.88%, 11/02/2051
|
1.9
|
|
AL Candelaria Spain SA, 5.75%, 06/15/2033
|
1.9
|
|
Oversea-Chinese Banking Corp. Ltd., 4.60%, 06/15/2032
|
1.8
|
|
OCP SA, 6.75%, 05/02/2034
|
1.8
|
The DoubleLine fund complex has historically used multiple firms to serve as the independent registered public accounting firms across the fund complex in the United States. On August 19, 2025, the Board of Trustees of the Trust considered and approved a proposal to consolidate that work for the entire fund complex with a single firm, Deloitte & Touche LLP, and Deloitte was appointed to serve as the independent registered public accounting firm of each series of the Trust (each, a “Fund”) for the fiscal year ending March 31, 2026. In connection with that transition, PricewaterhouseCoopers LLP, each Fund’s prior independent registered public accounting firm, was dismissed effective as of August 5, 2025.
WHAT WERE THE FUND COSTS FOR THE PAST YEAR? (based on a hypothetical $10,000 investment)
|
Class Name
|
Costs of a $10,000 investment
|
Costs paid as a percentage of a $10,000 investment
|
|
Class I
|
$46
|
0.45%
|
HOW DID THE FUND PERFORM LAST YEAR AND WHAT AFFECTED ITS PERFORMANCE?
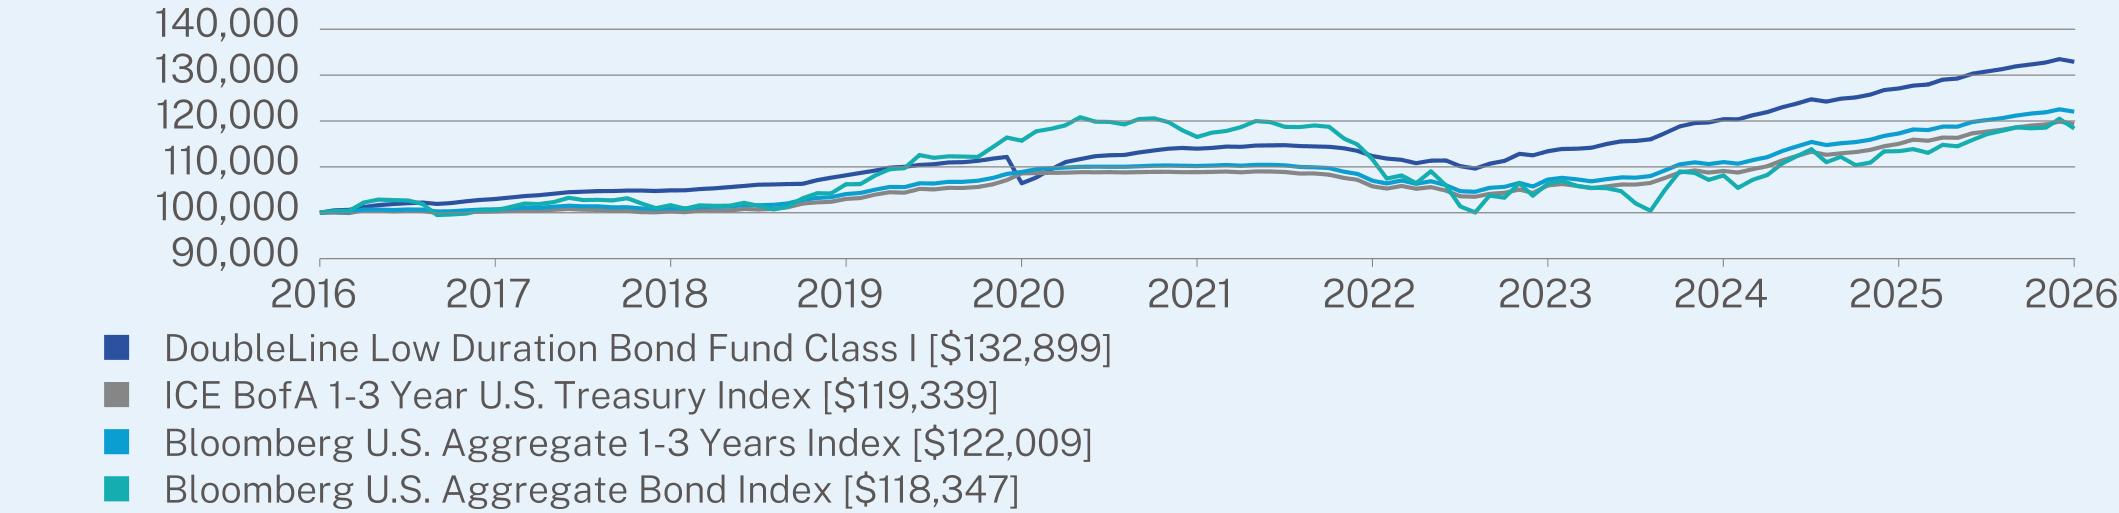
For the 12-month period ended March 31, 2026, the DoubleLine Low Duration Bond Fund outperformed the benchmark ICE BofA 1-3 Year U.S. Treasury Index return of 3.75% on a net asset value basis.
WHAT FACTORS INFLUENCED PERFORMANCE?
The Fund’s credit sector allocation contributed to performance, as all credit sectors within the Fund outperformed the return of the benchmark. The Fund’s U.S. government securities and Agency mortgage-backed securities allocations also generated healthy returns and outperformed the benchmark.
POSITIONING
The Fund maintained a high credit quality, with less than 5% in below-investment-grade exposures and around two-thirds in AAA and U.S. government-guaranteed assets. The Fund rotated up in quality during the period, deploying cash from maturities into higher-rated bonds. The Fund increased investment grade corporate bond and Agency and non-Agency residential mortgage-backed securities allocations and reduced U.S. government securities and collateralized loan obligation allocations.
|
Top Contributors
|
|
|
↑
|
U.S. Government Securities
|
|
↑
|
Non-Agency Commercial and Residential Mortgage-Backed Securities
|
|
↑
|
Investment Grade Corporates
|
|
Top Detractors
|
|
|
↓
|
All holdings within the Fund contributed to performance
|
ANNUAL AVERAGE TOTAL RETURN (%)
|
|
1 Year
|
5 Year
|
10 Year
|
|
Class I (without sales charge)
|
4.57
|
3.12
|
2.89
|
|
ICE BofA 1-3 Year U.S. Treasury Index
|
3.75
|
1.86
|
1.78
|
|
Bloomberg U.S. Aggregate 1-3 Years Index
|
4.03
|
2.06
|
2.01
|
|
Bloomberg U.S. Aggregate Bond Index
|
4.35
|
0.31
|
1.70
|
Visit https://doubleline.com/fund-documents/ for more recent performance information.
KEY FUND STATISTICS
|
Net Assets
|
$6,494,782,012
|
|
Number of Holdings
|
840
|
|
Total Advisory Fees Paid
|
$22,026,836
|
|
Portfolio Turnover
|
54%
|
|
Effective Duration
|
1.75 years
|
|
Weighted Average Life
|
2.86 years
|
WHAT DID THE FUND INVEST IN?
|
Credit Quality Breakdown*
|
(% of Net Assets)
|
|
Government
|
23.3
|
|
Agency
|
5.9
|
|
AAA
|
36.0
|
|
AA
|
6.0
|
|
A
|
11.0
|
|
BBB
|
14.7
|
|
BB
|
1.3
|
|
B and Below
|
0.2
|
|
Not Rated
|
1.1
|
|
Other
|
0.5
|
|
Sector Breakdown
|
(% of Net Assets)
|
|
U.S. Government and Agency Obligations
|
22.5
|
|
Non-Agency Commercial Mortgage Backed Obligations
|
14.8
|
|
Non-Agency Residential Collateralized Mortgage Obligations
|
14.3
|
|
U.S. Corporate Bonds
|
12.7
|
|
Collateralized Loan Obligations
|
9.1
|
|
Asset Backed Obligations
|
8.8
|
|
Foreign Corporate Bonds
|
7.7
|
|
U.S. Government and Agency Mortgage Backed Obligations
|
6.4
|
|
Foreign Government Bonds, Foreign Agencies and Foreign Government Sponsored Corporations
|
2.4
|
|
Cash & Other
|
1.3
|
The DoubleLine fund complex has historically used multiple firms to serve as the independent registered public accounting firms across the fund complex in the United States. On August 19, 2025, the Board of Trustees of the Trust considered and approved a proposal to consolidate that work for the entire fund complex with a single firm, Deloitte & Touche LLP, and Deloitte was appointed to serve as the independent registered public accounting firm of each series of the Trust (each, a “Fund”) for the fiscal year ending March 31, 2026. In connection with that transition, PricewaterhouseCoopers LLP, each Fund’s prior independent registered public accounting firm, was dismissed effective as of August 5, 2025.
WHAT WERE THE FUND COSTS FOR THE PAST YEAR? (based on a hypothetical $10,000 investment)
|
Class Name
|
Costs of a $10,000 investment
|
Costs paid as a percentage of a $10,000 investment*,**
|
|
Class I2
|
$21
|
0.50%
|
HOW DID THE FUND PERFORM LAST YEAR AND WHAT AFFECTED ITS PERFORMANCE?
For the 12-month period ended March 31, 2026, the DoubleLine Low Duration Bond Fund outperformed the benchmark ICE BofA 1-3 Year U.S. Treasury Index return of 3.75% on a net asset value basis.
WHAT FACTORS INFLUENCED PERFORMANCE?
The Fund’s credit sector allocation contributed to performance, as all credit sectors within the Fund outperformed the return of the benchmark. The Fund’s U.S. government securities and Agency mortgage-backed securities allocations also generated healthy returns and outperformed the benchmark.
POSITIONING
The Fund maintained a high credit quality, with less than 5% in below-investment-grade exposures and around two-thirds in AAA and U.S. government-guaranteed assets. The Fund rotated up in quality during the period, deploying cash from maturities into higher-rated bonds. The Fund increased investment grade corporate bond and Agency and non-Agency residential mortgage-backed securities allocations and reduced U.S. government securities and collateralized loan obligation allocations.
|
Top Contributors
|
|
|
↑
|
U.S. Government Securities
|
|
↑
|
Non-Agency Commercial and Residential Mortgage-Backed Securities
|
|
↑
|
Investment Grade Corporates
|
|
Top Detractors
|
|
|
↓
|
All holdings within the Fund contributed to performance
|
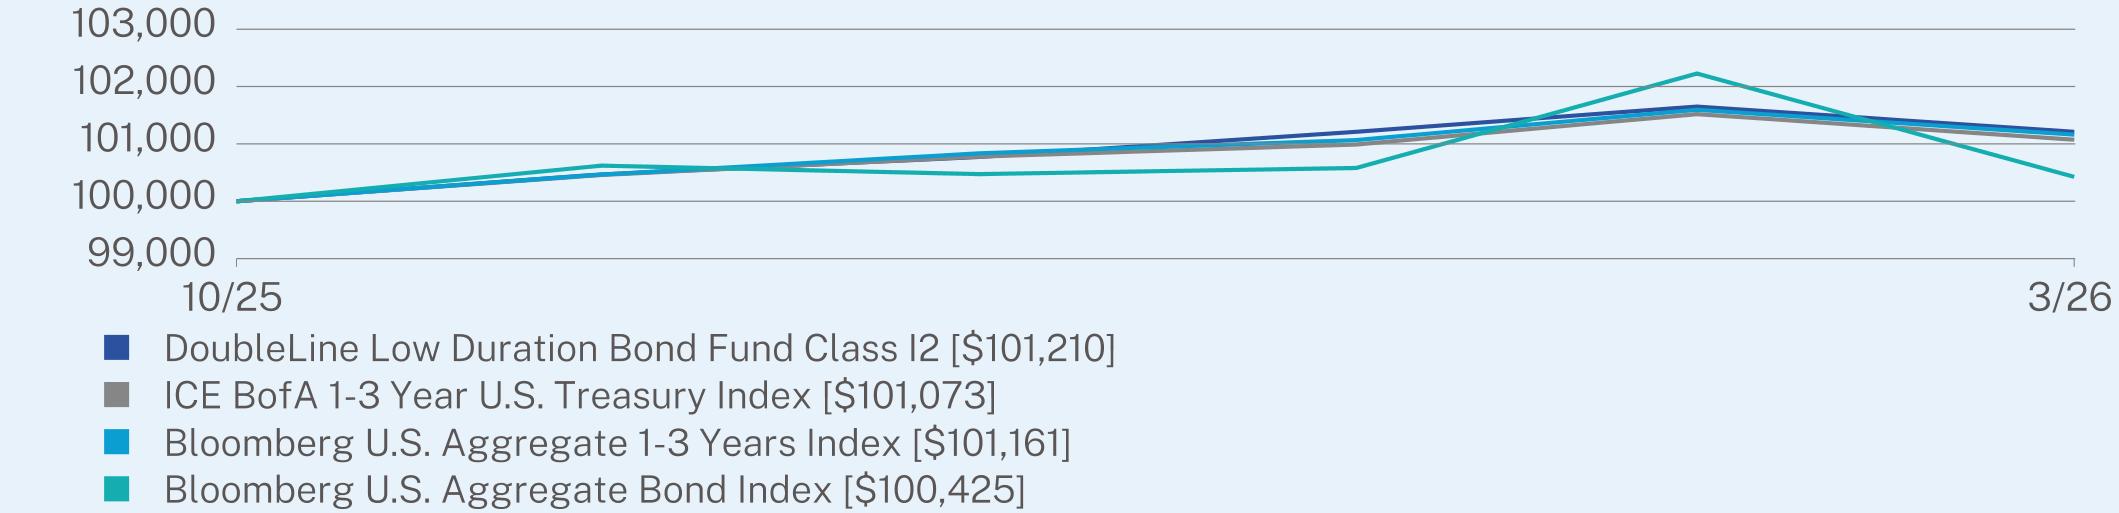
AVERAGE TOTAL RETURN (%)
|
|
Since Inception
(10/31/2025) |
|
Class I2 (without sales charge)
|
1.21
|
|
ICE BofA 1-3 Year U.S. Treasury Index
|
1.07
|
|
Bloomberg U.S. Aggregate 1-3 Years Index
|
1.16
|
|
Bloomberg U.S. Aggregate Bond Index
|
0.43
|
Visit https://doubleline.com/fund-documents/ for more recent performance information.
KEY FUND STATISTICS
|
Net Assets
|
$6,494,782,012
|
|
Number of Holdings
|
840
|
|
Total Advisory Fees Paid
|
$22,026,836
|
|
Portfolio Turnover
|
54%
|
|
Effective Duration
|
1.75 years
|
|
Weighted Average Life
|
2.86 years
|
WHAT DID THE FUND INVEST IN?
|
Credit Quality Breakdown*
|
(% of Net Assets)
|
|
Government
|
23.3
|
|
Agency
|
5.9
|
|
AAA
|
36.0
|
|
AA
|
6.0
|
|
A
|
11.0
|
|
BBB
|
14.7
|
|
BB
|
1.3
|
|
B and Below
|
0.2
|
|
Not Rated
|
1.1
|
|
Other
|
0.5
|
|
Sector Breakdown
|
(% of Net Assets)
|
|
U.S. Government and Agency Obligations
|
22.5
|
|
Non-Agency Commercial Mortgage Backed Obligations
|
14.8
|
|
Non-Agency Residential Collateralized Mortgage Obligations
|
14.3
|
|
U.S. Corporate Bonds
|
12.7
|
|
Collateralized Loan Obligations
|
9.1
|
|
Asset Backed Obligations
|
8.8
|
|
Foreign Corporate Bonds
|
7.7
|
|
U.S. Government and Agency Mortgage Backed Obligations
|
6.4
|
|
Foreign Government Bonds, Foreign Agencies and Foreign Government Sponsored Corporations
|
2.4
|
|
Cash & Other
|
1.3
|
The DoubleLine fund complex has historically used multiple firms to serve as the independent registered public accounting firms across the fund complex in the United States. On August 19, 2025, the Board of Trustees of the Trust considered and approved a proposal to consolidate that work for the entire fund complex with a single firm, Deloitte & Touche LLP, and Deloitte was appointed to serve as the independent registered public accounting firm of each series of the Trust (each, a “Fund”) for the fiscal year ending March 31, 2026. In connection with that transition, PricewaterhouseCoopers LLP, each Fund’s prior independent registered public accounting firm, was dismissed effective as of August 5, 2025.
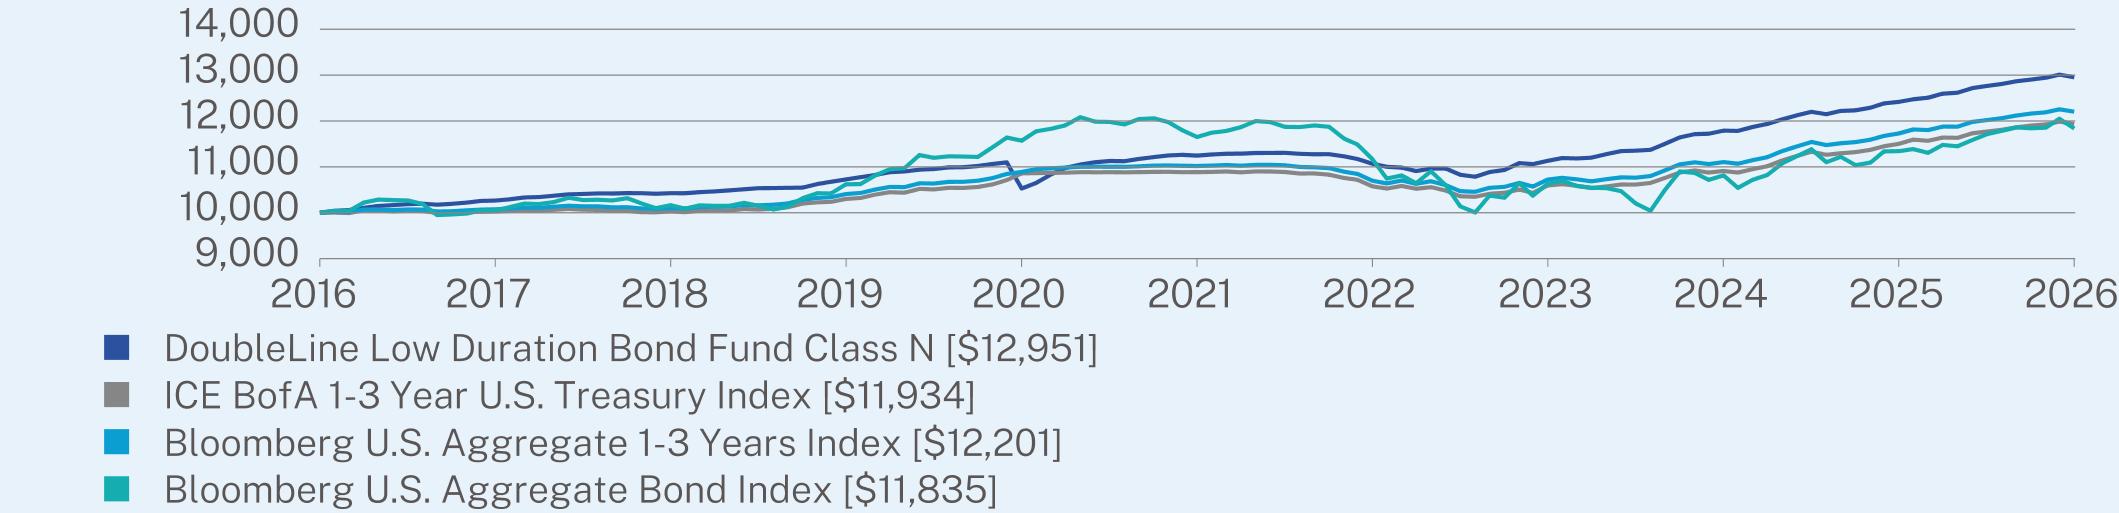
WHAT WERE THE FUND COSTS FOR THE PAST YEAR? (based on a hypothetical $10,000 investment)
|
Class Name
|
Costs of a $10,000 investment
|
Costs paid as a percentage of a $10,000 investment
|
|
Class N
|
$72
|
0.70%
|
HOW DID THE FUND PERFORM LAST YEAR AND WHAT AFFECTED ITS PERFORMANCE?
For the 12-month period ended March 31, 2026, the DoubleLine Low Duration Bond Fund outperformed the benchmark ICE BofA 1-3 Year U.S. Treasury Index return of 3.75% on a net asset value basis.
WHAT FACTORS INFLUENCED PERFORMANCE?
The Fund’s credit sector allocation contributed to performance, as all credit sectors within the Fund outperformed the return of the benchmark. The Fund’s U.S. government securities and Agency mortgage-backed securities allocations also generated healthy returns and outperformed the benchmark.
POSITIONING
The Fund maintained a high credit quality, with less than 5% in below-investment-grade exposures and around two-thirds in AAA and U.S. government-guaranteed assets. The Fund rotated up in quality during the period, deploying cash from maturities into higher-rated bonds. The Fund increased investment grade corporate bond and Agency and non-Agency residential mortgage-backed securities allocations and reduced U.S. government securities and collateralized loan obligation allocations.
|
Top Contributors
|
|
|
↑
|
U.S. Government Securities
|
|
↑
|
Non-Agency Commercial and Residential Mortgage-Backed Securities
|
|
↑
|
Investment Grade Corporates
|
|
Top Detractors
|
|
|
↓
|
All holdings within the Fund contributed to performance
|
ANNUAL AVERAGE TOTAL RETURN (%)
|
|
1 Year
|
5 Year
|
10 Year
|
|
Class N (without sales charge)
|
4.31
|
2.87
|
2.62
|
|
ICE BofA 1-3 Year U.S. Treasury Index
|
3.75
|
1.86
|
1.78
|
|
Bloomberg U.S. Aggregate 1-3 Years Index
|
4.03
|
2.06
|
2.01
|
|
Bloomberg U.S. Aggregate Bond Index
|
4.35
|
0.31
|
1.70
|
Visit https://doubleline.com/fund-documents/ for more recent performance information.
KEY FUND STATISTICS
|
Net Assets
|
$6,494,782,012
|
|
Number of Holdings
|
840
|
|
Total Advisory Fees Paid
|
$22,026,836
|
|
Portfolio Turnover
|
54%
|
|
Effective Duration
|
1.75 years
|
|
Weighted Average Life
|
2.86 years
|
WHAT DID THE FUND INVEST IN?
|
Credit Quality Breakdown*
|
(% of Net Assets)
|
|
Government
|
23.3
|
|
Agency
|
5.9
|
|
AAA
|
36.0
|
|
AA
|
6.0
|
|
A
|
11.0
|
|
BBB
|
14.7
|
|
BB
|
1.3
|
|
B and Below
|
0.2
|
|
Not Rated
|
1.1
|
|
Other
|
0.5
|
|
Sector Breakdown
|
(% of Net Assets)
|
|
U.S. Government and Agency Obligations
|
22.5
|
|
Non-Agency Commercial Mortgage Backed Obligations
|
14.8
|
|
Non-Agency Residential Collateralized Mortgage Obligations
|
14.3
|
|
U.S. Corporate Bonds
|
12.7
|
|
Collateralized Loan Obligations
|
9.1
|
|
Asset Backed Obligations
|
8.8
|
|
Foreign Corporate Bonds
|
7.7
|
|
U.S. Government and Agency Mortgage Backed Obligations
|
6.4
|
|
Foreign Government Bonds, Foreign Agencies and Foreign Government Sponsored Corporations
|
2.4
|
|
Cash & Other
|
1.3
|
The DoubleLine fund complex has historically used multiple firms to serve as the independent registered public accounting firms across the fund complex in the United States. On August 19, 2025, the Board of Trustees of the Trust considered and approved a proposal to consolidate that work for the entire fund complex with a single firm, Deloitte & Touche LLP, and Deloitte was appointed to serve as the independent registered public accounting firm of each series of the Trust (each, a “Fund”) for the fiscal year ending March 31, 2026. In connection with that transition, PricewaterhouseCoopers LLP, each Fund’s prior independent registered public accounting firm, was dismissed effective as of August 5, 2025.
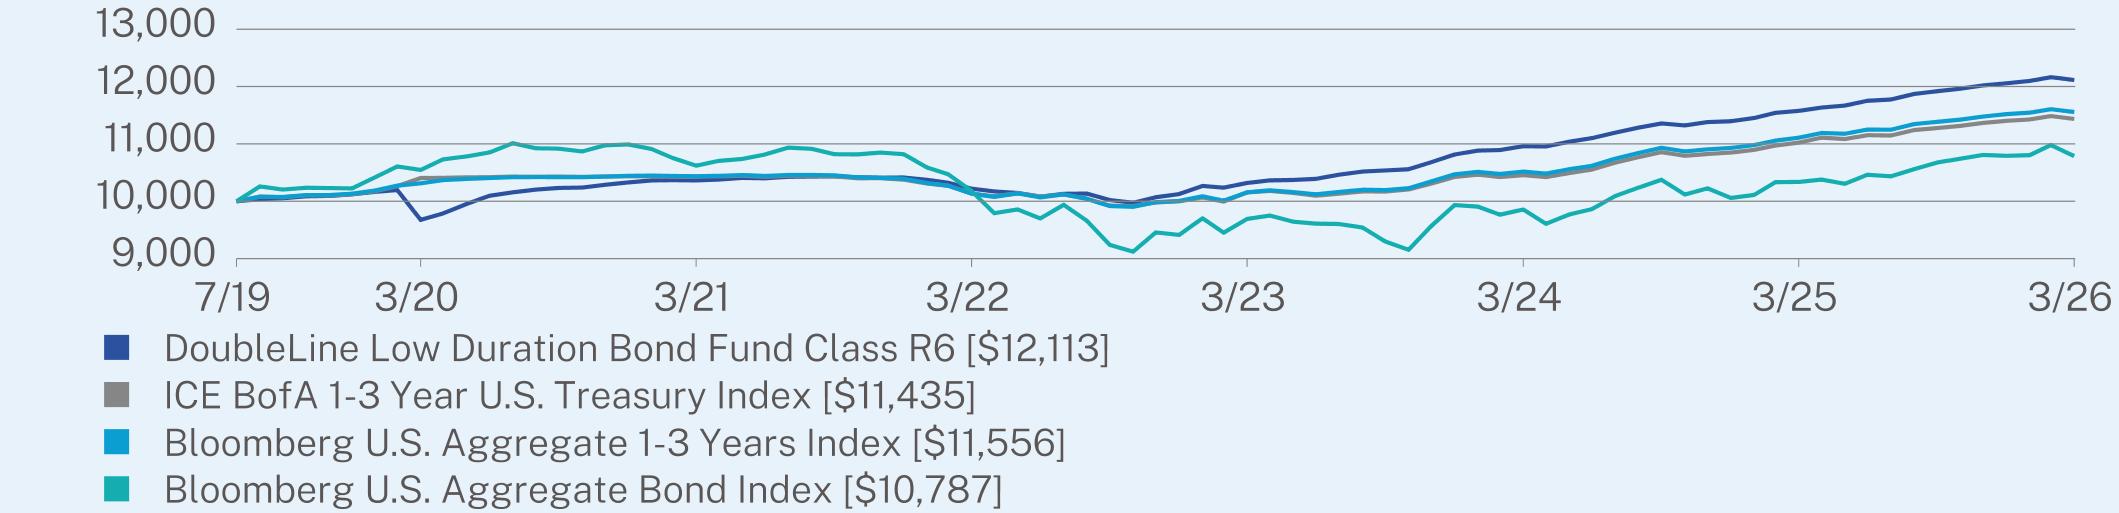
WHAT WERE THE FUND COSTS FOR THE PAST YEAR? (based on a hypothetical $10,000 investment)
|
Class Name
|
Costs of a $10,000 investment
|
Costs paid as a percentage of a $10,000 investment
|
|
Class R6
|
$40
|
0.39%
|
HOW DID THE FUND PERFORM LAST YEAR AND WHAT AFFECTED ITS PERFORMANCE?
For the 12-month period ended March 31, 2026, the DoubleLine Low Duration Bond Fund outperformed the benchmark ICE BofA 1-3 Year U.S. Treasury Index return of 3.75% on a net asset value basis.
WHAT FACTORS INFLUENCED PERFORMANCE?
The Fund’s credit sector allocation contributed to performance, as all credit sectors within the Fund outperformed the return of the benchmark. The Fund’s U.S. government securities and Agency mortgage-backed securities allocations also generated healthy returns and outperformed the benchmark.
POSITIONING
The Fund maintained a high credit quality, with less than 5% in below-investment-grade exposures and around two-thirds in AAA and U.S. government-guaranteed assets. The Fund rotated up in quality during the period, deploying cash from maturities into higher-rated bonds. The Fund increased investment grade corporate bond and Agency and non-Agency residential mortgage-backed securities allocations and reduced U.S. government securities and collateralized loan obligation allocations.
|
Top Contributors
|
|
|
↑
|
U.S. Government Securities
|
|
↑
|
Non-Agency Commercial and Residential Mortgage-Backed Securities
|
|
↑
|
Investment Grade Corporates
|
|
Top Detractors
|
|
|
↓
|
All holdings within the Fund contributed to performance
|
ANNUAL AVERAGE TOTAL RETURN (%)
|
|
1 Year
|
5 Year
|
Since Inception
(07/31/2019) |
|
Class R6 (without sales charge)
|
4.64
|
3.17
|
2.92
|
|
ICE BofA 1-3 Year U.S. Treasury Index
|
3.75
|
1.86
|
2.03
|
|
Bloomberg U.S. Aggregate 1-3 Years Index
|
4.03
|
2.06
|
2.19
|
|
Bloomberg U.S. Aggregate Bond Index
|
4.35
|
0.31
|
1.14
|
Visit https://doubleline.com/fund-documents/ for more recent performance information.
KEY FUND STATISTICS
|
Net Assets
|
$6,494,782,012
|
|
Number of Holdings
|
840
|
|
Total Advisory Fees Paid
|
$22,026,836
|
|
Portfolio Turnover
|
54%
|
|
Effective Duration
|
1.75 years
|
|
Weighted Average Life
|
2.86 years
|
WHAT DID THE FUND INVEST IN?
|
Credit Quality Breakdown*
|
(% of Net Assets)
|
|
Government
|
23.3
|
|
Agency
|
5.9
|
|
AAA
|
36.0
|
|
AA
|
6.0
|
|
A
|
11.0
|
|
BBB
|
14.7
|
|
BB
|
1.3
|
|
B and Below
|
0.2
|
|
Not Rated
|
1.1
|
|
Other
|
0.5
|
|
Sector Breakdown
|
(% of Net Assets)
|
|
U.S. Government and Agency Obligations
|
22.5
|
|
Non-Agency Commercial Mortgage Backed Obligations
|
14.8
|
|
Non-Agency Residential Collateralized Mortgage Obligations
|
14.3
|
|
U.S. Corporate Bonds
|
12.7
|
|
Collateralized Loan Obligations
|
9.1
|
|
Asset Backed Obligations
|
8.8
|
|
Foreign Corporate Bonds
|
7.7
|
|
U.S. Government and Agency Mortgage Backed Obligations
|
6.4
|
|
Foreign Government Bonds, Foreign Agencies and Foreign Government Sponsored Corporations
|
2.4
|
|
Cash & Other
|
1.3
|
The DoubleLine fund complex has historically used multiple firms to serve as the independent registered public accounting firms across the fund complex in the United States. On August 19, 2025, the Board of Trustees of the Trust considered and approved a proposal to consolidate that work for the entire fund complex with a single firm, Deloitte & Touche LLP, and Deloitte was appointed to serve as the independent registered public accounting firm of each series of the Trust (each, a “Fund”) for the fiscal year ending March 31, 2026. In connection with that transition, PricewaterhouseCoopers LLP, each Fund’s prior independent registered public accounting firm, was dismissed effective as of August 5, 2025.
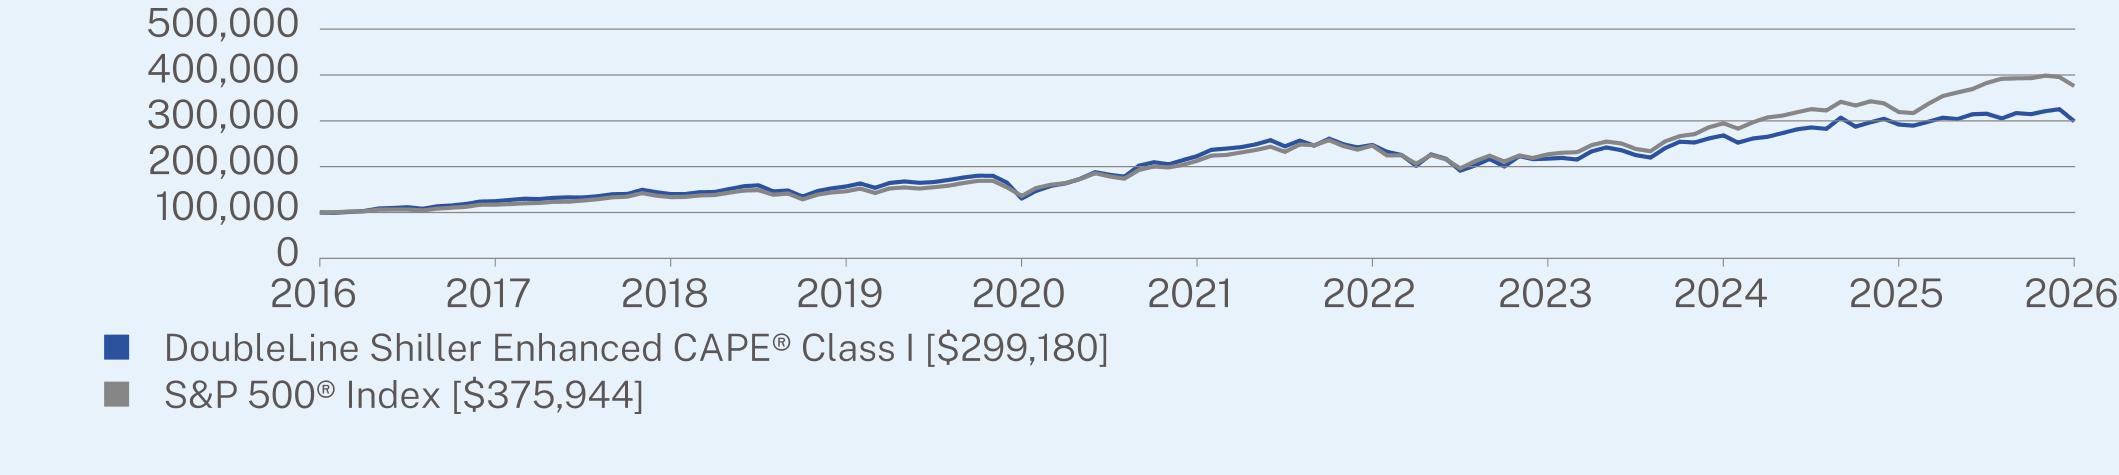
WHAT WERE THE FUND COSTS FOR THE PAST YEAR? (based on a hypothetical $10,000 investment)
|
Class Name
|
Costs of a $10,000 investment
|
Costs paid as a percentage of a $10,000 investment
|
|
Class I
|
$56
|
0.55%
|
HOW DID THE FUND PERFORM LAST YEAR AND WHAT AFFECTED ITS PERFORMANCE?
For the 12-month period ended March 31, 2026, the DoubleLine Shiller Enhanced CAPE® underperformed the benchmark S&P 500 Index® return of 17.80% on a net asset value basis.
WHAT FACTORS INFLUENCED PERFORMANCE?
Three of the Fund’s seven sector allocations appreciated in value. The communication services allocation was the biggest contributor to Fund performance while real estate was the biggest detractor. All sectors within the Fund’s fixed-income portfolio increased in value. The biggest contributor to fixed-income portfolio performance by sector was non-Agency mortgage-backed securities while the laggard was U.S. government securities.
POSITIONING
The Shiller Barclays CAPE® U.S. Sector Total Return USD Index, to which the Fund gained exposure through the use of swap contracts, was allocated to seven sectors: consumer discretionary, consumer staples, communication services, financials, health care, materials and real estate. The Fund’s use of swap contracts to gain exposure to equities facilitated investment of the Fund’s remaining assets in fixed income securities across nine sectors: bank loans, investment grade corporate bonds, Agency residential mortgage-backed securities (RMBS), non-Agency RMBS, asset-backed securities, emerging markets fixed income, commercial MBS, collateralized loan obligations and U.S. government securities.
|
Top Contributors
|
|
|
↑
|
Communication Services
|
|
↑
|
Consumer Discretionary
|
|
↑
|
Materials
|
|
↑
|
Fixed-Income Portfolio Exposure to Asset-Backed Securities
|
|
Top Detractors
|
|
|
↓
|
Real Estate
|
|
↓
|
Consumer Staples
|
|
↓
|
Financials
|
ANNUAL AVERAGE TOTAL RETURN (%)
|
|
1 Year
|
5 Year
|
10 Year
|
|
Class I (without sales charge)
|
2.53
|
6.07
|
11.58
|
|
S&P 500® Index
|
17.80
|
12.06
|
14.16
|
Visit https://doubleline.com/fund-documents/ for more recent performance information.
KEY FUND STATISTICS
|
Net Assets
|
$2,840,947,019
|
|
Number of Holdings
|
788
|
|
Total Advisory Fees Paid
|
$15,299,505
|
|
Portfolio Turnover
|
48%
|
WHAT DID THE FUND INVEST IN?
|
Credit Quality Breakdown*
|
(% of Net Assets)
|
|
Government
|
26.9
|
|
Agency
|
5.5
|
|
AAA
|
30.0
|
|
AA
|
6.4
|
|
A
|
8.5
|
|
BBB
|
14.4
|
|
BB
|
1.3
|
|
B and Below
|
3.1
|
|
Not Rated
|
3.0
|
|
Other
|
0.9
|
|
Sector Breakdown
|
(% of Net Assets)
|
|
U.S. Government and Agency Obligations
|
25.9
|
|
Non-Agency Residential Collateralized Mortgage Obligations
|
14.4
|
|
U.S. Corporate Bonds
|
13.6
|
|
Non-Agency Commercial Mortgage Backed Obligations
|
12.8
|
|
Collateralized Loan Obligations
|
10.6
|
|
Asset Backed Obligations
|
9.4
|
|
U.S. Government and Agency Mortgage Backed Obligations
|
6.5
|
|
Foreign Corporate Bonds
|
5.9
|
|
Bank Loans
|
2.1
|
|
Cash & Other
|
-1.2
|
|
CAPE Sector Breakdown*
|
(% of Net Assets)
|
|
Communication Services
|
25.0
|
|
Consumer Discretionary
|
25.1
|
|
Health Care
|
25.0
|
|
Real Estate
|
24.9
|
The DoubleLine fund complex has historically used multiple firms to serve as the independent registered public accounting firms across the fund complex in the United States. On August 19, 2025, the Board of Trustees of the Trust considered and approved a proposal to consolidate that work for the entire fund complex with a single firm, Deloitte & Touche LLP, and Deloitte was appointed to serve as the independent registered public accounting firm of each series of the Trust (each, a “Fund”) for the fiscal year ending March 31, 2026. In connection with that transition, PricewaterhouseCoopers LLP, each Fund’s prior independent registered public accounting firm, was dismissed effective as of August 5, 2025.
WHAT WERE THE FUND COSTS FOR THE PAST YEAR? (based on a hypothetical $10,000 investment)
|
Class Name
|
Costs of a $10,000 investment
|
Costs paid as a percentage of a $10,000 investment*,**
|
|
Class I2
|
$25
|
0.61%
|
HOW DID THE FUND PERFORM LAST YEAR AND WHAT AFFECTED ITS PERFORMANCE?
For the 12-month period ended March 31, 2026, the DoubleLine Shiller Enhanced CAPE® underperformed the benchmark S&P 500 Index® return of 17.80% on a net asset value basis.
WHAT FACTORS INFLUENCED PERFORMANCE?
Three of the Fund’s seven sector allocations appreciated in value. The communication services allocation was the biggest contributor to Fund performance while real estate was the biggest detractor. All sectors within the Fund’s fixed-income portfolio increased in value. The biggest contributor to fixed-income portfolio performance by sector was non-Agency mortgage-backed securities while the laggard was U.S. government securities.
POSITIONING
The Shiller Barclays CAPE® U.S. Sector Total Return USD Index, to which the Fund gained exposure through the use of swap contracts, was allocated to seven sectors: consumer discretionary, consumer staples, communication services, financials, health care, materials and real estate. The Fund’s use of swap contracts to gain exposure to equities facilitated investment of the Fund’s remaining assets in fixed income securities across nine sectors: bank loans, investment grade corporate bonds, Agency residential mortgage-backed securities (RMBS), non-Agency RMBS, asset-backed securities, emerging markets fixed income, commercial MBS, collateralized loan obligations and U.S. government securities.
|
Top Contributors
|
|
|
↑
|
Communication Services
|
|
↑
|
Consumer Discretionary
|
|
↑
|
Materials
|
|
↑
|
Fixed-Income Portfolio Exposure to Asset-Backed Securities
|
|
Top Detractors
|
|
|
↓
|
Real Estate
|
|
↓
|
Consumer Staples
|
|
↓
|
Financials
|
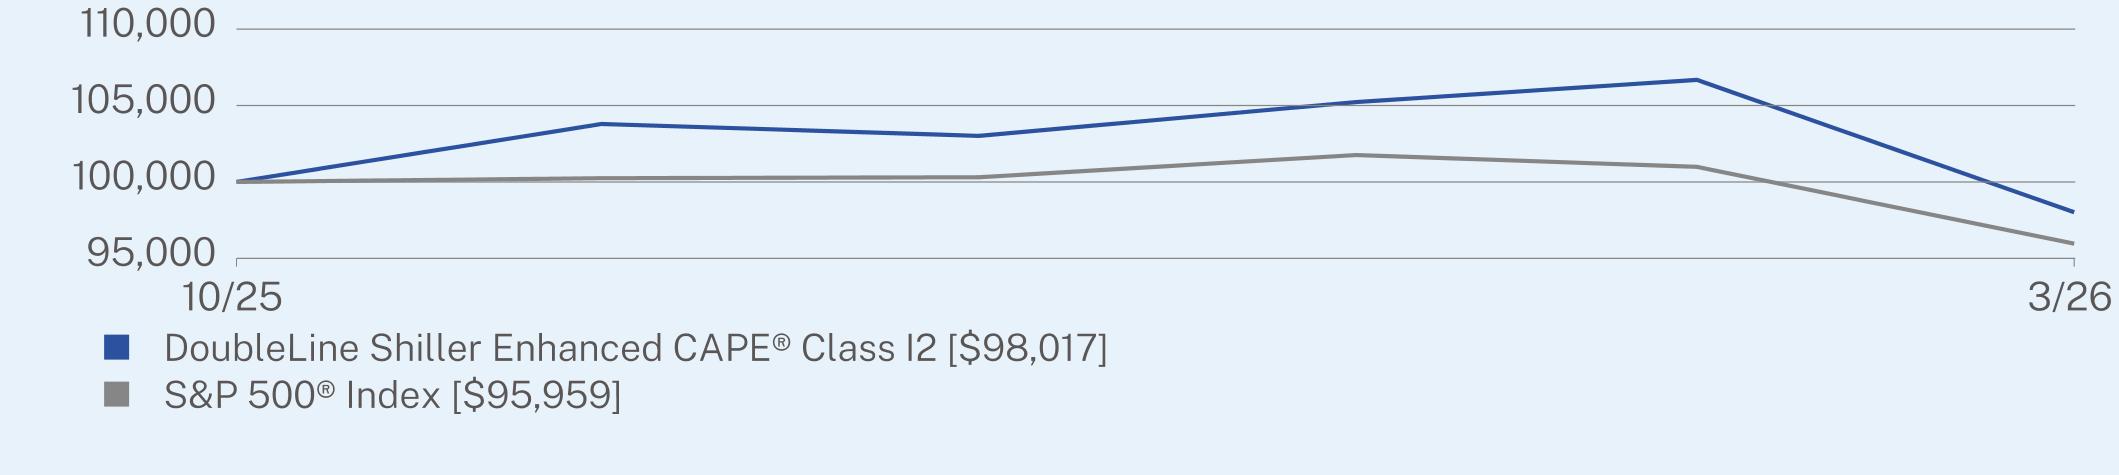
AVERAGE TOTAL RETURN (%)
|
|
Since Inception
(10/31/2025) |
|
Class I2 (without sales charge)
|
-1.98
|
|
S&P 500® Index
|
-4.04
|
Visit https://doubleline.com/fund-documents/ for more recent performance information.
KEY FUND STATISTICS
|
Net Assets
|
$2,840,947,019
|
|
Number of Holdings
|
788
|
|
Total Advisory Fees Paid
|
$15,299,505
|
|
Portfolio Turnover
|
48%
|
WHAT DID THE FUND INVEST IN?
|
Credit Quality Breakdown*
|
(% of Net Assets)
|
|
Government
|
26.9
|
|
Agency
|
5.5
|
|
AAA
|
30.0
|
|
AA
|
6.4
|
|
A
|
8.5
|
|
BBB
|
14.4
|
|
BB
|
1.3
|
|
B and Below
|
3.1
|
|
Not Rated
|
3.0
|
|
Other
|
0.9
|
|
Sector Breakdown
|
(% of Net Assets)
|
|
U.S. Government and Agency Obligations
|
25.9
|
|
Non-Agency Residential Collateralized Mortgage Obligations
|
14.4
|
|
U.S. Corporate Bonds
|
13.6
|
|
Non-Agency Commercial Mortgage Backed Obligations
|
12.8
|
|
Collateralized Loan Obligations
|
10.6
|
|
Asset Backed Obligations
|
9.4
|
|
U.S. Government and Agency Mortgage Backed Obligations
|
6.5
|
|
Foreign Corporate Bonds
|
5.9
|
|
Bank Loans
|
2.1
|
|
Cash & Other
|
-1.2
|
|
CAPE Sector Breakdown*
|
(% of Net Assets)
|
|
Communication Services
|
25.0
|
|
Consumer Discretionary
|
25.1
|
|
Health Care
|
25.0
|
|
Real Estate
|
24.9
|
The DoubleLine fund complex has historically used multiple firms to serve as the independent registered public accounting firms across the fund complex in the United States. On August 19, 2025, the Board of Trustees of the Trust considered and approved a proposal to consolidate that work for the entire fund complex with a single firm, Deloitte & Touche LLP, and Deloitte was appointed to serve as the independent registered public accounting firm of each series of the Trust (each, a “Fund”) for the fiscal year ending March 31, 2026. In connection with that transition, PricewaterhouseCoopers LLP, each Fund’s prior independent registered public accounting firm, was dismissed effective as of August 5, 2025.
WHAT WERE THE FUND COSTS FOR THE PAST YEAR? (based on a hypothetical $10,000 investment)
|
Class Name
|
Costs of a $10,000 investment
|
Costs paid as a percentage of a $10,000 investment
|
|
Class N
|
$81
|
0.80%
|
HOW DID THE FUND PERFORM LAST YEAR AND WHAT AFFECTED ITS PERFORMANCE?
For the 12-month period ended March 31, 2026, the DoubleLine Shiller Enhanced CAPE® underperformed the benchmark S&P 500 Index® return of 17.80% on a net asset value basis.
WHAT FACTORS INFLUENCED PERFORMANCE?
Three of the Fund’s seven sector allocations appreciated in value. The communication services allocation was the biggest contributor to Fund performance while real estate was the biggest detractor. All sectors within the Fund’s fixed-income portfolio increased in value. The biggest contributor to fixed-income portfolio performance by sector was non-Agency mortgage-backed securities while the laggard was U.S. government securities.
POSITIONING
The Shiller Barclays CAPE® U.S. Sector Total Return USD Index, to which the Fund gained exposure through the use of swap contracts, was allocated to seven sectors: consumer discretionary, consumer staples, communication services, financials, health care, materials and real estate. The Fund’s use of swap contracts to gain exposure to equities facilitated investment of the Fund’s remaining assets in fixed income securities across nine sectors: bank loans, investment grade corporate bonds, Agency residential mortgage-backed securities (RMBS), non-Agency RMBS, asset-backed securities, emerging markets fixed income, commercial MBS, collateralized loan obligations and U.S. government securities.
|
Top Contributors
|
|
|
↑
|
Communication Services
|
|
↑
|
Consumer Discretionary
|
|
↑
|
Materials
|
|
↑
|
Fixed-Income Portfolio Exposure to Asset-Backed Securities
|
|
Top Detractors
|
|
|
↓
|
Real Estate
|
|
↓
|
Consumer Staples
|
|
↓
|
Financials
|
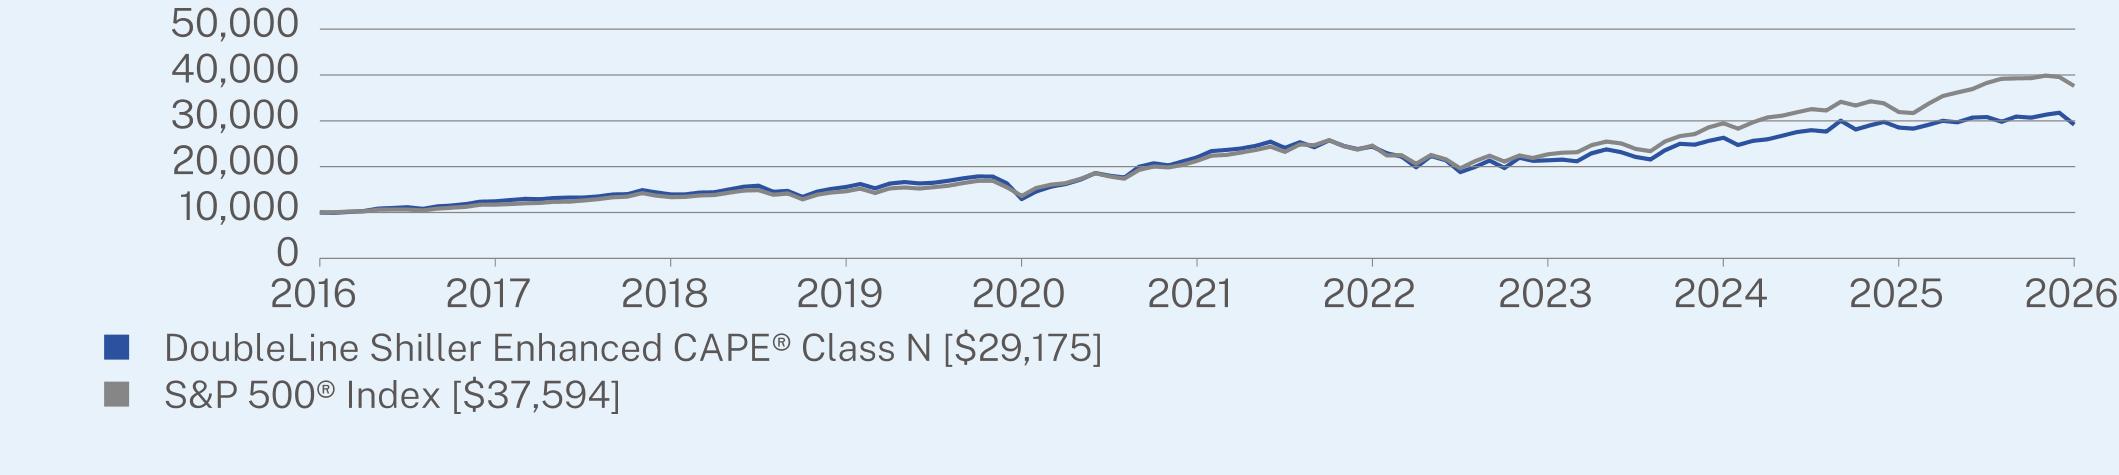
ANNUAL AVERAGE TOTAL RETURN (%)
|
|
1 Year
|
5 Year
|
10 Year
|
|
Class N (without sales charge)
|
2.27
|
5.79
|
11.30
|
|
S&P 500® Index
|
17.80
|
12.06
|
14.16
|
Visit https://doubleline.com/fund-documents/ for more recent performance information.
KEY FUND STATISTICS
|
Net Assets
|
$2,840,947,019
|
|
Number of Holdings
|
788
|
|
Total Advisory Fees Paid
|
$15,299,505
|
|
Portfolio Turnover
|
48%
|
WHAT DID THE FUND INVEST IN?
|
Credit Quality Breakdown*
|
(% of Net Assets)
|
|
Government
|
26.9
|
|
Agency
|
5.5
|
|
AAA
|
30.0
|
|
AA
|
6.4
|
|
A
|
8.5
|
|
BBB
|
14.4
|
|
BB
|
1.3
|
|
B and Below
|
3.1
|
|
Not Rated
|
3.0
|
|
Other
|
0.9
|
|
Sector Breakdown
|
(% of Net Assets)
|
|
U.S. Government and Agency Obligations
|
25.9
|
|
Non-Agency Residential Collateralized Mortgage Obligations
|
14.4
|
|
U.S. Corporate Bonds
|
13.6
|
|
Non-Agency Commercial Mortgage Backed Obligations
|
12.8
|
|
Collateralized Loan Obligations
|
10.6
|
|
Asset Backed Obligations
|
9.4
|
|
U.S. Government and Agency Mortgage Backed Obligations
|
6.5
|
|
Foreign Corporate Bonds
|
5.9
|
|
Bank Loans
|
2.1
|
|
Cash & Other
|
-1.2
|
|
CAPE Sector Breakdown*
|
(% of Net Assets)
|
|
Communication Services
|
25.0
|
|
Consumer Discretionary
|
25.1
|
|
Health Care
|
25.0
|
|
Real Estate
|
24.9
|
The DoubleLine fund complex has historically used multiple firms to serve as the independent registered public accounting firms across the fund complex in the United States. On August 19, 2025, the Board of Trustees of the Trust considered and approved a proposal to consolidate that work for the entire fund complex with a single firm, Deloitte & Touche LLP, and Deloitte was appointed to serve as the independent registered public accounting firm of each series of the Trust (each, a “Fund”) for the fiscal year ending March 31, 2026. In connection with that transition, PricewaterhouseCoopers LLP, each Fund’s prior independent registered public accounting firm, was dismissed effective as of August 5, 2025.
WHAT WERE THE FUND COSTS FOR THE PAST YEAR? (based on a hypothetical $10,000 investment)
|
Class Name
|
Costs of a $10,000 investment
|
Costs paid as a percentage of a $10,000 investment
|
|
Class R6
|
$50
|
0.49%
|
HOW DID THE FUND PERFORM LAST YEAR AND WHAT AFFECTED ITS PERFORMANCE?
For the 12-month period ended March 31, 2026, the DoubleLine Shiller Enhanced CAPE® underperformed the benchmark S&P 500 Index® return of 17.80% on a net asset value basis.
WHAT FACTORS INFLUENCED PERFORMANCE?
Three of the Fund’s seven sector allocations appreciated in value. The communication services allocation was the biggest contributor to Fund performance while real estate was the biggest detractor. All sectors within the Fund’s fixed-income portfolio increased in value. The biggest contributor to fixed-income portfolio performance by sector was non-Agency mortgage-backed securities while the laggard was U.S. government securities.
POSITIONING
The Shiller Barclays CAPE® U.S. Sector Total Return USD Index, to which the Fund gained exposure through the use of swap contracts, was allocated to seven sectors: consumer discretionary, consumer staples, communication services, financials, health care, materials and real estate. The Fund’s use of swap contracts to gain exposure to equities facilitated investment of the Fund’s remaining assets in fixed income securities across nine sectors: bank loans, investment grade corporate bonds, Agency residential mortgage-backed securities (RMBS), non-Agency RMBS, asset-backed securities, emerging markets fixed income, commercial MBS, collateralized loan obligations and U.S. government securities.
|
Top Contributors
|
|
|
↑
|
Communication Services
|
|
↑
|
Consumer Discretionary
|
|
↑
|
Materials
|
|
↑
|
Fixed-Income Portfolio Exposure to Asset-Backed Securities
|
|
Top Detractors
|
|
|
↓
|
Real Estate
|
|
↓
|
Consumer Staples
|
|
↓
|
Financials
|
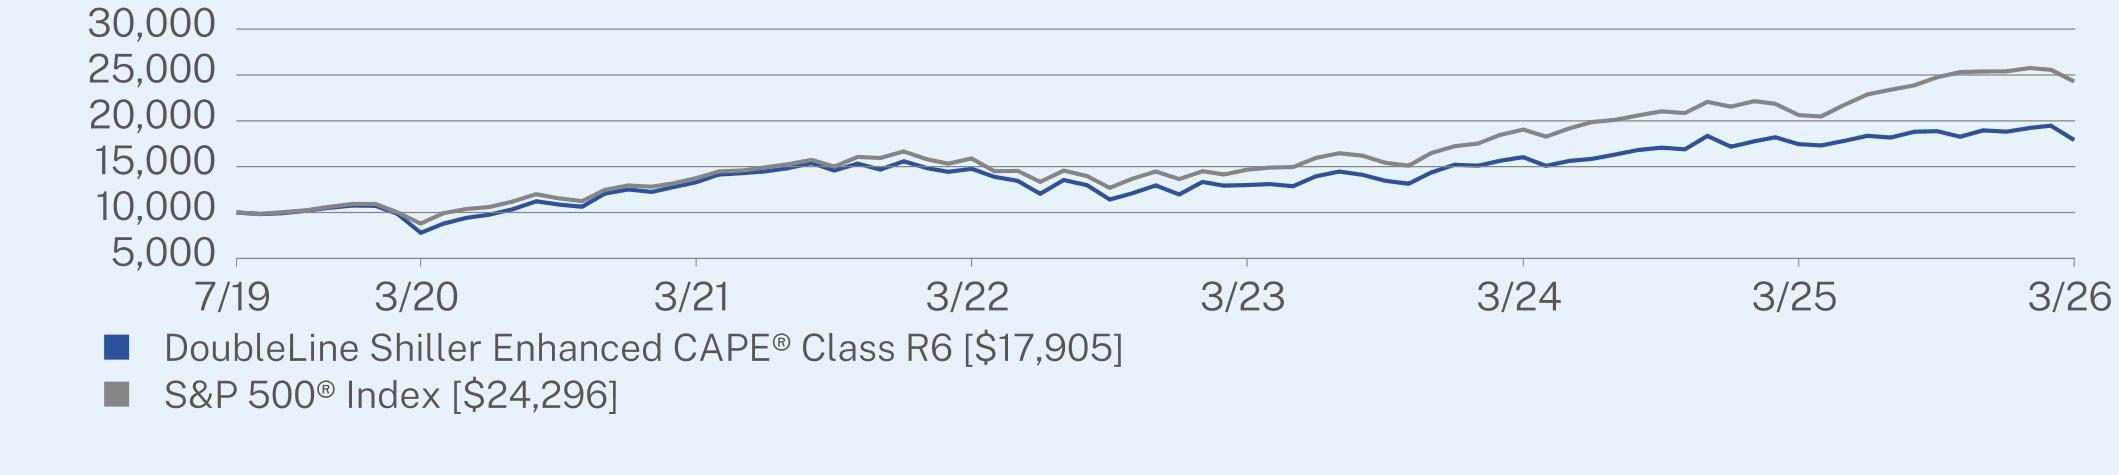
ANNUAL AVERAGE TOTAL RETURN (%)
|
|
1 Year
|
5 Year
|
Since Inception
(07/31/2019) |
|
Class R6 (without sales charge)
|
2.59
|
6.13
|
9.13
|
|
S&P 500® Index
|
17.80
|
12.06
|
14.24
|
Visit https://doubleline.com/fund-documents/ for more recent performance information.
KEY FUND STATISTICS
|
Net Assets
|
$2,840,947,019
|
|
Number of Holdings
|
788
|
|
Total Advisory Fees Paid
|
$15,299,505
|
|
Portfolio Turnover
|
48%
|
WHAT DID THE FUND INVEST IN?
|
Credit Quality Breakdown*
|
(% of Net Assets)
|
|
Government
|
26.9
|
|
Agency
|
5.5
|
|
AAA
|
30.0
|
|
AA
|
6.4
|
|
A
|
8.5
|
|
BBB
|
14.4
|
|
BB
|
1.3
|
|
B and Below
|
3.1
|
|
Not Rated
|
3.0
|
|
Other
|
0.9
|
|
Sector Breakdown
|
(% of Net Assets)
|
|
U.S. Government and Agency Obligations
|
25.9
|
|
Non-Agency Residential Collateralized Mortgage Obligations
|
14.4
|
|
U.S. Corporate Bonds
|
13.6
|
|
Non-Agency Commercial Mortgage Backed Obligations
|
12.8
|
|
Collateralized Loan Obligations
|
10.6
|
|
Asset Backed Obligations
|
9.4
|
|
U.S. Government and Agency Mortgage Backed Obligations
|
6.5
|
|
Foreign Corporate Bonds
|
5.9
|
|
Bank Loans
|
2.1
|
|
Cash & Other
|
-1.2
|
|
CAPE Sector Breakdown*
|
(% of Net Assets)
|
|
Communication Services
|
25.0
|
|
Consumer Discretionary
|
25.1
|
|
Health Care
|
25.0
|
|
Real Estate
|
24.9
|
The DoubleLine fund complex has historically used multiple firms to serve as the independent registered public accounting firms across the fund complex in the United States. On August 19, 2025, the Board of Trustees of the Trust considered and approved a proposal to consolidate that work for the entire fund complex with a single firm, Deloitte & Touche LLP, and Deloitte was appointed to serve as the independent registered public accounting firm of each series of the Trust (each, a “Fund”) for the fiscal year ending March 31, 2026. In connection with that transition, PricewaterhouseCoopers LLP, each Fund’s prior independent registered public accounting firm, was dismissed effective as of August 5, 2025.
WHAT WERE THE FUND COSTS FOR THE PAST YEAR? (based on a hypothetical $10,000 investment)
|
Class Name
|
Costs of a $10,000 investment
|
Costs paid as a percentage of a $10,000 investment
|
|
Class I
|
$76
|
0.74%
|
HOW DID THE FUND PERFORM LAST YEAR AND WHAT AFFECTED ITS PERFORMANCE?
For the 12-month period ended March 31, 2026, the DoubleLine Flexible Income Fund outperformed the benchmark Bloomberg U.S. Aggregate Bond Index return of 4.35% on a net asset value basis.
WHAT FACTORS INFLUENCED PERFORMANCE?
The Fund’s credit exposure, most notably to non-Agency residential mortgage-backed securities (RMBS), collateralized loan obligations, non-Agency commercial MBS and bank loans, outperformed investment grade corporate bonds in the benchmark. The Fund’s allocation to U.S. government securities also contributed to performance. In addition, the Fund’s underweight duration relative to the benchmark contributed to performance as U.S. rates generally rose in the period.
POSITIONING
The Fund had approximately 75% exposure to credit and 25% to U.S. government-guaranteed assets. The Fund’s duration was shorter than that of the benchmark, and the Fund rotated up in credit quality during the period, deploying cash from maturities into higher-rated bonds. The Fund increased non-Agency commercial and residential mortgage-backed securities and non-U.S. dollar allocations. The Fund reduced U.S. government securities, collateralized loan obligation and bank loan allocations.
|
Top Contributors
|
|
|
↑
|
Non-Agency Residential and Commercial Mortgage-Backed Securities
|
|
↑
|
Collateralized Loan Obligations
|
|
↑
|
Duration Positioning
|
|
↑
|
Bank Loans
|
|
Top Detractors
|
|
|
↓
|
All holdings within the Fund contributed to performance
|
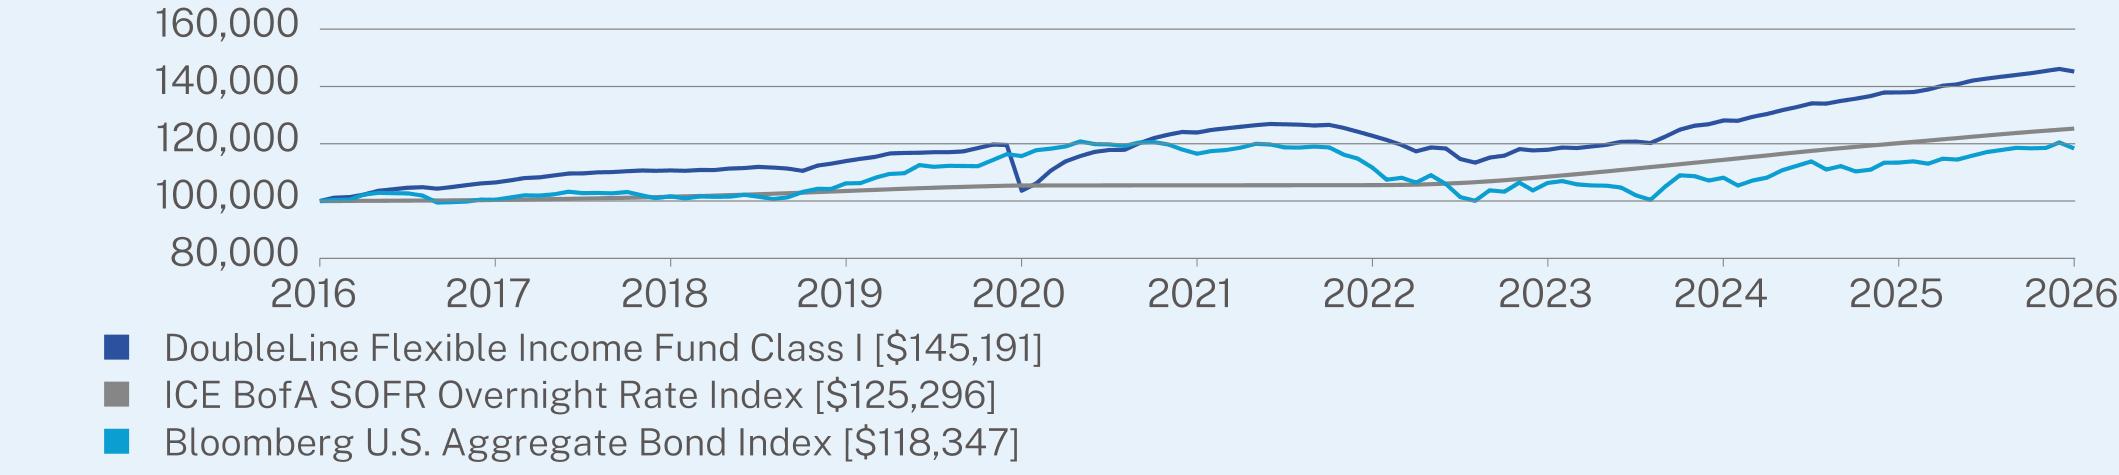
ANNUAL AVERAGE TOTAL RETURN (%)
|
|
1 Year
|
5 Year
|
10 Year
|
|
Class I (without sales charge)
|
5.28
|
3.22
|
3.80
|
|
ICE BofA SOFR Overnight Rate Index
|
4.22
|
3.50
|
2.28
|
|
Bloomberg U.S. Aggregate Bond Index
|
4.35
|
0.31
|
1.70
|
Visit https://doubleline.com/fund-documents/ for more recent performance information.
KEY FUND STATISTICS
|
Net Assets
|
$1,447,530,658
|
|
Number of Holdings
|
1,234
|
|
Total Advisory Fees Paid
|
$7,855,896
|
|
Portfolio Turnover
|
50%
|
|
Effective Duration
|
1.72 years
|
|
Weighted Average Life
|
4.15 years
|
WHAT DID THE FUND INVEST IN?
|
Credit Quality Breakdown*
|
(% of Net Assets)
|
|
Government
|
16.9
|
|
Agency
|
9.7
|
|
AAA
|
10.4
|
|
AA
|
3.1
|
|
A
|
9.0
|
|
BBB
|
22.9
|
|
BB
|
13.2
|
|
B and Below
|
10.1
|
|
Not Rated
|
3.2
|
|
Other
|
1.5
|
|
Sector Breakdown
|
(% of Net Assets)
|
|
Non-Agency Residential Collateralized Mortgage Obligations
|
17.7
|
|
U.S. Government and Agency Mortgage Backed Obligations
|
13.5
|
|
Collateralized Loan Obligations
|
12.4
|
|
Non-Agency Commercial Mortgage Backed Obligations
|
12.4
|
|
U.S. Treasury Bills
|
10.4
|
|
Bank Loans
|
9.0
|
|
Asset Backed Obligations
|
5.6
|
|
Affiliated Mutual Funds
|
4.6
|
|
U.S. Corporate Bonds
|
4.3
|
|
Cash & Other
|
10.1
|
The DoubleLine fund complex has historically used multiple firms to serve as the independent registered public accounting firms across the fund complex in the United States. On August 19, 2025, the Board of Trustees of the Trust considered and approved a proposal to consolidate that work for the entire fund complex with a single firm, Deloitte & Touche LLP, and Deloitte was appointed to serve as the independent registered public accounting firm of each series of the Trust (each, a “Fund”) for the fiscal year ending March 31, 2026. In connection with that transition, PricewaterhouseCoopers LLP, each Fund’s prior independent registered public accounting firm, was dismissed effective as of August 5, 2025.
WHAT WERE THE FUND COSTS FOR THE PAST YEAR? (based on a hypothetical $10,000 investment)
|
Class Name
|
Costs of a $10,000 investment
|
Costs paid as a percentage of a $10,000 investment*,**
|
|
Class I2
|
$34
|
0.79%
|
HOW DID THE FUND PERFORM LAST YEAR AND WHAT AFFECTED ITS PERFORMANCE?
For the 12-month period ended March 31, 2026, the DoubleLine Flexible Income Fund outperformed the benchmark Bloomberg U.S. Aggregate Bond Index return of 4.35% on a net asset value basis.
WHAT FACTORS INFLUENCED PERFORMANCE?
The Fund’s credit exposure, most notably to non-Agency residential mortgage-backed securities (RMBS), collateralized loan obligations, non-Agency commercial MBS and bank loans, outperformed investment grade corporate bonds in the benchmark. The Fund’s allocation to U.S. government securities also contributed to performance. In addition, the Fund’s underweight duration relative to the benchmark contributed to performance as U.S. rates generally rose in the period.
POSITIONING
The Fund had approximately 75% exposure to credit and 25% to U.S. government-guaranteed assets. The Fund’s duration was shorter than that of the benchmark, and the Fund rotated up in credit quality during the period, deploying cash from maturities into higher-rated bonds. The Fund increased non-Agency commercial and residential mortgage-backed securities and non-U.S. dollar allocations. The Fund reduced U.S. government securities, collateralized loan obligation and bank loan allocations.
|
Top Contributors
|
|
|
↑
|
Non-Agency Residential and Commercial Mortgage-Backed Securities
|
|
↑
|
Collateralized Loan Obligations
|
|
↑
|
Duration Positioning
|
|
↑
|
Bank Loans
|
|
Top Detractors
|
|
|
↓
|
All holdings within the Fund contributed to performance
|
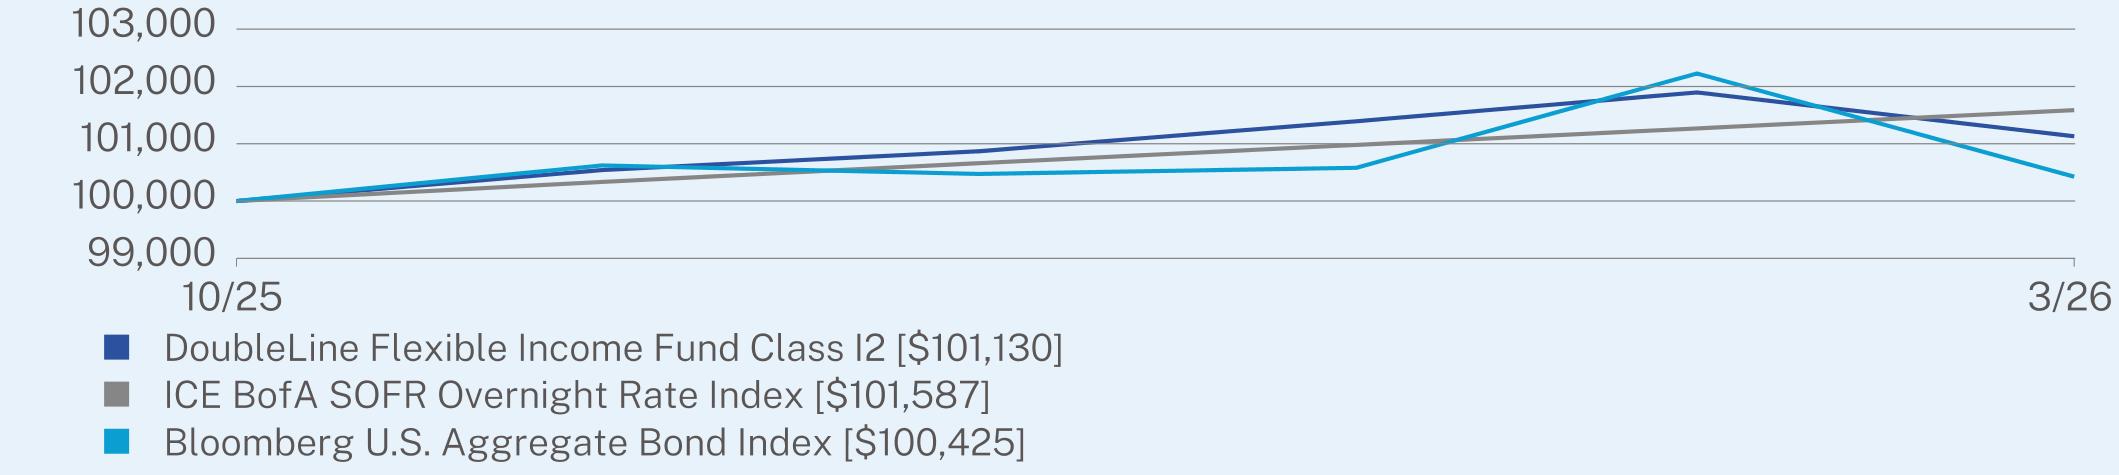
AVERAGE TOTAL RETURN (%)
|
|
Since Inception
(10/31/2025) |
|
Class I2 (without sales charge)
|
1.13
|
|
ICE BofA SOFR Overnight Rate Index
|
1.59
|
|
Bloomberg U.S. Aggregate Bond Index
|
0.43
|
Visit https://doubleline.com/fund-documents/ for more recent performance information.
KEY FUND STATISTICS
|
Net Assets
|
$1,447,530,658
|
|
Number of Holdings
|
1,234
|
|
Total Advisory Fees Paid
|
$7,855,896
|
|
Portfolio Turnover
|
50%
|
|
Effective Duration
|
1.72 years
|
|
Weighted Average Life
|
4.15 years
|
WHAT DID THE FUND INVEST IN?
|
Credit Quality Breakdown*
|
(% of Net Assets)
|
|
Government
|
16.9
|
|
Agency
|
9.7
|
|
AAA
|
10.4
|
|
AA
|
3.1
|
|
A
|
9.0
|
|
BBB
|
22.9
|
|
BB
|
13.2
|
|
B and Below
|
10.1
|
|
Not Rated
|
3.2
|
|
Other
|
1.5
|
|
Sector Breakdown
|
(% of Net Assets)
|
|
Non-Agency Residential Collateralized Mortgage Obligations
|
17.7
|
|
U.S. Government and Agency Mortgage Backed Obligations
|
13.5
|
|
Collateralized Loan Obligations
|
12.4
|
|
Non-Agency Commercial Mortgage Backed Obligations
|
12.4
|
|
U.S. Treasury Bills
|
10.4
|
|
Bank Loans
|
9.0
|
|
Asset Backed Obligations
|
5.6
|
|
Affiliated Mutual Funds
|
4.6
|
|
U.S. Corporate Bonds
|
4.3
|
|
Cash & Other
|
10.1
|
The DoubleLine fund complex has historically used multiple firms to serve as the independent registered public accounting firms across the fund complex in the United States. On August 19, 2025, the Board of Trustees of the Trust considered and approved a proposal to consolidate that work for the entire fund complex with a single firm, Deloitte & Touche LLP, and Deloitte was appointed to serve as the independent registered public accounting firm of each series of the Trust (each, a “Fund”) for the fiscal year ending March 31, 2026. In connection with that transition, PricewaterhouseCoopers LLP, each Fund’s prior independent registered public accounting firm, was dismissed effective as of August 5, 2025.
WHAT WERE THE FUND COSTS FOR THE PAST YEAR? (based on a hypothetical $10,000 investment)
|
Class Name
|
Costs of a $10,000 investment
|
Costs paid as a percentage of a $10,000 investment
|
|
Class N
|
$101
|
0.99%
|
HOW DID THE FUND PERFORM LAST YEAR AND WHAT AFFECTED ITS PERFORMANCE?
For the 12-month period ended March 31, 2026, the DoubleLine Flexible Income Fund outperformed the benchmark Bloomberg U.S. Aggregate Bond Index return of 4.35% on a net asset value basis.
WHAT FACTORS INFLUENCED PERFORMANCE?
The Fund’s credit exposure, most notably to non-Agency residential mortgage-backed securities (RMBS), collateralized loan obligations, non-Agency commercial MBS and bank loans, outperformed investment grade corporate bonds in the benchmark. The Fund’s allocation to U.S. government securities also contributed to performance. In addition, the Fund’s underweight duration relative to the benchmark contributed to performance as U.S. rates generally rose in the period.
POSITIONING
The Fund had approximately 75% exposure to credit and 25% to U.S. government-guaranteed assets. The Fund’s duration was shorter than that of the benchmark, and the Fund rotated up in credit quality during the period, deploying cash from maturities into higher-rated bonds. The Fund increased non-Agency commercial and residential mortgage-backed securities and non-U.S. dollar allocations. The Fund reduced U.S. government securities, collateralized loan obligation and bank loan allocations.
|
Top Contributors
|
|
|
↑
|
Non-Agency Residential and Commercial Mortgage-Backed Securities
|
|
↑
|
Collateralized Loan Obligations
|
|
↑
|
Duration Positioning
|
|
↑
|
Bank Loans
|
|
Top Detractors
|
|
|
↓
|
All holdings within the Fund contributed to performance
|
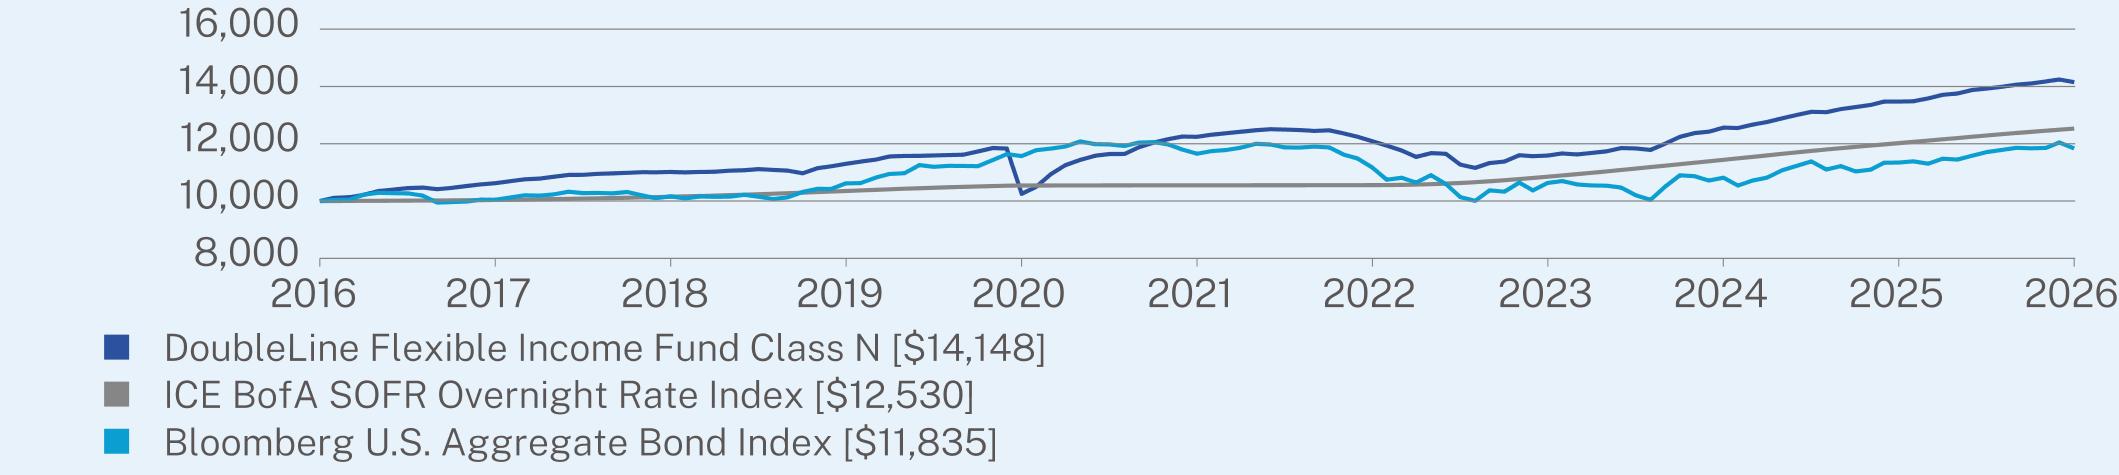
ANNUAL AVERAGE TOTAL RETURN (%)
|
|
1 Year
|
5 Year
|
10 Year
|
|
Class N (without sales charge)
|
5.01
|
2.94
|
3.53
|
|
ICE BofA SOFR Overnight Rate Index
|
4.22
|
3.50
|
2.28
|
|
Bloomberg U.S. Aggregate Bond Index
|
4.35
|
0.31
|
1.70
|
Visit https://doubleline.com/fund-documents/ for more recent performance information.
KEY FUND STATISTICS
|
Net Assets
|
$1,447,530,658
|
|
Number of Holdings
|
1,234
|
|
Total Advisory Fees Paid
|
$7,855,896
|
|
Portfolio Turnover
|
50%
|
|
Effective Duration
|
1.72 years
|
|
Weighted Average Life
|
4.15 years
|
WHAT DID THE FUND INVEST IN?
|
Credit Quality Breakdown*
|
(% of Net Assets)
|
|
Government
|
16.9
|
|
Agency
|
9.7
|
|
AAA
|
10.4
|
|
AA
|
3.1
|
|
A
|
9.0
|
|
BBB
|
22.9
|
|
BB
|
13.2
|
|
B and Below
|
10.1
|
|
Not Rated
|
3.2
|
|
Other
|
1.5
|
The DoubleLine fund complex has historically used multiple firms to serve as the independent registered public accounting firms across the fund complex in the United States. On August 19, 2025, the Board of Trustees of the Trust considered and approved a proposal to consolidate that work for the entire fund complex with a single firm, Deloitte & Touche LLP, and Deloitte was appointed to serve as the independent registered public accounting firm of each series of the Trust (each, a “Fund”) for the fiscal year ending March 31, 2026. In connection with that transition, PricewaterhouseCoopers LLP, each Fund’s prior independent registered public accounting firm, was dismissed effective as of August 5, 2025.
WHAT WERE THE FUND COSTS FOR THE PAST YEAR? (based on a hypothetical $10,000 investment)
|
Class Name
|
Costs of a $10,000 investment
|
Costs paid as a percentage of a $10,000 investment
|
|
Class R6
|
$69
|
0.67%
|
HOW DID THE FUND PERFORM LAST YEAR AND WHAT AFFECTED ITS PERFORMANCE?
For the 12-month period ended March 31, 2026, the DoubleLine Flexible Income Fund outperformed the benchmark Bloomberg U.S. Aggregate Bond Index return of 4.35% on a net asset value basis.
WHAT FACTORS INFLUENCED PERFORMANCE?
The Fund’s credit exposure, most notably to non-Agency residential mortgage-backed securities (RMBS), collateralized loan obligations, non-Agency commercial MBS and bank loans, outperformed investment grade corporate bonds in the benchmark. The Fund’s allocation to U.S. government securities also contributed to performance. In addition, the Fund’s underweight duration relative to the benchmark contributed to performance as U.S. rates generally rose in the period.
POSITIONING
The Fund had approximately 75% exposure to credit and 25% to U.S. government-guaranteed assets. The Fund’s duration was shorter than that of the benchmark, and the Fund rotated up in credit quality during the period, deploying cash from maturities into higher-rated bonds. The Fund increased non-Agency commercial and residential mortgage-backed securities and non-U.S. dollar allocations. The Fund reduced U.S. government securities, collateralized loan obligation and bank loan allocations.
|
Top Contributors
|
|
|
↑
|
Non-Agency Residential and Commercial Mortgage-Backed Securities
|
|
↑
|
Collateralized Loan Obligations
|
|
↑
|
Duration Positioning
|
|
↑
|
Bank Loans
|
|
Top Detractors
|
|
|
↓
|
All holdings within the Fund contributed to performance
|
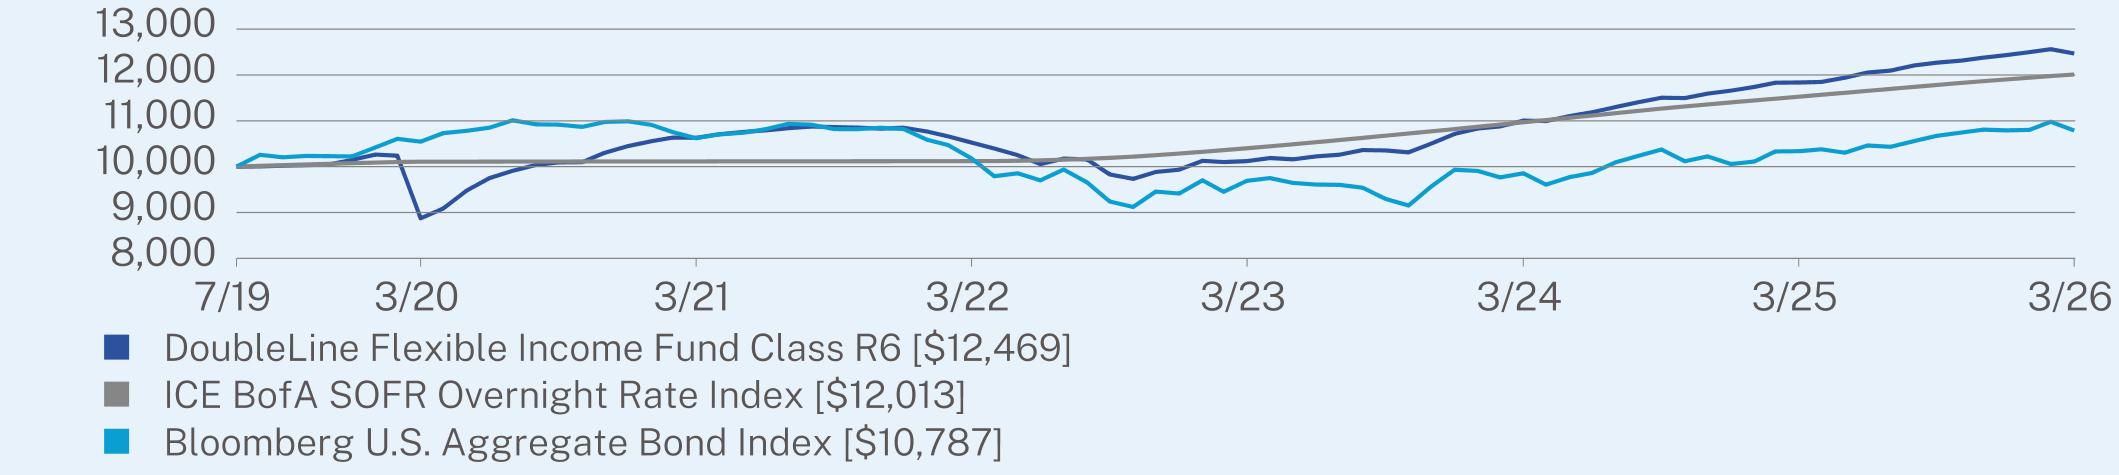
ANNUAL AVERAGE TOTAL RETURN (%)
|
|
1 Year
|
5 Year
|
Since Inception
(07/31/2019) |
|
Class R6 (without sales charge)
|
5.34
|
3.24
|
3.36
|
|
ICE BofA SOFR Overnight Rate Index
|
4.22
|
3.50
|
2.79
|
|
Bloomberg U.S. Aggregate Bond Index
|
4.35
|
0.31
|
1.14
|
Visit https://doubleline.com/fund-documents/ for more recent performance information.
KEY FUND STATISTICS
|
Net Assets
|
$1,447,530,658
|
|
Number of Holdings
|
1,234
|
|
Total Advisory Fees Paid
|
$7,855,896
|
|
Portfolio Turnover
|
50%
|
|
Effective Duration
|
1.72 years
|
|
Weighted Average Life
|
4.15 years
|
WHAT DID THE FUND INVEST IN?
|
Credit Quality Breakdown*
|
(% of Net Assets)
|
|
Government
|
16.9
|
|
Agency
|
9.7
|
|
AAA
|
10.4
|
|
AA
|
3.1
|
|
A
|
9.0
|
|
BBB
|
22.9
|
|
BB
|
13.2
|
|
B and Below
|
10.1
|
|
Not Rated
|
3.2
|
|
Other
|
1.5
|
|
Sector Breakdown
|
(% of Net Assets)
|
|
Non-Agency Residential Collateralized Mortgage Obligations
|
17.7
|
|
U.S. Government and Agency Mortgage Backed Obligations
|
13.5
|
|
Collateralized Loan Obligations
|
12.4
|
|
Non-Agency Commercial Mortgage Backed Obligations
|
12.4
|
|
U.S. Treasury Bills
|
10.4
|
|
Bank Loans
|
9.0
|
|
Asset Backed Obligations
|
5.6
|
|
Affiliated Mutual Funds
|
4.6
|
|
U.S. Corporate Bonds
|
4.3
|
|
Cash & Other
|
10.1
|
The DoubleLine fund complex has historically used multiple firms to serve as the independent registered public accounting firms across the fund complex in the United States. On August 19, 2025, the Board of Trustees of the Trust considered and approved a proposal to consolidate that work for the entire fund complex with a single firm, Deloitte & Touche LLP, and Deloitte was appointed to serve as the independent registered public accounting firm of each series of the Trust (each, a “Fund”) for the fiscal year ending March 31, 2026. In connection with that transition, PricewaterhouseCoopers LLP, each Fund’s prior independent registered public accounting firm, was dismissed effective as of August 5, 2025.
WHAT WERE THE FUND COSTS FOR THE PAST YEAR? (based on a hypothetical $10,000 investment)
|
Class Name
|
Costs of a $10,000 investment
|
Costs paid as a percentage of a $10,000 investment
|
|
Class I
|
$61
|
0.59%
|
HOW DID THE FUND PERFORM LAST YEAR AND WHAT AFFECTED ITS PERFORMANCE?
For the 12-month period ended March 31, 2026, the DoubleLine Low Duration Emerging Markets Fixed Income Fund outperformed the benchmark J.P. Morgan CEMBI Broad Diversified 1-3 Year Index return of 5.25%.
WHAT FACTORS INFLUENCED PERFORMANCE?
The Fund’s overweight to emerging markets sovereign debt and underweight to the Middle East and Asia relative to the benchmark contributed to performance. The Fund’s underweight to Europe and Africa detracted from performance.
POSITIONING
The Fund maintained a slightly longer duration than that of the benchmark. The Fund was overweight sovereign and quasi-sovereign debt relative to the benchmark and increased its allocation to investment grade credit. The Fund was overweight Latin America and underweight Asia, the Middle East and Africa.
|
Top Contributors
|
|
|
↑
|
Emerging Markets Sovereign Debt Allocation
|
|
↑
|
Middle East Allocation
|
|
↑
|
Asia Allocation
|
|
Top Detractors
|
|
|
↓
|
Europe Allocation
|
|
↓
|
Africa Allocation
|
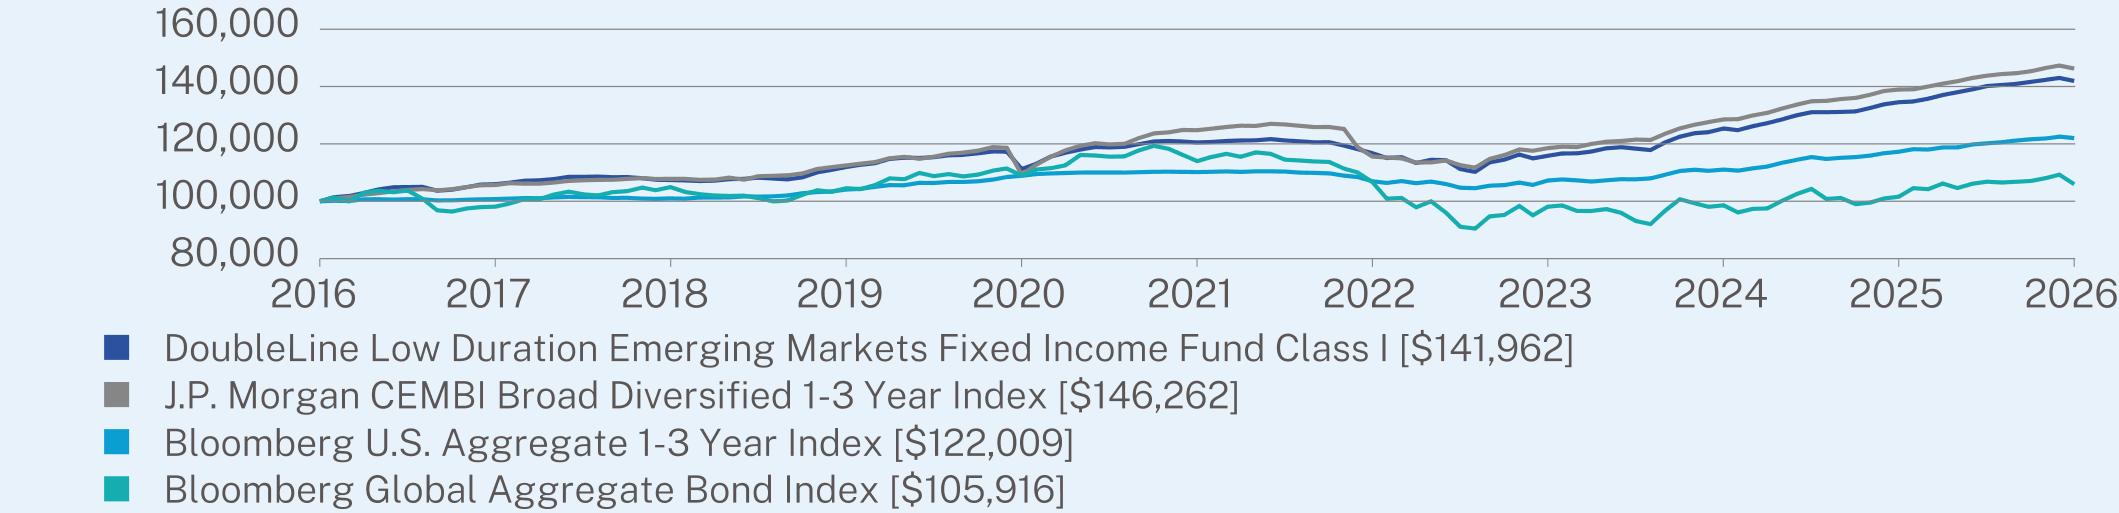
ANNUAL AVERAGE TOTAL RETURN (%)
|
|
1 Year
|
5 Year
|
10 Year
|
|
Class I (without sales charge)
|
5.52
|
3.33
|
3.57
|
|
J.P. Morgan CEMBI Broad Diversified 1-3 Year Index
|
5.25
|
3.23
|
3.88
|
|
Bloomberg U.S. Aggregate 1-3 Year Index
|
4.03
|
2.06
|
2.01
|
|
Bloomberg Global Aggregate Bond Index
|
4.26
|
-1.46
|
0.58
|
Visit https://doubleline.com/fund-documents/ for more recent performance information.
KEY FUND STATISTICS
|
Net Assets
|
$132,042,300
|
|
Number of Holdings
|
89
|
|
Total Advisory Fees Paid
|
$400,820
|
|
Portfolio Turnover
|
58%
|
WHAT DID THE FUND INVEST IN?
|
Credit Quality Breakdown*
|
(% of Net Assets)
|
|
A
|
16.3
|
|
BBB
|
54.4
|
|
BB
|
21.9
|
|
Not Rated
|
0.2
|
|
Other
|
7.2
|
|
Top Ten Holdings
|
(% of Net Assets)
|
|
BBVA Mexico SA Institucion De Banca Multiple Grupo Financiero BBVA Mexico/TX, 5.88%, 09/13/2034
|
2.5
|
|
Chile Electricity PEC SpA, 01/25/2028
|
2.5
|
|
Oversea-Chinese Banking Corp. Ltd., 4.60%, 06/15/2032
|
2.4
|
|
Mexico Government International Bond, 4.50%, 04/22/2029
|
2.3
|
|
Chile Electricity Lux MPC Sarl, 6.01%, 01/20/2033
|
2.2
|
|
Guatemala Government Bond, 4.50%, 05/03/2026
|
2.2
|
|
MSILF Government Portfolio - Class Institutional, 3.57%, 12/31/2031
|
2.1
|
|
JPMorgan U.S. Government Money Market Fund - Class IM, 3.60%, 01/01/2040
|
2.1
|
|
First American Government Obligations Fund - Class U, 3.60%, 02/01/2030
|
2.1
|
|
AL Candelaria Spain SA, 7.50%, 12/15/2028
|
2.1
|
The DoubleLine fund complex has historically used multiple firms to serve as the independent registered public accounting firms across the fund complex in the United States. On August 19, 2025, the Board of Trustees of the Trust considered and approved a proposal to consolidate that work for the entire fund complex with a single firm, Deloitte & Touche LLP, and Deloitte was appointed to serve as the independent registered public accounting firm of each series of the Trust (each, a “Fund”) for the fiscal year ending March 31, 2026. In connection with that transition, PricewaterhouseCoopers LLP, each Fund’s prior independent registered public accounting firm, was dismissed effective as of August 5, 2025.
WHAT WERE THE FUND COSTS FOR THE PAST YEAR? (based on a hypothetical $10,000 investment)
|
Class Name
|
Costs of a $10,000 investment
|
Costs paid as a percentage of a $10,000 investment*,**
|
|
Class I2
|
$27
|
0.66%
|
HOW DID THE FUND PERFORM LAST YEAR AND WHAT AFFECTED ITS PERFORMANCE?
For the 12-month period ended March 31, 2026, the DoubleLine Low Duration Emerging Markets Fixed Income Fund outperformed the benchmark J.P. Morgan CEMBI Broad Diversified 1-3 Year Index return of 5.25%.
WHAT FACTORS INFLUENCED PERFORMANCE?
The Fund’s overweight to emerging markets sovereign debt and underweight to the Middle East and Asia relative to the benchmark contributed to performance. The Fund’s underweight to Europe and Africa detracted from performance.
POSITIONING
The Fund maintained a slightly longer duration than that of the benchmark. The Fund was overweight sovereign and quasi-sovereign debt relative to the benchmark and increased its allocation to investment grade credit. The Fund was overweight Latin America and underweight Asia, the Middle East and Africa.
|
Top Contributors
|
|
|
↑
|
Emerging Markets Sovereign Debt Allocation
|
|
↑
|
Middle East Allocation
|
|
↑
|
Asia Allocation
|
|
Top Detractors
|
|
|
↓
|
Europe Allocation
|
|
↓
|
Africa Allocation
|
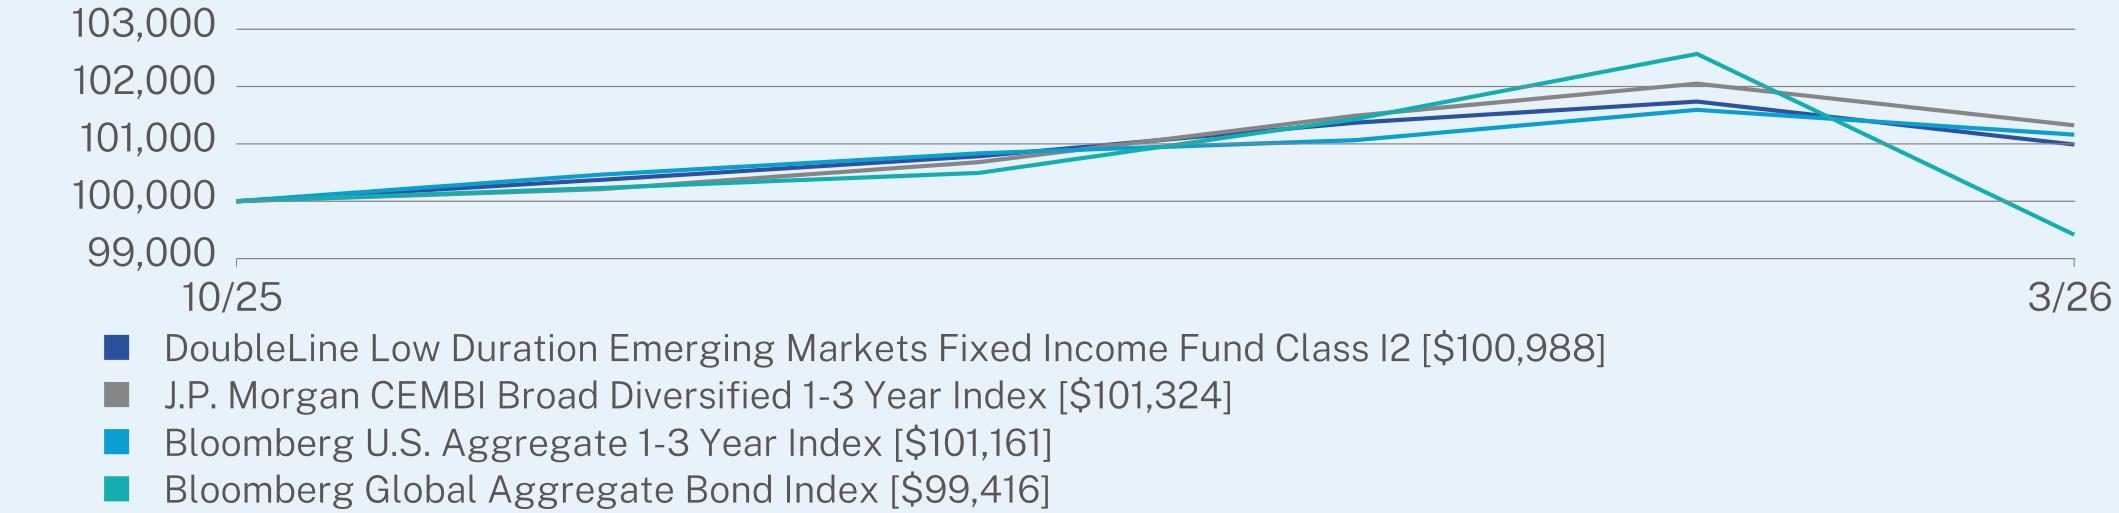
AVERAGE TOTAL RETURN (%)
|
|
Since Inception
(10/31/2025) |
|
Class I2 (without sales charge)
|
0.99
|
|
J.P. Morgan CEMBI Broad Diversified 1-3 Year Index
|
1.32
|
|
Bloomberg U.S. Aggregate 1-3 Year Index
|
1.16
|
|
Bloomberg Global Aggregate Bond Index
|
-0.58
|
Visit https://doubleline.com/fund-documents/ for more recent performance information.
KEY FUND STATISTICS
|
Net Assets
|
$132,042,300
|
|
Number of Holdings
|
89
|
|
Total Advisory Fees Paid
|
$400,820
|
|
Portfolio Turnover
|
58%
|
WHAT DID THE FUND INVEST IN?
|
Credit Quality Breakdown*
|
(% of Net Assets)
|
|
A
|
16.3
|
|
BBB
|
54.4
|
|
BB
|
21.9
|
|
Not Rated
|
0.2
|
|
Other
|
7.2
|
|
Top Ten Holdings
|
(% of Net Assets)
|
|
BBVA Mexico SA Institucion De Banca Multiple Grupo Financiero BBVA Mexico/TX, 5.88%, 09/13/2034
|
2.5
|
|
Chile Electricity PEC SpA, 01/25/2028
|
2.5
|
|
Oversea-Chinese Banking Corp. Ltd., 4.60%, 06/15/2032
|
2.4
|
|
Mexico Government International Bond, 4.50%, 04/22/2029
|
2.3
|
|
Chile Electricity Lux MPC Sarl, 6.01%, 01/20/2033
|
2.2
|
|
Guatemala Government Bond, 4.50%, 05/03/2026
|
2.2
|
|
MSILF Government Portfolio - Class Institutional, 3.57%, 12/31/2031
|
2.1
|
|
JPMorgan U.S. Government Money Market Fund - Class IM, 3.60%, 01/01/2040
|
2.1
|
|
First American Government Obligations Fund - Class U, 3.60%, 02/01/2030
|
2.1
|
|
AL Candelaria Spain SA, 7.50%, 12/15/2028
|
2.1
|
The DoubleLine fund complex has historically used multiple firms to serve as the independent registered public accounting firms across the fund complex in the United States. On August 19, 2025, the Board of Trustees of the Trust considered and approved a proposal to consolidate that work for the entire fund complex with a single firm, Deloitte & Touche LLP, and Deloitte was appointed to serve as the independent registered public accounting firm of each series of the Trust (each, a “Fund”) for the fiscal year ending March 31, 2026. In connection with that transition, PricewaterhouseCoopers LLP, each Fund’s prior independent registered public accounting firm, was dismissed effective as of August 5, 2025.
WHAT WERE THE FUND COSTS FOR THE PAST YEAR? (based on a hypothetical $10,000 investment)
|
Class Name
|
Costs of a $10,000 investment
|
Costs paid as a percentage of a $10,000 investment
|
|
Class N
|
$86
|
0.84%
|
HOW DID THE FUND PERFORM LAST YEAR AND WHAT AFFECTED ITS PERFORMANCE?
For the 12-month period ended March 31, 2026, the DoubleLine Low Duration Emerging Markets Fixed Income Fund outperformed the benchmark J.P. Morgan CEMBI Broad Diversified 1-3 Year Index return of 5.25%.
WHAT FACTORS INFLUENCED PERFORMANCE?
The Fund’s overweight to emerging markets sovereign debt and underweight to the Middle East and Asia relative to the benchmark contributed to performance. The Fund’s underweight to Europe and Africa detracted from performance.
POSITIONING
The Fund maintained a slightly longer duration than that of the benchmark. The Fund was overweight sovereign and quasi-sovereign debt relative to the benchmark and increased its allocation to investment grade credit. The Fund was overweight Latin America and underweight Asia, the Middle East and Africa.
|
Top Contributors
|
|
|
↑
|
Emerging Markets Sovereign Debt Allocation
|
|
↑
|
Middle East Allocation
|
|
↑
|
Asia Allocation
|
|
Top Detractors
|
|
|
↓
|
Europe Allocation
|
|
↓
|
Africa Allocation
|
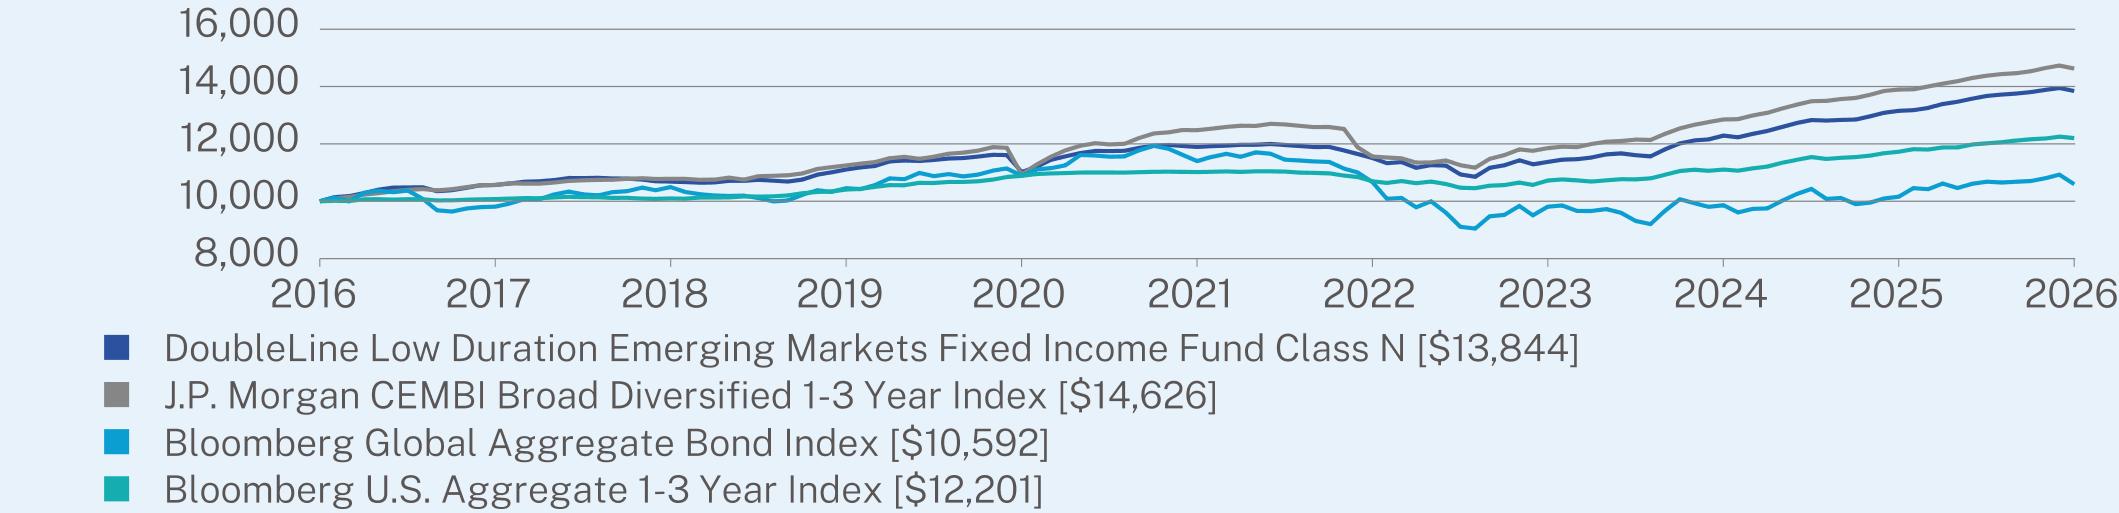
ANNUAL AVERAGE TOTAL RETURN (%)
|
|
1 Year
|
5 Year
|
10 Year
|
|
Class N (without sales charge)
|
5.24
|
3.08
|
3.31
|
|
J.P. Morgan CEMBI Broad Diversified 1-3 Year Index
|
5.25
|
3.23
|
3.88
|
|
Bloomberg U.S. Aggregate 1-3 Year Index
|
4.03
|
2.06
|
2.01
|
|
Bloomberg Global Aggregate Bond Index
|
4.26
|
-1.46
|
0.58
|
Visit https://doubleline.com/fund-documents/ for more recent performance information.
KEY FUND STATISTICS
|
Net Assets
|
$132,042,300
|
|
Number of Holdings
|
89
|
|
Total Advisory Fees Paid
|
$400,820
|
|
Portfolio Turnover
|
58%
|
WHAT DID THE FUND INVEST IN?
|
Credit Quality Breakdown*
|
(% of Net Assets)
|
|
A
|
16.3
|
|
BBB
|
54.4
|
|
BB
|
21.9
|
|
Not Rated
|
0.2
|
|
Other
|
7.2
|
|
Top Ten Holdings
|
(% of Net Assets)
|
|
BBVA Mexico SA Institucion De Banca Multiple Grupo Financiero BBVA Mexico/TX, 5.88%, 09/13/2034
|
2.5
|
|
Chile Electricity PEC SpA, 01/25/2028
|
2.5
|
|
Oversea-Chinese Banking Corp. Ltd., 4.60%, 06/15/2032
|
2.4
|
|
Mexico Government International Bond, 4.50%, 04/22/2029
|
2.3
|
|
Chile Electricity Lux MPC Sarl, 6.01%, 01/20/2033
|
2.2
|
|
Guatemala Government Bond, 4.50%, 05/03/2026
|
2.2
|
|
MSILF Government Portfolio - Class Institutional, 3.57%, 12/31/2031
|
2.1
|
|
JPMorgan U.S. Government Money Market Fund - Class IM, 3.60%, 01/01/2040
|
2.1
|
|
First American Government Obligations Fund - Class U, 3.60%, 02/01/2030
|
2.1
|
|
AL Candelaria Spain SA, 7.50%, 12/15/2028
|
2.1
|
The DoubleLine fund complex has historically used multiple firms to serve as the independent registered public accounting firms across the fund complex in the United States. On August 19, 2025, the Board of Trustees of the Trust considered and approved a proposal to consolidate that work for the entire fund complex with a single firm, Deloitte & Touche LLP, and Deloitte was appointed to serve as the independent registered public accounting firm of each series of the Trust (each, a “Fund”) for the fiscal year ending March 31, 2026. In connection with that transition, PricewaterhouseCoopers LLP, each Fund’s prior independent registered public accounting firm, was dismissed effective as of August 5, 2025.
WHAT WERE THE FUND COSTS FOR THE PAST YEAR? (based on a hypothetical $10,000 investment)
|
Class Name
|
Costs of a $10,000 investment
|
Costs paid as a percentage of a $10,000 investment
|
|
Class I
|
$51
|
0.50%
|
HOW DID THE FUND PERFORM LAST YEAR AND WHAT AFFECTED ITS PERFORMANCE?
For the 12-month period ended March 31, 2026, the DoubleLine Long Duration Total Return Bond Fund underperformed the benchmark Bloomberg U.S. Long Government/Credit Index return of 2.17% on a net asset value basis.
WHAT FACTORS INFLUENCED PERFORMANCE?
The Fund maintained an average duration slightly longer than that of its benchmark during a period of rising interest rates, which detracted from performance. This was driven primarily by the Fund’s allocation to long-duration U.S. government securities. Partially offsetting this, the Fund’s allocation to Agency mortgage-backed securities generated strong returns and outperformed long-duration mortgages in the benchmark.
POSITIONING
The Fund invested primarily in long-duration Agency mortgage-backed securities and maintained a high-quality profile, with a 100% allocation to U.S. government-backed assets.
|
Top Contributors
|
|
|
↑
|
Agency Mortgage-Backed Securities
|
|
Top Detractors
|
|
|
↓
|
Long Duration Positioning
|

ANNUAL AVERAGE TOTAL RETURN (%)
|
|
1 Year
|
5 Year
|
10 Year
|
|
Class I (without sales charge)
|
2.02
|
-4.23
|
-0.79
|
|
Bloomberg U.S. Long Government/Credit Index
|
2.17
|
-2.93
|
1.18
|
|
Bloomberg U.S. Aggregate Bond Index
|
4.35
|
0.31
|
1.70
|
Visit https://doubleline.com/fund-documents/ for more recent performance information.
KEY FUND STATISTICS
|
Net Assets
|
$55,217,410
|
|
Number of Holdings
|
61
|
|
Total Advisory Fees Paid
|
$34,925
|
|
Portfolio Turnover
|
74%
|
|
Effective Duration
|
14.22 years
|
|
Weighted Average Life
|
9.73 years
|
WHAT DID THE FUND INVEST IN?
|
Credit Quality Breakdown*
|
(% of Net Assets)
|
|
Government
|
21.7
|
|
Agency
|
68.6
|
|
Other
|
9.7
|
|
Sector Breakdown
|
(% of Net Assets)
|
|
U.S. Government and Agency Mortgage Backed Obligations
|
90.9
|
|
Money Market Funds
|
11.6
|
|
Futures Contracts
|
-0.6
|
|
Cash & Other
|
-1.9
|
The DoubleLine fund complex has historically used multiple firms to serve as the independent registered public accounting firms across the fund complex in the United States. On August 19, 2025, the Board of Trustees of the Trust considered and approved a proposal to consolidate that work for the entire fund complex with a single firm, Deloitte & Touche LLP, and Deloitte was appointed to serve as the independent registered public accounting firm of each series of the Trust (each, a “Fund”) for the fiscal year ending March 31, 2026. In connection with that transition, PricewaterhouseCoopers LLP, each Fund’s prior independent registered public accounting firm, was dismissed effective as of August 5, 2025.
WHAT WERE THE FUND COSTS FOR THE PAST YEAR? (based on a hypothetical $10,000 investment)
|
Class Name
|
Costs of a $10,000 investment
|
Costs paid as a percentage of a $10,000 investment*,**
|
|
Class I2
|
$23
|
0.57%
|
HOW DID THE FUND PERFORM LAST YEAR AND WHAT AFFECTED ITS PERFORMANCE?
For the 12-month period ended March 31, 2026, the DoubleLine Long Duration Total Return Bond Fund underperformed the benchmark Bloomberg U.S. Long Government/Credit Index return of 2.17% on a net asset value basis.
WHAT FACTORS INFLUENCED PERFORMANCE?
The Fund maintained an average duration slightly longer than that of its benchmark during a period of rising interest rates, which detracted from performance. This was driven primarily by the Fund’s allocation to long-duration U.S. government securities. Partially offsetting this, the Fund’s allocation to Agency mortgage-backed securities generated strong returns and outperformed long-duration mortgages in the benchmark.
POSITIONING
The Fund invested primarily in long-duration Agency mortgage-backed securities and maintained a high-quality profile, with a 100% allocation to U.S. government-backed assets.
|
Top Contributors
|
|
|
↑
|
Agency Mortgage-Backed Securities
|
|
Top Detractors
|
|
|
↓
|
Long Duration Positioning
|
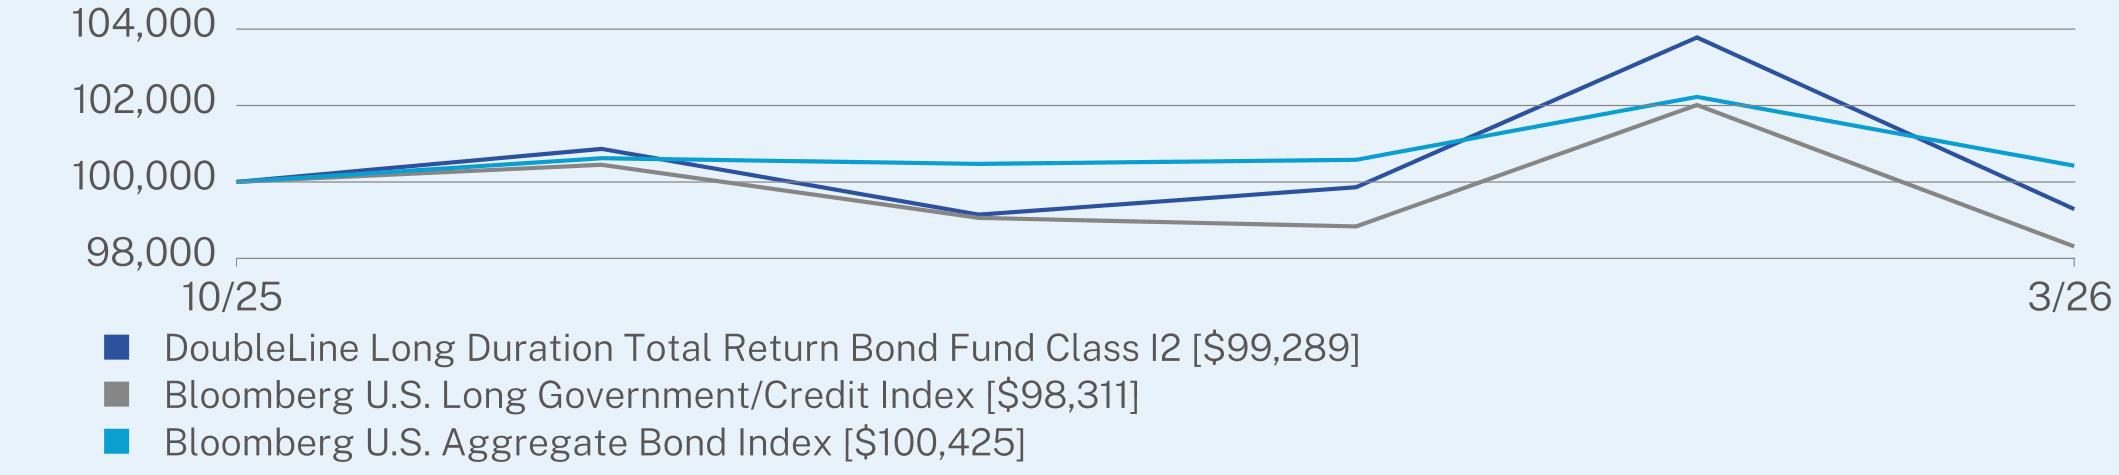
AVERAGE TOTAL RETURN (%)
|
|
Since Inception
(10/31/2025) |
|
Class I2 (without sales charge)
|
-0.71
|
|
Bloomberg U.S. Aggregate Bond Index
|
0.43
|
|
Bloomberg U.S. Long Government/Credit
|
-1.69
|
Visit https://doubleline.com/fund-documents/ for more recent performance information.
KEY FUND STATISTICS
|
Net Assets
|
$55,217,410
|
|
Number of Holdings
|
61
|
|
Total Advisory Fees Paid
|
$34,925
|
|
Portfolio Turnover
|
74%
|
|
Effective Duration
|
14.22 years
|
|
Weighted Average Life
|
9.73 years
|
WHAT DID THE FUND INVEST IN?
|
Credit Quality Breakdown*
|
(% of Net Assets)
|
|
Government
|
21.7
|
|
Agency
|
68.6
|
|
Other
|
9.7
|
|
Sector Breakdown
|
(% of Net Assets)
|
|
U.S. Government and Agency Mortgage Backed Obligations
|
90.9
|
|
Money Market Funds
|
11.6
|
|
Futures Contracts
|
-0.6
|
|
Cash & Other
|
-1.9
|
The DoubleLine fund complex has historically used multiple firms to serve as the independent registered public accounting firms across the fund complex in the United States. On August 19, 2025, the Board of Trustees of the Trust considered and approved a proposal to consolidate that work for the entire fund complex with a single firm, Deloitte & Touche LLP, and Deloitte was appointed to serve as the independent registered public accounting firm of each series of the Trust (each, a “Fund”) for the fiscal year ending March 31, 2026. In connection with that transition, PricewaterhouseCoopers LLP, each Fund’s prior independent registered public accounting firm, was dismissed effective as of August 5, 2025.
WHAT WERE THE FUND COSTS FOR THE PAST YEAR? (based on a hypothetical $10,000 investment)
|
Class Name
|
Costs of a $10,000 investment
|
Costs paid as a percentage of a $10,000 investment
|
|
Class N
|
$76
|
0.75%
|
HOW DID THE FUND PERFORM LAST YEAR AND WHAT AFFECTED ITS PERFORMANCE?
For the 12-month period ended March 31, 2026, the DoubleLine Long Duration Total Return Bond Fund underperformed the benchmark Bloomberg U.S. Long Government/Credit Index return of 2.17% on a net asset value basis.
WHAT FACTORS INFLUENCED PERFORMANCE?
The Fund maintained an average duration slightly longer than that of its benchmark during a period of rising interest rates, which detracted from performance. This was driven primarily by the Fund’s allocation to long-duration U.S. government securities. Partially offsetting this, the Fund’s allocation to Agency mortgage-backed securities generated strong returns and outperformed long-duration mortgages in the benchmark.
POSITIONING
The Fund invested primarily in long-duration Agency mortgage-backed securities and maintained a high-quality profile, with a 100% allocation to U.S. government-backed assets.
|
Top Contributors
|
|
|
↑
|
Agency Mortgage-Backed Securities
|
|
Top Detractors
|
|
|
↓
|
Long Duration Positioning
|
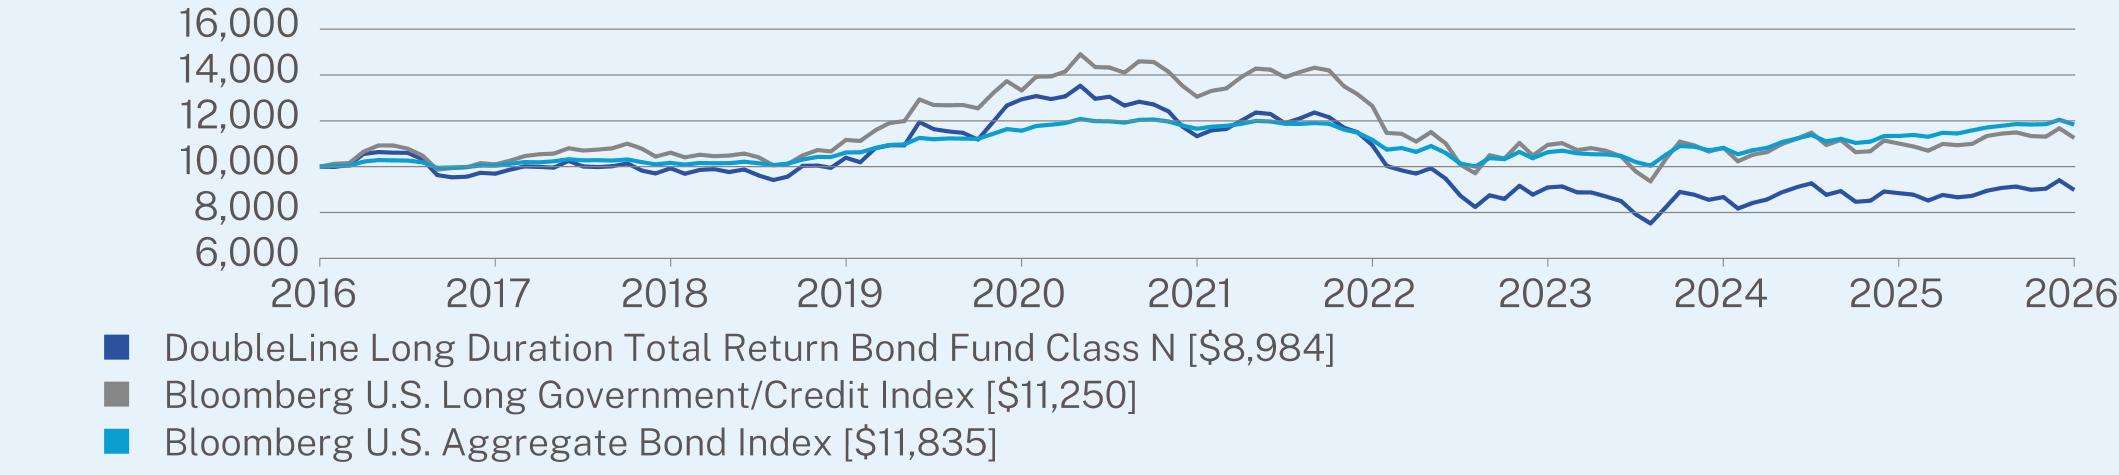
ANNUAL AVERAGE TOTAL RETURN (%)
|
|
1 Year
|
5 Year
|
10 Year
|
|
Class N (without sales charge)
|
1.61
|
-4.53
|
-1.07
|
|
Bloomberg U.S. Long Government/Credit Index
|
2.17
|
-2.93
|
1.18
|
|
Bloomberg U.S. Aggregate Bond Index
|
4.35
|
0.31
|
1.70
|
Visit https://doubleline.com/fund-documents/ for more recent performance information.
KEY FUND STATISTICS
|
Net Assets
|
$55,217,410
|
|
Number of Holdings
|
61
|
|
Total Advisory Fees Paid
|
$34,925
|
|
Portfolio Turnover
|
74%
|
|
Effective Duration
|
14.22 years
|
|
Weighted Average Life
|
9.73 years
|
WHAT DID THE FUND INVEST IN?
|
Credit Quality Breakdown*
|
(% of Net Assets)
|
|
Government
|
21.7
|
|
Agency
|
68.6
|
|
Other
|
9.7
|
|
Sector Breakdown
|
(% of Net Assets)
|
|
U.S. Government and Agency Mortgage Backed Obligations
|
90.9
|
|
Money Market Funds
|
11.6
|
|
Futures Contracts
|
-0.6
|
|
Cash & Other
|
-1.9
|
The DoubleLine fund complex has historically used multiple firms to serve as the independent registered public accounting firms across the fund complex in the United States. On August 19, 2025, the Board of Trustees of the Trust considered and approved a proposal to consolidate that work for the entire fund complex with a single firm, Deloitte & Touche LLP, and Deloitte was appointed to serve as the independent registered public accounting firm of each series of the Trust (each, a “Fund”) for the fiscal year ending March 31, 2026. In connection with that transition, PricewaterhouseCoopers LLP, each Fund’s prior independent registered public accounting firm, was dismissed effective as of August 5, 2025.
WHAT WERE THE FUND COSTS FOR THE PAST YEAR? (based on a hypothetical $10,000 investment)
|
Class Name
|
Costs of a $10,000 investment
|
Costs paid as a percentage of a $10,000 investment
|
|
Class I
|
$125
|
1.10%
|
HOW DID THE FUND PERFORM LAST YEAR AND WHAT AFFECTED ITS PERFORMANCE?
For the 12-month period ended March 31, 2026, the DoubleLine Strategic Commodity Fund underperformed the benchmark Bloomberg Commodity Index Total Return of 32.29% on a net asset value basis.
WHAT FACTORS INFLUENCED PERFORMANCE?
During the period, the Fund was allocated to the Morgan Stanley Backwardation Focused Multi-Commodity Index (MSBFMCI beta exposure) and the DoubleLine Commodity Long Short Strategy (DCLSS alpha exposure), which the Fund gained exposure to using swap contracts. The Fund’s exposure to the MSBFMCI increased in value but underperformed the benchmark. The Fund’s exposure to the DCLSS increased in value but underperformed the benchmark. The Fund’s use of derivative instruments to gain exposure to commodities facilitated investment of the Fund’s remaining assets in U.S. Treasuries, which increased in value.
POSITIONING
On average during the period, the Fund had a roughly one-quarter exposure to the DCLSS and a three-quarters exposure to the MSBFMCI. The Fund was fully collateralized by U.S. Treasuries.
|
Top Contributors
|
|
|
↑
|
Morgan Stanley Backwardation Focused Multi-Commodity Index Beta Exposure
|
|
↑
|
DoubleLine Commodity Long Short Strategy Alpha Exposure
|
|
↑
|
U.S. Treasuries
|
|
Top Detractors
|
|
|
↓
|
All holdings within the Fund contributed to performance
|
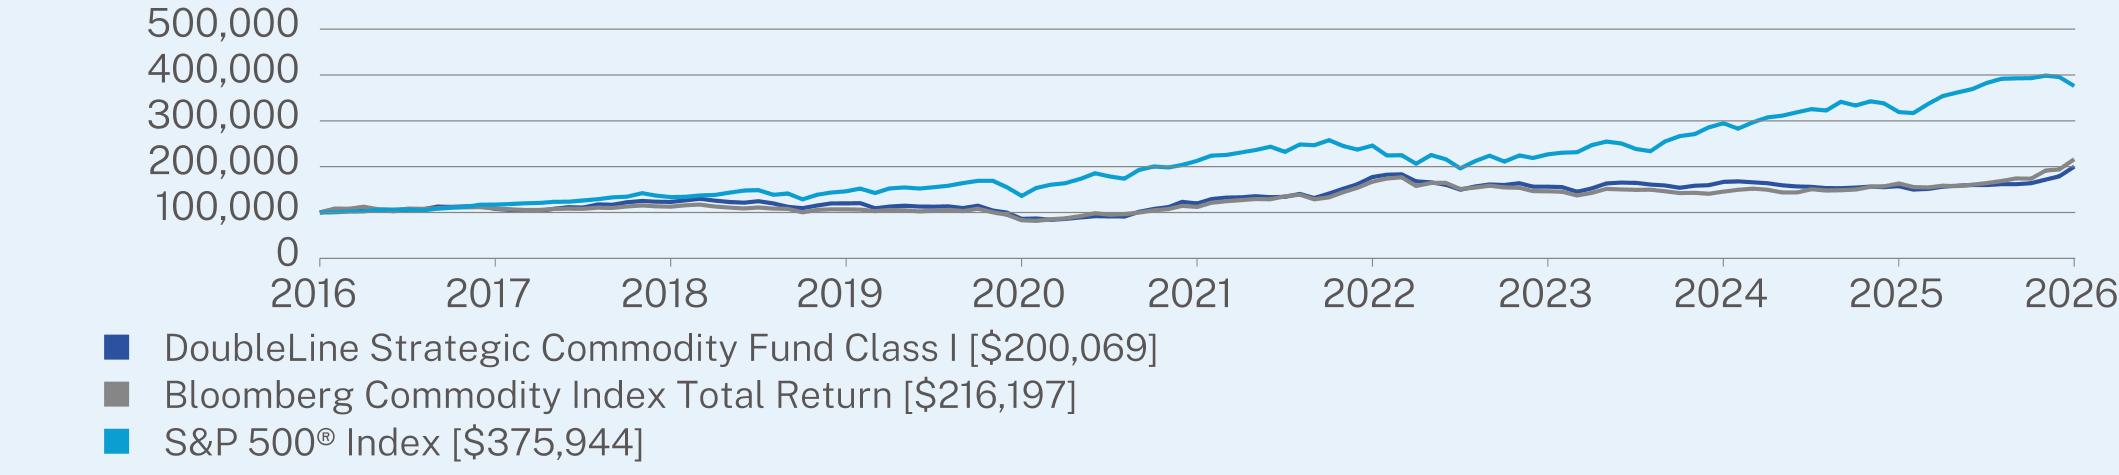
ANNUAL AVERAGE TOTAL RETURN (%)
|
|
1 Year
|
5 Year
|
10 Year
|
|
Class I (without sales charge)
|
27.14
|
10.83
|
7.18
|
|
Bloomberg Commodity Index Total Return
|
32.29
|
14.04
|
8.02
|
|
S&P 500® Index
|
17.80
|
12.06
|
14.16
|
Visit https://doubleline.com/fund-documents/ for more recent performance information.
KEY FUND STATISTICS
|
Net Assets
|
$85,521,600
|
|
Number of Holdings
|
18
|
|
Total Advisory Fees Paid
|
$552,079
|
|
Portfolio Turnover
|
0%
|
WHAT DID THE FUND INVEST IN?
|
Morgan Stanley BFMCI Breakdown
|
(% of Net Assets)
|
|
Energy
|
41.4
|
|
Grains
|
18.7
|
|
Livestock
|
4.5
|
|
Metals
|
26.9
|
|
Softs
|
8.5
|
|
Portfolio Sector Allocation Breakdown*
|
(% of Net Assets)
|
|
Morgan Stanley BFMCI
|
79.9
|
|
Tactical Commodity Exposure
|
20.1
|
|
Tactical Commodity Exposure Breakdown*
|
(% of Net Assets)
|
|
Long Commodity Allocation
|
58.4
|
|
Short Commodity Allocation
|
41.6
|
The DoubleLine fund complex has historically used multiple firms to serve as the independent registered public accounting firms across the fund complex in the United States. On August 19, 2025, the Board of Trustees of the Trust considered and approved a proposal to consolidate that work for the entire fund complex with a single firm, Deloitte & Touche LLP, and Deloitte was appointed to serve as the independent registered public accounting firm of each series of the Trust (each, a “Fund”) for the fiscal year ending March 31, 2026. In connection with that transition, PricewaterhouseCoopers LLP, each Fund’s prior independent registered public accounting firm, was dismissed effective as of August 5, 2025.
WHAT WERE THE FUND COSTS FOR THE PAST YEAR? (based on a hypothetical $10,000 investment)
|
Class Name
|
Costs of a $10,000 investment
|
Costs paid as a percentage of a $10,000 investment*,**
|
|
Class I2
|
$54
|
1.17%
|
HOW DID THE FUND PERFORM LAST YEAR AND WHAT AFFECTED ITS PERFORMANCE?
For the 12-month period ended March 31, 2026, the DoubleLine Strategic Commodity Fund underperformed the benchmark Bloomberg Commodity Index Total Return of 32.29% on a net asset value basis.
WHAT FACTORS INFLUENCED PERFORMANCE?
During the period, the Fund was allocated to the Morgan Stanley Backwardation Focused Multi-Commodity Index (MSBFMCI beta exposure) and the DoubleLine Commodity Long Short Strategy (DCLSS alpha exposure), which the Fund gained exposure to using swap contracts. The Fund’s exposure to the MSBFMCI increased in value but underperformed the benchmark. The Fund’s exposure to the DCLSS increased in value but underperformed the benchmark. The Fund’s use of derivative instruments to gain exposure to commodities facilitated investment of the Fund’s remaining assets in U.S. Treasuries, which increased in value.
POSITIONING
On average during the period, the Fund had a roughly one-quarter exposure to the DCLSS and a three-quarters exposure to the MSBFMCI. The Fund was fully collateralized by U.S. Treasuries.
|
Top Contributors
|
|
|
↑
|
Morgan Stanley Backwardation Focused Multi-Commodity Index Beta Exposure
|
|
↑
|
DoubleLine Commodity Long Short Strategy Alpha Exposure
|
|
↑
|
U.S. Treasuries
|
|
Top Detractors
|
|
|
↓
|
All holdings within the Fund contributed to performance
|
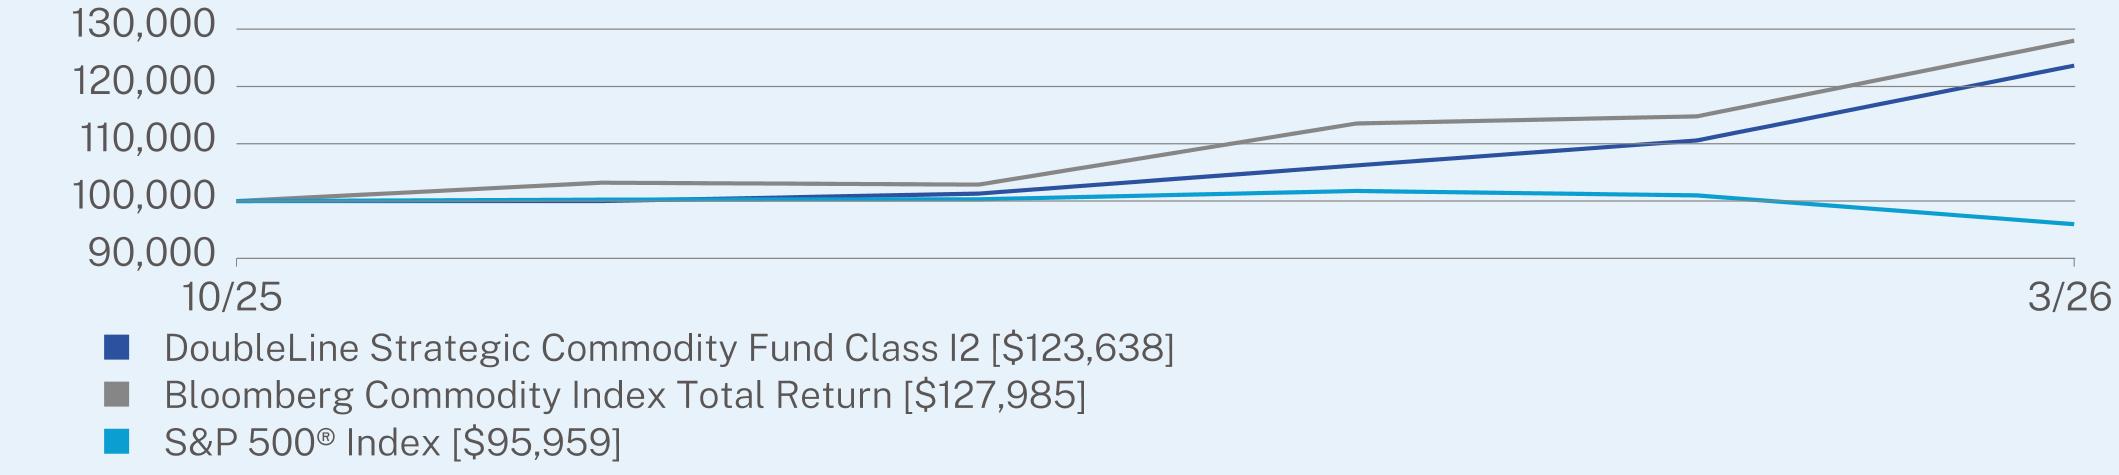
AVERAGE TOTAL RETURN (%)
|
|
Since Inception
(10/31/2025) |
|
Class I2 (without sales charge)
|
23.64
|
|
Bloomberg Commodity Index Total Return
|
27.99
|
|
S&P 500® Index
|
-4.04
|
Visit https://doubleline.com/fund-documents/ for more recent performance information.
KEY FUND STATISTICS
|
Net Assets
|
$85,521,600
|
|
Number of Holdings
|
18
|
|
Total Advisory Fees Paid
|
$552,079
|
|
Portfolio Turnover
|
0%
|
WHAT DID THE FUND INVEST IN?
|
Morgan Stanley BFMCI Breakdown
|
(% of Net Assets)
|
|
Energy
|
41.4
|
|
Grains
|
18.7
|
|
Livestock
|
4.5
|
|
Metals
|
26.9
|
|
Softs
|
8.5
|
|
Portfolio Sector Allocation Breakdown*
|
(% of Net Assets)
|
|
Morgan Stanley BFMCI
|
79.9
|
|
Tactical Commodity Exposure
|
20.1
|
|
Tactical Commodity Exposure Breakdown*
|
(% of Net Assets)
|
|
Long Commodity Allocation
|
58.4
|
|
Short Commodity Allocation
|
41.6
|
The DoubleLine fund complex has historically used multiple firms to serve as the independent registered public accounting firms across the fund complex in the United States. On August 19, 2025, the Board of Trustees of the Trust considered and approved a proposal to consolidate that work for the entire fund complex with a single firm, Deloitte & Touche LLP, and Deloitte was appointed to serve as the independent registered public accounting firm of each series of the Trust (each, a “Fund”) for the fiscal year ending March 31, 2026. In connection with that transition, PricewaterhouseCoopers LLP, each Fund’s prior independent registered public accounting firm, was dismissed effective as of August 5, 2025.
WHAT WERE THE FUND COSTS FOR THE PAST YEAR? (based on a hypothetical $10,000 investment)
|
Class Name
|
Costs of a $10,000 investment
|
Costs paid as a percentage of a $10,000 investment
|
|
Class N
|
$153
|
1.35%
|
HOW DID THE FUND PERFORM LAST YEAR AND WHAT AFFECTED ITS PERFORMANCE?
For the 12-month period ended March 31, 2026, the DoubleLine Strategic Commodity Fund underperformed the benchmark Bloomberg Commodity Index Total Return of 32.29% on a net asset value basis.
WHAT FACTORS INFLUENCED PERFORMANCE?
During the period, the Fund was allocated to the Morgan Stanley Backwardation Focused Multi-Commodity Index (MSBFMCI beta exposure) and the DoubleLine Commodity Long Short Strategy (DCLSS alpha exposure), which the Fund gained exposure to using swap contracts. The Fund’s exposure to the MSBFMCI increased in value but underperformed the benchmark. The Fund’s exposure to the DCLSS increased in value but underperformed the benchmark. The Fund’s use of derivative instruments to gain exposure to commodities facilitated investment of the Fund’s remaining assets in U.S. Treasuries, which increased in value.
POSITIONING
On average during the period, the Fund had a roughly one-quarter exposure to the DCLSS and a three-quarters exposure to the MSBFMCI. The Fund was fully collateralized by U.S. Treasuries.
|
Top Contributors
|
|
|
↑
|
Morgan Stanley Backwardation Focused Multi-Commodity Index Beta Exposure
|
|
↑
|
DoubleLine Commodity Long Short Strategy Alpha Exposure
|
|
↑
|
U.S. Treasuries
|
|
Top Detractors
|
|
|
↓
|
All holdings within the Fund contributed to performance
|
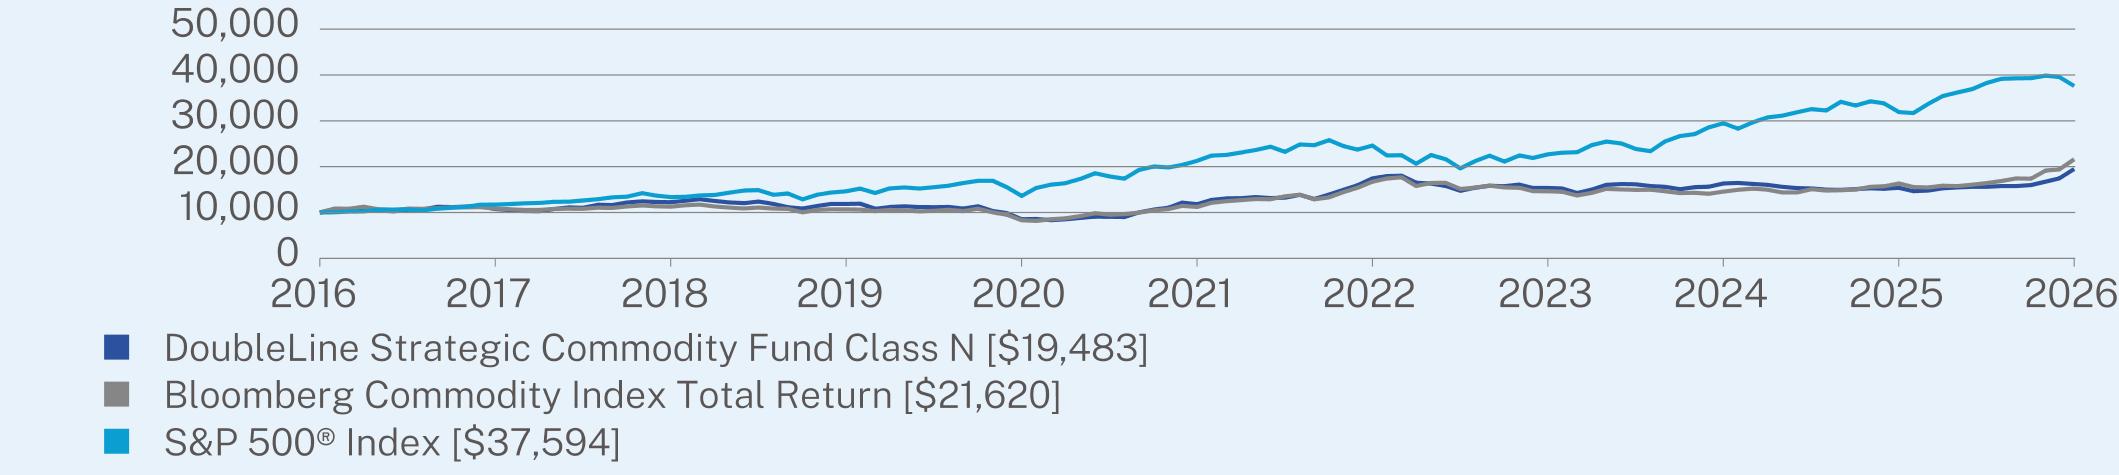
ANNUAL AVERAGE TOTAL RETURN (%)
|
|
1 Year
|
5 Year
|
10 Year
|
|
Class N (without sales charge)
|
26.68
|
10.55
|
6.90
|
|
Bloomberg Commodity Index Total Return
|
32.29
|
14.04
|
8.02
|
|
S&P 500® Index
|
17.80
|
12.06
|
14.16
|
Visit https://doubleline.com/fund-documents/ for more recent performance information.
KEY FUND STATISTICS
|
Net Assets
|
$85,521,600
|
|
Number of Holdings
|
18
|
|
Total Advisory Fees Paid
|
$552,079
|
|
Portfolio Turnover
|
0%
|
WHAT DID THE FUND INVEST IN?
|
Morgan Stanley BFMCI Breakdown
|
(% of Net Assets)
|
|
Energy
|
41.4
|
|
Grains
|
18.7
|
|
Livestock
|
4.5
|
|
Metals
|
26.9
|
|
Softs
|
8.5
|
|
Portfolio Sector Allocation Breakdown*
|
(% of Net Assets)
|
|
Morgan Stanley BFMCI
|
79.9
|
|
Tactical Commodity Exposure
|
20.1
|
|
Tactical Commodity Exposure Breakdown*
|
(% of Net Assets)
|
|
Long Commodity Allocation
|
58.4
|
|
Short Commodity Allocation
|
41.6
|
The DoubleLine fund complex has historically used multiple firms to serve as the independent registered public accounting firms across the fund complex in the United States. On August 19, 2025, the Board of Trustees of the Trust considered and approved a proposal to consolidate that work for the entire fund complex with a single firm, Deloitte & Touche LLP, and Deloitte was appointed to serve as the independent registered public accounting firm of each series of the Trust (each, a “Fund”) for the fiscal year ending March 31, 2026. In connection with that transition, PricewaterhouseCoopers LLP, each Fund’s prior independent registered public accounting firm, was dismissed effective as of August 5, 2025.
WHAT WERE THE FUND COSTS FOR THE PAST YEAR? (based on a hypothetical $10,000 investment)
|
Class Name
|
Costs of a $10,000 investment
|
Costs paid as a percentage of a $10,000 investment
|
|
Class I
|
$66
|
0.64%
|
HOW DID THE FUND PERFORM LAST YEAR AND WHAT AFFECTED ITS PERFORMANCE?
For the 12-month period ended March 31, 2026, the DoubleLine Global Bond Fund outperformed the benchmark FTSE World Government Bond Index return of 3.75% on a net asset value basis.
WHAT FACTORS INFLUENCED PERFORMANCE?
The Fund’s underweight to Japan relative to the benchmark and exposure to South Africa and Mexico contributed to Fund performance. The Fund’s underweight to China and exposure to Italy detracted from Fund performance.
POSITIONING
The Fund maintained a duration shorter than that of the benchmark. In terms of regional allocation, the Fund held an overweight relative to the benchmark to Central and Eastern Europe, Middle East and Africa (CEEMEA) while maintaining an underweight to emerging Asia.
|
Top Contributors
|
|
|
↑
|
Japan Allocation
|
|
↑
|
South Africa Allocation
|
|
↑
|
Mexico Allocation
|
|
Top Detractors
|
|
|
↓
|
China Allocation
|
|
↓
|
Italy Allocation
|
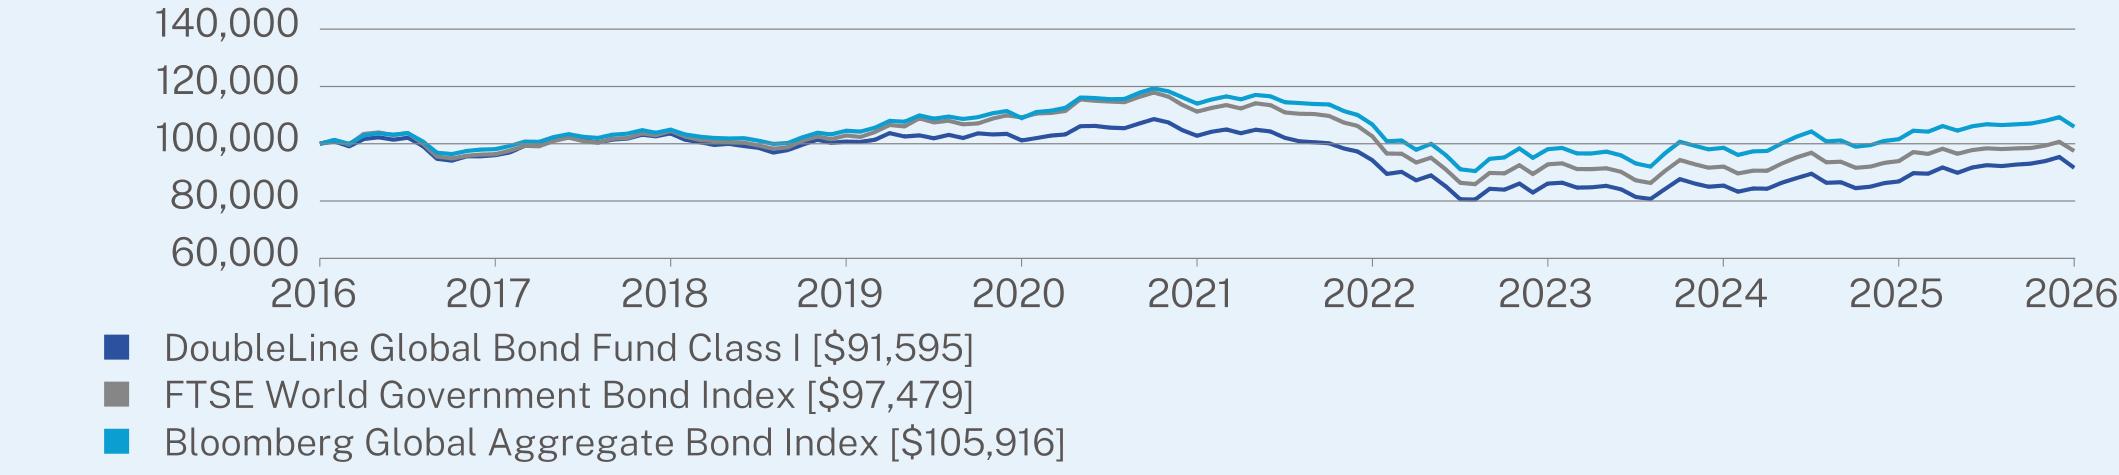
ANNUAL AVERAGE TOTAL RETURN (%)
|
|
1 Year
|
5 Year
|
10 Year
|
|
Class I (without sales charge)
|
5.45
|
-2.28
|
-0.87
|
|
FTSE World Government Bond Index
|
3.75
|
-2.60
|
-0.25
|
|
Bloomberg Global Aggregate Bond Index
|
4.26
|
-1.46
|
0.58
|
Visit https://doubleline.com/fund-documents/ for more recent performance information.
KEY FUND STATISTICS
|
Net Assets
|
$246,087,335
|
|
Number of Holdings
|
59
|
|
Total Advisory Fees Paid
|
$1,109,833
|
|
Portfolio Turnover
|
45%
|
WHAT DID THE FUND INVEST IN?
|
Credit Quality Breakdown*
|
(% of Net Assets)
|
|
Government
|
35.2
|
|
AAA
|
12.1
|
|
AA
|
16.8
|
|
A
|
19.9
|
|
BBB
|
6.8
|
|
BB
|
2.8
|
|
Other
|
6.4
|
|
Top Ten Holdings
|
(% of Net Assets)
|
|
United States Treasury Note/Bond, 0.63%, 08/15/2030
|
4.7
|
|
United States Treasury Note/Bond, 0.75%, 01/31/2028
|
4.1
|
|
United States Treasury Note/Bond, 0.88%, 11/15/2030
|
3.9
|
|
Australia Government Bond, 2.75%, 06/21/2035
|
3.8
|
|
United States Treasury Note/Bond, 0.63%, 05/15/2030
|
3.7
|
|
Spain Government Bond, 0.50%, 04/30/2030
|
3.4
|
|
United States Treasury Note/Bond, 0.63%, 12/31/2027
|
3.2
|
|
United States Treasury Note/Bond, 1.13%, 05/15/2040
|
2.8
|
|
United States Treasury Note/Bond, 1.75%, 08/15/2041
|
2.8
|
|
United States Treasury Note/Bond, 1.38%, 11/15/2040
|
2.8
|
The DoubleLine fund complex has historically used multiple firms to serve as the independent registered public accounting firms across the fund complex in the United States. On August 19, 2025, the Board of Trustees of the Trust considered and approved a proposal to consolidate that work for the entire fund complex with a single firm, Deloitte & Touche LLP, and Deloitte was appointed to serve as the independent registered public accounting firm of each series of the Trust (each, a “Fund”) for the fiscal year ending March 31, 2026. In connection with that transition, PricewaterhouseCoopers LLP, each Fund’s prior independent registered public accounting firm, was dismissed effective as of August 5, 2025.
WHAT WERE THE FUND COSTS FOR THE PAST YEAR? (based on a hypothetical $10,000 investment)
|
Class Name
|
Costs of a $10,000 investment
|
Costs paid as a percentage of a $10,000 investment*,**
|
|
Class I2
|
$32
|
0.77%
|
HOW DID THE FUND PERFORM LAST YEAR AND WHAT AFFECTED ITS PERFORMANCE?
For the 12-month period ended March 31, 2026, the DoubleLine Global Bond Fund outperformed the benchmark FTSE World Government Bond Index return of 3.75% on a net asset value basis.
WHAT FACTORS INFLUENCED PERFORMANCE?
The Fund’s underweight to Japan relative to the benchmark and exposure to South Africa and Mexico contributed to Fund performance. The Fund’s underweight to China and exposure to Italy detracted from Fund performance.
POSITIONING
The Fund maintained a duration shorter than that of the benchmark. In terms of regional allocation, the Fund held an overweight relative to the benchmark to Central and Eastern Europe, Middle East and Africa (CEEMEA) while maintaining an underweight to emerging Asia.
|
Top Contributors
|
|
|
↑
|
Japan Allocation
|
|
↑
|
South Africa Allocation
|
|
↑
|
Mexico Allocation
|
|
Top Detractors
|
|
|
↓
|
China Allocation
|
|
↓
|
Italy Allocation
|
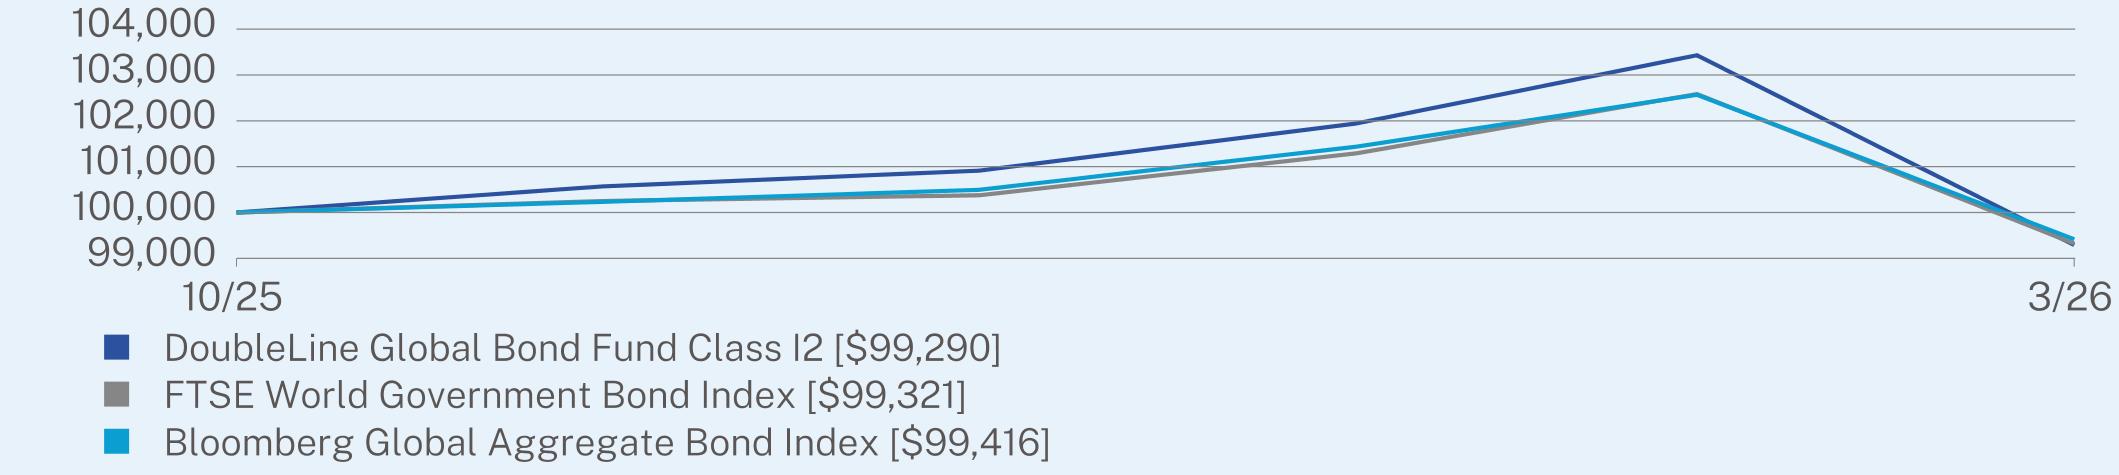
AVERAGE TOTAL RETURN (%)
|
|
Since Inception
(10/31/2025) |
|
Class I2 (without sales charge)
|
-0.71
|
|
FTSE World Government Bond Index
|
-0.68
|
|
Bloomberg Global Aggregate Bond Index
|
-0.58
|
Visit https://doubleline.com/fund-documents/ for more recent performance information.
KEY FUND STATISTICS
|
Net Assets
|
$246,087,335
|
|
Number of Holdings
|
59
|
|
Total Advisory Fees Paid
|
$1,109,833
|
|
Portfolio Turnover
|
45%
|
WHAT DID THE FUND INVEST IN?
|
Credit Quality Breakdown*
|
(% of Net Assets)
|
|
Government
|
35.2
|
|
AAA
|
12.1
|
|
AA
|
16.8
|
|
A
|
19.9
|
|
BBB
|
6.8
|
|
BB
|
2.8
|
|
Other
|
6.4
|
|
Top Ten Holdings
|
(% of Net Assets)
|
|
United States Treasury Note/Bond, 0.63%, 08/15/2030
|
4.7
|
|
United States Treasury Note/Bond, 0.75%, 01/31/2028
|
4.1
|
|
United States Treasury Note/Bond, 0.88%, 11/15/2030
|
3.9
|
|
Australia Government Bond, 2.75%, 06/21/2035
|
3.8
|
|
United States Treasury Note/Bond, 0.63%, 05/15/2030
|
3.7
|
|
Spain Government Bond, 0.50%, 04/30/2030
|
3.4
|
|
United States Treasury Note/Bond, 0.63%, 12/31/2027
|
3.2
|
|
United States Treasury Note/Bond, 1.13%, 05/15/2040
|
2.8
|
|
United States Treasury Note/Bond, 1.75%, 08/15/2041
|
2.8
|
|
United States Treasury Note/Bond, 1.38%, 11/15/2040
|
2.8
|
The DoubleLine fund complex has historically used multiple firms to serve as the independent registered public accounting firms across the fund complex in the United States. On August 19, 2025, the Board of Trustees of the Trust considered and approved a proposal to consolidate that work for the entire fund complex with a single firm, Deloitte & Touche LLP, and Deloitte was appointed to serve as the independent registered public accounting firm of each series of the Trust (each, a “Fund”) for the fiscal year ending March 31, 2026. In connection with that transition, PricewaterhouseCoopers LLP, each Fund’s prior independent registered public accounting firm, was dismissed effective as of August 5, 2025.
WHAT WERE THE FUND COSTS FOR THE PAST YEAR? (based on a hypothetical $10,000 investment)
|
Class Name
|
Costs of a $10,000 investment
|
Costs paid as a percentage of a $10,000 investment
|
|
Class N
|
$91
|
0.89%
|
HOW DID THE FUND PERFORM LAST YEAR AND WHAT AFFECTED ITS PERFORMANCE?
For the 12-month period ended March 31, 2026, the DoubleLine Global Bond Fund outperformed the benchmark FTSE World Government Bond Index return of 3.75% on a net asset value basis.
WHAT FACTORS INFLUENCED PERFORMANCE?
The Fund’s underweight to Japan relative to the benchmark and exposure to South Africa and Mexico contributed to Fund performance. The Fund’s underweight to China and exposure to Italy detracted from Fund performance.
POSITIONING
The Fund maintained a duration shorter than that of the benchmark. In terms of regional allocation, the Fund held an overweight relative to the benchmark to Central and Eastern Europe, Middle East and Africa (CEEMEA) while maintaining an underweight to emerging Asia.
|
Top Contributors
|
|
|
↑
|
Japan Allocation
|
|
↑
|
South Africa Allocation
|
|
↑
|
Mexico Allocation
|
|
Top Detractors
|
|
|
↓
|
China Allocation
|
|
↓
|
Italy Allocation
|
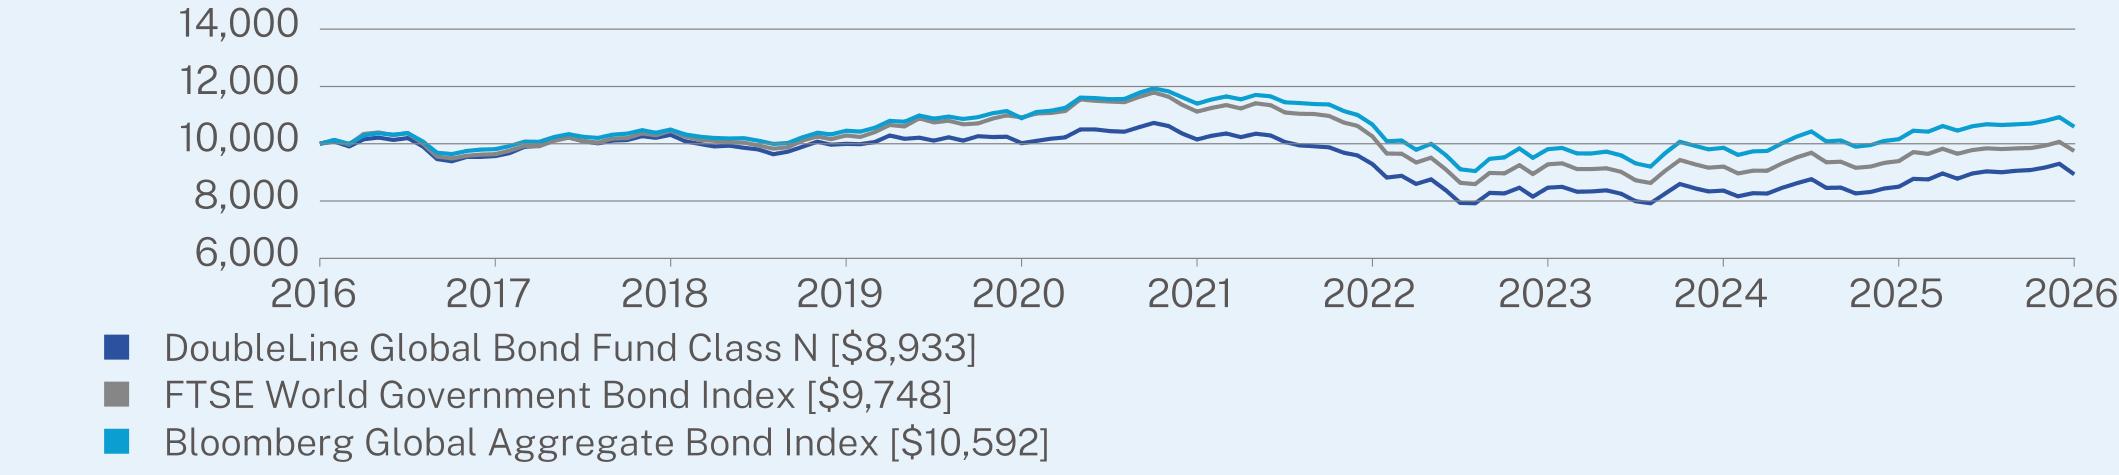
ANNUAL AVERAGE TOTAL RETURN (%)
|
|
1 Year
|
5 Year
|
10 Year
|
|
Class N (without sales charge)
|
5.10
|
-2.52
|
-1.12
|
|
FTSE World Government Bond Index
|
3.75
|
-2.60
|
-0.25
|
|
Bloomberg Global Aggregate Bond Index
|
4.26
|
-1.46
|
0.58
|
Visit https://doubleline.com/fund-documents/ for more recent performance information.
KEY FUND STATISTICS
|
Net Assets
|
$246,087,335
|
|
Number of Holdings
|
59
|
|
Total Advisory Fees Paid
|
$1,109,833
|
|
Portfolio Turnover
|
45%
|
WHAT DID THE FUND INVEST IN?
|
Credit Quality Breakdown*
|
(% of Net Assets)
|
|
Government
|
35.2
|
|
AAA
|
12.1
|
|
AA
|
16.8
|
|
A
|
19.9
|
|
BBB
|
6.8
|
|
BB
|
2.8
|
|
Other
|
6.4
|
|
Top Ten Holdings
|
(% of Net Assets)
|
|
United States Treasury Note/Bond, 0.63%, 08/15/2030
|
4.7
|
|
United States Treasury Note/Bond, 0.75%, 01/31/2028
|
4.1
|
|
United States Treasury Note/Bond, 0.88%, 11/15/2030
|
3.9
|
|
Australia Government Bond, 2.75%, 06/21/2035
|
3.8
|
|
United States Treasury Note/Bond, 0.63%, 05/15/2030
|
3.7
|
|
Spain Government Bond, 0.50%, 04/30/2030
|
3.4
|
|
United States Treasury Note/Bond, 0.63%, 12/31/2027
|
3.2
|
|
United States Treasury Note/Bond, 1.13%, 05/15/2040
|
2.8
|
|
United States Treasury Note/Bond, 1.75%, 08/15/2041
|
2.8
|
|
United States Treasury Note/Bond, 1.38%, 11/15/2040
|
2.8
|
The DoubleLine fund complex has historically used multiple firms to serve as the independent registered public accounting firms across the fund complex in the United States. On August 19, 2025, the Board of Trustees of the Trust considered and approved a proposal to consolidate that work for the entire fund complex with a single firm, Deloitte & Touche LLP, and Deloitte was appointed to serve as the independent registered public accounting firm of each series of the Trust (each, a “Fund”) for the fiscal year ending March 31, 2026. In connection with that transition, PricewaterhouseCoopers LLP, each Fund’s prior independent registered public accounting firm, was dismissed effective as of August 5, 2025.
WHAT WERE THE FUND COSTS FOR THE PAST YEAR? (based on a hypothetical $10,000 investment)
|
Class Name
|
Costs of a $10,000 investment
|
Costs paid as a percentage of a $10,000 investment
|
|
Class I
|
$73
|
0.64%
|
HOW DID THE FUND PERFORM LAST YEAR AND WHAT AFFECTED ITS PERFORMANCE?
For the 12-month period ended March 31, 2026, the DoubleLine Shiller Enhanced International CAPE® outperformed the benchmark MSCI Europe Net Total Return USD Index return of 19.11% on a net asset value basis.
WHAT FACTORS INFLUENCED PERFORMANCE?
Five of the Fund’s six sector allocations appreciated in value. The energy allocation was the biggest contributor to Fund performance while health care was the lone detractor. Every sector within the Fund’s fixed-income portfolio increased in value. The biggest contributor to fixed-income portfolio performance by sector was non-Agency mortgage-backed securities while the laggard was U.S. government securities.
POSITIONING
The Shiller Barclays CAPE® Europe Sector Net TR NoC USD Index, to which the Fund gained exposure through the use of swap contracts, was allocated to six sectors: consumer discretionary, consumer staples, energy, health care, information technology and materials. The Fund’s use of swap contracts to gain exposure to equities facilitated investment of the Fund’s remaining assets in fixed income securities across eight sectors: bank loans, investment grade corporate bonds, Agency residential mortgage-backed securities (RMBS), non-Agency RMBS, asset-backed securities, commercial MBS, collateralized loan obligations and U.S. government securities.
|
Top Contributors
|
|
|
↑
|
Energy
|
|
↑
|
Materials
|
|
↑
|
Fixed-Income Collateral Portfolio
|
|
Top Detractors
|
|
|
↓
|
Health Care
|
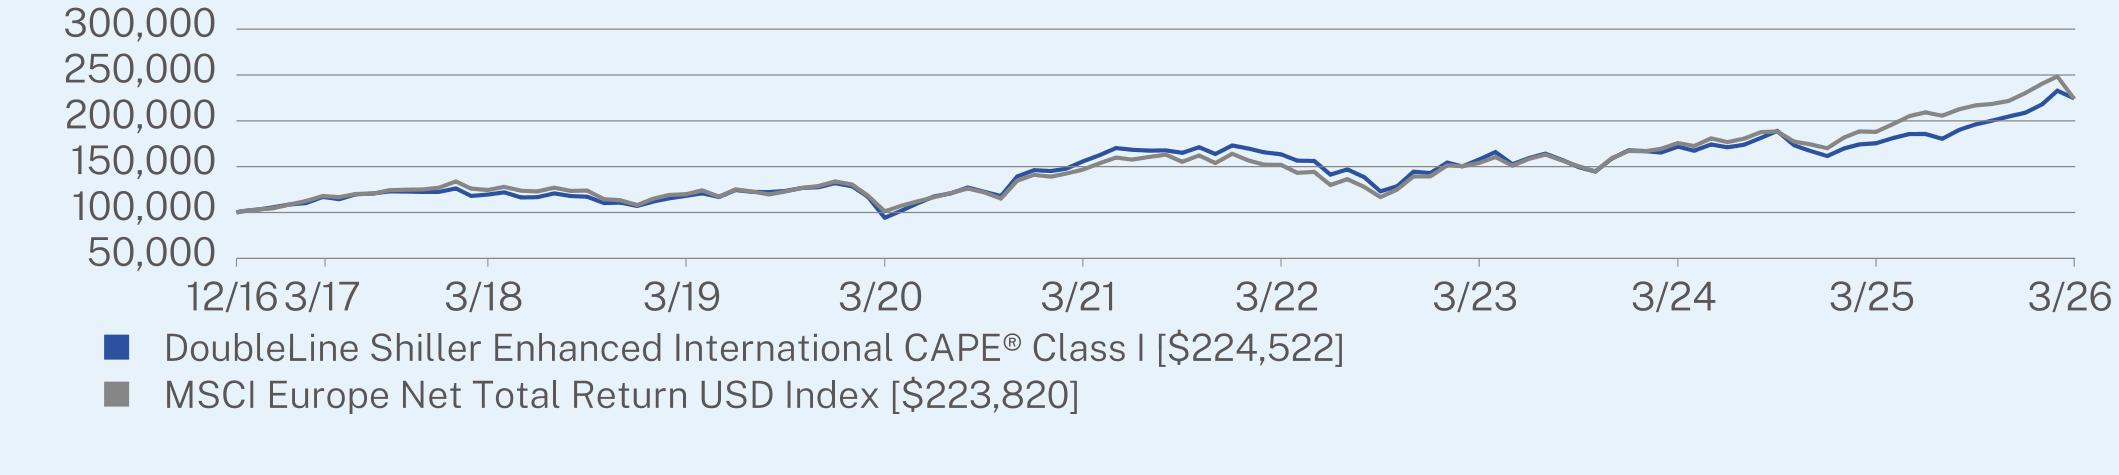
ANNUAL AVERAGE TOTAL RETURN (%)
|
|
1 Year
|
5 Year
|
Since Inception
(12/23/2016) |
|
Class I (without sales charge)
|
27.90
|
7.60
|
9.12
|
|
MSCI Europe Net Total Return USD Index
|
19.11
|
8.79
|
9.08
|
Visit https://doubleline.com/fund-documents/ for more recent performance information.
KEY FUND STATISTICS
|
Net Assets
|
$32,805,938
|
|
Number of Holdings
|
274
|
|
Total Advisory Fees Paid
|
$0
|
|
Portfolio Turnover
|
58%
|
WHAT DID THE FUND INVEST IN?
|
Credit Quality Breakdown*
|
(% of Net Assets)
|
|
Government
|
24.1
|
|
Agency
|
4.4
|
|
AAA
|
30.7
|
|
AA
|
6.2
|
|
A
|
6.0
|
|
BBB
|
13.8
|
|
BB
|
1.1
|
|
B and Below
|
6.6
|
|
Not Rated
|
2.9
|
|
Other
|
4.2
|
|
Sector Breakdown
|
(% of Net Assets)
|
|
U.S. Government and Agency Obligations
|
21.8
|
|
U.S. Corporate Bonds
|
14.8
|
|
Non-Agency Residential Collateralized Mortgage Obligations
|
12.9
|
|
Non-Agency Commercial Mortgage Backed Obligations
|
12.7
|
|
Total Return Swaps
|
10.8
|
|
Collateralized Loan Obligations
|
9.1
|
|
Asset Backed Obligations
|
7.4
|
|
Money Market Funds
|
5.1
|
|
U.S. Government and Agency Mortgage Backed Obligations
|
4.0
|
|
Cash & Other
|
1.4
|
|
CAPE Sector Breakdown*
|
(% of Net Assets)
|
|
Consumer Staples
|
27.2
|
|
Energy
|
25.1
|
|
Health Care
|
24.5
|
|
Materials
|
23.2
|
The DoubleLine fund complex has historically used multiple firms to serve as the independent registered public accounting firms across the fund complex in the United States. On August 19, 2025, the Board of Trustees of the Trust considered and approved a proposal to consolidate that work for the entire fund complex with a single firm, Deloitte & Touche LLP, and Deloitte was appointed to serve as the independent registered public accounting firm of each series of the Trust (each, a “Fund”) for the fiscal year ending March 31, 2026. In connection with that transition, PricewaterhouseCoopers LLP, each Fund’s prior independent registered public accounting firm, was dismissed effective as of August 5, 2025.
WHAT WERE THE FUND COSTS FOR THE PAST YEAR? (based on a hypothetical $10,000 investment)
|
Class Name
|
Costs of a $10,000 investment
|
Costs paid as a percentage of a $10,000 investment*,**
|
|
Class I2
|
$31
|
0.71%
|
HOW DID THE FUND PERFORM LAST YEAR AND WHAT AFFECTED ITS PERFORMANCE?
For the 12-month period ended March 31, 2026, the DoubleLine Shiller Enhanced International CAPE® outperformed the benchmark MSCI Europe Net Total Return USD Index return of 19.11% on a net asset value basis.
WHAT FACTORS INFLUENCED PERFORMANCE?
Five of the Fund’s six sector allocations appreciated in value. The energy allocation was the biggest contributor to Fund performance while health care was the lone detractor. Every sector within the Fund’s fixed-income portfolio increased in value. The biggest contributor to fixed-income portfolio performance by sector was non-Agency mortgage-backed securities while the laggard was U.S. government securities.
POSITIONING
The Shiller Barclays CAPE® Europe Sector Net TR NoC USD Index, to which the Fund gained exposure through the use of swap contracts, was allocated to six sectors: consumer discretionary, consumer staples, energy, health care, information technology and materials. The Fund’s use of swap contracts to gain exposure to equities facilitated investment of the Fund’s remaining assets in fixed income securities across eight sectors: bank loans, investment grade corporate bonds, Agency residential mortgage-backed securities (RMBS), non-Agency RMBS, asset-backed securities, commercial MBS, collateralized loan obligations and U.S. government securities.
|
Top Contributors
|
|
|
↑
|
Energy
|
|
↑
|
Materials
|
|
↑
|
Fixed-Income Collateral Portfolio
|
|
Top Detractors
|
|
|
↓
|
Health Care
|
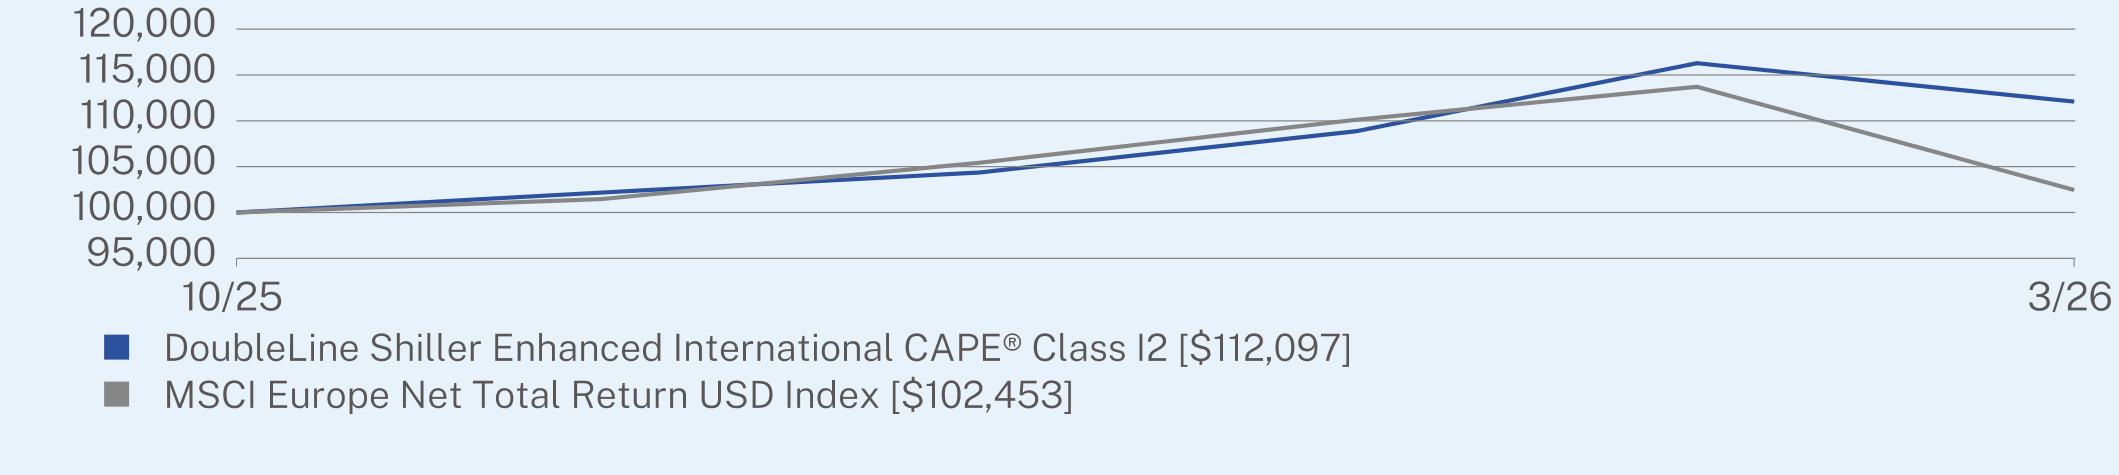
AVERAGE TOTAL RETURN (%)
|
|
Since Inception
(10/31/2025) |
|
Class I2 (without sales charge)
|
12.10
|
|
MSCI Europe Net Total Return USD Index
|
2.45
|
Visit https://doubleline.com/fund-documents/ for more recent performance information.
KEY FUND STATISTICS
|
Net Assets
|
$32,805,938
|
|
Number of Holdings
|
274
|
|
Total Advisory Fees Paid
|
$0
|
|
Portfolio Turnover
|
58%
|
WHAT DID THE FUND INVEST IN?
|
Credit Quality Breakdown*
|
(% of Net Assets)
|
|
Government
|
24.1
|
|
Agency
|
4.4
|
|
AAA
|
30.7
|
|
AA
|
6.2
|
|
A
|
6.0
|
|
BBB
|
13.8
|
|
BB
|
1.1
|
|
B and Below
|
6.6
|
|
Not Rated
|
2.9
|
|
Other
|
4.2
|
|
Sector Breakdown
|
(% of Net Assets)
|
|
U.S. Government and Agency Obligations
|
21.8
|
|
U.S. Corporate Bonds
|
14.8
|
|
Non-Agency Residential Collateralized Mortgage Obligations
|
12.9
|
|
Non-Agency Commercial Mortgage Backed Obligations
|
12.7
|
|
Total Return Swaps
|
10.8
|
|
Collateralized Loan Obligations
|
9.1
|
|
Asset Backed Obligations
|
7.4
|
|
Money Market Funds
|
5.1
|
|
U.S. Government and Agency Mortgage Backed Obligations
|
4.0
|
|
Cash & Other
|
1.4
|
|
CAPE Sector Breakdown*
|
(% of Net Assets)
|
|
Consumer Staples
|
27.2
|
|
Energy
|
25.1
|
|
Health Care
|
24.5
|
|
Materials
|
23.2
|
The DoubleLine fund complex has historically used multiple firms to serve as the independent registered public accounting firms across the fund complex in the United States. On August 19, 2025, the Board of Trustees of the Trust considered and approved a proposal to consolidate that work for the entire fund complex with a single firm, Deloitte & Touche LLP, and Deloitte was appointed to serve as the independent registered public accounting firm of each series of the Trust (each, a “Fund”) for the fiscal year ending March 31, 2026. In connection with that transition, PricewaterhouseCoopers LLP, each Fund’s prior independent registered public accounting firm, was dismissed effective as of August 5, 2025.
WHAT WERE THE FUND COSTS FOR THE PAST YEAR? (based on a hypothetical $10,000 investment)
|
Class Name
|
Costs of a $10,000 investment
|
Costs paid as a percentage of a $10,000 investment
|
|
Class N
|
$101
|
0.89%
|
HOW DID THE FUND PERFORM LAST YEAR AND WHAT AFFECTED ITS PERFORMANCE?
For the 12-month period ended March 31, 2026, the DoubleLine Shiller Enhanced International CAPE® outperformed the benchmark MSCI Europe Net Total Return USD Index return of 19.11% on a net asset value basis.
WHAT FACTORS INFLUENCED PERFORMANCE?
Five of the Fund’s six sector allocations appreciated in value. The energy allocation was the biggest contributor to Fund performance while health care was the lone detractor. Every sector within the Fund’s fixed-income portfolio increased in value. The biggest contributor to fixed-income portfolio performance by sector was non-Agency mortgage-backed securities while the laggard was U.S. government securities.
POSITIONING
The Shiller Barclays CAPE® Europe Sector Net TR NoC USD Index, to which the Fund gained exposure through the use of swap contracts, was allocated to six sectors: consumer discretionary, consumer staples, energy, health care, information technology and materials. The Fund’s use of swap contracts to gain exposure to equities facilitated investment of the Fund’s remaining assets in fixed income securities across eight sectors: bank loans, investment grade corporate bonds, Agency residential mortgage-backed securities (RMBS), non-Agency RMBS, asset-backed securities, commercial MBS, collateralized loan obligations and U.S. government securities.
|
Top Contributors
|
|
|
↑
|
Energy
|
|
↑
|
Materials
|
|
↑
|
Fixed-Income Collateral Portfolio
|
|
Top Detractors
|
|
|
↓
|
Health Care
|
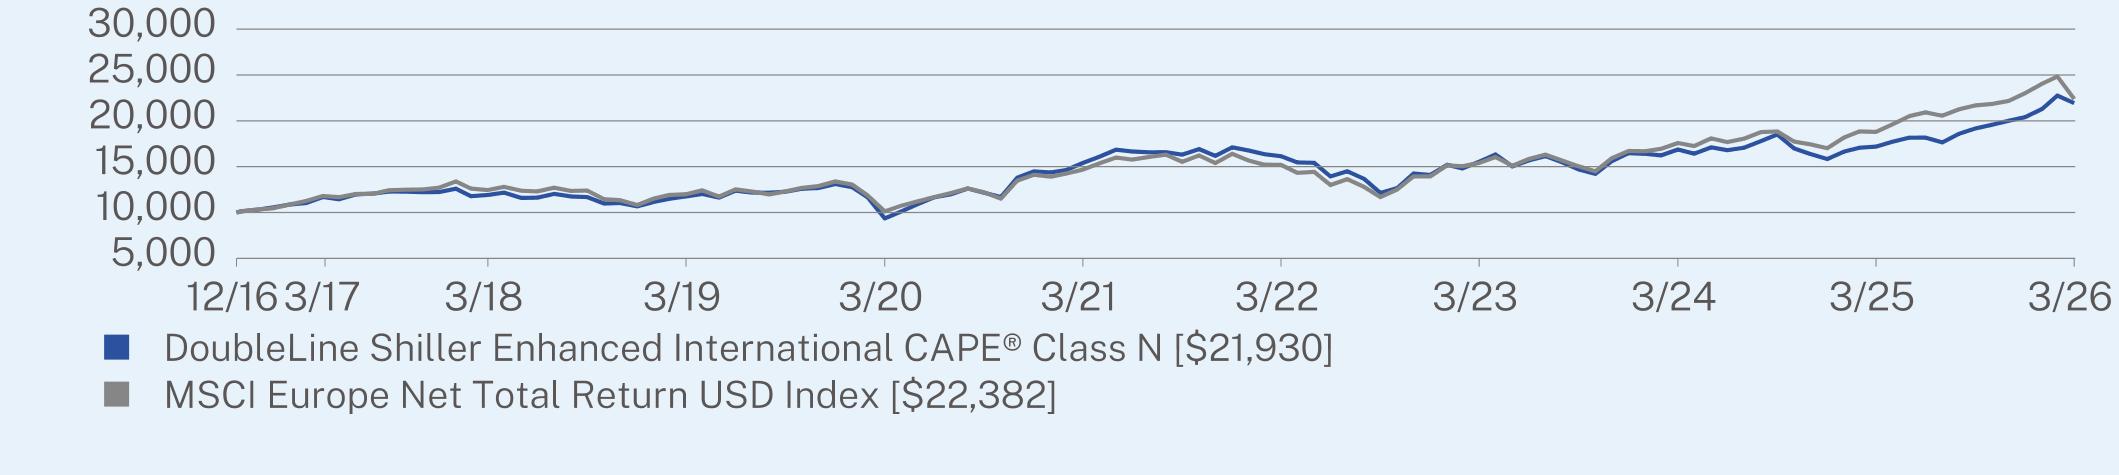
ANNUAL AVERAGE TOTAL RETURN (%)
|
|
1 Year
|
5 Year
|
Since Inception
(12/23/2016) |
|
Class N (without sales charge)
|
27.59
|
7.30
|
8.84
|
|
MSCI Europe Net Total Return USD Index
|
19.11
|
8.79
|
9.08
|
Visit https://doubleline.com/fund-documents/ for more recent performance information.
KEY FUND STATISTICS
|
Net Assets
|
$32,805,938
|
|
Number of Holdings
|
274
|
|
Total Advisory Fees Paid
|
$0
|
|
Portfolio Turnover
|
58%
|
WHAT DID THE FUND INVEST IN?
|
Credit Quality Breakdown*
|
(% of Net Assets)
|
|
Government
|
24.1
|
|
Agency
|
4.4
|
|
AAA
|
30.7
|
|
AA
|
6.2
|
|
A
|
6.0
|
|
BBB
|
13.8
|
|
BB
|
1.1
|
|
B and Below
|
6.6
|
|
Not Rated
|
2.9
|
|
Other
|
4.2
|
|
Sector Breakdown
|
(% of Net Assets)
|
|
U.S. Government and Agency Obligations
|
21.8
|
|
U.S. Corporate Bonds
|
14.8
|
|
Non-Agency Residential Collateralized Mortgage Obligations
|
12.9
|
|
Non-Agency Commercial Mortgage Backed Obligations
|
12.7
|
|
Total Return Swaps
|
10.8
|
|
Collateralized Loan Obligations
|
9.1
|
|
Asset Backed Obligations
|
7.4
|
|
Money Market Funds
|
5.1
|
|
U.S. Government and Agency Mortgage Backed Obligations
|
4.0
|
|
Cash & Other
|
1.4
|
|
CAPE Sector Breakdown*
|
(% of Net Assets)
|
|
Consumer Staples
|
27.2
|
|
Energy
|
25.1
|
|
Health Care
|
24.5
|
|
Materials
|
23.2
|
The DoubleLine fund complex has historically used multiple firms to serve as the independent registered public accounting firms across the fund complex in the United States. On August 19, 2025, the Board of Trustees of the Trust considered and approved a proposal to consolidate that work for the entire fund complex with a single firm, Deloitte & Touche LLP, and Deloitte was appointed to serve as the independent registered public accounting firm of each series of the Trust (each, a “Fund”) for the fiscal year ending March 31, 2026. In connection with that transition, PricewaterhouseCoopers LLP, each Fund’s prior independent registered public accounting firm, was dismissed effective as of August 5, 2025.
WHAT WERE THE FUND COSTS FOR THE PAST YEAR? (based on a hypothetical $10,000 investment)
|
Class Name
|
Costs of a $10,000 investment
|
Costs paid as a percentage of a $10,000 investment
|
|
Class I
|
$96
|
0.90%
|
HOW DID THE FUND PERFORM LAST YEAR AND WHAT AFFECTED ITS PERFORMANCE?
For the 12-month period ended March 31, 2026, the DoubleLine Emerging Markets Local Currency Bond Fund outperformed the benchmark J.P. Morgan GBI-EM Global Diversified Index return of 11.76% on a net asset value basis.
WHAT FACTORS INFLUENCED PERFORMANCE?
The Fund’s overweight to South Africa relative to the benchmark and exposure to Brazil and Mexico contributed to Fund performance. The Fund’s exposure to Malaysia detracted from Fund performance.
POSITIONING
The Fund maintained a shorter duration than that of the benchmark. In terms of regional allocation, the Fund was underweight Asia relative to the benchmark.
|
Top Contributors
|
|
|
↑
|
South Africa Allocation
|
|
↑
|
Brazil Allocation
|
|
↑
|
Mexico Allocation
|
|
Top Detractors
|
|
|
↓
|
Malaysia Allocation
|
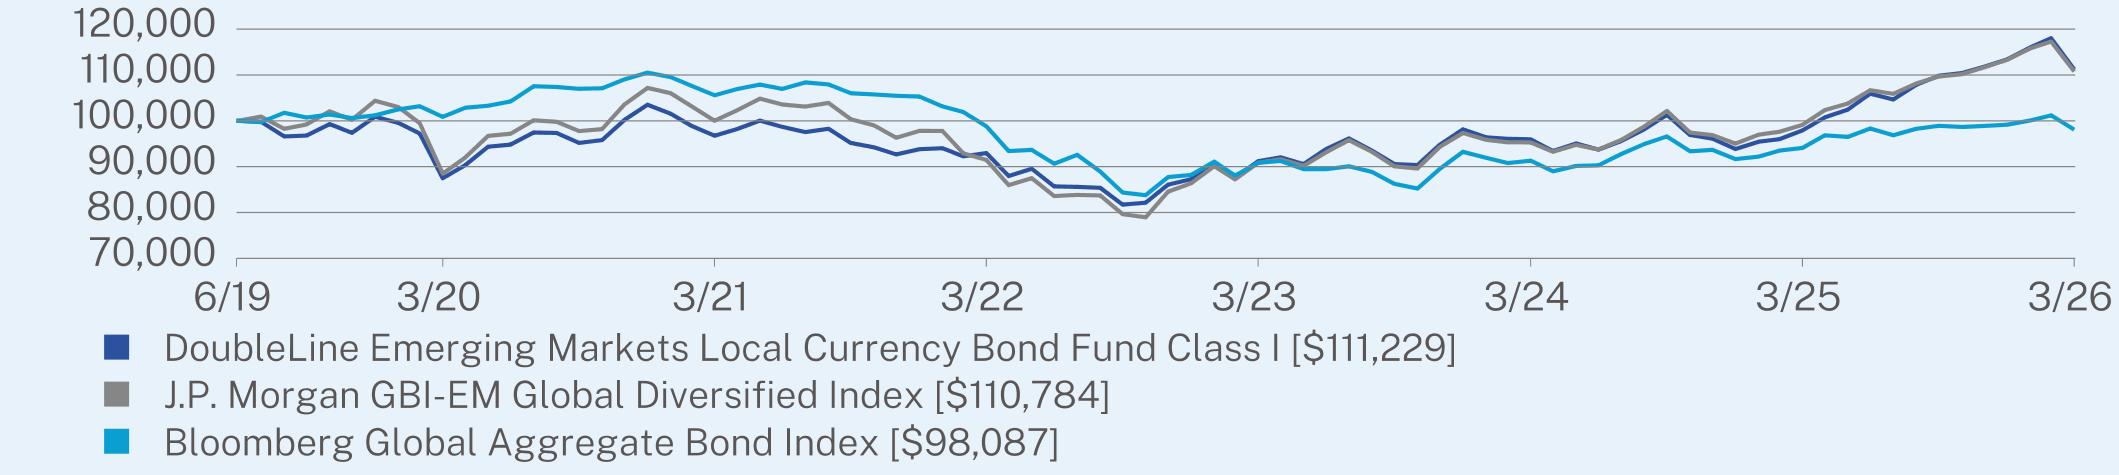
ANNUAL AVERAGE TOTAL RETURN (%)
|
|
1 Year
|
5 Year
|
Since Inception
(06/28/2019) |
|
Class I (without sales charge)
|
13.60
|
2.83
|
1.59
|
|
J.P. Morgan GBI-EM Global Diversified Index
|
11.76
|
2.06
|
1.53
|
|
Bloomberg Global Aggregate Bond Index
|
4.26
|
-1.46
|
-0.29
|
Visit https://doubleline.com/fund-documents/ for more recent performance information.
KEY FUND STATISTICS
|
Net Assets
|
$484,891,721
|
|
Number of Holdings
|
53
|
|
Total Advisory Fees Paid
|
$1,949,385
|
|
Portfolio Turnover
|
46%
|
WHAT DID THE FUND INVEST IN?
|
Credit Quality Breakdown*
|
(% of Net Assets)
|
|
AAA
|
17.3
|
|
AA
|
3.4
|
|
A
|
17.5
|
|
BBB
|
30.7
|
|
BB
|
23.2
|
|
Other
|
7.9
|
|
Currency Exposure Breakdown
|
(% of Net Assets)
|
|
Mexican Peso
|
13.3
|
|
Brazilian Real
|
12.0
|
|
Rand
|
11.5
|
|
Rupiah
|
7.8
|
|
Indian Rupee
|
6.8
|
|
U.S. Dollar
|
6.2
|
|
Polish Zloty
|
5.6
|
|
Malaysian Ringgit
|
4.9
|
|
Nuevo Sol
|
4.6
|
|
Baht
|
4.6
|
|
Singapore Dollar
|
4.5
|
|
Colombian Peso
|
3.9
|
|
Hungarian Forint
|
3.7
|
|
Czech Koruna
|
3.4
|
|
New Leu
|
3.4
|
|
Chilean Peso
|
2.9
|
|
New Israeli Sheqel
|
0.8
|
|
Yuan Renminbi
|
0.1
|
The DoubleLine fund complex has historically used multiple firms to serve as the independent registered public accounting firms across the fund complex in the United States. On August 19, 2025, the Board of Trustees of the Trust considered and approved a proposal to consolidate that work for the entire fund complex with a single firm, Deloitte & Touche LLP, and Deloitte was appointed to serve as the independent registered public accounting firm of each series of the Trust (each, a “Fund”) for the fiscal year ending March 31, 2026. In connection with that transition, PricewaterhouseCoopers LLP, each Fund’s prior independent registered public accounting firm, was dismissed effective as of August 5, 2025.
WHAT WERE THE FUND COSTS FOR THE PAST YEAR? (based on a hypothetical $10,000 investment)
|
Class Name
|
Costs of a $10,000 investment
|
Costs paid as a percentage of a $10,000 investment*,**
|
|
Class I2
|
$40
|
0.97%
|
HOW DID THE FUND PERFORM LAST YEAR AND WHAT AFFECTED ITS PERFORMANCE?
For the 12-month period ended March 31, 2026, the DoubleLine Emerging Markets Local Currency Bond Fund outperformed the benchmark J.P. Morgan GBI-EM Global Diversified Index return of 11.76% on a net asset value basis.
WHAT FACTORS INFLUENCED PERFORMANCE?
The Fund’s overweight to South Africa relative to the benchmark and exposure to Brazil and Mexico contributed to Fund performance. The Fund’s exposure to Malaysia detracted from Fund performance.
POSITIONING
The Fund maintained a shorter duration than that of the benchmark. In terms of regional allocation, the Fund was underweight Asia relative to the benchmark.
|
Top Contributors
|
|
|
↑
|
South Africa Allocation
|
|
↑
|
Brazil Allocation
|
|
↑
|
Mexico Allocation
|
|
Top Detractors
|
|
|
↓
|
Malaysia Allocation
|
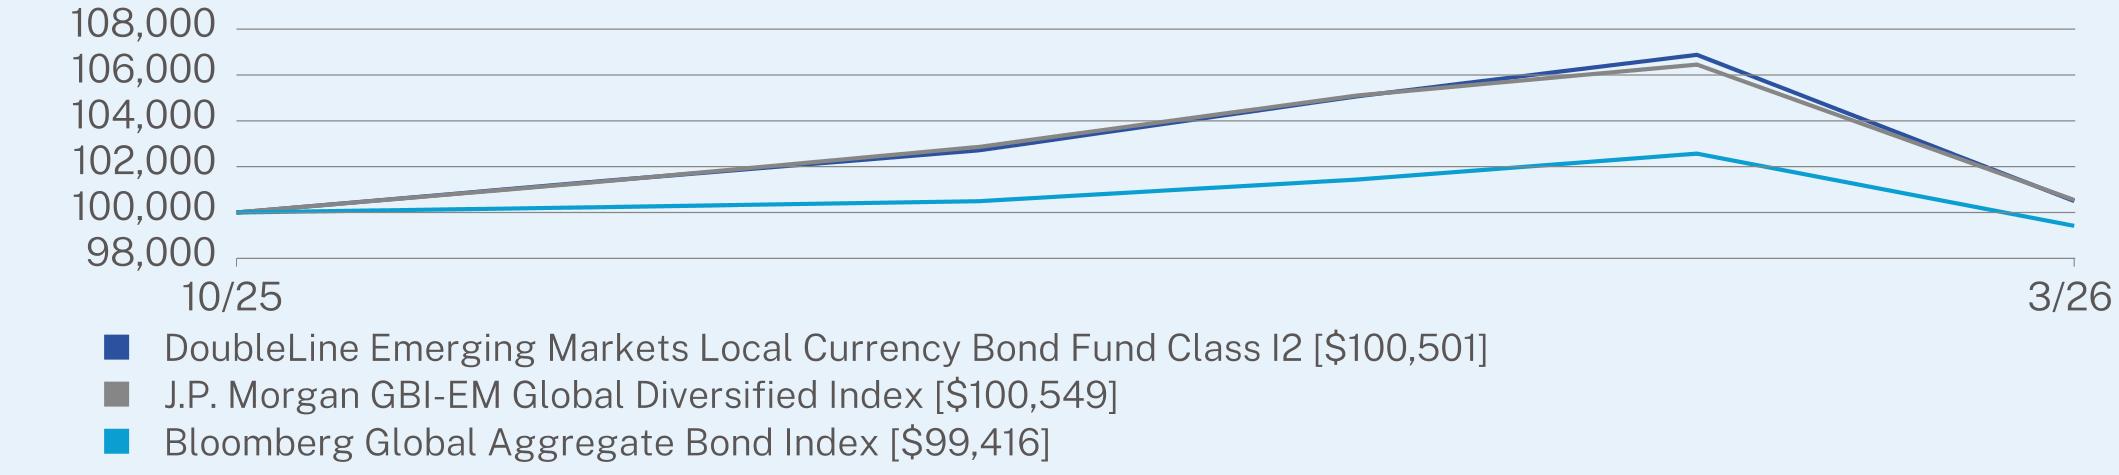
AVERAGE TOTAL RETURN (%)
|
|
Since Inception
(10/31/2025) |
|
Class I2 (without sales charge)
|
0.50
|
|
J.P. Morgan GBI-EM Global Diversified Index
|
0.55
|
|
Bloomberg Global Aggregate Bond Index
|
-0.58
|
Visit https://doubleline.com/fund-documents/ for more recent performance information.
KEY FUND STATISTICS
|
Net Assets
|
$484,891,721
|
|
Number of Holdings
|
53
|
|
Total Advisory Fees Paid
|
$1,949,385
|
|
Portfolio Turnover
|
46%
|
WHAT DID THE FUND INVEST IN?
|
Credit Quality Breakdown*
|
(% of Net Assets)
|
|
AAA
|
17.3
|
|
AA
|
3.4
|
|
A
|
17.5
|
|
BBB
|
30.7
|
|
BB
|
23.2
|
|
Other
|
7.9
|
|
Currency Exposure Breakdown
|
(% of Net Assets)
|
|
Mexican Peso
|
13.3
|
|
Brazilian Real
|
12.0
|
|
Rand
|
11.5
|
|
Rupiah
|
7.8
|
|
Indian Rupee
|
6.8
|
|
U.S. Dollar
|
6.2
|
|
Polish Zloty
|
5.6
|
|
Malaysian Ringgit
|
4.9
|
|
Nuevo Sol
|
4.6
|
|
Baht
|
4.6
|
|
Singapore Dollar
|
4.5
|
|
Colombian Peso
|
3.9
|
|
Hungarian Forint
|
3.7
|
|
Czech Koruna
|
3.4
|
|
New Leu
|
3.4
|
|
Chilean Peso
|
2.9
|
|
New Israeli Sheqel
|
0.8
|
|
Yuan Renminbi
|
0.1
|
The DoubleLine fund complex has historically used multiple firms to serve as the independent registered public accounting firms across the fund complex in the United States. On August 19, 2025, the Board of Trustees of the Trust considered and approved a proposal to consolidate that work for the entire fund complex with a single firm, Deloitte & Touche LLP, and Deloitte was appointed to serve as the independent registered public accounting firm of each series of the Trust (each, a “Fund”) for the fiscal year ending March 31, 2026. In connection with that transition, PricewaterhouseCoopers LLP, each Fund’s prior independent registered public accounting firm, was dismissed effective as of August 5, 2025.
WHAT WERE THE FUND COSTS FOR THE PAST YEAR? (based on a hypothetical $10,000 investment)
|
Class Name
|
Costs of a $10,000 investment
|
Costs paid as a percentage of a $10,000 investment
|
|
Class N
|
$123
|
1.15%
|
HOW DID THE FUND PERFORM LAST YEAR AND WHAT AFFECTED ITS PERFORMANCE?
For the 12-month period ended March 31, 2026, the DoubleLine Emerging Markets Local Currency Bond Fund outperformed the benchmark J.P. Morgan GBI-EM Global Diversified Index return of 11.76% on a net asset value basis.
WHAT FACTORS INFLUENCED PERFORMANCE?
The Fund’s overweight to South Africa relative to the benchmark and exposure to Brazil and Mexico contributed to Fund performance. The Fund’s exposure to Malaysia detracted from Fund performance.
POSITIONING
The Fund maintained a shorter duration than that of the benchmark. In terms of regional allocation, the Fund was underweight Asia relative to the benchmark.
|
Top Contributors
|
|
|
↑
|
South Africa Allocation
|
|
↑
|
Brazil Allocation
|
|
↑
|
Mexico Allocation
|
|
Top Detractors
|
|
|
↓
|
Malaysia Allocation
|
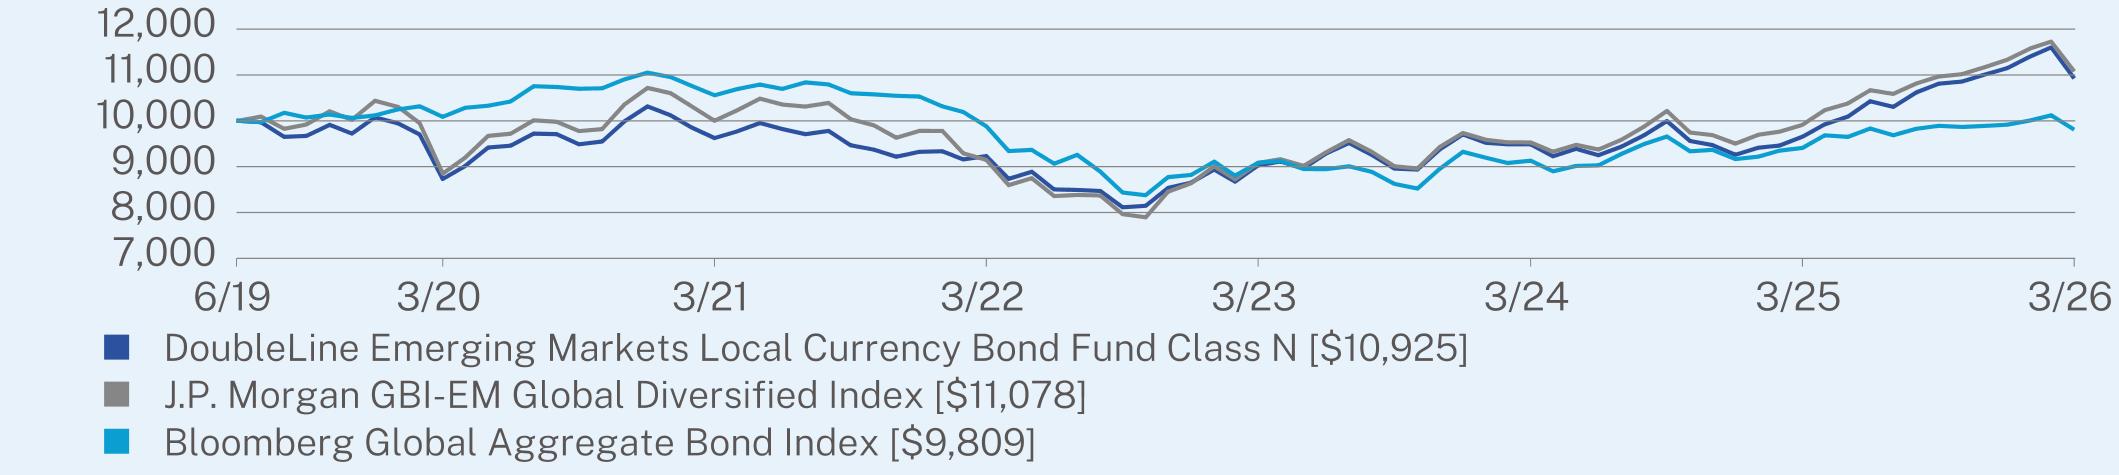
ANNUAL AVERAGE TOTAL RETURN (%)
|
|
1 Year
|
5 Year
|
Since Inception
(06/28/2019) |
|
Class N (without sales charge)
|
13.16
|
2.57
|
1.32
|
|
J.P. Morgan GBI-EM Global Diversified Index
|
11.76
|
2.06
|
1.53
|
|
Bloomberg Global Aggregate Bond Index
|
4.26
|
-1.46
|
-0.29
|
Visit https://doubleline.com/fund-documents/ for more recent performance information.
KEY FUND STATISTICS
|
Net Assets
|
$484,891,721
|
|
Number of Holdings
|
53
|
|
Total Advisory Fees Paid
|
$1,949,385
|
|
Portfolio Turnover
|
46%
|
WHAT DID THE FUND INVEST IN?
|
Credit Quality Breakdown*
|
(% of Net Assets)
|
|
AAA
|
17.3
|
|
AA
|
3.4
|
|
A
|
17.5
|
|
BBB
|
30.7
|
|
BB
|
23.2
|
|
Other
|
7.9
|
|
Currency Exposure Breakdown
|
(% of Net Assets)
|
|
Mexican Peso
|
13.3
|
|
Brazilian Real
|
12.0
|
|
Rand
|
11.5
|
|
Rupiah
|
7.8
|
|
Indian Rupee
|
6.8
|
|
U.S. Dollar
|
6.2
|
|
Polish Zloty
|
5.6
|
|
Malaysian Ringgit
|
4.9
|
|
Nuevo Sol
|
4.6
|
|
Baht
|
4.6
|
|
Singapore Dollar
|
4.5
|
|
Colombian Peso
|
3.9
|
|
Hungarian Forint
|
3.7
|
|
Czech Koruna
|
3.4
|
|
New Leu
|
3.4
|
|
Chilean Peso
|
2.9
|
|
New Israeli Sheqel
|
0.8
|
|
Yuan Renminbi
|
0.1
|
The DoubleLine fund complex has historically used multiple firms to serve as the independent registered public accounting firms across the fund complex in the United States. On August 19, 2025, the Board of Trustees of the Trust considered and approved a proposal to consolidate that work for the entire fund complex with a single firm, Deloitte & Touche LLP, and Deloitte was appointed to serve as the independent registered public accounting firm of each series of the Trust (each, a “Fund”) for the fiscal year ending March 31, 2026. In connection with that transition, PricewaterhouseCoopers LLP, each Fund’s prior independent registered public accounting firm, was dismissed effective as of August 5, 2025.
| [1] |
|
||
| [2] |
|
||
| [3] |
|
||
| [4] |
|
||
| [5] |
|
||
| [6] |
|
||
| [7] |
|
||
| [8] |
|
||
| [9] |
|
||
| [10] |
|
||
| [11] |
|
||
| [12] |
|
||
| [13] |
|
||
| [14] |
|
||
| [15] |
|
||
| [16] |
|
||
| [17] |
|
||
| [18] |
|
||
| [19] |
|
||
| [20] |
|
||
| [21] |
|
||
| [22] |
|
||
| [23] |
|
||
| [24] |
|
||
| [25] |
|
||
| [26] |
|
||
| [27] |
|
||
| [28] |
|
||
| [29] |
|
||
| [30] |
|
||
| [31] |
|
||
| [32] |
|
||
| [33] |
|
||
| [34] |
|
||
| [35] |
|
||
| [36] |
|
||
| [37] |
|
||
| [38] |
|
||
| [39] |
|
||
| [40] |
|
||
| [41] |
|
||
| [42] |
|
||
| [43] |
|
||
| [44] |
|
||
| [45] |
|
||
| [46] |
|
||
| [47] |
|
||
| [48] |
|
||
| [49] |
|
||
| [50] |
|
||
| [51] |
|
||
| [52] |
|
||
| [53] |
|
||
| [54] |
|
||
| [55] |
|
||
| [56] |
|
||
| [57] |
|
||
| [58] |
|
||
| [59] |
|
||
| [60] |
|
||
| [61] |
|
||
| [62] |
|
||
| [63] |
|
||
| [64] |
|
||
| [65] |
|
||
| [66] |
|
||
| [67] |
|
||
| [68] |
|
||
| [69] |
|
||
| [70] |
|
||
| [71] |
|
||
| [72] |
|
||
| [73] |
|
||
| [74] |
|
||
| [75] |
|