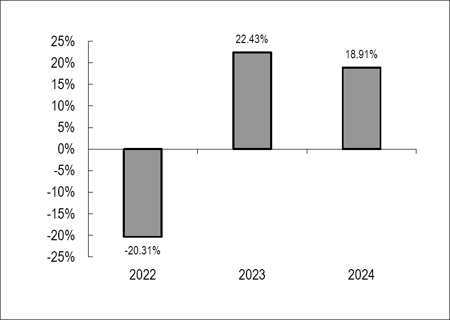
The bar chart and performance table below show the variability of the Fund’s returns, which is some indication of the risks of investing in the Fund. The bar chart shows performance of the Fund’s shares for each calendar year since the Fund’s inception. The performance table compares the performance of the Fund over time to the performance of the Index and a broad-based securities market index. You should be aware that the Fund’s past performance (before and after taxes) is not necessarily an indication of how the Fund will perform in the future. The Fund changed its principal investment strategies on June 3, 2026. Performance prior to that date reflects the Fund’s prior principal investment strategies Updated performance information is available at no cost by visiting www.monarchfunds.com or by calling toll free at (541) 291-4405.
| Best Quarter: | 4th Quarter 2023 | 12.70% |
| Worst Quarter: | 2nd Quarter 2022 | (15.02)% |
| One Year | Since Inception (3/23/21) | |
| Return before taxes | 18.91% | 9.09% |
| Return after taxes on distributions | 18.91% | 9.09% |
| Return after taxes on distributions and sale of Fund shares | 11.20% | 7.12% |
| Index – Monarch Blue Chips Elite Index | 19.23% | 9.39% |
| S&P 500® Index* | 25.02% | 13.12% |
| * | The S&P 500® Index is an unmanaged free-float capitalization-weighted index which measures the performance of 500 large-cap common stocks actively traded in the United States. Index returns assume reinvestment of dividends. Investors may not invest in the index directly; unlike the Fund’s returns, the index does not reflect any fees or expenses. |