What were the Fund's costs for the last year?
(based on hypothetical $10,000 investment)
|
|
Costs
of a $10,000 investment |
Costs
paid as a percentage of a $10,000 investment |
|---|---|---|
|
Ordinary
Shares |
$144 |
1.35% |
What affected the Fund’s performance this period?
The Fund delivered a strong absolute return but trailed the Russell 2000. Results came from bottom-up stock selection in Consumer Discretionary, Information Technology, Consumer Staples and Utilities. Information Technology was the standout, anchored by MKS Inc., which rallied on double-digit sales across semiconductor, advanced packaging and photonics end markets, while electronics distributors Arrow Electronics and Avnet beat consensus as the industry recovered from the 2023–2024 inventory correction. In Consumer Discretionary, for‑profit education companies Laureate Education and Perdoceo Education gained on organic enrollment growth, while American Eagle Outfitters and Buckle Inc. rallied on strong same‑store sales. Ingles Markets continued its post‑COVID margin recovery in Consumer Staples, Black Hills Corp. supported returns in Utilities, and CVR Energy and Diamondback Energy benefited from firmer oil prices. Lundin Mining capitalized on tight copper supply and strong execution at its Caserones mine, while Bermuda‑domiciled Bank of N.T. Butterfield added meaningfully in Financials. Key detractors included Graphic Packaging, which was sold during the year; Progress Software, weighed by a broader software derating; office‑furniture maker HNI Corp.; and Puerto Rico’s EVERTEC, which was exited on macro concerns.
How did the Fund perform over the past 10 years?
CUMULATIVE PERFORMANCE | March 31, 2016 through March 31, 2026
(Initial Investment of $10,000)
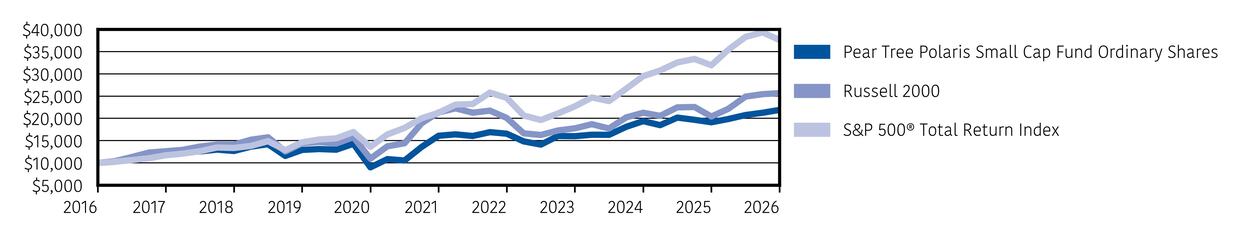
AVERAGE ANNUAL TOTAL RETURNS
|
|
One
Year |
Five
Year |
Ten
Year |
|---|---|---|---|
|
Pear
Tree Polaris Small Cap Fund Ordinary Shares |
14.51% |
6.35% |
8.15% |
|
Russell
2000 |
25.73% |
3.77% |
9.88% |
|
S&P
500 |
17.80% |
12.06% |
14.16% |
Key Fund Statistics
(as of March 31, 2026)
|
Total
Net Assets |
$92,052,337 |
|
Number
of Holdings |
50 |
|
Advisory
Fee |
$733,315 |
|
Portfolio
Turnover |
37% |
What did the Fund invest in?
(as of March 31, 2026)
SECTOR ALLOCATION
(% of Fund’s net assets)
|
Financials |
|
|
Industrials |
|
|
Information
Technology |
|
|
Real
Estate |
|
|
Health
Care |
|
|
Consumer
Discretionary |
|
|
Materials |
|
|
Consumer
Staples |
|
|
Energy |
|
|
Utilities |
|
|
Cash
and Other Assets (Net) |
TOP TEN HOLDINGS
(% of Fund’s net assets)
|
Laureate
Education, Inc. |
|
|
Lantheus
Holdings, Inc. |
|
|
Northeast
Bancorp |
|
|
Ingles
Markets Inc. |
|
|
The
Bank of N.T. Butterfield & Son Limited |
|
|
V2X,
Inc. |
|
|
Black
Hills Corporation |
|
|
BOK
Financial Corporation |
|
|
South
Plains Financial, Inc. |
|
|
Perdoceo
Education Corporation |
How has the Fund changed?
This is a summary of certain changes to the Fund since April 1, 2025. For more complete information, you may find copies of the Fund’s prospectus, financial information on Form N-CSR (which includes any required tax information for dividends), holdings, proxy voting information, and other information at www.peartreefunds.com/fund-documents/. You also may request this information without charge by contacting Pear Tree Funds at 1-800-326-2151 or info@peartreefunds.com or by contacting your financial intermediary.
During the reporting period, there were no changes to the Ordinary Share Class.
The Russell and the S&P do not accept any liability for any errors or omissions in the indexes or data, and hereby expressly disclaim all warranties of originality, accuracy, completeness, timeliness, merchantability and fitness for a particular purpose. No party may rely on any indexes or data contained in this communication. Visit www.peartreefunds.com/fund-documents/ for additional legal notices & disclaimers.
What were the Fund's costs for the last year?
(based on hypothetical $10,000 investment)
|
|
Costs
of a $10,000 investment |
Costs
paid as a percentage of a $10,000 investment |
|---|---|---|
|
Institutional
Shares |
$105 |
0.97% |
What affected the Fund’s performance this period?
The Fund delivered a strong absolute return but trailed the Russell 2000. Results came from bottom-up stock selection in Consumer Discretionary, Information Technology, Consumer Staples and Utilities. Information Technology was the standout, anchored by MKS Inc., which rallied on double-digit sales across semiconductor, advanced packaging and photonics end markets, while electronics distributors Arrow Electronics and Avnet beat consensus as the industry recovered from the 2023–2024 inventory correction. In Consumer Discretionary, for‑profit education companies Laureate Education and Perdoceo Education gained on organic enrollment growth, while American Eagle Outfitters and Buckle Inc. rallied on strong same‑store sales. Ingles Markets continued its post‑COVID margin recovery in Consumer Staples, Black Hills Corp. supported returns in Utilities, and CVR Energy and Diamondback Energy benefited from firmer oil prices. Lundin Mining capitalized on tight copper supply and strong execution at its Caserones mine, while Bermuda‑domiciled Bank of N.T. Butterfield added meaningfully in Financials. Key detractors included Graphic Packaging, which was sold during the year; Progress Software, weighed by a broader software derating; office‑furniture maker HNI Corp.; and Puerto Rico’s EVERTEC, which was exited on macro concerns.
How did the Fund perform over the past 10 years?
CUMULATIVE PERFORMANCE | March 31, 2016 through March 31, 2026
(Initial Investment of $1,000,000)
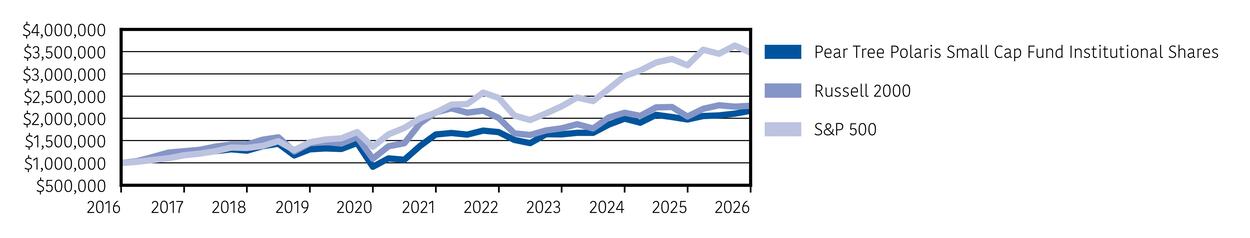
AVERAGE ANNUAL TOTAL RETURNS
|
|
One
Year |
Five
Year |
Ten
Year |
|---|---|---|---|
|
Pear
Tree Polaris Small Cap Fund Institutional Shares |
14.92% |
6.74% |
8.54% |
|
Russell
2000 |
25.73% |
3.77% |
9.88% |
|
S&P
500 |
17.80% |
12.06% |
14.16% |
Key Fund Statistics
(as of March 31, 2026)
|
Total
Net Assets |
$92,052,337 |
|
Number
of Holdings |
50 |
|
Advisory
Fee |
$733,315 |
|
Portfolio
Turnover |
37% |
What did the Fund invest in?
(as of March 31, 2026)
SECTOR ALLOCATION
(% of Fund’s net assets)
|
Financials |
|
|
Industrials |
|
|
Information
Technology |
|
|
Real
Estate |
|
|
Health
Care |
|
|
Consumer
Discretionary |
|
|
Materials |
|
|
Consumer
Staples |
|
|
Energy |
|
|
Utilities |
|
|
Cash
and Other Assets (Net) |
TOP TEN HOLDINGS
(% of Fund’s net assets)
|
Laureate
Education, Inc. |
|
|
Lantheus
Holdings, Inc. |
|
|
Northeast
Bancorp |
|
|
Ingles
Markets Inc. |
|
|
The
Bank of N.T. Butterfield & Son Limited |
|
|
V2X,
Inc. |
|
|
Black
Hills Corporation |
|
|
BOK
Financial Corporation |
|
|
South
Plains Financial, Inc. |
|
|
Perdoceo
Education Corporation |
How has the Fund changed?
This is a summary of certain changes to the Fund since April 1, 2025. For more complete information, you may find copies of the Fund’s prospectus, financial information on Form N-CSR (which includes any required tax information for dividends), holdings, proxy voting information, and other information at www.peartreefunds.com/fund-documents/. You also may request this information without charge by contacting Pear Tree Funds at 1-800-326-2151 or info@peartrseefunds.com or by contacting your financial intermediary.
During the reporting period, there were no changes to the Institutional Share Class.
The Russell and the S&P do not accept any liability for any errors or omissions in the indexes or data, and hereby expressly disclaim all warranties of originality, accuracy, completeness, timeliness, merchantability and fitness for a particular purpose. No party may rely on any indexes or data contained in this communication. Visit www.peartreefunds.com/fund-documents/ for additional legal notices & disclaimers.
What were the Fund's costs for the last year?
(based on hypothetical $10,000 investment)
|
|
Costs
of a $10,000 investment |
Costs
paid as a percentage of a $10,000 investment |
|---|---|---|
|
R6
Shares |
$101 |
0.94% |
What affected the Fund’s performance this period?
The Fund delivered a strong absolute return but trailed the Russell 2000. Results came from bottom-up stock selection in Consumer Discretionary, Information Technology, Consumer Staples and Utilities. Information Technology was the standout, anchored by MKS Inc., which rallied on double-digit sales across semiconductor, advanced packaging and photonics end markets, while electronics distributors Arrow Electronics and Avnet beat consensus as the industry recovered from the 2023–2024 inventory correction. In Consumer Discretionary, for‑profit education companies Laureate Education and Perdoceo Education gained on organic enrollment growth, while American Eagle Outfitters and Buckle Inc. rallied on strong same‑store sales. Ingles Markets continued its post‑COVID margin recovery in Consumer Staples, Black Hills Corp. supported returns in Utilities, and CVR Energy and Diamondback Energy benefited from firmer oil prices. Lundin Mining capitalized on tight copper supply and strong execution at its Caserones mine, while Bermuda‑domiciled Bank of N.T. Butterfield added meaningfully in Financials. Key detractors included Graphic Packaging, which was sold during the year; Progress Software, weighed by a broader software derating; office‑furniture maker HNI Corp.; and Puerto Rico’s EVERTEC, which was exited on macro concerns.
How did the Fund perform since inception?
CUMULATIVE PERFORMANCE | November 1, 2024 (Commencement of Operations) through March 31, 2026
(Initial Investment of $100,000)
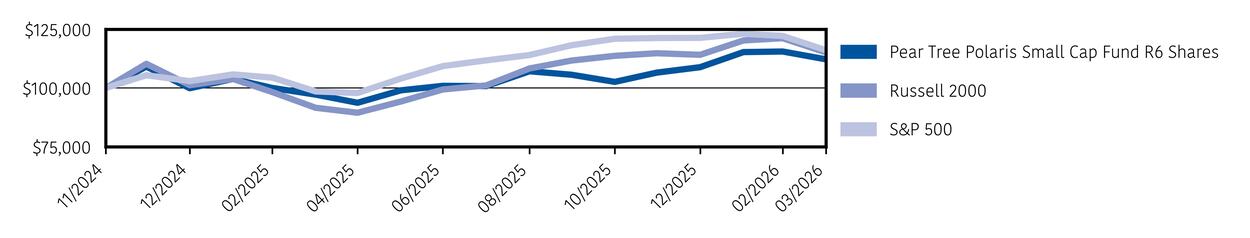
AVERAGE ANNUAL TOTAL RETURNS
|
|
One
Year |
Since
Inception |
|---|---|---|
|
Pear
Tree Polaris Small Cap Fund R6 Shares |
15.45% |
8.51% |
|
Russell
2000 |
25.73% |
10.52% |
|
S&P
500 |
17.80% |
11.14% |
Key Fund Statistics
(as of March 31, 2026)
|
Total
Net Assets |
$92,052,337 |
|
Number
of Holdings |
50 |
|
Advisory
Fee |
$733,315 |
|
Portfolio
Turnover |
37% |
What did the Fund invest in?
(as of March 31, 2026)
SECTOR ALLOCATION
(% of Fund’s net assets)
|
Financials |
|
|
Industrials |
|
|
Information
Technology |
|
|
Real
Estate |
|
|
Health
Care |
|
|
Consumer
Discretionary |
|
|
Materials |
|
|
Consumer
Staples |
|
|
Energy |
|
|
Utilities |
|
|
Cash
and Other Assets (Net) |
TOP TEN HOLDINGS
(% of Fund’s net assets)
|
Laureate
Education, Inc. |
|
|
Lantheus
Holdings, Inc. |
|
|
Northeast
Bancorp |
|
|
Ingles
Markets Inc. |
|
|
The
Bank of N.T. Butterfield & Son Limited |
|
|
V2X,
Inc. |
|
|
Black
Hills Corporation |
|
|
BOK
Financial Corporation |
|
|
South
Plains Financial, Inc. |
|
|
Perdoceo
Education Corporation |
How has the Fund changed?
This is a summary of certain changes to the Fund since April 1, 2025. For more complete information, you may find copies of the Fund’s prospectus, financial information on Form N-CSR (which includes any required tax information for dividends), holdings, proxy voting information, and other information at www.peartreefunds.com/fund-documents/. You also may request this information without charge by contacting Pear Tree Funds at 1-800-326-2151 or info@peartreefunds.com or by contacting your financial intermediary.
Effective December 5, 2025, a reverse stock split (the "Reverse Stock Split") of the issued and outstanding shares of Class R6 took place. As a result of the Reverse Stock Split, for each Class R6 share of the Fund a shareholder held, the shareholder received a proportional number of shares of Class R6 of the Fund with the same aggregate dollar value. The total dollar value of a shareholder's investment in Class R6 shares of the Fund was unchanged and each shareholder continued to own the same percentage (by value) of the Fund immediately following the Reverse Stock Split as the shareholder did immediately prior to the Reverse Stock Split. The Reverse Stock Split Ratio was 3.861 to 1.
The Russell and the S&P do not accept any liability for any errors or omissions in the indexes or data, and hereby expressly disclaim all warranties of originality, accuracy, completeness, timeliness, merchantability and fitness for a particular purpose. No party may rely on any indexes or data contained in this communication. Visit www.peartreefunds.com/fund-documents/ for additional legal notices & disclaimers.
What were the Fund's costs for the last year?
(based on hypothetical $10,000 investment)
|
|
Costs
of a $10,000 investment |
Costs
paid as a percentage of a $10,000 investment |
|---|---|---|
|
Ordinary
Shares |
$117 |
1.12% |
What affected the Fund’s performance this period?
Health Care, one of the most heavily weighted sectors in the portfolio, represented approximately 25% of total holdings. The significant overweight position in the sector, combined with weak performance from several holdings, detracted roughly 240 basis points from relative results during the period. Notable detractors within Health Care included UnitedHealth Group, which declined 47%, and Elevance Health, which fell 31%.
In addition, three positions in the Information Technology sector contributed meaningfully to underperformance. In descending order, these were SAP (35.6%), Accenture (35%), and Salesforce (30%).
The portfolio benefited from favorable performance in the Communication Services, Financials, and Real Estate sectors during the period.
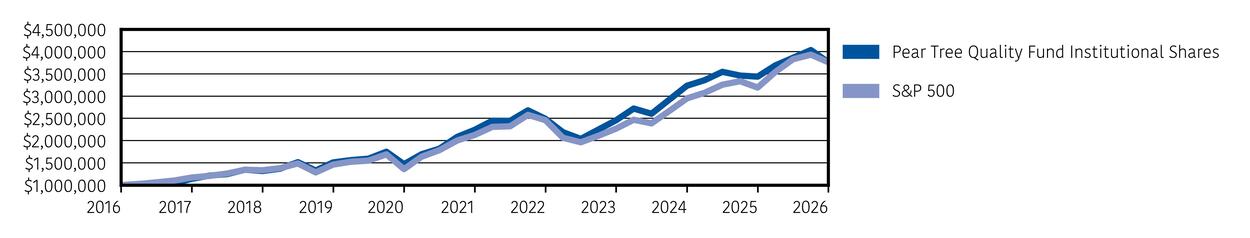
How did the Fund perform over the past 10 years?
CUMULATIVE PERFORMANCE | March 31, 2016 through March 31, 2026
(Initial Investment of $10,000)
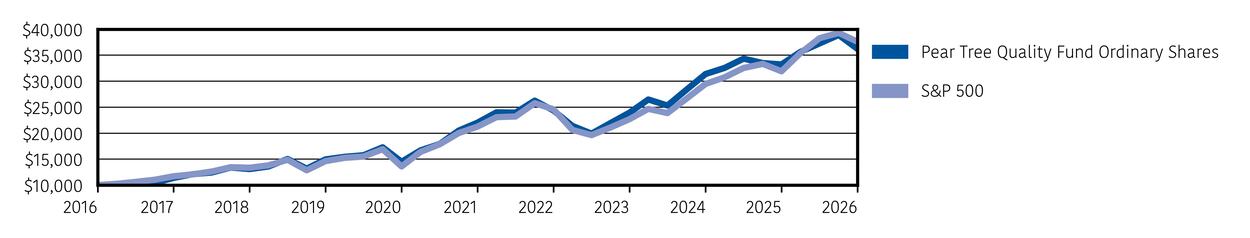
AVERAGE ANNUAL TOTAL RETURNS
|
|
One
Year |
Five
Year |
Ten
Year |
|---|---|---|---|
|
Pear
Tree Quality Fund Ordinary Shares |
9.01% |
10.46% |
13.74% |
|
S&P
500 |
17.80% |
12.06% |
14.16% |
Key Fund Statistics
(as of March 31, 2026)
|
Total
Net Assets |
$267,720,984 |
|
Number
of Holdings |
45 |
|
Advisory
Fee |
$1,906,587 |
|
Portfolio
Turnover |
53% |
What did the Fund invest in?
(as of March 31, 2026)
SECTOR ALLOCATION
(% of Fund’s net assets)
|
Information
Technology |
|
|
Health
Care |
|
|
Communication
Services |
|
|
Consumer
Discretionary |
|
|
Consumer
Staples |
|
|
Financials |
|
|
Industrials |
|
|
Cash
and Other Assets (Net) |
TOP TEN HOLDINGS
(% of Fund’s net assets)
|
Microsoft
Corporation |
|
|
Alphabet,
Inc. Class A |
|
|
Meta
Platforms, Inc. |
|
|
Taiwan
Semiconductor Manufacturing Co., Ltd. |
|
|
Apple,
Inc. |
|
|
Johnson
& Johnson |
|
|
Lam
Research Corporation |
|
|
Amazon.com,
Inc. |
|
|
Thermo
Fisher Scientific, Inc. |
|
|
Accenture
Plc |
How has the Fund changed?
This is a summary of certain changes to the Fund since April 1, 2025. For more complete information, you may find copies of the Fund’s prospectus, financial information on Form N-CSR (which includes any required tax information for dividends), holdings, proxy voting information, and other information at www.peartreefunds.com/fund-documents/. You also may request this information without charge by contacting Pear Tree Funds at 1-800-326-2151 or info@peartreefunds.com or by contacting your financial intermediary.
During the reporting period, there were no changes to the Ordinary Share Class.
The S&P does not accept any liability for any errors or omissions in the indexes or data, and hereby expressly disclaims all warranties of originality, accuracy, completeness, timeliness, merchantability and fitness for a particular purpose. No party may rely on any indexes or data contained in this communication. Visit www.peartreefunds.com/fund-documents/ for additional legal notices & disclaimers.
What were the Fund's costs for the last year?
(based on hypothetical $10,000 investment)
|
|
Costs
of a $10,000 investment |
Costs
paid as a percentage of a $10,000 investment |
|---|---|---|
|
Institutional
Shares |
$79 |
0.75% |
What affected the Fund’s performance this period?
Health Care, one of the most heavily weighted sectors in the portfolio, represented approximately 25% of total holdings. The significant overweight position in the sector, combined with weak performance from several holdings, detracted roughly 240 basis points from relative results during the period. Notable detractors within Health Care included UnitedHealth Group, which declined 47%, and Elevance Health, which fell 31%.
In addition, three positions in the Information Technology sector contributed meaningfully to underperformance. In descending order, these were SAP (35.6%), Accenture (35%), and Salesforce (30%).
The portfolio benefited from favorable performance in the Communication Services, Financials, and Real Estate sectors during the period.
How did the Fund perform over the past 10 years?
CUMULATIVE PERFORMANCE | March 31, 2016 through March 31, 2026
(Initial Investment of $1,000,000)
AVERAGE ANNUAL TOTAL RETURNS
|
|
One
Year |
Five
Year |
Ten
Year |
|---|---|---|---|
|
Pear
Tree Quality Fund Institutional Shares |
9.41% |
10.89% |
14.16% |
|
S&P
500 |
17.80% |
12.06% |
14.16% |
Key Fund Statistics
(as of March 31, 2026)
|
Total
Net Assets |
$267,720,984 |
|
Number
of Holdings |
45 |
|
Advisory
Fee |
$1,906,587 |
|
Portfolio
Turnover |
53% |
What did the Fund invest in?
(as of March 31, 2026)
SECTOR ALLOCATION
(% of Fund’s net assets)
|
Information
Technology |
|
|
Health
Care |
|
|
Communication
Services |
|
|
Consumer
Discretionary |
|
|
Consumer
Staples |
|
|
Financials |
|
|
Industrials |
|
|
Cash
and Other Assets (Net) |
TOP TEN HOLDINGS
(% of Fund’s net assets)
|
Microsoft
Corporation |
|
|
Alphabet,
Inc. Class A |
|
|
Meta
Platforms, Inc. |
|
|
Taiwan
Semiconductor Manufacturing Co., Ltd. |
|
|
Apple,
Inc. |
|
|
Johnson
& Johnson |
|
|
Lam
Research Corporation |
|
|
Amazon.com,
Inc. |
|
|
Thermo
Fisher Scientific, Inc. |
|
|
Accenture
Plc |
How has the Fund changed?
This is a summary of certain changes to the Fund since April 1, 2025. For more complete information, you may find copies of the Fund’s prospectus, financial information on Form N-CSR (which includes any required tax information for dividends), holdings, proxy voting information, and other information at www.peartreefunds.com/fund-documents/. You also may request this information without charge by contacting Pear Tree Funds at 1-800-326-2151 or info@peartreefunds.com or by contacting your financial intermediary.
During the reporting period, there were no changes to the Institutional Share Class.
The S&P does not accept any liability for any errors or omissions in the indexes or data, and hereby expressly disclaims all warranties of originality, accuracy, completeness, timeliness, merchantability and fitness for a particular purpose. No party may rely on any indexes or data contained in this communication. Visit www.peartreefunds.com/fund-documents/ for additional legal notices & disclaimers.
What were the Fund's costs for the last year?
(based on hypothetical $10,000 investment)
|
|
Costs
of a $10,000 investment |
Costs
paid as a percentage of a $10,000 investment |
|---|---|---|
|
R6
Shares |
$67 |
0.64% |
What affected the Fund’s performance this period?
Health Care, one of the most heavily weighted sectors in the portfolio, represented approximately 25% of total holdings. The significant overweight position in the sector, combined with weak performance from several holdings, detracted roughly 240 basis points from relative results during the period. Notable detractors within Health Care included UnitedHealth Group, which declined 47%, and Elevance Health, which fell 31%.
In addition, three positions in the Information Technology sector contributed meaningfully to underperformance. In descending order, these were SAP (35.6%), Accenture (35%), and Salesforce (30%).
The portfolio benefited from favorable performance in the Communication Services, Financials, and Real Estate sectors during the period.
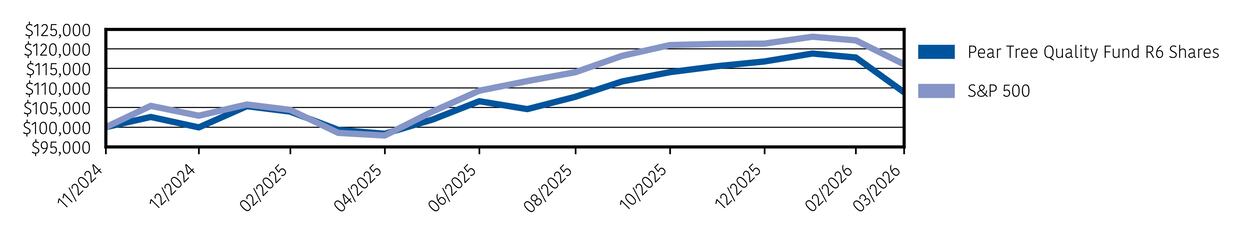
How did the Fund perform since inception?
CUMULATIVE PERFORMANCE | November 1, 2024 (Commencement of Operations) through March 31, 2026
(Initial Investment of $100,000)
AVERAGE ANNUAL TOTAL RETURNS
|
|
One
Year |
Since
Inception |
|---|---|---|
|
Pear
Tree Quality Fund R6 Shares |
9.68% |
6.24% |
|
S&P
500 |
17.80% |
11.14% |
Key Fund Statistics
(as of March 31, 2026)
|
Total
Net Assets |
$267,720,984 |
|
Number
of Holdings |
45 |
|
Advisory
Fee |
$1,906,587 |
|
Portfolio
Turnover |
53% |
What did the Fund invest in?
(as of March 31, 2026)
SECTOR ALLOCATION
(% of Fund’s net assets)
|
Information
Technology |
|
|
Health
Care |
|
|
Communication
Services |
|
|
Consumer
Discretionary |
|
|
Consumer
Staples |
|
|
Financials |
|
|
Industrials |
|
|
Cash
and Other Assets (Net) |
TOP TEN HOLDINGS
(% of Fund’s net assets)
|
Microsoft
Corporation |
|
|
Alphabet,
Inc. Class A |
|
|
Meta
Platforms, Inc. |
|
|
Taiwan
Semiconductor Manufacturing Co., Ltd. |
|
|
Apple,
Inc. |
|
|
Johnson
& Johnson |
|
|
Lam
Research Corporation |
|
|
Amazon.com,
Inc. |
|
|
Thermo
Fisher Scientific, Inc. |
|
|
Accenture
Plc |
How has the Fund changed?
This is a summary of certain changes to the Fund since April 1, 2025. For more complete information, you may find copies of the Fund’s prospectus, financial information on Form N-CSR (which includes any required tax information for dividends), holdings, proxy voting information, and other information at www.peartreefunds.com/fund-documents/. You also may request this information without charge by contacting Pear Tree Funds at 1-800-326-2151 or info@peartreefunds.com or by contacting your financial intermediary.
Effective December 5, 2025, a reverse stock split (the "Reverse Stock Split") of the issued and outstanding shares of Class R6 took place. As a result of the Reverse Stock Split, for each Class R6 share of the Fund a shareholder held, the shareholder received a proportional number of shares of Class R6 of the Fund with the same aggregate dollar value. The total dollar value of a shareholder's investment in Class R6 shares of the Fund was unchanged and each shareholder continued to own the same percentage (by value) of the Fund immediately following the Reverse Stock Split as the shareholder did immediately prior to the Reverse Stock Split. The Reverse Stock Split Ratio was 3.258 to 1.
The S&P does not accept any liability for any errors or omissions in the indexes or data, and hereby expressly disclaims all warranties of originality, accuracy, completeness, timeliness, merchantability and fitness for a particular purpose. No party may rely on any indexes or data contained in this communication. Visit www.peartreefunds.com/fund-documents/ for additional legal notices & disclaimers.
What were the Fund's costs for the last year?
(based on hypothetical $10,000 investment)
|
|
Costs
of a $10,000 investment |
Costs
paid as a percentage of a $10,000 investment |
|---|---|---|
|
Ordinary
Shares |
$144 |
1.22% |
What affected the Fund’s performance this period?
The rapid advance of artificial intelligence has driven a significant uptick in energy demand, highlighting the need to increase our energy supply and upgrade and strengthen our electrical grid. The list of top contributors to the Fund’s performance over the past year were beneficiaries: turbine suppliers, electrical equipment suppliers, electrical grid and renewable energy contractors, and energy storage companies. Additionally, the continuation of the de-globalization of our economy due to tariff wars, national security concerns and other nationalistic behaviors has helped the Fund’s positions in companies that improve energy security, provide domestic sources of key materials and improve the efficiency of our supply chains. Most of the detractors to Fund performance were companies negatively impacted by fears that AI would disrupt their business models or companies experiencing slowdowns in their end markets due to economic uncertainty.
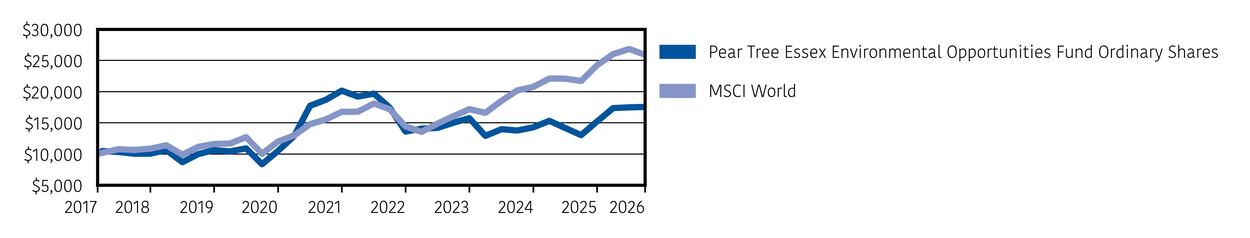
How did the Fund perform since inception?
CUMULATIVE PERFORMANCE | September 1, 2017 (Commencement of Operations) through March 31, 2026*
(Initial Investment of $10,000)
AVERAGE ANNUAL TOTAL RETURNS*
|
|
One
Year |
Five
Year |
Since
Inception |
|---|---|---|---|
|
Pear
Tree Essex Environmental Opportunities Fund Ordinary Shares |
34.63% |
(1.26%) |
6.77% |
|
MSCI
World |
19.39% |
10.77% |
11.73% |
| * | Performance for periods prior to September 1, 2021 represent the performance of Essex Environmental Opportunities Fund, the predecessor of the Fund. |
Key Fund Statistics
(as of March 31, 2026)
|
Total
Net Assets |
$26,956,298 |
|
Number
of Holdings |
38 |
|
Advisory
Fee |
$175,110 |
|
Portfolio
Turnover |
56% |
What did the Fund invest in?
(as of March 31, 2026)
COUNTRY ALLOCATION
(% of Fund’s net assets)
|
United
States |
|
|
Japan |
|
|
Germany |
|
|
Ireland |
|
|
Switzerland |
|
|
China |
|
|
Netherlands |
TOP TEN HOLDINGS
(% of Fund’s net assets)
|
Infineon
Technologies AG |
|
|
Corteva,
Inc. |
|
|
Badger
Meter, Inc. |
|
|
Kingspan
Group plc |
|
|
Advanced
Drainage Systems, Inc. |
|
|
Enphase
Energy, Inc. |
|
|
Primoris
Services Corporation |
|
|
Keyence
Corporation |
|
|
Toray
Industries, Inc. |
|
|
Cognex
Corporation |
How has the Fund changed?
This is a summary of certain changes to the Fund since April 1, 2025. For more complete information, you may find copies of the Fund’s prospectus, financial information on Form N-CSR (which includes any required tax information for dividends), holdings, proxy voting information, and other information at www.peartreefunds.com/fund-documents/. You also may request this information without charge by contacting Pear Tree Funds at 1-800-326-2151 or info@peartreefunds.com or by contacting your financial intermediary.
During the reporting period, there were no changes to the Ordinary Share Class.
The MSCI does not accept any liability for any errors or omissions in the indexes or data, and hereby expressly disclaims all warranties of originality, accuracy, completeness, timeliness, merchantability and fitness for a particular purpose. No party may rely on any indexes or data contained in this communication. Visit www.peartreefunds.com/fund-documents/ for additional legal notices & disclaimers.
What were the Fund's costs for the last year?
(based on hypothetical $10,000 investment)
|
Class
Name |
Costs
of a $10,000 investment |
Costs
paid as a percentage of a $10,000 investment |
|---|---|---|
|
Institutional
Shares |
$115 |
0.98% |
What affected the Fund’s performance this period?
The rapid advance of artificial intelligence has driven a significant uptick in energy demand, highlighting the need to increase our energy supply and upgrade and strengthen our electrical grid. The list of top contributors to the Fund’s performance over the past year were beneficiaries: turbine suppliers, electrical equipment suppliers, electrical grid and renewable energy contractors, and energy storage companies. Additionally, the continuation of the de-globalization of our economy due to tariff wars, national security concerns and other nationalistic behaviors has helped the Fund’s positions in companies that improve energy security, provide domestic sources of key materials and improve the efficiency of our supply chains. Most of the detractors to Fund performance were companies negatively impacted by fears that AI would disrupt their business models or companies experiencing slowdowns in their end markets due to economic uncertainty.
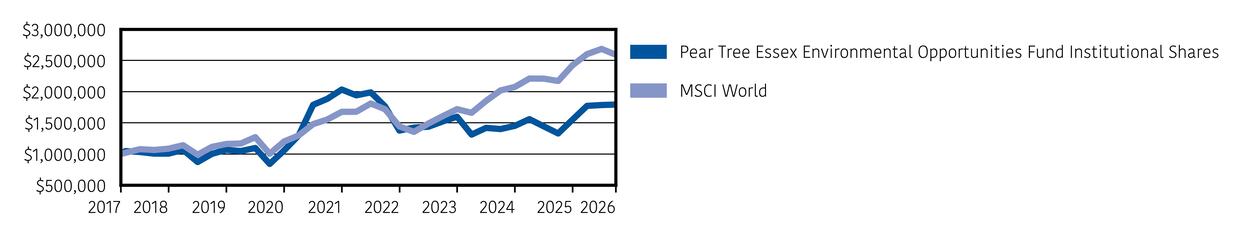
How did the Fund perform since inception?
CUMULATIVE PERFORMANCE | September 1, 2017 (Commencement of Operations) through March 31, 2026*
(Initial Investment of $1,000,000)
AVERAGE ANNUAL TOTAL RETURNS*
|
|
One
Year |
Five
Year |
Since
Inception |
|---|---|---|---|
|
Pear
Tree Essex Environmental Opportunities Fund Institutional Shares |
34.83% |
(1.00%) |
7.04% |
|
MSCI
World |
19.39% |
10.77% |
11.73% |
| * | Performance for periods prior to September 1, 2021 represent the performance of Essex Environmental Opportunities Fund, the predecessor of the Fund. |
Key Fund Statistics
(as of March 31, 2026)
|
Total
Net Assets |
$26,956,298 |
|
Number
of Holdings |
38 |
|
Advisory
Fee |
$175,110 |
|
Portfolio
Turnover |
56% |
What did the Fund invest in?
(as of March 31, 2026)
COUNTRY ALLOCATION
(% of Fund’s net assets)
|
United
States |
|
|
Japan |
|
|
Germany |
|
|
Ireland |
|
|
Switzerland |
|
|
China |
|
|
Netherlands |
TOP TEN HOLDINGS
(% of Fund’s net assets)
|
Infineon
Technologies AG |
|
|
Corteva,
Inc. |
|
|
Badger
Meter, Inc. |
|
|
Kingspan
Group plc |
|
|
Advanced
Drainage Systems, Inc. |
|
|
Enphase
Energy, Inc. |
|
|
Primoris
Services Corporation |
|
|
Keyence
Corporation |
|
|
Toray
Industries, Inc. |
|
|
Cognex
Corporation |
How has the Fund changed?
This is a summary of certain changes to the Fund since April 1, 2025. For more complete information, you may find copies of the Fund’s prospectus, financial information on Form N-CSR (which includes any required tax information for dividends), holdings, proxy voting information, and other information at www.peartreefunds.com/fund-documents/. You also may request this information without charge by contacting Pear Tree Funds at 1-800-326-2151 or info@peartreefunds.com or by contacting your financial intermediary.
During the reporting period, there were no changes to the Institutional Share Class.
The MSCI does not accept any liability for any errors or omissions in the indexes or data, and hereby expressly disclaims all warranties of originality, accuracy, completeness, timeliness, merchantability and fitness for a particular purpose. No party may rely on any indexes or data contained in this communication. Visit www.peartreefunds.com/fund-documents/ for additional legal notices & disclaimers.
What were the Fund's costs for the last year?
(based on hypothetical $10,000 investment)
|
|
Costs
of a $10,000 investment |
Costs
paid as a percentage of a $10,000 investment |
|---|---|---|
|
R6
Shares |
$109 |
0.92% |
What affected the Fund’s performance this period?
The rapid advance of artificial intelligence has driven a significant uptick in energy demand, highlighting the need to increase our energy supply and upgrade and strengthen our electrical grid. The list of top contributors to the Fund’s performance over the past year were beneficiaries: turbine suppliers, electrical equipment suppliers, electrical grid and renewable energy contractors, and energy storage companies. Additionally, the continuation of the de-globalization of our economy due to tariff wars, national security concerns and other nationalistic behaviors has helped the Fund’s positions in companies that improve energy security, provide domestic sources of key materials and improve the efficiency of our supply chains. Most of the detractors to Fund performance were companies negatively impacted by fears that AI would disrupt their business models or companies experiencing slowdowns in their end markets due to economic uncertainty.
How did the Fund perform since inception?
CUMULATIVE PERFORMANCE | September 1, 2021 (Commencement of Operations) through March 31, 2026
(Initial Investment of $100,000)
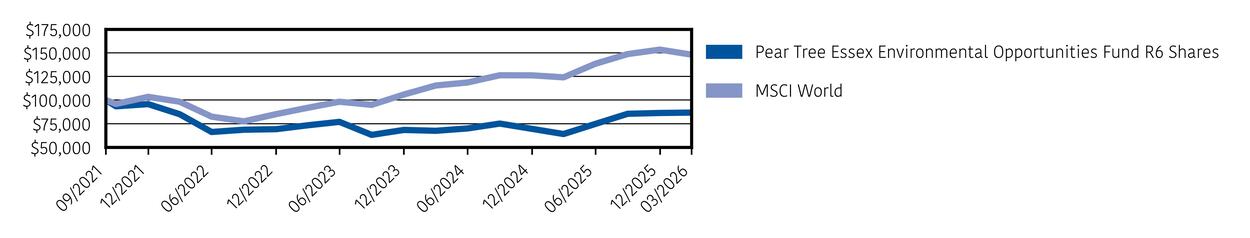
AVERAGE ANNUAL TOTAL RETURNS
|
|
One
Year |
Since
Inception |
|---|---|---|
|
Pear
Tree Essex Environmental Opportunities Fund R6 Shares |
35.46% |
(3.06%) |
|
MSCI
World |
19.39% |
8.88% |
Key Fund Statistics
(as of March 31, 2026)
|
Total
Net Assets |
$26,956,298 |
|
Number
of Holdings |
38 |
|
Advisory
Fee |
$175,110 |
|
Portfolio
Turnover |
56% |
What did the Fund invest in?
(as of March 31, 2026)
COUNTRY ALLOCATION
(% of Fund’s net assets)
|
United
States |
|
|
Japan |
|
|
Germany |
|
|
Ireland |
|
|
Switzerland |
|
|
China |
|
|
Netherlands |
TOP TEN HOLDINGS
(% of Fund’s net assets)
|
Infineon
Technologies AG |
|
|
Corteva,
Inc. |
|
|
Badger
Meter, Inc. |
|
|
Kingspan
Group plc |
|
|
Advanced
Drainage Systems, Inc. |
|
|
Enphase
Energy, Inc. |
|
|
Primoris
Services Corporation |
|
|
Keyence
Corporation |
|
|
Toray
Industries, Inc. |
|
|
Cognex
Corporation |
How has the Fund changed?
This is a summary of certain changes to the Fund since April 1, 2025. For more complete information, you may find copies of the Fund’s prospectus, financial information on Form N-CSR (which includes any required tax information for dividends), holdings, proxy voting information, and other information at www.peartreefunds.com/fund-documents/. You also may request this information without charge by contacting Pear Tree Funds at 1-800-326-2151 or info@peartreefunds.com or by contacting your financial intermediary.
Effective December 5, 2025, a reverse stock split (the "Reverse Stock Split") of the issued and outstanding shares of Class R6 took place. As a result of the Reverse Stock Split, for each Class R6 share of the Fund a shareholder held, the shareholder received a proportional number of shares of Class R6 of the Fund with the same aggregate dollar value. The total dollar value of a shareholder's investment in Class R6 shares of the Fund was unchanged and each shareholder continued to own the same percentage (by value) of the Fund immediately following the Reverse Stock Split as the shareholder did immediately prior to the Reverse Stock Split. The Reverse Stock Split Ratio was 2.188 to 1.
The MSCI does not accept any liability for any errors or omissions in the indexes or data, and hereby expressly disclaims all warranties of originality, accuracy, completeness, timeliness, merchantability and fitness for a particular purpose. No party may rely on any indexes or data contained in this communication. Visit www.peartreefunds.com/fund-documents/ for additional legal notices & disclaimers.
What were the Fund's costs for the last year?
(based on hypothetical $10,000 investment)
|
|
Costs
of a $10,000 investment |
Costs
paid as a percentage of a $10,000 investment |
|---|---|---|
|
Ordinary
Shares |
$174 |
1.50%* |
| * | The percentage would have been 1.45% if the Trust did not engage a third party to assist in reclaiming EU tax overpayments made by the Fund. |
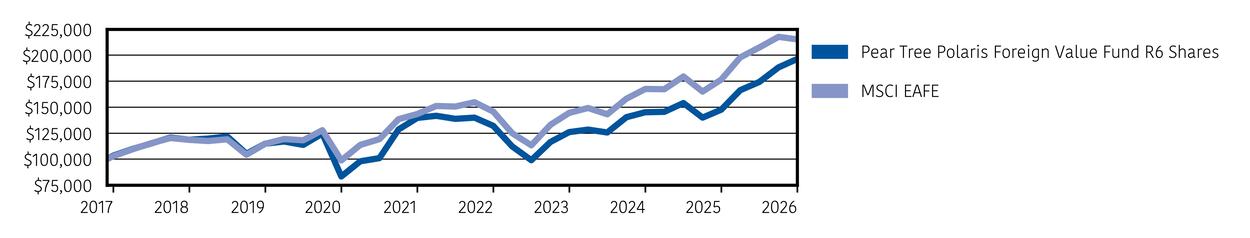
What affected the Fund’s performance this period?
The Fund’s performance was led by strong stock selection in Information Technology (“IT”), Industrials, Financials and Materials.IT was the standout sector contributor, driven by the AI‑fueled shortage in advanced chips and memory; SK Hynix and Samsung Electronics were the top two contributors overall as supply‑demand dynamics favored memory manufacturers. Industrials and Financials also drove results, with Marubeni closing in on guidance targets through new investments and a richer non‑resource profit mix, while Shinhan Financial and Mitsubishi UFJ benefited from strong quarterly results and earnings momentum. Materials contributed meaningfully: Lundin Mining posted record revenues on higher copper prices, and Yara International gained share after the Strait of Hormuz closure disrupted roughly 30% of global nitrogen supply. By country, South Korea dominated, followed by Japan, Canada and Norway. Key laggards included Teleperformance, pressured by fears that generative AI will disrupt customer service outsourcing; Nomad Foods, which cut full‑year guidance; Alibaba, amid skepticism over its sizeable AI and cloud capex; and Sanofi, following mixed COPD Phase 3 trial results.
How did the Fund perform over the past 10 years?
CUMULATIVE PERFORMANCE | March 31, 2016 through March 31, 2026
(Initial Investment of $10,000)
AVERAGE ANNUAL TOTAL RETURNS
|
|
One
Year |
Five
Year |
Ten
Year |
|---|---|---|---|
|
Pear
Tree Polaris Foreign Value Fund Ordinary Shares |
32.38% |
6.56% |
7.56% |
|
MSCI
EAFE |
21.88% |
8.45% |
8.91% |
Key Fund Statistics
(as of March 31, 2026)
|
Total
Net Assets |
$1,398,714,960 |
|
Number
of Holdings |
59 |
|
Advisory
Fee |
$14,679,283 |
|
Portfolio
Turnover |
29% |
What did the Fund invest in?
(as of March 31, 2026)
COUNTRY ALLOCATION
(% of Fund’s net assets)
|
Japan |
|
|
South
Korea |
|
|
France |
|
|
Germany |
|
|
United
Kingdom |
|
|
Ireland |
|
|
Norway |
|
|
Sweden |
|
|
Spain |
|
|
China |
|
|
Italy |
|
|
Switzerland |
|
|
Netherlands |
|
|
Puerto
Rico |
|
|
Singapore |
|
|
Hong
Kong |
|
|
Chile |
|
|
Taiwan |
|
|
Canada |
|
|
Belgium |
|
|
Russia |
TOP TEN HOLDINGS
(% of Fund’s net assets)
|
SK
Hynix, Inc. |
|
|
Samsung
Electronics Company Limited |
|
|
Marubeni
Corporation |
|
|
TotalEnergies
SE |
|
|
Endesa,
S.A. |
|
|
Barry
Callebaut AG |
|
|
Jazz
Pharmaceuticals plc |
|
|
Koninklijke
Ahold Delhaize N.V. |
|
|
DNB
Bank ASA |
|
|
ORIX
Corporation |
How has the Fund changed?
This is a summary of certain changes to the Fund since April 1, 2025. For more complete information, you may find copies of the Fund’s prospectus, financial information on Form N-CSR (which includes any required tax information for dividends), holdings, proxy voting information, and other information at www.peartreefunds.com/fund-documents/. You also may request this information without charge by contacting Pear Tree Funds at 1-800-326-2151 or info@peartreefunds.com or by contacting your financial intermediary.
During the reporting period, there were no changes to the Ordinary Share Class.
The MSCI does not accept any liability for any errors or omissions in the indexes or data, and hereby expressly disclaims all warranties of originality, accuracy, completeness, timeliness, merchantability and fitness for a particular purpose. No party may rely on any indexes or data contained in this communication. Visit www.peartreefunds.com/fund-documents/ for additional legal notices & disclaimers.
What were the Fund's costs for the last year?
(based on hypothetical $10,000 investment)
|
|
Costs
of a $10,000 investment |
Costs
paid as a percentage of a $10,000 investment |
|---|---|---|
|
Institutional
Shares |
$129 |
1.11%* |
| * | The percentage would have been 1.08% if the Trust did not engage a third party to assist in reclaiming EU tax overpayments made by the Fund. |
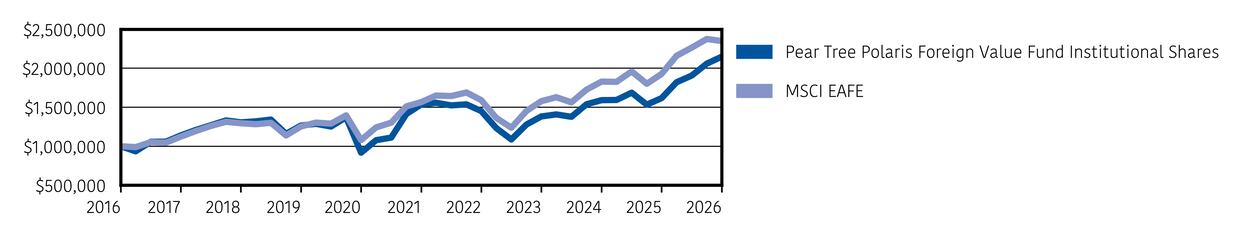
What affected the Fund’s performance this period?
The Fund’s performance was led by strong stock selection in Information Technology (“IT”), Industrials, Financials and Materials.IT was the standout sector contributor, driven by the AI‑fueled shortage in advanced chips and memory; SK Hynix and Samsung Electronics were the top two contributors overall as supply‑demand dynamics favored memory manufacturers. Industrials and Financials also drove results, with Marubeni closing in on guidance targets through new investments and a richer non‑resource profit mix, while Shinhan Financial and Mitsubishi UFJ benefited from strong quarterly results and earnings momentum. Materials contributed meaningfully: Lundin Mining posted record revenues on higher copper prices, and Yara International gained share after the Strait of Hormuz closure disrupted roughly 30% of global nitrogen supply. By country, South Korea dominated, followed by Japan, Canada and Norway. Key laggards included Teleperformance, pressured by fears that generative AI will disrupt customer service outsourcing; Nomad Foods, which cut full‑year guidance; Alibaba, amid skepticism over its sizeable AI and cloud capex; and Sanofi, following mixed COPD Phase 3 trial results.
How did the Fund perform over the past 10 years?
CUMULATIVE PERFORMANCE | March 31, 2016 through March 31, 2026
(Initial Investment of $1,000,000)
AVERAGE ANNUAL TOTAL RETURNS
|
|
One
Year |
Five
Year |
Ten
Year |
|---|---|---|---|
|
Pear
Tree Polaris Foreign Value Fund Institutional Shares |
32.87% |
6.95% |
7.94% |
|
MSCI
EAFE |
21.88% |
8.45% |
8.91% |
Key Fund Statistics
(as of March 31, 2026)
|
Total
Net Assets |
$1,398,714,960 |
|
Number
of Holdings |
59 |
|
Advisory
Fee |
$14,679,283 |
|
Portfolio
Turnover |
29% |
What did the Fund invest in?
(as of March 31, 2026)
COUNTRY ALLOCATION
(% of Fund’s net assets)
|
Japan |
|
|
South
Korea |
|
|
France |
|
|
Germany |
|
|
United
Kingdom |
|
|
Ireland |
|
|
Norway |
|
|
Sweden |
|
|
Spain |
|
|
China |
|
|
Italy |
|
|
Switzerland |
|
|
Netherlands |
|
|
Puerto
Rico |
|
|
Singapore |
|
|
Hong
Kong |
|
|
Chile |
|
|
Taiwan |
|
|
Canada |
|
|
Belgium |
|
|
Russia |
TOP TEN HOLDINGS
(% of Fund’s net assets)
|
SK
Hynix, Inc. |
|
|
Samsung
Electronics Company Limited |
|
|
Marubeni
Corporation |
|
|
TotalEnergies
SE |
|
|
Endesa,
S.A. |
|
|
Barry
Callebaut AG |
|
|
Jazz
Pharmaceuticals plc |
|
|
Koninklijke
Ahold Delhaize N.V. |
|
|
DNB
Bank ASA |
|
|
ORIX
Corporation |
How has the Fund changed?
This is a summary of certain changes to the Fund since April 1, 2025. For more complete information, you may find copies of the Fund’s prospectus, financial information on Form N-CSR (which includes any required tax information for dividends), holdings, proxy voting information, and other information at www.peartreefunds.com/fund-documents/. You also may request this information without charge by contacting Pear Tree Funds at 1-800-326-2151 or info@peartreefunds.com or by contacting your financial intermediary.
During the reporting period, there were no changes to the Institutional Share Class.
The MSCI does not accept any liability for any errors or omissions in the indexes or data, and hereby expressly disclaims all warranties of originality, accuracy, completeness, timeliness, merchantability and fitness for a particular purpose. No party may rely on any indexes or data contained in this communication. Visit www.peartreefunds.com/fund-documents/ for additional legal notices & disclaimers.
What were the Fund's costs for the last year?
(based on hypothetical $10,000 investment)
|
|
Costs
of a $10,000 investment |
Costs
paid as a percentage of a $10,000 investment |
|---|---|---|
|
R6
Shares |
$115 |
0.98%* |
| * | The percentage would have been 0.94% if the Trust did not engage a third party to assist in reclaiming EU tax overpayments made by the Fund. |
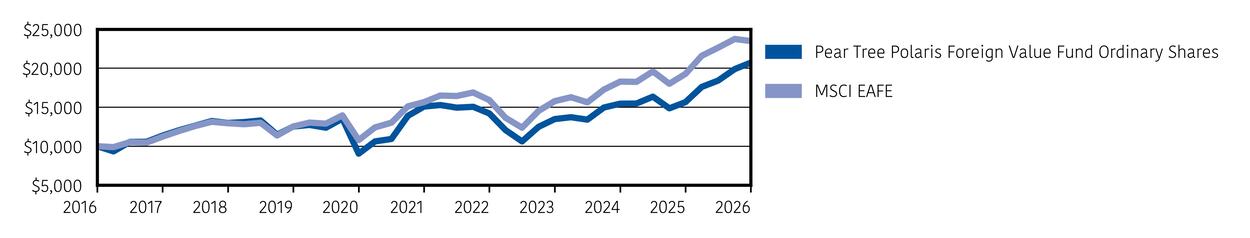
What affected the Fund’s performance this period?
The Fund’s performance was led by strong stock selection in Information Technology (“IT”), Industrials, Financials and Materials.IT was the standout sector contributor, driven by the AI‑fueled shortage in advanced chips and memory; SK Hynix and Samsung Electronics were the top two contributors overall as supply‑demand dynamics favored memory manufacturers. Industrials and Financials also drove results, with Marubeni closing in on guidance targets through new investments and a richer non‑resource profit mix, while Shinhan Financial and Mitsubishi UFJ benefited from strong quarterly results and earnings momentum. Materials contributed meaningfully: Lundin Mining posted record revenues on higher copper prices, and Yara International gained share after the Strait of Hormuz closure disrupted roughly 30% of global nitrogen supply. By country, South Korea dominated, followed by Japan, Canada and Norway. Key laggards included Teleperformance, pressured by fears that generative AI will disrupt customer service outsourcing; Nomad Foods, which cut full‑year guidance; Alibaba, amid skepticism over its sizeable AI and cloud capex; and Sanofi, following mixed COPD Phase 3 trial results.
How did the Fund perform since inception?
CUMULATIVE PERFORMANCE | February 6, 2017 (Commencement of Operations) through March 31, 2026
(Initial Investment of $100,000)
AVERAGE ANNUAL TOTAL RETURNS
|
|
One
Year |
Five
Year |
Since
Inception |
|---|---|---|---|
|
Pear
Tree Polaris Foreign Value Fund R6 Shares |
33.00% |
7.05% |
7.66% |
|
MSCI
EAFE |
21.88% |
8.45% |
8.92% |
Key Fund Statistics
(as of March 31, 2026)
|
Total
Net Assets |
$1,398,714,960 |
|
Number
of Holdings |
59 |
|
Advisory
Fee |
$14,679,283 |
|
Portfolio
Turnover |
29% |
What did the Fund invest in?
(as of March 31, 2026)
COUNTRY ALLOCATION
(% of Fund’s net assets)
|
Japan |
|
|
South
Korea |
|
|
France |
|
|
Germany |
|
|
United
Kingdom |
|
|
Ireland |
|
|
Norway |
|
|
Sweden |
|
|
Spain |
|
|
China |
|
|
Italy |
|
|
Switzerland |
|
|
Netherlands |
|
|
Puerto
Rico |
|
|
Singapore |
|
|
Hong
Kong |
|
|
Chile |
|
|
Taiwan |
|
|
Canada |
|
|
Belgium |
|
|
Russia |
TOP TEN HOLDINGS
(% of Fund’s net assets)
|
SK
Hynix, Inc. |
|
|
Samsung
Electronics Company Limited |
|
|
Marubeni
Corporation |
|
|
TotalEnergies
SE |
|
|
Endesa,
S.A. |
|
|
Barry
Callebaut AG |
|
|
Jazz
Pharmaceuticals plc |
|
|
Koninklijke
Ahold Delhaize N.V. |
|
|
DNB
Bank ASA |
|
|
ORIX
Corporation |
How has the Fund changed?
This is a summary of certain changes to the Fund since April 1, 2025. For more complete information, you may find copies of the Fund’s prospectus, financial information on Form N-CSR (which includes any required tax information for dividends), holdings, proxy voting information, and other information at www.peartreefunds.com/fund-documents/. You also may request this information without charge by contacting Pear Tree Funds at 1-800-326-2151 or info@peartreefunds.com or by contacting your financial intermediary.
Effective December 5, 2025, a reverse stock split (the "Reverse Stock Split") of the issued and outstanding shares of Class R6 took place. As a result of the Reverse Stock Split, for each Class R6 share of the Fund a shareholder held, the shareholder received a proportional number of shares of Class R6 of the Fund with the same aggregate dollar value. The total dollar value of a shareholder's investment in Class R6 shares of the Fund was unchanged and each shareholder continued to own the same percentage (by value) of the Fund immediately following the Reverse Stock Split as the shareholder did immediately prior to the Reverse Stock Split. The Reverse Stock Split Ratio was 2.119 to 1.
The MSCI does not accept any liability for any errors or omissions in the indexes or data, and hereby expressly disclaims all warranties of originality, accuracy, completeness, timeliness, merchantability and fitness for a particular purpose. No party may rely on any indexes or data contained in this communication. Visit www.peartreefunds.com/fund-documents/ for additional legal notices & disclaimers.
What were the Fund's costs for the last year?
(based on hypothetical $10,000 investment)
|
|
Costs
of a $10,000 investment |
Costs
paid as a percentage of a $10,000 investment |
|---|---|---|
|
Ordinary
Shares |
$160 |
1.48%* |
| * | The percentage would have been 1.44% if the Trust did not engage a third party to assist in reclaiming EU tax overpayments made by the Fund. |
What affected the Fund’s performance this period?
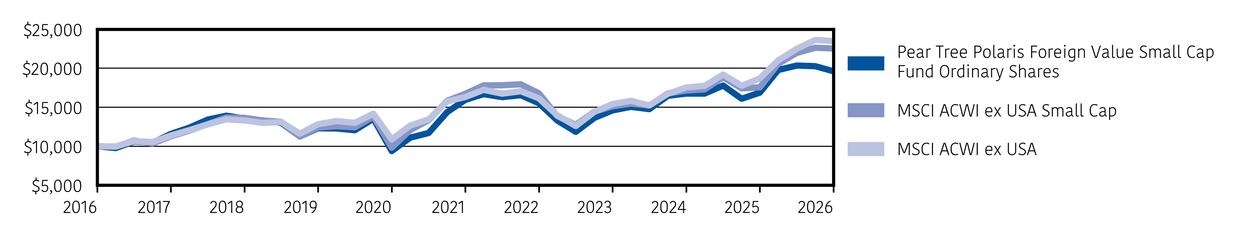
The Fund delivered a strong absolute return but trailed the MSCI ACWI ex USA Small Cap Index, which was lifted by sharp rallies in metals & mining and other capital‑intensive sectors where the Fund is structurally underweight, as well as outsized gains in markets such as Taiwan, South Korea and Canada where positioning differed materially from the benchmark. Stock selection was strong in the sectors the Fund does emphasize: Utilities, Consumer Staples and Industrials, with Japan, Norway, the United Kingdom and France the largest country contributors. Utilities was the standout sector. Brazil’s Equatorial Energia posted robust earnings on volume growth, tariff adjustments and the profitable sale of transmission assets, while France’s Rubis and Portugal’s Redes Energéticas Nacionais rallied on rising electricity demand and grid‑investment tailwinds. Ireland’s Glanbia surged on strong whey protein demand tied to GLP‑1 adoption and functional nutrition, anchoring the Consumer Staples contribution. In Japan, Kanematsu Corp. benefited from sustained momentum in IT services and mobile retail, and Kraftia Corporation was sold at its target valuation. Norwegian regional banks Sparebanken Norge and SpareBank 1 Sør‑Norge gained as Norges Bank held policy rates at 4%, supporting net interest margins. Key detractors included goeasy Ltd., Zhongsheng Group, Hikma Pharmaceuticals and Sopra Steria.
How did the Fund perform over the past 10 years?
CUMULATIVE PERFORMANCE | March 31, 2016 through March 31, 2026
(Initial Investment of $10,000)
AVERAGE ANNUAL TOTAL RETURNS
|
|
One
Year |
Five
Year |
Ten
Year |
|---|---|---|---|
|
Pear
Tree Polaris Foreign Value Small Cap Fund Ordinary Shares |
16.37% |
4.25% |
6.99% |
|
MSCI
ACWI ex USA Small Cap |
28.41% |
6.16% |
8.47% |
|
MSCI
ACWI ex USA |
25.58% |
7.56% |
8.91% |
Key Fund Statistics
(as of March 31, 2026)
|
Total
Net Assets |
$617,081,836 |
|
Number
of Holdings |
56 |
|
Advisory
Fee |
$6,344,470 |
|
Portfolio
Turnover |
27% |
What did the Fund invest in?
(as of March 31, 2026)
COUNTRY ALLOCATION
(% of Fund’s net assets)
|
France |
|
|
Japan |
|
|
Norway |
|
|
United
Kingdom |
|
|
Thailand |
|
|
Taiwan |
|
|
Brazil |
|
|
Sweden |
|
|
Belgium |
|
|
China |
|
|
Germany |
|
|
Canada |
|
|
India |
|
|
Portugal |
|
|
Ireland |
|
|
Netherlands |
|
|
Hong
Kong |
|
|
Italy |
|
|
South
Korea |
|
|
Singapore |
|
|
Denmark |
|
|
South
Africa |
|
|
Spain |
TOP TEN HOLDINGS
(% of Fund’s net assets)
|
Equatorial
Energia S.A. |
|
|
D'Ieteren
S.A. |
|
|
Rubis |
|
|
Krungthai
Card Public Company Limited |
|
|
Redes
Energéticas Nacionais, SGPS, S.A. |
|
|
TISCO
Financial Group |
|
|
Elis
S.A. |
|
|
Ipsos |
|
|
Mizuho
Leasing Company, Limited |
|
|
Glanbia
plc |
How has the Fund changed?
This is a summary of certain changes to the Fund since April 1, 2025. For more complete information, you may find copies of the Fund’s prospectus, financial information on Form N-CSR (which includes any required tax information for dividends), holdings, proxy voting information, and other information at www.peartreefunds.com/fund-documents/. You also may request this information without charge by contacting Pear Tree Funds at 1-800-326-2151 or info@peartreefunds.com or by contacting your financial intermediary.
During the reporting period, there were no changes to the Ordinary Share Class.
The MSCI does not accept any liability for any errors or omissions in the indexes or data, and hereby expressly disclaims all warranties of originality, accuracy, completeness, timeliness, merchantability and fitness for a particular purpose. No party may rely on any indexes or data contained in this communication. Visit www.peartreefunds.com/fund-documents/ for additional legal notices & disclaimers.
What were the Fund's costs for the last year?
(based on hypothetical $10,000 investment)
|
|
Costs
of a $10,000 investment |
Costs
paid as a percentage of a $10,000 investment |
|---|---|---|
|
Institutional
Shares |
$121 |
1.11%* |
| * | The percentage would have been 1.07% if the Trust did not engage a third party to assist in reclaiming EU tax overpayments made by the Fund. |
What affected the Fund’s performance this period?
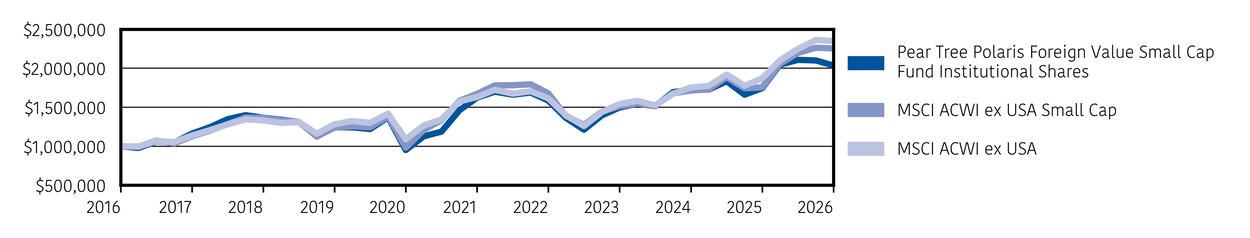
The Fund delivered a strong absolute return but trailed the MSCI ACWI ex USA Small Cap Index, which was lifted by sharp rallies in metals & mining and other capital‑intensive sectors where the Fund is structurally underweight, as well as outsized gains in markets such as Taiwan, South Korea and Canada where positioning differed materially from the benchmark. Stock selection was strong in the sectors the Fund does emphasize: Utilities, Consumer Staples and Industrials, with Japan, Norway, the United Kingdom and France the largest country contributors. Utilities was the standout sector. Brazil’s Equatorial Energia posted robust earnings on volume growth, tariff adjustments and the profitable sale of transmission assets, while France’s Rubis and Portugal’s Redes Energéticas Nacionais rallied on rising electricity demand and grid‑investment tailwinds. Ireland’s Glanbia surged on strong whey protein demand tied to GLP‑1 adoption and functional nutrition, anchoring the Consumer Staples contribution. In Japan, Kanematsu Corp. benefited from sustained momentum in IT services and mobile retail, and Kraftia Corporation was sold at its target valuation. Norwegian regional banks Sparebanken Norge and SpareBank 1 Sør‑Norge gained as Norges Bank held policy rates at 4%, supporting net interest margins. Key detractors included goeasy Ltd., Zhongsheng Group, Hikma Pharmaceuticals and Sopra Steria.
How did the Fund perform over the past 10 years?
CUMULATIVE PERFORMANCE | March 31, 2016 through March 31, 2026
(Initial Investment of $1,000,000)
AVERAGE ANNUAL TOTAL RETURNS
|
|
One
Year |
Five
Year |
Ten
Year |
|---|---|---|---|
|
Pear
Tree Polaris Foreign Value Small Cap Fund Institutional Shares |
16.82% |
4.65% |
7.39% |
|
MSCI
ACWI ex USA Small Cap |
28.41% |
6.16% |
8.47% |
|
MSCI
ACWI ex USA |
25.58% |
7.56% |
8.91% |
Key Fund Statistics
(as of March 31, 2026)
|
Total
Net Assets |
$617,081,836 |
|
Number
of Holdings |
56 |
|
Advisory
Fee |
$6,344,470 |
|
Portfolio
Turnover |
27% |
What did the Fund invest in?
(as of March 31, 2026)
COUNTRY ALLOCATION
(% of Fund’s net assets)
|
France |
|
|
Japan |
|
|
Norway |
|
|
United
Kingdom |
|
|
Thailand |
|
|
Taiwan |
|
|
Brazil |
|
|
Sweden |
|
|
Belgium |
|
|
China |
|
|
Germany |
|
|
Canada |
|
|
India |
|
|
Portugal |
|
|
Ireland |
|
|
Netherlands |
|
|
Hong
Kong |
|
|
Italy |
|
|
South
Korea |
|
|
Singapore |
|
|
Denmark |
|
|
South
Africa |
|
|
Spain |
TOP TEN HOLDINGS
(% of Fund’s net assets)
|
Equatorial
Energia S.A. |
|
|
D'Ieteren
S.A. |
|
|
Rubis |
|
|
Krungthai
Card Public Company Limited |
|
|
Redes
Energéticas Nacionais, SGPS, S.A. |
|
|
TISCO
Financial Group |
|
|
Elis
S.A. |
|
|
Ipsos |
|
|
Mizuho
Leasing Company, Limited |
|
|
Glanbia
plc |
How has the Fund changed?
This is a summary of certain changes to the Fund since April 1, 2025. For more complete information, you may find copies of the Fund’s prospectus, financial information on Form N-CSR (which includes any required tax information for dividends), holdings, proxy voting information, and other information at www.peartreefunds.com/fund-documents/. You also may request this information without charge by contacting Pear Tree Funds at 1-800-326-2151 or info@peartreefunds.com or by contacting your financial intermediary.
During the reporting period, there were no changes to the Institutional Share Class.
The MSCI does not accept any liability for any errors or omissions in the indexes or data, and hereby expressly disclaims all warranties of originality, accuracy, completeness, timeliness, merchantability and fitness for a particular purpose. No party may rely on any indexes or data contained in this communication. Visit www.peartreefunds.com/fund-documents/ for additional legal notices & disclaimers.
What were the Fund's costs for the last year?
(based on hypothetical $10,000 investment)
|
|
Costs
of a $10,000 investment |
Costs
paid as a percentage of a $10,000 investment |
|---|---|---|
|
R6
Shares |
$117 |
1.08%* |
| * | The percentage would have been 1.03% if the Trust did not engage a third party to assist in reclaiming EU tax overpayments made by the Fund. |
What affected the Fund’s performance this period?
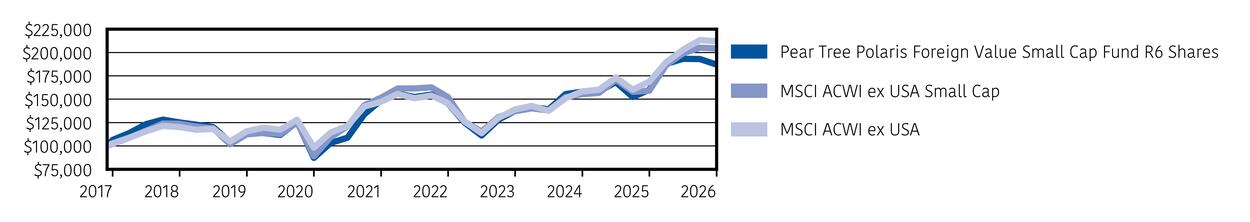
The Fund delivered a strong absolute return but trailed the MSCI ACWI ex USA Small Cap Index, which was lifted by sharp rallies in metals & mining and other capital‑intensive sectors where the Fund is structurally underweight, as well as outsized gains in markets such as Taiwan, South Korea and Canada where positioning differed materially from the benchmark. Stock selection was strong in the sectors the Fund does emphasize: Utilities, Consumer Staples and Industrials, with Japan, Norway, the United Kingdom and France the largest country contributors. Utilities was the standout sector. Brazil’s Equatorial Energia posted robust earnings on volume growth, tariff adjustments and the profitable sale of transmission assets, while France’s Rubis and Portugal’s Redes Energéticas Nacionais rallied on rising electricity demand and grid‑investment tailwinds. Ireland’s Glanbia surged on strong whey protein demand tied to GLP‑1 adoption and functional nutrition, anchoring the Consumer Staples contribution. In Japan, Kanematsu Corp. benefited from sustained momentum in IT services and mobile retail, and Kraftia Corporation was sold at its target valuation. Norwegian regional banks Sparebanken Norge and SpareBank 1 Sør‑Norge gained as Norges Bank held policy rates at 4%, supporting net interest margins. Key detractors included goeasy Ltd., Zhongsheng Group, Hikma Pharmaceuticals and Sopra Steria.
How did the Fund perform since inception?
CUMULATIVE PERFORMANCE | February 6, 2017 (Commencement of Operations) through March 31, 2026
(Initial Investment of $100,000)
AVERAGE ANNUAL TOTAL RETURNS
|
|
One
Year |
Five
Year |
Since
Inception |
|---|---|---|---|
|
Pear
Tree Polaris Foreign Value Small Cap Fund R6 Shares |
17.00% |
4.72% |
7.12% |
|
MSCI
ACWI ex USA Small Cap |
28.41% |
6.16% |
8.34% |
|
MSCI
ACWI ex USA |
25.58% |
7.56% |
8.72% |
Key Fund Statistics
(as of March 31, 2026)
|
Total
Net Assets |
$617,081,836 |
|
Number
of Holdings |
56 |
|
Advisory
Fee |
$6,344,470 |
|
Portfolio
Turnover |
27% |
What did the Fund invest in?
(as of March 31, 2026)
COUNTRY ALLOCATION
(% of Fund’s net assets)
|
France |
|
|
Japan |
|
|
Norway |
|
|
United
Kingdom |
|
|
Thailand |
|
|
Taiwan |
|
|
Brazil |
|
|
Sweden |
|
|
Belgium |
|
|
China |
|
|
Germany |
|
|
Canada |
|
|
India |
|
|
Portugal |
|
|
Ireland |
|
|
Netherlands |
|
|
Hong
Kong |
|
|
Italy |
|
|
South
Korea |
|
|
Singapore |
1.3 |
|
Denmark |
|
|
South
Africa |
|
|
Spain |
TOP TEN HOLDINGS
(% of Fund’s net assets)
|
Equatorial
Energia S.A. |
|
|
D'Ieteren
S.A. |
|
|
Rubis |
|
|
Krungthai
Card Public Company Limited |
|
|
Redes
Energéticas Nacionais, SGPS, S.A. |
|
|
TISCO
Financial Group |
|
|
Elis
S.A. |
|
|
Ipsos |
|
|
Mizuho
Leasing Company, Limited |
|
|
Glanbia
plc |
How has the Fund changed?
This is a summary of certain changes to the Fund since April 1, 2025. For more complete information, you may find copies of the Fund’s prospectus, financial information on Form N-CSR (which includes any required tax information for dividends), holdings, proxy voting information, and other information at www.peartreefunds.com/fund-documents/. You also may request this information without charge by contacting Pear Tree Funds at 1-800-326-2151 or info@peartreefunds.com or by contacting your financial intermediary.
Effective December 5, 2025, a reverse stock split (the "Reverse Stock Split") of the issued and outstanding shares of Class R6 took place. As a result of the Reverse Stock Split, for each Class R6 share of the Fund a shareholder held, the shareholder received a proportional number of shares of Class R6 of the Fund with the same aggregate dollar value. The total dollar value of a shareholder's investment in Class R6 shares of the Fund was unchanged and each shareholder continued to own the same percentage (by value) of the Fund immediately following the Reverse Stock Split as the shareholder did immediately prior to the Reverse Stock Split. The Reverse Stock Split Ratio was 1.429 to 1.
The MSCI does not accept any liability for any errors or omissions in the indexes or data, and hereby expressly disclaims all warranties of originality, accuracy, completeness, timeliness, merchantability and fitness for a particular purpose. No party may rely on any indexes or data contained in this communication. Visit www.peartreefunds.com/fund-documents/ for additional legal notices & disclaimers.
What were the Fund's costs for the last year?
(based on hypothetical $10,000 investment)
|
|
Costs
of a $10,000 investment |
Costs
paid as a percentage of a $10,000 investment |
|---|---|---|
|
Ordinary
Shares |
$152 |
1.44% |
What affected the Fund’s performance this period?
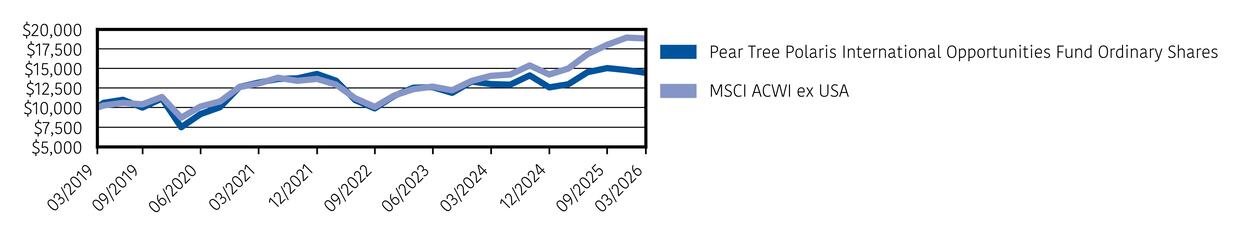
The Fund delivered a strong absolute return but trailed the MSCI ACWI ex USA Index, which was lifted by sharp rallies in headline AI semiconductor names and in Energy, an area where the Fund had limited exposure. Stock selection was strong in the sectors the Fund does emphasize: Materials, Consumer Staples and Utilities, with Taiwan, Italy, Norway and Brazil the largest country contributors. Italy’s SOL S.p.A. led contributors, extending a multi‑year run of robust earnings as its European home‑care services division grew alongside the core industrial gas business. Taiwan’s Yageo Corporation and Hong Kong’s Kingboard Laminates rallied as IT components benefited from AI infrastructure demand, with Kingboard’s copper‑clad laminates a key input for printed circuit boards used in AI and server chips. Norway’s Sparebanken Norge gained as Norges Bank held policy rates at 4%, supporting net interest margins, while Peru’s Credicorp Ltd. expanded margins on loan growth and lower funding costs. Brazil’s Equatorial Energia anchored Utilities on volume growth, tariff adjustments and the profitable sale of its transmission assets. Key detractors included Canada’s goeasy Ltd.; France’s Neurones; Switzerland’s ALSO Holding; China’s Zhongsheng Group; and Thailand’s Krungthai Card.
How did the Fund perform since inception?
CUMULATIVE PERFORMANCE | January 30, 2019 (Commencement of Operations) through March 31, 2026
(Initial Investment of $10,000)
AVERAGE ANNUAL TOTAL RETURNS
|
|
One
Year |
Five
Year |
Since
Inception |
|---|---|---|---|
|
Pear
Tree Polaris International Opportunities Fund Ordinary Shares |
11.31% |
1.84% |
6.25% |
|
MSCI
ACWI ex USA |
25.58% |
7.56% |
9.22% |
Key Fund Statistics
(as of March 31, 2026)
|
Total
Net Assets |
$64,877,205 |
|
Number
of Holdings |
50 |
|
Advisory
Fee |
$496,856 |
|
Portfolio
Turnover |
46% |
What did the Fund invest in?
(as of March 31, 2026)
COUNTRY ALLOCATION
(% of Fund’s net assets)
|
Hong
Kong |
|
|
Taiwan |
|
|
Belgium |
|
|
Japan |
|
|
United
Kingdom |
|
|
China |
|
|
Italy |
|
|
France |
|
|
South
Africa |
|
|
Thailand |
|
|
Norway |
|
|
Brazil |
|
|
Australia |
|
|
Canada |
|
|
Indonesia |
|
|
Ireland |
|
|
Switzerland |
|
|
Mexico |
|
|
Portugal |
|
|
India |
|
|
Malaysia |
|
|
South
Korea |
|
|
Peru |
|
|
United
States |
TOP TEN HOLDINGS
(% of Fund’s net assets)
|
SOL
S.p.A. |
|
|
Cranswick
plc |
|
|
Kingboard
Laminates Holdings, Ltd. |
|
|
Sparebanken
Norge |
|
|
Yageo
Corporation |
|
|
Chailease
Holding Co., Ltd. |
|
|
Equatorial
Energia S.A. |
|
|
Macquarie
Group Limited |
|
|
JAC
Recruitment Co., Ltd. |
|
|
VSTECS
Holdings Limited |
How has the Fund changed?
This is a summary of certain changes to the Fund since April 1, 2025. For more complete information, you may find copies of the Fund’s prospectus, financial information on Form N-CSR (which includes any required tax information for dividends), holdings, proxy voting information, and other information at www.peartreefunds.com/fund-documents/. You also may request this information without charge by contacting Pear Tree Funds at 1-800-326-2151 or info@peartreefunds.com or by contacting your financial intermediary.
During the reporting period, there were no changes to the Ordinary Share Class.
The MSCI does not accept any liability for any errors or omissions in the indexes or data, and hereby expressly disclaims all warranties of originality, accuracy, completeness, timeliness, merchantability and fitness for a particular purpose. No party may rely on any indexes or data contained in this communication. Visit www.peartreefunds.com/fund-documents/ for additional legal notices & disclaimers.
What were the Fund's costs for the last year?
(based on hypothetical $10,000 investment)
|
|
Costs
of a $10,000 investment |
Costs
paid as a percentage of a $10,000 investment |
|---|---|---|
|
Institutional
Shares |
$105 |
0.99% |
What affected the Fund’s performance this period?
The Fund delivered a strong absolute return but trailed the MSCI ACWI ex USA Index, which was lifted by sharp rallies in headline AI semiconductor names and in Energy, an area where the Fund had limited exposure. Stock selection was strong in the sectors the Fund does emphasize: Materials, Consumer Staples and Utilities, with Taiwan, Italy, Norway and Brazil the largest country contributors. Italy’s SOL S.p.A. led contributors, extending a multi‑year run of robust earnings as its European home‑care services division grew alongside the core industrial gas business. Taiwan’s Yageo Corporation and Hong Kong’s Kingboard Laminates rallied as IT components benefited from AI infrastructure demand, with Kingboard’s copper‑clad laminates a key input for printed circuit boards used in AI and server chips. Norway’s Sparebanken Norge gained as Norges Bank held policy rates at 4%, supporting net interest margins, while Peru’s Credicorp Ltd. expanded margins on loan growth and lower funding costs. Brazil’s Equatorial Energia anchored Utilities on volume growth, tariff adjustments and the profitable sale of its transmission assets. Key detractors included Canada’s goeasy Ltd.; France’s Neurones; Switzerland’s ALSO Holding; China’s Zhongsheng Group; and Thailand’s Krungthai Card.
How did the Fund perform since inception?
CUMULATIVE PERFORMANCE | January 30, 2019 (Commencement of Operations) through March 31, 2026
(Initial Investment of $1,000,000)
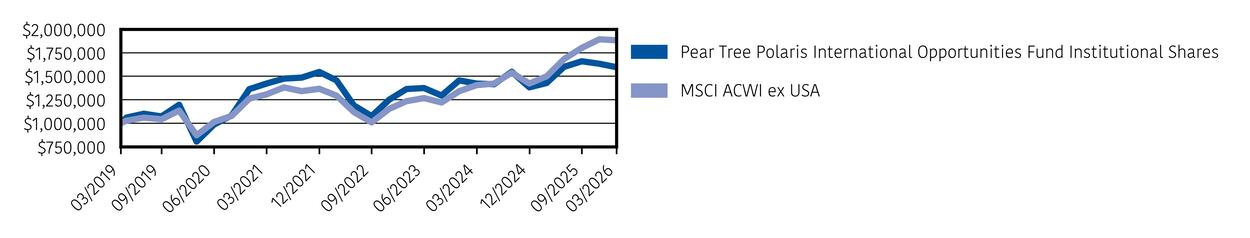
AVERAGE ANNUAL TOTAL RETURNS
|
|
One
Year |
Five
Year |
Since
Inception |
|---|---|---|---|
|
Pear
Tree Polaris International Opportunities Fund Institutional Shares |
11.76% |
2.33% |
6.72% |
|
MSCI
ACWI ex USA |
25.58% |
7.56% |
9.22% |
Key Fund Statistics
(as of March 31, 2026)
|
Total
Net Assets |
$64,877,205 |
|
Number
of Holdings |
50 |
|
Advisory
Fee |
$496,856 |
|
Portfolio
Turnover |
46% |
What did the Fund invest in?
(as of March 31, 2026)
COUNTRY ALLOCATION
(% of Fund’s net assets)
|
Hong
Kong |
|
|
Taiwan |
|
|
Belgium |
|
|
Japan |
|
|
United
Kingdom |
|
|
China |
|
|
Italy |
|
|
France |
|
|
South
Africa |
|
|
Thailand |
|
|
Norway |
|
|
Brazil |
|
|
Australia |
|
|
Canada |
|
|
Indonesia |
|
|
Ireland |
|
|
Switzerland |
|
|
Mexico |
|
|
Portugal |
|
|
India |
|
|
Malaysia |
|
|
South
Korea |
|
|
Peru |
|
|
United
States |
TOP TEN HOLDINGS
(% of Fund’s net assets)
|
SOL
S.p.A. |
|
|
Cranswick
plc |
|
|
Kingboard
Laminates Holdings, Ltd. |
|
|
Sparebanken
Norge |
|
|
Yageo
Corporation |
|
|
Chailease
Holding Co., Ltd. |
|
|
Equatorial
Energia S.A. |
|
|
Macquarie
Group Limited |
|
|
JAC
Recruitment Co., Ltd. |
|
|
VSTECS
Holdings Limited |
How has the Fund changed?
This is a summary of certain changes to the Fund since April 1, 2025. For more complete information, you may find copies of the Fund’s prospectus, financial information on Form N-CSR (which includes any required tax information for dividends), holdings, proxy voting information, and other information at www.peartreefunds.com/fund-documents/. You also may request this information without charge by contacting Pear Tree Funds at 1-800-326-2151 or info@peartreefunds.com or by contacting your financial intermediary.
On July 31, 2025, a contractual agreement for the Manager to reimburse with respect to the Institutional Shares a portion of expenses in an amount equal to 0.10 percent per annum terminated and reimbursements terminated for all periods after that date. The contract to reimburse expenses of Institutional Shares, such that 'Total Annual Fund Operating Expenses after Fee Waiver and/or Expense Reimbursement', other than extraordinary expenses is not greater than 0.99 percent remains in place and was extended through July 31, 2026.
The MSCI does not accept any liability for any errors or omissions in the indexes or data, and hereby expressly disclaims all warranties of originality, accuracy, completeness, timeliness, merchantability and fitness for a particular purpose. No party may rely on any indexes or data contained in this communication. Visit www.peartreefunds.com/fund-documents/ for additional legal notices & disclaimers.
What were the Fund's costs for the last year?
(based on hypothetical $10,000 investment)
|
|
Costs
of a $10,000 investment |
Costs
paid as a percentage of a $10,000 investment |
|---|---|---|
|
R6
Shares |
$102 |
0.96% |
What affected the Fund’s performance this period?
The Fund delivered a strong absolute return but trailed the MSCI ACWI ex USA Index, which was lifted by sharp rallies in headline AI semiconductor names and in Energy, an area where the Fund had limited exposure. Stock selection was strong in the sectors the Fund does emphasize: Materials, Consumer Staples and Utilities, with Taiwan, Italy, Norway and Brazil the largest country contributors. Italy’s SOL S.p.A. led contributors, extending a multi‑year run of robust earnings as its European home‑care services division grew alongside the core industrial gas business. Taiwan’s Yageo Corporation and Hong Kong’s Kingboard Laminates rallied as IT components benefited from AI infrastructure demand, with Kingboard’s copper‑clad laminates a key input for printed circuit boards used in AI and server chips. Norway’s Sparebanken Norge gained as Norges Bank held policy rates at 4%, supporting net interest margins, while Peru’s Credicorp Ltd. expanded margins on loan growth and lower funding costs. Brazil’s Equatorial Energia anchored Utilities on volume growth, tariff adjustments and the profitable sale of its transmission assets. Key detractors included Canada’s goeasy Ltd.; France’s Neurones; Switzerland’s ALSO Holding; China’s Zhongsheng Group; and Thailand’s Krungthai Card.
How did the Fund perform since inception?
CUMULATIVE PERFORMANCE | January 30, 2019 (Commencement of Operations) through March 31, 2026
(Initial Investment of $100,000)
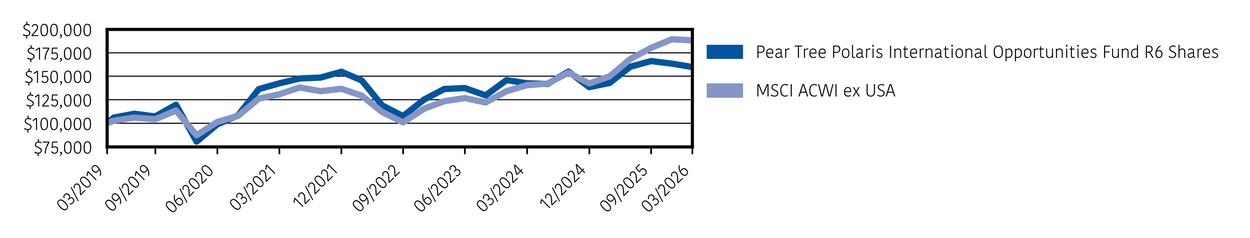
AVERAGE ANNUAL TOTAL RETURNS
|
|
One
Year |
Five
Year |
Since
Inception |
|---|---|---|---|
|
Pear
Tree Polaris International Opportunities Fund R6 Shares |
11.90% |
2.34% |
6.75% |
|
MSCI
ACWI ex USA |
25.58% |
7.56% |
9.22% |
Key Fund Statistics
(as of March 31, 2026)
|
Total
Net Assets |
$64,877,205 |
|
Number
of Holdings |
50 |
|
Advisory
Fee |
$496,856 |
|
Portfolio
Turnover |
46% |
What did the Fund invest in?
(as of March 31, 2026)
COUNTRY ALLOCATION
(% of Fund’s net assets)
|
Hong
Kong |
|
|
Taiwan |
|
|
Belgium |
|
|
Japan |
|
|
United
Kingdom |
|
|
China |
|
|
Italy |
|
|
France |
|
|
South
Africa |
|
|
Thailand |
|
|
Norway |
|
|
Brazil |
|
|
Australia |
|
|
Canada |
|
|
Indonesia |
|
|
Ireland |
|
|
Switzerland |
|
|
Mexico |
|
|
Portugal |
|
|
India |
|
|
Malaysia |
|
|
South
Korea |
|
|
Peru |
|
|
United
States |
TOP TEN HOLDINGS
(% of Fund’s net assets)
|
SOL
S.p.A. |
|
|
Cranswick
plc |
|
|
Kingboard
Laminates Holdings, Ltd. |
|
|
Sparebanken
Norge |
|
|
Yageo
Corporation |
|
|
Chailease
Holding Co., Ltd. |
|
|
Equatorial
Energia S.A. |
|
|
Macquarie
Group Limited |
|
|
JAC
Recruitment Co., Ltd. |
|
|
VSTECS
Holdings Limited |
How has the Fund changed?
This is a summary of certain changes to the Fund since April 1, 2025. For more complete information, you may find copies of the Fund’s prospectus, financial information on Form N-CSR (which includes any required tax information for dividends), holdings, proxy voting information, and other information at www.peartreefunds.com/fund-documents/. You also may request this information without charge by contacting Pear Tree Funds at 1-800-326-2151 or info@peartreefunds.com or by contacting your financial intermediary.
During the reporting period, there were no changes to the R6 Share Class.
The MSCI does not accept any liability for any errors or omissions in the indexes or data, and hereby expressly disclaims all warranties of originality, accuracy, completeness, timeliness, merchantability and fitness for a particular purpose. No party may rely on any indexes or data contained in this communication. Visit www.peartreefunds.com/fund-documents/ for additional legal notices & disclaimers.
| [1] | The percentage would have been 1.45% if the Trust did not engage a third party to assist in reclaiming EU tax overpayments made by the Fund. |
| [2] | The percentage would have been 1.08% if the Trust did not engage a third party to assist in reclaiming EU tax overpayments made by the Fund. |
| [3] | The percentage would have been 0.94% if the Trust did not engage a third party to assist in reclaiming EU tax overpayments made by the Fund. |
| [4] | The percentage would have been 1.44% if the Trust did not engage a third party to assist in reclaiming EU tax overpayments made by the Fund. |
| [5] | The percentage would have been 1.07% if the Trust did not engage a third party to assist in reclaiming EU tax overpayments made by the Fund. |
| [6] | The percentage would have been 1.03% if the Trust did not engage a third party to assist in reclaiming EU tax overpayments made by the Fund. |