Shareholder Report
Mar. 31, 2026
USD ($)
holding
This annual shareholder report contains important information about the Bridges Capital Tactical ETF (the “Fund”) for the period of April 1, 2025 to March 31, 2026 (the “Period”). You can also find additional information at https://bridgesetf.com/. You can also request this information by contacting us at (215) 330-4476. | |||||||||||
Availability of Additional Information
For additional information about the Fund, including its prospectus, financial information, holdings, and proxy information, visit https://bridgesetf.com/. You can also request information by calling (215) 330-4476.
Householding
Householding is an option available to certain investors of the Fund. Householding is a method of delivery, based on the preference of the individual investor, in which a single copy of certain shareholder documents can be delivered to investors who share the same address, even if their accounts are registered under different names. Householding for the Fund is available through certain broker-dealers. If you are interested in enrolling in householding and receiving a single copy of prospectuses and other shareholder documents or you are currently enrolled in householding and wish to change your householding status, please contact your broker-dealer.
| WHAT WERE THE FUND COSTS FOR THE PERIOD? (based on a hypothetical $10,000 investment) | |||||||||||
| COST OF $10,000 INVESTMENT | COST PAID AS A PERCENTAGE OF $10,000 INVESTMENT | ||||||||||
| $82 | 0.78% | ||||||||||
| WHAT FACTORS INFLUENCED PERFORMANCE FOR THE PERIOD? | |||||||||||
During the Period, the Sub-Adviser maintained its commitment to active risk management and managed the Fund with a bias that markets may remain in the late stages of the business cycle that began in May of 2020. This approach resulted in the Fund capturing a portion of the S&P 500 returns, while holding approximately 40-80% cash and cash alternatives for most of the Period.
The Fund’s allocation utilized tranches to tax-efficiently scale into and out of equities based on the proprietary breadth indicators of the overall equity markets. This process is independent of market headlines, removing any manager’s assumption of the market response to a particular event.
The Fund’s performance over the Period demonstrated less volatility, smaller drawdowns, and faster recovery than the S&P 500 benchmark and then grew at a slower pace than the benchmark once the breadth indicators signaled strong but weakening breadth. In April 2025, the benchmark S&P 500 experienced a meaningful drawdown from the recent highs of February 2025 due in part to headlines around tariffs. The Fund maintained its focus on breadth indicators and was allocated to roughly 68% cash or cash alternatives prior to the decline of the benchmark. This contributed to the Fund experiencing a smaller drawdown than the benchmark during this period of volatility. The Fund experienced approximately a 9% drawdown from recent highs. The Fund made multiple purchases of equities and reduced its cash and cash alternative allocation during the month of March 2025 through April 2025. This rebalancing allowed the Fund to take advantage of lower prices in large-cap equities, while not experiencing the same level of drawdown. During the following months, the Fund tax-efficiently sold portions of the equity allocation, building the cash and cash alternative portion back to approximately 78% of the allocation by mid-August 2025. This process of management allowed the Fund to benefit from growth of the benchmark during the Period with lower volatility. However, as expected with this process seeking lower volatility, when the benchmark continued to make new highs, the growth of the Fund slowed in relation to the overall benchmark. The Fund’s risk management process of utilizing breadth indicators as the primary signal to take on more or less risk demonstrated success during the Period.
| HOW DID THE FUND PERFORM FOR THE PERIOD? | |||||||||||
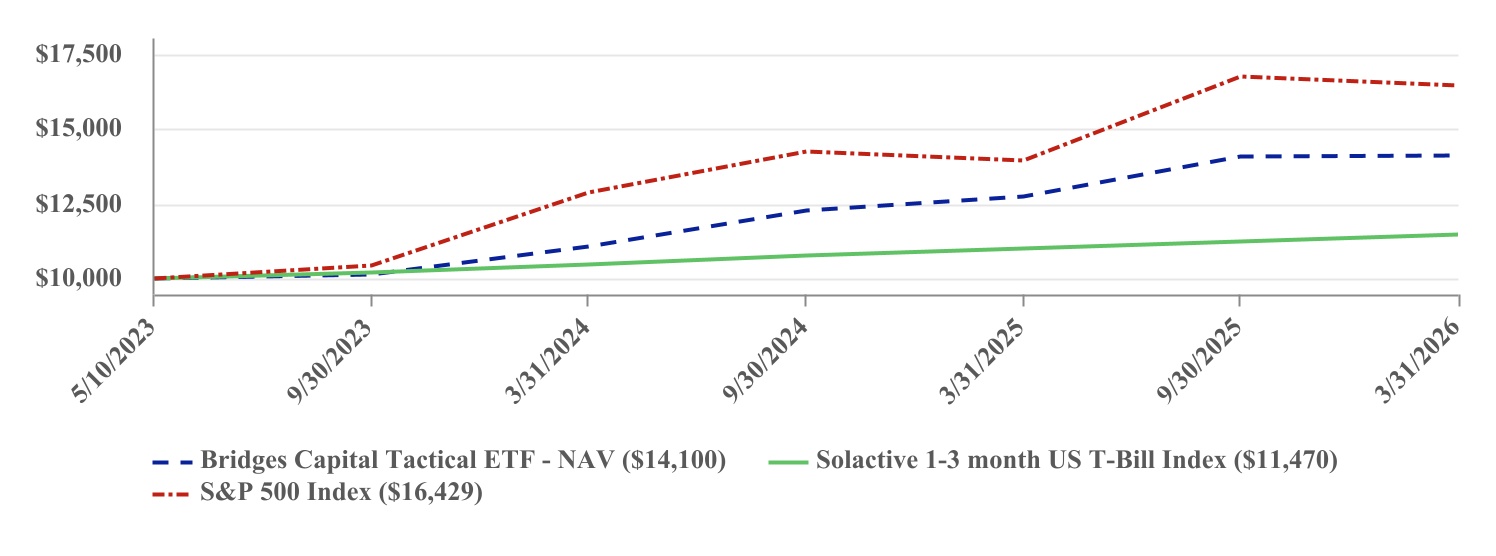
| PERFORMANCE | ||||||||
| One Year | Since Inception (5/10/2023 ) | |||||||
| Bridges Capital Tactical ETF- NAV | 10.69% | 12.61% | ||||||
| Solactive 1-3 Month US T-Bill Index | 4.13% | 4.86% | ||||||
| S&P 500 Index | 17.80% | 18.72% | ||||||
The Fund’s past performance is not a good predictor of how the Fund will perform in the future. The graph and table do not reflect the deduction of taxes that a shareholder would pay on fund distributions or redemption of fund shares. Visit https://bridgesetf.com/ for more recent performance information. | ||||||||
| KEY FUND STATISTICS (as of Period End) | ||||||||||||||||||||
| Net Assets | $40,375,351 | Portfolio Turnover Rate* | 381% | |||||||||||||||||
| # of Portfolio Holdings | 15 | Advisory Fees Paid | $303,400 | |||||||||||||||||
| *Portfolio turnover is not annualized and is calculated without regard to short-term securities having a maturity of less than one year. Excludes impact of in-kind transactions. | ||||||||||||||||||||
| ASSET WEIGHTING (as a % of Net Assets) | |||||
| Fixed Income ETF | 48.9% | ||||
| Information Technology | 21.7% | ||||
| Communication Services | 12.2% | ||||
| Consumer Discretionary | 7.9% | ||||
| U.S. Treasury Bills | 5.9% | ||||
| Domestic Stock ETF | 3.1% | ||||
| Cash and Cash Equivalents | 0.3% | ||||
| TOP 10 HOLDINGS (as a % of Net Assets) | |||||
| Alpha Architect 1-3 Month Box ETF | 48.9% | ||||
| United States Treasury Bill, 3.56%, 05/28/2026 | 5.8% | ||||
| Netflix, Inc. | 4.6% | ||||
| Advanced Micro Devices, Inc. | 4.2% | ||||
| Tesla, Inc. | 3.9% | ||||
| Amazon.com, Inc. | 3.9% | ||||
| Palantir Technologies, Inc. - Class A | 3.9% | ||||
| Broadcom, Inc. | 3.8% | ||||
| Alphabet, Inc. - Class C | 3.8% | ||||
| Meta Platforms, Inc. - Class A | 3.8% | ||||