Shareholder Report
Mar. 31, 2026
USD ($)
holding
Mar. 31, 2026
USD ($)
holding
This annual shareholder report contains important information about the Euclidean Fundamental Value ETF (the “Fund”) for the period of April 1, 2025 to March 31, 2026 (the “Period”). You can find additional information about the Fund at https://euclideanetf.com. You can also request this information by contacting us at (215) 330-4476. | |||||||||||
Availability of Additional Information
For additional information about the Fund, including its prospectus, financial information, holdings, and proxy information, visit https://euclideanetf.com. You can also request information by calling (215) 330-4476.
Householding
Householding is an option available to certain investors of the Fund. Householding is a method of delivery, based on the preference of the individual investor, in which a single copy of certain shareholder documents can be delivered to investors who share the same address, even if their accounts are registered under different names. Householding for the Fund is available through certain broker-dealers. If you are interested in enrolling in householding and receiving a single copy of prospectuses and other shareholder documents or you are currently enrolled in householding and wish to change your householding status, please contact your broker-dealer.
| WHAT WERE THE FUND COSTS FOR THE PERIOD? (based on a hypothetical $10,000 investment) | |||||||||||
| COST OF $10,000 INVESTMENT | COST PAID AS A PERCENTAGE OF $10,000 INVESTMENT | ||||||||||
| $105 | 0.95% | ||||||||||
| WHAT FACTORS INFLUENCED PERFORMANCE FOR THE PERIOD? | |||||||||||
For the Period, the Fund outperformed its broad-based benchmark, the S&P 500 Index, primarily due to sector allocation and security selection.
During the Period, the Fund had meaningful exposure to companies in the Materials and Energy sectors. Holdings in these sectors benefited from firmer commodity prices and improving demand conditions over the course of the Period and contributed positively to the Fund's returns.
The Fund continued to have little exposure to the largest-capitalization names in the Information Technology and Communication Services sectors that drove meaningful portion of the S&P 500 Index's returns in the prior fiscal year. During the Period, the relative contribution of these mega-capitalization names to the S&P 500 Index's return moderated performance.
During the Period, the Fund continued to execute its strategy of systematically investing, based on its quantitative models, in companies believed to be of high-quality and attractively valued. This approach can result in higher differentiation from the benchmark and may lead to performance differences from the benchmark.
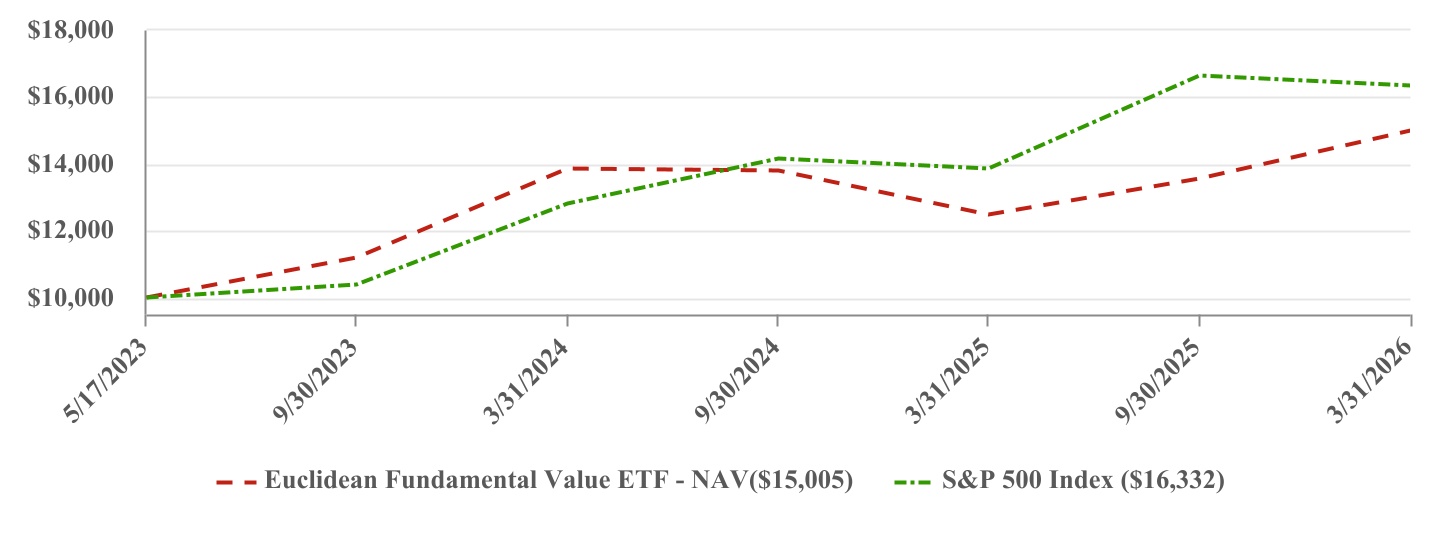
| PERFORMANCE | ||||||||
| One Year | Since Inception (5/17/2023) | |||||||
| Euclidean Fundamental Value ETF - NAV | 20.38% | 15.17% | ||||||
| S&P 500 Index | 17.80% | 18.61% | ||||||
The Fund’s past performance is not a good predictor of how the Fund will perform in the future. The graph and table do not reflect the deduction of taxes that a shareholder would pay on Fund distributions or redemption of Fund shares. Visit https://euclideanetf.com for more recent performance information. | ||||||||
| KEY FUND STATISTICS (as of Period End) | ||||||||||||||||||||
| Net Assets | $149,243,652 | Portfolio Turnover Rate* | 60% | |||||||||||||||||
| # of Portfolio Holdings | 63 | Advisory Fees Paid | $1,318,975 | |||||||||||||||||
| *Portfolio turnover is not annualized and is calculated without regard to short-term securities having a maturity of less than one year. Excludes impact of in-kind transactions. | ||||||||||||||||||||
| SECTOR WEIGHTING (as a % of Net Assets) | |||||
| Consumer Discretionary | 26.6% | ||||
| Energy | 16.7% | ||||
| Industrials | 16.2% | ||||
| Materials | 11.9% | ||||
| Health Care | 11.3% | ||||
| Consumer Staples | 7.7% | ||||
| Communication Services | 3.4% | ||||
| Information Technology | 2.5% | ||||
| Utilities | 1.4% | ||||
| Cash and Cash Equivalents | 2.3% | ||||
| TOP 10 HOLDINGS (as a % of Net Assets) | |||||
| Alcoa Corp. | 3.2% | ||||
| Mueller Industries, Inc. | 2.5% | ||||
| Photronics, Inc. | 2.5% | ||||
| Newmont Corp. | 2.5% | ||||
| APA Corp. | 2.5% | ||||
| CF Industries Holdings, Inc. | 2.4% | ||||
| Perdoceo Education Corp. | 2.4% | ||||
| Oshkosh Corp. | 2.2% | ||||
| Laureate Education, Inc. | 2.2% | ||||
| Allison Transmission Holdings, Inc. | 2.2% | ||||