AMC Consultants (UK) Limited
Registered in England and Wales No. 3688365
Office 336a, Davidson House, Forbury Square
Reading RG1 3EU
United Kingdom

Exhibit 96.1
|
AMC Consultants (UK) Limited Registered in England and Wales No. 3688365
Office 336a, Davidson House, Forbury Square Reading RG1 3EU United Kingdom |
|
| T | +44 1628 778 256 | |
| E | unitedkingdom@amcconsultants.com |
amcconsultants.com
Report
S-K 1300 Technical Report Summary: KCM Integrated Operations (Initial Assessment)
Konkola Copper Mines Plc
AMC Project 0424076
2 June 2026
mine smarter
| S-K 1300 TRS: KCM Integrated Operations (Initial Assessment) | |
| Konkola Copper Mines Plc | 0424076 |
QUALIFIED PERSON — DATE AND SIGNATURE PAGE
This Technical Report Summary has been prepared by AMC Consultants (UK) Limited, acting as the Qualified Person for all sections of this report. In accordance with Instruction 5 to Item 601(b)(96) of Regulation S-K, AMC Consultants (UK) Limited is an entity that satisfies the requirements of a qualified person under § 229.1300(b) and assumes responsibility for the Technical Report Summary as a whole.
AMC Consultants (UK) Limited confirms that it has the relevant experience, competence, and professional qualifications required to prepare and take responsibility for all sections of this TRS. The individual professionals within AMC who contributed to this report possess qualifications and experience appropriate to the subject matter of their contributions and are members of recognised professional organizations.
| Qualified Person: | Sections Responsible: |
|
AMC Consultants (UK) Limited Registered in England and Wales No. 3688365 Office 336a, Davidson House, Forbury Square Reading RG1 3EU, United Kingdom |
All sections (Sections 1 through 25) |
| Signature: | Date: |
| Karl van Olden | 2 June 2026 |
|
Authorized Signatory AMC Consultants (UK) Limited |
| Effective Date of TRS: | 1 April 2026 |
| Date of Report: | 2 June 2026 |
| AMC Project Number: | 0424076 |
Note: Pursuant to Instruction 5 to Item 601(b)(96), where an entity rather than an individual serves as the qualified person, the entity assumes responsibility for the Technical Report Summary. The authorized signatory executes this page on behalf of AMC Consultants (UK) Limited in its capacity as Qualified Person.
| amcconsultants.com | i |
| S-K 1300 TRS: KCM Integrated Operations (Initial Assessment) | |
| Konkola Copper Mines Plc | 0424076 |
|
CAUTIONARY STATEMENT - INITIAL ASSESSMENT
This Initial Assessment is preliminary in nature. It includes Inferred Mineral Resources that are considered too speculative geologically to have the economic considerations applied to them that would enable them to be categorised as Mineral Reserves, and there is no certainty that this Initial Assessment will be realised. Mineral Resources that are not Mineral Reserves do not have demonstrated economic viability.
|
|
INFERRED MINERAL RESOURCE PROPORTION
Approximately 63% of KCM Mineral Resources are classified as Inferred (483 Mt of 773 Mt). At Konkola Mine, approximately 87% of Mineral Resources are classified as Inferred (249 Mt of 288 Mt). Inferred Mineral Resources have a lower level of confidence and cannot be converted to Mineral Reserves. It is reasonably expected that the majority of Inferred Resources could be upgraded with continued exploration.
|
|
IMPORTANT NOTICE - INITIAL ASSESSMENT
This Technical Report Summary has been prepared as an INITIAL ASSESSMENT in accordance with Subpart 1300 of Regulation S-K (17 CFR Part 229, Subpart 1300). This document presents economic analysis for the full KCM Operations based on all Mineral Resources, with the Measured and Indicated Case (M&I Case) providing results excluding Inferred Mineral Resources. A separate Preliminary Feasibility Study Technical Report Summary has been prepared for the Mineral Reserve portion only, demonstrating economic viability based exclusively on Mineral Reserves.
|
| amcconsultants.com | ii |
| S-K 1300 TRS: KCM Integrated Operations (Initial Assessment) | |
| Konkola Copper Mines Plc | 0424076 |
Contents
| 1 | Executive summary | 19 | |||
| 1.1 | Introduction | 19 | |||
| 1.2 | Property description and ownership | 19 | |||
| 1.3 | Mineral rights | 20 | |||
| 1.4 | Geology and mineralisation | 21 | |||
| 1.4.1 | Regional geological setting | 21 | |||
| 1.4.2 | Mineralisation characteristics | 21 | |||
| 1.4.3 | Structural and hydrothermal influences | 21 | |||
| 1.5 | Exploration and drilling status | 21 | |||
| 1.5.1 | Konkola | 21 | |||
| 1.5.2 | Nchanga | 22 | |||
| 1.5.3 | Tailings dams | 22 | |||
| 1.6 | Mineral Resource estimate | 23 | |||
| 1.7 | Mineral Reserve estimate | 24 | |||
| 1.8 | Development and operational status | 24 | |||
| 1.8.1 | Konkola | 25 | |||
| 1.8.2 | Nchanga | 25 | |||
| 1.9 | Mining methods | 26 | |||
| 1.10 | Processing and recovery methods | 26 | |||
| 1.11 | Infrastructure | 28 | |||
| 1.12 | Economic analysis summary - dual presentation | 29 | |||
| 1.12.1 | Key assumptions | 30 | |||
| 1.12.2 | Production plan | 30 | |||
| 1.12.3 | Capital and operating costs | 33 | |||
| 1.12.3.1 | Economic results | 37 | |||
| 1.13 | Sensitivity analysis | 38 | |||
| 1.14 | Environmental studies, permitting, and social or community impact | 40 | |||
| 1.15 | Qualified Person's conclusions | 41 | |||
| 1.15.1 | Initial Assessment status | 41 | |||
| 1.15.2 | Economic assessment | 41 | |||
| 1.15.3 | The QP recommends | 41 | |||
| 2 | Introduction | 42 | |||
| 2.1 | Registrant for whom the TRS was prepared | 42 | |||
| 2.2 | Terms of reference and purpose | 42 | |||
| 2.3 | Units of measure | 42 | |||
| 2.4 | Defined terms and abbreviations | 43 | |||
| 2.5 | Sources of information | 45 | |||
| 2.6 | Personal inspection of the property | 45 | |||
| 2.7 | Summary of previously filed technical report | 46 | |||
| 2.8 | Qualified Persons | 46 | |||
| 2.9 | Reliance on the registrant | 46 | |||
| 3 | Property description | 47 | |||
| 3.1 | Property description | 47 | |||
| 3.2 | Project location | 48 | |||
| 3.3 | Ownership | 51 | |||
| 3.4 | Mineral rights | 51 | |||
| 3.5 | Description of property rights | 52 | |||
| 3.6 | Infrastructure and access | 52 | |||
| 3.7 | Royalty payments and fiscal obligations | 53 | |||
| 3.8 | Significant encumbrances to the property | 53 | |||
| 3.8.1 | Environmental compliance obligations | 53 | |||
| amcconsultants.com | iii |
| S-K 1300 TRS: KCM Integrated Operations (Initial Assessment) | |
| Konkola Copper Mines Plc | 0424076 |
| 3.8.2 | Permit conditions | 54 | ||
| 3.8.3 | Social and land use obligations | 54 | ||
| 3.9 | Significant factors and risks affecting access | 54 | ||
| 3.9.1 | Operational risks | 54 | ||
| 3.9.2 | Regulatory and social risks | 55 | ||
| 3.10 | Adjacent properties | 55 | ||
| 4 | Accessibility, climate, local resources, infrastructure, and physiography | 57 | ||
| 4.1 | Topography and land description | 57 | ||
| 4.1.1 | Flora and fauna | 57 | ||
| 4.2 | Access to the property | 57 | ||
| 4.2.1 | Regional access | 57 | ||
| 4.2.2 | Inter-site access and product transport routes | 58 | ||
| 4.3 | Climate description | 59 | ||
| 4.4 | Availability of required infrastructure | 60 | ||
| 4.4.1 | Power | 60 | ||
| 4.4.2 | Water | 60 | ||
| 4.4.3 | Supplies | 60 | ||
| 4.4.4 | Personnel | 60 | ||
| 5 | History | 61 | ||
| 5.1 | Early exploration and discovery (pre-1950) | 61 | ||
| 5.1.1 | Nchanga | 61 | ||
| 5.1.2 | Konkola | 61 | ||
| 5.2 | Systematic development and state ownership (1950s–1999) | 61 | ||
| 5.2.1 | Expansion under colonial and early independence era (1950s–1969) | 61 | ||
| 5.2.2 | Nationalisation and ZCCM era (1969–1999) | 62 | ||
| 5.3 | Privatisation and Anglo American Corporation (2000–2002) | 62 | ||
| 5.4 | Vedanta Resources (2004–2019) | 62 | ||
| 5.5 | Provisional liquidation (2019–2024) | 63 | ||
| 5.5.1 | Production curtailment | 63 | ||
| 5.5.2 | Exploration and development activity | 64 | ||
| 5.5.3 | Infrastructure condition | 64 | ||
| 5.5.4 | Resolution and resumption of control | 64 | ||
| 5.6 | Production history | 64 | ||
| 5.7 | Key development milestones | 66 | ||
| 6 | Geological setting and mineralisation | 67 | ||
| 6.1 | Regional geology | 67 | ||
| 6.1.1 | Lithostratigraphy of the Central African Copperbelt | 68 | ||
| 6.1.2 | Mineralisation genesis | 69 | ||
| 6.1.3 | Structural and tectonic evolution | 70 | ||
| 6.2 | Konkola local geology | 70 | ||
| 6.2.1 | Mineralisation | 72 | ||
| 6.2.2 | Major structural controls on mineralisation | 75 | ||
| 6.3 | Nchanga local geology | 76 | ||
| 6.3.1 | Mineralisation | 76 | ||
| 6.3.2 | Major structural controls on mineralisation | 76 | ||
| 6.4 | Summary of geological characteristics | 77 | ||
| 7 | Exploration | 78 | ||
| 7.1 | Exploration history – Konkola and Nchanga | 78 | ||
| 7.2 | Drilling methods | 79 | ||
| 7.3 | Core recovery | 79 | ||
| 7.4 | Core logging | 80 | ||
| 7.5 | Sample selection | 80 | ||
| amcconsultants.com | iv |
| S-K 1300 TRS: KCM Integrated Operations (Initial Assessment) | |
| Konkola Copper Mines Plc | 0424076 |
| 7.6 | QAQC program | 80 | |||
| 7.7 | Konkola Mine | 81 | |||
| 7.7.1 | Drillhole locations | 81 | |||
| 7.7.2 | Hydrogeology | 82 | |||
| 7.7.3 | Exploration program summary | 82 | |||
| 7.8 | Nchanga Business Unit | 82 | |||
| 7.8.1 | Drillhole locations | 82 | |||
| 7.8.2 | Hydrogeology | 85 | |||
| 7.8.3 | Future drilling program summary | 85 | |||
| 7.9 | Geotechnical data, testing, and analysis | 86 | |||
| 7.9.1 | Konkola | 86 | |||
| 7.9.1.1 | Geotechnical drilling | 86 | |||
| 7.9.1.2 | Geotechnical testing | 86 | |||
| 7.9.1.3 | Seismicity | 86 | |||
| 7.9.1.4 | In situ stress | 87 | |||
| 7.9.1.5 | Groundwater | 87 | |||
| 7.9.2 | Nchanga | 88 | |||
| 8 | Sample preparation, analyses, and security | 89 | |||
| 8.1 | Hard rock samples | 89 | |||
| 8.1.1 | Sample preparation and analysis | 89 | |||
| 8.1.2 | Sample preparation method | 89 | |||
| 8.1.3 | Analytical method | 89 | |||
| 8.1.4 | Bulk density measurement | 89 | |||
| 8.2 | Tailings samples | 90 | |||
| 8.2.1 | TD03 and TD04 | 90 | |||
| 8.2.1.1 | Sample preparation and analysis | 90 | |||
| 8.2.1.2 | Sample preparation method | 90 | |||
| 8.2.1.3 | Analytical method | 90 | |||
| 8.2.1.4 | Bulk density measurement | 90 | |||
| 8.2.2 | TD05 | 91 | |||
| 8.2.2.1 | Sample preparation and analysis | 91 | |||
| 8.2.2.2 | Sample preparation method | 91 | |||
| 8.2.2.3 | Analytical method | 91 | |||
| 8.2.2.4 | Bulk density measurement | 91 | |||
| 8.3 | Quality assurance quality control program | 93 | |||
| 8.4 | Sample security | 93 | |||
| 8.5 | Quality assurance quality control – Konkola | 94 | |||
| 8.5.1 | Konkola | 94 | |||
| 8.5.1.1 | CRM | 94 | |||
| 8.5.1.2 | Repeats | 98 | |||
| 8.5.1.3 | Blanks | 99 | |||
| 8.6 | Quality assurance quality control - Nchanga | 99 | |||
| 8.6.1 | Chingola Open Pit C and E Extension (COP E Ext) | 100 | |||
| 8.6.1.1 | CRM | 100 | |||
| 8.6.1.2 | Repeats | 101 | |||
| 8.6.2 | TD03 and TD04 | 102 | |||
| 8.6.3 | TD05 | 102 | |||
| 8.6.4 | QAQC conclusion | 108 | |||
| 8.7 | Qualified Person’s opinion | 109 | |||
| 8.7.1 | Historical data | 109 | |||
| 8.7.2 | Sample security | 109 | |||
| 8.7.3 | QP's opinion on sample preparation, security and analytical procedures | 109 | |||
| 8.8 | QAQC recommendations | 111 | |||
| amcconsultants.com | v |
| S-K 1300 TRS: KCM Integrated Operations (Initial Assessment) | |
| Konkola Copper Mines Plc | 0424076 |
| 9 | Data verification | 112 | |||
| 9.1 | Historic data | 112 | |||
| 9.2 | Modern data | 112 | |||
| 9.2.1 | Database | 112 | |||
| 9.2.2 | Exported data validation | 112 | |||
| 9.2.3 | Data verification | 113 | |||
| 9.2.4 | Database security | 113 | |||
| 9.3 | Data verification limitations - Konkola | 113 | |||
| 9.4 | Data verification limitations - Nchanga | 114 | |||
| 9.5 | Qualified Person’s opinion | 115 | |||
| 9.5.1 | Historical data | 115 | |||
| 9.5.2 | Modern data | 115 | |||
| 9.5.3 | Assessment of identified verification limitations | 115 | |||
| 9.5.4 | Data adequacy conclusion | 116 | |||
| 10 | Mineral processing and metallurgical testing | 117 | |||
| 10.1 | Testing nature, extent, and analytical procedures | 117 | |||
| 10.2 | Testing laboratories | 118 | |||
| 10.3 | Test sample representativity | 118 | |||
| 10.4 | Testing results, assumptions, and deleterious elements | 119 | |||
| 10.4.1 | Konkola concentrator | 119 | |||
| 10.4.2 | Nchanga TLP | 119 | |||
| 10.4.3 | Nchanga TLP and Elevated Temperature Leach Technology | 121 | |||
| 10.4.4 | TD05 metallurgical test work | 121 | |||
| 10.5 | Qualified Person’s opinion | 123 | |||
| 11 | Mineral Resource estimates | 124 | |||
| 11.1 | Introduction | 124 | |||
| 11.2 | KCM Integrated Operations - Mineral Resources | 125 | |||
| 11.2.1 | Mineral Resource uncertainty | 126 | |||
| 11.2.2 | Cut-off grade derivation | 127 | |||
| 11.3 | Konkola | 128 | |||
| 11.3.1 | Data | 129 | |||
| 11.3.2 | Geological interpretation | 130 | |||
| 11.3.2.1 | Estimation domains | 132 | |||
| 11.3.2.2 | Definition of hangingwall and footwall surfaces | 132 | |||
| 11.3.3 | Statistics and compositing | 139 | |||
| 11.3.3.1 | Variography | 141 | |||
| 11.3.4 | Block model and estimation parameters | 142 | |||
| 11.3.4.1 | Estimation parameters | 143 | |||
| 11.3.4.2 | Bulk density | 143 | |||
| 11.3.5 | Block model validation | 144 | |||
| 11.3.5.1 | Swath plots | 144 | |||
| 11.3.5.2 | Visual validation | 146 | |||
| 11.3.5.3 | Statistical validation | 147 | |||
| 11.3.6 | Classification criteria | 149 | |||
| 11.3.7 | Mineral Resource uncertainty | 150 | |||
| 11.3.8 | Mineral Resource Estimate | 150 | |||
| 11.4 | Nchanga assets | 151 | |||
| 11.4.1 | Chingola open pit D and F (COP DF) | 151 | |||
| 11.4.1.1 | Data | 151 | |||
| 11.4.1.2 | Geological interpretation and generation of 3D representation | 152 | |||
| 11.4.1.3 | Statistics and compositing | 152 | |||
| 11.4.1.4 | Block model and estimation parameters | 153 | |||
| 11.4.1.5 | Bulk density | 154 | |||
| amcconsultants.com | vi |
| S-K 1300 TRS: KCM Integrated Operations (Initial Assessment) | |
| Konkola Copper Mines Plc | 0424076 |
| 11.4.1.6 | Estimation validation | 154 | |||
| 11.4.1.7 | Classification criteria | 155 | |||
| 11.4.1.8 | Mineral Resource uncertainty | 156 | |||
| 11.4.1.9 | Mineral Resource estimate | 156 | |||
| 11.4.2 | Chingola Open Pit C and E Extension (COP E Ext) | 157 | |||
| 11.4.2.1 | Data | 157 | |||
| 11.4.2.2 | Geological interpretation and generation of 3D representation | 158 | |||
| 11.4.2.3 | Statistics and compositing | 160 | |||
| 11.4.2.4 | Block model and estimation parameters | 161 | |||
| 11.4.2.5 | Bulk density | 162 | |||
| 11.4.2.6 | Estimation validation | 162 | |||
| 11.4.2.7 | Classification criteria | 163 | |||
| 11.4.2.8 | Mineral Resource uncertainty | 165 | |||
| 11.4.2.9 | Mineral Resource estimate | 165 | |||
| 11.4.3 | Tailings dams TD03 and TD04 | 166 | |||
| 11.4.3.1 | Data | 166 | |||
| 11.4.3.2 | Generation of volume / tonnage and grade | 166 | |||
| 11.4.3.3 | Mining, processing, and recovery | 167 | |||
| 11.4.3.4 | Classification criteria | 167 | |||
| 11.4.3.5 | Mineral Resource uncertainty | 168 | |||
| 11.4.3.6 | Mineral Resource estimate | 168 | |||
| 11.4.4 | Tailings dam TD05 (Muntimpa) | 168 | |||
| 11.4.4.1 | Data | 169 | |||
| 11.4.4.2 | Generation of volume / tonnage | 170 | |||
| 11.4.4.3 | Statistics and compositing | 170 | |||
| 11.4.4.4 | Block model and estimation parameters | 173 | |||
| 11.4.4.5 | Bulk density | 174 | |||
| 11.4.4.6 | Estimation validation | 174 | |||
| 11.4.4.7 | Classification criteria | 176 | |||
| 11.4.4.8 | Mineral Resource uncertainty | 178 | |||
| 11.4.4.9 | Mineral Resource estimate | 178 | |||
| 11.5 | Qualified Person’s opinion | 179 | |||
| 12 | Mineral Reserve estimates | 180 | |||
| 13 | Mining methods | 181 | |||
| 13.1 | Introduction | 181 | |||
| 13.2 | Konkola Mine | 183 | |||
| 13.2.1 | Konkola Mine - Geotechnical considerations | 183 | |||
| 13.2.1.1 | Geotechnical domains | 183 | |||
| 13.2.1.2 | Structural geology summary | 192 | |||
| 13.2.2 | Geotechnical considerations for mining | 195 | |||
| 13.2.2.1 | Stope stability and design | 195 | |||
| 13.2.2.2 | Stope dilution estimation | 195 | |||
| 13.2.2.3 | Infrastructure placement | 195 | |||
| 13.2.2.4 | Crown pillar and subsidence risk | 195 | |||
| 13.2.3 | Ground support and numerical modelling | 195 | |||
| 13.2.4 | Hydrogeology | 196 | |||
| 13.2.4.1 | Hydrology summary | 196 | |||
| 13.2.4.2 | Aquifer parameters and testing | 196 | |||
| 13.2.4.3 | Dewatering volumes and rates | 197 | |||
| 13.2.4.4 | Chingola dolomite | 197 | |||
| 13.2.4.5 | Recharge | 198 | |||
| 13.2.4.6 | Dewatering system and boreholes | 198 | |||
| 13.2.4.7 | Water balance and groundwater model status | 199 | |||
| amcconsultants.com | vii |
| S-K 1300 TRS: KCM Integrated Operations (Initial Assessment) | |
| Konkola Copper Mines Plc | 0424076 |
| 13.2.4.8 | Water quality | 200 | |||
| 13.2.4.9 | Mine schedule and dewatering plan | 200 | |||
| 13.2.4.10 | Future dewatering rates | 202 | |||
| 13.2.4.11 | Pumping infrastructure – Konkola Mine | 203 | |||
| 13.2.4.12 | Konkola Mine water management infrastructure | 204 | |||
| 13.2.4.13 | Upgrade of existing pumping infrastructure | 204 | |||
| 13.2.4.14 | Risks | 205 | |||
| 13.2.5 | Existing mining – Konkola Mine | 206 | |||
| 13.2.6 | Planned mining methods - Konkola Mine | 206 | |||
| 13.2.7 | Mining unit dimensions | 208 | |||
| 13.2.8 | Mining dilution and recovery factors | 209 | |||
| 13.2.9 | Mine design | 209 | |||
| 13.2.10 | Mining operations | 212 | |||
| 13.2.11 | Backfill – Konkola Mine | 213 | |||
| 13.2.11.1 | Paste fill geomechanics and fill strength | 214 | |||
| 13.2.11.2 | Paste fill placement and retention | 215 | |||
| 13.2.12 | Ventilation – Konkola Mine | 216 | |||
| 13.3 | Nchanga Operations | 217 | |||
| 13.3.1 | COP D and F surface pit | 218 | |||
| 13.3.1.1 | Geotechnical considerations | 218 | |||
| 13.3.1.2 | Geotechnical considerations Nchanga open pits | 219 | |||
| 13.3.2 | Planned underground mining – Nchanga | 223 | |||
| 13.3.2.1 | Mining dilution and recovery factors | 224 | |||
| 13.4 | Tailings reclamation | 224 | |||
| 13.4.1 | Sources of production TD03, TD04, TD05 | 224 | |||
| 13.4.2 | Tailings dam inventory | 225 | |||
| 13.4.3 | Processing methodology and plant design | 226 | |||
| 13.4.4 | Production schedule | 226 | |||
| 13.4.5 | Materials handling, slurry pumping | 227 | |||
| 13.5 | Konkola Mine – conceptual mining plan | 227 | |||
| 13.5.1 | Near-term production (Measured and Indicated Resources) | 227 | |||
| 13.5.2 | Full Resource Case | 227 | |||
| 13.6 | Mining personnel | 229 | |||
| 13.7 | Full resource scenario | 229 | |||
| 13.7.1 | Full Resource Case scenario assumptions | 230 | |||
| 13.7.2 | Conceptual production profile | 231 | |||
| 13.7.3 | Inferred Mineral Resource cautionary statement | 231 | |||
| 14 | Processing and recovery methods | 232 | |||
| 14.1 | Konkola concentrator | 234 | |||
| 14.1.1 | Konkola process description | 234 | |||
| 14.1.1.1 | Historical performance | 235 | |||
| 14.1.1.2 | Restart performance | 235 | |||
| 14.1.2 | Plant design and equipment | 238 | |||
| 14.1.3 | Plant operations | 238 | |||
| 14.1.4 | Konkola LOMP production schedule | 240 | |||
| 14.2 | Nchanga concentrators | 242 | |||
| 14.2.1 | Historical performance | 242 | |||
| 14.2.2 | Nchanga LOM production | 245 | |||
| 14.3 | Nchanga TLP | 246 | |||
| 14.3.1 | Historical performance | 247 | |||
| 14.3.2 | Restart performance | 249 | |||
| 14.3.2.1 | Plant design and equipment | 250 | |||
| 14.3.2.2 | Combined TLP and TLP 2 production schedule | 250 | |||
| amcconsultants.com | viii |
| S-K 1300 TRS: KCM Integrated Operations (Initial Assessment) | |
| Konkola Copper Mines Plc | 0424076 |
| 14.4 | Nchanga smelter | 251 | |||
| 14.4.1 | Recent smelter performance | 253 | |||
| 14.4.2 | Smelter condition | 255 | |||
| 14.4.3 | Concentrate blending and third-party feed requirements | 256 | |||
| 14.4.3.1 | Sources of third-party concentrate | 257 | |||
| 14.4.3.2 | Availability of third-party concentrate | 257 | |||
| 14.4.3.3 | Existing contracts and commercial terms | 258 | |||
| 14.4.3.4 | Alternatives to third-party concentrate procurement | 259 | |||
| 14.4.3.5 | Assessment of supply certainty | 260 | |||
| 14.4.4 | Nkana refinery | 261 | |||
| 14.4.4.1 | Mode of operation, general condition | 261 | |||
| 14.4.4.2 | Production | 262 | |||
| 14.5 | Proposed processing methods | 262 | |||
| 14.5.1 | Process description | 263 | |||
| 14.5.2 | Design parameters | 263 | |||
| 14.5.3 | TD06 tailings storage facility | 263 | |||
| 14.6 | Proposed flow sheet | 263 | |||
| 14.7 | Plant design and equipment | 264 | |||
| 14.8 | Plant operations | 264 | |||
| 15 | Infrastructure | 265 | |||
| 15.1 | Roads | 265 | |||
| 15.2 | Rail | 266 | |||
| 15.3 | Port facilities | 267 | |||
| 15.4 | Water dams | 267 | |||
| 15.5 | Dumps | 268 | |||
| 15.6 | Licensing and permitting | 268 | |||
| 15.7 | Konkola operation waste dumps | 268 | |||
| 15.8 | Nchanga Operation waste dumps | 269 | |||
| 15.9 | Tailings disposal | 270 | |||
| 15.9.1 | Tailings deposition locations | 270 | |||
| 15.9.2 | LOM capacity and expansion opportunities | 273 | |||
| 15.9.3 | Licensing and permitting | 275 | |||
| 15.9.4 | Stability and TSF management processes | 275 | |||
| 15.10 | Power | 276 | |||
| 15.10.1 | Existing operating power supply capacity and expansion | 276 | |||
| 15.10.2 | Emergency power supply and expansion | 277 | |||
| 15.11 | Water | 277 | |||
| 15.11.1 | Raw water | 277 | |||
| 15.11.2 | Konkola Operations raw water balance | 277 | |||
| 15.11.3 | Nchanga Operations raw water balance | 278 | |||
| 15.11.4 | Potable water (domestic water) | 278 | |||
| 15.12 | Pipelines | 278 | |||
| 15.13 | Ancillary surface infrastructure and expansions | 278 | |||
| 15.13.1 | Internal rail network | 279 | |||
| 15.13.2 | Office building | 279 | |||
| 15.13.3 | Change houses and other buildings | 280 | |||
| 15.13.4 | Infrastructure related to life of mine expansions | 280 | |||
| 16 | Market studies and contracts | 281 | |||
| 16.1 | Market information | 281 | |||
| 16.1.1 | Market for KCM’s products | 281 | |||
| 16.1.2 | Copper demand | 281 | |||
| 16.1.3 | Copper supply | 282 | |||
| 16.1.4 | Cobalt demand | 283 | |||
| amcconsultants.com | ix |
| S-K 1300 TRS: KCM Integrated Operations (Initial Assessment) | |
| Konkola Copper Mines Plc | 0424076 |
| 16.1.5 | Cobalt supply | 283 | |||
| 16.1.6 | Study price and sales terms | 283 | |||
| 16.1.7 | Copper pricing for NSR cut-off grade estimation | 284 | |||
| 16.2 | Contracts and status | 285 | |||
| 16.2.1 | Forward sales and hedging | 285 | |||
| 16.2.2 | Site development contracts | 285 | |||
| 16.2.3 | Operating contracts | 287 | |||
| 16.2.4 | Other agreements and contracts | 288 | |||
| 17 | Environmental studies, permitting, and plans | 288 | |||
| 17.1 | Environmental studies, permitting, and social or community impact | 288 | |||
| 17.2 | Permitting requirements | 289 | |||
| 17.3 | Rehabilitation, closure, and post closure planning | 289 | |||
| 18 | Capital and operating costs | 290 | |||
| 18.1 | Konkola Mine operating cost estimate | 290 | |||
| 18.2 | Nchanga Business Unit operating cost estimate | 291 | |||
| 18.3 | Operating cost summary - KCM Integrated Operations | 292 | |||
| 18.4 | Konkola Mine capital cost estimate | 292 | |||
| 18.5 | Nchanga Business Unit capital cost estimate | 293 | |||
| 18.6 | Nchanga TLP and tailings facilities capital cost estimate | 294 | |||
| 18.6.1 | TLP capacity expansion (TLP 2) | 294 | |||
| 18.6.2 | Elevated Temperature Leach (ETL) upgrade | 294 | |||
| 18.6.3 | TD5 reclamation infrastructure (Phase 1) | 295 | |||
| 18.7 | Capital cost summary — KCM Integrated Operations | 295 | |||
| 18.8 | Cost estimate accuracy | 295 | |||
| 19 | Economic analysis | 297 | |||
| 19.1 | Full Resource Case (Including Inferred) | 297 | |||
| 19.2 | Measured and Indicated Resource Case | 298 | |||
| 19.3 | Key assumptions | 299 | |||
| 19.3.1 | Byproducts | 299 | |||
| 19.3.2 | Third-party concentrate: basis for inclusion in economic analysis | 299 | |||
| 19.3.2.1 | Third-party concentrate sensitivity (partial and adjusted scenarios) | 300 | |||
| 19.3.3 | Royalties and taxation | 301 | |||
| 19.4 | Production plans | 302 | |||
| 19.5 | Economic results - dual presentation | 304 | |||
| 19.6 | Sensitivity analysis | 312 | |||
| 20 | Adjacent properties | 314 | |||
| 20.1 | Chililabombwe area | 314 | |||
| 20.1.1 | Lubambe Copper Mine | 315 | |||
| 20.1.2 | Mingomba Project | 316 | |||
| 20.2 | Chingola area | 316 | |||
| 20.2.1 | Mimbula Copper Project | 316 | |||
| 20.3 | Kitwe area | 316 | |||
| 20.3.1 | Mopani Copper Mines | 316 | |||
| 20.4 | Qualified Person’s statement on adjacent properties | 316 | |||
| 21 | Other relevant data and information | 317 | |||
| 21.1 | Konkola Deeps production expansion project | 317 | |||
| 21.1.1 | Project outlook | 317 | |||
| 21.1.2 | Strategic opportunities | 317 | |||
| 21.1.3 | Recommended approach | 318 | |||
| 21.2 | Nchanga LP and Smelter expansion studies | 318 | |||
| amcconsultants.com | x |
| S-K 1300 TRS: KCM Integrated Operations (Initial Assessment) | |
| Konkola Copper Mines Plc | 0424076 |
| 21.2.1 | Project outlook | 318 | ||
| 21.2.2 | Recommended approach | 318 | ||
| 22 | Qualified Person's interpretation and conclusions | 319 | ||
| 22.1 | Mineral Resource data | 319 | ||
| 22.2 | Mineral Resources | 319 | ||
| 22.3 | Initial Assessment conclusions | 319 | ||
| 22.4 | Project economics | 319 | ||
| 22.5 | Effective date and subsequent events | 319 | ||
| 23 | Recommendations | 320 | ||
| 23.1 | Mineral Resource and geological recommendations | 320 | ||
| 23.1.1 | Konkola resource infill and extension drilling | 320 | ||
| 23.1.2 | Nchanga | 320 | ||
| 23.1.3 | QAQC and data management | 321 | ||
| 23.2 | Mining recommendations | 321 | ||
| 23.2.1 | Konkola Mine | 321 | ||
| 23.2.2 | TD03/TD04 tailings reclamation | 321 | ||
| 23.2.3 | Nchanga Underground projects | 321 | ||
| 23.3 | Processing and metallurgical recommendations | 321 | ||
| 23.3.1 | Konkola Concentrator | 321 | ||
| 23.3.2 | Nchanga TLP | 322 | ||
| 23.3.3 | TLP 2 / TD05 prefeasibility study | 322 | ||
| 23.4 | Infrastructure recommendations | 322 | ||
| 23.5 | Economic and commercial recommendations | 322 | ||
| 23.6 | Summary of recommended work program | 323 | ||
| 24 | References | 324 | ||
| 24.1 | Unit of measurement and abbreviations | 325 | ||
| 24.1.1 | Units of measurement | 325 | ||
| 24.1.2 | Abbreviations | 326 | ||
| 25 | Reliance on information provided by the Registrant | 327 | ||
| 25.1 | Legal matters | 327 | ||
| 25.2 | Environmental and community matters | 327 | ||
| 25.3 | Tailings storage facilities | 327 | ||
| 25.4 | Macroeconomic assumptions | 328 | ||
| 25.4.1 | Market information | 328 | ||
| 25.5 | Community accommodations | 328 | ||
| 25.6 | Governmental factors | 328 | ||
| 25.7 | Historical production and operating data | 328 | ||
| 25.8 | Contractor and business partner information | 329 | ||
| amcconsultants.com | xi |
| S-K 1300 TRS: KCM Integrated Operations (Initial Assessment) | |
| Konkola Copper Mines Plc | 0424076 |
Tables
| Table 1.1 | Operations and processing infrastructure licenses | 20 |
| Table 1.2 | KCM Mineral Resources – 1 April 2026 | 23 |
| Table 1.3 | Capital cost summary | 34 |
| Table 1.4 | Capital cost by operation – Full Resource Case (Including Inferred) | 34 |
| Table 1.5 | Capital cost by operation – M&I Case (Excluding Inferred) | 34 |
| Table 1.6 | Capital cost estimate accuracy | 35 |
| Table 1.7 | Average LOM unit operating cost by operation – Full Resource Case | 35 |
| Table 1.8 | Average unit operating cost summary – dual presentation | 35 |
| Table 1.9 | Total LOM operating costs by operation – dual presentation | 36 |
| Table 1.10 | Konkola Mine operating cost breakdown – Full Resource Case | 36 |
| Table 1.11 | Konkola Mine operating costs – first five years | 36 |
| Table 1.12 | C1 cash cost and AISC by operation – dual presentation | 37 |
| Table 1.13 | Summarised economic results | 38 |
| Table 1.14 | Sensitivity analysis results – Full Resource Case | 39 |
| Table 1.15 | Sensitivity analysis results – M&I Case | 40 |
| Table 2.1 | Defined terms and abbreviations | 43 |
| Table 3.1 | Material property classification | 47 |
| Table 3.2 | Component assets within KCM Integrated Operations | 47 |
| Table 3.3 | KCM Integrated Operations — facility coordinates (WGS84 datum) | 50 |
| Table 3.4 | KCM mineral rights and tenure details | 52 |
| Table 3.5 | Summary of adjacent properties | 56 |
| Table 4.1 | Inter-site distances and access routes | 58 |
| Table 5.1 | Principal capital investments by Vedanta Resources (2004–2019) | 63 |
| Table 5.2 | Cumulative copper production by operation | 65 |
| Table 5.3 | Key development milestones | 66 |
| Table 6.1 | KCM deposit mineralisation extent | 77 |
| Table 6.2 | Summary of geological characteristics of KCM operations | 77 |
| Table 7.1 | Exploration drill program – Konkola Mine | 82 |
| Table 7.2 | Exploration drill program – Nchanga Business Unit | 85 |
| Table 7.3 | Elastic rock properties | 86 |
| Table 7.4 | Local geology and hydrogeological units | 88 |
| Table 8.1 | List of corrected outcomes for 16 GBM911-16 CRMs | 95 |
| Table 8.2 | CRM sample submission – COP CE Ext | 100 |
| Table 8.3 | QAQC sample submission rate TCu% - TD05 | 102 |
| Table 8.4 | CRM source - TD05 | 103 |
| Table 8.5 | QP assessment of QAQC results by deposit | 110 |
| Table 8.6 | QAQC recommendations | 111 |
| Table 9.1 | QP assessment of data verification limitations — Konkola | 114 |
| Table 10.1 | Historical, restart, and planned Nchanga TLP recoveries | 120 |
| Table 10.2 | Recovery downstream efficiency factors | 122 |
| Table 11.1 | KCM Mineral Resources – 1 April 2026 | 125 |
| Table 11.2 | Cut-off grade input assumptions by asset | 128 |
| Table 11.3 | Top-caps - Konkola | 139 |
| Table 11.4 | Descriptive statistics pre- and post-compositing – Konkola | 140 |
| Table 11.5 | Variogram models - Konkola | 142 |
| Table 11.6 | Block model origin and extents | 142 |
| Table 11.7 | Lithology codes in block model - Konkola | 143 |
| Table 11.8 | Bulk density by lithology - Konkola | 144 |
| Table 11.9 | Statistical comparison of composite and estimated values for TCu% - Konkola | 148 |
| Table 11.10 | Mineral Resource Konkola Mine – 1 April 2026 | 150 |
| Table 11.11 | Descriptive statistics for COP DF composited samples | 153 |
| Table 11.12 | Variogram models – COP DF | 153 |
| Table 11.13 | Block model origin and extents – COP DF | 153 |
| amcconsultants.com | xii |
| S-K 1300 TRS: KCM Integrated Operations (Initial Assessment) | |
| Konkola Copper Mines Plc | 0424076 |
| Table 11.14 | Estimation parameters – COP DF | 154 |
| Table 11.15 | Mineral Resource COP DF– 1 April 2026 | 157 |
| Table 11.16 | Statistics by mineralisation zone for composite data – COP E Ext | 160 |
| Table 11.17 | Block model origin and extents – COP E Ext | 161 |
| Table 11.18 | Estimation parameters – COP E Ext | 162 |
| Table 11.19 | Bulk density by lithology – COP E Ext | 162 |
| Table 11.20 | Drillhole versus block model mean grades – COP E Ext | 163 |
| Table 11.21 | Mineral Resource COP E Extension – 1 April 2026 | 165 |
| Table 11.22 | Summary statistics total copper tailings dam samples | 166 |
| Table 11.23 | Summary statistics acid soluble copper tailings dam samples | 167 |
| Table 11.24 | Mineral Resource TD03 and TD04– 1 April 2026 | 168 |
| Table 11.25 | Top-caps – TD05 | 172 |
| Table 11.26 | Variogram models – TD05 | 173 |
| Table 11.27 | Search orientation and ranges – TD05 | 173 |
| Table 11.28 | Mineral Resource TD05 – 1 April 2026 | 178 |
| Table 13.1 | KCM production scenarios – M&I Case and Full Resource Case | 181 |
| Table 13.2 | KCM LOM mining areas | 182 |
| Table 13.3 | KCM Shaft 3 summary of rock mass properties | 185 |
| Table 13.4 | KCM Shaft 4 summary of rock mass properties | 187 |
| Table 13.5 | Summary of water capture extrapolated over time | 200 |
| Table 13.6 | Indicative future mine inflow rates for the next 7-year mine plan | 202 |
| Table 13.7 | Mining methods currently employed by mining area at Konkola Mine | 206 |
| Table 13.8 | Konkola Mine mining methods | 207 |
| Table 13.9 | Typical stope dimensions | 208 |
| Table 13.10 | Mining dilution and recovery factors | 209 |
| Table 13.11 | Key development designs | 210 |
| Table 13.12 | Materials handling locations | 213 |
| Table 13.13 | Backfill infrastructure and strategic recommendations | 213 |
| Table 13.14 | Konkola paste fill design strengths (FoS=1.5) and paste fill recipes at 28 days curing | 215 |
| Table 13.15 | Machine types, counts, and utilisation factors | 216 |
| Table 13.16 | Summary of primary ventilation airflows | 217 |
| Table 13.17 | NOP Cut II design parameters | 221 |
| Table 13.18 | Nchanga underground mining methods | 223 |
| Table 13.19 | Schedule modifying factors | 224 |
| Table 13.20 | Available inventory from TD03, TD04 and TD05 for the Nchanga TLP from 1 April 2026 |
225 |
| Table 13.21 | Konkola Mine production scenarios | 228 |
| Table 13.22 | KCM Mineral Resources by asset – 1 April 2026 | 230 |
| Table 13.23 | Conceptual production profile – Full Resource scenario | 231 |
| Table 14.1 | Konkola concentrator major equipment | 238 |
| Table 14.2 | Capacity criteria | 239 |
| Table 14.3 | Comminution criteria | 239 |
| Table 14.4 | Flotation criteria | 240 |
| Table 14.5 | Konkola concentrator key assumptions | 241 |
| Table 14.6 | Nchanga concentrator capacities | 242 |
| amcconsultants.com | xiii |
| S-K 1300 TRS: KCM Integrated Operations (Initial Assessment) | |
| Konkola Copper Mines Plc | 0424076 |
| Table 14.7 | Nchanga TLP highest annual performance | 248 |
| Table 14.8 | Copper production estimate | 248 |
| Table 14.9 | Nchanga TLP major unit processes | 250 |
| Table 14.10 | Nchanga smelter – basic design production parameters | 252 |
| Table 14.11 | Nchanga smelter – historical production | 253 |
| Table 14.12 | Nchanga smelter production – October 2024 | 255 |
| Table 14.13 | Smelter rebuild CAPEX – by section | 256 |
| Table 14.14 | Example monthly concentrate blend plan – June 2025 | 256 |
| Table 14.15 | Concentrate blending plan – FY25/26 business plan | 259 |
| Table 14.16 | Nkana Refinery production – 2024-2025 | 262 |
| Table 14.17 | TLP 2 design parameters | 263 |
| Table 15.1 | Operational TSF conditions, TD05 (Muntimpa) and Lubengele | 274 |
| Table 16.1 | Five-year copper forward prices (real US$ 2025) | 284 |
| Table 16.2 | Five-year copper trailing prices | 284 |
| Table 16.3 | Copper payability terms for Konkola and Nchanga Copper Concentrate | 284 |
| Table 16.4 | Major development contracts | 285 |
| Table 16.5 | Example of long-term contract components | 287 |
| Table 16.6 | Royalty charge relation to copper price | 288 |
| Table 18.1 | Konkola Mine cost build-up | 290 |
| Table 18.2 | Average LOM operating cost by operation | 292 |
| Table 18.3 | Capital expenditure plan - Konkola Mine | 293 |
| Table 18.4 | Capital expenditure plan - Nchanga Business Unit | 293 |
| Table 18.5 | Capital expenditure plan - TLP and Tailings Reclamation | 295 |
| Table 18.6 | Capital expenditure plan - KCM Integrated Operations | 295 |
| Table 18.7 | Capital allocation by operation — Full Resource Case | 296 |
| Table 18.8 | KCM Integrated Operations capital expenditure schedule | 296 |
| Table 18.9 | KCM cost estimation accuracy | 296 |
| Table 19.1 | Byproducts: Type, Quantity and Price Assumption | 299 |
| Table 19.2 | Economic results – KCM Integrated Operations | 304 |
| Table 19.3 | Full Resource Case production and cashflow schedule | 307 |
| Table 19.4 | M&I Case production and cashflow schedule | 311 |
| Table 19.5 | Sensitivity analysis results – Full Resource Case | 312 |
| Table 19.6 | Sensitivity analysis results – M&I Case | 313 |
| Table 20.1 | Summary of adjacent properties | 314 |
| Table 23.1 | Recommended work program | 323 |
| Table 24.1 | TRS data and information sources | 324 |
| amcconsultants.com | xiv |
| S-K 1300 TRS: KCM Integrated Operations (Initial Assessment) | |
| Konkola Copper Mines Plc | 0424076 |
Figures
| Figure 1.1 | KCM Smelter Feed Profile – Full Resource Case (incl. external purchased concentrates) | 30 |
| Figure 1.2 | KCM Smelter Feed Profile – M&I Case (incl. external purchased concentrates) | 31 |
| Figure 1.3 | Total Copper Sold – Full Resource Case | 31 |
| Figure 1.4 | Total Copper Sold – M&I Case | 32 |
| Figure 1.5 | KCM Production Profile – Full Resource Case | 32 |
| Figure 1.6 | KCM Production Profile – M&I Case | 33 |
| Figure 1.7 | Sensitivity analysis graph – Full Resource Case | 39 |
| Figure 1.8 | Sensitivity analysis graph – M&I Case | 39 |
| Figure 3.1 | Map of Zambia showing the Copperbelt Region | 48 |
| Figure 3.2 | Property location map – KCM Integrated Operations | 49 |
| Figure 3.3 | Geographic location of Konkola Mines in Zambia | 50 |
| Figure 4.1 | Inter site logistics map | 59 |
| Figure 5.1 | KCM historical production FY06-FY24 | 65 |
| Figure 6.1 | Location of Lufilian Arc within Pan-African Belts of Central and Southern Africa | 67 |
| Figure 6.2 | Schematic cross section of the Lufilian fold belt | 68 |
| Figure 6.3 | Simplified Katanga Supergroup stratigraphy | 69 |
| Figure 6.4 | Geological map of the greater Konkola area | 70 |
| Figure 6.5 | Stratigraphic column of the Konkola Geology | 72 |
| Figure 7.1 | Recovery of tailings material and in core tray at TD05 | 80 |
| Figure 7.2 | Drillhole location plan - Konkola | 81 |
| Figure 7.3 | Drillhole location plan – COP DF | 83 |
| Figure 7.4 | Drillhole location plan – COP E Extension | 84 |
| Figure 7.5 | Drillhole location plan – TD05 | 85 |
| Figure 7.6 | Seismic system schematics at Konkola | 87 |
| Figure 7.7 | Location of three main aquifers in the Konkola Mine, section looking north | 88 |
| Figure 8.1 | Dry bulk density TD05 | 92 |
| Figure 8.2 | Water content calculated from the bulk density samples TD05 | 92 |
| Figure 8.3 | Reference core and tailings sample storage in secure core yard | 94 |
| Figure 8.4 | Location plan of holes drilled from 2016 to 2023 - Konkola | 96 |
| Figure 8.5 | Shewhart plots for CRMs A, B, C, and D - Konkola | 97 |
| Figure 8.6 | Shewhart plots for CRMs E, F, and G - Konkola | 97 |
| Figure 8.7 | RPD plot TCu repeat samples no cut-off and at 1.5% TCu- Konkola - post 2016 data | 98 |
| Figure 8.8 | Blank samples plot showing 0.5% TCu upper limit | 99 |
| Figure 8.9 | HARD plot for repeat samples below 1.0% TCu | 101 |
| Figure 8.10 | HARD plot for repeat samples between 0.5% TCu and 3.0% TCu | 102 |
| Figure 8.11 | Sequence of CRM submission – TD05 | 103 |
| Figure 8.12 | Shewhart plot for % TCu for all CRMs – TD05 | 103 |
| Figure 8.13 | Shewhart plot for 1.68% TCu CRM – TD05 | 104 |
| Figure 8.14 | Blank samples plot showing 0.1% TCu upper limit | 105 |
| Figure 8.15 | Comparison of TCu% in blank sample and TCu% of preceding sample | 106 |
| Figure 8.16 | Pulp repeat precision analysis TCu% – TD05 | 107 |
| Figure 8.17 | Pulp repeat precision analysis ASCu% – TD05 | 108 |
| Figure 10.1 | Nchanga TLP copper production and recoveries - Restart and FY25-26 plan | 119 |
| Figure 10.2 | Nchanga TLP copper recoveries | 120 |
| Figure 11.1 | Plan location of the KCM Mineral Deposits | 124 |
| Figure 11.2 | Plan view of mining areas - Konkola | 129 |
| Figure 11.3 | Drillhole location plan - Konkola | 130 |
| Figure 11.4 | Plan view comparing differences in 2016 and 2024 interpretation - Konkola | 131 |
| Figure 11.5 | Plan view of historic mapping from 1850L - Konkola | 132 |
| amcconsultants.com | xv |
| S-K 1300 TRS: KCM Integrated Operations (Initial Assessment) | |
| Konkola Copper Mines Plc | 0424076 |
| Figure 11.6 | Contact analysis between non-mineralised and mineralised material - Konkola | 133 |
| Figure 11.7 | Isometric of hangingwall and footwall constraining surfaces - Konkola | 134 |
| Figure 11.8 | Plan view of along strike grade continuity - Konkola | 135 |
| Figure 11.9 | Box and whisker plot comparing TCu% across seven grade domains - Konkola | 135 |
| Figure 11.10 | Q-Q plots comparing TCu% across seven grade domains - Konkola | 136 |
| Figure 11.11 | Plan view of block model and composites flagged by domain - Konkola | 137 |
| Figure 11.12 | Top-capping analysis - Konkola | 138 |
| Figure 11.13 | Experimental semi-variogram model for TCu% - Domain 5 - Konkola | 141 |
| Figure 11.14 | Swath plots Measured and Indicated TCu% Domain 1 - Konkola | 145 |
| Figure 11.15 | Swath plots Measured and Indicated TCu% Domain 2 - Konkola | 146 |
| Figure 11.16 | Cross sections comparing composite intervals and block model grades - Konkola | 147 |
| Figure 11.17 | Plan view of the Mineral Resource classification - Konkola | 148 |
| Figure 11.18 | Isometric of the average distance to sample support – Konkola | 149 |
| Figure 11.19 | Drillhole location plan – COP DF | 152 |
| Figure 11.20 | Swath plots – COP DF | 155 |
| Figure 11.21 | Drillhole location plan – COP E Ext | 158 |
| Figure 11.22 | Plan view of drillhole intersections and interpreted mineralisation Zones TCu% - COP E Ext | 159 |
| Figure 11.23 | Plan view of drillhole intersections and interpreted mineralisation Zones ASCu% - COP E Ext | 160 |
| Figure 11.24 | Histogram composite samples TCu% and ASCu% - Zone A COP E Ext | 161 |
| Figure 11.25 | Swath plots – COP E Ext | 163 |
| Figure 11.26 | Plan view of the Mineral Resource classification – COP E Ext | 164 |
| Figure 11.27 | Drillhole location plan – TD05 | 169 |
| Figure 11.28 | Histogram of vertical thickness from drilling -TD05 | 170 |
| Figure 11.29 | Histogram composite samples TCu% - TD05 | 171 |
| Figure 11.30 | Histogram composite samples ASCu% - TD05 | 171 |
| Figure 11.31 | Correlation between TCu% and ASCu%- TD05 | 172 |
| Figure 11.32 | Cross section of TCu% grades in drillholes and estimated block model – TD05 | 174 |
| Figure 11.33 | Statistical comparison of drillholes and block model – Indicated only – TD05 | 175 |
| Figure 11.34 | Swath plot TCu% in 124 m slices – TD05 | 175 |
| Figure 11.35 | Swath plot ASCu% in 124 m slices – TD05 | 176 |
| Figure 11.36 | Plan view of the Mineral Resource classification – TD05 | 177 |
| Figure 13.1 | Location of KCM's Konkola and Nchanga Mining operations | 182 |
| Figure 13.2 | Plan view map of the Konkola mine showing the geotechnical domains | 184 |
| Figure 13.3 | Location of regional faults within the Konkola mine area | 193 |
| Figure 13.4 | Location of modelled faults within mine workings | 194 |
| Figure 13.5 | Cross section showing the interconnected nature of the Chingola dolomite (light blue) between KCM (right) and Lubambe (left) | 197 |
| Figure 13.6 | Subsidence area shown on InSAR ascending image | 198 |
| Figure 13.7 | Conceptual water balance | 199 |
| Figure 13.8 | Currently inferred phreatic surface based on measurements from shut in holes | 201 |
| Figure 13.9 | Rotated section showing the planned footwall dewatering drilling | 202 |
| Figure 13.10 | Konkola Mine dewatered, developed, and mined | 203 |
| amcconsultants.com | xvi |
| S-K 1300 TRS: KCM Integrated Operations (Initial Assessment) | |
| Konkola Copper Mines Plc | 0424076 |
| Figure 13.11 | Dewatering schematic, with required upgrades shown in red | 205 |
| Figure 13.12 | Final mine outline map - plan view showing mining zone boundaries and key infrastructure | 208 |
| Figure 13.13 | Plan view of a loading level | 210 |
| Figure 13.14 | Isometric view of the loading system (LHOS) | 211 |
| Figure 13.15 | Isometric view of the loading system (panel stoping) | 212 |
| Figure 13.16 | Target paste design strength – 2 Exposures | 214 |
| Figure 13.17 | Target paste design strength – 1 Exposure | 215 |
| Figure 13.18 | Paste fill arched shotcrete barricades | 216 |
| Figure 13.19 | Ventilation compared to production | 217 |
| Figure 13.20 | NBU active production zones | 218 |
| Figure 13.21 | Aerial photo and locations of open pits at Nchanga | 220 |
| Figure 13.22 | NOP Cut II geotechnical domains | 221 |
| Figure 13.23 | COP DF geotechnical zones | 222 |
| Figure 13.24 | Nchanga Underground mining operations (NUG) | 223 |
| Figure 13.25 | Nchanga site layout | 225 |
| Figure 13.26 | Konkola Mine development schedule | 228 |
| Figure 13.27 | Total project ore mining schedule | 229 |
| Figure 14.1 | KCM total flowsheet | 233 |
| Figure 14.2 | Konkola concentrator flowsheet | 234 |
| Figure 14.3 | Konkola historical ore treatment | 235 |
| Figure 14.4 | Konkola daily ore received since restart | 236 |
| Figure 14.5 | Konkola ore processed since restart | 236 |
| Figure 14.6 | Konkola recoveries since restart | 236 |
| Figure 14.7 | Konkola concentrate produced since restart | 237 |
| Figure 14.8 | Concentrate production and grade - Restart and FY25-26 plan | 237 |
| Figure 14.9 | Copper production and recoveries - Restart and FY25-26 plan | 238 |
| Figure 14.10 | Konkola LOM ore feed | 240 |
| Figure 14.11 | Konkola concentrate production | 241 |
| Figure 14.12 | Total copper metal in Konkola concentrate | 241 |
| Figure 14.13 | Nchanga business unit material flows | 242 |
| Figure 14.14 | Old East Mill historical actual vs budget ore milled (t) | 242 |
| Figure 14.15 | New East Mill historical actual vs budget ore milled (t) | 243 |
| Figure 14.16 | New West Mill historical actual vs budget ore milled (t) | 243 |
| Figure 14.17 | Old East Mill concentrate tonnes and grades | 244 |
| Figure 14.18 | New East Mill concentrate tonnes and grades | 244 |
| Figure 14.19 | New West Mill concentrate tonnes and grades | 244 |
| Figure 14.20 | Total LOM ore feed to the Nchanga concentrators | 245 |
| Figure 14.21 | Nchanga LOM high-grade concentrate production and grade | 245 |
| Figure 14.22 | Nchanga LOM low-grade concentrate production and grade | 245 |
| Figure 14.23 | Nchanga TLP flowsheet | 246 |
| Figure 14.24 | Historical Nchanga TLP throughput | 247 |
| Figure 14.25 | Nchanga TLP historical recoveries | 248 |
| Figure 14.26 | Nchanga TLP copper recovery since restart | 249 |
| amcconsultants.com | xvii |
| S-K 1300 TRS: KCM Integrated Operations (Initial Assessment) | |
| Konkola Copper Mines Plc | 0424076 |
| Figure 14.27 | Nchanga TLP throughput since restart | 249 |
| Figure 14.28 | Combined Nchanga TLP and TLP 2 LOMP feed schedule | 250 |
| Figure 14.29 | Combined Nchanga TLP and TLP 2 LOMP cathode production and total copper recovery | 251 |
| Figure 14.30 | Nchanga smelter block flow diagram – design rates shown | 252 |
| Figure 14.31 | Smelter downtime - FY22, FY23, FY24 | 254 |
| Figure 14.32 | Nkana refinery – process flowsheet | 261 |
| Figure 14.33 | Proposed TLP 2 flowsheet | 264 |
| Figure 15.1 | Map showing main roads connecting towns of Chingola and Chililabombwe | 266 |
| Figure 15.2 | Map showing rail infrastructure of Zambia Railways Limited | 267 |
| Figure 15.3 | Map showing waste dump locations at KCM | 269 |
| Figure 15.4 | Map showing locations of various waste dumps at Nchanga Mines | 270 |
| Figure 15.5 | Map showing locations of all TSFs of Konkola and Nchanga Operations | 271 |
| Figure 15.6 | Map showing detail view of TD05 Muntimpa TSF | 272 |
| Figure 15.7 | Map showing detail view of Lubengele TSF | 273 |
| Figure 18.1 | Konkola Mine operating cost profile for LOM schedule | 291 |
| Figure 18.2 | Konkola LOM split by activity | 291 |
| Figure 19.1 | KCM Smelter Feed Profile – Full Resource Case (incl. external purchased concentrates) | 302 |
| Figure 19.2 | KCM Smelter Feed Profile – M&I Case (incl. external purchased concentrates) | 303 |
| Figure 19.3 | Projected overall mining schedule – Full Resource Case | 303 |
| Figure 19.4 | Projected overall mining schedule – M&I Case | 303 |
| Figure 19.5 | Full Resource Case cashflow | 306 |
| Figure 19.6 | M&I Case cashflow | 306 |
| Figure 19.7 | Sensitivity analysis graph – Full Resource Case | 312 |
| Figure 19.8 | Sensitivity analysis graph – M&I Case | 313 |
| Figure 20.1 | Konkola deposit and surrounding properties | 315 |
| amcconsultants.com | xviii |
| S-K 1300 TRS: KCM Integrated Operations (Initial Assessment) | |
| Konkola Copper Mines Plc | 0424076 |
| 1 | Executive summary |
|
CAUTIONARY STATEMENT
This Initial Assessment is preliminary in nature and includes Inferred Mineral Resources that are considered too speculative geologically to have the economic considerations applied to them that would enable them to be categorised as Mineral Reserves. There is no certainty that this Initial Assessment will be realised or that Inferred Mineral Resources will be converted to higher confidence categories. Mineral Resources that are not Mineral Reserves do not have demonstrated economic viability. A companion Preliminary Feasibility Study Technical Report Summary presents economic analysis based exclusively on Measured and Indicated Mineral Resources.
|
| 1.1 | Introduction |
AMC Consultants (UK) Limited (AMC) was engaged by Vedanta Resources Limited (Vedanta) to prepare this Initial Assessment (IA) Technical Report Summary (TRS) for the Konkola Copper Mines Plc (KCM) Integrated Operations located in the Zambian Copperbelt. This report has been prepared in compliance with Subpart 1300 of Regulation S-K (S-K 1300) as mandated by the United States Securities and Exchange Commission (SEC).
This IA TRS presents a comprehensive Life-of-Mine (LOM) Plan that includes mining from all KCM operations:
| · | Konkola Mine. |
| · | Nchanga Business Unit – COP DF open pit and underground, COP E Extension underground, and Nchanga Underground. |
| · | Reclamation of TD03 and TD04, processed through the Nchanga Tailings Leach Plant (TLP). |
| · | Proposed reclamation of TD05 tailings. For the M&I Case, TD05 will be processed through the existing Nchanga TLP, which will be retrofitted with Elevated Temperature Leach (ETL). For the Full Resource Case, a new proposed TLP (TLP 2) will be constructed and designed with ETL, and TD05 will be processed through both plants at higher rates. |
The technical contents of this report adhere to S-K 1300 requirements for reporting Mineral Resources. The M&I Case (Measured and Indicated, excluding Inferred) is presented for comparison purposes in accordance with Item 1302(d)(4)(ii)(C); formal declaration of Mineral Reserves is provided in the separate PFS Technical Report Summary. The effective date of this report is 1 April 2026.
Unless otherwise stated, all units in this report are in metric (SI) units. Currency is presented in United States Dollars (US$).
| 1.2 | Property description and ownership |
The KCM Integrated Operations constitutes a single material property comprising an integrated copper production complex from ore extraction through to refined copper metal. Konkola Copper Mines Plc (KCM) is an integrated copper mining, processing, and refining operation located in the Copperbelt Province of the Republic of Zambia.
KCM was privatised in March 2000 when assets were acquired from the state-owned Zambia Consolidated Copper Mines Limited (ZCCM). Following the exit of Anglo American in September 2002, Vedanta Resources assumed operational control from November 2004, investing in smelter construction, the Konkola Concentrator, Nchanga Concentrators, and the Konkola Mine, Konkola Deep Mining Project (No. 4 Shaft, 6 Mtpa hoisting capacity). KCM’s integrated metal production peaked at 160,000 tonnes per annum in FY 2013. In 2019, Zambia Consolidated Copper Mines Investment Holdings Plc (ZCCM-IH) commenced provisional liquidation proceedings, and operations were managed by a provisional liquidator until July 2024, when they were returned to Vedanta with shareholding restored to pre-liquidation status. Further details are provided in Section 5.
| amcconsultants.com | 19 |
| S-K 1300 TRS: KCM Integrated Operations (Initial Assessment) | |
| Konkola Copper Mines Plc | 0424076 |
The properties covered by this IA TRS comprise the full KCM operations:
| · | Konkola Mine: Located near Chililabombwe, Republic of Zambia, approximately 20 kilometers (km) north of Chingola and 5 km south of the Democratic Republic of the Congo border. |
| · | Nchanga Business Unit: Located near Chingola, comprising multiple open pit and underground operations including COP DF, COP E Extension and Nchanga Underground (UOB / LOB). |
| · | Tailings Recovery Operations: TD03, TD04, TD05, and Kakosa tailings, processed through the Nchanga TLP. |
| · | Processing Infrastructure: Konkola Concentrator, Nchanga Concentrators, Nchanga Smelter, Nkana Refinery, and Nchanga TLP. In the Full Resource Case an additional TLP (TLP 2) is proposed. The proposed TLP 2 will incorporate elevated temperature leaching and increase the total tailings complex throughput rate by 17.6Mtpa. |
KCM is a subsidiary of CopperTech Metals Inc. (the registrant). Mineral rights associated with the Konkola and Nchanga license areas are held by Konkola Mineral Resources Limited (KMRL), a subsidiary of KCM. As of the effective date of this report, Vedanta Resources holds 79.4% of KCM’s issued share capital, with ZCCM-IH holding 20.6%. Further details on the registrant are provided in Section 2.1 and on operational history, including ownership transitions, in Section 3.3.
For the Full Resource Case, the Konkola Mine and adjacent mineral processing facilities contribute approximately 74% of total payable copper production (5,816 kt of 7,880kt), the Nchanga Business Unit contributes approximately 3% (266 kt), and the Nchanga TLP contributes approximately 23% (1,798 kt).
For the M&I Case, the Konkola Mine contributes approximately 57% of payable copper (734 kt of 1,446 kt) and the Nchanga TLP contributes approximately 43% (713 kt).
| 1.3 | Mineral rights |
KCM's mineral rights are governed by the Republic of Zambia's Minerals Regulation Commission Act (2024) and operate under Large-Scale Mining Licenses (LSMLs). The key licenses relevant to this IA are shown in Table 1.1.
Table 1.1 Operations and processing infrastructure licenses
| Asset | License | Description | Area (ha) | Expiry | ||||
| Konkola Mine | 7076-HQ-LML | Mining and concentrator operations | 4,054 | 30 Mar 2050 | ||||
| Nchanga Mine | 7075-HQ-LML | Nchanga mining and tailings operations | 10,659 | 30 Mar 2050 | ||||
| Nchanga TLP | 28174-HQ-MPL | Nchanga TLP operations | 177 | 16 Dec 2045 | ||||
| Nkana Refinery | 20945-HQ-MPL | Refining activities at Kitwe | 50 | 18 Apr 2050 |
As of the effective date of this report, and to the Qualified Person's knowledge, there are no material encumbrances, legal proceedings, or compliance issues that would adversely affect the standing of these licenses or KCM's ability to conduct operations. Standard regulatory and environmental obligations applicable to mining operations in Zambia are described in Section 3.
| amcconsultants.com | 20 |
| S-K 1300 TRS: KCM Integrated Operations (Initial Assessment) | |
| Konkola Copper Mines Plc | 0424076 |
| 1.4 | Geology and mineralisation |
| 1.4.1 | Regional geological setting |
KCM’s mining assets are located within the Central African Copperbelt, one of the most prolific sediment-hosted copper provinces globally. The deposits occur within the Neoproterozoic Katanga Supergroup, a sequence of sedimentary rocks that host significant copper-cobalt mineralisation across the Republic of Zambia and the Democratic Republic of the Congo (DRC).
The Lufilian Arc, a major structural feature, has influenced the deformation and mineralisation of KCM’s deposits. The copper deposits are primarily stratiform, sediment-hosted, and are controlled by structural folding, thrust faulting, and lithological variations.
| 1.4.2 | Mineralisation characteristics |
The Konkola deposit is a sediment-hosted stratiform copper system, primarily situated within the Lower Roan Subgroup of the Katangan Supergroup. This geological sequence comprises sandstones, siltstones, and dolomites deposited in a shallow marine to fluvial environment, later subjected to regional deformation during the Lufilian Orogeny. The mineralisation is controlled by both stratigraphy and structure, with mineralisation occurring as laterally continuous, fine grained disseminations and bedding-parallel sulfide veinlets, locally enhanced by folding and faulting.
The mineralisation style varies across different mining areas. The Konkola Mine includes copper sulfides (chalcopyrite, bornite, and chalcocite) occurring as disseminations and veinlets within carbonaceous shales and dolomitic siltstones. The mineralisation of the various Nchanga deposits is described in more detail in Section 1.5.2 below.
| 1.4.3 | Structural and hydrothermal influences |
The Copperbelt deposits, including those at Konkola and Nchanga, exhibit complex structural features that have significantly influenced both the preservation and distribution of copper mineralisation. These structures have not only enhanced mineralisation grades in localised zones but also facilitated the continuation of mineralisation at considerable depth.
| 1.5 | Exploration and drilling status |
There is no active exploration being undertaken at either Konkola or Nchanga assets. All drilling is resource infill or resource extension drilling. This includes all other means of exploration, for example geophysics.
| 1.5.1 | Konkola |
Current drilling and interpretation provide a solid basis for Mineral Resource estimation, but limitations persist due to:
| · | Sparse drilling in transition zones and extensions of mineralisation. |
| · | Gaps in assay coverage. |
| · | Delays in assay turnaround due to on-site laboratory constraints. |
| · | Inconsistent quality assurance / quality control (QAQC) procedures in historical (pre-2016) data. |
| · | Limited structural, geometallurgical and hydrogeological modelling. |
To address these gaps and enable Resource upgrade and potential future Reserve conversion, an upgrade to the on-site analytical laboratory is recommended.
| amcconsultants.com | 21 |
| S-K 1300 TRS: KCM Integrated Operations (Initial Assessment) | |
| Konkola Copper Mines Plc | 0424076 |
A phased drilling and data acquisition program is proposed to progressively upgrade the resource classification, de-risk geological understanding, and support long-term mine planning:
| · | Phase 1: Achieve a Measured classification for five years of production through a 60-meter (m) drill spacing using underground and surface directional drilling. |
| · | Phase 2: Target Indicated material for the next ten years of production through a combination of surface directional and vertical drilling. |
| · | Phase 3: Infill drill to enhance confidence in the Inferred Mineral Resource by reducing the drillhole spacing. |
| · | Phase 4: Undertake resource extension drilling at the lease boundary, consisting of a small number of surfaces drillholes with an average depth of 1,500 m. |
| 1.5.2 | Nchanga |
Drilling at Nchanga has historically focused on delineating both near-surface oxide mineralisation for open pit mining and deeper sulfide zones for underground extraction. The Nchanga Underground and open pit deposits have benefited from extensive historical drilling. Modern drilling efforts have been limited in recent years due to operational constraints.
Recent technical reviews have identified key opportunities to enhance resource definition at Nchanga:
| · | Infill drilling to improve confidence in remnant underground ore zones, particularly where block cave depletion and historic mining have left isolated pods of mineralisation. |
| · | Drilling of open pit extensions at the margins of existing pit shells to define additional near-surface oxide and supergene resources. |
| · | Structural re-interpretation of fault zones and controls on high-grade shoots within the underground footprint. |
Future geological development programs for Nchanga are proposed to:
| · | Investigate COP E Ext and COP DF for potential extensions and to increase geological confidence for proposed development of underground mining. |
| · | Collate the geological information and understanding for all current and past operating assets into a single digital geological project. This will allow for the creation of a digital asset wide geological interpretation for the first time. With the goal being to identify areas where mineralisation might have been overlooked both as extensions to known mineralisation and between known mineralisation. |
| 1.5.3 | Tailings dams |
Lubengele (Konkola): Auger drilling and test work commenced at Lubengele in late-2025 at a 250 m by 250 m drill spacing pattern, with the objective of supporting an initial Mineral Resource estimate at Indicated classification on completion of the drilling and metallurgical test work programme in 2026. Lubengele is not currently included in the Mineral Resource estimate and is not relied upon in the economic evaluation presented in this Initial Assessment.
TD05 (Nchanga): TD05 has been included in the Mineral Resource estimate for the first time as part of this Initial Assessment, based on the 2025/26 auger drilling and characterisation campaign described in Section 7.7. Approximately 53% of the TD05 Mineral Resource (by contained copper) is classified as Inferred, with the balance classified as Indicated. The Indicated portion is included in the M&I Case mine plan and processed via the existing Nchanga TLP; the Inferred portion is included in the Full Resource Case only and processed via the proposed TLP 2 facility (refer Section 14.5). Additional drilling and bulk density sampling at TD05 may be undertaken in future reporting periods to support a potential upgrade of the Inferred portion to Indicated classification.
| amcconsultants.com | 22 |
| S-K 1300 TRS: KCM Integrated Operations (Initial Assessment) | |
| Konkola Copper Mines Plc | 0424076 |
| 1.6 | Mineral Resource estimate |
INFERRED MINERAL RESOURCE PROPORTION
Approximately 63% of KCM Mineral Resources are classified as Inferred (483 Mt of 773 Mt). At Konkola Mine, approximately 87% of Resources are classified as Inferred (249 Mt of 288 Mt). Inferred Mineral Resources have a lower level of confidence and cannot be converted to Mineral Reserves. It is reasonably expected that the majority of Inferred Resources could be upgraded with continued exploration.
A Mineral Resource is an estimate of the in situ concentration of solid material of economic interest, which serves as the point of reference for the Mineral Resource estimate. The Mineral Resource classification criteria and cut-off grade (COG) on an asset-by-asset basis. The Mineral Resource estimate as of 1 April 2026 for all KCM operations is summarised in Table 1.2 below.
Table 1.2 KCM Mineral Resources – 1 April 2026
| Cut-off | Tonnes | Total copper | Copper | Total cobalt | Cobalt | |||||||||||||||||||||
| Asset | Classification | TCu (%) | Mt | TCu (%) | Cu (kt) | TCo (%) | Co (kt) | |||||||||||||||||||
| Measured | 1.1 | 4.1 | 3.5 | 140 | 0.08 | 3 | ||||||||||||||||||||
| Indicated | 1.1 | 35 | 3.7 | 1,289 | 0.07 | 24 | ||||||||||||||||||||
| Konkola Mine | Measured + Indicated | 1.1 | 39 | 3.7 | 1,430 | 0.07 | 27 | |||||||||||||||||||
| Inferred | 1.1 | 249 | 3.4 | 8,353 | 0.06 | 150 | ||||||||||||||||||||
| Total | - | 288 | 3.4 | 9,783 | 0.06 | 177 | ||||||||||||||||||||
| Indicated OP | 0.50 | 2.2 | 1.4 | 31 | 0.12 | 3 | ||||||||||||||||||||
| Indicated UG | 1.1 | 13 | 1.6 | 202 | 0.04 | 5 | ||||||||||||||||||||
| COP DF | Measured + Indicated | - | 15 | 1.6 | 233 | 0.05 | 8 | |||||||||||||||||||
| Inferred | - | - | - | - | - | - | ||||||||||||||||||||
| Total | 15 | 1.6 | 233 | 0.05 | 8 | |||||||||||||||||||||
| Measured | - | - | - | - | - | - | ||||||||||||||||||||
| Indicated | 0.9 | 13 | 2.6 | 345 | - | - | ||||||||||||||||||||
| COP E Ext | Measured + Indicated | 0.9 | 13 | 2.6 | 345 | - | - | |||||||||||||||||||
| Inferred | 0.9 | 9 | 2.4 | 221 | - | - | ||||||||||||||||||||
| Total | - | 23 | 2.5 | 566 | - | - | ||||||||||||||||||||
| TD03 | Indicated | 0.0 | 3 | 0.8 | 21 | 0.01 | 1 | |||||||||||||||||||
| TD04 | Indicated | 0.0 | 22 | 0.6 | 134 | 0.03 | 6 | |||||||||||||||||||
| TD05 | Measured | - | - | - | - | - | - | |||||||||||||||||||
| Indicated | 0.0 | 198 | 0.6 | 1,091 | 0.02 | 44 | ||||||||||||||||||||
| Measured + Indicated | 0.0 | 198 | 0.6 | 1,091 | 0.02 | 44 | ||||||||||||||||||||
| Inferred | 0.0 | 225 | 0.5 | 1,180 | 0.02 | 49 | ||||||||||||||||||||
| Total | - | 423 | 0.5 | 2,272 | 0.02 | 93 | ||||||||||||||||||||
| Measured | - | 4.1 | 3.5 | 140 | 0.08 | 3 | ||||||||||||||||||||
| Indicated | - | 286 | 1.1 | 3,114 | 0.03 | 83 | ||||||||||||||||||||
| Total KCM | Measured + Indicated | - | 290 | 1.1 | 3,255 | 0.03 | 86 | |||||||||||||||||||
| Inferred | - | 483 | 2.0 | 9,755 | 0.04 | 199 | ||||||||||||||||||||
| Total | - | 773 | 1.7 | 13,009 | 0.04 | 284 | ||||||||||||||||||||
| amcconsultants.com | 23 |
| S-K 1300 TRS: KCM Integrated Operations (Initial Assessment) | |
| Konkola Copper Mines Plc | 0424076 |
Notes:
| · | Mineral Resources are reported with an effective date of 1 April 2026. |
| · | No Mineral Reserves are declared as part of this Initial Assessment. Mineral Resources are reported in their entirety. |
| · | Classification in accordance with S-K 1300. |
| · | Approximately 63% of KCM Mineral Resources are classified as Inferred (483 Mt of 773 Mt). Inferred Mineral Resources are considered too speculative geologically to be categorised as Mineral Reserves at this time, and there is no certainty that Inferred Mineral Resources will be converted to higher confidence categories with additional exploration. |
| · | Cut-off grades are applied on an asset-by-asset basis as set out in the individual deposit resource tables in Sections 11.3 to 11.4. |
| · | Cobalt grades for TD03, TD04 and TD05 are reported for geological completeness. Cobalt is not recovered in the TLP electrowinning process and no cobalt revenue is attributed to TD03, TD04 or TD05 in the economic analysis. |
| · | Point of reference: In situ material. |
| · | Metallurgical recovery — Konkola Mine: Concentrator 86.5% Cu (Full Resource Case life-of-mine average; M&I Case 89.2%), 60% Co; Smelter 98.1% Cu, 30% Co; Concentrate payable Cu 96.8%. |
| · | Metallurgical recovery (LOM Average) – Nchanga: Concentrator 53.9% Cu (varies by deposit); Smelter 98.1% Cu. |
| · | Metallurgical recovery — Nchanga TLP processing routes: Recovery assumptions vary by deposit and processing route. TD03 and TD04 — existing Nchanga TLP, ambient leach: 74.8% ASCu recovery, equivalent to approximately 48.5% TCu recovery to cathode. TD05 — processed through the existing Nchanga TLP (retrofitted with elevated temperature leach) under both the M&I Case and the Full Resource Case; under the Full Resource Case, the additional TD05 throughput required to process the larger Mineral Resource scope is also processed through the proposed TLP 2 facility (refer Section 14.5), with both plants operating in parallel and using elevated temperature leach. TCu recovery to cathode is determined by feed grade per Section 10.4.4.5 and capped at 82% for TCu grades above 1.5%. Case-level blended TCu recoveries to cathode are reported in Table 1.13 and Table 19.2 (66.8% Full Resource Case; 56.7% M&I Case) and reflect the deposit mix, feed scheduling, and the timing of the elevated temperature leach upgrade. |
| · | Processing route — M&I Case: Konkola / Nchanga Concentrator → Nchanga Smelter → Nkana Refinery; TD03 / TD04 / TD05 via the existing Nchanga TLP. |
| · | Processing route — Full Resource Case: as for the M&I Case, with the existing Nchanga TLP retrofitted with Elevated Temperature Leach (ETL); the larger TD05 throughput required under the Full Resource Case is processed across two facilities in parallel — the existing Nchanga TLP and a new proposed TLP 2 facility, also designed with ETL (refer Section 14.5). |
| · | Tonnage and grade are rounded; this may result in minor computational discrepancies. |
| · | Mineral Resources are 100% attributable to KCM. |
The Mineral Resource classification incorporates distance to drillhole support based on a drillhole spacing study, base of mining depletion, geological and grade continuity, estimation confidence and knowledge of the Konkola mineralisation from 67 years of mining.
The total Measured and Indicated Mineral Resource is concentrated within areas of high drilling density and well-established geological control, particularly in the central and upper portions of the Konkola deposit. Inferred material is more prevalent at depth and along strike extensions, where drilling density remains limited.
| 1.7 | Mineral Reserve estimate |
No Mineral Reserves are declared in this Initial Assessment. Mineral Reserves for the KCM Integrated Operations have been separately estimated and declared in the companion Preliminary Feasibility Study Technical Report Summary: KCM Integrated Operations (AMC Consultants, effective 1 April 2026). The reader is directed to the PFS TRS for the Mineral Reserve estimate, supporting mine plan, modifying factors, and economic analysis.
Mineral Resources that are not Mineral Reserves do not have demonstrated economic viability.
| 1.8 | Development and operational status |
KCM is a brownfield operation with over 95 years of continuous mining history. The Konkola Mine, Nchanga smelter, Nkana refinery, and associated processing infrastructure are established, operational facilities. KCM’s integrated metal production peaked at 160,000 tonnes per annum in FY2013 and subsequently declined to approximately 55,000 tonnes per annum during the provisional liquidation period (2019-2024). Following the return of operational control to Vedanta in July 2024, KCM has commenced a restart and ramp-up of operations.
| amcconsultants.com | 24 |
| S-K 1300 TRS: KCM Integrated Operations (Initial Assessment) | |
| Konkola Copper Mines Plc | 0424076 |
| 1.8.1 | Konkola |
Konkola is an established underground copper mining operation located near Chililabombwe, Republic of Zambia. Development activities are centered on the Konkola Deep Mining Project (KDMP), which provides access to deeper sections of the orebody via vertical shafts and underground declines. Mining is primarily undertaken using longitudinal longhole open stoping (LHOS) methods. Paste fill is not currently used at the operation, however it is a critical component for future extraction of flatly dipping areas of the orebody, where panel stoping is planned. Paste fill will enable secondary stope extraction and assist with regional geotechnical stability.
The operation is characterised by exceptionally high groundwater inflows and is regarded as one of the wettest underground mines globally, with an ore hoist-to-water pumping ratio of approximately 1:49. A comprehensive dewatering system is in place, including staged pumping stations, sumps, and water management infrastructure to maintain mine access and safety. The mine’s ventilation systems have been progressively expanded to address increasing depth and the use of underground diesel fleets. Personnel access is provided via shaft hoisting systems and declines, supported by underground refuge chambers and surface infrastructure.
AMC's LOM hydrological analysis identified significant water recirculation at Konkola, estimated at 25-50% based on hydrological interpretation and incorporating previous studies (Dr Kawawa Banda et al, “Seepage Estimation Using Discharge Measurements in the Upper Kafue River, Zambia”, 2017; and Konkola Surface Exclusion Plan, 2025). A scoping study evaluated piping discharge water to the Kafue River using large-diameter HDPE pipes to minimise recirculation. The estimated capital cost is $20 million (M), with a projected payback period of 2-3 months based on current dewatering system power consumption. Reducing recirculation could yield substantial operating and capital cost savings.
Surface facilities include the Konkola concentrator, where run-of-mine (ROM) ore is processed through crushing, milling, flotation, and dewatering. The produced concentrate is transported to the Nchanga smelter, with final copper production completed at the Nkana refinery via electrorefining.
Planned infrastructure upgrades at Konkola include:
| · | Refurbishment and optimisation of the concentrator circuit to improve throughput and metallurgical recovery. |
| · | Upgrades to tailings pumping coupled with a paste fill plant and distribution system to facilitate a change in mining method required to optimise resource recovery. |
| · | Installation of a new pump station at 1,390 mL required for dewatering of the orebody, which is necessary to facilitate mining. |
| · | Improvements to energy efficiency and alignment of processing capacity with underground production targets. |
Additionally, portions of the tailings stream are to be directed to the underground paste fill system, supporting sustainable mining and reduced surface deposition requirements.
| 1.8.2 | Nchanga |
Nchanga, located near Chingola, comprises both open pit and underground mining operations. The open pits historically targeted extensive near-surface oxide and supergene-enriched copper mineralisation, while the underground operation focused on deeper sulfide zones, including the Nchanga Block Cave.
The open pit operations have been significantly scaled back, with current activity centered on reclamation, small-scale remnant extraction, and waste management. However, opportunities remain to extend pit limits or exploit satellite pods through selective mining, subject to further study and economic assessment.
| amcconsultants.com | 25 |
| S-K 1300 TRS: KCM Integrated Operations (Initial Assessment) | |
| Konkola Copper Mines Plc | 0424076 |
The Nchanga Underground operation is largely centered on remnant mining and the final stages of block caving. Production has declined as ore flow from the block cave reduces, but pockets of recoverable mineralisation remain accessible via selective stoping or slusher-based extraction methods.
Surface processing at Nchanga includes:
| · | The Nchanga concentrators, which historically processed both open pit and underground ore. |
| · | The Nchanga TLP, which reprocesses material from TD03 and TD04 and, going forward, the Measured and Indicated portion of the TD05 Mineral Resource, recovering copper through acid leaching, solvent extraction, and electrowinning. |
| · | The Nchanga smelter, which processes concentrate from both Konkola and historical Nchanga sources. |
Planned and ongoing initiatives at Nchanga include:
| · | Optimisation of the existing Nchanga TLP, including the proposed Elevated Temperature Leach (ETL) upgrade to improve copper recovery from refractory acid-soluble copper minerals (M&I Case and Full Resource Case; refer Section 18.6.2). |
| · | Construction and commissioning of the proposed TLP 2 facility under the Full Resource Case, designed to provide additional tailings processing capacity to enable the larger TD05 throughput required under the Full Resource Case. TLP 2 will utilise elevated-temperature leaching, solvent extraction, and electrowinning to produce LME Grade A copper cathode, operating in parallel with the existing Nchanga TLP (refer Section 14.5 and Section 18.6.1). |
| · | Commissioning of TD06 as a new active tailings storage facility, enabling cessation of fresh tailings deposition at TD05 to support reclamation operations. |
| · | Continued monitoring and maintenance of operational TSFs (TD05 and Lubengele) consistent with Zambian regulatory and ICMM tailings management requirements. |
| · | Evaluation of open pit expansion and underground remnant extraction options. |
| · | Refurbishment of selected processing circuits to maintain operational integrity. |
| 1.9 | Mining methods |
KCM's mining operations utilise a range of underground and surface mining methods, selected in accordance with orebody geometry and existing infrastructure.
The Konkola Mine targets the Kirilabombwe orebody to depths exceeding 2,000 m. Mining is conducted through mechanised longitudinal longhole open stoping (LHOS), accessed via vertical shafts and decline infrastructure. A redesign of the Konkola Deeps mine plan has changed the mining method in flatly dipping areas from post pillar cut-and-fill to panel stoping with paste fill, reducing development requirements by approximately 200 km and US$1 billion (B) over the LOM. Construction of a new pump station at 1,390 mL is critical for dewatering to access deeper mineralisation.
The Nchanga Business Unit comprises open pit and underground operations. Open pit mining uses conventional truck-and-shovel methods. Underground mining includes an active block cave with production forecast to decline over the next two years, after which remnant ore will be recovered using selective open stoping.
The Nchanga TLP recovers copper from historical tailings at TD03 and TD04, with opportunities identified to assess potential recovery from TD05 and Lubengele tailings facilities.
| 1.10 | Processing and recovery methods |
KCM's processing infrastructure comprises the Konkola concentrator, Nchanga concentrators, Nchanga TLP, Nchanga flash smelter, and Nkana refinery. These assets are operationally integrated and cannot be economically separated.
| amcconsultants.com | 26 |
| S-K 1300 TRS: KCM Integrated Operations (Initial Assessment) | |
| Konkola Copper Mines Plc | 0424076 |
Key processing parameters:
| · | Konkola Concentrator Recovery: 86.5% copper recovery to concentrate for the Full Resource Case, 89.2% for the M&I Case |
| · | Concentrate Grade: Approximately 33% copper |
| · | Smelter copper recovery: 98.1% |
| · | Concentrate Payable Cu: 96.8% |
| · | Nchanga TLP recovery (TCu to cathode): |
| — | TLP 1 only, conventional ambient leach (historical): 44.7% |
| — | TLP 1 with Elevated Temperature Leach retrofit, M&I Case: 56.7% |
| — | TLP 1 with Elevated Temperature Leach retrofit, Full Resource Case: 59.3% |
| — | TLP 2 with Elevated Temperature Leach (new build), Full Resource Case: 73.9% |
| — | Case-level blended TLP recovery: 56.7% (M&I Case); 66.8% (Full Resource Case combining TLP 1 and TLP 2 operations in parallel) |
Sulfide ores from Konkola and Nchanga are processed via conventional flotation to produce copper concentrates grading approximately 33% Cu. Concentrates are processed in the Nchanga flash smelter to produce copper anodes, which are refined at the Nkana refinery to produce LME Grade A copper cathode.
The Nchanga TLP processes oxide tailings from TD03, TD04, and Nchanga concentrator tailings through sulfuric acid leaching, solvent extraction, and electrowinning to produce copper cathode. The Nchanga TLP has demonstrated capacity of 50,000 tpd with estimated copper production of 118 tpd.
TD05 has been classified as a Mineral Resource and is included in both the M&I Case and the Full Resource Case. Under the M&I Case, TD05 is processed through the existing Nchanga TLP (retrofitted with elevated temperature leach). Under the Full Resource Case, the larger TD05 throughput is processed across the existing Nchanga TLP and the proposed TLP 2 facility operating in parallel, both using elevated temperature leach.
The LOM Full Resource plan assumes purchase of 300,000–315,000 tpa of third-party concentrate from regional Zambian and DRC Copperbelt mines to supplement KCM's own internal feed. This is a process requirement of the Nchanga Flash Smelting Furnace, which requires a specific Fe / SiO₂ ratio in the feed blend that cannot be achieved using KCM's own concentrates alone, as both the Konkola and Nchanga concentrators produce high-silica concentrate (typically 20–22% SiO₂ against a preferred limit of less than 15% SiO₂). Third-party concentrate is purchased on a metal-return basis, KCM takes ownership of the concentrate and bears the associated price risk, and is not a toll processing arrangement.
Third-party concentrate has been sourced historically from large-scale open pit and underground copper producers in the Zambian and DRC Copperbelt, providing a diverse regional supply base within 200 to 500 kilometres of the Nchanga Smelter. The Copperbelt region produced approximately 4.3 million tonnes of copper in 2025 and is expected to grow further through 2030, providing a substantial regional concentrate supply base. However, a number of the largest Copperbelt mine expansions are expected to be accompanied by dedicated on-site smelting capacity over the LOM period, which would reduce the volume of concentrate available to third-party buyers such as KCM. In particular, Ivanhoe Mines has announced plans to commission an on-site direct-to-blister smelter at the Kamoa-Kakula Copper Complex in the DRC (500,000 tpa capacity), which, once operational, is expected to process Kamoa-Kakula's own concentrate internally rather than making it available to regional third-party smelters. Kamoa-Kakula concentrate has historically been one of the most desirable high-grade, low-silica feeds available to the Nchanga Flash Smelting Furnace (FSF) and its anticipated withdrawal from the regional market represents a material change in the third-party concentrate supply landscape over the LOM. While growing overall Copperbelt production from mines without access to proprietary smelting capacity is expected to partially offset this reduction, the absence of binding long-term supply contracts beyond FY2026 is identified as an essential risk requiring resolution. A structural factor supporting supply continuity is the Zambian government's 10% export levy on copper concentrate, which creates a material economic incentive for Zambian producers to supply domestic smelters rather than export, and the comparatively high logistics cost of shipping DRC-origin concentrate to overseas smelters relative to regional Copperbelt facilities effectively anchors domestically produced concentrate within the Zambian processing value chain. The QPs consider that there is a reasonable basis to expect that third-party concentrate will remain available at the volumes assumed in the LOM plan, given the scale of regional Copperbelt production and the structural inability of many smaller producers to develop proprietary smelting capacity. However, the absence of binding supply contracts beyond 2026 introduces commercial uncertainty that the QPs consider to be a material risk to the LOM plan, and securing ongoing supply arrangements is identified as an essential commercial requirement. Further detail on sourcing, availability, contract terms, alternatives, and the basis for this assessment is provided in Section 14.4.3.
| amcconsultants.com | 27 |
| S-K 1300 TRS: KCM Integrated Operations (Initial Assessment) | |
| Konkola Copper Mines Plc | 0424076 |
The sensitivity of project economics to this dependency has been assessed by modelling the removal of third-party concentrate from the LOM plan entirely, as set out in Section 19.3.2. The post-tax NPV₈% impact comprises two components: the direct smelter contribution, and the incremental acid procurement cost arising from reduced smelter throughput (calculated as the delta between the US$175/t external market price and the US$130/t internal transfer price).
For the M&I Case, the direct smelter contribution accounts for approximately US$140M, or 5% of the base case NPV₈% of US$2,640M, with a further US$70M (3%) from incremental acid procurement. The combined reduction of US$210M reduces the M&I Case post-tax NPV₈% to US$2,430M.
For the Full Resource Case, the direct smelter contribution accounts for approximately US$196M, or 2% of the base case post-tax NPV₈% of US$8,637M, with a further US$100M (1%) from incremental acid procurement. The combined reduction of US$296M (3%) reduces the Full Resource Case post-tax NPV₈% to US$8,341M.
The KCM Integrated Operations remain economic in both cases on the basis of KCM's own Mineral Resource production. The uninterrupted sourcing of third-party concentrate is nonetheless identified as an essential operational and commercial requirement throughout the life-of-mine.
| 1.11 | Infrastructure |
KCM’s integrated operations span three principal sites connected by established road infrastructure across the Copperbelt Province. Run-of-mine ore from the Konkola Mine at Chililabombwe is processed through the on-site Konkola Concentrator. Copper concentrate is transported approximately 20 km by road to the Nchanga Flash Smelter at Chingola, with blister copper then transported approximately 55 km to the Nkana Refinery at Kitwe for electrorefining to LME Grade A cathode. All inter-site routes utilise high-quality tarmac roads capable of supporting loads up to 50 tonnes.
Power is supplied under a long-term agreement with Copperbelt Energy Corporation (CEC), providing 200 MW capacity to all KCM sites. This agreement has been in place for over 20 years. Water supply for processing operations is sourced primarily from the Kafue River system and from dewatering operations at the Konkola Mine, which pumps approximately 350,000 m³/day. The Konkola Mine operates a comprehensive staged dewatering system including pumping stations, sumps, and water management infrastructure critical to maintaining mine access and safety.
Export logistics for refined copper cathode rely on road freight to rail transfer points and onward transport to regional ports, including Dar-es-Salaam (Tanzania), Walvis Bay (Namibia), and Durban (South Africa). Further details on infrastructure and logistics are provided in Sections 4.
| amcconsultants.com | 28 |
| S-K 1300 TRS: KCM Integrated Operations (Initial Assessment) | |
| Konkola Copper Mines Plc | 0424076 |
| 1.12 | Economic analysis summary - dual presentation |
In accordance with Item 1302(d)(4)(ii)(C) of Regulation S-K, the economic analysis is presented with equal prominence for both the Full Resource Case (including Inferred Resources) and the Measured and Indicated Case (excluding Inferred Resources).
CAUTIONARY STATEMENT REGARDING INITIAL ASSESSMENT
This Initial Assessment is preliminary in nature. It includes Inferred Mineral Resources that are considered too speculative geologically to have the economic considerations applied to them that would enable them to be categorised as Mineral Reserves, and there is no certainty that this Initial Assessment will be realised. Mineral Resources that are not Mineral Reserves do not have demonstrated economic viability.
INFERRED MINERAL RESOURCE PROPORTION
Approximately 63% of KCM Mineral Resources are classified as Inferred (483 Mt of 773 Mt). At Konkola Mine, approximately 87% of Resources are classified as Inferred (249 Mt of 288 Mt). Inferred Mineral Resources have a lower level of geological confidence and are considered too speculative to have economic considerations applied that would enable them to be categorised as Mineral Reserves at this time. There is no certainty that Inferred Mineral Resources will be converted to higher confidence categories, although this is expected to be achievable with continued systematic exploration.
IMPORTANT DISCLOSURE
The economic results INCLUDING Inferred Resources are preliminary and speculative. The economic results EXCLUDING Inferred Resources represent the M&I Case and demonstrate the economic viability of the project based on Measured and Indicated Mineral Resources only.
This IA is based on a comprehensive LOM Plan that includes mining from:
| · | Konkola Mine – Measured, Indicated, and Inferred Mineral Resources (operating). |
| · | Nchanga Indicated and Inferred Resources: |
| — | COP DF open pit mine (operating in 2026). |
| — | Nchanga COP E Underground (planned). |
| — | Nchanga COP DF Underground (planned). |
| · | Reclamation of TD03, TD04, and TD5, processed through the Nchanga TLP (operating) and the proposed Nchanga TLP 2 plant (proposed for construction). |
The IA is a preliminary technical and economic study of the economic potential of all parts of the KCM operations including Konkola Mine, Nchanga Tailings Recovery, and Nchanga mining operations. The confidence in the overall LOM scenario is at an IA level of confidence.
The IA of the Nchanga deposits and the Inferred Mineral Resource component of the Konkola Mine is preliminary in nature; it includes Inferred Mineral Resources that are considered too speculative geologically to have the economic considerations applied to them that would enable them to be categorised as Mineral Reserves and as such, these Mineral Resources have not been demonstrated to have economic viability. There is no certainty that the IA will be realised.
| amcconsultants.com | 29 |
| S-K 1300 TRS: KCM Integrated Operations (Initial Assessment) | |
| Konkola Copper Mines Plc | 0424076 |
| 1.12.1 | Key assumptions |
| · | Copper Price: P75 consensus pricing as per Table 16.1 (ranging from US$11,101/t to US$12,793/t over the LOM assessment period). |
| · | Cobalt Price: P50 consensus pricing (ranging from US$42,262/t to US$52,465/t over the LOM assessment period). |
| · | Discount Rate: 8% real, pre-tax. |
| 1.12.2 | Production plan |
| · | The basis of the economic model is the mining, processing, and smelting schedule as presented in this report which includes mined tonnes (ore and waste), development meters, processed ore tonnes, grade, and recoveries. |
| · | The Full Resource Case comprises production from Measured, Indicated, and Inferred Resources. |
| · | The M&I Case comprises production from Measured and Indicated Mineral Resources at Konkola Mine and Indicated Mineral Resources in TD03, TD04 and TD05. |
The smelter feed profiles for both scenarios are shown in Figure 1.1 and Figure 1.2. Both cases assume third-party concentrate purchases to maintain smelter throughput at approximately 850 ktpa.
Figure 1.1 KCM Smelter Feed Profile – Full Resource Case (incl. external purchased concentrates)
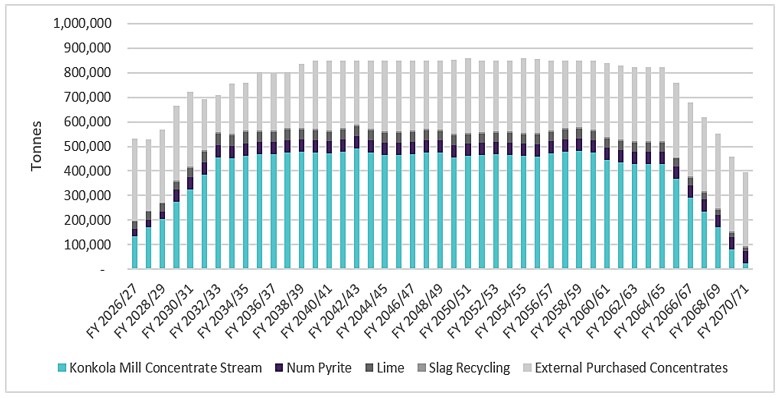
Source: AMC, 2026.
| amcconsultants.com | 30 |
| S-K 1300 TRS: KCM Integrated Operations (Initial Assessment) | |
| Konkola Copper Mines Plc | 0424076 |
Figure 1.2 KCM Smelter Feed Profile – M&I Case (incl. external purchased concentrates)
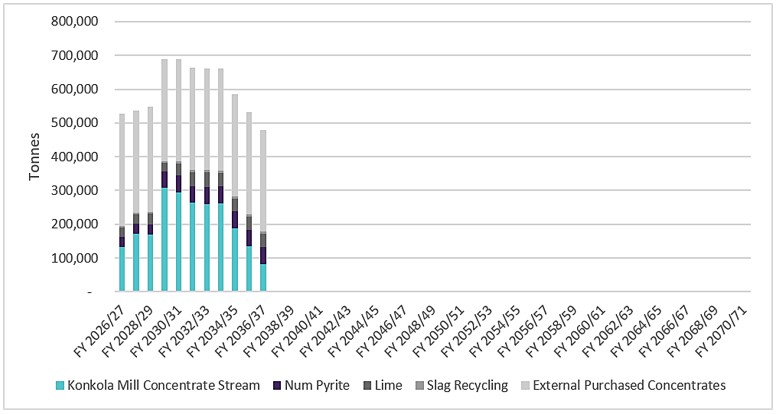
Source: AMC, 2026.
The total copper sold from the KCM operations across the life of operations, including copper anodes from the smelter, copper in cobalt alloy, and copper cathodes produced by the Nchanga TLP, is shown in Figure 1.3 and Figure 1.4.
Figure 1.3 Total Copper Sold – Full Resource Case
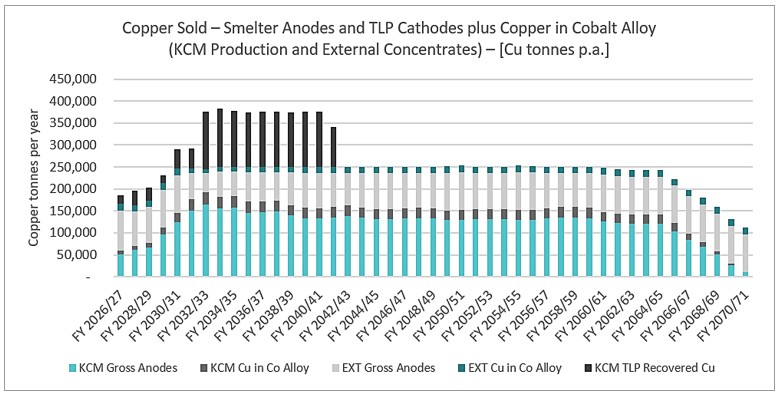
Source: AMC, 2026.
| amcconsultants.com | 31 |
| S-K 1300 TRS: KCM Integrated Operations (Initial Assessment) | |
| Konkola Copper Mines Plc | 0424076 |
Figure 1.4 Total Copper Sold – M&I Case
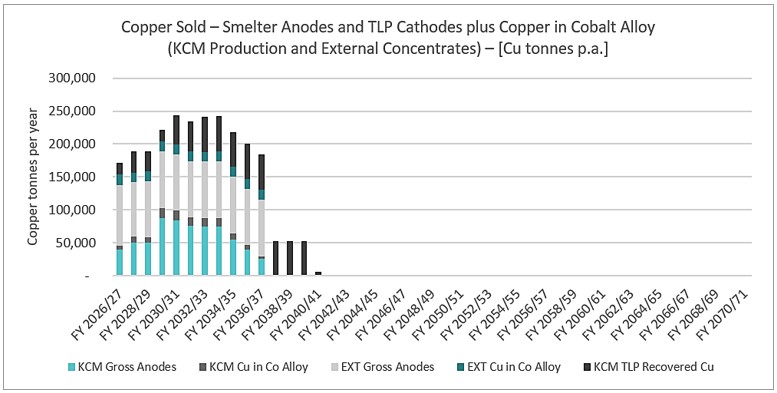
Source: AMC, 2026.
The production profiles for both scenarios are shown in Figure 1.5 and Figure 1.6. The Full Resource Case recovers a total of 7,880kt (7.9 Mt) of payable copper over approximately 45 years from KCM’s own ore (Konkola Mine, Nchanga Business Unit, and Nchanga TLP), and the M&I Case recovers a total of 1,446 kt (1.45 Mt) of payable copper over approximately 15 years. These figures exclude copper produced from third-party concentrates processed through the Nchanga Smelter, which generates additional copper anodes that are reported separately in Table 1.3.
Figure 1.5 KCM Production Profile – Full Resource Case
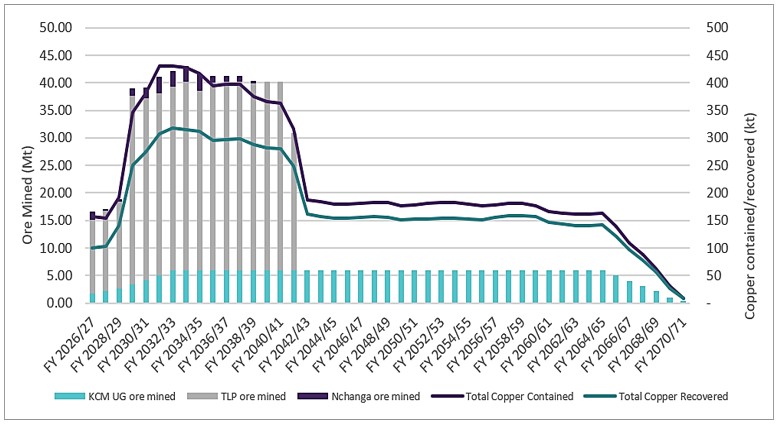
Source: AMC, 2026.
| amcconsultants.com | 32 |
| S-K 1300 TRS: KCM Integrated Operations (Initial Assessment) | |
| Konkola Copper Mines Plc | 0424076 |
Figure 1.6 KCM Production Profile – M&I Case
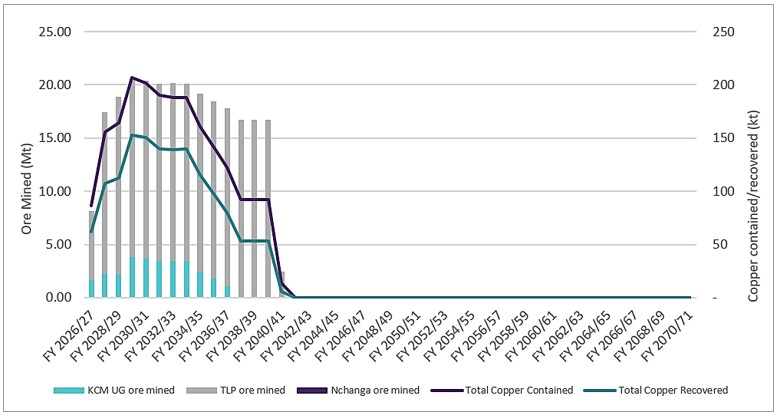
Source: AMC, 2026.
| 1.12.3 | Capital and operating costs |
Capital and operating costs for mining, processing, administration, and other costs to support the LOM for both Konkola Mine and Nchanga Operations are described in detail in Section 18 of this report. The capital and operating costs for Konkola Mine have been developed to PFS level of accuracy (±25%). The unit operating cost estimates have been applied across the life of the operations.
The capital and operating costs for Nchanga mining operations (COP DF, COP E Extension, and Nchanga Underground) are based on historical operating data and benchmarked estimates and are defined to a lesser degree of confidence than Konkola Mine. These costs meet the requirements of an Initial Assessment but have not been developed to PFS-level confidence. Nchanga mining operations are included in the Full Resource Case only and are not part of the M&I Case.
The capital and operating costs for the existing Nchanga TLP base operations (conventional ambient leach, as currently operated) are developed to PFS level of accuracy (±25%) and are presented in a separate Preliminary Feasibility Study (PFS) Technical Report Summary. The capital and operating costs for the proposed elevated temperature leach retrofit of the existing Nchanga TLP and for the proposed TLP 2 facility are developed at Initial Assessment level, based on vendor concept design (Nerin) and AMC's concept-level cost estimates, and meet the requirements of an Initial Assessment but have not been developed to PFS-level confidence.
Total capital expenditure for the Full Resource Case is US$7,595M over the approximately 45-year LOM, compared to US$1,699M for the M&I Case over approximately 15 years. Capital costs comprise growth capital for processing improvements and infrastructure upgrades, development capital for underground access and production development, and sustaining capital for ongoing operations including the Nchanga Smelter and Refinery. A summary of the capital cost estimates for both cases is presented in Table 1.3.
| amcconsultants.com | 33 |
| S-K 1300 TRS: KCM Integrated Operations (Initial Assessment) | |
| Konkola Copper Mines Plc | 0424076 |
Table 1.3 Capital cost summary
| Capital Category | Full Resource Case (US$M) | M&I Case (US$M) | ||||||
| Growth Capital | 1,626 | 342 | ||||||
| Capital Development | 3,419 | 569 | ||||||
| Sustaining Capital | 2,551 | 788 | ||||||
| Total Capital | 7,595 | 1,699 | ||||||
Note: Nchanga Business Unit includes COP DF open pit, COP E Extension, and Nchanga Underground. Nchanga TLP Operations includes the proposed new TLP 2 facility under Growth capital for the Full Resource Case only; the M&I Case includes only the existing Nchanga TLP and its proposed elevated temperature leach retrofit. Totals may not sum due to rounding.
Table 1.4 presents the capital cost breakdown by operation for the Full Resource Case. The majority of capital expenditure (US$4,954M) is attributable to Konkola Mine, comprising KDMP development capital, growth capital for dewatering and processing infrastructure, and sustaining capital over the extended LOM. Nchanga Business Unit capital of US$823M includes development of the COP E, and COP DF underground operations.
Table 1.4 Capital cost by operation – Full Resource Case (Including Inferred)
| Operation | Growth (US$M) | Development (US$M) | Sustaining (US$M) | Total (US$M) | ||||||||||||
| Konkola Mine | 455 | 2,887 | 1,612 | 4,954 | ||||||||||||
| Nchanga Business Unit | 247 | 532 | 44 | 823 | ||||||||||||
| Nchanga TLP Operations | 924 | - | 496 | 1,420 | ||||||||||||
| Nchanga Smelter & Refinery | - | – | 399 | 399 | ||||||||||||
| Total | 1,626 | 3,419 | 2,551 | 7,595 | ||||||||||||
Note: Nchanga Business Unit includes COP DF open pit, COP E Extension, and Nchanga Underground. Nchanga TLP Operations includes the proposed new TLP 2 facility under Growth capital. Totals may not sum due to rounding.
Table 1.5 presents the capital cost breakdown for the M&I Case. This case is based exclusively on Measured and Indicated Resources.
Table 1.5 Capital cost by operation – M&I Case (Excluding Inferred)
| Operation | Growth (US$M) | Development (US$M) | Sustaining (US$M) | Total (US$M) | ||||||||||||
| Konkola Mine | 189 | 569 | 302 | 1,060 | ||||||||||||
| Nchanga Business Unit | - | - | 7 | 7 | ||||||||||||
| Nchanga TLP Operations | 154 | - | 337 | 490 | ||||||||||||
| Nchanga Smelter & Refinery | - | - | 142 | 142 | ||||||||||||
| Total | 342 | 569 | 788 | 1,699 | ||||||||||||
Note: Konkola Mine M&I Case capital cost estimates are at PFS-level accuracy (±25%) with contingency of 10–15% depending on cost category, consistent with the separate PFS TRS (Table 18.1). Nchanga Business Unit includes Sustaining capital for the three Nchanga concentrator mills. Nchanga TLP Operations includes Growth capital for the proposed Elevated Temperature Leach (ETL) retrofit of the existing Nchanga TLP and Sustaining capital for the existing TLP. The M&I Case excludes the proposed TLP 2 facility and Nchanga Business Unit mining capital, which are included in the Full Resource Case only.
The accuracy of the capital and operating cost estimates varies by component, reflecting the different levels of study applied across the KCM operations. Table 1.6 summarises the cost estimate accuracy by component.
| amcconsultants.com | 34 |
| S-K 1300 TRS: KCM Integrated Operations (Initial Assessment) | |
| Konkola Copper Mines Plc | 0424076 |
Table 1.6 Capital cost estimate accuracy
| Cost Component | Accuracy Range | Study Level | ||
| Konkola Mine – Existing Operations | ±25% | PFS | ||
| Konkola Mine – KDMP Expansion | ±25% | PFS | ||
| Nchanga TLP – Existing Operations | ±25% | PFS | ||
| Nchanga Smelter & Refinery | ±25% | PFS | ||
| Nchanga TLP – ETL Retrofit | ±25–35% | IA | ||
| Nchanga TLP 2 | ±35–50% | IA | ||
| Nchanga COP DF Open Pit | ±35% | IA | ||
| Nchanga COP E, DF Underground | ±35–50% | IA |
Note: Accuracy ranges from ±25% for PFS-level estimates (Konkola Mine, existing Nchanga TLP, and Nchanga Smelter & Refinery) to ±25–50% for Initial Assessment-level estimates covering future TLP infrastructure (the proposed ETL retrofit and TLP 2 facility) and the Nchanga Business Unit mining operations. PFS-level estimates are supported by engineered designs and vendor quotations; IA-level estimates are based on benchmarked operating data, vendor concept design (Nerin), and AMC's concept-level cost estimates. Refer to Section 18 for detailed cost estimation methodology.
The average LOM unit operating costs by operation for the Full Resource Case are summarised in Table 1.7. Operating costs include mining, processing, and general and administrative (G&A) costs. Konkola Mine has the highest total unit operating cost at US$94.3/t ore, reflecting deep-level underground mining requirements, while Nchanga TLP Operations has the lowest at US$15.1/t due to the nature of tailings reprocessing.
Table 1.7 Average LOM unit operating cost by operation – Full Resource Case
| Operation | Mining (US$/t) | Processing (US$/t) | G&A (US$/t) | Total (US$/t) | ||||||||||||
| Konkola Mine | 74.0 | 15.1 | 5.1 | 94.3 | ||||||||||||
| Nchanga (OP + UG Combined) | 56.0 | 18.2 | 4.0 | 78.1 | ||||||||||||
| Nchanga TLP Operations | 0.8 | 14.4 | 0.9 | 16.1 | ||||||||||||
Note: Note: Full Resource Case includes Measured, Indicated, and Inferred Mineral Resources processed over the approximately 45-year LOM. Nchanga (OP + UG Combined) comprises COP DF open pit, COP E Extension, and Nchanga Underground operations; operating costs are at Initial Assessment-level confidence. Nchanga TLP Operations processing cost includes the operating cost of the proposed elevated temperature leach (ETL) retrofit of the existing Nchanga TLP and the proposed TLP 2 facility (Initial Assessment-level confidence; refer Section 14.5). Konkola Mine and existing Nchanga TLP operating costs are at PFS-level confidence and are presented in a separate Pre-Feasibility Study (PFS) Technical Report Summary.
Table 1.8 presents the average unit operating costs for both the Full Resource Case and the M&I Case. The lower unit cost for Konkola Mine in the Full Resource Case (US$94.3/t vs US$125.2/t) reflects economies of scale over the longer LOM period with higher sustained production rates. Nchanga Operations are included in the Full Resource Case only and are not part of the M&I Case.
Table 1.8 Average unit operating cost summary – dual presentation
| Operation | Unit | Full Resource Case | M&I Case | |||||||
| Konkola Mine | US$/t ore | 94.3 | 125.2 | |||||||
| Nchanga Operations | US$/t ore | 78.1 | - | |||||||
| Nchanga TLP Operations | US$/t ore | 16.1 | 16.7 | |||||||
Note: Operating costs include mining, processing, and site administration costs. Nchanga Operations refers to Nchanga Business Unit mining (COP DF open pit, COP E Extension, and Nchanga Underground) and is included in the Full Resource Case only. Nchanga TLP Operations unit cost includes the operating cost of the proposed elevated temperature leach (ETL) retrofit of the existing Nchanga TLP under both cases and the proposed TLP 2 facility under the Full Resource Case only. The Konkola Mine M&I Case unit operating cost ($125.2/t) is higher than the Full Resource Case ($94.3/t) due to shorter LOM (15 vs 45 years) and lower sustained production rates, reducing the dilution of fixed costs over total ore tonnage.
Table 1.9 presents total LOM operating costs for both scenarios. Total operating costs for the Full Resource Case are US$31,378M over the approximately 45-year LOM, compared to US$7,355M for the M&I Case over approximately 15 years.
| amcconsultants.com | 35 |
| S-K 1300 TRS: KCM Integrated Operations (Initial Assessment) | |
| Konkola Copper Mines Plc | 0424076 |
Table 1.9 Total LOM operating costs by operation – dual presentation
| Operation | Full Resource Case (US$M) | M&I Case (US$M) | ||||||
| Konkola Mine | 21,948 | 3,639 | ||||||
| Nchanga Business Unit (NBU) | 1,630 | 11 | ||||||
| Nchanga TLP Operations | 7,800 | 3,705 | ||||||
| Total Operating Costs by Operation | 31,378 | 7,355 | ||||||
| Ore Processed (kt) | 727,273 | 253,673 | ||||||
| Weighted Average Unit Cost (US$/t) | 43.14 | 28.99 | ||||||
Note: Nchanga TLP operating costs include the operating cost of the proposed elevated temperature leach (ETL) retrofit of the existing Nchanga TLP under both cases and the proposed TLP 2 facility under the Full Resource Case only. Nchanga Business Unit operating costs under the M&I Case relate to sustaining costs for the three Nchanga concentrator mills supporting smelter feed; NBU mining operations are included in the Full Resource Case only. Ore processed includes all sources feeding into the respective processing facilities. Weighted average unit cost is calculated across all operations.
Konkola Mine is the primary cost centre for both scenarios. Table 1.10 presents the detailed operating cost breakdown by major category for the Full Resource Case LOM. Production stoping (30%) and power costs (23%) together account for over half of total Konkola operating expenditure.
Table 1.10 Konkola Mine operating cost breakdown – Full Resource Case
| Cost category | LOM total (US$M) | % of total | Unit Cost (US$/t) | |||||||||
| Production Stoping | 6,477 | 30 | % | 27.8 | ||||||||
| Operating Development | 2,819 | 13 | % | 12.1 | ||||||||
| Backfill Operations | 366 | 2 | % | 1.6 | ||||||||
| Power Costs | 5,057 | 23 | % | 21.7 | ||||||||
| KCM Labour (direct) | 1,344 | 6 | % | 5.8 | ||||||||
| G&A | 1,195 | 5 | % | 5.1 | ||||||||
| Mine Services | 313 | 1 | % | 1.3 | ||||||||
| Tramming | 852 | 4 | % | 3.7 | ||||||||
| Mining Opex Subtotal | 18,423 | 84 | % | 79.1 | ||||||||
| Processing Costs | 3,524 | 16 | % | 15.1 | ||||||||
| Total Konkola Mine Operating Costs | 21,948 | 100 | % | 94.3 | ||||||||
| Ore Processed (Mt) | 232.8 | - | - | |||||||||
Note: LOM Total is over the approximately 45-year Full Resource Case life. Unit costs calculated on 232.8 Mt total ore processed. Operating development includes underground drives within production zones. Power costs include electricity supply to all underground and surface operations. Processing costs include concentrator reagents, grinding media, and plant labour.
Table 1.11 presents the Konkola Mine operating cost profile for the first five fiscal years. Unit operating costs decline from US$177.7/t in FY2026/27 to US$106.0/t in FY2030/31 as production ramps up from 1,669 kt to 4,189 kt per annum, reflecting the significant operating leverage inherent in the underground mining operation.
Table 1.11 Konkola Mine operating costs – first five years
| Parameter | FY2026/27 | FY2027/28 | FY2028/29 | FY2029/30 | FY2030/31 | LOM total | ||||||||||||||||||
| Ore Processed (kt) | 1,669 | 2,180 | 2,639 | 3,400 | 4,189 | 232,775 | ||||||||||||||||||
| Operating Costs (US$M) | 296.7 | 327.0 | 353.6 | 396.4 | 443.8 | 21,948 | ||||||||||||||||||
| Unit Cost (US$/t) | 177.7 | 150.0 | 134.0 | 116.6 | 106.0 | 94.3 | ||||||||||||||||||
Note: Higher unit costs in early years reflect fixed cost absorption at lower production rates during the KDMP development ramp-up period. LOM average unit cost of US$94.3/t assumes sustained production rates of approximately 6 Mtpa at steady state.
Table 1.12 presents the C1 cash cost and all-in sustaining cost (AISC) for each operation under both scenarios. C1 cash cost includes all direct mining, processing, and site G&A costs, net of by-product credits. AISC additionally includes sustaining capital and royalties.
| amcconsultants.com | 36 |
| S-K 1300 TRS: KCM Integrated Operations (Initial Assessment) | |
| Konkola Copper Mines Plc | 0424076 |
Table 1.12 C1 cash cost and AISC by operation – dual presentation
| Cost metric | Full Resource Case | M&I Case | ||||||
| KCM Underground | ||||||||
| C1 Cash Cost (US$M) | 22,951 | 3,886 | ||||||
| C1 Cash Cost (US$/lb Cu) | 1.79 | 2.40 | ||||||
| AISC (US$M) | 29,287 | 4,819 | ||||||
| AISC (US$/lb Cu) | 2.28 | 2.98 | ||||||
| Nchanga Business Unit (NBU) | ||||||||
| C1 Cash Cost (US$M) | 1,683 | 11 | ||||||
| C1 Cash Cost (US$/lb Cu) | 2.87 | – | ||||||
| Nchanga TLP Operations | ||||||||
| C1 Cash Cost (US$M) | 7,800 | 3,705 | ||||||
| C1 Cash Cost (US$/lb Cu) | 1.97 | 2.36 | ||||||
| AISC (US$M) | 9,793 | 4,507 | ||||||
| AISC (US$/lb Cu) | 2.47 | 2.87 | ||||||
Note:
| · | C1 and AISC are non-GAAP measures. C1 Cash Cost includes all direct mining, processing, and site G&A costs, and smelter and refinery costs net of by-product credits. AISC includes C1 plus sustaining capital and royalties. Full definitions and reconciliation provided in Section 18. |
| · | Segment totals for the Full Resource Case reconcile to Consolidated C1 within rounding. The M&I Case segment totals exceed Consolidated C1 by approximately US$0.9 billion because third-party concentrate processed through the Nchanga Smelter contributes a larger share of M&I integrated metal production; smelter costs allocated to segments on throughput basis therefore exceed the smelter cost netted at the integrated metal level applied at Consolidated. |
| 1.12.3.1 | Economic results |
The before-tax economic analysis is based on the project financial model developed to estimate annual cash flows and sensitivities for the KCM Operations that include Konkola Mine, Nchanga Underground operations, Nchanga open pits, Nchanga TLP used to process tailings from TD03, TD04, TD05, and Nchanga Smelter. The economic results are presented (Table 1.13) as a side-by-side comparison between the Full Resource Case and the Measured and Indicated Resource Case. The Nchanga TLP is part of the Nchanga Operations but has been separated out in the table below for clarity.
| amcconsultants.com | 37 |
| S-K 1300 TRS: KCM Integrated Operations (Initial Assessment) | |
| Konkola Copper Mines Plc | 0424076 |
Table 1.13 Summarised economic results
| Item | Unit | Full Resource Case (Including Inferred) | M&I Case (Excluding Inferred) | |||||||
| Production | ||||||||||
| Konkola Ore Mined | kt | 232,775 | 29,066 | |||||||
| Konkola Underground Head Grade | %TCu | 2.94 | 2.89 | |||||||
| Konkola Underground Recovery | % | 86.5 | 89.2 | |||||||
| NBU Ore Mined | kt | 20,861 | 0 | |||||||
| NBU Head Grade | %TCu | 2.42 | 0 | |||||||
| NBU Recovery | % | 53.9 | 0 | |||||||
| Nchanga TLP Ore Mined | kt | 473,636 | 224,607 | |||||||
| Nchanga TLP Head Grade | %TCu | 0.57 | 0.56 | |||||||
| Nchanga TLP Recovery (Total Cu Recovery) | % | 66.8 | 56.7 | |||||||
| Total Integrated Copper Production(1) | kt | 7,880 | 1,446 | |||||||
| Mine Life | years | ~45 | ~15 | |||||||
| Economic Metrics | ||||||||||
| Net Revenue | US$M | 88,194 | 16,724 | |||||||
| Total Operating Costs(2) | US$M | 33,276 | 8,002 | |||||||
| Total Capital Expenditure | US$M | 7,595 | 1,699 | |||||||
| C1 Cash Cost(3) | US$/lb Cu | 1.87 | 2.10 | |||||||
| All-in Sustaining Cost(3) | US$/lb Cu | 2.38 | 2.69 | |||||||
| Free Cash Flow (post-tax) | US$M | 29,072 | 4,296 | |||||||
| NPV₈% (post-tax, real) | US$M | 8,637 | 2,640 | |||||||
| IRR (post-tax) | % | 65 | N/A | |||||||
| Payback Period | years | ~3.3 | ~1.7 | |||||||
Notes:
| 1 | Integrated Metal Production is KCM's own payable copper (Konkola Mine + NBU + Nchanga TLP). Excludes copper from third-party concentrate processed at the Nchanga Smelter and Nkana Refinery. Refer to Table 19.3 (Full Resource Case production and cashflow schedule) and Table 19.4 (M&I Case production and cashflow schedule) for full breakdown. |
| 2 | Total Operating Costs comprises mining operating costs, smelter and refinery operating costs net of by-product credits, and treatment and refining charges (TC/RC). Refer to Table 1.9 for the full operating cost build. |
| 3 | C1 Cash Cost and AISC are non-GAAP measures calculated on KCM's own payable copper production (Integrated Metal Production basis). Refer to Figure 18.1. and Section 18. |
| 4 | IRR is not reported for the M&I Case. KCM is a brownfield producing operation, with capital distributed across the mine plan rather than concentrated in an initial construction phase. The modest Year 1 negative pre-tax free cash flow reflects incremental investment timing rather than a greenfield-type construction outflow, and a conventional IRR does not produce a meaningful measure of economic viability. |
The Full Resource Case (Including Inferred) represents the full potential of the KCM operations but is preliminary and speculative in nature, as described in the cautionary statement at the front of this report. The M&I Case (Excluding Inferred) demonstrates economic viability based on Measured and Indicated Resources only; a separate Preliminary Feasibility Study Technical Report Summary has been prepared on the basis of the M&I Case mine plan and technical parameters. An 8% annual discount rate has been applied to the cashflows in the Full Resource Case to yield a post-tax NPV of US$8.6B (US$12.1B pre-tax), while the M&I Case yields US$2.6B post-tax (US$3.4B pre-tax).
| 1.13 | Sensitivity analysis |
A sensitivity analysis on the NPV₈% was undertaken for both the Full Resource Case and M&I Case, testing copper price, cobalt price, operating costs, and capital costs. The results are shown in Figure 1.7, Figure 1.8,
Table 1.14, and Table 1.15. In both cases, the project is most sensitive to changes in copper price and operating costs.
| amcconsultants.com | 38 |
| S-K 1300 TRS: KCM Integrated Operations (Initial Assessment) | |
| Konkola Copper Mines Plc | 0424076 |
Figure 1.7 Sensitivity analysis graph – Full Resource Case
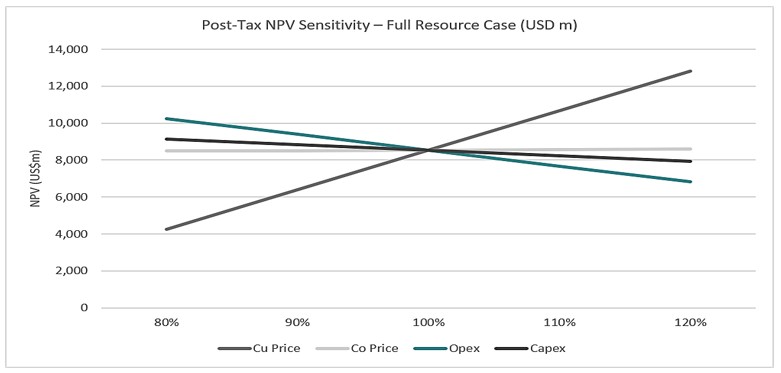
Source: AMC, 2026.
Sensitivity analysis on the NPV₈% for the Full Resource Case (Including Inferred) is summarised below.
Table 1.14 Sensitivity analysis results – Full Resource Case
| Parameter | 80% | 90% | 100% | 110% | 120% | |||||||||||||||
| Cu Price (NPV US$M) | 4,344 | 6,491 | 8,637 | 10,784 | 12,930 | |||||||||||||||
| Co Price (NPV US$M) | 8,587 | 8,612 | 8,637 | 8,662 | 8,687 | |||||||||||||||
| OPEX (NPV US$M) | 10,355 | 9,496 | 8,637 | 7,778 | 6,919 | |||||||||||||||
| CAPEX (NPV US$M) | 9,240 | 8,938 | 8,637 | 8,336 | 8,034 | |||||||||||||||
The post-tax NPV₈% sensitivity analysis for the M&I Case (Excluding Inferred) is shown below.
Figure 1.8 Sensitivity analysis graph – M&I Case
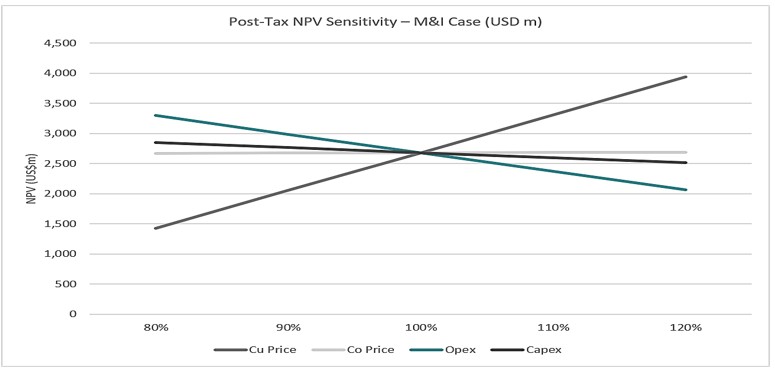
Source: AMC, 2026.
| amcconsultants.com | 39 |
| S-K 1300 TRS: KCM Integrated Operations (Initial Assessment) | |
| Konkola Copper Mines Plc | 0424076 |
Table 1.15 Sensitivity analysis results – M&I Case
| Parameter | 80% | 90% | 100% | 110% | 120% | |||||||||||||||
| Cu Price (NPV US$M) | 1,385 | 2,013 | 2,640 | 3,268 | 3,895 | |||||||||||||||
| Co Price (NPV US$M) | 2,630 | 2,635 | 2,640 | 2,645 | 2,650 | |||||||||||||||
| OPEX (NPV US$M) | 3,254 | 2,947 | 2,640 | 2,333 | 2,026 | |||||||||||||||
| CAPEX (NPV US$M) | 2,807 | 2,724 | 2,640 | 2,556 | 2,473 | |||||||||||||||
| 1.14 | Environmental studies, permitting, and social or community impact |
KCM operates under valid Large-Scale Mining Licenses issued by the Zambian Ministry of Mines. Key permits include environmental authorisations under the Zambia Environmental Management Agency (ZEMA), water abstraction permits for dewatering operations, and tailings storage facility (TSF) operating permits. All required permits for current operations are in place. The Konkola license (7076-HQ-LML) expires 30 March 2050, and the Nchanga TLP license (28174-HQ-MPL) expires 16 December 2045. No new permits are required for the activities contemplated in this Initial Assessment.
Environmental management at KCM is governed by the Environmental Management Act (EMA) of 2011 and its subsidiary regulations. Based on the 2020 EPF audit report, KCM's total EPF liability across all locations was US$129M. As per the assessment, Nkana was classified under Category 1, while Nchanga, Konkola and Nampundwe were classified under Category 2, with a total cash contribution liability of US$12,037,058. KCM made a cash contribution of US$5,464,682, leaving an outstanding balance of US$6,572,376 during the liquidation period. The outstanding balance has been filed as a claim under the Creditors' Scheme of Arrangement by the Mines Safety Department (MSD), which falls under the Government of the Republic of Zambia (GRZ), and will be settled in accordance with the waterfall mechanism provided thereunder. In relation to the period of provisional liquidation, during which KCM was not under the control of Vedanta, KCM has been granted a two-year moratorium on liabilities from the date of Board reinstatement (31 July 2024), during which no payments in respect of such liabilities are required. KCM is actively working across all operational sites to improve compliance with EPF requirements and enhance site categorisation, which is expected to reduce future cash contribution obligations. To strengthen compliance and provide an updated position, KCM commissioned an independent third-party assessment of EPF liabilities as at 31 December 2025, which assessed the total EPF liability at US$144M. The increase from the 2020 audit is attributable primarily to updated closure cost assumptions, revised scope of rehabilitation activities, inflationary adjustments, and expanded environmental obligations identified during the reassessment. Estimated closure costs of US$133M for the Full Resource Case and US$133M for the M&I Case have been included in the economic analysis (Section 19) and are based on preliminary closure planning, which may be refined in subsequent studies.
Tailings storage facilities are managed in accordance with the Global Industry Standard on Tailings Management (GISTM), with quarterly independent assessments conducted on all operational TSFs. Two operational TSFs (TD05 Muntimpa and Lubengele) are subject to ongoing stability monitoring and statutory compliance inspections. Further details on TSF conditions and management are provided in Section 15.9.
KCM’s operations are located within established Copperbelt mining towns (Chililabombwe, Chingola, and Kitwe) with long-standing community relationships. Community development, resettlement programs, and stakeholder engagement activities are managed by KCM as described in Section 17. The Qualified Persons (QPs) have relied on the Registrant for information regarding environmental and community matters as disclosed in Section 25.
| amcconsultants.com | 40 |
| S-K 1300 TRS: KCM Integrated Operations (Initial Assessment) | |
| Konkola Copper Mines Plc | 0424076 |
| 1.15 | Qualified Person's conclusions |
| 1.15.1 | Initial Assessment status |
This Initial Assessment is preliminary in nature. It includes Inferred Mineral Resources that are considered too speculative geologically to have the economic considerations applied to them that would enable them to be categorised as Mineral Reserves, and there is no certainty that this Initial Assessment will be realised. Mineral Resources that are not Mineral Reserves do not have demonstrated economic viability.
Approximately 63% of KCM Mineral Resources are classified as Inferred (483 Mt of 773 Mt). At Konkola Mine, approximately 87% of Mineral Resources are classified as Inferred (249 Mt of 288 Mt). The QP considers that significant additional drilling and technical studies are required to upgrade Inferred Resources to higher confidence categories. There is no certainty that Inferred Mineral Resources will be converted to higher confidence categories, although this is expected to be achievable with continued systematic exploration.
| 1.15.2 | Economic assessment |
The Full Resource Case (Including Inferred) returns a post-tax NPV₈% of US$8,637M (US$12,050M pre-tax) over an approximately 45-year mine life. The M&I Case (Excluding Inferred) returns a post-tax NPV₈% of US$2,640M (US$3,418M pre-tax) over an approximately 15-year mine life, demonstrating that the Measured and Indicated Mineral Resource portion of the KCM operations has a positive economic outcome independent of Inferred Resources. The Full Resource Case includes Inferred Mineral Resources that do not have demonstrated economic viability; there is no certainty that the cash flows presented for the Full Resource Case will be realised. The economic results for both cases are presented with equal prominence in Section 19 of this report.
Realisation of the value indicated by the Full Resource Case is dependent on adequate and timely investment of capital and the successful upgrade of Inferred Resources to higher confidence categories through continued drilling programs.
| 1.15.3 | The QP recommends |
| · | A phased resource infill and extension drilling program at Konkola Mine (estimated cost US$11.5M over 18 months) to increase geological confidence and support the conversion of Inferred Resources to Indicated and Measured categories, enabling future Mineral Reserve estimation. |
| · | Completion of the Lubengele (Konkola) auger drilling program currently underway to generate a first-time Mineral Resource estimate (estimated cost US$0.5M). |
| · | Completion of prefeasibility-level studies for the COP E Extension and COP DF underground projects at Nchanga, based on current drilling results and Mineral Resources, to advance these toward Mineral Reserve estimation. The Nchanga resource estimates should be updated to incorporate revised geological interpretations and modern estimation techniques (estimated cost US$1.5M). |
| · | Completion of a prefeasibility-level study for the proposed TLP 2 facility and TD05 reclamation, based on the TD05 Mineral Resource estimate and the conceptual TLP 2 design presented in this Initial Assessment, to advance the Measured and Indicated portion of the TD05 Mineral Resource toward Mineral Reserve estimation (estimated cost US$1.5M). |
| · | Supporting technical studies, including mining studies for Konkola Mine, processing and metallurgical studies, and infrastructure studies (combined estimated cost US$3.5M). |
| · | Updating of QAQC standard operating procedures and generation of master QAQC and Mineral Resource statement reports, in preparation for external audit of Mineral Resource estimates (estimated cost US$0.3M). |
| · | Completion of a Feasibility Study on the KCM Integrated Operations to support future investment and funding processes (estimated cost US$1.0M). |
The total recommended work program is estimated at US$20M over 18-24 months. A detailed summary of the recommended work program is presented in Section 23 (Table 23.1). There is no assurance that these recommendations will result in expanded Mineral Resources or Mineral Reserves.
| amcconsultants.com | 41 |
| S-K 1300 TRS: KCM Integrated Operations (Initial Assessment) | |
| Konkola Copper Mines Plc | 0424076 |
| 2 | Introduction |
AMC Consultants (UK) Limited (AMC) was engaged by Vedanta Resources Limited (Vedanta) to prepare this Initial Assessment (IA) Technical Report Summary (TRS) for the Konkola Copper Mines Plc (KCM) Integrated Operations located in the Zambian Copperbelt. This report has been prepared in compliance with Subpart 1300 of Regulation S-K (S-K 1300) as mandated by the United States Securities and Exchange Commission (SEC). This IA TRS presents a comprehensive Life-of-Mine (LOM) Plan for all KCM operations, including Konkola Mine, Nchanga Business Unit, and Tailings Reprocessing Operations. The technical contents of this report adhere to S-K 1300 requirements for reporting Mineral Resources.
In accordance with Item 1302(d)(4)(ii)(C), economic results are presented with equal prominence for both the Full Resource Case (Including Inferred) and the M&I Case (Excluding Inferred). A separate Preliminary Feasibility Study (PFS) Technical Report Summary has been prepared which presents the Reserve Case economic analysis and supports the Mineral Reserve estimate declared therein. The effective date of this report is 1 April 2026.
| 2.1 | Registrant for whom the TRS was prepared |
This TRS has been prepared for the registrant, CopperTech Metals Inc., and its subsidiary, KCM. KCM is the operator of the Konkola and Nchanga copper mining operations located in the Copperbelt Province of Zambia. KCM and its subsidiary company Konkola Mineral Resources Limited (KMRL) are the legal holders of the mineral rights associated with the Konkola and Nchanga license areas and operate under large-scale mining licenses.
| 2.2 | Terms of reference and purpose |
This report has been prepared in accordance with S-K 1300 of the U.S. SEC and provides a Technical Report Summary for the KCM Integrated Operations, comprising:
| · | Konkola Mine and Konkola Concentrator |
| · | Nchanga Underground and Open Pit operations |
| · | Nchanga Concentrators |
| · | Nchanga Tailings Leach Plant (TLP), including the proposed new TLP 2 facility under the Full Resource Case |
| · | Nchanga Smelter and Nkana Refinery |
| · | Nchanga Tailings Dams TD03, TD04, and TD05 |
The purpose of this report is to present Mineral Resource estimates, the proposed development and operating plans for those Mineral Resources, and associated technical assessments, including risk factors and economic considerations. The report constitutes an Initial Assessment for the KCM Integrated Operations, incorporating mine planning, extraction rates, and economic analysis for both the Full Resource Case and M&I Case.
This report was prepared by AMC, an independent mining consultancy, on behalf of Vedanta Resources Limited (Vedanta), the parent company of KCM. AMC has no material interest in KCM or its affiliates.
| 2.3 | Units of measure |
Unless otherwise stated, all units in this report are in metric (SI) units. Currency is presented in United States Dollars (US$). The exchange rate used for financial modelling and conversions is the FY2025/26 average exchange rate (12 months ended 31 March 2026) of ZMW 22.40 to US$1.00, unless stated otherwise.
| amcconsultants.com | 42 |
| S-K 1300 TRS: KCM Integrated Operations (Initial Assessment) | |
| Konkola Copper Mines Plc | 0424076 |
Grades are reported as total copper (TCu) in percent (%), total cobalt (TCo) in percent (%), and acid soluble copper (ASCu) in percent (%). Tonnages are reported as dry metric tonnes (t) unless otherwise explicitly stated.
The unit mL refers to meter level and is the vertical elevation with reference to the collar position of 4 Shaft at Konkola.
| 2.4 | Defined terms and abbreviations |
Table 2.1 defines the principal facility names, abbreviations, and technical terms used throughout this TRS. Each term is defined at first use in the body of the report; the standardised form shown in Table 2.1 is used thereafter.
Table 2.1 Defined terms and abbreviations
| Defined term | Abbreviation | Description |
| KCM Integrated Operations | — | The integrated mining, processing, smelting, and refining operations of Konkola Copper Mines Plc, comprising the Konkola Mine and Konkola Concentrator, Nchanga Business Unit (open pit and underground), Nchanga Concentrators, Nchanga Tailings Dams TD03, TD04, and TD05, the existing Nchanga TLP (including the proposed Elevated Temperature Leach retrofit under the M&I Case and the Full Resource Case), the proposed Nchanga TLP 2 facility (under the Full Resource Case), the Nchanga Smelter, and the Nkana Refinery, as described in Section 1.2. |
| Konkola Mine | — | The underground copper mine at Chililabombwe, Copperbelt Province, Zambia, operated by KCM. Includes all underground workings accessed via No. 1, No. 3, and No. 4 Shafts. |
| Konkola Deep Mining Project | KDMP | The development project providing deep-level access to the Konkola orebody via No. 4 Shaft and associated underground infrastructure. |
| Konkola Concentrator | — | The sulfide flotation concentrator located at the Konkola Mine site, processing run-of-mine ore from the Konkola Mine. |
| Tailings Dam 03 | TD03 | The historical tailings storage facility at the Nchanga site, from which tailings are reclaimed for processing through the Nchanga TLP. |
| Tailings Dam 04 | TD04 | The historical tailings storage facility at the Nchanga site, from which tailings are reclaimed for processing through the Nchanga TLP. |
| Tailings Dam 05 | TD05 | The current tailings storage facility at the Nchanga site, from which tailings are proposed to be reclaimed for processing through the Nchanga TLP under both the M&I and Full Resource Cases, and through the proposed TLP 2 facility under the Full Resource Case (both using Elevated Temperature Leach). |
| Nchanga TLP | Nchanga TLP | The acid leach and solvent extraction–electrowinning (SX-EW) facility at Nchanga that processes reclaimed tailings from TD03, TD04, and TD05 and current Nchanga Concentrators tailings. The existing TLP is to be retrofitted with Elevated Temperature Leach (ETL) under the M&I Case and the Full Resource Case. |
| Nchanga TLP 2 | TLP 2 | A proposed new tailings leach plant facility to be constructed at the Nchanga site under the Full Resource Case, designed with Elevated Temperature Leach (ETL) technology to provide additional tailings processing capacity in parallel with the existing Nchanga TLP. Refer Section 14.5. |
| Elevated Temperature Leach | ETL | A hydrometallurgical leaching process operated at elevated temperature (approximately 80°C) using sulfuric acid, which achieves higher copper extraction from refractory tailings material than conventional ambient-temperature leach. ETL is applied as a retrofit upgrade to the existing Nchanga TLP under the M&I Case and the Full Resource Case, and is incorporated in the design of the proposed TLP 2 facility under the Full Resource Case. |
| amcconsultants.com | 43 |
| S-K 1300 TRS: KCM Integrated Operations (Initial Assessment) | |
| Konkola Copper Mines Plc | 0424076 |
| Defined term | Abbreviation | Description |
| Nchanga Smelter | — | The Outotec flash smelting facility at Nchanga, Chingola, with a nameplate capacity of approximately 850 ktpa of concentrate feed, producing approximately 312 ktpa of copper. Includes the sulfuric acid plant. |
| Nkana Refinery | — | The electrolytic copper refinery at Kitwe, producing LME Grade A copper cathode from Nchanga Smelter anode. |
| Nchanga Concentrators | — | The three concentrating mills at the Nchanga site: Old East Mill (OEM), Nchanga East Mill (NEM), and North West Mill (NWM). Used to process Nchanga Business Unit ore under the Full Resource Case. Not operated under the M&I Case or Reserve Case (no NBU ore feed in either case). |
| Nchanga Business Unit | NBU | The Nchanga mining and processing operations at Chingola, including underground and open pit mines. |
| Nampundwe Mine | — | The underground pyrite mine located approximately 50 km west of Lusaka, supplying pyrite flux to the Nchanga Smelter. The pyrite is processed at the smelter to produce sulfuric acid, which is consumed in the Nchanga TLP leach operations. |
| Initial Assessment | IA | A preliminary economic assessment, as defined under S-K 1300 §1302(d)(4)(ii), of the economic potential of Mineral Resources that may include Inferred Mineral Resources. An Initial Assessment is preliminary in nature; there is no certainty that the results of the Initial Assessment will be realised. |
| Pre-Feasibility Study | PFS | A study at PFS-level accuracy (±25%) supporting the declaration of Mineral Reserves. A separate Pre-Feasibility Study Technical Report Summary has been prepared for the Reserve Case at the KCM Integrated Operations. |
| Full Resource Case | FRC | The Initial Assessment economic case that includes all Measured, Indicated, and Inferred Mineral Resources at the KCM Integrated Operations. The Full Resource Case incorporates the existing Nchanga TLP (retrofitted with Elevated Temperature Leach) and the proposed new TLP 2 facility (also designed with ETL), operating in parallel. |
| M&I Case | M&I | The Initial Assessment economic case that includes only Measured and Indicated Mineral Resources at the KCM Integrated Operations. Inferred Mineral Resources are excluded. The M&I Case includes the existing Nchanga TLP retrofitted with Elevated Temperature Leach (ETL) but does not include the proposed TLP 2 facility or Nchanga Business Unit mining operations. |
| Reserve Case | — | The Pre-Feasibility Study economic case that includes only Mineral Reserves at the KCM Integrated Operations (Konkola Mine and the TD03/TD04 portions of the Tailings Complex). The Reserve Case uses the existing Nchanga TLP with conventional ambient-temperature leach and is presented in a separate Pre-Feasibility Study Technical Report Summary. |
| Solvent Extraction–Electrowinning | SX-EW | The hydrometallurgical process used at the Nchanga TLP and the proposed TLP 2 to extract copper from sulfuric acid leach solution and produce copper cathode directly, bypassing the smelter and refinery. |
| Total Copper grade | TCu | The total copper content of an ore, concentrate, or tailings sample, expressed as a percentage by mass. |
| Acid-Soluble Copper grade | ASCu | The portion of total copper in an ore or tailings sample that is soluble in sulfuric acid; the copper fraction recoverable in leach operations. |
| Acid-Insoluble Copper grade | AICu | The portion of total copper in an ore or tailings sample that is not soluble in sulfuric acid; this copper fraction is not directly recoverable in leach operations. |
| London Metal Exchange Grade A | LME Grade A | The minimum copper purity standard (99.9935% Cu) traded on the London Metal Exchange. Achieved at the KCM Integrated Operations by both the Nkana Refinery (from Nchanga Smelter anodes) and the Nchanga TLP / proposed TLP 2 (via SX-EW directly). |
| Run-of-Mine | ROM | Ore as mined, before processing through the concentrator. |
| Longitudinal longhole open stoping | LHOS | The primary underground mining method applied at Konkola Mine. |
| amcconsultants.com | 44 |
| S-K 1300 TRS: KCM Integrated Operations (Initial Assessment) | |
| Konkola Copper Mines Plc | 0424076 |
| Defined term | Abbreviation | Description |
| Post pillar cut and fill | PPCF | A secondary mining method historically applied at Konkola Mine for flatly dipping sections; replaced by panel stoping with paste fill in the PFS mine plan. |
| Ore Shale Unit | OSU | The principal mineralised horizon at Konkola, a carbonaceous and dolomitic shale unit within the Lower Roan Group. |
| S-K 1300 | — | Regulation S-K, subpart 1300, of the U.S. Securities and Exchange Commission, governing disclosure of mining-related information. |
| Qualified Person | QP | As defined in S-K 1300 §1300(a). |
| Fiscal year | FY | The financial year of Konkola Copper Mines Plc, running from 1 April to 31 March of the following calendar year. References to a fiscal year, e.g. FY2026/27, denote the period from 1 April 2026 to 31 March 2027. All production schedules, financial projections, and operational data presented in this TRS are reported on this fiscal year basis unless otherwise stated. |
| 2.5 | Sources of information |
This report is based on data and information provided by KCM as outlined in Section 25 of this report, supplemented by AMC's independent analysis, site inspections, historical reports, and public domain references. Sources include:
| · | KCM geological models, drillhole databases, and quality assurance / quality control (QAQC) records. |
| · | Processing plant flow sheets, production records, and metallurgical test work. |
| · | Cost models, operating assumptions, and infrastructure documentation. |
| · | Site visits, interviews with KCM technical teams, and historical technical studies. |
Data verification steps were conducted in accordance with S-K 1300, and the Qualified Persons (QPs) have reviewed all relevant datasets for consistency and completeness.
| 2.6 | Personal inspection of the property |
In accordance with Item 1302(b)(2)(iii) of Regulation S-K, AMC Consultants (UK) Limited confirms that personal inspections of the KCM operations were conducted by the technical professionals responsible for the preparation of this Technical Report Summary.
AMC personnel conducted site inspections at the Konkola and Nchanga operations on the following occasions:
| · | November 2024: Initial site inspection covering Konkola Mine workings (including active development headings, shaft systems, and ore passes), the Konkola Concentrator, surface infrastructure, and the Nchanga Smelter and Refinery. The inspection included review of core storage facilities, geological logging practices, and sample preparation procedures at the on-site laboratory. |
| · | February 2025: Follow-up inspection focused on underground mining operations at Konkola, including observation of longhole open stoping and panel stoping methods, rail haulage and tramming systems, dewatering infrastructure, and ventilation circuits. Processing operations at the Nchanga TLP and tailings reclamation activities at TD03 and TD04 were also inspected. Meetings were held with KCM operational and technical teams to verify production data, cost assumptions, and contractor arrangements. |
| · | April 2025: This inspection covered the Konkola Concentrator refurbishment progress, paste fill plant site, Nchanga Smelter operations, and the Lubengele tailings storage facility. Updated geological models and mine plans were reviewed with KCM's geology and mine planning teams, and datasets used in the preparation of this TRS were verified against site records. |
| · | July 2025: Follow-up inspection focused on geological data collection and collation for Mineral Resource estimation, incorporating audit and review of inputs for Konkola and Nchanga hard rock assets. Including an inspection of the core storage facilities and Konkola on-site laboratory. Review of geological logging practices, sample preparation procedures and QAQC procedures. Inspection of ongoing core drilling at TD05 tailings storage facility. |
| amcconsultants.com | 45 |
| S-K 1300 TRS: KCM Integrated Operations (Initial Assessment) | |
| Konkola Copper Mines Plc | 0424076 |
IBIS Environmental personnel conducted site inspections during 2024 and 2025 in support of the environmental and social assessments presented in Sections 3.8.1 and 17 of this report, including baseline environmental monitoring, stakeholder engagement activities, and assessment of tailings storage facility conditions.
All inspections occurred during active operational periods. Observations made during site visits were cross-referenced with geological models, mine plans, production records, and historical datasets to validate the assumptions used in Mineral Resource estimation, mine planning, cost estimation, and economic analysis. The AMC professionals who conducted the site inspections are the same individuals responsible for the technical content of this TRS and who contributed to the conclusions and recommendations presented herein.
The Qualified Person is satisfied that the site inspections were of sufficient scope, frequency, and duration to support the conclusions presented in this report.
| 2.7 | Summary of previously filed technical report |
This report updates and supersedes any previous technical reports prepared for KCM in the United States of America or other jurisdictions, based on earlier geological models and classification criteria relying primarily on variogram ranges. The current assessment includes revised drillhole data, updated estimation methods, and a stricter classification framework as applied by AMC in line with current industry practice.
| 2.8 | Qualified Persons |
AMC is an independent third-party consulting firm comprising mining experts, including professional geologists and mining engineers. In accordance with S-K Item 1302(b)(1)(ii), AMC signs this TRS as a firm.
The AMC personnel who prepared this report are specialists in geology, Mineral Resource estimation, underground mining, geotechnical engineering, mineral processing, and mineral economics. All contributing personnel have more than five years of relevant experience in sediment-hosted copper deposits and underground mining operations and are members in good standing of recognised professional organisations including the Australasian Institute of Mining and Metallurgy (AusIMM) and the Australian Institute of Geoscientists (AIG).
AMC takes responsibility for all sections of this Report.
| 2.9 | Reliance on the registrant |
AMC have relied on information and assurance provided by KCM and several specialists employed by KCM. The detail of this reliance is provided in Section 25 of this document.
| amcconsultants.com | 46 |
| S-K 1300 TRS: KCM Integrated Operations (Initial Assessment) | |
| Konkola Copper Mines Plc | 0424076 |
| 3 | Property description |
| 3.1 | Property description |
This Initial Assessment has been prepared in accordance with Item 1302(d) of Regulation S-K and covers the KCM Integrated Operations, a single integrated mining complex comprising the Konkola Mine and Concentrator near Chililabombwe, the Nchanga Business Unit (NBU) operations near Chingola (including the Chingola Open Pit DF, Nchanga Underground, and the planned COP E Extension, and COP DF Underground), the Nchanga TLP and associated TD03 and TD04 tailings recovery operations, the Nchanga Smelter, and the Nkana Refinery in Kitwe. The Nampundwe Pyrite Mine in Shibuyunji District, which supplies pyrite flux to the Nchanga Smelter, is a supporting asset within the KCM license portfolio but is not a copper-producing operation.
The scope of this Initial Assessment differs from the companion PFS Technical Report Summary in that it includes the full Mineral Resource base across all KCM operations, including Inferred Mineral Resources that are too speculative geologically to have the economic considerations applied to them that would enable classification as Mineral Reserves. The PFS is limited to the Mineral Reserve at Konkola Mine and the TD03/TD04 tailings recovery operations. The Nchanga Business Unit mining operations (COP DF open pit, COP DF Underground, COP E Extension, and Nchanga Underground) are assessed in this Initial Assessment only and are not part of the PFS.
Per Item 1301 of Regulation S-K, the KCM Integrated Operations is classified as a single material property (Table 3.1). The integrated nature of operations — with Konkola concentrate processed through the Nchanga Smelter and refined at the Nkana Refinery — means that these assets cannot be economically or operationally separated. Per Item 1304, material properties receive individual detailed disclosures throughout this report. The component assets comprising the KCM Integrated Operations are summarised in Table 3.2.
Table 3.1 Material property classification
| Property | Classification | Justification |
| KCM Integrated Operations | MATERIAL | Single integrated mining complex: Konkola Mine + Nchanga Operations + TD03/TD04/TD05 + Nchanga TLP + Smelter + Refinery. Common ownership, interdependent operations, integrated value chain from ore to refined copper. |
Table 3.2 Component assets within KCM Integrated Operations
| Component | Status | Notes |
| Konkola Mine | Operating | Primary production center; 51% of of M&I Case payable copper; 74% of Full Resource Case copper |
| TD03/TD04 Tailings Recovery | Operating | Measured and Indicated Mineral Resource material processed through the existing Nchanga TLP over an approximate three-year reclamation period, contributing approximately 80 kt of payable copper. The corresponding Mineral Reserves are declared in the companion Pre-Feasibility Study Technical Report Summary |
| TD05 Tailings Recovery | Planned | Reclamation under the M&I Case (existing TLP only, retrofitted with ETL) and the Full Resource Case (existing TLP plus proposed TLP 2, both with ETL); refer Section 14.5 |
| Nchanga COP DF Open Pit | Operating | Limited remaining life; Full Resource Case only |
| Nchanga COP DF Underground | Planned | IA-level confidence; Inferred Resources only |
| Nchanga COP E Extension | Planned | IA-level confidence; Inferred Resources only |
| Nchanga Underground (UOB / LOB) | Operating | Limited remaining mine life; Full Resource Case only |
| Nampundwe Mine | Supporting | Pyrite source supplying flux to the Nchanga Smelter; smelter acid production supplies the Nchanga TLP and (under FRC) TLP 2 leach operations. No direct copper production |
| amcconsultants.com | 47 |
| S-K 1300 TRS: KCM Integrated Operations (Initial Assessment) | |
| Konkola Copper Mines Plc | 0424076 |
| 3.2 | Project location |
The KCM Integrated Operations are located in the
Copperbelt Province of the Republic of Zambia
(Figure 3.1), within a region that has historically been the backbone of Zambia’s economy and remains a globally significant copper-producing
district. The Konkola Mine is situated at Chililabombwe, approximately 20 km north of Chingola and 5 km south of the Zambia–DRC
border, at latitude 12.375°S and longitude 27.831°E. The Nchanga Complex, including open pit and underground mines, concentrators,
Nchanga TLP, and smelter, is located approximately 4 km from the town of Chingola at latitude 12.513°S and longitude 27.858°E.
The Nkana Refinery is located in Kitwe at latitude 12.809°S and longitude 28.252°E. The Nampundwe Pyrite Mine is located in the
Shibuyunji District of Central Province, approximately 320 km south of the Copperbelt operations, at latitude 15.492°S and longitude
27.910°E.
Geographic coordinates for all major facilities are presented in Table 3.3 and shown on the property location maps (Figure 3.2 and Figure 3.3).
Figure 3.1 Map of Zambia showing the Copperbelt Region
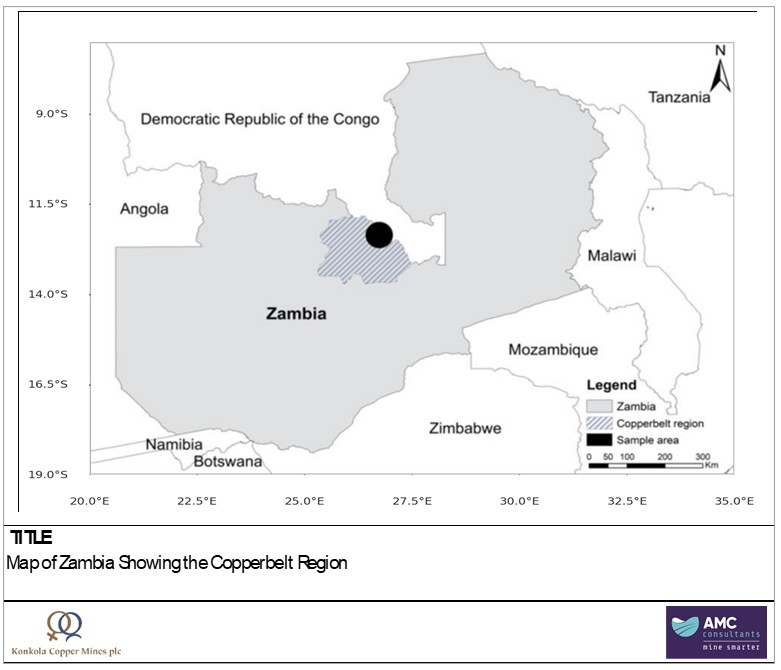
Source: Post-Mining Restoration in Zambia Screening native tree species for phytoremediation potential. 2021. ResearchGate. Retrieved from https://www.researchgate.net/figure/Map-of-Zambia-The-Copperbelt-region-is-marked-in-the-stripped-grey-and-the-sampled-areas_fig1_341293959. Accessed: 24 Mar 2025.
| amcconsultants.com | 48 |
| S-K 1300 TRS: KCM Integrated Operations (Initial Assessment) | |
| Konkola Copper Mines Plc | 0424076 |
Figure 3.2 Property location map – KCM Integrated Operations
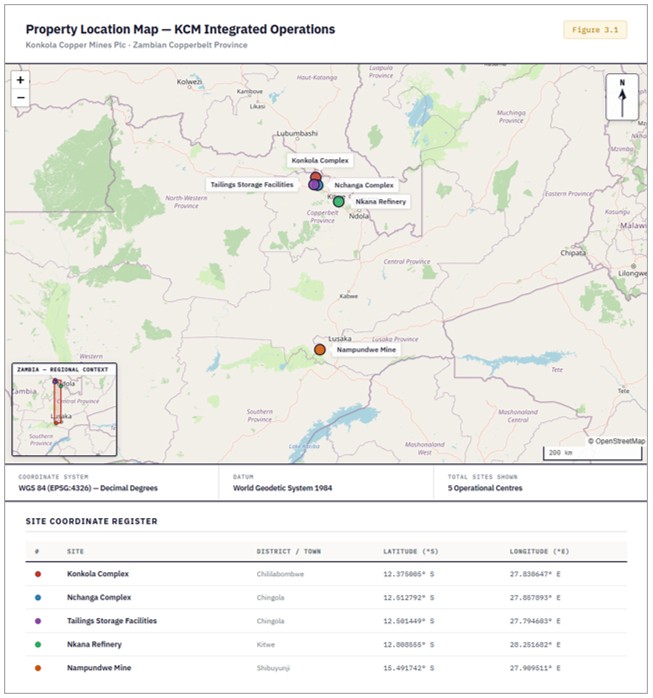
Source: Base map tiles © OpenStreetMap contributors. Coordinate system: WGS 84 (EPSG:4326), Decimal Degrees. Map accuracy within ±50 m of stated coordinates.
| amcconsultants.com | 49 |
| S-K 1300 TRS: KCM Integrated Operations (Initial Assessment) | |
| Konkola Copper Mines Plc | 0424076 |
Figure 3.3 Geographic location of Konkola Mines in Zambia
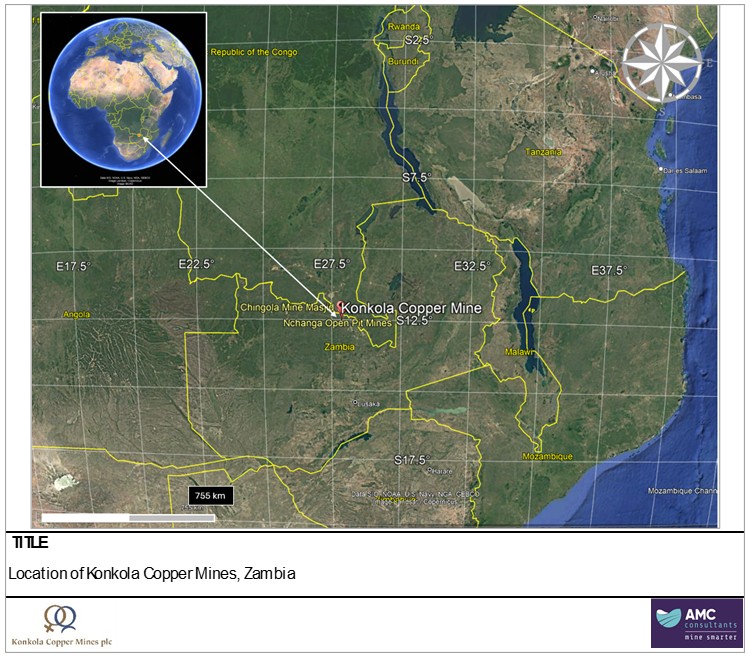
Note: Map showing the location of Konkola Mines, Zambia.
Source: Google Earth Pro., 2025. Available at: https://earth.google.com. Accessed 10 March 2025.
Table 3.3 KCM Integrated Operations — facility coordinates (WGS84 datum)
| Site / facility | Latitude | Longitude | License No. | |||
| Konkola Complex — Chililabombwe | ||||||
| Konkola Mine (No. 4 Shaft) | 12.378820°S | 27.829329°E | 7076-HQ-LML | |||
| Konkola Mine (No. 1 Shaft) | 12.380048°S | 27.829103°E | 7076-HQ-LML | |||
| Konkola Mine (No. 3 Shaft) | 12.359064°S | 27.818375°E | 7076-HQ-LML | |||
| Konkola Concentrator | 12.375666°S | 27.829844°E | 7076-HQ-LML | |||
| Nchanga Complex — Chingola | ||||||
| Nchanga Underground (D Shaft) | 12.524812°S | 27.854832°E | 7075-HQ-LML | |||
| Chingola Open Pit DF (COP DF) | 12.555909°S | 27.815651°E | 7075-HQ-LML | |||
| Chingola Open Pit E Extension | 12.542381°S, | 27.814069°E | 7075-HQ-LML | |||
| Nchanga East Mill (Concentrator) | 12.526696°S | 27.858325°E | 28173-HQ-MPL | |||
| Nchanga West Mill (Concentrator) | 12.525773°S | 27.857918°E | 28173-HQ-MPL | |||
| Nchanga Smelter | 12.530508°S | 27.855137°E | 7075-HQ-LML | |||
| Nchanga TLP | 12.532698°S | 27.847922°E | 28174-HQ-MPL | |||
| Tailings storage facility Facilities — Chingola | ||||||
| TD03 — centroid | 12.502871°S | 27.794465°E | 7075-HQ-LML | |||
| TD04 — centroid | 12.513000°S | 27.797564°E | 7075-HQ-LML | |||
| TD05 — centroid | 12.618307 S | 27.885647 E | 7075-HQ-LML | |||
| Nkana Refinery — Kitwe | ||||||
| Nkana Refinery (Electrorefinery) | 12.657859°S | 28.082655°E | 20945-HQ-MPL | |||
| Nampundwe Mine — Shibuyunji District | ||||||
| Nampundwe Pyrite Mine | 15.492062°S | 27.909868°E | 7074-HQ-LML |
Notes: All coordinates in WGS84 decimal degrees. Complex-level coordinates represent the approximate centroid of each operational area. Areas sourced from Large-Scale Mining License schedules.
| amcconsultants.com | 50 |
| S-K 1300 TRS: KCM Integrated Operations (Initial Assessment) | |
| Konkola Copper Mines Plc | 0424076 |
| 3.3 | Ownership |
KCM is an indirect subsidiary of CopperTech Metals Inc. (the Registrant). CopperTech holds its interest in KCM through Vedanta Resources (Jersey) Limited (VRJL). As of the effective date of this report, VRJL holds 79.42% of KCM’s issued share capital, with Zambia Consolidated Copper Mines Investment Holdings Plc (ZCCM-IH) holding 20.58%. The Government of the Republic of Zambia holds one special share in KCM.
Mineral rights associated with the Konkola and Nchanga license areas are held by Konkola Mineral Resources Limited (KMRL), a wholly owned subsidiary of KCM. A complete schedule of mining licenses, mineral processing licenses, and associated areas is provided in Table 3.4.
In May 2019, ZCCM-IH petitioned the High Court of Zambia seeking to wind up KCM, and a provisional liquidator was appointed to oversee operations. On 6 November 2023, the parties entered into the KCM Shareholders Agreement, establishing the terms for the resumption of operational control by VRJL. The Scheme of Arrangement was sanctioned by the High Court on 28 June 2024 and became effective on 31 July 2024, at which point the provisional liquidator was removed and the board of directors of KCM was reinstated. In connection with the Scheme of Arrangement, VRJL entered into loan agreements with KCM for an aggregate principal amount of up to US$1.27 billion (B) to fund capital expenditure, creditor settlement, and community support. Further details on the Scheme of Arrangement and KCM Shareholders Agreement are provided in the Registrant’s Registration Statement on Form S-1.
| 3.4 | Mineral rights |
KCM’s mineral rights are governed by Zambia’s Minerals Regulation Commission Act (2024). The company operates under Large-Scale Mining Licenses (LSMLs) and Mineral Processing Licenses (MPLs) issued by the Ministry of Mines and Minerals Development (MMMD). These licenses grant KCM exclusive rights to explore, mine, and process copper within its designated areas. The key licenses relevant to current operations and processing infrastructure are shown in Table 3.4.
| amcconsultants.com | 51 |
| S-K 1300 TRS: KCM Integrated Operations (Initial Assessment) | |
| Konkola Copper Mines Plc | 0424076 |
Table 3.4 KCM mineral rights and tenure details
| Asset | License | Description | Area (ha) |
Expiry date | ||||
| Konkola Mine License | 7076-HQ-LML | Covers mining and concentrator operations at the Konkola Mine site in Chililabombwe | 4,054.0 | 30 March 2050 | ||||
| Nchanga License | 7075-HQ-LML | Covers Nchanga mining and tailings recovery operations in Chingola | 10,659.0 | 30 March 2050 | ||||
| Nchanga TLP License | 28174-HQ-MPL | Covers Nchanga TLP in Chingola | 177.0 | 16 December 2045 | ||||
| Nchanga Old East Mill License | 28173-HQ-MPL | Covers all Nchanga concentrator operations in Chingola | 27.0 | 16 December 2045 | ||||
| Nampundwe License | 7074-HQ-LML | Covers Pyrite mining and concentrator operations at Nampundwe located approximately 50 km west of Lusaka | 962.4528 | 30 March 2050 | ||||
| Nkana Refinery License | 20945-HQ-MPL | Covers refining activities at the Nkana smelter and electro refinery in Kitwe | 50.0176 | 18 April 2050 |
Note: All licenses are held in the name of Konkola Copper Mines Plc and are associated with relevant surface rights and environmental approvals. As of the effective date of this report, there are no known encumbrances, material legal proceedings, material permit conditions, or compliance issues affecting the standing of these licenses.
| 3.5 | Description of property rights |
KCM holds exclusive rights to explore for, extract, process, and sell copper ores and related products within the boundaries of its mining licenses. These rights are granted under the Mines and Minerals Development Act (2015) of Zambia and are administered by the Ministry of Mines and Minerals Development. The licenses provide legal authority for both surface and underground mining activities, as well as construction and operation of associated infrastructure including processing plants, tailings storage facilities, waste management areas, and water abstraction systems.
Surface rights within the license areas are secured either directly through the mining licenses or through long-term leases with the Zambian Government. These rights permit the construction of mining infrastructure, roads, and processing facilities. Water abstraction rights have been obtained to support dewatering and processing operations, which are critical to underground mining viability.
Land access agreements have been established with local communities and traditional authorities to ensure uninterrupted mining and exploration activities. These agreements outline land-use policies, compensation frameworks, and sustainability commitments. In areas where project development has affected local landholders or settlements, resettlement action plans (RAPs) have been developed in line with Zambian regulatory requirements and international standards. These plans include structured consultation processes, physical relocation (where applicable), livelihood restoration programs, and monitoring mechanisms. Ongoing engagement with local communities is maintained to support KCM’s social licence to operate.
As of the effective date of this report, all property rights are considered to be in good legal standing.
| 3.6 | Infrastructure and access |
The KCM Copperbelt operations are located within the towns of Chililabombwe, Chingola, and Kitwe in the Copperbelt Province of Zambia. The primary regional access route is the T3 Highway (Chingola-Chililabombwe Road), a sealed, all-weather tarmac road with a carriageway width of approximately 10 m, capable of supporting loads of up to 50 tonnes. The T3 Highway connects the Konkola and Nchanga operations and provides onward access to the Kasumbalesa Border Post, which serves as a key point for copper product exports and equipment imports.
Air transport is supported by the Simon Mwansa Kapwepwe International Airport in Ndola, approximately 130 km south-east of the Konkola Mine. The regional rail network connects to major southern and eastern African ports including Durban and Richards Bay (South Africa), Dar es Salaam (Tanzania), and Beira and Nacala (Mozambique), supporting export logistics for copper products and the import of equipment and bulk reagents.
| amcconsultants.com | 52 |
| S-K 1300 TRS: KCM Integrated Operations (Initial Assessment) | |
| Konkola Copper Mines Plc | 0424076 |
Utilities required for operations, including power and water, are provided through established regional infrastructure. Power is supplied via the national grid through ZESCO Limited, Zambia’s state-owned electricity utility. Detailed descriptions of infrastructure, topography, climate, and access conditions are presented in Section 4.
| 3.7 | Royalty payments and fiscal obligations |
Zambia’s Minerals Regulation Commission Act (2024) mandates royalty payments based on copper production revenue at the following sliding scale rates:
| · | 4.0% for copper prices below US$4,000/t |
| · | 6.5% for copper prices between US$4,000/t and US$5,000/t |
| · | 8.5% for copper prices between US$5,000/t and US$7,000/t |
| · | 10.0% for copper prices above US$7,000/t |
KCM is additionally subject to a 30% corporate income tax and a 16% value-added tax (VAT) on applicable transactions. These fiscal obligations form part of the national revenue system and are not tied to community investment schemes. Community development initiatives are administered through separate corporate social responsibility (CSR) frameworks.
| 3.8 | Significant encumbrances to the property |
To the Qualified Person’s knowledge, as of the effective date of this report, there are no material encumbrances to the KCM mining licenses or property rights that would prevent KCM from conducting mining operations. KCM is subject to standard regulatory, environmental, and social obligations that are typical for mining operations in Zambia, as described below.
| 3.8.1 | Environmental compliance obligations |
Based on the 2020 Environmental Protection Fund (EPF) audit report, Konkola Copper Mines Plc (KCM)’s total EPF liability across all locations was US$129 million (M). As per the assessment, Nkana was classified under Category 1, while Nchanga, Konkola and Nampundwe were classified under Category 2, with a total cash contribution liability of US$12,037,058.
KCM made a cash contribution of US$5,464,682, leaving an outstanding balance of US$6,572,376 during the liquidation period. Following the introduction of the Creditors’ Scheme of Arrangement, the Mines Safety Department (MSD) successfully filed a claim for US$6,572,376 under the Scheme. As MSD falls under the Government of the Republic of Zambia (GRZ), settlement of this claim will be governed by the waterfall mechanism provided under the approved Scheme of Arrangement and will be affected in accordance with the structure set out therein.
In relation to the period of provisional liquidation, during which KCM was not under the control of Vedanta, KCM has been granted a two-year moratorium on liabilities from the date of Board reinstatement (31 July 2024). During this moratorium period, no payments in respect of such liabilities are required to be made.
KCM is actively working across all operational sites to improve compliance with EPF requirements and enhance site categorisation, which is expected to reduce future cash contribution obligations. KCM is actively working across all operational sites to improve compliance with EPF requirements and enhance site categorisation, which is expected to reduce future cash contribution obligations. To strengthen compliance and provide an updated position, KCM commissioned an independent third-party assessment of EPF liabilities as at 31 December 2025, which assessed the total EPF liability at US$144M. The increase from the 2020 audit is attributable primarily to updated closure cost assumptions, revised scope of rehabilitation activities, inflationary adjustments, and expanded environmental obligations identified during the reassessment.
| amcconsultants.com | 53 |
| S-K 1300 TRS: KCM Integrated Operations (Initial Assessment) | |
| Konkola Copper Mines Plc | 0424076 |
The recognised asset retirement obligation as of 31 March 2026 is US$66.6M.
Environmental compliance is governed by permits issued under the Environmental Management Act, including conditions related to tailings management, water quality, air emissions, and waste handling. KCM is subject to compliance and prevention orders issued by ZEMA requiring, among other things, rehabilitation of TD05, desilting and ecological restoration of natural streams, installation of off-gas cleaning systems at the Nchanga Smelter anode furnaces, and measures to ensure dam stability and zero discharge from pollution control dam areas. KCM has planned capital expenditures of approximately US$28 million over the next five years to address these compliance requirements. Total closure costs are estimated at US$133 million (Section 18). Updated closure plans have been prepared in line with IFC Environmental and Social Performance Standards. Detailed rehabilitation, closure, and post-closure planning is presented in Section 17.3.
| 3.8.2 | Permit conditions |
Mining and processing operations are subject to conditions outlined in licenses and permits issued by ZEMA and other regulatory authorities. These conditions address land disturbance, air and water discharge limits, hazardous materials management, and occupational health and safety standards. Non-compliance may result in fines, suspension of activities, or legal enforcement actions.
| 3.8.3 | Social and land use obligations |
KCM engages with local communities and traditional authorities on matters relating to land access, displacement, and environmental impacts. Where resettlement is required, KCM implements RAPs that include compensation mechanisms, livelihood restoration, and post-resettlement monitoring. These obligations are considered an integral part of maintaining the company’s social licence to operate.
| 3.9 | Significant factors and risks affecting access |
| 3.9.1 | Operational risks |
KCM’s operations at Konkola are exposed to a range of technical, environmental, and infrastructure-related risks that may affect the consistency of production and cost management. The principal operational risks are:
Geological complexity: The Konkola deposit is characterised by folded and faulted stratigraphy, variable mineralisation thickness, and locally disrupted mineralisation associated with thrust zones and synclinal folding. These geological features complicate stope layout, sequencing, and dilution control, particularly in areas where the mineralisation is pinched or offset. Variability in lithological contacts and the presence of soft interbedded units also pose geotechnical challenges for ground support and hangingwall stability. Ongoing reconciliation between modelled and actual mineralisation geometry is required to maintain operational efficiency and accurate resource and production forecasting.
| amcconsultants.com | 54 |
| S-K 1300 TRS: KCM Integrated Operations (Initial Assessment) | |
| Konkola Copper Mines Plc | 0424076 |
Dewatering requirements: Konkola is one of the wettest underground mines globally, with groundwater inflows averaging approximately 350,000 m³/day, resulting in a hoisted ore-to-water ratio of approximately 1:49. Effective mine access and safety are contingent on continuous operation of multi-stage dewatering infrastructure, including underground pump chambers and high-capacity surface discharge systems. The scale and cost of dewatering represent a persistent operational and financial risk, particularly if equipment reliability, power supply, or maintenance programs are compromised. Dewatering limitations may also restrict access to deeper sections of the deposit and influence the achievable mining rate.
Power supply reliability: The operation is reliant on grid-connected hydroelectric power supplied by ZESCO, which is subject to seasonal variability due to rainfall-dependent reservoir levels. Periodic national power shortages and scheduled load-shedding events can disrupt production and impact critical systems such as dewatering, hoisting, ventilation, and ore processing. As the mine cannot operate without constant dewatering, interruptions to power supply present a significant operational risk. Existing backup capacity is limited and not sufficient to maintain full dewatering or production rates during extended outages.
| 3.9.2 | Regulatory and social risks |
KCM’s ability to maintain uninterrupted access to its mining tenements and sustain long-term operations is subject to regulatory stability, community engagement, and ongoing compliance with environmental and licence obligations. While Zambia has an established mining regulatory framework and a supportive investment environment, the regulatory environment continues to evolve in response to economic pressures, global commodity prices, and stakeholder expectations.
Government policy: Zambia’s mining sector has experienced policy and fiscal shifts over the past decade, including changes to royalty structures, VAT rules, and corporate tax rates. These adjustments have sometimes occurred with limited notice, affecting financial models and operational planning. Future policy reforms — particularly around beneficiation, local content requirements, or energy use — could introduce new compliance requirements.
Community relations: KCM operates in proximity to densely populated communities, some of which are directly affected by land access, water usage, or environmental outcomes from mining operations. While community engagement frameworks are in place, there remains a risk that local concerns regarding resettlement, employment, or environmental impacts could escalate, particularly in areas earmarked for expansion or infrastructure upgrades. Proactive engagement, grievance resolution mechanisms, and ongoing social investment are necessary to maintain trust and operational continuity.
Licence renewals and regulatory compliance: Retention of mineral rights is subject to compliance with licence conditions, including reporting obligations, environmental monitoring, and demonstration of continued exploration or development activity. Failure to meet these obligations may lead to penalties, delays in licence renewal, or revocation. Sustained compliance is critical to maintaining the right to operate.
Artisanal mining: Artisanal and small-scale mining activity along the Zambian Copperbelt is commonplace and may impact licensing and mining rights, surface access, and community relations in areas adjacent to KCM’s operations.
| 3.10 | Adjacent properties |
The following section describes properties adjacent to or in the immediate vicinity of the KCM license areas. The descriptions are based on publicly available information disclosed by the respective owners and operators. The Qualified Person has not verified the information presented and it is not necessarily indicative of the mineralisation, geological characteristics, or economic potential of the KCM properties that are the subject of this TRS.
| amcconsultants.com | 55 |
| S-K 1300 TRS: KCM Integrated Operations (Initial Assessment) | |
| Konkola Copper Mines Plc | 0424076 |
Table 3.5 Summary of adjacent properties
| Property | Owner / Operator | Location | Commodity | Status |
Adjacent KCM License | |||||
| Mimbula Project | Moxico Resources | Chingola | Cu | Operating (OP) | 7075-HQ-LML | |||||
| Mopani Nkana Complex | ZCCM-IH | Kitwe | Cu, Co | Operating (UG) | 20945-HQ-MPL | |||||
| Lubambe Mine | EMR Capital / ZCCM-IH | Chililabombwe | Cu | Operating (UG) | 7076-HQ-LML | |||||
| Mingomba Project | KoBold Metals / ZCCM-IH | Chililabombwe | Cu | Exploration | 7076-HQ-LML |
Note: UG = underground, OP = open pit. Ownership and status based on publicly available information as of March 2026.
These neighbouring operations are hosted within the same regional geological setting, notably the Lower Roan Subgroup of the Katangan Supergroup. While they share regional structural and stratigraphic continuity with the KCM deposits, each project is independently operated, and there are no current joint ventures or cooperative development agreements in place.
| amcconsultants.com | 56 |
| S-K 1300 TRS: KCM Integrated Operations (Initial Assessment) | |
| Konkola Copper Mines Plc | 0424076 |
| 4 | Accessibility, climate, local resources, infrastructure, and physiography |
| 4.1 | Topography and land description |
KCM operations (including Nchanga and Konkola) are located on the Copperbelt and Central Provinces which are in North-Central Zambia and Central Zambia respectively. The Copperbelt Province is 13.06°S and 27.55°E and is host to the Konkola operations in the town of Chililabombwe and the Nchanga Mine in the town of Chingola. The Central Province which is home to the Nampundwe Mine is in the district of Shibuyunji, which lies between 15°S and 26°E.
The town of Chililabombwe lies at an elevation of 1,360 meters (m) on the Central African Plateau. It is a low-lying land which extends to the border with the DRC. The topography between the hills is gently undulating with deeply weathered red lateritic soils. The top-soils are generally sandy but with a heavier textured subsoil. Most of these lateritic soils are leached because of the high rainfall and hence tend to be acidic and relatively infertile. The town has a population of ~100,000 people.
The town of Chingola lies at an elevation of 1,363 m and has a topography that is generally hilly with steep slopes along the Kafue River. The soils are sandy in some areas and loamy in others. It has a population of ~157,000 people making it the third most populated town on the Copperbelt Province.
Shibuyunji District is located at an elevation of 1,202 m along the Great West Road. Its topography is generally flat and swampy with fertile soils conducive for farming. The district is bound by the Kafue River on one side and has a population of ~177,000 people.
| 4.1.1 | Flora and fauna |
Miombo woodland is principally the vegetation type found in the Copperbelt region. The common tree species found in this vegetation type are Brachystegia, Isoberliriia, and Julbernardia. The natural vegetation patterns of the region have, however, been extensively disturbed by human activities that include mining activities, wood harvesting for fuel (charcoal production), subsistence / shifting agriculture and plantations among other activities.
The vegetation within the KCM Nchanga Mining License Area has equally been significantly disturbed through mining, charcoal production, subsistence agriculture and other human activities. The diversity of wildlife species within the Nchanga mining license area is poor mainly because of mining operations, human settlements, agriculture and other human activities that have resulted in loss of wildlife habitat and subsequent loss in species diversity.
| 4.2 | Access to the property |
| 4.2.1 | Regional access |
The KCM Copperbelt operations are located within the towns of Chililabombwe, Chingola, and Kitwe in the Copperbelt Province of Zambia. The Nampundwe pyrite mine is located in the Shibuyunji District of Central Province, approximately 50 km west of Lusaka.
The primary regional access route is the T3 Highway (Chingola–Chililabombwe Road), a sealed, all-weather tarmac road with a carriageway width of approximately 10 m, capable of supporting loads of up to 50 tonnes with maximum transport dimensions of 12 m length, 5 m width, and 4.5 m height. The T3 Highway connects the Konkola and Nchanga operations and provides onward access to the Kasumbalesa Border Post to the north, which serves as a key point for imports from the DRC and copper product exports. Local roads connecting to the Nkana Refinery in Kitwe are a mix of sealed and gravel surfaces maintained by the municipal authority.
| amcconsultants.com | 57 |
| S-K 1300 TRS: KCM Integrated Operations (Initial Assessment) | |
| Konkola Copper Mines Plc | 0424076 |
Air access is provided by Simon Mwansa Kapwepwe International Airport in Ndola, situated approximately 65 km from Kitwe, 120 km from Chingola, and 150 km from Chililabombwe. The airport provides scheduled passenger and cargo flights, facilitating personnel movement and time-sensitive materials logistics.
| 4.2.2 | Inter-site access and product transport routes |
The KCM Integrated Operations require the routine transport of intermediate products between sites. Copper concentrate produced at the Konkola Concentrator is transported by road to the Nchanga Smelter in Chingola. Copper anodes produced by the smelter are transported by road to the Nkana Refinery in Kitwe for electrorefining to copper cathode. Pyrite concentrate from the Nampundwe Mine is transported by road to the Nchanga Smelter for use in concentrate blending. Table 4.1 summarises the inter-site distances and access routes.
Table 4.1 Inter-site distances and access routes
| Route | Distance¹ | Road type | Product / purpose | |||
| Konkola → Nchanga (Chililabombwe → Chingola) | ~25 km | Sealed (T3 Highway) | Copper concentrate (Konkola Concentrator to Nchanga Smelter) | |||
| Nchanga → Nkana Refinery (Chingola → Kitwe) | ~55 km | Sealed (regional road) | Copper anodes (Nchanga Smelter to Nkana Refinery for electrorefining) | |||
| Konkola → Nkana Refinery (Chililabombwe → Kitwe) | ~80 km | Sealed (via Chingola) | Personnel; combined route for concentrate and anode transport | |||
| Nampundwe → Nchanga (Shibuyunji → Chingola) | ~350 km | Sealed (T2/T3 via Kapiri Mposhi) | Pyrite concentrate (Nampundwe Mine to Nchanga Smelter for blending) | |||
| Nchanga → Kasumbalesa Border Post (Chingola → DRC border) | ~40 km | Sealed (T3 Highway) | Copper product export; equipment and reagent imports from DRC | |||
| Kitwe → Simon Mwansa Kapwepwe Airport (Ndola) | ~65 km | Sealed | Personnel, time-sensitive materials |
Note: ¹Road distances are approximate road distances between town centers. Facility gate-to-gate distances may vary.
All inter-site product transport is by road. The local railway infrastructure in the Copperbelt is not currently operational for concentrate or product haulage due to the deteriorated condition of rolling stock and track in the Chililabombwe–Chingola corridor (refer to Section 15.2). Road freight is the primary logistics mode for both inter-site intermediate product movement and final product export.
The T3 Highway provides reliable year-round access between the Konkola and Nchanga operations. Local roads within the Copperbelt towns are generally maintained but are subject to deterioration during the wet season (November to March), with potholes a known hazard. Road conditions are not considered a material constraint on operations.
Detailed descriptions of road, rail, and port infrastructure are provided in Section 15. Export logistics, including routes to the ports of Dar es Salaam (Tanzania), Durban (South Africa), and Walvis Bay (Namibia), are described in Section 15.3.
Figure 4.1 illustrates the principal inter-site product transport routes connecting the KCM Integrated Operations, including the movement of copper concentrate, copper anodes, and pyrite concentrate between facilities.
| amcconsultants.com | 58 |
| S-K 1300 TRS: KCM Integrated Operations (Initial Assessment) | |
| Konkola Copper Mines Plc | 0424076 |
Figure 4.1 Inter site logistics map
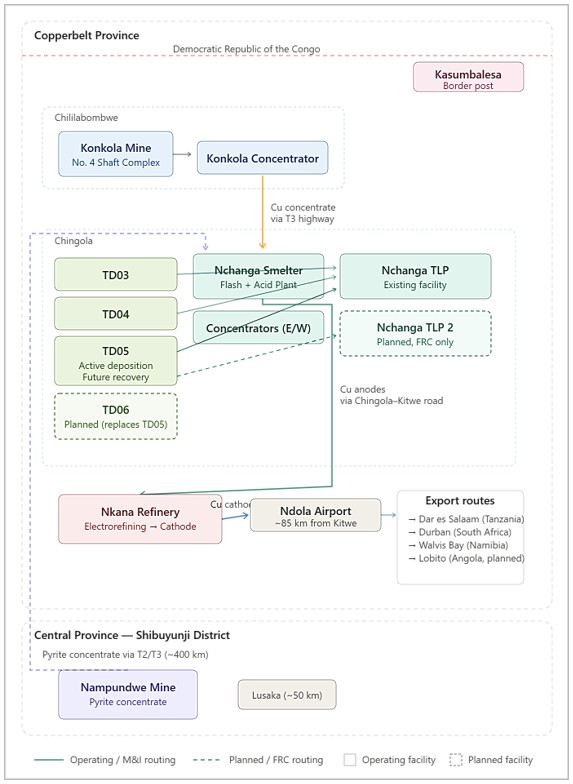
Notes: Schematic representation; facilities not to geographic scale. All inter-site product transport is by road. Local rail infrastructure is not currently operational for product haulage (refer Section 4).
Source: AMC, 2026. Adapted from KCM operational data.
| amcconsultants.com | 59 |
| S-K 1300 TRS: KCM Integrated Operations (Initial Assessment) | |
| Konkola Copper Mines Plc | 0424076 |
| 4.3 | Climate description |
The KCM operations are situated within a subtropical climate zone characterised by distinct wet and dry seasons. The wet season extends from approximately November to April, with the dry season from May to October. Mean annual rainfall across the Copperbelt region is approximately 1,200 mm, with the majority falling between December and March.
At the Konkola and Nchanga operations in the northern Copperbelt, average temperatures range from approximately 17°C in the cool dry season (June–August) to 27°C during the hot wet season (October-December). Conditions at the Nkana Refinery in Kitwe are broadly comparable given its proximity within the Copperbelt Province. The Nampundwe Mine, located approximately 320 km to the south in the Shibuyunji District, experiences a similar seasonal pattern but with marginally lower annual rainfall and slightly higher dry-season temperatures.
Increased rainfall during the wet season can affect surface transport between sites, tailings deposition rates, and water management at the TD03 and TD04 tailings storage facilities. However, all KCM operations, including Konkola Mine mining, the Nchanga open pit and concentrators, and the Nkana Refinery, operate on a year-round basis. There is no seasonal restriction to the operating season.
| 4.4 | Availability of required infrastructure |
The mine site is within the districts of Chingola, Chililabombwe, Kitwe, and Shibuyunji, infrastructure availability is detailed below. Utilities required for operation, including power and water, are provided through established regional infrastructure. Access to tailings and backfill facilities, as well as haul and access roads linking to the processing and smelting operations, is also in place.
| 4.4.1 | Power |
The mining area of interest have access to grid power. Copperbelt towns get their power through Copperbelt Energy Corporation (CEC) under a long-term power supply agreement. All infrastructure is well established and has been providing 200 megawatts (MW) for over 20 years.
| 4.4.2 | Water |
The Kafue River system passes through all Copperbelt towns and remains a source of water for all mining operations associated with KCM. Part of Kafue recharge water comes from the Konkola Mine which pumps approximately 350,000 m³/day. Even in drought seasons, the Kafue River still maintains a reasonable recharge to adequately cater for KCM mining and processing requirements.
| 4.4.3 | Supplies |
The Copperbelt regions have historically housed mining houses since 1925. Over the years other support industries have been established to supply consumables such as Mill Balls, Bolts and Nuts, Rubber and other mining consumables. Further, a number of companies have come up to supply valves, fuels and other materials requirement to support the LOM plan. Other supplies coming from overseas are transported through available international roads while some are air freighted through available airports.
| 4.4.4 | Personnel |
Surrounding areas have colleges that have consistently trained human resources for the mining industry. Of interest are institutions such as: The University of Zambia, The Copperbelt University, Northern Technical College all located within 500 km radius. KCM runs the Kitwe Trades School.
Over the years, Zambia has produced mining personnel with relevant experience. KCM has retained significant human capital in all fields in Sustainability, Human Capital Management, Metallurgy, Mining, Maintenance, Electrical to support the LOM plan. There is a clear succession plan in place and training is provided to ensure sustained performance.
| amcconsultants.com | 60 |
| S-K 1300 TRS: KCM Integrated Operations (Initial Assessment) | |
| Konkola Copper Mines Plc | 0424076 |
| 5 | History |
The KCM Integrated Operations encompass three mining license areas in Zambia: the Nchanga Large-scale Mining License (7075-HQ-LML) in Chingola, the Konkola Large-scale Mining License (7076-HQ-LML) in Chililabombwe, and the Nampundwe Large-scale Mining License (7074-HQ-LML) in Nampundwe. The mining history of these properties spans over nine decades and is closely tied to the broader development of the Zambian Copperbelt as one of the world’s major copper-producing regions.
This section describes the type, amount, quality, and general results of exploration, development, and mining undertaken by previous owners. A detailed exploration history, including drilling campaigns and geological modelling, is presented in Section 7. Production history is discussed in Section 5.6.
| 5.1 | Early exploration and discovery (pre-1950) |
Copper prospecting in the Zambian Copperbelt intensified during the 1920s and 1930s under British colonial interests. In 1923, exclusive prospecting concessions were granted to the Anglo American Corporation (Anglo) for the Rhokana Concession and to Roan Selection Trust (RST) for the Rhodesia Congo Border Concession. Anglo operated the Nchanga and Konkola deposits; RST operated mines at Roan Antelope (Luanshya), Mufulira, and Chambishi.
| 5.1.1 | Nchanga |
Exploration at Nchanga commenced in 1923 with surface reconnaissance, geological mapping, and trenching that identified copper anomalies within the Lower Roan Group sediments. Development of the underground mine began in 1927. Initial underground mining commenced in 1931 but was suspended shortly thereafter due to catastrophic flooding and depressed copper prices. The mine was rehabilitated and underground mining recommenced in 1937 under Nchanga Consolidated Copper Mines Limited (NCCM). The town of Chingola was founded in 1943 to service the expanding Nchanga operations.
| 5.1.2 | Konkola |
Early exploration at Konkola (then known as Bancroft) was limited to surface mapping, trenching, and basic geochemical sampling. These activities identified copper anomalies within sedimentary formations and led to the recognition of the Ore Shale Unit (OSU) as the primary host of copper mineralisation. Shaft sinking commenced with No. 1 Shaft in 1953, with ore production beginning from the No. 1 and No. 2 Shafts in 1957. The mine was operated by Anglo under the Bancroft name until Zambia’s independence in 1964, after which the town was renamed Chililabombwe.
| 5.2 | Systematic development and state ownership (1950s–1999) |
| 5.2.1 | Expansion under colonial and early independence era (1950s–1969) |
From the 1950s onwards, exploration at both Nchanga and Konkola transitioned towards systematic diamond drilling aimed at confirming the continuity and thickness of the mineralised horizons. Early drilling programs used spacings of 200–300 m, which were progressively reduced as the deposits became better defined. These programs confirmed the stratiform nature of the mineralisation and identified key structural controls including faults, folds, and lithological variations.
At Nchanga, open pit mining commenced in 1955 from the Nchanga Open Pit (NOP), targeting extensive near-surface oxide and supergene-enriched copper mineralisation. Subsequently, additional satellite open pits were developed around the Chingola arc, making the Nchanga complex one of the largest open pit copper operations in Africa. Underground mining continued in parallel, targeting deeper sulfide zones including what later became the Nchanga block cave.
At Konkola, the No. 3 Shaft commenced production in 1963, accessing the Kirila Bombwe North ore body. Infrastructure expansion included rail links integrated into the colonial network connecting the Copperbelt to southern export ports. By the late 1960s, Zambian national copper production had reached approximately 769,000 tonnes per annum, with the Nchanga and Konkola operations contributing materially to this total.
| amcconsultants.com | 61 |
| S-K 1300 TRS: KCM Integrated Operations (Initial Assessment) | |
| Konkola Copper Mines Plc | 0424076 |
| 5.2.2 | Nationalisation and ZCCM era (1969–1999) |
Following the Matero Reforms of August 1969, the Government of the Republic of Zambia (GRZ) acquired a 51% interest in the two major foreign mining corporations. Anglo’s Zambian operations were reorganised as Nchanga Consolidated Copper Mines (NCCM), encompassing the Nchanga, Nkana, and Konkola Mines. RST’s operations became Roan Consolidated Mines (RCM). In 1973, the GRZ redeemed all outstanding bonds and assumed full management control. In 1982, NCCM and RCM merged to form Zambia Consolidated Copper Mines Limited (ZCCM), a state-controlled parastatal.
During the ZCCM era, capital investment in exploration and development was severely constrained. No new mines were opened after 1979. The mining operations were used to fund social services and employment programs, reducing the capital available for reinvestment in geological exploration, equipment maintenance, and mine development. National copper production declined from a peak of approximately 750,000 tonnes in 1973 to approximately 250,000 tonnes in 2000. Throughout this period, limited exploration drilling was undertaken at the KCM properties and little investment was made in processing infrastructure or shaft deepening.
| 5.3 | Privatisation and Anglo American Corporation (2000–2002) |
The privatisation of ZCCM’s operating divisions commenced in the late 1990s under the Mines and Minerals Act of 1995. KCM was formed in March 2000 to acquire the assets of the Konkola Mine, Nchanga Mine, and Nampundwe Mine from ZCCM. KCM was initially 65% owned by ZCI Holdings SA (a wholly owned subsidiary of Zambia Copper Investment Limited, itself 50.9% owned by Anglo), 20% by ZCCM, and 7.5% each by the International Finance Corporation (IFC) and CDC Financial Services (Mauritius) Limited. Anglo was the largest individual shareholder with an effective 33% interest.
During this short ownership period, Anglo initiated planning for the Konkola Deep Mining Project (KDMP), which envisaged deepening the Konkola Mine to access higher-grade ore below existing workings. However, depressed copper prices and the capital requirements of the project led Anglo to withdraw its investment in KCM on 16 September 2002. IFC and CDC exited at the same time. Following these departures, KCM was restructured with approximately 42% held by ZCCM-IH and approximately 58% by ZCI Holdings SA, with GRZ holding one special share.
| 5.4 | Vedanta Resources (2004–2019) |
Following a search for a strategic equity partner, Vedanta Resources (Vedanta) took over management of KCM in November 2004. Vedanta’s shareholding subsequently increased to 79.4%, with ZCCM-IH retaining 20.6%. In 2003, prior to Vedanta’s operational takeover, KCM had acquired the Nkana metallurgical complex (“SmelterCo”) comprising a smelter, refinery, and associated sulfuric acid plants and infrastructure in Kitwe.
Vedanta undertook significant capital investment in both development and processing infrastructure.
| amcconsultants.com | 62 |
| S-K 1300 TRS: KCM Integrated Operations (Initial Assessment) | |
| Konkola Copper Mines Plc | 0424076 |
Table 5.1 Principal capital investments by Vedanta Resources (2004–2019)
| Investment | Description | |
| Nchanga Smelter | New flash furnace smelter commissioned in 2008 incorporating Outotec technology, with nominal capacity of 312,000 tpa of copper. Replaced the former Nkana smelter as the primary smelting facility. Integrated sulfuric acid plant producing approximately 1,850 tpd of sulfuric acid for leaching operations at the Nchanga TLP. | |
| Konkola No. 4 Shaft | Sinking commenced in June 2006 as part of the KDMP. Designed with 6 Mtpa hoisting capacity to access the deeper Kirila Bombwe South ore body. The shaft provides access to mineralisation at approximately 1,000 m depth, with the ore body traced to below 1,800 m. | |
| Konkola Concentrator | New 6 Mtpa nameplate capacity concentrator commissioned in 2008 at the Konkola site, employing conventional milling and flotation to produce copper concentrate for the Nchanga Smelter. | |
| Nchanga Concentrators | Upgrades to the three existing concentrators (Old East Mill, New East Mill, and New West Mill), with a combined capacity of 13 Mtpa. | |
| KDMP (partial) | Partial development of the Konkola Deep Mining Project, including No. 4 Shaft sinking and initial underground infrastructure development. The full KDMP, requiring dewatering and extension of underground infrastructure to access deeper mineralisation, was not completed. |
Source: KCM, 2026.
Vedanta also invested in brownfield exploration studies for several satellite deposits within the existing license areas, including Kakosa North and South, Chingola Open Pit ‘E’ Extension (COP E Extension), Chingola Open Pit D and F (COP DF) underground, and the Upper Ore Body. Extension and infill drilling of known mineralisation was undertaken throughout this period, focused on geological development below and along strike of mineralisation in and around active mining areas. None of the brownfield projects had advanced to construction by the time of provisional liquidation in 2019.
Exploration during the Vedanta period (2004-2019) is described in detail in Section 7.1. The key exploration activities included higher-density infill and extension diamond drilling programs at Konkola and Nchanga, supported by improved drill rig technology, core recovery techniques, and enhanced geostatistical modelling. These programs allowed the systematic classification of Mineral Resources into Measured, Indicated, and Inferred categories.
Integrated metal production reached a high of approximately 160,000 tonnes of copper in Financial Year (FY) 2013, reflecting the benefit of the Vedanta-era capital investments. However, production subsequently declined to approximately 90,000 tonnes in FY 2019, driven by mining challenges at Konkola (including water management), declining open pit inventory at Nchanga, and reduced smelter feed.
| 5.5 | Provisional liquidation (2019–2024) |
In May 2019, ZCCM-IH filed a winding-up petition in the High Court of Zambia, resulting from a shareholder dispute with Vedanta. The High Court appointed a provisional liquidator (“the Provisional Liquidator”) to oversee KCM’s operations. During this period, KCM’s board was suspended and the company operated outside of Vedanta’s direct management.
| amcconsultants.com | 63 |
| S-K 1300 TRS: KCM Integrated Operations (Initial Assessment) | |
| Konkola Copper Mines Plc | 0424076 |
| 5.5.1 | Production curtailment |
Under the Provisional Liquidator’s control, total copper production declined significantly, falling from approximately 90,000 tonnes in FY 2019 to a low of approximately 54,000 tonnes in FY 2024. The principal factors contributing to the production decline were:
| · | Reduced capital investment in mine development, equipment replacement, and infrastructure maintenance, resulting in declining ore production from both Konkola Mine and the Nchanga open pit and underground operations. |
| · | Less concentrate delivered to the Nchanga Smelter, leading to the smelter operating at less than 50% of its nominal capacity. |
| · | Minimal acid production from the smelter, restricting feed to the Nchanga TLP and curtailing cathode output from Nchanga TLP operations. |
| · | Failure to pay third-party concentrate suppliers on time, further reducing smelter utilisation of available concentrate. |
| · | A four-month care and maintenance period during FY 2025, prior to the resumption of normal operations. |
| 5.5.2 | Exploration and development activity |
No exploration, infill, or extension drilling was undertaken by KCM during the provisional liquidation period. Geological and structural mapping was continued at Konkola to refine lithological contacts, structural deformation, and alteration patterns. The mapping program focused on surface and underground geological observations, detailed core logging, and high-resolution core photography to document lithological variations and structural controls on mineralisation.
Capital development expenditure was minimal. Net cash used in investing activities during FY 2024 (under the Provisional Liquidator) was approximately US$28M, declining to approximately US$13M in FY 2025 due to care and maintenance activities.
| 5.5.3 | Infrastructure condition |
During the provisional liquidation, limited investment in equipment maintenance and infrastructure refurbishment resulted in deterioration of key mining and processing assets. Underground mining equipment at Konkola experienced reduced availability, and the Nchanga processing circuits operated below designed capacity. The condition of the Nkana Refinery tank house and the Nchanga Smelter required substantial refurbishment upon resumption of control.
| 5.5.4 | Resolution and resumption of control |
In 2023, Vedanta and ZCCM-IH resolved the shareholder dispute through a scheme of arrangement under which Vedanta committed to a revised investment program. The scheme was sanctioned by the High Court of Zambia on 28 June 2024 and became effective on 31 July 2024 (the “Scheme Effective Date”). On that date, the Provisional Liquidator was removed and Vedanta’s control and ownership of KCM was reinstated, with shareholding restored to 79.4% Vedanta (through VRHL) and 20.6% ZCCM-IH. The board was reconstituted.
Since the resumption of control, Vedanta has deployed approximately US$125M to refurbish assets across the integrated operations and restore production. Under Vedanta’s management from 31 July 2024 through 31 December 2025, KCM has achieved a production run rate of approximately 140,000 tonnes per annum of copper.
| 5.6 | Production history |
Mining and metal production from the KCM properties is summarised below. Production data prior to FY 2006 is limited due to the transition from ZCCM records. Detailed exploration history from the pre-1950s through the current period is discussed in Section 7.1.
Cumulative copper production from the KCM properties since commencement of operations is substantial.
| amcconsultants.com | 64 |
| S-K 1300 TRS: KCM Integrated Operations (Initial Assessment) | |
| Konkola Copper Mines Plc | 0424076 |
Table 5.2 Cumulative copper production by operation
| Operation | First Production | Cumulative Cu Extracted | ||
| Konkola Complex | 1957 | ~3.2 Mt | ||
| Nchanga Complex | 1937 (UG); 1955 (OP) | ~14.3 Mt |
Source: KCM historical operational records; first production dates corroborated by KCM corporate website (kcm.co.zm) and publicly available Zambian Copperbelt mining history sources. Cumulative extraction includes all production since commencement.
KCM integrated metal production was highest in FY 2013 at approximately 160,000 tonnes of copper. Production continued on a downward trajectory to approximately 90,000 tonnes in FY 2019, at which point provisional liquidation commenced. During the provisional liquidation period (FY 2020–FY 2024), metal production averaged approximately 55,000 tonnes per annum and reached a low of approximately 54,000 tonnes in FY 2024. Production has remained below historic levels during the restart period.
A summary of KCM’s historical production from FY 2006 to FY 2024 is shown in Figure 5.1.
Figure 5.1 KCM historical production FY06-FY24
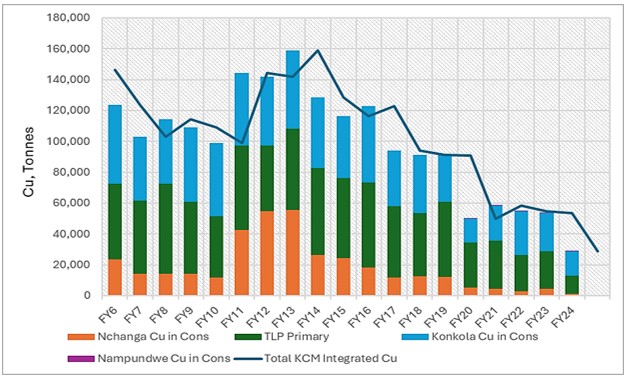
Source: KCM, 2025.
Due to mining challenges during the provisional liquidation, less concentrate was delivered to the smelter, leading to the smelter operating at less than 50% capacity. This led to minimal acid production, restricting Nchanga TLP production. The smelter did not adequately utilise available concentrate in the country due to failure to pay concentrate suppliers on time.
KCM has demonstrated production capability of 160,000 tonnes per annum with all operations running optimally. The installed smelting and refining capacity is 300,000 tonnes per annum. KCM has installed capacity to produce in excess of 200,000 tonnes per annum of copper in concentrates at Konkola and 100,000 tonnes of copper cathodes from the tailings leach facility at Nchanga. With planned investment in mining and processing facilities, KCM is positioned to produce over 300,000 tonnes per annum of finished copper.
| amcconsultants.com | 65 |
| S-K 1300 TRS: KCM Integrated Operations (Initial Assessment) | |
| Konkola Copper Mines Plc | 0424076 |
| 5.7 | Key development milestones |
Table 5.3 summarises the principal development milestones for the KCM Integrated Operations.
Table 5.3 Key development milestones
| Year | Operation | Milestone | ||
| 1923 | Nchanga | Exploration commenced; surface reconnaissance and geological mapping. | ||
| 1927 | Nchanga | Underground mine development commenced. | ||
| 1931 | Nchanga | Initial underground mining commenced; suspended due to flooding and low copper prices. | ||
| 1937 | Nchanga | Underground mining recommenced under NCCM. | ||
| 1943 | Nchanga | Town of Chingola founded to service Nchanga operations. | ||
| 1953 | Konkola | No. 1 Shaft sinking commenced (Bancroft Mine). | ||
| 1955 | Nchanga | Open pit mining commenced from the Nchanga Open Pit. | ||
| 1957 | Konkola | First ore production from No. 1 and No. 2 Shafts. | ||
| 1963 | Konkola | No. 3 Shaft commenced production. | ||
| 1969 | All | GRZ acquired 51% interest in mining companies (Matero Reforms). Anglo operations reorganised as NCCM. | ||
| 1982 | All | NCCM and RCM merged to form ZCCM. | ||
| 2000 | All | KCM formed; acquired Konkola, Nchanga, and Nampundwe assets from ZCCM. Anglo American as strategic partner. | ||
| 2002 | All | Anglo American, IFC, and CDC withdrew from KCM. | ||
| 2003 | Nkana | KCM acquired Nkana metallurgical complex (SmelterCo) comprising smelter, refinery, and sulfuric acid plants. | ||
| 2004 | All | Vedanta assumed management of KCM (November). | ||
| 2006 | Konkola | Sinking of No. 4 Shaft commenced (KDMP). | ||
| 2008 | Nchanga | New Nchanga Smelter commissioned (Outotec technology, 312,000 tpa copper capacity). | ||
| 2008 | Konkola | New 6 Mtpa Konkola concentrator commissioned. | ||
| 2019 | All | Provisional liquidation commenced (May). Production decline accelerated. | ||
| 2024 | All | Scheme of arrangement sanctioned (June). Provisional Liquidator removed; Vedanta control restored (July). |
Source: KCM, 2025; public sources. Nampundwe development milestones are not available in sufficient detail for inclusion.
| amcconsultants.com | 66 |
| S-K 1300 TRS: KCM Integrated Operations (Initial Assessment) | |
| Konkola Copper Mines Plc | 0424076 |
| 6 | Geological setting and mineralisation |
The KCM operations are part of the Zambian Copperbelt, a major segment of the Central African Copperbelt, one of the world's most significant sediment-hosted copper provinces. The primary host rocks for copper-cobalt mineralisation belong to the Katanga Supergroup.
| 6.1 | Regional geology |
The KCM operations are part of the Zambian Copperbelt, a major segment of the Central African Copperbelt, one of the world’s most significant sediment-hosted copper provinces, Figure 6.1. The Central African Copperbelt forms part of the Lufilian Arc, a large Neoproterozoic fold-and-thrust belt that developed due to the collision between the Congo and Kalahari cratons during the Pan-African Orogeny (~650-500 Ma). This collision shaped the arcuate Copperbelt structure, characterised by large-scale recumbent folding, thrust faulting, and shear zones, which significantly influenced copper mineralisation distribution. The Copperbelt comprises Neoproterozoic-age sedimentary sequences that were initially deposited in an ancient rift environment and later subjected to regional tectonic deformation, further impacting the structural and mineralisation framework of the region.
Figure 6.1 Location of Lufilian Arc within Pan-African Belts of Central and Southern Africa
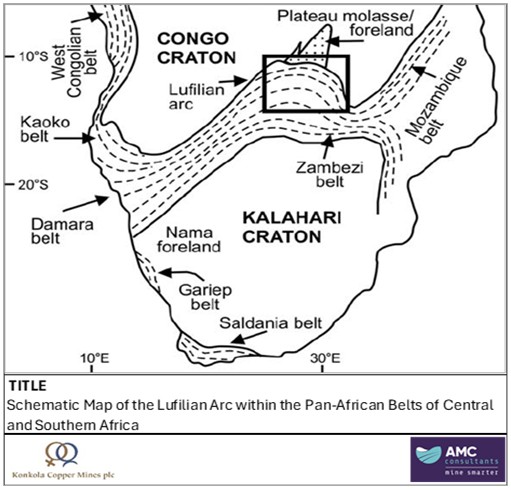
Source: Wendorff, M., 2011. Tectonosedimentary expressions of the evolution of the Fungurume foreland basin in the Lufilian Arc, Neoproterozoic-Lower Palaeozoic, Central Africa. Geological Society of London Special Publications, 357, 69-83. https://doi.org/10.1144/SP357.5.
The primary host rocks for copper-cobalt mineralisation belong to the Katanga Supergroup, a thick succession of marine sedimentary sequences that unconformably overlie the older Basement Complex, which consists of metamorphic and igneous rocks such as schists, gneisses, and granitic intrusions. These basement rocks form the structural foundation for the overlying stratigraphic sequences and influence local deposit geometry. The Katanga Supergroup is subdivided into several formations, with the most economically significant being the Lower Roan Subgroup, which hosts the bulk of copper mineralisation within sandstones, siltstones, and carbonate-rich rocks. The overlying Mwashia and Kundelungu Groups contain additional sedimentary sequences that play roles in fluid migration and structural modification of mineral deposits.
| amcconsultants.com | 67 |
| S-K 1300 TRS: KCM Integrated Operations (Initial Assessment) | |
| Konkola Copper Mines Plc | 0424076 |
The geological evolution of the Central African Copperbelt is defined by key processes that influenced mineralisation:
| · | Initial rift-related deposition (880-750 Ma): The formation of the Katanga Supergroup occurred within a rift basin, leading to the accumulation of thick siliciclastic and carbonate sediments that laid the foundation for later mineralisation. |
| · | Main phase of basin subsidence (750-650 Ma): Continued deposition of marine sediments, including black shales, carbonates, and siltstones, established the stratigraphic framework that would later host copper deposits. |
| · | Orogenic compression and mineral remobilisation (~650-500 Ma): The Lufilian Orogeny deformed the Katanga rocks, inducing folding, thrusting, and faulting that created structural traps, facilitating fluid migration and concentrating copper-cobalt mineralisation. |
The copper deposits of the Zambian Copperbelt are classified as sediment-hosted stratiform copper deposits, with mineralisation occurring as disseminated sulfides within shales, siltstones, and dolomitic horizons. These deposits formed through the interaction of metal-bearing hydrothermal fluids with sulfur-rich reductants, leading to the precipitation of copper sulfides (Figure 6.2). The complex structural modifications from the Lufilian Orogeny played a crucial role in shaping the distribution and quality of mineralisation zones, making structural controls a key factor in the localisation of mineralisation.
Figure 6.2 Schematic cross section of the Lufilian fold belt
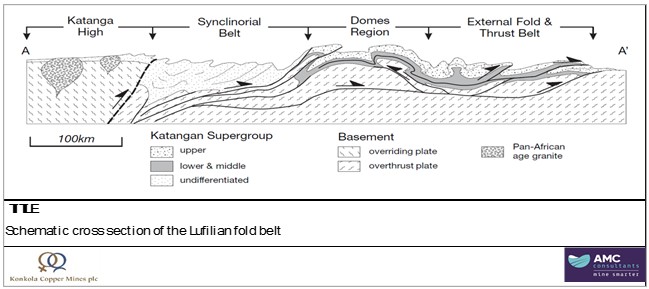
Source: Selley, D., Broughton, D., Scott, R., Hitzman, M., Bull, S., Large, R., McGoldrick, P., Croaker, M., & Pollington, N. (2005). A new look at the geology of the Zambian Copperbelt. Society of Economic Geologists, 100th Anniversary Volume, pp. 000-000.
| amcconsultants.com | 68 |
| S-K 1300 TRS: KCM Integrated Operations (Initial Assessment) | |
| Konkola Copper Mines Plc | 0424076 |
| 6.1.1 | Lithostratigraphy of the Central African Copperbelt |
The Katanga Supergroup is subdivided into three major stratigraphic groups that play a crucial role in copper mineralisation.
Roan Group (dominant copper host) consisting of:
| · | Lower Roan Subgroup (Mindola and Kitwe Formations) in Zambia, has a mixed upper and a predominantly siliciclastic lower. With: |
| — | Basal conglomerate arkoses of coarse clastic sediments of alluvial fans deposited in an intra-cratonic rift basin forming a porous and permeable unit that later acted as a conduit for mineralising fluids. |
| — | Quartzite and feldspathic sandstones from braided streams, interbedded with conglomerates. |
| — | Organically rich finely laminated dolomitic shales, dolomites and siltstones. This unit contains the Ore Shale Unit (OSU), which hosts the stratiform copper-cobalt mineralisation found in the Konkola area. The high organic content created a reducing environment, leading to sulfide precipitation and the formation of extensive copper-rich zones. |
| · | Upper Roan Subgroup overlies the Lower Roan, in Zambia it is a predominantly carbonate unit. Consisting of thick often massive and recrystallised carbonate sequences, with interbedded shales and siltstones. With the change between the two formations marked by the presence of a conglomerate breccia. |
Nguba Group (overlying marine sequences) composed of carbonates, black shales, and calcareous siltstones, deposited in a deeper marine setting. Acting as a regional aquitard, restricted hydrothermal fluid flow and impacting mineralisation patterns. Some zones within the Nguba Group contain secondary copper enrichment, where remobilised fluids have introduced additional mineralisation.
Kundelungu Group (late-stage overlying sequences) consisting of thick quartzites, sandstones, and glaciogenic diamictites, representing deposition in a post-orogenic setting. These units do not host significant copper mineralisation but provide structural control by acting as competent layers that influence the development of folds and thrust faults.
Figure 6.3 illustrates a simplified stratigraphic column of the Kataga Supergroup and geological units containing copper mineralisation.
Figure 6.3 Simplified Katanga Supergroup stratigraphy
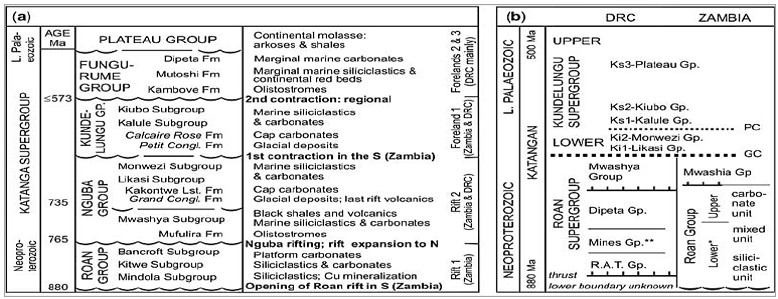
Source: Wendorff, M. (2011). Tectonosedimentary expressions of the evolution of the Fungurume foreland basin in the Lufilian Arc, Neoproterozoic-Lower Palaeozoic, Central Africa. Geological Society of London Special Publications, 357, 69-83. https://doi.org/10.1144/SP357.5.
| 6.1.2 | Mineralisation genesis |
Copper deposits of the Zambian Copperbelt are sediment-hosted stratiform deposits, formed through the interplay of sedimentation, basin evolution, and hydrothermal fluid migration. During Neoproterozoic rifting, metal-bearing basinal brines circulated through permeable Roan Group sediments. Copper and cobalt were leached from basement rocks and precipitated upon reacting with sulfur-rich reductants (such as organic matter and pyrite) within the OSU. Near-surface oxidation led to the formation of oxide copper minerals (malachite, azurite, and chrysocolla). Supergene enrichment enhanced chalcocite-dominated mineralisation, improving mineralisation grades.
| amcconsultants.com | 69 |
| S-K 1300 TRS: KCM Integrated Operations (Initial Assessment) | |
| Konkola Copper Mines Plc | 0424076 |
| 6.1.3 | Structural and tectonic evolution |
The Central African Copperbelt has experienced multiple deformational events. Key structural features include:
| · | The Lufilian Orogeny (~650-500 Ma) - deforming the Copperbelt with crustal shortening and folding that led to the formation of broad northwest-trending synclines and anticlines. |
| · | Compression resulted in the development of thrust faults, which served as secondary pathways for fluid movement and mineralisation deposition. |
| · | The Konkola Syncline preserves high-grade copper mineralisation by trapping mineralisation within fold closures. |
| · | Thrust faults and shear zones have segmented the mineralised horizons, resulting in localised enrichment zones and structural complexity. |
| · | The Nguba Group functions as a major aquitard, restricting hydrothermal fluid flow and impacting mineralisation deposition. |
Primary mineralisation is hosted within the OSU. Regional-scale shear zones and low-angle thrust faults have influenced the redistribution of mineralisation, creating high-grade copper zones. Reactivated fault structures have remobilised copper-cobalt mineralisation, leading to the formation of secondary enrichment zones.
| 6.2 | Konkola local geology |
The geological map of the greater Konkola areas is shown in Figure 6.4. The Konkola deposit (shown in grey) is adjacent to the Kirilabombwe anticline.
Figure 6.4 Geological map of the greater Konkola area
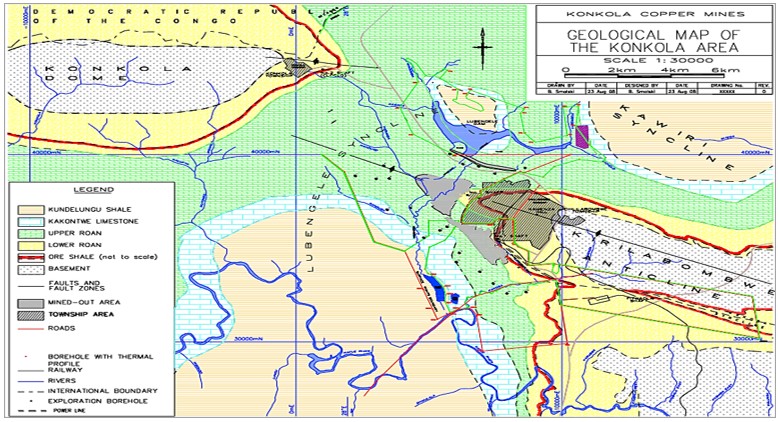
Source: KCM, 2026.
| amcconsultants.com | 70 |
| S-K 1300 TRS: KCM Integrated Operations (Initial Assessment) | |
| Konkola Copper Mines Plc | 0424076 |
Konkola mineralisation is hosted within the Lower Roan Subgroup, see the stratigraphic column in Figure 6.5. Key geological units include:
Lower Roan Subgroup consisting of:
| · | Multiple coarse-grained conglomerates and sandstones at the base of the sequence. |
| · | Footwall Quartzite (FWQ) a thick, well-cemented quartzite, forming a structurally competent horizon beneath the main mineralised zones. |
| · | Ore Shale Unit (OSU), the primary copper-bearing unit, composed of carbonaceous shales and interbedded siltstones. The mineralised OSU is characterised by fine-grained sulfide dissemination and bedding-parallel veinlets, with mineral deposition controlled by sedimentary permeability, organic matter content, and structural influences. Key geological features include: |
— Primary host rock: Carbonaceous black shale interbedded with dolomite and siltstone.
— Structural complexity: Folding and thrust faulting create zones of enhanced mineralisation.
— Hydrothermal alteration: Carbonate veining, and minor sericite alteration.
| · | Hangingwall Quartzite (HWQ), a sequence of arkosic and cherty sandstones above the OSU, influencing groundwater movement and structural stability. |
| amcconsultants.com | 71 |
| S-K 1300 TRS: KCM Integrated Operations (Initial Assessment) | |
| Konkola Copper Mines Plc | 0424076 |
Figure 6.5 Stratigraphic column of the Konkola Geology
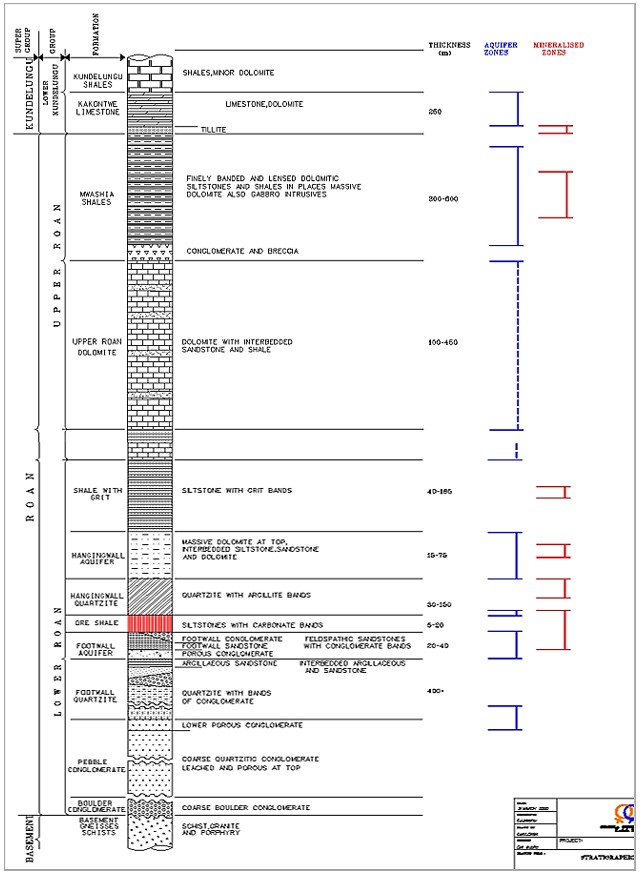
Source: KCM, 2026.
| amcconsultants.com | 72 |
| S-K 1300 TRS: KCM Integrated Operations (Initial Assessment) | |
| Konkola Copper Mines Plc | 0424076 |
| 6.2.1 | Mineralisation |
The Konkola deposit is classified as a sediment hosted stratiform copper deposit, formed in low-energy, reducing sedimentary environments. Mineralisation is primarily hosted within fine-grained sedimentary units, where copper sulfides precipitated under anoxic conditions. The deposit exhibits two distinct styles of mineralisation, influenced by lithological and structural controls: shale-hosted and sandstone-hosted copper mineralisation.
Shale-hosted fine grained copper mineralisation occurs within carbonaceous siltstones and shales of the OSU, forming laterally extensive, stratiform deposits. Copper deposition took place in multiple phases, beginning with primary hypogene sulfide mineralisation, followed by supergene enrichment, which enhanced mineralisation grades near the surface. Structural remobilisation further concentrated copper within fold hinges and fault intersections, creating localised high-grade zones.
In contrast, sandstone-hosted copper mineralisation is found in porous quarzitic sandstones of the FWQ, where mineralising fluids migrated into high-permeability zones, leading to structurally controlled, localised mineralisation deposition. Although less laterally extensive than shale-hosted mineralisation, these zones often contain higher-grade copper concentrations.
The dominant economic minerals at Konkola include chalcopyrite, bornite, and chalcocite. These primary copper sulfide minerals define the economic potential of the deposit, with bornite and chalcocite typically associated with higher copper grades, while chalcopyrite remains the most widespread. Cobalt is present often occurring as the copper cobalt sulfide (CuCo2S4) carrollite.
The mineralogy of the KCM operation varies significantly across different mining areas, reflecting differences in host rock composition, structural complexity, hydrothermal alteration, and secondary enrichment processes.
| 6.2.1.1 | Primary sulfide mineralisation |
The primary (hypogene) mineralisation at Konkola is characterised by the deposition of copper-bearing sulfide minerals within the OSU under reducing conditions during the initial formation of the deposit. This mineralisation style represents the earliest stage of copper enrichment and is largely controlled by the chemical composition of the host rock, basin-scale fluid migration, and diagenetic processes. Unlike secondary mineralisation, which results from later enrichment or oxidation, primary mineralisation is associated with the original precipitation of copper sulfides from hydrothermal fluids during the deposit’s formation.
The distribution of chalcopyrite, bornite, and pyrite varies according to temperature, fluid composition, and permeability at the time of deposition. Chalcopyrite-dominant zones represent the earliest sulfide mineralisation, forming as a stable copper-iron sulfide under moderate-temperature conditions. Bornite-rich zones indicate higher copper enrichment, often associated with hydrothermal upgrading, while pyrite-dominant areas suggest less copper availability during early diagenesis.
In addition to its layer-parallel stratiform distribution, primary mineralisation at Konkola has also been affected by later structural reworking. In some areas, copper sulfides have been remobilised along shear zones and fault intersections, locally increasing mineralisation grades. These structural features, combined with hydrothermal alteration, have influenced the spatial variability of primary mineralisation and its transition into enriched secondary mineralisation zones. Key sources of copper from primary mineralisation are summarised below:
| · | Chalcopyrite (CuFeS₂): |
| — | The most abundant copper-bearing sulfide at Konkola, particularly in deeper, unaltered hypogene zones. |
| — | Typically forms as fine-grained disseminations within the shale matrix or as vein-hosted mineralisation along bedding planes and fractures. |
| — | Chalcopyrite is the primary mineral in lower-grade areas but can be locally enriched where it has been altered by later hydrothermal or supergene processes. |
| amcconsultants.com | 73 |
| S-K 1300 TRS: KCM Integrated Operations (Initial Assessment) | |
| Konkola Copper Mines Plc | 0424076 |
| · | Bornite (Cu₅FeS₄): |
| — | Occurs in regions of increased thermal alteration, often in association with chalcopyrite. |
| — | Found in higher-grade copper zones, where it partially replaces chalcopyrite, increasing the copper-to-iron ratio in the ore. |
| — | Bornite is particularly notable in areas affected by hydrothermal fluid influx, where its formation is linked to sulfidation reactions and temperature variations. |
| · | Pyrite (FeS₂): |
| — | Widespread across the OSU, with higher concentrations in lower-grade areas where it formed as an early diagenetic phase before copper mineralisation. |
| — | Acts as an indicator of reducing conditions, which were crucial for the precipitation of copper sulfides. |
| — | While not an economic source of copper, pyrite plays a role in buffering sulfur activity within the mineralising system and influencing later enrichment processes. |
| 6.2.1.2 | Supergene enrichment and secondary mineralisation |
The process of supergene enrichment enhances copper grades at Konkola by transforming primary sulfides into secondary, more copper-rich minerals. This enrichment occurs when meteoric water infiltrates the deposit, dissolving copper from upper oxidised zones and redepositing it at deeper levels where chemical conditions shift from oxidising to reducing. This results in the conversion of chalcopyrite and bornite into higher-grade chalcocite and covellite, which has greater copper content per unit mass.
At Konkola, supergene enrichment is particularly evident in structurally favorable zones, such as areas with increased fracture permeability, shear zones, and fold hinges. These geological features provide pathways for descending copper-rich solutions and serve as natural deposition sites where secondary sulfides precipitate. As a result, supergene-enriched horizons often exhibit higher copper grades than the original primary sulfide mineralisation, making them economically significant for mining.
Secondary mineralisation, a broader term that encompasses supergene enrichment, refers to all mineral changes that occur after the initial formation of the deposit. This includes both sulfide transformations and the development of oxidised copper minerals. In the near-surface portions of the Konkola deposit, prolonged exposure to oxygen and acidic groundwater has altered sulfides into secondary copper oxides and carbonates, such as malachite, azurite, and chrysocolla.
| · | Chalcocite (Cu₂S) and Covellite (CuS): Formed due to the leaching of primary sulfides and redeposition in enrichment blankets. |
| · | Malachite (Cu₂(CO₃)(OH)₂) and Azurite (Cu₃(CO₃)₂(OH)₂): Common in weathered zones, particularly in the Nchanga Open Pit and Kakosa deposits. |
| · | Chrysocolla and Cuprite: Found in oxidised portions, particularly along structural conduits where groundwater movement has promoted oxidation. |
These oxidised minerals mark the transition from the weathered surface layers down to the enriched sulfide zone.
While secondary sulfide mineralisation generally improves copper recovery through flotation due to the higher copper-to-iron ratio of minerals like chalcocite and digenite, oxide mineralisation poses different processing challenges. Copper oxides are less responsive to flotation and require acid leaching methods for effective recovery. The extent of oxidation and supergene enrichment at Konkola influences metallurgical performance, with some areas containing both highly reactive secondary sulfides and less flotation-efficient oxidised copper zones.
The structural complexity of the Konkola deposit has a significant impact on the distribution of supergene enrichment and secondary mineralisation. Fault networks and shear zones have facilitated the downward migration of copper-bearing fluids, leading to localised zones of high-grade enrichment. At the same time, impermeable lithological boundaries, such as certain carbonate-rich layers, have acted as barriers, influencing where secondary mineralisation is concentrated.
Together, these processes have resulted in a vertically zoned deposit, with near-surface oxidised minerals transitioning into secondary sulfide-rich enrichment zones, which in turn grade into the deeper primary hypogene sulfides. Understanding the interplay between these mineralisation styles is critical for mine planning and processing, as different zones require distinct extraction strategies to optimise recovery.
| amcconsultants.com | 74 |
| S-K 1300 TRS: KCM Integrated Operations (Initial Assessment) | |
| Konkola Copper Mines Plc | 0424076 |
| 6.2.1.3 | Hydrothermal alteration |
Hydrothermal alteration plays a role in modifying and upgrading mineralisation, particularly near shear zones and fault-controlled structural corridors. These alterations have influenced both the primary and secondary mineralisation processes, affecting mineral assemblages, metal mobility, and grade distribution.
These alteration zones often mark fluid pathways that controlled sulfide precipitation and redistribution, making them critical for targeting high-grade mineralisation shoots.
The primary hydrothermal alteration phases linked to mineralisation in the Konkola region include:
| · | Silicification: |
| — | Quartz veining and silica flooding occur in and around ore-bearing units, enhancing rock competency but reducing permeability. |
| — | This process often preserves sulfide mineralisation and is commonly associated with chalcopyrite-rich zones in the OSU. |
| · | Sericite-carbonate replacement: |
| — | Fine-grained sericite (white mica) and carbonate minerals replace original feldspar and clay-rich components within shale and sandstone units. |
| — | This alteration is associated with early-stage copper precipitation, often forming a chalcopyrite-pyrite assemblage, later overprinted by more copper-rich phases such as bornite and chalcocite. |
| · | Chloritic overprinting: |
| — | Localised along shear zones and fault boundaries, chlorite alteration is indicative of hydrothermal fluid interaction and mechanical deformation. |
| — | This alteration style is frequently linked to structural remobilisation of copper, where early-deposited chalcopyrite is upgraded to bornite and chalcocite, enhancing mineralisation grades in these zones. |
| 6.2.1.4 | Variability in mineralisation across mining areas |
The mineralisation styles in the OSU vary significantly depending on lithology, alteration intensity, and structural influences thus there are distinct differences existing between mineralisation in the different mining areas.
Konkola retains a predominantly primary sulfide assemblage, with disseminated chalcopyrite and bornite hosted in the OSU. Minimal supergene alteration has occurred due to limited fluid penetration and deep burial, preserving the hypogene mineralisation style.
| amcconsultants.com | 75 |
| S-K 1300 TRS: KCM Integrated Operations (Initial Assessment) | |
| Konkola Copper Mines Plc | 0424076 |
| 6.2.2 | Major structural controls on mineralisation |
The dominant structural feature shaping mineralisation at Konkola is the Konkola Syncline, a large-scale fold that has helped preserve mineralised horizons by shielding them from erosion and oxidation. The syncline geometry has also acted as a mineralisation trap, concentrating copper-bearing fluids along the fold axis.
In addition to folding, thrust faulting has played a role in mineralisation. Several major fault systems cut across the deposit, creating structural traps where mineralising fluids were focused along shear zones, fault intersections, and competency contrasts between rock units. These faults have led to:
| · | Thickening of mineralised zones, particularly in areas where repeated thrusting has stacked ore-bearing units. |
| · | Structural reworking of sulfides, with some areas experiencing remobilisation, resulting in localised grade increases. |
| · | Formation of high-grade lenses, particularly where faults intersect with lithological permeability contrasts, enhancing fluid-rock interaction. |
| 6.3 | Nchanga local geology |
The Nchanga mining complex is situated at the northwestern edge of the Kafue Anticline with mineralisation primarily hosted within the Lower Roan Subgroup, and specifically the Upper Ore Body (UOB), and the Lower Ore Body (LOB).The Nchanga mining complex spans a broader range of geological variability than at Konkola including the COP DF, COP E Extension, and underground deposits in both the UOB and LOB.
As at Konkola, the mineralisation at Nchanga is hosted within the Lower Roan Subgroup, with the enrichment of Arkosic sediments following the intrusion of the Neoproterozoic Nchanga basement granite. The emplacement and subsequent cooling of the Nchanga granite led to copper and cobalt enriched fluid migration across several horizons within the Lower Roan Subgroup, notably the UOB and LOB.
| 6.3.1 | Mineralisation |
Mineralisation at Nchanga comprises a sediment hosted stratiform copper deposit, formed in a low-energy, reducing sedimentary environment. Whilst the deposit genesis is similar to Konkola, the mineralisation displays a heterogeneous mix of oxide, supergene, and primary sulfide mineralisation due to prolonged weathering and groundwater interaction. Copper occurs in oxidised forms (malachite, chrysocolla) at the surface, while supergene sulfides (chalcocite, covellite) dominate in the enrichment zone, transitioning into primary chalcopyrite and bornite at greater depth.
The COP DF deposit area is situated at the lower south-eastern edge of the Nchanga asset, approximately 22 km directly south of Konkola with high copper concentrations present in the OSU.
The Nchanga COP E deposit area is located to the immediate north of COP DF, and some 22 km south of Konkola. The mineralisation appears to be an extension of the Konkola deposit with mineralisation occurring in carbonaceous shales.
| 6.3.2 | Major structural controls on mineralisation |
The Nchanga COP DF deposit exhibits high copper concentrations in the OSU and is situated within a fault-bounded basin, with thrust faulting and folding enhancing the preservation of mineralisation in trap sites. Mineralisation displays a steep dip of 50-70° with the structural complexity increasing with depth.
The Nchanga COP E deposit follows the regional synclinal trend, with localised structural disturbances which influence the geometry and thickness of mineralisation. The mineralisation sees dips varying between 45-70°, becoming shallower (30-40°) where the syncline starts to flatten out.
| amcconsultants.com | 76 |
| S-K 1300 TRS: KCM Integrated Operations (Initial Assessment) | |
| Konkola Copper Mines Plc | 0424076 |
| 6.4 | Summary of geological characteristics |
The geographic extents of the Konkola and Nchanga deposits reported as Mineral Resources are summarised in Table 6.1.
Table 6.1 KCM deposit mineralisation extent
| Deposit | Length (km) |
Width (m) |
Depth (m) |
Mineralisation | ||||
| Konkola | ~ 5 | 5 – 50 | > 1,000 | Chalcopyrite, bornite | ||||
| COP DF | ~ 1.5 | 3 - 50 | 300 - 600 | Malachite, chrysocolla, cuprite, bornite, and chalcopyrite | ||||
| COP E Extension | ~0.8 | 3 - 50 | ~300 | - |
Table 6.2 summarises the variable geological conditions across Konkola and Nchanga assets.
Table 6.2 Summary of geological characteristics of KCM operations
| Operation | Geological characteristics |
| Konkola |
· Location: Centrally located in the Konkola mining district, approximately 15 km north of Nchanga. · Host lithology: The OSU hosts the majority of copper mineralisation, overlain by the Hangingwall Quartzite. Dominated by chalcopyrite-pyrite mineralisation, with bornite becoming more prominent in structurally complex zones. Structural deformation, particularly thrust faulting, has created zones of higher permeability, allowing for localised remobilisation of copper and increased grade variability. Deep-seated hydrothermal fluids have contributed to minor silicification and sericite alteration, modifying the host rock and influencing metallurgical properties. · Structural controls: The deposit is preserved within the Konkola Syncline, a broad northwest-trending fold structure. Thrust faulting and shear zones segment the mineralisation, creating localised enrichment and structural complexity. · Deposit geometry and dip: The mineralisation is moderately to steeply dipping (45-70°), conforming to the synclinal structure. The dip increases sharply at depth, requiring specialised mining techniques. · Hydrogeology: Konkola is among the wettest underground mines, with high groundwater inflows along faulted and fractured zones, necessitating intensive dewatering measures. |
| COP DF |
· Location: Lower south-eastern edge of the Nchanga asset, approximately 22 km directly south of Konkola. · Host lithology: Similar to the main Konkola deposit, with high copper concentrations in the OSU. · Structural controls: Situated in a fault-bounded basin, with thrust faulting and folding enhancing preservation of mineralisation. · Deposit geometry and dip: The mineralisation maintains a steep dip (50-70°), with structural complexity increasing significantly at depth. · Hydrogeology: High groundwater management requirements due to fault connectivity and potential hydraulic connections to nearby mining areas, requiring continuous high-capacity dewatering. |
| COP E Extension |
· Location: Lower south-eastern edge of the Nchanga asset immediately north of COP DF, approximately 22 km directly south of Konkola. · Host lithology: Extension of the Konkola deposit, with continuous mineralisation in carbonaceous shales. · Structural controls: The deposit follows the regional synclinal trend, with localised structural disturbances influencing mineralisation geometry and thickness. · Deposit geometry and dip: The dip varies between 45-70°, with localised shallower zones (30-40°) where the syncline flattens. · Hydrogeology: Similar dewatering challenges as Konkola Deep, requiring intensive pumping infrastructure and hydrogeological monitoring. |
The mineralisation styles in the OSU vary significantly depending on lithology, alteration intensity, and structural influences thus there are distinct differences existing between mineralisation in the different mining areas.
| · | Konkola: Retains a predominantly primary sulfide assemblage, with disseminated chalcopyrite and bornite hosted in the OSU. Minimal supergene alteration has occurred due to limited fluid penetration and deep burial, preserving the hypogene mineralisation style. |
| · | Kakosa South and Fitwaola (see Figure 11.1): Higher carbonate content has resulted in localised alteration differences, affecting both rock strength and processing requirements. Sulfide mineralisation is more dispersed, with some areas exhibiting lower supergene influence due to carbonate buffering effects, which limited acid-driven leaching. |
| · | Nchanga: Mineralisation displays a heterogeneous mix of oxide, supergene, and primary sulfide mineralisation due to prolonged weathering and groundwater interaction. Copper occurs in oxidised forms (malachite, chrysocolla) at the surface, while supergene sulfides (chalcocite, covellite) dominate in the enrichment zone, transitioning into primary chalcopyrite and bornite at greater depth. |
| amcconsultants.com | 77 |
| S-K 1300 TRS: KCM Integrated Operations (Initial Assessment) | |
| Konkola Copper Mines Plc | 0424076 |
| 7 | Exploration |
Exploration at KCM has been ongoing since discovery. The drilling database contains both historical and modern data from diamond core drilling. Modern drilling programs have focused on resource definition and upgrading classification.
There is no active exploration being undertaken at either Konkola or Nchanga assets. All exploration described below is historic and conducted by previous asset owners. All proposed drilling is resource infill or resource extension drilling. This includes all other means of exploration, for example geophysics.
| 7.1 | Exploration history – Konkola and Nchanga |
The exploration history of both Konkola and Nchanga spans over a century and includes:
| · | Multiple phases of geophysical surveys, geological mapping, hydrogeochemical sampling, and diamond drilling. |
| · | Surface mapping and trenching, which provided the first indications of copper anomalies. |
| · | Geochemical sampling, used to establish baseline geochemical signatures. |
| · | Diamond drilling campaigns (1950s–1980s), which confirmed the stratiform nature of the OSU and outlined the structural framework of the deposit. |
| · | Higher-density drilling programs (1990s–2000s), improving confidence in grade continuity and allowing for systematic Mineral Resource classification. |
| · | Geostatistical modelling, integrating conditional simulation and variography techniques to refine resource estimates. |
| · | Recommencement of infill and extension drilling at Konkola and select Nchanga assets in late 2025. Drilling at Nchanga TD05 to commence the process to incorporate the tailings dam into the resource base. |
Early exploration (pre-1950s): Initial Surface Reconnaissance: The earliest exploration efforts at Konkola were limited to surface mapping, trenching, and basic geochemical sampling. These activities aimed to identify copper anomalies and determine potential mineralised zones. Mapping efforts focused on understanding lithological and structural features; while trenching and shallow sampling confirmed the presence of copper within sedimentary formations. Although these early techniques were rudimentary, they led to the identification of the OSU, which was later recognised as the primary host of copper mineralisation at Konkola.
Systematic diamond drilling phase (1950s–1980s): From the 1950s onwards, exploration transitioned towards systematic diamond drilling, aimed at confirming the continuity and thickness of the OSU. Early drilling programs initially used wider spacing of 200–300 m, which was progressively reduced as the deposit was better defined. These programs provided critical insights into the stratiform nature of the deposit, confirming that copper mineralisation was laterally extensive and relatively continuous over several kilometres. Through this phase, key structural controls on mineralisation were identified, including faults, folds, and lithological variations, which were recognised as significant influences on grade distribution.
Advancements in geological modelling (1990s–2004): The 1990s marked a significant shift in geological strategy, coinciding with the privatisation of Zambian mining assets, which increased investment in geological studies. Higher-density infill and extension diamond drilling programs were undertaken, supported by improved drill rig technology, core recovery techniques, and enhanced geostatistical modelling. These advancements allowed for the systematic classification of Mineral Resources into Measured, Indicated, and Inferred categories, reducing uncertainty and improving the reliability of resource estimates.
In November 2004 KCM commenced management of the Konkola and Nchanga assets. From this time focus has been on production, then the development of smaller brownfields assets within and around the existing mining areas these include COP E Extension, COP DF underground, Kakosa North and South, Upper Ore Body and tailings dams.
| amcconsultants.com | 78 |
| S-K 1300 TRS: KCM Integrated Operations (Initial Assessment) | |
| Konkola Copper Mines Plc | 0424076 |
Recent production from the 2006 onwards is discussed in Section 5.6.
Drilling (2004 to 2019): Extension and infill drilling of known mineralisation was undertaken prior to provisional liquidation through ZCCM-IH in May 2019. The geological development focused on infill drilling below and along strike of mineralisation in and around active mining areas.
Mapping for structural controls (2019 to 2024): No exploration, infill and extension drilling has been undertaken by KCM. Geological and structural mapping has been undertaken at Konkola to refine lithological contacts, structural deformation, and alteration patterns to update the geological interpretation. The mapping program has focused on surface and underground geological observations, detailed core logging and high-resolution core photography to documenting lithological variations and structural controls on mineralisation.
Drilling (late 2025 and ongoing): Infill drilling has commenced at Konkola underground and Nchanga COP E Extension and Upper Orebody. Drilling and test work commenced at TD05 and Lubengele. With TD05 progressing to an initial Mineral Resource estimation.
| 7.2 | Drilling methods |
Collection and collation of drillhole data for Konkola and Nchanga is the same.
Infill and extension drillholes are drilled using pneumatic or electric hydraulic diamond coring underground drill rigs. Drill rod sizes include BQ, NQ, HQ, and PQ diameter depending on length and purpose of hole (dewatering or resource infill) which are specified by site geologists / hydrogeologists. Diamond drilling is outsourced to specialist drilling companies.
All drilled core is cleaned, measured and placed in appropriately labelled core boxes and transported from underground to the surface core yard facilities. The contractor performs all the work necessary to complete or abandon each hole in the manner specified by KCM.
Drilling at TD03 and TD04 tailings dams in September 2000, was done by 50 mm portable mechanised auger. Holes were drilled to the rock or soil below the tailings and terminated.
The 2025 drilling at TD05 tailings dam is by HQ core drilling using an Atlas Copco CS15 H121 drill rig. Holes were generally drilled into the underlying laterite basement then terminated.
| 7.3 | Core recovery |
A minimum core recovery of 90% is expected in the hard rock mineralisation. Core recovery is measured and checked during core logging.
Tailings drilling in 2025 produced 90% core recovery across the program due to water content of the tailing’s material.
| amcconsultants.com | 79 |
| S-K 1300 TRS: KCM Integrated Operations (Initial Assessment) | |
| Konkola Copper Mines Plc | 0424076 |
Figure 7.1 Recovery of tailings material and in core tray at TD05
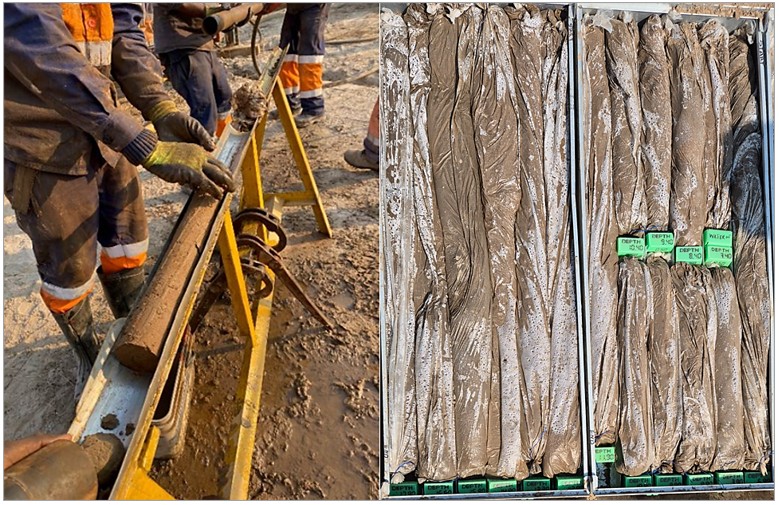
Source: ABGM 2026 and AMC 2026.
| 7.4 | Core logging |
Core logging procedure includes recording information such as lithology, rock type, visible mineralisation, degree of weathering, RQD, and joint density. The logging is done manually on paper log template. Drill logs are then checked and verified by the supervising geologist and approved. The logs are then entered into Excel spread sheets and are again checked for transcription errors.
| 7.5 | Sample selection |
After logging the drillhole, the geologist prepares a sampling sheet. The entire mineralisation unit is sampled, including some portion of the footwall and hangingwall so as to have a clear definition of the mineralisation boundary. The sample interval is a maximum of 1 m in mineralisation, and 0.5 m in the immediate footwall and hangingwall formations.
Generally, for infill and extension drilling whole core is submitted for sample preparation and analysis. From mid-2025, for example sections, half core is being submitted so as to retain material in the core tray for audit purposes.
For tailings sample analysis the whole sample interval was used in the analysis
| 7.6 | QAQC program |
As part of QAQC, blank and certified reference material (CRM) samples are inserted consecutively for every five primary samples for small batches <20 samples or every ten primary samples for batches >30 samples. As a general guide, a minimum of three and a maximum of five CRM samples are used per batch. CRMs are used for counterchecking the accuracy of analytical method applied. Repeats are also used as part of QAQC and are prepared by retrieving coarse rejects and pulp samples from the laboratory and re-submitting them for assaying. At least 20% of combined course and pulps samples are submitted to the laboratory. Repeat samples are aimed at checking reproducibility or precision of the laboratory. Repeat samples are repacked and assigned different sample numbers prior to resubmission to the laboratory for re-assay. CRMs are inserted after every tenth sample in all the drillholes within the mineralisation.
| amcconsultants.com | 80 |
| S-K 1300 TRS: KCM Integrated Operations (Initial Assessment) | |
| Konkola Copper Mines Plc | 0424076 |
After logging the core, the core is sampled as per sampling procedure and is dispatched to the analytical laboratory for assaying.
| 7.7 | Konkola Mine |
| 7.7.1 | Drillhole locations |
Drillhole location plan for Konkola, showing 4,245 drillholes, see Figure 7.1. Drillholes pre- 2016 are black. Drillholes from 2016 onwards are shown in red. Further detail is provided in context in Section 11.3.
Figure 7.2 Drillhole location plan - Konkola
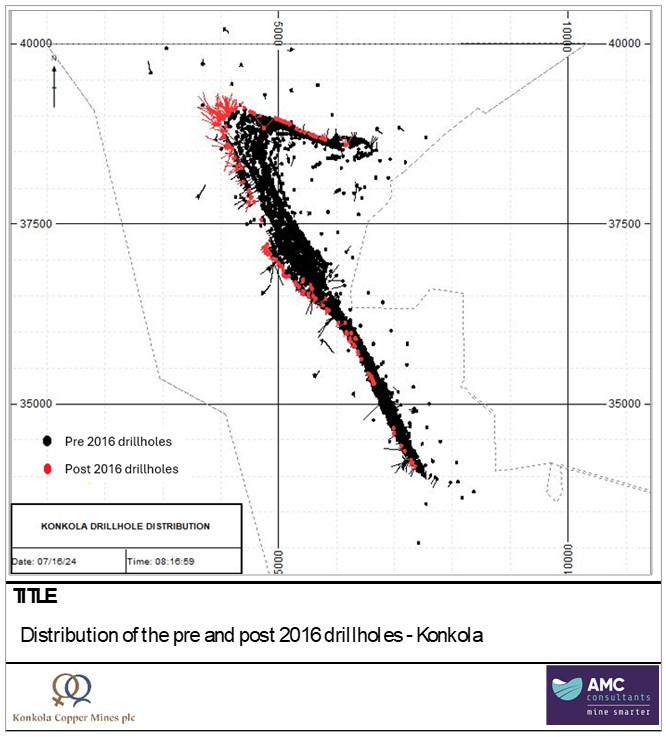
Source: AMC, 2026.
| amcconsultants.com | 81 |
| S-K 1300 TRS: KCM Integrated Operations (Initial Assessment) | |
| Konkola Copper Mines Plc | 0424076 |
| 7.7.2 | Hydrogeology |
At Konkola the following testing and monitoring has been established:
| · | Piezometer Installation: Monitoring wells have been established to measure groundwater levels and flow rates. |
| · | Pump Testing: Conducted to determine aquifer permeability, hydraulic conductivity, and inflow rates into mine workings. |
| · | Hydrogeological Modelling: A numerical groundwater flow model is under development to predict future dewatering requirements and optimise water management strategies. |
| · | Water Quality Assessments: Routine sampling of mine water is conducted to monitor contamination risks and compliance with environmental standards. |
See Section 13.2.4 for hydrogeological information in the context of the mining method and mine plan.
| 7.7.3 | Exploration program summary |
The planned drilling programs are designed as a phased approach with each phase targeting varying Resource classifications ranging from Measured, Indicated, and Inferred. The exploration program at Konkola Mine is summarised in Table 7.1.
Table 7.1 Exploration drill program – Konkola Mine
| Phase | Objective | Drill spacing | Meters | Target classification | ||||
| Phase 1 | 5-year production confidence | 60 m | TBD | Measured | ||||
| Phase 2 | 10-year production confidence | 120 m | TBD | Indicated | ||||
| Phase 3 | Inferred upgrade | 200 m | TBD | Indicated | ||||
| Phase 4 | Boundary extension | Exploratory | TBD | Inferred |
| 7.8 | Nchanga Business Unit |
| 7.8.1 | Drillhole locations |
Drillhole location plan for COP DF showing 445 drillholes is shown in Figure 7.2.
| amcconsultants.com | 82 |
| S-K 1300 TRS: KCM Integrated Operations (Initial Assessment) | |
| Konkola Copper Mines Plc | 0424076 |
Figure 7.3 Drillhole location plan – COP DF
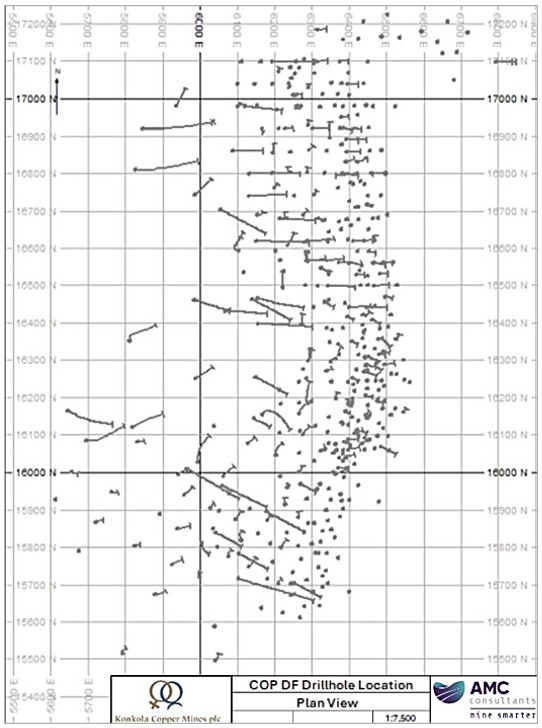
Source: AMC, 2026.
| amcconsultants.com | 83 |
| S-K 1300 TRS: KCM Integrated Operations (Initial Assessment) | |
| Konkola Copper Mines Plc | 0424076 |
Drillhole location plan for COP E showing 283 drillholes is shown in Figure 7.4. The drillholes in green have not been used in the resource estimation for more detail see Section 11.6.3.1.
Figure 7.4 Drillhole location plan – COP E Extension
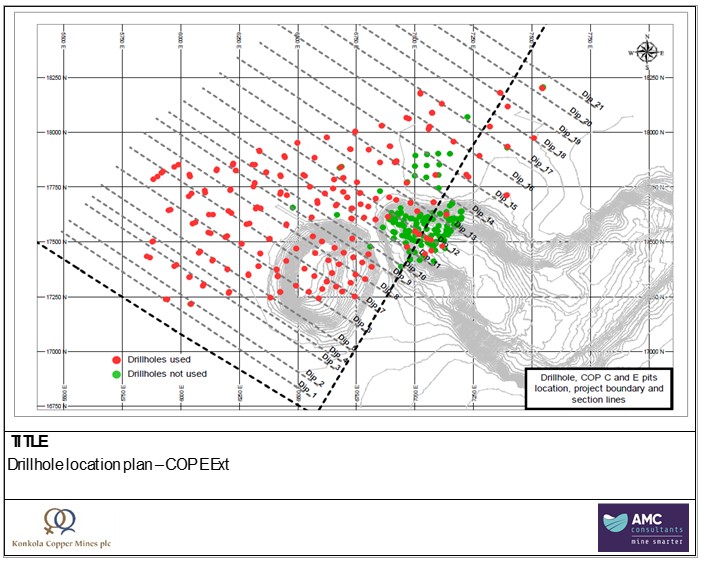
Source: AMC, 2026.
Figure 7.5 shows the drillhole location plan for 2025 for TD05. This includes sample locations for the 14 HQ metallurgical test work drillhole (teal diamonds), the 245 HQ vertical drillholes (green circles) and 29 HQ shallow drillholes for bulk density sampling and measurement (blue squares).
| amcconsultants.com | 84 |
| S-K 1300 TRS: KCM Integrated Operations (Initial Assessment) | |
| Konkola Copper Mines Plc | 0424076 |
Figure 7.5 Drillhole location plan – TD05
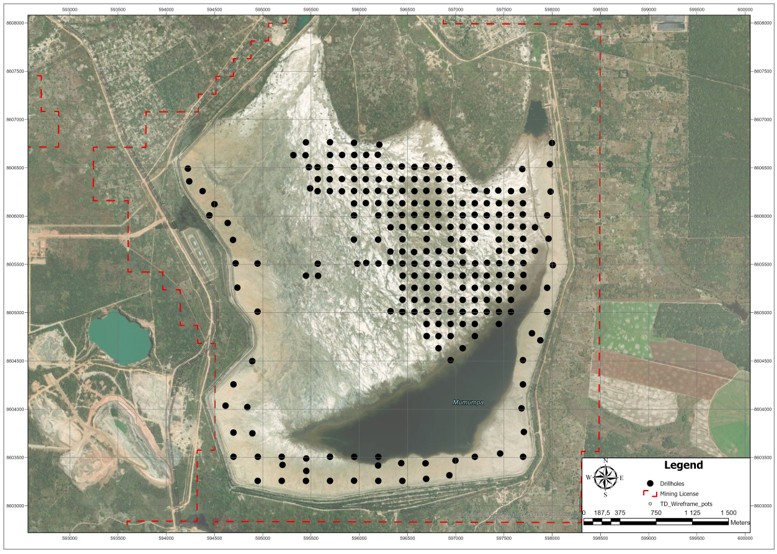
Source: ABGM 2026
| 7.8.2 | Hydrogeology |
Nchanga COP E Ext and COP DF are in proximity to historic large open pits as such they have undergone long term dewatering. The level of study for Nchanga COP E Ext and COP DF is at an early stage, and the status of existing groundwater conditions will be assessed as part of the project development.
| 7.8.3 | Future drilling program summary |
The planned drilling programs at Nchanga are designed to upgrade the current Inferred Mineral Resources to Indicated classification and support future prefeasibility studies for underground development. The drilling program for Nchanga Business Unit assets is summarised in Table 7.2.
Table 7.2 Exploration drill program – Nchanga Business Unit
| Asset | Objective |
Current classification |
Drill spacing |
Target classification | ||||
| COP DF | Resource upgrade and extension | Indicated + Inferred | 60-80 m | Indicated | ||||
| COP DF Underground | Define underground potential | Inferred | 80-100 m | Indicated | ||||
| COP E Extension | Infill and upgrade | Inferred | 80-100 m | Indicated |
Notes:
| · | COP DF and COP E Extension are currently classified as Inferred Mineral Resources and require infill drilling to support future Mineral Reserve estimation. |
| · | Drill spacing targets are based on achieving Indicated Mineral Resource classification per S-K 1300 requirements. |
| · | Detailed drilling programs and budgets are provided in Section 23 (Recommendations). |
| amcconsultants.com | 85 |
| S-K 1300 TRS: KCM Integrated Operations (Initial Assessment) | |
| Konkola Copper Mines Plc | 0424076 |
| 7.9 | Geotechnical data, testing, and analysis |
| 7.9.1 | Konkola |
| 7.9.1.1 | Geotechnical drilling |
Geotechnical drilling and logging are done specifically for geotechnical rock mass classification purposes. AMC has identified gaps in the available geotechnical data across KCM. To allow rock mass characterisation across the project, a geotechnical data collection program has been recommended to support the KDMP mine expansion project and the associated LOM studies required by KCM. AMC has designed a conceptual but executable resource definition (or drill out) program for the KDMP mining area (AMC Konkola KDMP Exploration Strategy report, Jan 2025).
| 7.9.1.2 | Geotechnical testing |
Elastic rock properties using in numerical modelling in 2012 are listed in Table 7.3. Any new data collected for rock properties should be used to revise the previous work. Previous rock property testing for Konkola provided by Itasca 1997 was utilised for numerical modelling in Section 13.2.3.
Table 7.3 Elastic rock properties
| Rock unit | Rock Mass Modulus (MPa) | Poisson’s Ratio | UCS (MPa) | Cohesion (MPa) | Friction angle (°) | |||||||||||||||
| Quartzite | 17,800 | 0.2 | 150 | 5.3 | 48.0 | |||||||||||||||
| Ore Shale | 13,300 | 0.2 | 150 | 4.0 | 37.5 | |||||||||||||||
| Conglomerate | 31,600 | 0.2 | 170 | 7.0 | 52.6 | |||||||||||||||
| Unit ‘A’ | 168 | 0.3 | 5 | 2.4 | 3.0 | |||||||||||||||
Source: AMC, 2026.
Geotechnical sampling and testing are recommended to be performed with future resource definition programs.
| 7.9.1.3 | Seismicity |
KCM has experienced seismicity, with the first recorded event on 8 January 1995. This prompted the purchase of a seismic monitoring system. Four events have since been recorded with Richter magnitudes greater than 6. The source of the earthquakes was found to be well outside the mine region. Mine scale seismic events have been recorded with local magnitudes up to 2.1 since November 1996. The most recent 2.1 event was in June 2020.
The Mine at No 1 Shaft and No 3 Shaft has previously identified a number of high stress pockets with seismic events recorded at No 1 Shaft. Seismic damage was predominantly observed in drives and included falls of ground, rock burst, fracturing and onion skin like unravelling.
Previous observations have noted that the intensity of ground damage from high stress conditions and seismic events reduces the further away the excavation is from the OSU and footwall (KCM, 2000).
Regions of the mine with relatively strong rock mass are likely to be associated with the seismicity. It is expected that seismicity will become more common as the mine develops deeper, particularly in this area.
Seismic monitoring continued during the KCM provisional liquidation proceedings period to allow a baseline prior to the mine restart. AMC recommends ongoing assessment of the seismic data in the future to understand the events and source in relation to rock mass, faults or dewatering. Figure 7.5 presents a schematic diagram of the Konkola IMS seismic system. The IMS system, commissioned in 2012 comprises of 12 sensors (triaxial and uniaxial 4.5 Hz geophones) and allows real time monitoring.
| amcconsultants.com | 86 |
| S-K 1300 TRS: KCM Integrated Operations (Initial Assessment) | |
| Konkola Copper Mines Plc | 0424076 |
Figure 7.6 Seismic system schematics at Konkola
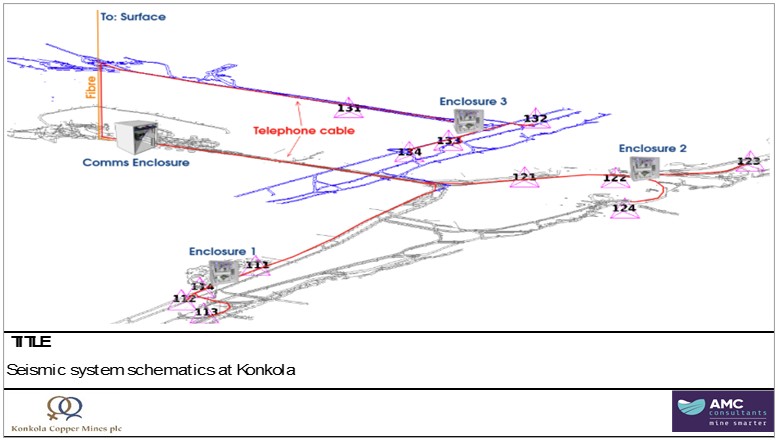
Source: GCMP, 2022b.
| 7.9.1.4 | In situ stress |
Previous modelling indicated that stress on closure pillars was likely to significantly increase with vertical depth. An updated LOM will require a detailed review of the expected damage to closure pillars and ability to recover these.
Since the pause in production, AMC recommends that the underground operations undertake a review of development performance for general convergence and damage in drives due to the orientation of drives, and standoff distance of the drives from stoping areas, including stress mapping guidance. Horizontal stress is noted as sub-parallel to the foliation and mineralisation and is the dominant influence on damage to development within pillars and the footwall.
AMC recommends that in situ stress testing is undertaken at the lowest level in the future to confirm the orientation of the stress field at depth which is based on the current limited testing. In situ stress has critical implications (safety, production reliability, etc.) that higher induced stress will cause at these mining depths.
| 7.9.1.5 | Groundwater |
The stratigraphic units of the local area are detailed below in Table 7.4, including the average thickness of each unit and their hydrogeological significance (aquifer or aquiclude). The general strike orientation of the units is from south to north, with a dip towards the west at an angle of approximately 40° (GCMP, 2020).
Groundwater inflows are collected and used to characterise the rock mass generally as damp, dripping or wet conditions. The hydrogeological information is presented in the KCM mine designs and used in geotechnical stability analysis (GCMP, 2022).
Figure 7.6 shows the three main aquifers in the Konkola mine sequence. The base of the hangingwall aquifer 2024 modelled structure is ~40 m in the hangingwall of the OSU and indicated to have very high flow rates ~2,000 mL/s. The footwall aquifer contains slightly cemented sands and is described as damp and the FWQ and LPC aquifer has a minimum distance of approximately 100 m from the mine workings and characterised as dripping ground water conditions.
| amcconsultants.com | 87 |
| S-K 1300 TRS: KCM Integrated Operations (Initial Assessment) | |
| Konkola Copper Mines Plc | 0424076 |
Table 7.4 Local geology and hydrogeological units
| Stratigraphy | Thickness (m) | Hydrogeological unit | ||
| Upper Roan Dolomite | >400 | Aquifer | ||
| Shale with Grit | 70 | Aquiclude | ||
| Chingola Dolomite | 15 | Aquifer | ||
| Dolomitic Schist | 20 | Minor aquifer | ||
| Upper Banded Shale | 18 | Aquiclude | ||
| Feldspathic Quartzite | 18 | Aquiclude | ||
| Upper Banded Sandstone | 15 | Aquifer | ||
| Pink Quartzite | 5 | Aquiclude | ||
| Lower Banded Sandstone | 10 | Aquifer | ||
| Lower Banded Shale | 10 | Aquiclude | ||
| Arkose | 15 | Minor aquifer | ||
| Basement | >400 | Impermeable |
Figure 7.7 Location of three main aquifers in the Konkola Mine, section looking north
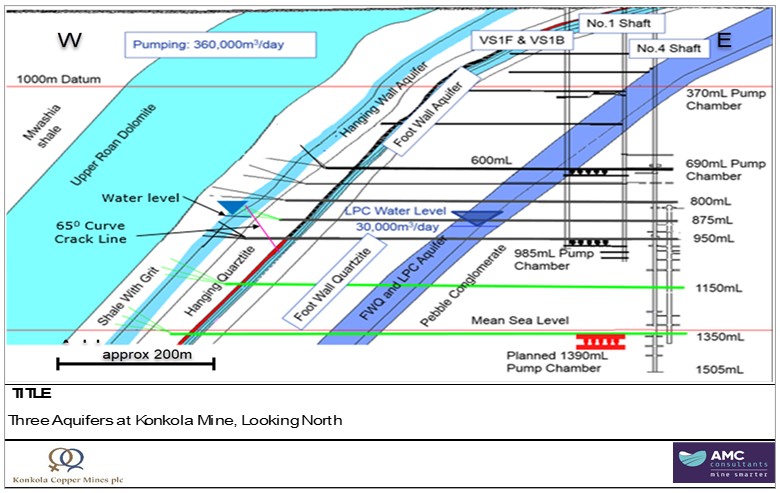
Source: KCM, 2026.
| 7.9.2 | Nchanga |
Nchanga COP E Ext and COP DF are early-stage projects geotechnical conditions will be assessed as part of the project development.
Recent drilling incorporates the collection of geotechnical logging for all drillholes. Laboratory test work and analysis will be undertaken as part of future prefeasibility-level studies.
| amcconsultants.com | 88 |
| S-K 1300 TRS: KCM Integrated Operations (Initial Assessment) | |
| Konkola Copper Mines Plc | 0424076 |
| 8 | Sample preparation, analyses, and security |
Sample preparation and analysis procedures at KCM follow industry-standard protocols. QAQC protocols include the use of certified reference materials (CRMs), blanks, and duplicate samples.
| 8.1 | Hard rock samples |
| 8.1.1 | Sample preparation and analysis |
Sample preparation and analysis for:
| · | Konkola is undertaken at the KCM laboratory at Konkola (Konkola analytical laboratory). |
| · | Nchanga is undertaken at the KCM laboratory at Nchanga (Nchanga analytical laboratory). |
Sample preparation methods, analytical methods and laboratory quality control is the same at both laboratories and is applied uniformly across all assets.
Future drilling analysis is planned to be analyzed by in internationally recognised external laboratory.
| 8.1.2 | Sample preparation method |
Sample preparation method entailed:
| · | Drying the received samples at a temperature of 110° Celsius plus or minus 5 degrees (110+/-5°C) for a period up to 4 hours. |
| · | Primary particle size reduction by crushing the samples from 150 mm to 12.7 mm. |
| · | Secondary particle size reduction by crushing the entire primary crusher product of 12.7 mm or less to than 4 mm. |
| · | Repeated riffling of the secondary crusher product until a final portion measuring about 250 g to 300 g is obtained. |
| · | The final riffle product is then pulverised to pulp of 90 percent passing 75 micron sieve (200 mesh), packed into envelops as laboratory samples, and finally submitted to main laboratory for analysis. |
| · | Coarse rejects and pulps are reclaimed where the coarse rejects are stored until it is confirmed they are not required to metallurgical test work. The pulp rejects are retained. |
| 8.1.3 | Analytical method |
The analytical method for each sample is a partial digestion via nitric and sulfuric acid for soluble copper, and complete digestion for total copper and total cobalt, with an Atomic Absorption Spectrometry (AAS) finish.
If total copper is greater than 10% Cu, the sample(s) are re-analyzed by using the electro-gravimetric method.
| 8.1.4 | Bulk density measurement |
Bulk density measurements are done at KCM site mineralogy laboratory using the Archimedes method.
Samples are selected from the hangingwall and footwall formations and mineralised material. For mineralised material the sample is selected from HQ or a larger size drillhole. The core samples are cut using core cutting machine. One half of the sample is sent to the analytical laboratory for assaying, the other half is sent to the mineralogy laboratory for bulk density measurement. The samples used in the bulk density measurement range from 50 to 70 mm. Cracked and poor-quality samples are excluded.
The samples are cleaned, dried at 105°C for 12 hours, cooled, weighted in air, dipped in wax, which is allowed to set, weighed in air, then immersed in water and weighted.
| amcconsultants.com | 89 |
| S-K 1300 TRS: KCM Integrated Operations (Initial Assessment) | |
| Konkola Copper Mines Plc | 0424076 |
Bulk density is calculated using the following equation:
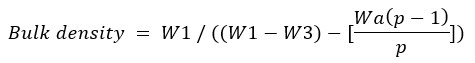
Where:
W1=weight of sample in air
Wa=weight of wax in air, that is =W2-W1
W2=weight of sample with wax in air
W3=weight of total sample in water after waxing
p=density of wax used
1=density of water
| 8.2 | Tailings samples |
| 8.2.1 | TD03 and TD04 |
| 8.2.1.1 | Sample preparation and analysis |
One and a half metre samples were riffle split using a Jones riffle splitter to 1/8th portion weighted and adjacent samples composited to a 3 m sample length downhole. Rock/soil samples were not included in the composite.
Samples were submitted to AHK for preparation and analysed for total copper and total cobalt and acid soluble copper, where the total copper is greater than 0.5% TCu.
| 8.2.1.2 | Sample preparation method |
Sample preparation method entailed:
| ● | Drying the samples at 105(+/-5°)C °C for a period ranging from four hours to more than 24 hours, due to the significant moisture content. |
| ● | Sample is split to <1 kg. |
| ● | Pulverize to 85% passing 75 micron sieve (200 mesh). |
| ● | Splitting of wither a 50 g or 40 g aliquot for analysis. |
| ● | Storage of rejects. |
| 8.2.1.3 | Analytical method |
The analytical method for:
| ● | A 40 g sample for TCu% and TCo% is a 4-acid digest (DIG42S), with and AAS finish. |
| ● | A 50 g sample ASCu% and ASCo% is sulfuric acid leach (DIG72C), with an AAS finish |
| 8.2.1.4 | Bulk density measurement |
Small trenches about 0.5 m deep were dug to collect samples for bulk density determination. Bulk density values were obtained from column settling tests range from 1.1 t/m3 to 1.3 t/m3.
These values align with bulk density for surficial samples and are not representative of aged/compacted tailings.
An historic dry bulk density value of 1.55 t/m3 was used for tonnage derivation.
| amcconsultants.com | 90 |
| S-K 1300 TRS: KCM Integrated Operations (Initial Assessment) | |
| Konkola Copper Mines Plc | 0424076 |
| 8.2.2 | TD05 |
| 8.2.2.1 | Sample preparation and analysis |
Sample preparation and analysis for TD05 tailings samples is undertaken at Société Générale de Surveillance SA (SGS), Kalulushi, Zambia.
SGS Kalulushi is an ISO/IEC 17025:2017 accredited laboratory for copper and base metals analysis through to 1 April 2028. It was accredited by the Southern African Development Community Accreditation Service (SADCAS) in December 2024.
| 8.2.2.2 | Sample preparation method |
Core samples were split longitudinally and sampled at intervals of approximately 1 m, depending on the drill run length and recovery.
Sample preparation method entailed:
| · | Drying the samples at 105(+/-5°)C °C for a period ranging from four hours to more than 24 hours, due to the significant moisture content. |
| · | Sample is split to <1 kg. |
| · | Pulverize to 85% passing 75 micron sieve (200 mesh). |
| · | Splitting of wither a 50 g or 40 g aliquot for analysis. |
| · | Storage of rejects. |
| 8.2.2.3 | Analytical method |
The analytical method for:
| · | A 40 g sample for TCu% and TCo% is a 4-acid digest (DIG42S), with and AAS finish. |
| · | A 50 g sample ASCu% and ASCo% is sulfuric acid leach (DIG72C), with an AAS finish |
| 8.2.2.4 | Bulk density measurement |
Bulk density measurements reported in the AHK 2025 metallurgical test report work did not document a method description. The masses of the three samples were all 100 g. This indicates that a settling column/sedimentation test was used to measure wet bulk density. This method is representative of early or beached wet bulk density.
The three wet bulk density results reported are 1.33, 1.56, and 1.57 t/m3 respectively. For an arithmetic mean of 1.49 t/m3.
In addition, samples were collected for bulk density measurement from 1 m deep shallow drillholes. Allowing for the measurement of the in situ volume and the wet and dry sample weights.
A total of 29 diamond holes were drilled and measured for moisture, with a wet and dry density calculated using the volumetric method at the Nchanga laboratory. The arithmetic mean of the dry bulk density is 1.16 t/m3. The distribution of dry bulk density values is shown in Figure 8.1.
| amcconsultants.com | 91 |
| S-K 1300 TRS: KCM Integrated Operations (Initial Assessment) | |
| Konkola Copper Mines Plc | 0424076 |
Figure 8.1 Dry bulk density TD05
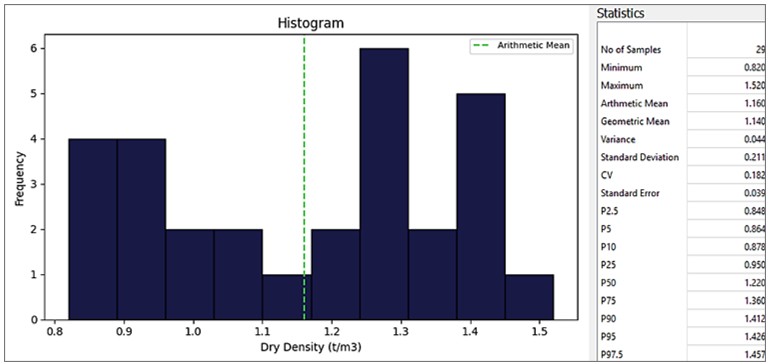
Source: ABGM 2026
The average bulk density from the shallow holes is representative of loose, slime dominant or upstream ponded tailings but not typical of beach material (moderately drained 1.5 to 1.7 t/m3) or aged/compacted tailings (1.7 to 1.9 t/m3).
The arithmetic mean derived from the 29 shallow samples is likely conservative. TD05 will require the application of a variable dry bulk density as it is still being built and wet in significant areas. The full profile of the tailings dam both laterally and at depth is not represented in the data. Application of higher value dry bulk density is not appropriate until further data has been collected.
The water content calculated from the shallow bulk density samples is illustrated in Figure 8.4. This is not expected to be representative of the entire tailings dam.
Figure 8.2 Water content calculated from the bulk density samples TD05
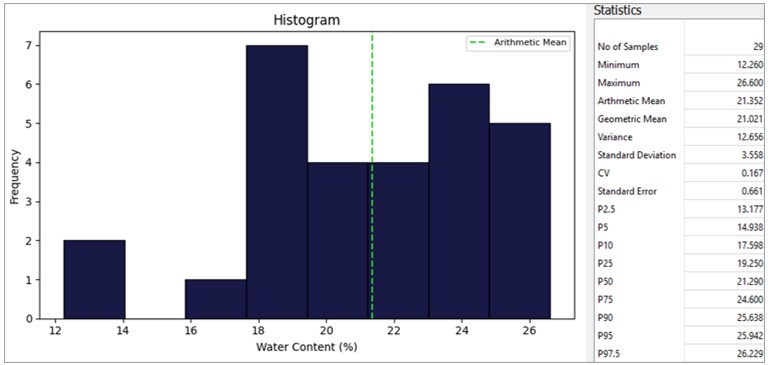
Source: ABGM 2026
| amcconsultants.com | 92 |
| S-K 1300 TRS: KCM Integrated Operations (Initial Assessment) | |
| Konkola Copper Mines Plc | 0424076 |
| 8.3 | Quality assurance quality control program |
QAQC is undertaken on TCu% and ASCu% analysis and is done via the submission of repeat samples and the submission of CRM’s and blanks.
Repeats consist of fine rejects of samples within potentially economic mineralisation grade ranges. Samples for which laboratory assay results have been received, are repacked and assigned different sample numbers then resubmitted to the laboratory for re assay. The assay results of these samples are then compared to the original assays. Samples are submitted at a 1 in 10 ratio.
If the original and repeat assay differ by less than 10% precision is regarded acceptable, and the original assay results are cleared for use in resource estimation.
CRMs are inserted after every tenth sample in all the drillholes within the mineralisation. The analytical results of the CRMs are then plotted against the original CRMs grades. A +/- 2SD error difference from the CRM grade is considered an acceptable range, especially when dealing with relatively high-grade, i.e. grades above 2% TCu. With grade lower than TCu 2%, a +/- 3SD error difference is considered acceptable.
Additional quality controls include:
| · | Blind checks: For every 10 samples, one sample is randomly picked and inserted as a blind check by the sample preparers to measure reproducibility of the analysis. |
| · | Independent checks: Periodic insertion of previously analysed samples as independent checks to measure reproducibility between analysis. |
| · | The use of internal laboratory CRMs within each batch. |
| 8.4 | Sample security |
Sample security is achieved by the monitored sample-tracking approach using both excel and hard copy records which indicates sample position at each stage from receipt to disposal. This also involves capturing of all details of both the team member submitting the samples and every analytical staff member handling the samples.
Before disposal, the analyzed batches are stored for retention, in a restricted-access sample storage room, to allow for any queries from the KCM department submitting the samples. Actual disposal is done by the KCM sample owner. This is to ensure accountability for samples falls with the sample owner.
Reference core and plastic sleeved tailings samples, are stored in core trays in a secure core yard, Figure 8.3
| amcconsultants.com | 93 |
| S-K 1300 TRS: KCM Integrated Operations (Initial Assessment) | |
| Konkola Copper Mines Plc | 0424076 |
Figure 8.3 Reference core and tailings sample storage in secure core yard
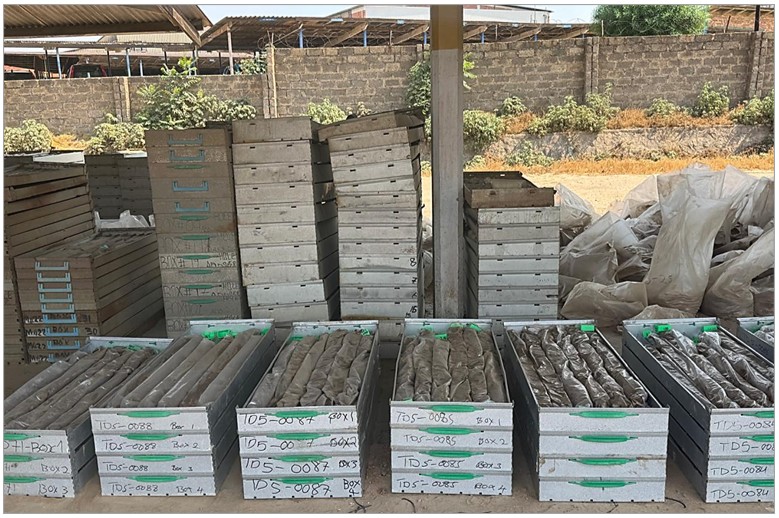
Source: AGBM 2026
| 8.5 | Quality assurance quality control – Konkola |
| 8.5.1 | Konkola |
During the audit of the 2020 Mineral Resource, KCM provided the auditor with a cumulative database of the all the QAQC work undertaken at Konkola mine. In order to ascertain the quality of the post 2016 data, the auditor segmented the data to conduct separate analyses for the old and new data.
For the post 2016 data the following observations have been made:
| · | The repeats showed 54% of TCu samples and 23% of the of ASCu being within 10% deviation. This observation was deemed to be far short of the expectations for the assays to be included in the Mineral Resource work. |
| · | The analysis of CRMs STD_A (3.44% TCu) and STD_C (2.48% TCu) showed consistently lower than expected results. This is a concern and might indicate high-grade copper assays may be underestimated, that is a negative bias. |
QAQC assessment undertaken in 2024, discussed below, incorporates the post 2016 drilling. The exercise covered analysis of the CRM for accuracy, repeats for precision and blanks for contamination.
| 8.5.1.1 | CRM |
For CRMs specific tasks include:
| · | QAQC records validation: To ensure all results are recorded in the database and the QC results on all the drillhole assay certificates for holes drilled after 2016 were examined. |
| · | CRM validation: Konkola Mine utilises a range of CRMs sourced from Geostats Pty Ltd to monitor the accuracy of the laboratory. Each CRM has a unique product ID associated with specific grade values and standard deviations. |
| amcconsultants.com | 94 |
| S-K 1300 TRS: KCM Integrated Operations (Initial Assessment) | |
| Konkola Copper Mines Plc | 0424076 |
To guarantee reliable performance analysis, the CRM results database was meticulously checked to verify that all CRM laboratory results were correctly linked to their corresponding certified values. It was discovered that the certified values for 16 analyses of GBM911-16 were initially assigned incorrectly in the database. After the corrections, 12 out of the 16 results have passed. With the remaining four values being outside +/-2SD.
Table 8.1 shows a list of the corrected CRM values in comparison to the incorrect entry.
Table 8.1 List of corrected outcomes for 16 GBM911-16 CRMs
| Original | Corrected | |||||||||||||
| BHID | Sample ID | CRM | Laboratory (TCu%) |
Certified (TCu%) |
Status | Certified CRM |
Status | |||||||
| BV1611 | MX9864 | GBM911-16 | 2.52 | 3.44 | Fail | 2.48 | Pass | |||||||
| BV1612 | MY33 | GBM911-16 | 2.42 | 3.44 | Fail | 2.48 | Pass | |||||||
| BV1614 | MX9864 | GBM911-16 | 2.40 | 3.44 | Fail | 2.48 | Pass | |||||||
| BV1615 | MY112 | GBM911-16 | 2.55 | 3.44 | Fail | 2.48 | Pass | |||||||
| BV1616 | MY318 | GBM911-16 | 2.32 | 3.44 | Fail | 2.48 | Pass | |||||||
| BV1619 | MY380 | GBM911-16 | 2.60 | 3.44 | Fail | 2.48 | Pass | |||||||
| BV1623 | MY433 | GBM911-16 | 2.57 | 3.44 | Fail | 2.48 | Pass | |||||||
| BV1631 | MY1077 | GBM911-16 | 2.24 | 3.44 | Fail | 2.48 | Fail | |||||||
| BV1631 | MY1093 | GBM911-16 | 2.35 | 3.44 | Fail | 2.48 | Pass | |||||||
| BV1633 | MY1199 | GBM911-16 | 2.92 | 3.44 | Fail | 2.48 | Fail | |||||||
| BV1635 | MY1242 | GBM911-16 | 2.33 | 3.44 | Fail | 2.48 | Pass | |||||||
| BV1635 | MY1257 | GBM911-16 | 2.60 | 3.44 | Fail | 2.48 | Pass | |||||||
| BV1636 | MY1311 | GBM911-16 | 2.52 | 3.44 | Fail | 2.48 | Pass | |||||||
| BV1637 | MY1363 | GBM911-16 | 2.59 | 3.44 | Fail | 2.48 | Pass | |||||||
| BV1637 | MY1389 | GBM911-16 | 2.75 | 3.44 | Fail | 2.48 | Fail | |||||||
| BV1638 | MY1400 | GBM911-16 | 2.74 | 3.44 | Fail | 2.48 | Fail | |||||||
Note: +/- 1 SD is between 2.39 to 2.56% TCu, +/- 2 SD is between 2.30 to 2.65% TCu.
Source: KCM 2026.
The rectified drillholes that passed the QAQC test were then plotted together with the failed drillholes and those without CRMs as shown in Figure 8.1. Also included are holes drilled up to November 2023.
| amcconsultants.com | 95 |
| S-K 1300 TRS: KCM Integrated Operations (Initial Assessment) | |
| Konkola Copper Mines Plc | 0424076 |
Figure 8.4 Location plan of holes drilled from 2016 to 2023 - Konkola
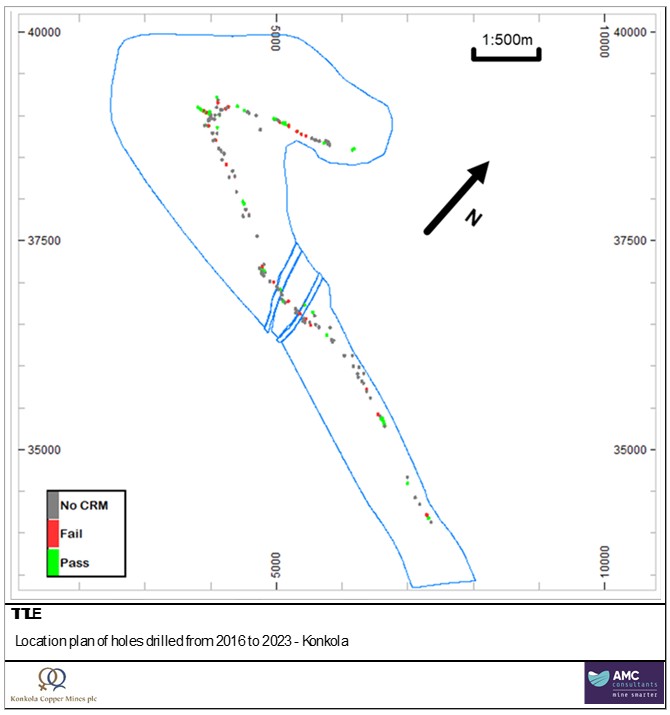
Source: AMC, 2026.
The analysis conducted on the entire database showed that majority of the CRM results from the laboratory were within the acceptable range of +/-2 standard deviations (SD) of the CRM mean as shown in Figure 8.2. However, Standard A showed a number of CRM values outside the 2SD. Another observation was that the majority of the laboratory results outside 2SD plotted below the mean value indicating a conservative negative bias. Figure 8.2 shows the results for standards A, B, C, and D from the analytical laboratory. Results for standard E, F, and G are presented as Figure 8.3.
| amcconsultants.com | 96 |
| S-K 1300 TRS: KCM Integrated Operations (Initial Assessment) | |
| Konkola Copper Mines Plc | 0424076 |
Figure 8.5 Shewhart plots for CRMs A, B, C, and D - Konkola
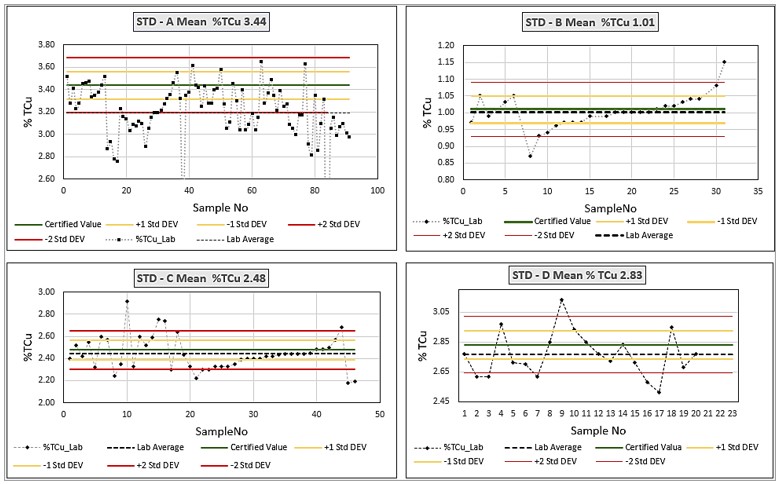
Source: AMC, 2026.
Figure 8.6 Shewhart plots for CRMs E, F, and G - Konkola
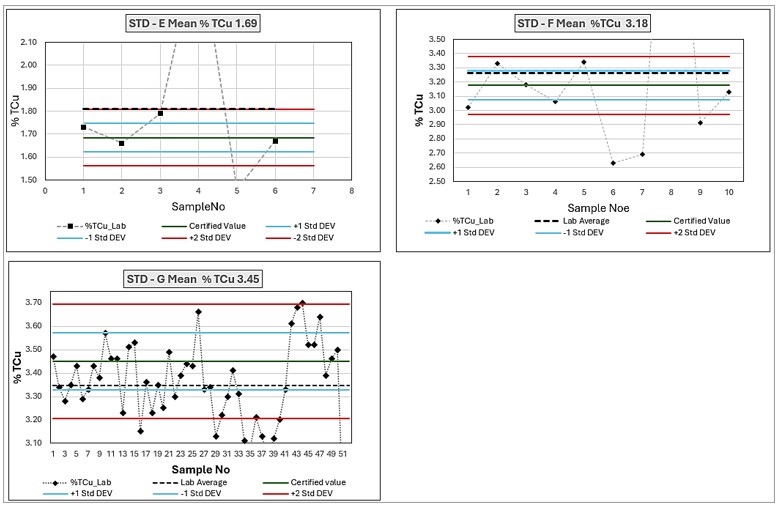
Source: AMC, 2026.
| amcconsultants.com | 97 |
| S-K 1300 TRS: KCM Integrated Operations (Initial Assessment) | |
| Konkola Copper Mines Plc | 0424076 |
| 8.5.1.2 | Repeats |
Repeat samples at Konkola mine are utilised to evaluate the laboratories precision. Samples submitted for re-assaying have been selected randomly without regard to the mineralisation or grade of the original sample. Therefore, the duplicate dataset comprises samples that are below the cut-off and outside the areas of mineralisation. The sample statistics indicate the below cut-off assay values account for 35% of the entire dataset.
The repeatability analysis has shown that precision is very poor in the dataset with grades below cut-off. This is due to laboratory precision decreasing significantly for values proximal to the detection limit. Samples with values below cut-off are not regarded for most of downstream processes and have minimal impact on geostatistical modelling and grade estimation.
Therefore, the inclusion of original sample assay values that are significantly below cut-off grade impact the overall outlook of the level of precision of the data. Based on this observation, only samples with TCu% grades above cut-off of 1.5% were considered for precision analysis.
The relative paired difference (RPD) plot method was used to assess the precision for both unfiltered (no cut-off) and filtered (above cut-off) dataset.
The RPD plots for TCu% show that approximately 55% of the unfiltered sample results are within 10% of the half relative difference whereas the filtered (above cut-off) dataset showed that approximately 76% of repeats fall within 10% of the half relative difference as shown in Figure 8.4. At 1.5% TCu cut-off 75% of data passing 10% RPD is lower than ideal for an operating mine, 85 to 90% of the data at 10% RPD would be a good result.
Figure 8.7 RPD plot TCu repeat samples no cut-off and at 1.5% TCu- Konkola - post 2016 data
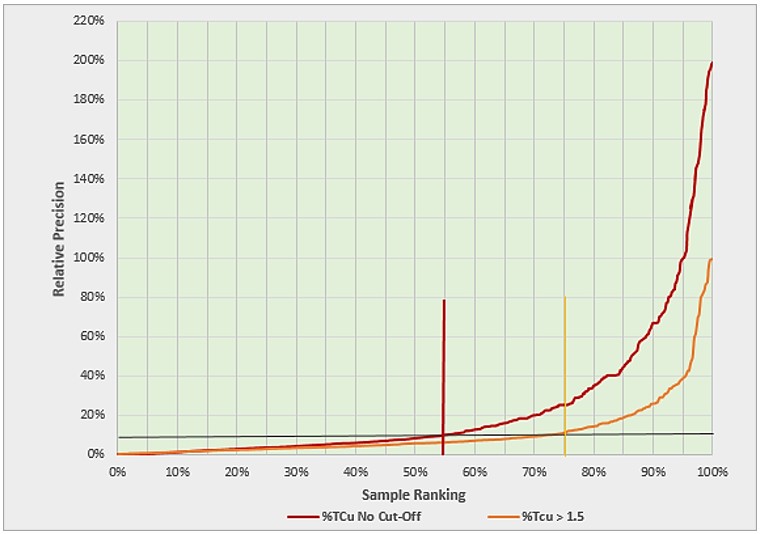
Source: AMC, 2026.
| amcconsultants.com | 98 |
| S-K 1300 TRS: KCM Integrated Operations (Initial Assessment) | |
| Konkola Copper Mines Plc | 0424076 |
| 8.5.1.3 | Blanks |
Blanks are comprised of local material. Analysis shows that blank sample analytical results are generally below the 0.5% TCu threshold which is used to define blank material. The variations observed are the result of using locally sourced non-mineralised material such as FWQ, AGSST, and PC. Figure 8.5 shows the blank sample plot, with the 0.5% TCu threshold line. Where four results are in excess of 0.5% TCu.
The majority of the analyses of the blank samples indicate that there is no to little likelihood of contamination of the mineralised samples having occurred during sample preparation. It is not clear whether the assay results greater than 0.15% TCu were due to contamination or low-grade mineralisation within the blank sample itself but the number of these anomalous samples is small.
Figure 8.8 Blank samples plot showing 0.5% TCu upper limit
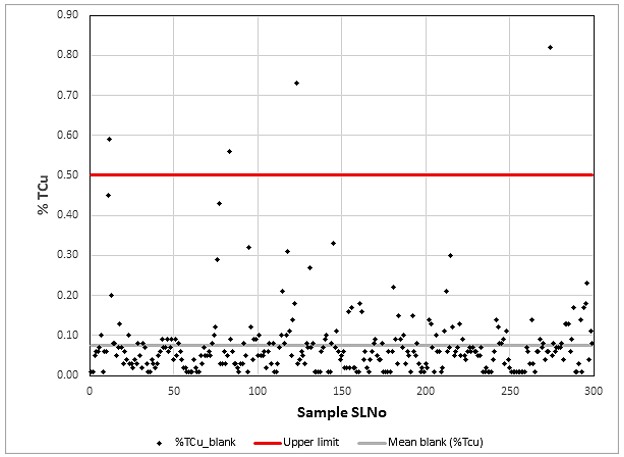
Source: AMC, 2026.
| 8.6 | Quality assurance quality control - Nchanga |
QAQC for the various Nchanga deposits is incomplete. The older generation of drillholes date back 50 years and the analytical data was not subject to modern QAQC. Much of the older generation of drilling is in areas where mining is complete. There is no or very limited QAQC data for:
| · | Nchanga Open Pit (NOP) |
| · | Chingola Open Pit D and F (COP DF) |
| · | Tailings dams TD03 and TD04 |
There is modern QAQC data for recent drilling for:
| · | Chingola Open Pit C and E Extension (COP E Ext) |
| · | Stockpile 16 |
| · | TD05 |
| amcconsultants.com | 99 |
| S-K 1300 TRS: KCM Integrated Operations (Initial Assessment) | |
| Konkola Copper Mines Plc | 0424076 |
| 8.6.1 | Chingola Open Pit C and E Extension (COP E Ext) |
For the Chingola Open Pit C and E Extension (COP E Ext) QAQC is available for the 2011 to 2013 drillholes only. QAQC includes:
| · | CRM insertion at a rate of 1:10. |
| · | Submission of selected pulp samples to the independent umpire laboratories Alfred H Knight (AHK), Kitwe, Zambia and SGS. |
No blanks were submitted.
| 8.6.1.1 | CRM |
Eleven CRMs were submitted for analysis. The number
of submissions for each CRM is shown in
Table 8.2.
Shewhart plots for each CRM standardised to zero were generated. The following observations were made:
| · | CRM 0.75% TCu - most of the analyses fall within the 2SD but there are more samples with a negative difference outside the 2SD plots than there are positive difference, this might indicate bias. The plot does not include 8 or 6% of the samples which have more than 20% deviation. |
| · | CRM 1.08% TCu – except for 3 or 7% of the samples with deviations above 20%, the analyses show reasonable precision. |
| · | CRM 1.47% TCu - has two significant outliers but generally show relatively reasonable precision. |
| · | CRM 1.54% TCu and 1.68% TCu shows the difference between the reported values and the CRM plotting within the 2SD with both positive and negative difference, on average the precision is reasonable. |
| · | CRM 2.14% TCu - one sample is significantly outside 2SD has more positive difference on average. This could be an indication of a slight bias in the data, generally the deviations are very small and contained within 1SD. |
| · | CRM 2.19% TCu, 2.62% TCu, 2.94% TCu, and 3.18% TCu - there are more positive deviations than they are negative ones, indications of possible bias in the sample analyses in those ranges, but the deviations are very small and contained within 1SD. |
| · | CRM 3.44% TCu – all the samples show positive deviations, but the deviations are very small and are contained within 1SD. |
Table 8.2 CRM sample submission – COP CE Ext
| CRM value (TCu%) | Number of samples submitted | |
| 0.75 | 134 | |
| 1.08 | 41 | |
| 1.47 | 48 | |
| 1.54 | 57 | |
| 1.65 | 11 | |
| 2.14 | 45 | |
| 2.19 | 4 | |
| 2.62 | 48 | |
| 2.94 | 67 | |
| 3.18 | 77 | |
| 3.44 | 11 |
Source: KCM 2026.
| amcconsultants.com | 100 |
| S-K 1300 TRS: KCM Integrated Operations (Initial Assessment) | |
| Konkola Copper Mines Plc | 0424076 |
| 8.6.1.2 | Repeats |
HARD plots, Figure 8.6 and Figure 8.7, were used to assess the precision of repeat sample analysis of the combined independent laboratories AHK and SGS.
Samples below 1% TCu have a poor HARD with approximately 28% of samples achieving a HARD of 10%. For TCu repeats these values should be in excess of 90%. This indicates the poor repeatability. There is no indication as to whether the analysis of the results omits samples within 15 times the detection limit which is accepted practice to remove variability introduced from the increase in error as approaching the detection limit.
For samples between 0.5% and 3.0% TCu the approximately 90% of samples achieves a HARD of 10%, this is considered reasonable reproducibility.
Figure 8.9 HARD plot for repeat samples below 1.0% TCu
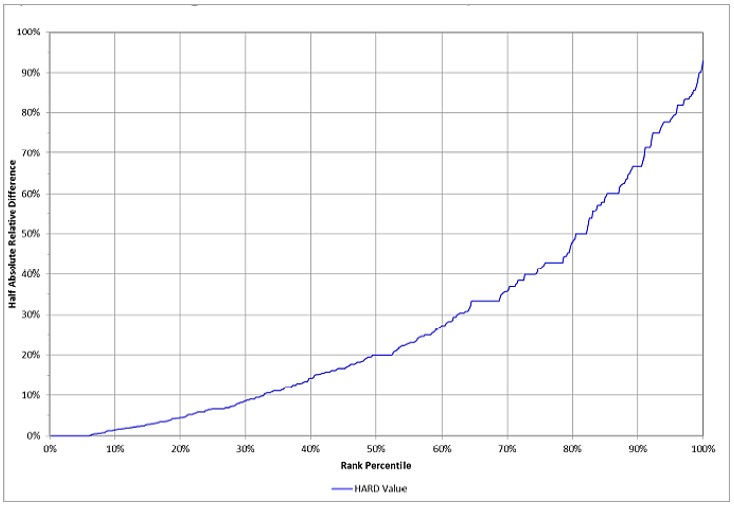
Source: KCM, 2026.
| amcconsultants.com | 101 |
| S-K 1300 TRS: KCM Integrated Operations (Initial Assessment) | |
| Konkola Copper Mines Plc | 0424076 |
Figure 8.10 HARD plot for repeat samples between 0.5% TCu and 3.0% TCu
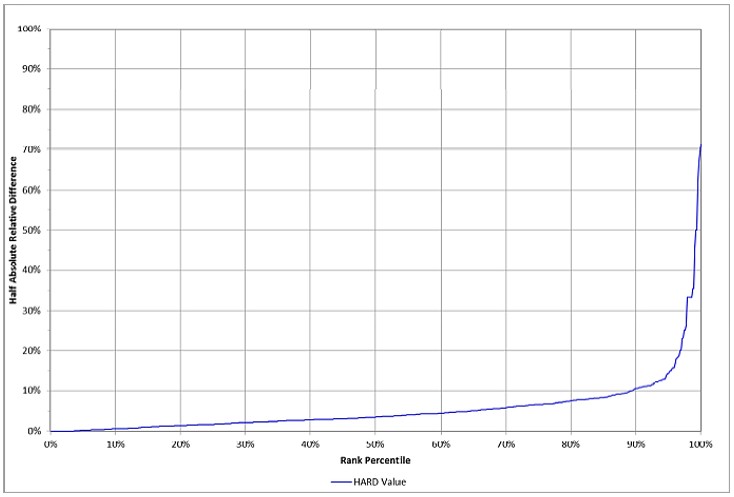
Source: KCM, 2026.
| 8.6.2 | TD03 and TD04 |
There is no available record or QAQC undertaken during the September 2000 drilling at TD03 and TD04.
| 8.6.3 | TD05 |
There are 6,040 sample intervals for TD05. Laboratory repeats, CRMs and blanks were submitted as part of the sample stream. No coarse repeats of inter laboratory duplicates were submitted as part of the QAQC program.
Table 8.3 QAQC sample submission rate TCu% - TD05
| Precision | Accuracy | |||||||
| Total samples | Laboratory repeats (pulp) |
CRM | Coarse Blanks | |||||
| Number of samples | 6,040 | 232 | 316 | 205 | ||||
| Proposed | - | 1:30 | 1:20 | 1:30 | ||||
| Actual | - | 1:26 | 1:19 | 1:29 | ||||
Source: AMC, 2026.
| 8.6.3.1 | CRM |
Six CRMs were supplied by Geostats (Pty) Ltd, and submitted as blind CMRs to the laboratory. The CRMs were certified for TCu% and not ASCu%, TCo% or ASCo%. The CRM material is not matrix matched, meaning the composition of the source material is different to the regional Copperbelt mineralisation.
| amcconsultants.com | 102 |
| S-K 1300 TRS: KCM Integrated Operations (Initial Assessment) | |
| Konkola Copper Mines Plc | 0424076 |
Table 8.4 CRM source - TD05
| CRM label | Material description# | Accepted Value TCu % | 2x Standard Deviations (%) | |||
| GBM324-9 | Composite Eastern Goldfields ore | 0.4303 | 0.0464 | |||
| GBM998-4 | Copper / gold ore oxide ex Pilbara | 0.7529 | 0.0622 | |||
| GBM907-14 | Low grade copper / zinc sulfide ore | 0.8126 | 0.0756 | |||
| GBM910-16 | Copper ore sulfide | 1.0069 | 0.0736 | |||
| GBM907-13 | Low grade copper / zinc sulfide ore | 1.6853 | 0.1228 | |||
| GBM911-16 | Copper / gold sulfide ore | 2.4774 | 0.1742 |
Note: # CRM material description is as per the CRM certificate.
Source: ABGM, 2026.
The sequence of CRM use is shown in Figure 8.11. Figure 8.12 shows all CRM results in the Shewhart plot.
Figure 8.11 Sequence of CRM submission – TD05
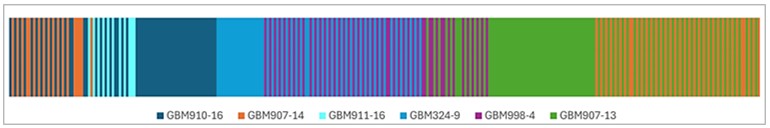
Source: ABGM, 2026.
Figure 8.12 Shewhart plot for % TCu for all CRMs – TD05
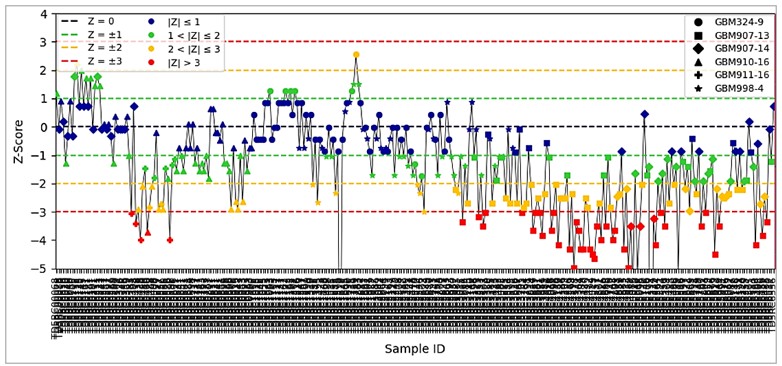
Source: ABGM, 2026.
Most CRMs exhibited a small negative bias. The two high-grade CRM samples GBM907-13 and GBM911-16 having a strong negative bias with multiple CRM’s falling outside 3SD. Additionally GBM907-14 at 0.81% TCu performs poorly with a negative bias and results outside 3SD. The source material for both GBM907-14 and GBM907-13 are listed as ‘low grade copper / zinc sulfide ore’, which might be sufficiently different to Copperbelt mineralisation to mean they are not suitable for use as a CRM.
The laboratory was informed and the negative bias and failing standards.
| amcconsultants.com | 103 |
| S-K 1300 TRS: KCM Integrated Operations (Initial Assessment) | |
| Konkola Copper Mines Plc | 0424076 |
This was investigated on a batch-by-batch basis.
The laboratory CRMs were assessed, they performed strongly as did the repeats. Despite the apparent negative bias, the cumulative sum of deviation from the mean of assays mostly suggested good internal stability of the analytical equipment, i.e. the absence of significant relative drift.
A comparison of Figure 8.11 to Figure 8.12 shows the alignment of the failing CRMs with the use of the high-grade standards, particularly towards the end of the drilling program. Three batches that had underreporting for GBM907-13 toward the end of the program were re-assayed.
They returned good results see Figure 8.13.
Figure 8.13 Shewhart plot for 1.68% TCu CRM – TD05
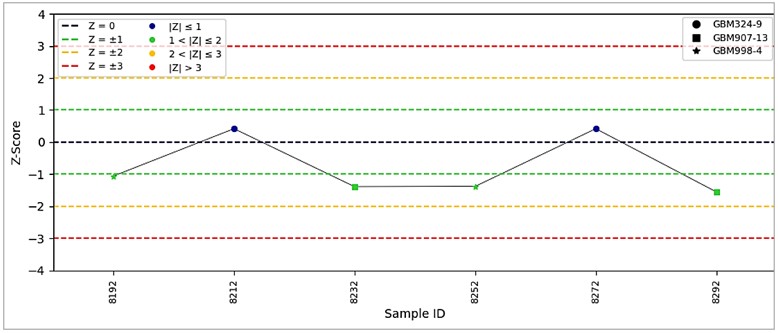
Source: ABGM, 2026.
The decision was made that as the overall sample pool being analysed is lower grade tailings material which performed well and that the low-grade bias is dominantly in the CRMs values well above the tailings grades that these results would be accepted.
Noting two of the three poorly performing CRMs have a source matrix stated as ‘low grade copper / zinc sulfide ore’, so might not be suitable for inclusion as a CRM for comparison to Copperbelt mineralisation.
The submission of the higher-grade CRMs would generally not have occurred with tailings material as they are well outside the expected grade range of the tailings. Additionally in both instances, the initial program and re-assay program, the laboratory knew what type and grade of material to expect. Hence it has been postulated as a possible laboratory calibration issue.
As the CRMs were not certified for ASCu% no assessment of their performance against the CRMs was performed.
| 8.6.3.2 | Blanks |
KCM submitted coarse footwall quartzite material from the Konkola mine as blank QC samples.
Five time the detection limit of 0.01% TCu, that is 0.05% TCu, is used as the minimum warning threshold and ten times the detection limit is used as the failure threshold.
A large number of samples reported TCu values on the warning threshold but since the source of the blank samples are locally source is barren waste material this is not unexpected. Comparing each blank sample result with its preceding sample result to inspect for carry over contamination shows no indication of the previous sample being of high-grade and thus carry over contamination in the blank.
| amcconsultants.com | 104 |
| S-K 1300 TRS: KCM Integrated Operations (Initial Assessment) | |
| Konkola Copper Mines Plc | 0424076 |
Figure 8.14 Blank samples plot showing 0.1% TCu upper limit
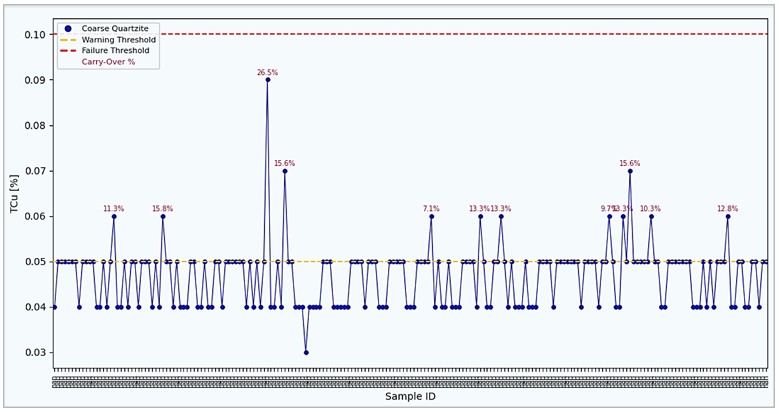
Source: ABGM 2026
| amcconsultants.com | 105 |
| S-K 1300 TRS: KCM Integrated Operations (Initial Assessment) | |
| Konkola Copper Mines Plc | 0424076 |
Figure 8.15 Comparison of TCu% in blank sample and TCu% of preceding sample
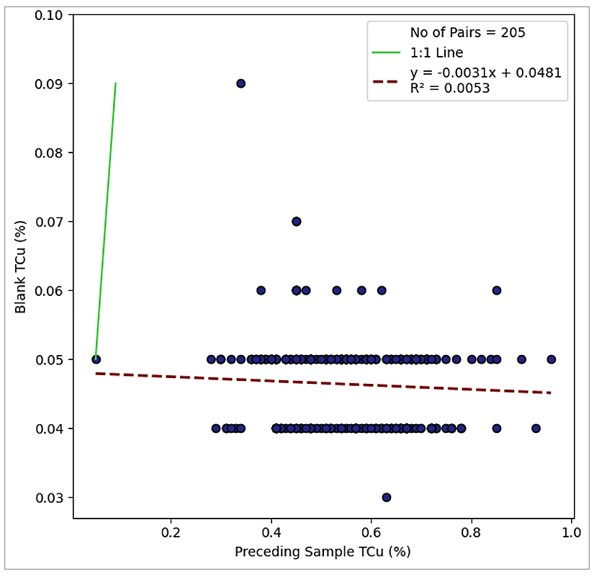
Source: ABGM, 2026.
| 8.6.3.3 | Repeats |
Approximately 1:25 samples were selected for pulp repeat analysis. This repeat was part of the routine samples’ submission. Testing for accuracy of the analytical measurement. Figure 8.16 and Figure 8.17 show the results of the pulp repeat analysis for TCu% and ASCu% respectively.
The repeats demonstrate good results for both TCu% and ASCu%.
| amcconsultants.com | 106 |
| S-K 1300 TRS: KCM Integrated Operations (Initial Assessment) | |
| Konkola Copper Mines Plc | 0424076 |
Figure 8.16 Pulp repeat precision analysis TCu% – TD05
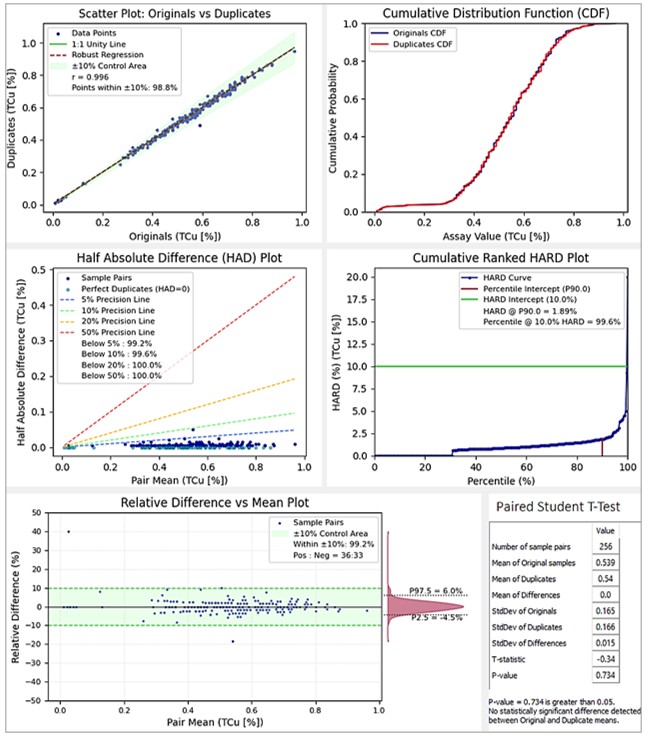
Source: ABGM, 2026.
| amcconsultants.com | 107 |
| S-K 1300 TRS: KCM Integrated Operations (Initial Assessment) | |
| Konkola Copper Mines Plc | 0424076 |
Figure 8.17 Pulp repeat precision analysis ASCu% – TD05
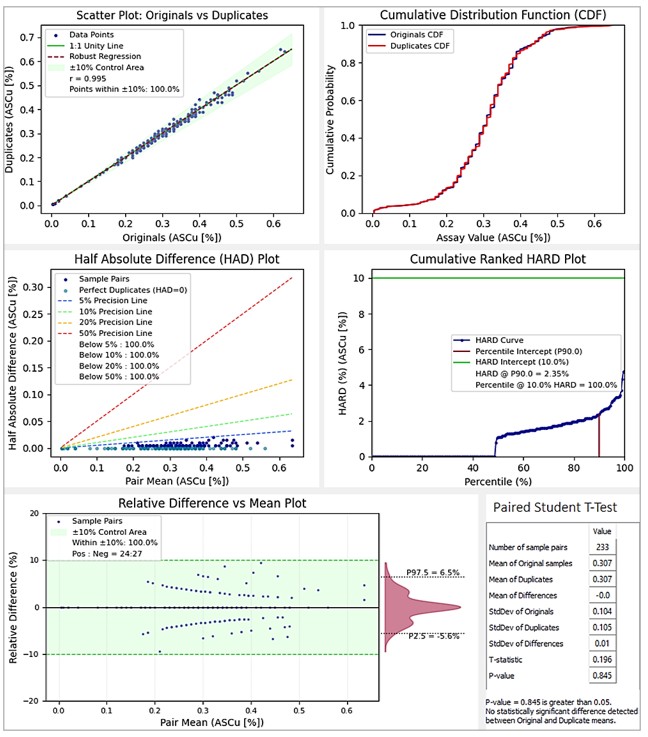
Source: ABGM, 2026.
| 8.6.4 | QAQC conclusion |
In drilling completed since the 2000’s some QAQC has been completed. Blanks have not always been submitted. The CRM results range from good, reasonable with slight negative bias, to poor. Similarly, the pulp repeats (same laboratory and second laboratory) results are mixed with both good and poor results.
| amcconsultants.com | 108 |
| S-K 1300 TRS: KCM Integrated Operations (Initial Assessment) | |
| Konkola Copper Mines Plc | 0424076 |
Results whether good or poor are consistent within each drilling program. This indicates the internal laboratory standards and potentially age of equipment is key to improved laboratory performance. Batch-by-batch analysis of the QAQC on receipt of the data will provide the laboratory with real-time performance feedback.
Recent analysis completed at external laboratory’s is a good quality.
| 8.7 | Qualified Person’s opinion |
| 8.7.1 | Historical data |
There is limited, if any, sample preparation or analytical QAQC data for the historical samples. The QP notes that there has been no twin hole drilling to confirm the accuracy of the historical data. However, historical and modern / recent drilling are intermingled geographically, and at no time have recent drillholes provided results outside the values or range indicated by historic drilling.
| 8.7.2 | Sample security |
The QP is of the opinion that sample security on receipt of samples by the site laboratory is acceptable, with samples located in a monitored environment and restricted access storage post sample preparation.
| 8.7.3 | QP's opinion on sample preparation, security and analytical procedures |
Modern and recent sample preparation, security, and analytical procedures applied are appropriate for the style of mineralisation and the analytes of interest (TCu, ASCu, TCo). The partial acid digestion for soluble copper and complete digestion for total copper with AAS finish is an industry-standard method for sediment-hosted copper deposits. The Archimedes method for bulk density measurement for hard rock samples is appropriate.
Tailings bulk density measurements require additional test work for compacted material. This might lead to an increase in dry bulk density for compacted tailings.
| 8.7.3.1 | Laboratory condition and umpire laboratory |
A site visit to the KCM analytical laboratory showed that the laboratory, due to age and use, requires physical maintenance and the replacement of old sample preparation and analytical equipment. Where there is doubt as to the condition of any of the site sample preparation and laboratory analytical equipment, an external third-party laboratory should be used.
Where there is a question about the performance of the QAQC for sample batches from the site laboratory, an umpire laboratory must be used. The QP recommends that external umpire laboratories (such as AHK or SGS) be used for independent verification of assay results on a routine basis, particularly for batches where internal QAQC results fall outside acceptable deviation limits.
The QP recommends that the internal laboratory be used for grade control and close spaced infill drilling samples only and that an external laboratory is used for all new exploration and resource infill drilling until the refurbishment of the site laboratory.
This layered approach provides additional confidence in the reliability of assay data used in the geological and resource models.
| amcconsultants.com | 109 |
| S-K 1300 TRS: KCM Integrated Operations (Initial Assessment) | |
| Konkola Copper Mines Plc | 0424076 |
| 8.7.3.2 | QAQC program |
It is the QP’s opinion that the current QAQC program is reasonable. However, the following modifications should be implemented:
| · | The inclusion and reporting of additional checks such as regular submission of coarse rejects, analytical duplicates in addition to repeats, sample sizing checks. |
| · | Focus repeat submission on potentially economic mineralisation. |
| · | Submission rates be fixed at between 1 in 10 and 1 in 20 depending on the QAQC sample type. |
| · | The use of an external or third-party laboratory for analytical repeats and coarse rejects should be undertaken quarterly. |
| · | Live batch-by-batch QAQC review for each data collection/drilling program ongoing during the life of the program. |
| 8.7.3.3 | Assessment of QAQC results |
The QP has reviewed the available QAQC data for each deposit. For deposits with modern QAQC programs, standards plotting outside ±2SD and repeat precision below target thresholds were noted, which compromises the demonstrated accuracy and precision of the assays to varying degrees. For several Nchanga deposits, QAQC data is absent or incomplete. However, the QP is of the opinion that although these deficiencies add a degree of uncertainty, they would not significantly affect the outcome of the grade estimation for the purposes of this IA. See Table 8.5 for the QP opinion of the QAQC results for each deposit.
Table 8.5 QP assessment of QAQC results by deposit
| Deposit | CRM Accuracy | Repeat Precision | Blank | QP Opinion | ||||
| Konkola | Moderate - negative bias at high grades (Std A) | Moderate result above 1.5% TCu cut-off. Sub economic poor performance | Acceptable | Adequate for IA. Negative CRM implies potential understatement rather than overstatement of grade. Repeat precision below ideal target. | ||||
| COP E Extension | Limited data reasonable results. Slight positive bias at lower grades. | Reasonable for samples between 0.5–3.0% TCu with 90% at HARD 10%. | Absent | Aequate for IA. CRM accuracy reasonable above 0.75% TCu. Repeat precision adequate for grades of interest (0.5–3.0% TCu) but poor for low grade. No blank data. QAQC absent for pre-2011 drillholes. Supports Inferred classification only. | ||||
| COP DF | Absent | Absent | Absent | Adequate for IA. Higher data uncertainty than deposits with modern QAQC. Absence does not preclude Inferred reporting given consistency between historical predictions and production outcomes at COP DF. Full modern QAQC required before DFS. | ||||
| TD03 / TD04 | Absent | Absent | Absent | Adequate for IA. No QAQC program. Uncertainty mitigated by the semi-homogeneous nature of tailings material and ongoing TLP production reconciliation providing independent grade validation. | ||||
| TD05 | Negative bias in high grade CRMs. | Good | Acceptable | Adequate for IA. High-grade CRMs used in the QAQC program are not representative of the material in the TD05 tailings dam. There is no impact on the Mineral Resoruce classification. |
Source: AMC, 2026.
| amcconsultants.com | 110 |
| S-K 1300 TRS: KCM Integrated Operations (Initial Assessment) | |
| Konkola Copper Mines Plc | 0424076 |
| 8.7.3.4 | Implication for Mineral Resource confidence |
The QP has considered the cumulative effect of the identified QAQC deficiencies on the reliability of the assay data used in the Mineral Resource estimates. The QP’s opinion is that the data is adequate for the purposes of this IA for the following reasons:
| · | The negative CRM bias observed at Konkola (the principal deposit) is conservative: it implies potential understatement of TCu grade at higher ranges rather than overstatement. This does not create a risk of resource overestimation. |
| · | Repeat precision, while below ideal, is within acceptable bounds when filtered for samples above the 1.5% TCu cut-off grade that is applied in the resource model. Below-cut-off samples, which dominate the poor precision statistics, have minimal influence on grade estimation for the declared resource. |
| · | The high-grade CRMs used in the QAQC program are not representative of the material in the TD05 tailings dam. There is no impact on the grade estimation or Mineral Resource classification. |
| · | The geographic intermingling of historical and modern drilling, with consistent grade ranges across both datasets, provides indirect validation of the historical data despite the absence of formal QAQC records for older samples. |
| · | Production reconciliation at Konkola, where the mine has operated continuously since 1957, provides over six decades of independent grade confirmation in mined areas. This operational validation carries significant weight in assessing the reliability of the underlying assay data. |
The QP is satisfied that the QAQC deficiencies, individually and in aggregate, add a degree of uncertainty to the assay database but do not materially compromise the reliability of the Mineral Resource estimates at the IA level of confidence.
| 8.8 | QAQC recommendations |
The QP recommends the following actions to improve assay data confidence.
Table 8.6 QAQC recommendations
| # | Recommendation | Priority / timing | ||
| 1 | Implement live batch-by-batch QAQC analysis with real-time performance feedback to KCM. CRM, blank, and pulp repeat results to be reviewed before each batch is accepted / finalised. | Immediate. Implement for all current and future drilling programs. | ||
| 2 | Failed batches to be re-assayed. Where continuing to fail, sent to an umpire laboratory for re-assay. | Implement within 3 months. Required for DFS data confidence. | ||
| 3 | Submit blanks for all drilling programs. Use certified blank material rather than locally sourced non-mineralised rock to eliminate ambiguity in blank results. | Immediate. Implement for all current and future drilling programs. | ||
| 4 | Establish routine umpire laboratory program with AHK or SGS for independent duplicate pulp and coarse reject assays on a minimum 1:25 basis. Duplicates should focus on economic grade ranges, with limited low-grade material | Implement within 3 months. Required for DFS data confidence. | ||
| 5 | Complete laboratory equipment upgrade program at KCM. Replace ageing sample preparation and analytical equipment identified during AMC site visit. Equipment condition directly correlates with precision performance. | Phased program; priority items before DFS drilling commences. | ||
| 6 | Include twin hole drilling in the KDMP resource definition program (Section 23) to provide independent confirmation of historical data accuracy in areas where pre-2016 drilling is the sole data source. | Include in DFS drill program design. | ||
| 7 | Investigate and characterise the negative CRM bias at Konkola (Standard A). Determine whether bias is systematic (method-related) or episodic (equipment/operator-related) and implement corrective measures to eliminate the bias source in future analytical work. | Before DFS resource estimation. Priority investigation. |
Source: AMC, 2026.
| amcconsultants.com | 111 |
| S-K 1300 TRS: KCM Integrated Operations (Initial Assessment) | |
| Konkola Copper Mines Plc | 0424076 |
| 9 | Data verification |
| 9.1 | Historic data |
The bulk of the data informing the current Mineral Resource estimates for most of the KCM assets is historical and was collected over a period spanning 50 years that the assets have been in operation.
Prior to the privatisation of the Zambian Copperbelt mines, all the data for the operations of all the mines on the Zambian Copperbelt was maintained centrally in a Borehole Master File database. On privatisation in the early 1990s, each of the new operators was able to extract from the repository the data pertaining to their operations.
The data verification undertaken for each of the KCM assets includes:
| · | Comparison of the modern database entries for the collar, assay and survey records against printouts from the Borehole Master File downloads. |
| · | Plotting plans and sections using data from the modern database and comparing the position of the drillhole and geology with the drillhole and geology position on the historic manually generated plans and sections. |
A significant portion of the historic drill data relates to areas that have since been mined out.
| 9.2 | Modern data |
| 9.2.1 | Database |
After drillhole logging the drill log spread sheets are sent to the database administrator who imports the data into the AcQuire Database. The database has validations switched on for lithological and assay type names, project codes, sample depths, i.e. the ‘from’ and ‘to’ depths of the samples, etc. Any errors associated with these fields and others are highlighted at import stage. Records with errors are not written to the database. A check report is run, with the database administrator sending import errors back to the originator geologist for correction. Once all errors are corrected, verification is done by the originator’s supervisor and the data is again sent to the database administrator for importation into the Acquire database. The check import method is run again, and if no further errors are detected, the entry method is changed to, insert, update or merge depending on the data type. The data is written into the database.
Consistency checks are done by extracting the newly imported data from the database, importing it into the mining software, e.g. Datamine®, de-surveying and displaying it in graphic windows for spatial and orientation visual validations.
| 9.2.2 | Exported data validation |
After data is exported from the database and imported to mining software the following validations are carried out to ensure data integrity:
| · | Check for missing data in collar file, survey file, geology file and assay file. |
| · | Check survey data for bearing beyond 360° and inclination beyond ±90°. |
| · | Check for data duplication. |
| · | Check for outliers in terms of spatial location. |
| · | Check for overlapping sample intervals. |
| · | Missing intervals. |
| · | Consistency in geological logging. |
| · | Check that drillhole length is not less than the sampling length. |
| · | Visual inspection of plotted drillhole trace. |
| amcconsultants.com | 112 |
| S-K 1300 TRS: KCM Integrated Operations (Initial Assessment) | |
| Konkola Copper Mines Plc | 0424076 |
During validation, some drillholes were found to have missing assay values. A thorough check found that those missing values were also missing on the actual log sheets. Further analysis reviewed that the missing values were outside the 1% TCu and did not affect the downstream process. The checks also found several samples with very high-grades and physical checks were conducted which verified that there were no typographic errors and the high-grades in the database were as per the values provided on the laboratory certificates.
| 9.2.3 | Data verification |
Data validation has been undertaken on data provided. This included drillhole collar surveys, downhole geological logging observations, sample selection and preparation, sample analysis, analytical results, and other test data.
Random checking has been undertaken of the geological database against the drillhole log sheets. Analytical results in the database were reviewed against the laboratory output MS Excel files checking for importation and transcription errors.
Verification included reviewing adherence to the: geological logging procedures, and the sample selection and preparation procedures.
| 9.2.4 | Database security |
Database backup is done on a weekly basis. This is managed by the MS server support team Server Consultants.
Database changes are only done on request by the data originator after discussing them with their supervisor, highlighting the changes that have been made which the data originator would like to have effect in the database, the changes are sent to the Database administrator together with the instructions for the changes. Once the changes are discussed and it’s agreed to update the records concerned, the update is made in the database and the instructions are filed on the Geology server for possible future reference. For some records like lithological name and assay values, the old record is maintained in columns, Formation_C, TCu1, ASCu1, TCo1, and ASCo1, while the updated record is maintained in Columns Formation, TCu, ASCu, TCo, and ASCo.
Corruption due to typographic error is avoided mainly by restricting the number of users that can write to the database. Most users are only assigned copy rights and usually work with extracted data. Currently only the database administrator has access to import data. Manual inputting of data into the database is avoided. The preference is to import data in CSV format as an output of Excel spread sheets. The Excel spreadsheets have gone a rigorous verification process as described below.
| 9.3 | Data verification limitations - Konkola |
During the data verification process, several limitations and challenges were identified:
| · | CRM Supply Shortages: Some assay batches lacked sufficient CRMs, limiting the ability to systematically validate analytical accuracy. |
| · | Quartz Blank Contamination: Independent audits identified trace mineralisation in quartz blanks, raising concerns about their effectiveness in detecting contamination. |
| · | Historical Data Gaps: Some older drillhole records lack complete metadata, particularly in relation to core recovery rates and downhole surveys. |
| · | Inconsistent Twin Drilling Data: While some historical twin drilling has been conducted, the coverage is limited, reducing the ability to fully validate historical datasets. |
| · | Incomplete Sample Disposal Records: Records on sample reject and pulp retention times were found to be inconsistent, creating gaps in long-term data verification. |
| amcconsultants.com | 113 |
| S-K 1300 TRS: KCM Integrated Operations (Initial Assessment) | |
| Konkola Copper Mines Plc | 0424076 |
These limitations impact the ability to fully assess data reliability across all historical and current Konkola drilling programs. The QP has assessed each limitation for its potential impact on the adequacy of the data used in this IA, as set out in Table 9.1 below.
Table 9.1 QP assessment of data verification limitations — Konkola
| Limitation | QP assessment | Impact on data adequacy for IA | ||
| CRM supply shortages: some assay batches lacked sufficient CRMs | CRM insertion rate target is 1:10. Shortages reduce the proportion of batches with independent accuracy checks. The 2024 QAQC reassessment (Section 8.5) reviewed the full CRM database and corrected identified errors. | Low. Shortages are episodic and do not invalidate the batches where CRMs were inserted. The negative CRM bias identified at Konkola is conservative. Does not compromise the IA resource estimates. | ||
| Quartz blank contamination: trace mineralisation identified in quartz blanks | The blank material is locally sourced non-mineralised rock (FWQ, AGSST, PC). It is unclear whether elevated results reflect contamination or inherent low-grade mineralisation in the blank material itself. | Low. At Konkola, blank results are generally below the 0.08% TCu threshold (Section 8.5.1.3). | ||
| Historical data gaps: some older drillhole records lack complete metadata (core recovery, downhole surveys) | Older drillholes from the Borehole Master File era may lack core recovery and survey data. These drillholes are geographically intermingled with modern drilling that does have complete metadata. | Low. | ||
| Inconsistent twin drilling data: limited coverage reduces ability to fully validate historical datasets | Some historical twin drilling has been conducted but coverage is limited. No systematic twin hole program has been implemented. Modern drilling in the same areas as historical holes provides indirect validation. | Low to moderate. The absence of a systematic twin hole program is a recognised gap. Grade consistency between historical and modern drillhole results located in nearby comfort. Twin hole drilling is recommended in the KDMP program (Section 23). | ||
| Incomplete sample disposal records: inconsistent reject and pulp retention records | Records on sample reject and pulp retention times are inconsistent. | Low. Sample disposal records do not affect the quality of the assay data already in the database. The limitation relates to the ability to perform retrospective verification, which is relevant only if re-assay is required. |
Source: AMC, 2026.
| 9.4 | Data verification limitations - Nchanga |
During the data verification process for the Nchanga deposits, several limitations and challenges were identified:
| · | Absence of QAQC for historical data: No formal QAQC data exists for the COP DF and TD03/TD04 drilling databases, which predate modern QAQC practices. The older generation of Nchanga drillholes spans up to 50 years of drilling history conducted in the absence of standardised analytical quality controls. This introduces a degree of uncertainty regarding the accuracy and precision of the underlying assay data for these deposits. The impact is assessed as low to moderate - COP DF has been subject to active mining without systematic grade discrepancies between predictions and production outcomes, and TD03/TD04 grade uncertainty is partially mitigated by the semi-homogeneous nature of tailings material and ongoing TLP production reconciliation. Refer to Table 8.6 for deposit-level QP assessments. |
| · | Limited blank and repeat submission Nchanga deposits: Blank submissions are absent for COP E Extension. COP E Extension has repeat submissions to umpire laboratories but no blanks. The absence of blanks prevents contamination assessment for these deposits. Impact is assessed as low for COP E Extension given the grade ranges involved. |
| · | CRM supply shortages: There is a low impact to COP E Extension where assay batches lack sufficient CRMs, limiting the ability to systematically validate analytical accuracy across all drilling phases. |
| amcconsultants.com | 114 |
| S-K 1300 TRS: KCM Integrated Operations (Initial Assessment) | |
| Konkola Copper Mines Plc | 0424076 |
| · | Historical data gaps: Some older Nchanga drillhole records lack complete metadata, particularly in relation to core recovery rates and downhole surveys. This is most significant for COP DF and the pre-2011 portion of the COP E Extension database where modern logging standards were not applied. Impact is low — missing metadata affects individual intercept confidence but does not introduce systematic bias. Areas with sparse or incomplete data are classified at lower confidence (Inferred) in the resource model. |
| · | Incomplete pulp and reject sample disposal records: Records on sample reject and pulp retention times are inconsistent across Nchanga drilling programs, creating gaps in long-term data verification. Impact is low — sample disposal records do not affect the quality of assay data already in the database. The limitation relates to the ability to perform retrospective re-assay verification only. |
| · | Drillhole orientation errors: Drillhole orientation (strike) required correction in a number of drillholes in the Upper Orebody (UOB). Errors were identified during the data verification process, checked against hard copy geological logs, and corrected prior to resource estimation. The QP is satisfied that the corrected orientation data is reliable for the purposes of the resource estimates presented in this IA. |
These limitations impact the ability to fully assess data reliability across all Nchanga drilling programs. The QP has assessed each limitation for its potential impact on the adequacy of the data used in this IA. The cumulative effect of these limitations on the Mineral Resource estimates, is set out in Table 8.5 and Table 8.6 of Section 8.
| 9.5 | Qualified Person’s opinion |
The QP considers that the only potential material risk with respect to data verification relates to the QAQC issues discussed in Section 8. A small subset of historical data has been excluded from the resource estimation to address these concerns.
The QP has reviewed the data verification procedures applied to both the historical and modern drilling databases across the KCM Integrated Operations. The verification scope included collar, assay, and survey records for the Konkola deposit, the Nchanga deposits (COP DF, COP E Extension, TD03, TD04 and TD05). The QP's assessment of data adequacy for the purposes of this IA TRS is set out below.
| 9.5.1 | Historical data |
The historical data has been verified by comparison of the modern AcQuire database entries against the Borehole Master File (original logs), and by plotting plans and sections from the database against historically hand generated hard-copy plans and sections. These verification methods are appropriate for validation of historic data and are consistent with industry practice for long-operating Copperbelt mines where centralised data repositories (Borehole Master File) were maintained prior to individual mine privatisation.
A significant portion of the historical data relates to areas that have since been mined out, which reduces the reliance on historical data for the resource estimates in this IA.
| 9.5.2 | Modern data |
The modern data management procedures are described in Section 9.2. The QP considers these procedures to be appropriate and consistent with good industry practice
| 9.5.3 | Assessment of identified verification limitations |
The data verification process identified five limitations for the Konkola dataset (Section 9.3) and six limitations for the Nchanga dataset (Section 9.4). The QP has assessed the Konkola limitations individually in Table 9.1. For the Nchanga deposits, the QP's deposit-level assessment of the cumulative effect of data and QAQC limitations is set out in Table 8.5 and Table 8.6.
| amcconsultants.com | 115 |
| S-K 1300 TRS: KCM Integrated Operations (Initial Assessment) | |
| Konkola Copper Mines Plc | 0424076 |
The Konkola verification limitations are individually and collectively of low to moderate materiality, as documented in Table 9.1. The Nchanga limitations vary by deposit - COP E Extension carries moderate data uncertainty primarily attributable to partial QAQC coverage and blank material quality respectively; COP DF and TD03/TD04 carry higher data uncertainty due to the complete absence of modern QAQC, mitigated in each case by production reconciliation evidence and the nature of the mineralisation; and TD05 carries low data uncertainty given comprehensive modern QAQC coverage, the high-grade CRM bias identified being unrepresentative of the low-grade tailings material.
| 9.5.4 | Data adequacy conclusion |
The QP is of the opinion that the data verification procedures applied to the KCM drilling databases are adequate for the purposes of this IA TRS. The historical data verification (and the modern data verification (AcQuire database validation controls, two-stage import process, nine-point exported data validation, and random checking against log sheets and laboratory certificates) together provide reasonable assurance that the data used in the Mineral Resource estimates is reliable.
The identified verification limitations are individually and collectively of low to moderate materiality. None of the limitations introduce a systematic bias or error source that would materially affect the Mineral Resource estimates at the IA level of confidence. The only area of moderate concern relates to the QAQC deficiencies discussed in Section 8, which are addressed in the QP's opinion in Section 8.7. Those deficiencies add a degree of analytical uncertainty but as discussed in that section, do not compromise the reliability of the data being used as an input into the grade estimation.
| amcconsultants.com | 116 |
| S-K 1300 TRS: KCM Integrated Operations (Initial Assessment) | |
| Konkola Copper Mines Plc | 0424076 |
| 10 | Mineral processing and metallurgical testing |
Metallurgical testing has been conducted to support process flowsheet design. Key recovery parameters:
| · | Konkola Concentrator: 86.5% copper recovery (Full Resource Case life-of-mine average); 89.2% (M&I Case life-of-mine average) |
| · | Nchanga Concentrators: 53.9% copper recovery (Full Resource Case life-of-mine average, varying by deposit and ore type) |
| · | Existing Nchanga TLP (conventional ambient leach, TD03/TD04 historical baseline): 74.8% acid-soluble copper (ASCu) recovery, equivalent to approximately 48.5% TCu recovery to cathode |
| · | Nchanga Elevated Temperature Leach (ETL): incremental ~23% recovery of acid-insoluble copper (AICu) above conventional ambient-temperature leach baseline; total leach recovery (TCu) varies by feed grade per Section 10.4.4.5 |
| · | Existing Nchanga TLP with ETL retrofit: approximately 56.7% TCu recovery to cathode (life-of-mine average), operating in both the M&I and Full Resource Cases. Recovery is driven by combined ASCu and AICu leaching. |
| · | Proposed TLP 2 (Elevated Temperature Leach, Full Resource Case only): approximately 73.9% TCu recovery to cathode, equivalent to 78.3% acid-soluble copper (ASCu) recovery (Nerin Concept Design; refer Section 14.5). |
| · | Under the Full Resource Case, the two facilities operate in parallel to process the larger TD05 throughput including the Inferred portion. The resulting Full Resource Case life-of-mine blended TCu recovery across the Nchanga TLP operation is approximately 66.8%. |
| · | Smelter: 98.1% copper recovery |
| · | Concentrate Payable Cu: 96.8% |
The primary processing method employed at the KCM concentrators at both Konkola and Nchanga is conventional froth flotation, a technique for the beneficiation of mixed sulfide and oxide copper ores. The current processing circuits consist of grinding, sulfide flotation in roughing, scavenging and cleaner configuration stages to recover primary copper sulfides. Tails from the sulfide flotation circuit containing unrecovered sulfides and oxide copper species undergo controlled potential sulfidation (CPS) with sodium hydrosulfide (NaHS), and are subsequently floated in an oxide rougher, scavenger with regrind, and cleaner flotation circuit to recover a portion of the oxide copper species. The processing circuit is described in detail in Section 14.1.
This two-stage approach has been validated through extensive operational performance at the site, with the sulfidation step tailored to optimise recovery from the mineral assemblage present within the Konkola deposit, which includes chalcopyrite, bornite, chalcocite, malachite, and azurite.
No novel or experimental processing routes have been introduced. The employed methodology is widely used within the copper industry, particularly for base metal operations processing transition ores with a blend of sulfide and oxide minerals. As such, no additional metallurgical test work has been deemed necessary to validate the general applicability of the process.
| 10.1 | Testing nature, extent, and analytical procedures |
KCM is an active operating mine with multiple process streams at the Konkola Concentrator. The current metallurgical performance inputs used in the production plan are derived from ongoing plant data obtained since operations resumed in August 2024 and historical metallurgical performance. As such, past test work has been superseded by current performance data, which reflects actual operating conditions and ore variability encountered during production.
| amcconsultants.com | 117 |
| S-K 1300 TRS: KCM Integrated Operations (Initial Assessment) | |
| Konkola Copper Mines Plc | 0424076 |
| 10.2 | Testing laboratories |
All metallurgical and analytical testing is conducted on site:
| · | Konkola analyses are undertaken at the KCM laboratory at Konkola (Konkola analytical laboratory). |
| · | Nchanga analyses are undertaken at the KCM laboratory at Nchanga (Nchanga analytical laboratory). |
The laboratory is a wholly owned facility of KCM and is independent of external influence. It operates under internationally recognised quality assurance standards and is certified to BSI ISO9001:2015.
The laboratory performs routine process monitoring, metallurgical accounting, and quality control testing, which directly informs plant adjustments and long-term production planning.
| 10.3 | Test sample representativity |
Test samples are collected for confirmation of metallurgical performance and for testing of potential changes in reagents and operating conditions.
Samples used for metallurgical tracking and process control are considered indicative of the ore being processed. Sampling is ongoing and responsive to mining progression. As new zones are accessed within the deposit, representative samples are taken and metallurgically assessed to ensure processing parameters are continuously optimised for maximum recovery and concentrate quality. This practice ensures metallurgical performance remains reliable over the life of the mine.
Despite strong internal QAQC protocols, several limitations were identified during independent reviews. These include occasional shortages of CRMs, trace mineralisation detected in quartz blanks, inconsistent sample disposal records, and limited twin-drilling coverage for validation. In particular, the quality of some assay batches was previously impacted by equipment ageing, although this is being addressed through a phased equipment upgrade program.
To ensure precision and mitigate data bias, QAQC reviews conducted in 2024 included reassessment of CRM results and corrections to historical data mismatches. Additional confirmation steps involved reanalysis of failed batches and implementation of stricter reference standard controls.
Where further validation is required, external umpire laboratories are recommended for independent verification of assay results, especially where internal QAQC results fall outside acceptable deviation limits. This layered approach provides additional confidence in the reliability of assay data used in the geological and metallurgical models.
Monthly Mineralogical Composite Reports, issued for October 2024, January 2025 and February 2025, further reinforce the robustness of the metallurgical data. These reports are prepared by the ISO-certified Konkola Analytical Services Department and follow a standardised methodology (Ref. KCM / MD / SIQ / MM01) to quantify copper and cobalt minerals in flotation feeds, tailings, and concentrates. The repeatability of analytical methods and the monthly reconciliation of flotation performance with mineralogical observations provide internal validation of laboratory and plant data. Trends in acid-soluble copper, mineral liberation, and gangue composition across months offer critical insight into both ore variability and plant response. Each report is signed by project mineralogists and approved by the Head Mineralogist, strengthening confidence in the internal QA process.
| amcconsultants.com | 118 |
| S-K 1300 TRS: KCM Integrated Operations (Initial Assessment) | |
| Konkola Copper Mines Plc | 0424076 |
| 10.4 | Testing results, assumptions, and deleterious elements |
| 10.4.1 | Konkola concentrator |
Konkola Concentrator is operational and will continue to be in operation for the mine life. The primary data inputs for metallurgical forecasting are derived from plant operational data collected in the operational period up until 2022 and since the recommencement of production in August 2024. This real-time data supersedes earlier bench-scale test work. While historical metallurgical testing was performed during earlier phases and feasibility assessment, the operational data now used offers superior representativity by directly reflecting the current process streams and ore variability encountered across mining areas.
Total copper recovery is closely related to the acid soluble copper content (ASCu). The recommended total copper recoveries are given by:
TCu(%) = -95.824 x ASCu(%)/TCu(%) + 99.146
The concentrate produced from the Konkola ore body is relatively free of deleterious elements and is a suitable feed for the Nchanga smelter. The main controls required are for silica and MgO content. Main gangue minerals in concentrate are argillite and quartz / feldspars. Gangue minerals comprise approximately 1/3rd of the concentrate mass. High silica and MgO are deleterious to smelter operation. The preferred contents are <15% and <1.5% respectively. Typical Konkola concentrate has 20-22% silica and 2.5 to 3% MgO. This is controlled by blending at the smelter.
| 10.4.2 | Nchanga TLP |
The primary data inputs for metallurgical forecasting are derived from plant operational data collected in the operational period up until 2022 and since the recommencement of production in August 2024. The operational data now used offers superior representativity by directly reflecting the current process streams and ore variability encountered across mining areas.
Figure 10.1 shows copper production and recovery performance since the restart and the FY25-26 plan.
Figure 10.1 Nchanga TLP copper production and recoveries - Restart and FY25-26 plan
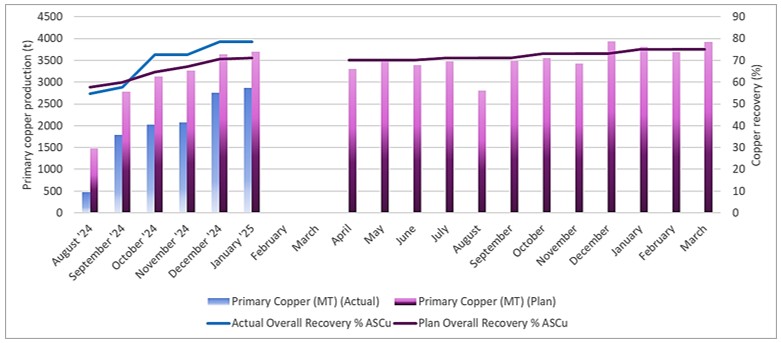
Source: KCM, 2025.
Nchanga TLP copper recoveries are shown in Figure 10.2 below.
| amcconsultants.com | 119 |
| S-K 1300 TRS: KCM Integrated Operations (Initial Assessment) | |
| Konkola Copper Mines Plc | 0424076 |
Figure 10.2 Nchanga TLP copper recoveries
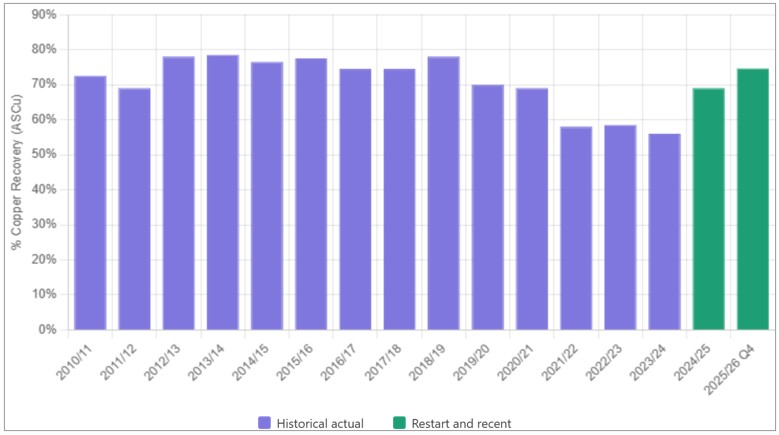
Source: KCM, 2026.
Recovery performance was reduced in the four-year period from 2020 to 2024 due to operating and financial constraints.
This data provides the basis for estimation of the long-term recovery performance of the Nchanga TLP. Collation of recovery data is given in Table 10.1.
Table 10.1 Historical, restart, and planned Nchanga TLP recoveries
| Recovery data | ASCu recovery (%) |
Note | ||
| Historical average 2010 to 2024 | 70.62 | 14 yr period. | ||
| Historical average excluding 2020 to 2024 data | 74.75 | 10 yr period. Excludes 4 yr period of operating and financial constraint. | ||
| Restart period August 2024 to January 2025 | 69.05 | 6 months. | ||
| Last 3 months of restart | 76.51 | Excludes first 3 months of restart. | ||
| Plan FY25-26 | 71.05 | Plan ramps up from 69.7% recovery to 74.8% recovery. | ||
| Plan FY25-26 Q4 | 74.82 | 3 months of plan. | ||
| Actual FY25-26 Q3 | 74.00 | 3 months of actual operating performance. | ||
| Actual FY25-26 Q4 | 74.60 | 3 months of actual operating performance; 0.3 percentage points below plan. |
The final period of the FY25-26 plan coincides with a relatively consistent 10-year period of operational performance. A recovery of 74.8% ASCu is suitable for long-term planning of the Nchanga TLP 1 performance. Q3 and Q4 FY25-26 actual ASCu recoveries of 74.00% and 74.60% respectively have now confirmed this assumption, with Q4 falling 0.3 percentage points below the Q4 plan of 74.82% and both quarters consistent with the 74.75% historical average from the 10-year period excluding 2020–2024.
| amcconsultants.com | 120 |
| S-K 1300 TRS: KCM Integrated Operations (Initial Assessment) | |
| Konkola Copper Mines Plc | 0424076 |
| 10.4.3 | Nchanga TLP and Elevated Temperature Leach Technology |
To process the larger tailings throughput required under the Full Resource Case, a second tailings leach plant (TLP 2) with integrated Elevated Temperature Leach (ETL) technology is proposed. The Full Resource Case assumes a TLP 2 throughput rate of 17.7 Mtpa, operating in parallel with the existing Nchanga TLP.
TLP 2 is designed with higher wash and leach efficiency than the existing Nchanga TLP, combined with elevated temperature leach conditions. Based on Nerin Concept Design, TLP 2 is expected to achieve TCu recovery to cathode of approximately 73.9% (78.3% ASCu recovery).
Under both the M&I Case and the Full Resource Case, the existing Nchanga TLP is retrofitted with ETL. The addition of ETL to the existing Nchanga TLP is expected to increase TCu recovery from the historical conventional leach baseline of approximately 48.5% (pre-ETL, reflecting the blended TD03/TD04 feed under ambient leach) to 56.7% under the M&I Case and 59.3% under the Full Resource Case. The difference between the two cases reflects the different feed mix. The Full Resource Case processes additional TD05 material at higher average grade, on which ETL achieves greater recovery uplift. The ratio of ASCu to AICu in the feed material is a key determinant of TCu recovery.
The overall case-level blended TCu recovery from the Nchanga TLP operations is approximately:
| · | M&I Case: 56.7% (existing Nchanga TLP with ETL retrofit, processing TD03, TD04, and the M&I portion of TD05) |
| · | Full Resource Case: 66.8% (existing Nchanga TLP with ETL retrofit, operating in parallel with TLP 2; processing the larger TD05 throughput across both facilities) |
| 10.4.4 | TD05 metallurgical test work |
The metallurgical test work program was undertaken in late-2025 by AHK to evaluate the copper recovery potential for TD05 tailings material, via TLP and the proposed ETL plant.
The 2025 program supplements a detailed study undertaken in 2021 which was focused on the use of ETL.
The 2025 drilling program and sample collection is described in Section 8.
| 10.4.4.1 | Test work program |
The test work program comprised:
| · | Particle size analysis: full particle size distribution (PSD) characterisation across low-grade, medium-grade, and high-grade composite samples at 212 µm, 106 µm, 75 µm, 53 µm, and 45 µm screen sizes. |
| · | Density determinations: true density (specific gravity) and wet bulk density on each composite. |
| · | Mineralogical characterisation: Modal mineralogy quantifying copper-bearing phases and gangue assemblage. |
| · | Leach test work: bottle roll leach tests under elevated temperature conditions (80°C), characterising acid soluble copper recovery and gangue acid consumption. |
| 10.4.4.2 | Material characterization |
The AHK characterisation identified a predominantly oxide copper mineralogy comprising chrysocolla, malachite, pseudomalachite, and minor chalcocite, hosted within a gangue assemblage dominated by cupriferous mica and silicate gangue. The dominantly oxide nature of the copper mineralogy supports the application of an acid leach process route.
| amcconsultants.com | 121 |
| S-K 1300 TRS: KCM Integrated Operations (Initial Assessment) | |
| Konkola Copper Mines Plc | 0424076 |
The material is fine-grained, typical of flotation tailings, and does not require additional comminution prior to leaching. Bulk density and true density were measured on each composite to information for the reclamation materials handling engineering calculations.
| 10.4.4.3 | Leach recovery — process basis |
The TD05 leach circuit recovery is modelled as a function of total copper grade (TCu) using a fitted regression on the combined 2021 and 2025 test work datasets. The fitted relationship is:
TCu Recovery (leach circuit only) = c − b / e^(a × TCu)
where:
a = 339.235
b = 0.846
c = 0.824
TCu is expressed as a decimal fraction
A maximum recovery cap of 82% is applied at TCu grades greater than 1.5%
This relationship represents recovery through the leach process only (acid leach of acid soluble copper into pregnant leach solution, PLS). It excludes downstream losses associated with washing, solvent extraction (SX), and electrowinning (EW). Application of the relationship to forecast cathode production therefore requires multiplication by the combined wash, SX, and EW efficiency factor.
The fitted relationship is consistent with the AHK leach efficiency results obtained across the low, medium, and high composites tested.
| 10.4.4.4 | Wash, solvent extraction, and electrowinning efficiency |
The downstream recovery efficiency factors for TLP 2, from leached solution to LME Grade A copper cathode, as adopted in the Nerin Concept Design, are summarised in Table 10.2.
Table 10.2 Recovery downstream efficiency factors
| Stage | Efficiency | |
| Wash circuit | 98.50% | |
| Solvent extraction | 99.50% | |
| Electrowinning current efficiency | 91.00% | |
| Combined wash + SX + EW factor | 89.2% |
| 10.4.4.5 | Recovery to cathode |
Combining the leach recovery relationship with the downstream factor yields the recovery to cathode:
TCu Recovery to cathode (%) = [c − b / e^(a × TCu)] × 0.87
Application of this relationship to the TD05 Mineral Resource head grade and to the life-of-mine production schedule is set out in Section 14.
| 10.4.4.6 | Acid consumption |
Total acid consumption (TAC) was measured during the leach tests across all three composites. Average TAC for the composite sample is materially higher than the gangue acid consumption observed at the existing Nchanga TLP feed and reflects the elevated temperature leach conditions and the carbonate-bearing gangue of TD05 material. Acid supply is identified as a key project sensitivity.
| amcconsultants.com | 122 |
| S-K 1300 TRS: KCM Integrated Operations (Initial Assessment) | |
| Konkola Copper Mines Plc | 0424076 |
| 10.5 | Qualified Person’s opinion |
In the opinion of the QP, the data provided is adequate for the purpose used in the TRS and procedures used are part of conventional industry practice.
In the opinion of the QP, the metallurgical data available for TD05 is sufficient for IA-level disclosure but is not yet at PFS confidence. The following points are noted:
| · | Test work result consistency: While the 2025 AHK test work results fall within the results of the 2021 ETL test work there are some inconsistencies that need investigation to be understood. |
| · | Temperature consistency: The 2025 AHK tests were conducted at 80°C, while the 2021 ETL tests operated at temperatures up to 70°C. While the QP is satisfied with the concordance between the two datasets within the scatter of the data, the recovery relationship is sensitive to operating temperature, and any commercial operation should validate the recovery basis under intended steady-state plant conditions. |
| · | Leach-only basis of the fitted relationship: The recovery relationship reflects the leach circuit only. Misapplication of the relationship without applying the downstream wash / solvent extraction / electrowinning factor (89.2% combined; refer Table 10.2) would materially overstate the recovery to cathode. |
| · | Recovery cap: The 82% recovery cap applied at TCu > 1.5% is a reasonable upper bound based on the asymptote of the fitted curve and is appropriate given the limited test data at higher grades. |
Recommendations for advancement to Mineral Reserve: To support a future PFS or FS for the New TLP project, the QP recommends: (i) further investigation of full leach results for the AHK2025 test work to resolve identified inconsistencies, (ii) variability test work across the depth and spatial extent of TD05 to characterise grade and recovery domains, (iii) pilot-scale or demonstration-scale leach testing at intended plant operating temperature to validate residence time and reagent consumption assumptions, and (iv) confirmation of acid supply availability and pricing assumptions consistent with the project's commissioning timeline, and (v) refinement of the elevated temperature leach (ETL) operating cost estimate (currently at IA Concept confidence) through detailed engineering of the steam plant, coal supply contracts, and integrated thermal management.
| amcconsultants.com | 123 |
| S-K 1300 TRS: KCM Integrated Operations (Initial Assessment) | |
| Konkola Copper Mines Plc | 0424076 |
| 11 | Mineral Resource estimates |
|
INFERRED MINERAL RESOURCE DISCLOSURE
Approximately 63% of KCM Mineral Resources are classified as Inferred (483 Mt of 773 Mt). Inferred Mineral Resources have a lower level of confidence and are considered too speculative geologically to be categorised as Mineral Reserves at this time. Inferred Mineral Resources are included in the Full Resource Case economic analysis presented in Section 19 only; the Measured and Indicated Case (M&I Case) economic analysis excludes all Inferred Mineral Resources. It is reasonably expected, though not certain, that the majority of Inferred Mineral Resources could be upgraded to Indicated or Measured classification with continued drilling and exploration.
|
| 11.1 | Introduction |
Figure 11.1 shows the location of KCM mining rights and Konkola and Nchanga assets.
Figure 11.1 Plan location of the KCM Mineral Deposits
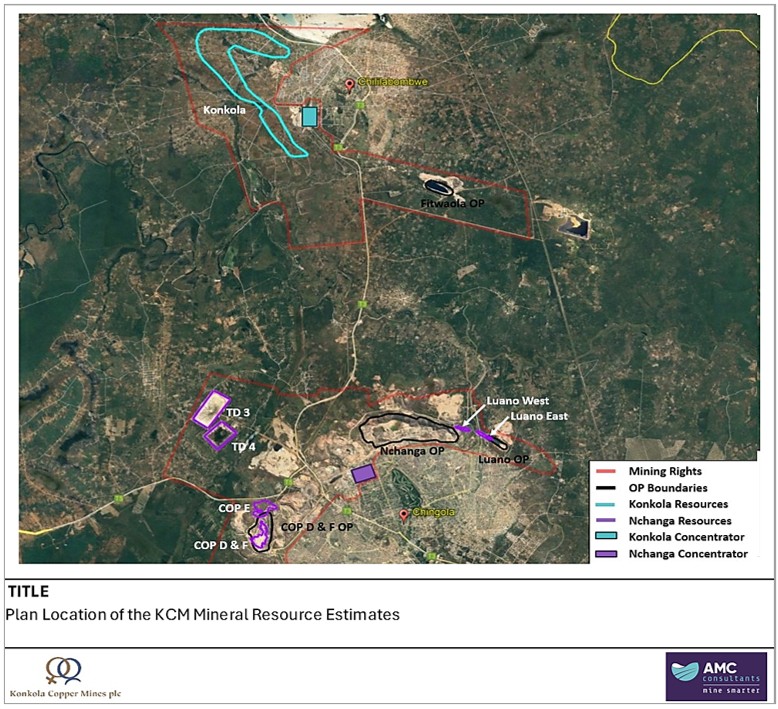
Source: AMC, 2026.
| amcconsultants.com | 124 |
| S-K 1300 TRS: KCM Integrated Operations (Initial Assessment) | |
| Konkola Copper Mines Plc | 0424076 |
The Mineral Resource classification criteria and cut-off grade on an asset-by-asset basis are based on combinations of the:
| · | Geological and grade continuity. |
| · | Drill data density. |
| · | Data quality. |
| · | Estimation quality. |
| · | Historical mining. |
| · | Mining method. |
| · | Potential for the mining method to transition from surface to underground. |
| · | Depth of mineralisation to surface. |
| 11.2 | KCM Integrated Operations - Mineral Resources |
Per Item 1304 of Regulation S-K 1300, each material property is presented with individual disclosures.
A Mineral Resource is an estimate of the in situ concentration of solid material of economic interest, which serves as the point of reference for the Mineral Resource estimate. The Mineral Resource classification criteria and cut-off grade (COG) are determined on an asset-by-asset basis, as set out in Sections 11.3 and 11.4 below. The Mineral Resource estimate as of 1 April 2026 for all KCM operations is summarised in Table 11.1 below.
Table 11.1 KCM Mineral Resources – 1 April 2026
| Cut-off | Tonnes | Total copper | Copper | Total cobalt | Cobalt | |||||||||||||||||||||
| Asset | Classification | TCu (%) | Mt | TCu (%) | Cu (kt) | TCo (%) | Co (kt) | |||||||||||||||||||
| Measured | 1.1 | 4 | 3.5 | 140 | 0.08 | 3 | ||||||||||||||||||||
| Indicated | 1.1 | 35 | 3.7 | 1,289 | 0.07 | 24 | ||||||||||||||||||||
| Konkola Mine | Measured + Indicated | 1.1 | 39 | 3.7 | 1,430 | 0.07 | 27 | |||||||||||||||||||
| Inferred | 1.1 | 249 | 3.4 | 8,353 | 0.06 | 150 | ||||||||||||||||||||
| Total | - | 288 | 3.4 | 9,783 | 0.06 | 177 | ||||||||||||||||||||
| Indicated OP | 0.50 | 2.2 | 1.4 | 31 | 0.12 | 3 | ||||||||||||||||||||
| Indicated UG | 1.1 | 13 | 1.6 | 202 | 0.04 | 5 | ||||||||||||||||||||
| COP DF | Measured + Indicated | - | 15 | 1.6 | 233 | 0.05 | 8 | |||||||||||||||||||
| Inferred | - | - | - | - | - | - | ||||||||||||||||||||
| Total | - | 15 | 1.6 | 233 | 0.05 | 8 | ||||||||||||||||||||
| Measured | - | - | - | - | - | - | ||||||||||||||||||||
| Indicated | 0.9 | 13 | 2.6 | 345 | - | - | ||||||||||||||||||||
| COP E Ext | Measured + Indicated | 0.9 | 13 | 2.6 | 345 | - | - | |||||||||||||||||||
| Inferred | 0.9 | 9 | 2.4 | 221 | - | - | ||||||||||||||||||||
| Total | - | 23 | 2.5 | 566 | - | - | ||||||||||||||||||||
| TD03 | Indicated | 0.0 | 3 | 0.8 | 21 | 0.01 | 1 | |||||||||||||||||||
| TD04 | Indicated | 0.0 | 22 | 0.6 | 134 | 0.03 | 6 | |||||||||||||||||||
| TD05 | Measured | - | - | - | - | - | - | |||||||||||||||||||
| Indicated | 0.0 | 198 | 0.6 | 1,091 | 0.02 | 44 | ||||||||||||||||||||
| Measured + Indicated | 0.0 | 198 | 0.6 | 1,091 | 0.02 | 44 | ||||||||||||||||||||
| Inferred | 0.0 | 225 | 0.5 | 1,180 | 0.02 | 49 | ||||||||||||||||||||
| Total | - | 423 | 0.5 | 2,272 | 0.02 | 93 | ||||||||||||||||||||
| Measured | - | 4 | 3.5 | 140 | 0.08 | 3 | ||||||||||||||||||||
| Indicated | - | 285 | 1.1 | 3,114 | 0.03 | 83 | ||||||||||||||||||||
| Total KCM | Measured + Indicated | - | 289 | 1.1 | 3,255 | 0.03 | 86 | |||||||||||||||||||
| Inferred | - | 483 | 2.0 | 9,755 | 0.04 | 199 | ||||||||||||||||||||
| Total | - | 773 | 1.7 | 13,009 | 0.04 | 284 | ||||||||||||||||||||
| amcconsultants.com | 125 |
| S-K 1300 TRS: KCM Integrated Operations (Initial Assessment) | |
| Konkola Copper Mines Plc | 0424076 |
Notes:
| · | Mineral Resources are reported with an effective date of 1 April 2026. |
| · | No Mineral Reserves are declared as part of this Initial Assessment. Mineral Resources are reported in their entirety. |
| · | Classification in accordance with S-K 1300. |
| · | Approximately 63% of KCM Mineral Resources are classified as Inferred (483 Mt of 773 Mt). Inferred Mineral Resources are considered too speculative geologically to be categorised as Mineral Reserves at this time, and there is no certainty that Inferred Mineral Resources will be converted to higher confidence categories with additional exploration. |
| · | Cut-off grades are applied on an asset-by-asset basis as set out in the individual deposit resource tables in Sections 11.3 to 11.4. |
| · | Cobalt grades for TD03, TD04 and TD05 are reported for geological completeness. Cobalt is not recovered in the TLP electrowinning process and no cobalt revenue is attributed to TD03, TD04 or TD05 in the economic analysis. |
| · | Point of reference: In situ material. |
| · | Metallurgical recovery — Konkola Mine: Concentrator 86.5% Cu (Full Resource Case life-of-mine average; M&I Case 89.2%), 60% Co; Smelter 98.1% Cu, 30% Co; Concentrate Payable Cu 96.8%. |
| · | Metallurgical recovery (LOM Average) — Nchanga Business Unit (Full Resource Case only): Concentrator 53.9% Cu (varies by deposit); Smelter 98.1% Cu; Concentrate Payable Cu 96.8%. |
| · | Metallurgical recovery — Nchanga TLP processing routes: Recovery assumptions vary by deposit and processing route. TD03 and TD04 — existing Nchanga TLP, ambient leach: 74.8% ASCu recovery, equivalent to approximately 48.5% TCu recovery to cathode. TD05 — processed through the existing Nchanga TLP (retrofitted with elevated temperature leach) under both the M&I Case and the Full Resource Case; under the Full Resource Case, the additional TD05 throughput required to process the larger Mineral Resource scope is also processed through the proposed TLP 2 facility (refer Section 14.5), with both plants operating in parallel and using elevated temperature leach. TCu recovery to cathode is determined by feed grade per Section 10.4.4.5 and capped at 82% for TCu grades above 1.5%. Case-level blended TCu recoveries to cathode are reported in Table 1.13 and Table 19.2 (66.8% Full Resource Case; 56.7% M&I Case) and reflect the deposit mix, feed scheduling, and the timing of the elevated temperature leach upgrade. |
| · | Processing route: Konkola / Nchanga Concentrator → Nchanga Smelter → Nkana Refinery; TD03 / TD04 via existing Nchanga TLP (conventional ambient leach); TD05 via existing Nchanga TLP retrofitted with Elevated Temperature Leach (ETL) under both the M&I Case and the Full Resource Case, with additional TD05 throughput under the Full Resource Case via the proposed TLP 2 facility operating in parallel (refer Section 14.5). Tonnage and grade are rounded; this may result in minor computational discrepancies. |
| · | Mineral Resources are 100% attributable to KCM. |
| 11.2.1 | Mineral Resource uncertainty |
Mineral Resource estimates may be materially affected by the following risk factors:
| · | Data quality: Limited QAQC data exists for historical drillholes. Modern and historical drilling are intermingled geographically, and at no time have recent drillholes provided results outside the range indicated by historical drilling. As mining progresses, reliance on historical data diminishes. The QP recommends implementation of comprehensive QAQC protocols on all future drillholes (Section 23). |
| · | Geological variability: The Konkola deposit is characterised by folded and faulted stratigraphy, variable mineralisation thickness, and locally disrupted mineralisation associated with thrust zones and synclinal folding. These features affect estimation confidence in areas of structural complexity, particularly where drillhole spacing is wide. The geological model accounts for known structural controls, but unidentified faults or changes in mineralisation geometry between drillholes may affect local block grade estimates. |
| · | Metallurgical recovery: Recovery assumptions are based on historical plant performance and limited variability test work. Variations in ore type, oxidation state (reflected in the ASCu ratio), and feed blend may affect achieved recoveries relative to the assumptions applied. |
| · | Economic assumptions: The Mineral Resource is constrained by a 1.1% TCu cut-off grade reflecting reasonable prospects for eventual economic extraction. Changes to metal prices, exchange rates, mining costs, or processing costs could materially affect the quantity of material reported above cut-off. |
| amcconsultants.com | 126 |
| S-K 1300 TRS: KCM Integrated Operations (Initial Assessment) | |
| Konkola Copper Mines Plc | 0424076 |
The QP considers that these risk factors are consistent with a deposit of this geological type and at this stage of exploration maturity, and do not represent unusual or atypical uncertainty relative to comparable sediment-hosted copper deposits on the Zambian Copperbelt. The most significant pathway to reducing uncertainty is the infill drilling program recommended in Section 23, which would support progressive conversion of Inferred Resources to higher confidence categories.
| 11.2.2 | Cut-off grade derivation |
Cut-off grades for all sulfide and mixed sulfide and oxide copper mineralisation are derived using a Net Smelter Return (NSR) breakeven method, in which the NSR per tonne of minable material at a given grade equals the total operating cost. The general expression is:
COG (%TCu) = (Cm + Cp + CG&A − CCo) ÷ NSR₁%
Where:
NSR₁% (US$/t ore per 1%TCu) = PCu × (Rconc × Rsmelt × Rpay) ÷ 100
And the variables are defined as:
| Symbol | Description | Unit | ||
| Cm | Mine operating cost | US$/t ore | ||
| Cp | Processing cost | US$/t ore | ||
| CG&A | Site general and administration cost | US$/t ore | ||
| CCo | Cobalt by-product credit, recognised at low payability rates per Section 16.1.6 | US$/t ore | ||
| PCu | Copper price used for cut-off grade estimation | US$/t Cu | ||
| Rconc | Concentrator metallurgical recovery | % | ||
| Rsmelt | Smelter recovery | % | ||
| Rpay | Refinery copper payability | % |
Smelter treatment and refining charges and freight (Table 16.3) are applied where relevant and act to reduce the effective NSR, offset partially by the integrated smelter economics for KCM's own concentrates. The copper price used for all cut-off grade derivations is US$10,000/t Cu (Section 16.1.7).
The key input assumptions by asset are summarised in the table below. Operating costs used for cut-off grade derivation are concept-level estimates prepared at the time of resource estimation, prior to and independent of the mine study. The LOM average costs in Table 18.2 reflect a mix of PFS-level and IA-level modelling across a 45-year production schedule including ramp-up periods and serve a different purpose. Deriving resource cut-off grades from concept-level cost proxies ahead of the formal mine study is consistent with standard industry practice under S-K 1300. Metallurgical recoveries are as reported in the individual deposit resource tables in Sections 11.3 to 11.4.
| amcconsultants.com | 127 |
| S-K 1300 TRS: KCM Integrated Operations (Initial Assessment) | |
| Konkola Copper Mines Plc | 0424076 |
Table 11.2 Cut-off grade input assumptions by asset
| Asset | Mining method | Cm + Cp + CG&A – Cco (US$/t ore, net of cobalt by-product credit)1 | Rconc (%) | Rsmelt (%) | Rpay (%) | PCu (US$/t) | Resulting COG | |||||||
| Konkola Mine | Underground | 90.1 | 89 | 98.1 | 96.8 | 10,000 | 1.1% TCu | |||||||
| COP DF | Open pit | 26.02 | 61 | 98.1 | 96.8 | 10,000 | 0.5% TCu | |||||||
| COP DF | Underground | 55.0 | 53 | 98.1 | 96.8 | 10,000 | 1.1% TCu | |||||||
| COP E Extension | Underground | 48.03 | 56 | 98.1 | 96.8 | 10,000 | 0.9% TCu | |||||||
| TD03 / TD04 / TD05 | Tailings reclamation | 14.34 | -6 | -6 | -6 | - | None applied6 |
Notes:
| 1 | Operating costs shown are net of the cobalt by-product credit (CCo), applied at low payability rates per Section 16.1.6. The column heading represents the net value (Cm + Cp + CG&A − CCo) used as the numerator in the cut-off grade derivation. |
| 2 | COP DF Open Pit: operating cost of US$26/t reflects the lower mining cost applicable to the shallow open pit geometry at concept-level resource estimation, net of cobalt by-product credit per Note 1. |
| 3 | COP E Extension: no cobalt credit applied; cobalt is not estimated for this deposit (refer Section 11.4.2.9). Operating cost of US$51/t reflects concept-level resource estimation inputs. |
| 4 | TD03, TD04 and TD05 are tailings deposits processed entirely through the Nchanga TLP. All material is required to be processed; no grade-based cut-off is applied. See Section 11.4.3. |
| 11.3 | Konkola |
Mineralisation at Konkola is predominately hosted in the shale formation (OSU) with some mineralisation extending to the adjacent hangingwall and footwall formations. The Konkola deposit is one of the largest in the region with Mineral Resource copper grades averaging above 3% TCu.
The Konkola deposit consists of seven mining areas. These include: Konkola East, Konkola Flats, Konkola Extension, Bancroft North, Bancroft Central, Bancroft Deeps, Bancroft South (see Figure 11.2). These mining areas will be referred to as collectively as Konkola.
The Konkola resource model was generated by AMC in 2024, incorporating an additional 251 drillholes not in the preceding resource model.
There has been no additional drilling until surface drilling commenced in late 2025. With 1,579 m drilled from a proposed 58,881 m drilling program, as at end March 2026. Insufficient analytical results were returned as of 15 January 2026 to justify a re-estimation of the resource model. An updated resource model will be undertaken on completion of the drilling program.
The 2024 resource model has since been depleted for production.
| amcconsultants.com | 128 |
| S-K 1300 TRS: KCM Integrated Operations (Initial Assessment) | |
| Konkola Copper Mines Plc | 0424076 |
Figure 11.2 Plan view of mining areas - Konkola
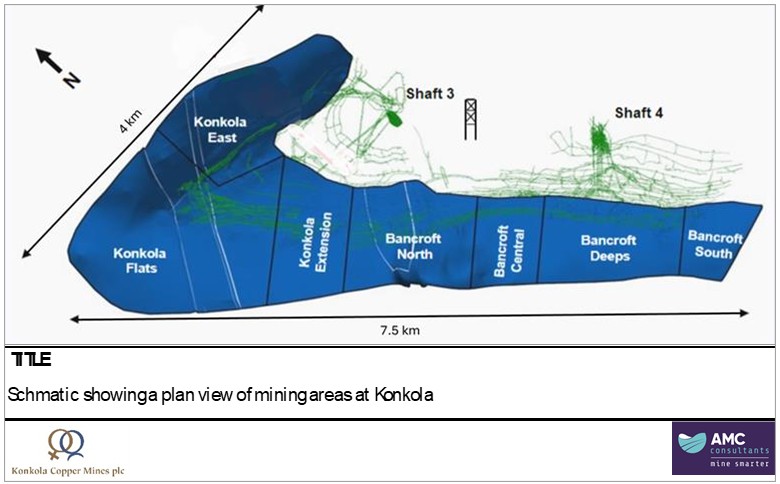
Source: AMC, 2026.
Datamine StudioRM® and Surpac® mining software was used to visualize and undertake the grade estimation. Supervisor® software was used for geostatistical assessment.
| 11.3.1 | Data |
The Konkola geological database contains 4,245 drillholes. The database is comprised of four files, collar, survey, geology, and assay. In 2024 an additional 251 drillhole have been incorporated.
The assay file contains a column called “Asscode” that separates waste from mineralisation using a geological cut-off grade of 1% TCu. Samples with grades below 1% TCu are coded 0 and those above 1% TCu are coded 1. Internal dilution was considered i.e., samples within the mineralisation below cut-off grade were coded as 1 based on the criteria that they were not more than 2 m thickness.
Drillholes are shown in plan view in Figure 11.3. Drillholes from 2016 onwards are shown in red and are present along the strike length of the mineralisation.
| amcconsultants.com | 129 |
| S-K 1300 TRS: KCM Integrated Operations (Initial Assessment) | |
| Konkola Copper Mines Plc | 0424076 |
Figure 11.3 Drillhole location plan - Konkola
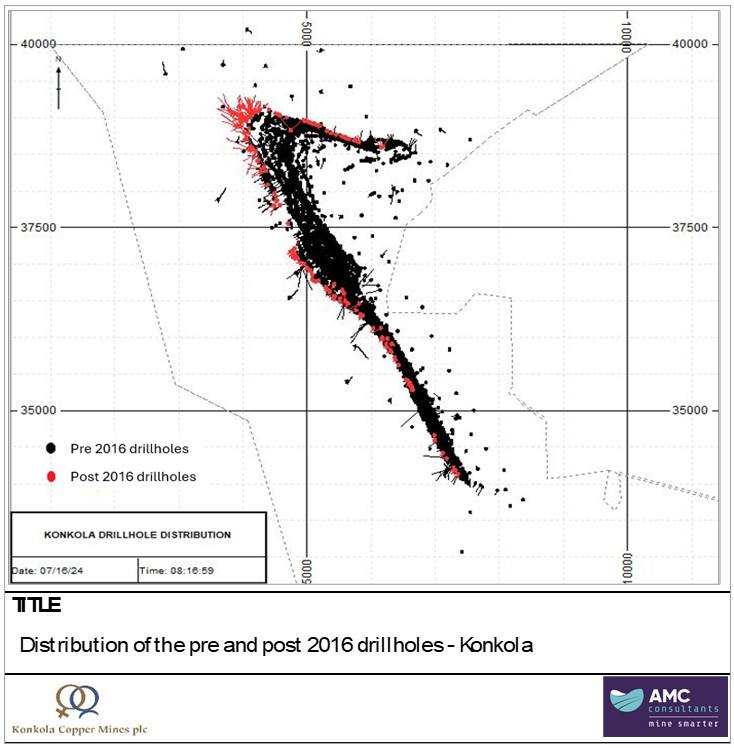
Source: AMC, 2026.
| 11.3.2 | Geological interpretation |
Between 2021 to 2024, the Konkola geology team completed a campaign to improve the structural understanding using underground geological mapping to refine the geological interpretation.
Prior to this, the 2016 geological models captured geological structures like faults with a displacement greater than 20 m. Other structures, such as stope scale faults, were not captured. Structures with less than 20 m displacement have been observed to be critical in the mine performance with respect to short-term mine planning.
Geological mapping and drillhole data were both used in the 2024 interpretation update. The lithological and mineralisation wireframes updated are the bottom of HWA, HWQ, OSU, FWS, PC, AGS, and FWQ including the grade wireframes (AFW and AHW) modelled at 1.0% TCu geological cut-off.
| amcconsultants.com | 130 |
| S-K 1300 TRS: KCM Integrated Operations (Initial Assessment) | |
| Konkola Copper Mines Plc | 0424076 |
With more drilling and geological mapping information acquired, several other fault structures have been defined and added to the geological models that where not present in the 2016 model as shown in Figure 11.4.
Figure 11.4 Plan view comparing differences in 2016 and 2024 interpretation - Konkola
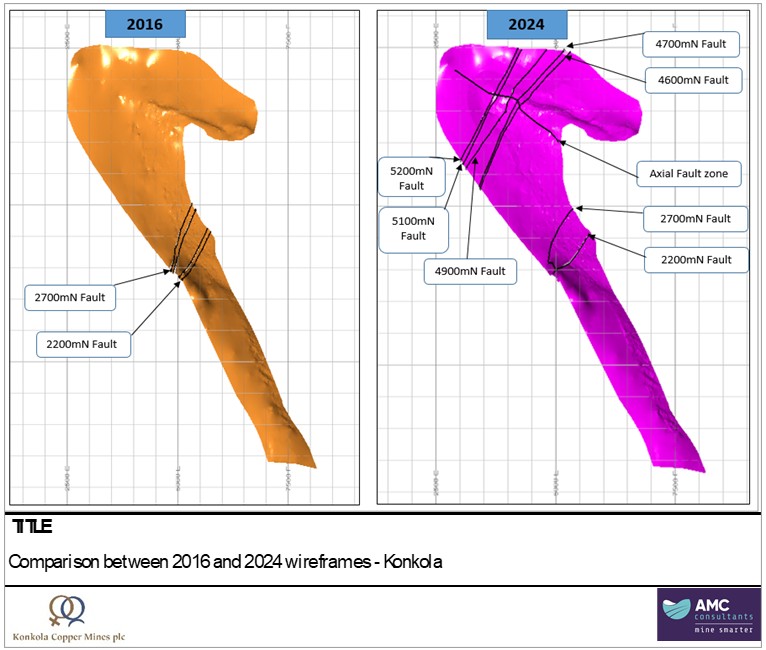
Source: AMC, 2026.
Steps used to update the geological interpretation:
| · | Geological mapping: Detailed structural mapping was carried out of all current faces and data plotted directly into MicroStation software (.dgn format). |
| · | Review of old plans: geological level plans from upper levels were reviewed to confirm the continuity of the faults that have been added to the updated geological interpretation. Where these were confirmed, they were included via scanning and digitising of the geology. Figure 11.5 shows an example of historic geological mapping from the top levels. |
| · | Drillhole logging: data collected from new drillholes was used for interpretation of fault kinematics. |
| · | Geological interpretation: Surpac® version 6.6 was used to update the 2016 geological interpretations surfaces. The 2016 surfaces for each formation were imported into Surpac® and sectioned at either 20 m or 40 m spacings. The strings were updated to honour current mapping and new drillholes. The grade shells (AFW and AHW) interpretation was also updated. |
| amcconsultants.com | 131 |
| S-K 1300 TRS: KCM Integrated Operations (Initial Assessment) | |
| Konkola Copper Mines Plc | 0424076 |
Figure 11.5 Plan view of historic mapping from 1850L - Konkola
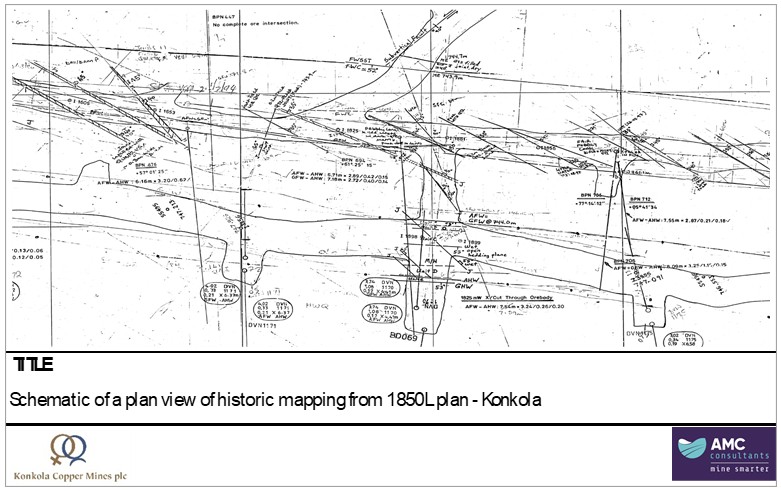
Source: AMC, 2026.
| 11.3.2.1 | Estimation domains |
Grade estimation domains were established in two steps: defining the hangingwall and footwall surfaces and then defining zones of grades continuity along strike (geostatistical stationarity).
| 11.3.2.2 | Definition of hangingwall and footwall surfaces |
The hangingwall and footwall surfaces were defined using a 1% TCu cut-off. Whilst the OSU is typically the host for mineralisation, in some location’s mineralisation is observed extending into the hangingwall and footwall of the OSU. In other instances, the OSU is not mineralised for its entire thickness.
The hangingwall and footwall surfaces were interpreted on section and digitised. The resulting strings were then explicitly modelled to generate the AFW and AHW wireframe surfaces.
Contact analysis of sample intervals on either side of the interpreted boundary illustrates that the contact between the mineralised and non-mineralised sections of the drillhole is a sharp boundary (Figure 11.6). Within the domain, sample grades are typically greater than 1% TCu, and outside of the wireframes, the sample grades drop to 0.3% TCu.
| amcconsultants.com | 132 |
| S-K 1300 TRS: KCM Integrated Operations (Initial Assessment) | |
| Konkola Copper Mines Plc | 0424076 |
Figure 11.6 Contact analysis between non-mineralised and mineralised material - Konkola
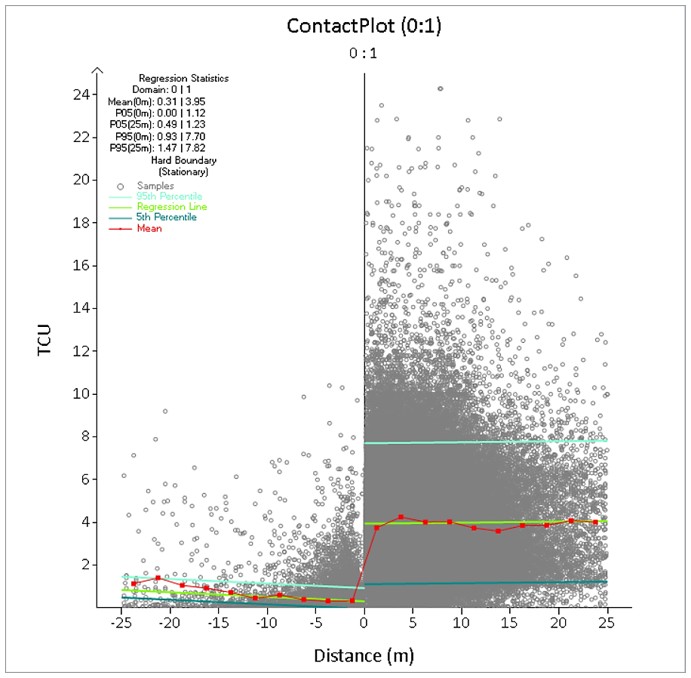
Source: AMC, 2026.
The hangingwall and footwall surfaces shown in Figure 11.7 were used in Datamine® to apply domain codes to the sample intervals. All compositing, exploratory data analysis, and estimations are constrained within this boundary.
| amcconsultants.com | 133 |
| S-K 1300 TRS: KCM Integrated Operations (Initial Assessment) | |
| Konkola Copper Mines Plc | 0424076 |
Figure 11.7 Isometric of hangingwall and footwall constraining surfaces - Konkola
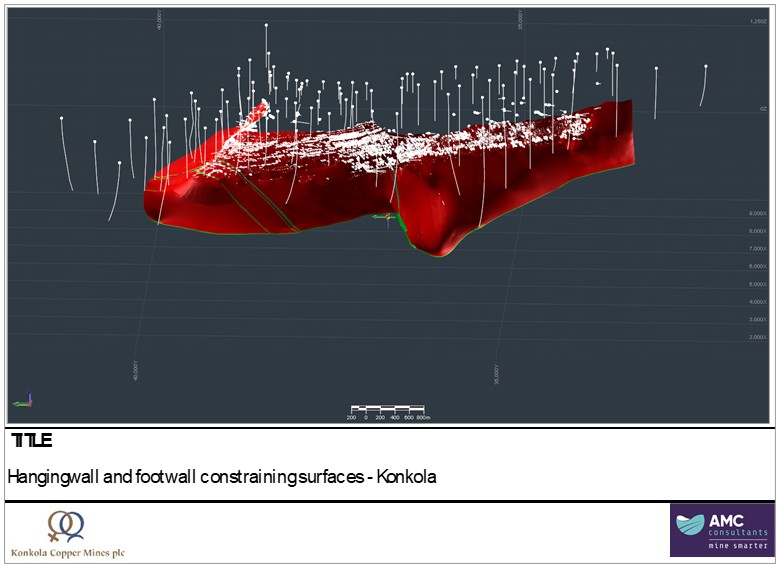
Source: AMC, 2026.
Note: Hangingwall surface in red overlaying the footwall surface in green.
Along strike continuity
As shown in Figure 11.8, visual analysis of the copper grades illustrates the existence of multiple distinct grade populations along strike within the mineralised zone defined by the hangingwall and footwall surfaces. These grade domains are believed to be structurally related features, with both sin and post-mineralisation relationships.
| amcconsultants.com | 134 |
| S-K 1300 TRS: KCM Integrated Operations (Initial Assessment) | |
| Konkola Copper Mines Plc | 0424076 |
Figure 11.8 Plan view of along strike grade continuity - Konkola
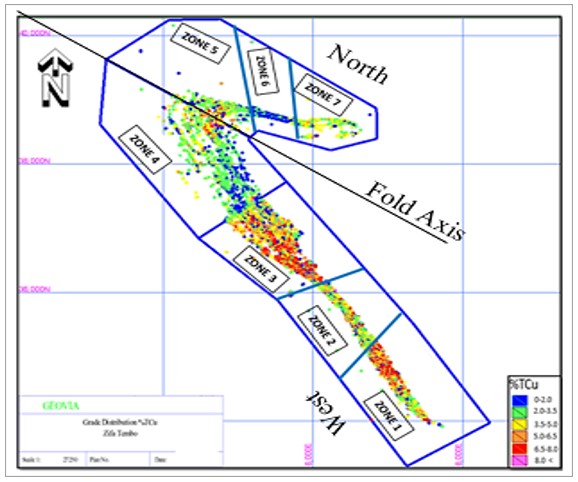
Source: AMC, 2026.
Both box and whisker plots (Figure 11.9) and Q-Q plots (Figure 11.10) support the existence of the lateral grade domains and provide evidence that the domains should be estimated separately to ensure the stationarity needed for ordinary kriging.
Figure 11.9 Box and whisker plot comparing TCu% across seven grade domains - Konkola
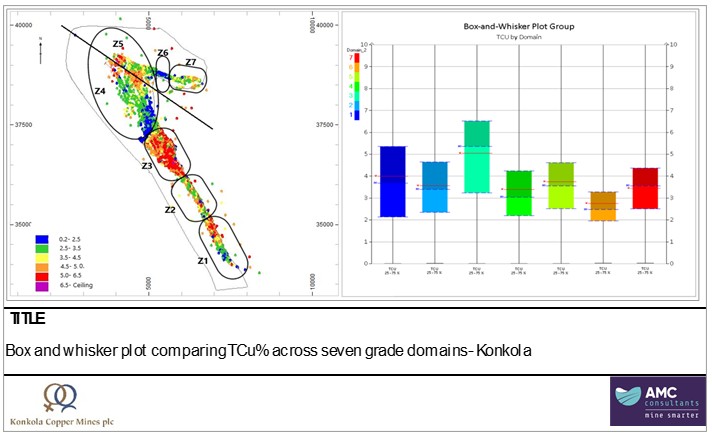
Source: AMC, 2026.
| amcconsultants.com | 135 |
| S-K 1300 TRS: KCM Integrated Operations (Initial Assessment) | |
| Konkola Copper Mines Plc | 0424076 |
Figure 11.10 Q-Q plots comparing TCu% across seven grade domains - Konkola
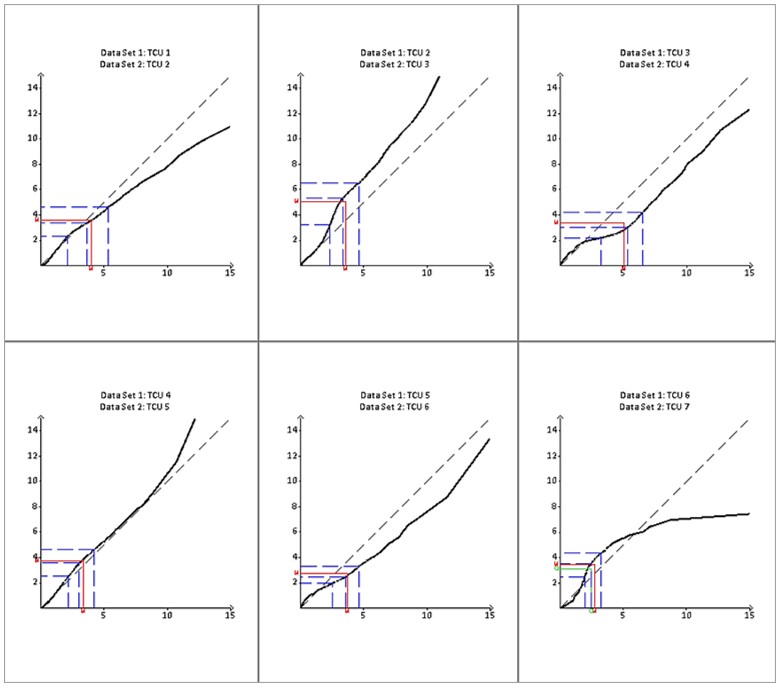
Source: AMC, 2026.
Domains four and five have been split into two separate domains using the fold axis as the domain boundary. These domains share the same grade populations. They have been separated to allow the application of the two structural orientations resulting from the fold hinge.
During grade estimation, some domain boundaries were used to provide hard constraints, while others were used to apply soft constraints, as follows:
| · | Z1/Z2, Z2/Z3, Z4/Z5 = Soft boundary (allow data sharing 50 m inside adjacent zones). |
| · | Z3/Z4, Z5/Z6, Z6/Z7 = Hard boundary (no data sharing allowed between adjacent zones). |
All compositing, exploratory data analysis, and estimation were conducted using these domains as individual estimation domains (Figure 11.11).
| amcconsultants.com | 136 |
| S-K 1300 TRS: KCM Integrated Operations (Initial Assessment) | |
| Konkola Copper Mines Plc | 0424076 |
Figure 11.11 Plan view of block model and composites flagged by domain - Konkola
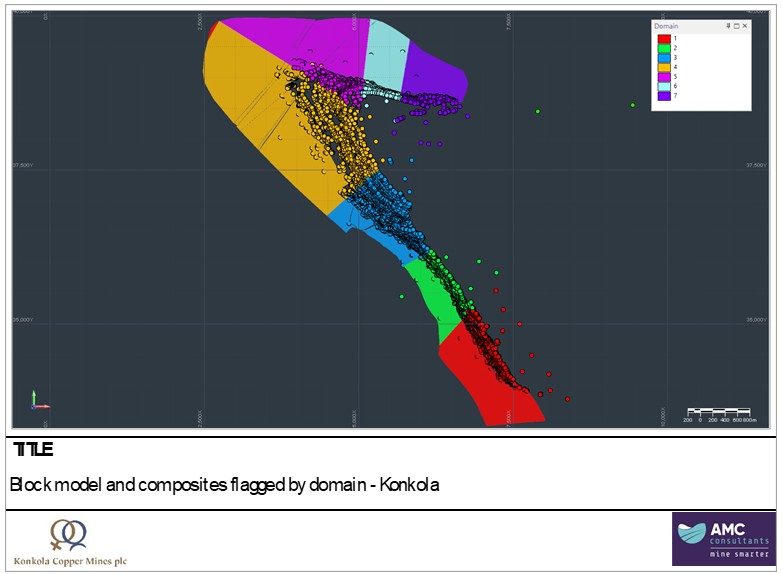
Source: AMC, 2026.
Top-capping analysis of grade was investigated using Supervisor® software. On a domain-by-domain basis, data distributions were considered on the raw composite data to ensure outliers were appropriately controlled during the compositing and estimation process. Top-caps were applied where breaks in the grade distributions were observed (Figure 11.12). The top-caps applied to the composites for the Konkola estimate are outlined as Table 11.3.
| amcconsultants.com | 137 |
| S-K 1300 TRS: KCM Integrated Operations (Initial Assessment) | |
| Konkola Copper Mines Plc | 0424076 |
Figure 11.12 Top-capping analysis - Konkola
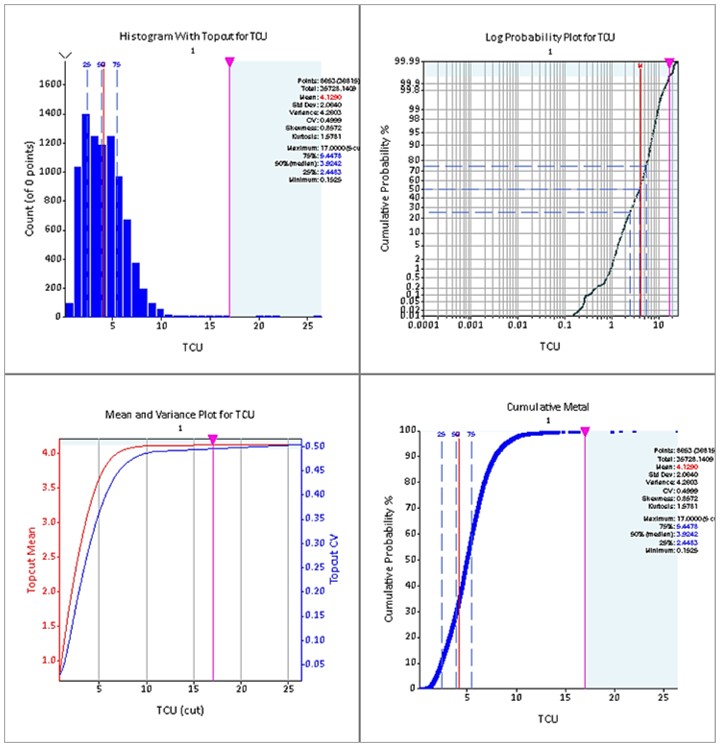
Source: AMC, 2026.
| amcconsultants.com | 138 |
| S-K 1300 TRS: KCM Integrated Operations (Initial Assessment) | |
| Konkola Copper Mines Plc | 0424076 |
Table 11.3 Top-caps - Konkola
| Element | Domain | Capping value | Number of samples cut | Percentile | ||||
| 1 | 17.00 | 5 | 99.90 | |||||
| 2 | 10.00 | 6 | 99.90 | |||||
| 3 | 15.00 | 7 | 99.90 | |||||
| TCu (%) | 4 | 15.00 | 4 | 100 | ||||
| 5 | 11.00 | 8 | 99.80 | |||||
| 6 | 8.00 | 7 | 99.50 | |||||
| 7 | 6.00 | 5 | 99.50 | |||||
| 1 | 8.50 | 6 | 99.90 | |||||
| 2 | 7.00 | 3 | 99.90 | |||||
| 3 | 9.00 | 7 | 99.90 | |||||
| ASCu (%) | 4 | 6.50 | 5 | 99.90 | ||||
| 5 | 7.00 | 4 | 99.90 | |||||
| 6 | 3.00 | 5 | 99.60 | |||||
| 7 | 2.70 | 5 | 99.50 | |||||
| 1 | 0.85 | 5 | 99.90 | |||||
| 2 | 0.60 | 3 | 99.90 | |||||
| 3 | 0.45 | 3 | 100 | |||||
| TCo (%) | 4 | 0.85 | 2 | 100 | ||||
| 5 | 0.73 | 2 | 99.90 | |||||
| 6 | 0.74 | 0 | 100 | |||||
| 7 | 0.50 | 2 | 99.80 |
Source: AMC, 2026.
| 11.3.3 | Statistics and compositing |
The Konkola deposit's sample lengths range from 0.10 m to a maximum of 15.0 m, with a mean of 0.60 m. A composite length sensitivity analysis was completed. The study compares the composites' coefficient of variation (CoV) at various composite lengths.
The results show a decrease in CoV, for both TCu% and ASCu%, at both 1 m and 2 m sample lengths. Due to the laminated and stratiform nature of the mineralisation, which at times can exhibit narrow features, a 1 m composite length was selected.
Descriptive statistics for copper, acid copper and cobalt before and after compositing are presented in Table 11.4.
| amcconsultants.com | 139 |
| S-K 1300 TRS: KCM Integrated Operations (Initial Assessment) | |
| Konkola Copper Mines Plc | 0424076 |
Table 11.4 Descriptive statistics pre- and post-compositing – Konkola
Total Copper
| All | Domain 1 | Domain 2 | Domain 3 | Domain 4 | Domain 5 | Domain 6 | Domain 7 | |||||||||||||||||||||||||||||||||||||||||||||||||||||||||
| Type | Raw | Comp | Raw | Comp | Raw | Comp | Raw | Comp | Raw | Comp | Raw | Comp | Raw | Comp | Raw | Comp | ||||||||||||||||||||||||||||||||||||||||||||||||
| Samp | 60,579 | 36,815 | 13,117 | 8,653 | 7,090 | 4,571 | 15,748 | 9,497 | 13,968 | 8,298 | 6,045 | 3,391 | 2,443 | 1,292 | 2,143 | 1,098 | ||||||||||||||||||||||||||||||||||||||||||||||||
| Min | 0.01 | 0.01 | 0.01 | 0.15 | 0.02 | 0.20 | 0.01 | 0.06 | 0.01 | 0.01 | 0.01 | 0.11 | 0.03 | 0.84 | 0.03 | 0.64 | ||||||||||||||||||||||||||||||||||||||||||||||||
| Max | 49.06 | 27.88 | 30.65 | 26.43 | 18.95 | 14.13 | 30.60 | 27.88 | 23.50 | 21.93 | 41.13 | 19.08 | 49.06 | 22.66 | 10.05 | 8.88 | ||||||||||||||||||||||||||||||||||||||||||||||||
| Avg | 3.99 | 4.09 | 4.00 | 4.13 | 3.57 | 3.65 | 5.05 | 5.19 | 3.39 | 3.45 | 3.75 | 3.76 | 2.76 | 2.74 | 3.44 | 3.49 | ||||||||||||||||||||||||||||||||||||||||||||||||
| SD | 2.22 | 1.97 | 2.37 | 2.08 | 1.78 | 1.50 | 2.49 | 2.13 | 1.77 | 1.64 | 1.92 | 1.53 | 1.55 | 1.17 | 1.35 | 1.08 | ||||||||||||||||||||||||||||||||||||||||||||||||
| CV | 0.56 | 0.48 | 0.59 | 0.50 | 0.50 | 0.41 | 0.49 | 0.41 | 0.52 | 0.47 | 0.51 | 0.41 | 0.56 | 0.43 | 0.39 | 0.31 | ||||||||||||||||||||||||||||||||||||||||||||||||
Acid Soluble Copper
| All | Domain 1 | Domain 2 | Domain 3 | Domain 4 | Domain 5 | Domain 6 | Domain 7 | |||||||||||||||||||||||||||||||||||||||||||||||||||||||||
| Type | Raw | Comp | Raw | Comp | Raw | Comp | Raw | Comp | Raw | Comp | Raw | Comp | Raw | Comp | Raw | Comp | ||||||||||||||||||||||||||||||||||||||||||||||||
| Samp | 60,437 | 36,726 | 13,075 | 8,626 | 7,079 | 4,559 | 15,731 | 9,488 | 13,920 | 8,264 | 6,043 | 3,391 | 2,429 | 1,285 | 2,135 | 1,098 | ||||||||||||||||||||||||||||||||||||||||||||||||
| Min | 0 | 0.01 | 0.01 | 0.01 | 0 | 0.01 | 0.01 | 0.01 | 0.01 | 0.01 | 0.01 | 0.01 | 0.009 | 0.01 | 0.01 | 0.01 | ||||||||||||||||||||||||||||||||||||||||||||||||
| Max | 21.82 | 12.859 | 21.4 | 12.859 | 13.91 | 7.537 | 14 | 12.825 | 12.83 | 12.81 | 18.4 | 7.865 | 21.82 | 8.855 | 5.62 | 5.356 | ||||||||||||||||||||||||||||||||||||||||||||||||
| Avg | 0.441 | 0.446 | 0.62 | 0.61 | 0.316 | 0.31 | 0.448 | 0.468 | 0.333 | 0.34 | 0.561 | 0.539 | 0.302 | 0.285 | 0.245 | 0.227 | ||||||||||||||||||||||||||||||||||||||||||||||||
| SD | 1.02 | 0.915 | 1.278 | 1.093 | 0.822 | 0.721 | 1.128 | 1.071 | 0.717 | 0.647 | 1.073 | 0.884 | 0.693 | 0.489 | 0.51 | 0.443 | ||||||||||||||||||||||||||||||||||||||||||||||||
| CV | 2.311 | 2.051 | 2.06 | 1.793 | 2.603 | 2.323 | 2.519 | 2.288 | 2.155 | 1.902 | 1.914 | 1.638 | 2.291 | 1.717 | 2.079 | 1.955 | ||||||||||||||||||||||||||||||||||||||||||||||||
Total Cobalt
| All | Domain 1 | Domain 2 | Domain 3 | Domain 4 | Domain 5 | Domain 6 | Domain 7 | |||||||||||||||||||||||||||||||||||||||||||||||||||||||||
| Raw | Comp | Raw | Comp | Raw | Comp | Raw | Comp | Raw | Comp | Raw | Comp | Raw | Comp | Raw | Comp | |||||||||||||||||||||||||||||||||||||||||||||||||
| Samp | 59,009 | 36,084 | 12,838 | 8,470 | 7,009 | 4,522 | 15,418 | 9,323 | 13,832 | 8,236 | 5,841 | 3,309 | 2,379 | 1,265 | 1,670 | 946 | ||||||||||||||||||||||||||||||||||||||||||||||||
| Min | 0.00 | 0.00 | 0.00 | 0.01 | 0.00 | 0.00 | 0.00 | 0.00 | 0.00 | 0.00 | 0.00 | 0.00 | 0.01 | 0.01 | 0.00 | 0.01 | ||||||||||||||||||||||||||||||||||||||||||||||||
| Max | 1.49 | 1.02 | 0.99 | 0.96 | 0.99 | 0.92 | 0.88 | 0.55 | 1.49 | 1.02 | 0.90 | 0.85 | 0.84 | 0.74 | 0.76 | 0.57 | ||||||||||||||||||||||||||||||||||||||||||||||||
| Avg | 0.08 | 0.08 | 0.12 | 0.12 | 0.07 | 0.06 | 0.04 | 0.04 | 0.08 | 0.08 | 0.08 | 0.08 | 0.12 | 0.12 | 0.07 | 0.07 | ||||||||||||||||||||||||||||||||||||||||||||||||
| SD | 0.10 | 0.09 | 0.14 | 0.12 | 0.08 | 0.07 | 0.04 | 0.04 | 0.09 | 0.08 | 0.10 | 0.09 | 0.10 | 0.10 | 0.09 | 0.08 | ||||||||||||||||||||||||||||||||||||||||||||||||
| CV | 1.31 | 1.17 | 1.20 | 1.03 | 1.18 | 1.03 | 1.20 | 1.04 | 1.13 | 0.99 | 1.28 | 1.14 | 0.88 | 0.80 | 1.23 | 1.09 | ||||||||||||||||||||||||||||||||||||||||||||||||
Source: AMC, 2026.
| amcconsultants.com | 140 |
| S-K 1300 TRS: KCM Integrated Operations (Initial Assessment) | |
| Konkola Copper Mines Plc | 0424076 |
| 11.3.3.1 | Variography |
Nugget effect was interpreted using downhole variograms for each domain and element of interest. Experimental downhole variograms were generated using 1 m composite lengths. Downhole variogram models were then generated to estimate the vertical intercepts of the model, which was set as the nugget effect for each variogram.
Directional variograms were generated for copper, acid-soluble copper and cobalt within each domain using top-cap 1 m composites. Within Supervisor®, directions were established for horizontal, across-strike and dip-plane orientations using directional continuity maps. Semi variogram models were generated for the major, semi major and minor orientations, using a range of angular tolerances and lag distanced to best interpret the experimental semi-variogram, as demonstrated in Figure 11.14.
Figure 11.13 Experimental semi-variogram model for TCu% - Domain 5 - Konkola
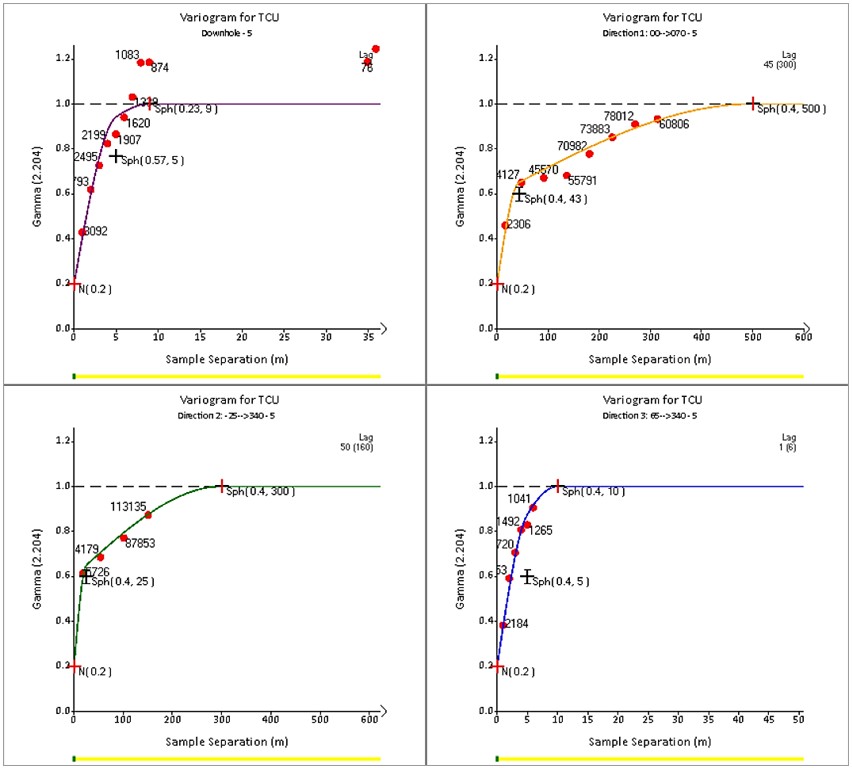
Source: AMC, 2026.
The resulting semi-variogram models were set to the Datamine® software orientation and exported as Datamine® variogram control files. Table 11.5 outlined the variogram parameters used in the estimation of the Konkola resource estimate. The author notes the maximum range of continuity for the copper domains is 60 to 725 m.
| amcconsultants.com | 141 |
| S-K 1300 TRS: KCM Integrated Operations (Initial Assessment) | |
| Konkola Copper Mines Plc | 0424076 |
Table 11.5 Variogram models - Konkola
| Structure 1 | Structure 2 | |||||||||||||||||||
| Element | Domain | Nugget | Sill | Major (m) | Semi Major (m) | Minor (m) | Sill | Major (m) | Semi Major (m) | Minor (m) | ||||||||||
| 1 | 0.15 | 0.64 | 15.0 | 10.0 | 8.0 | 0.21 | 150.0 | 50.0 | 15.0 | |||||||||||
| 2 | 0.20 | 0.64 | 20.0 | 10.0 | 4.0 | 0.18 | 150.0 | 120.0 | 8.0 | |||||||||||
| 3 | 0.10 | 0.74 | 20.0 | 17.0 | 3.0 | 0.16 | 300.0 | 150.0 | 8.0 | |||||||||||
| TCu | 4 | 0.10 | 0.53 | 40.0 | 35.0 | 10.0 | 0.37 | 220.0 | 180.0 | 25.0 | ||||||||||
| 5 | 0.20 | 0.40 | 43.0 | 25.0 | 5.0 | 0.40 | 500.0 | 300.0 | 10.0 | |||||||||||
| 6 | 0.10 | 0.33 | 25.0 | 25.0 | 4.0 | 0.57 | 725.0 | 650.0 | 20.0 | |||||||||||
| 7 | 0.20 | 0.54 | 11.0 | 18.0 | 2.0 | 0.26 | 60.0 | 50.0 | 15.0 | |||||||||||
| 1 | 0.15 | 0.66 | 25.0 | 10.0 | 15.0 | 0.19 | 200.0 | 40.0 | 25.0 | |||||||||||
| 2 | 0.15 | 0.67 | 10.0 | 10.0 | 6.0 | 0.18 | 100.0 | 70.0 | 15.0 | |||||||||||
| 3 | 0.15 | 0.55 | 60.0 | 60.0 | 10.0 | 0.30 | 325.0 | 200.0 | 15.0 | |||||||||||
| ASCu | 4 | 0.15 | 0.61 | 45.0 | 15.0 | 5.0 | 0.24 | 165.0 | 100.0 | 15.0 | ||||||||||
| 5 | 0.20 | 0.44 | 22.0 | 20.0 | 5.0 | 0.36 | 300.0 | 125.0 | 18.0 | |||||||||||
| 6 | 0.10 | 0.59 | 20.0 | 15.0 | 4.0 | 0.31 | 225.0 | 150.0 | 20.0 | |||||||||||
| 7 | 0.15 | 0.44 | 17.0 | 15.0 | 7.0 | 0.41 | 45.0 | 45.0 | 20.0 | |||||||||||
| 1 | 0.20 | 0.62 | 15.0 | 10.0 | 15.0 | 0.18 | 90.0 | 40.0 | 20.0 | |||||||||||
| 2 | 0.20 | 0.46 | 25.0 | 10.0 | 4.0 | 0.35 | 150.0 | 140.0 | 8.0 | |||||||||||
| 3 | 0.10 | 0.60 | 22.0 | 30.0 | 10.0 | 0.30 | 260.0 | 360.0 | 15.0 | |||||||||||
| TCo | 4 | 0.20 | 0.50 | 10.0 | 20.0 | 5.0 | 0.30 | 150.0 | 150.0 | 30.0 | ||||||||||
| 5 | 0.20 | 0.35 | 80.0 | 25.0 | 3.0 | 0.45 | 190.0 | 230.0 | 6.0 | |||||||||||
| 6 | 0.20 | 0.52 | 9.0 | 20.0 | 2.0 | 0.29 | 110.0 | 50.0 | 7.0 | |||||||||||
| 7 | 0.10 | 0.57 | 35.0 | 35.0 | 3.0 | 0.33 | 150.0 | 150.0 | 12.0 | |||||||||||
| 11.3.4 | Block model and estimation parameters |
The block model has an origin of easting 1,900 m, northing 31,500 m, and vertical -700 m. The parent block dimensions are 20 m in the easting and northing and directions and 2 m in the vertical, see Table 11.6. The thin vertical cell is to allow for the preservation of the laminated nature of the mineralisation.
Table 11.6 Block model origin and extents
| Direction | Origin (m) | Parent block size (m) |
Number of parent blocks |
Model extent (m) |
Minimum sub block size (m) | |||||
| Easting (m) | 1,900 | 20 | 350 | 8,900 | 5 | |||||
| Northing (m) | 31,500 | 20 | 475 | 41,000 | 5 | |||||
| Rl (m) | -700 | 2 | 2,200 | 3,700 | 1 |
The primary surfaces used in the initial stages of the block model generation are those of the hangingwall and footwall of the mineralisation (AHW and AFW) and the hangingwall and footwall of the OSU. These surfaces were assigned to the block model with an “Asscode” of 1 within the mineralisation surfaces and a “rock code” of 20. These two units were assigned to the block model using a sub-blocking technique to preserve the volume of the estimated units. The minimum sub-block sizes 5 m in the easting and northing and 1 m in the vertical direction.
The remainder of the stratigraphic sequence was applied to the model at a parent block level (no sub-blocking) using the stratigraphic sequence outlined in Table 11.7. The use of the parent blocks to flag the remaining stratigraphic sequence was to reduce the overall size of the model.
| amcconsultants.com | 142 |
| S-K 1300 TRS: KCM Integrated Operations (Initial Assessment) | |
| Konkola Copper Mines Plc | 0424076 |
Table 11.7 Lithology codes in block model - Konkola
| Description | Code | ROCK | ||
| Dolomite | DOL | |||
| Shale with Grit | SWG | 8 | ||
| Hangingwall aquifer | HWA | 9 | ||
| Hangingwall quartzite | HWQ | 10 | ||
| Ore Shale Unit | OSU | 20 | ||
| Footwall conglomerate | FWC | |||
| Footwall sandstone | FWS | 30 | ||
| Pours Conglomerate | PC | 40 | ||
| Argillaceous Sandstone | AGS | 50 | ||
| Footwall Quartzite | FWQ | 60 | ||
| Basal Conglomerate | BC | 70 |
The model is also flagged with:
| · | Mined – 0 = Mined, 1 = In situ |
| · | Dwater – 0 = not dewatered, 1 = dewatered |
| · | Ozone – 111 = ore |
| · | Topo – Proportion of block above topography |
| · | Class – Resource classification (1=Measured, 2=Indicated, and 3=Inferred) |
| 11.3.4.1 | Estimation parameters |
Grade estimated into the blocks was interpolated using Ordinary Kriging. During estimation, dynamic anisotropy was implemented which makes use of the orientation of the geology represented by the wireframe triangles or strings and allows the interpolation of the local strike and dip into each of the blocks in the model. These angles are then used to orientate the search ellipsoid to the individual block strike and dip during the kriging estimation process.
The estimation was done in three stages with the condition that only a maximum of three samples could be selected from each drillhole.
| · | Pass 1: Blocks estimated within the first search volume (SVOL1) with minimum and maximum number of samples of nine and 12. |
| · | Pass 2: The blocks not estimated within the first search (SVOL1) were estimated using second search volume (SVOL2) twice the search radius while maintaining the same number of samples as used in pass 1. |
| · | Pass 3: Blocks still un-estimated after the second search (SVOL2), were then estimated using a third search (SVOL3) with the minimum number of samples. |
The kriged estimate utilises a locally varying anisotropic (LVA) search within Datamine®. The process assigns the geological trend of the footwall surface to the Datamine® model. During the estimation, the search ellipse defined by the variograms is rotated to conform with the structural trend of the project. The use of LVA is a common technique for ensuring the geological trend is honored in dipping stratiform deposits.
| 11.3.4.2 | Bulk density |
The bulk density values assigned are from the historical and current studies. Table 11.8 shows the bulk density value and the rock code assigned to each lithology assigned in the block model.
| amcconsultants.com | 143 |
| S-K 1300 TRS: KCM Integrated Operations (Initial Assessment) | |
| Konkola Copper Mines Plc | 0424076 |
Table 11.8 Bulk density by lithology - Konkola
| Lithology | Bulk density (t/m3) | Rock code | ||
| HWA | 2.58 | 9 | ||
| HWQ | 2.61 | 10 | ||
| OSU | 2.68 | 20 | ||
| FWS | 2.56 | 30 | ||
| PC | 2.56 | 40 | ||
| AGS | 2.56 | 50 | ||
| FWQ | 2.56 | 60 | ||
| BC | 2.56 | 70 |
| 11.3.5 | Block model validation |
Three separate methods have been applied to validate the block model, they are swath plots, visual validation and statistical analysis.
| 11.3.5.1 | Swath plots |
Swather plots have been conducted domain-by-domain comparing the trends of the modelled estimates and input composites. A good correlation between input composites and estimated values is observed in the Measured and Indicated, as shown in Figure 11.15 and Figure 11.16.
| amcconsultants.com | 144 |
| S-K 1300 TRS: KCM Integrated Operations (Initial Assessment) | |
| Konkola Copper Mines Plc | 0424076 |
Figure 11.14 Swath plots Measured and Indicated TCu% Domain 1 - Konkola
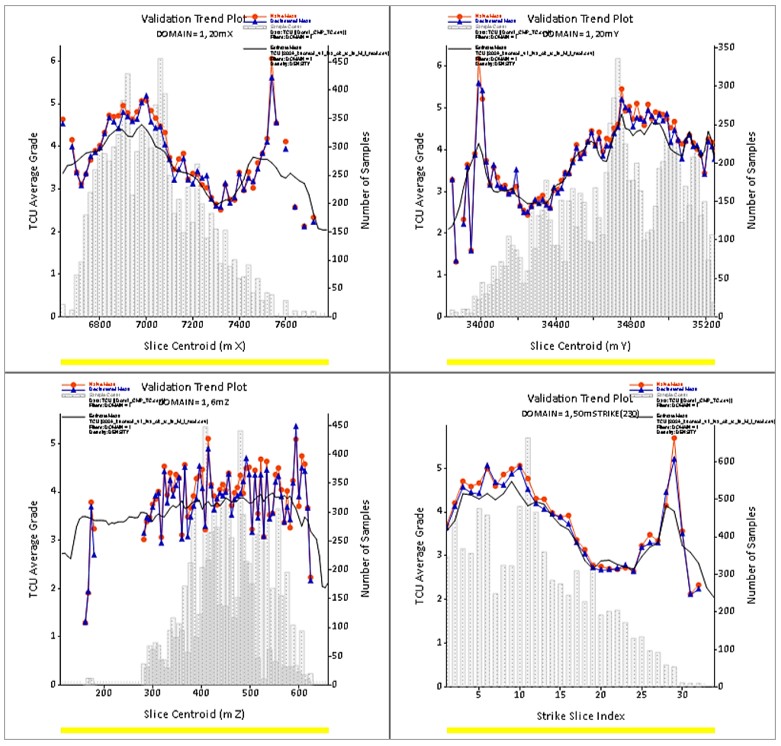
Source: AMC, 2026.
| amcconsultants.com | 145 |
| S-K 1300 TRS: KCM Integrated Operations (Initial Assessment) | |
| Konkola Copper Mines Plc | 0424076 |
Figure 11.15 Swath plots Measured and Indicated TCu% Domain 2 - Konkola
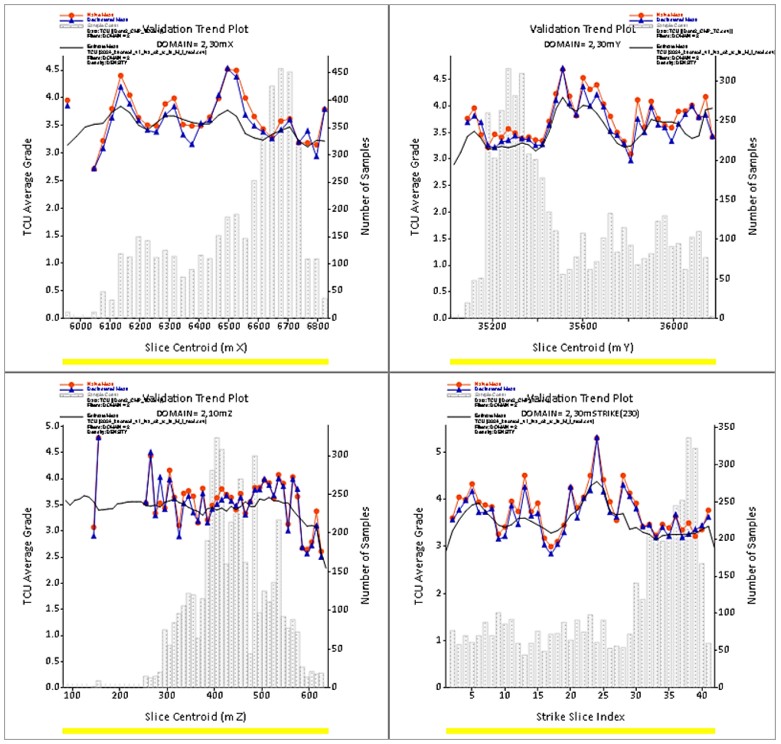
Source: AMC, 2026.
The correlation in the Inferred areas of the resource is far less robust, indicating the drillhole spacing used for the Inferred material is inappropriate for the classification. This observation is consistent with the variography, which illustrates materials are classified as Inferred outside the variogram ranges, which indicates there is no correlation between sample pairs.
| 11.3.5.2 | Visual validation |
Estimated block grades were validated visually by comparing them to sample data. Visual inspection assisted in validating the grade variations observed in the samples (high- and low-grades). A good correlation between input composites and estimated block values is shown in Figure 11.18.
| amcconsultants.com | 146 |
| S-K 1300 TRS: KCM Integrated Operations (Initial Assessment) | |
| Konkola Copper Mines Plc | 0424076 |
Figure 11.16 Cross sections comparing composite intervals and block model grades - Konkola
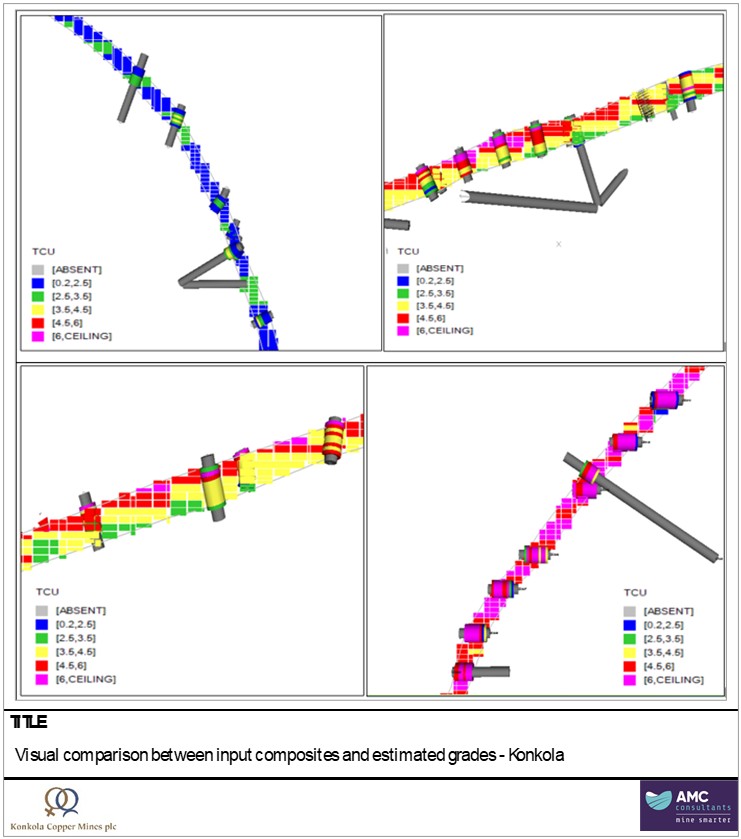
Source: AMC, 2026.
| 11.3.5.3 | Statistical validation |
The statistics of the capped composites were compared to OK estimates in the block model. As observed in Table 11.9. The mean of the composites compared well with the estimates within all zones having an OK / DH (%) difference of not more than 10% which is acceptable. Zone 1 gave the highest percent difference due to the low-grade samples towards the south end of Zone 1 that lowered the grade of the estimates. Zone 1 gave the highest per cent difference due to the low-grade samples towards the south end of Zone 1, which lowered the grade of the estimates. However, these low-grade samples could not be analysed separately as the sample size would not have been enough for statistical and geostatistical work.
| amcconsultants.com | 147 |
| S-K 1300 TRS: KCM Integrated Operations (Initial Assessment) | |
| Konkola Copper Mines Plc | 0424076 |
Table 11.9 Statistical comparison of composite and estimated values for TCu% - Konkola
| Composite (DH) | OK | OK/DH | ||||||||||||||||||||
| Domain | Nsam | Min | Max | Mean | SD | Nblocks | Min | Max | Mean | SD | (%) Diff | |||||||||||
| 1 | 9,010 | 0.15 | 17 | 4.1 | 2.04 | 181,432 | 1.38 | 9.5 | 3.67 | 1.21 | -10 | |||||||||||
| 2 | 4,571 | 0.2 | 10 | 3.65 | 1.49 | 88,942 | 1.54 | 6.42 | 3.48 | 0.68 | -5 | |||||||||||
| 3 | 9,492 | 0.06 | 15 | 5.18 | 2.11 | 177,402 | 1.53 | 9.76 | 4.69 | 1.11 | -9 | |||||||||||
| 4 | 8,241 | 0.01 | 15 | 3.44 | 1.61 | 423,032 | 1.09 | 11.04 | 3.44 | 1.1 | 0 | |||||||||||
| 5 | 3,376 | 0.11 | 11 | 3.76 | 1.48 | 132,776 | 1.67 | 7.14 | 4.03 | 0.93 | 7 | |||||||||||
| 6 | 1,292 | 0.84 | 8 | 2.72 | 1.01 | 43,105 | 1.48 | 4.36 | 2.57 | 0.5 | -6 | |||||||||||
| 7 | 1,098 | 0.64 | 6 | 3.48 | 1.06 | 66,236 | 1.84 | 5.04 | 3.62 | 0.54 | 4 | |||||||||||
Figure 11.17 Plan view of the Mineral Resource classification - Konkola
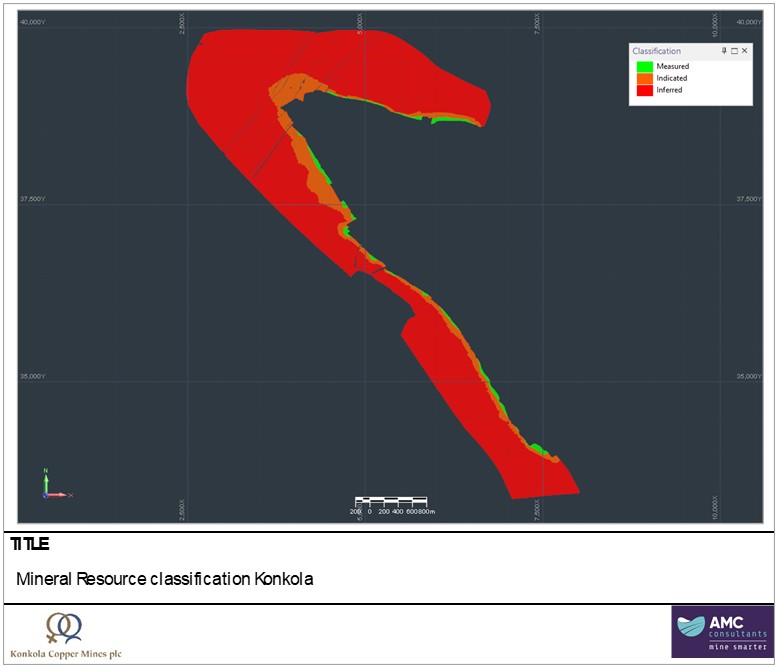
Source: AMC, 2026.
| amcconsultants.com | 148 |
| S-K 1300 TRS: KCM Integrated Operations (Initial Assessment) | |
| Konkola Copper Mines Plc | 0424076 |
| 11.3.6 | Classification criteria |
The Konkola is an established operation with a history of production since 1957. The economic outcomes described within the report underpin support for the eventual economic extraction.
The Mineral Resource classification criteria and cut-off grade are based on:
| · | Geological and grade continuity |
| · | Drill data density and spacing |
| · | Data quality |
| · | Estimation quality |
| · | Mining and production history |
A drillhole spacing study developed at site in 2019 is the basis for the general classification outlines. This is a conditional simulation technique to determine the optimal drilling spacing for Measured and Indicated. The study concluded that a drillhole spacing of 50 m by 25 m can be used for Measured classification and 150 m by 200 m can be used for an Indicated classification.
Parent blocks with an average distance of 50 m to a drillhole are classified as Measured and those with an average of 150 m to a drillhole are classified as Indicated. Resources with an average distance of more than 150 m and above the shaft bottom are classified as Inferred.
Where parent blocks are than 150 m below the base of mining in mineralisation (in ore development) and classified as Inferred the classification has been upgraded to Indicated. This gives in ore development the same weight as a drillhole.
It is noted that the average distance to sample support for the Inferred Resources varies from several hundred meters to approximately 1,700 m (Figure 11.20). Analysis of the ranges of the variograms shows a maximum range of 750 m, outside which correlation between sample points cannot be demonstrated.
A geological cut-off grade for the Mineral Resource of 1.1% TCu has been derived using a metal price of US$10,000/t Cu, in conjunction with typical historic mining modifying factors and concept level mine designs. For further information see Section 13 to Section 19.
Figure 11.18 Isometric of the average distance to sample support – Konkola
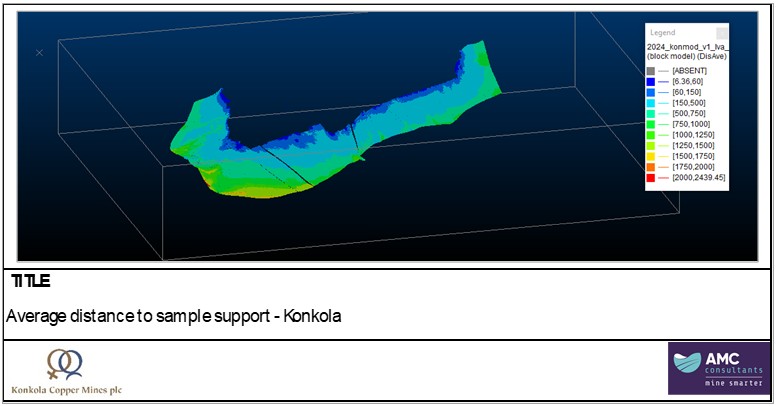
Source: AMC, 2026.
| amcconsultants.com | 149 |
| S-K 1300 TRS: KCM Integrated Operations (Initial Assessment) | |
| Konkola Copper Mines Plc | 0424076 |
| 11.3.7 | Mineral Resource uncertainty |
Mineral Resources are not Mineral Reserves and do not necessarily demonstrate economic viability. There is no certainty that all or any part of this Mineral Resource will be converted into Mineral Reserve.
The Konkola Mineral Resource is classified as a Measured, Indicated, and Inferred Mineral Resource.
Mineral Resource estimates may be materially affected by the quality of data, natural geological variability of mineralisation, metallurgical recovery, and the accuracy of the economic assumptions supporting reasonable prospects for economic extraction including metal prices, and mining and processing costs.
The classification of Inferred, with the wide drill data spacing, is supported via a good understanding of the geological and grade continuity observed from drilling and the extensive mining history.
The upgrade in the classification of the Mineral Resource from Inferred through to Measured represents an increased understanding of the items that materially impact geological variability. This results in minimisation of uncertainty and reduced risk.
Resource classification upgrades are achieved through increasing geological understanding by reducing the drillhole spacing, for Konkola this will come from the planned resource infill and extension drilling programs, for more detail see Section 23.
| 11.3.8 | Mineral Resource Estimate |
The Mineral Resource estimate (using a 1.1% TCu
cut-off grade) for the Konkola Mine is shown in
Table 11.10. The Mineral Resource classification considers drillhole spacing studies, data quality, structural and lithological continuity,
and estimation confidence. The 2024 Mineral Resource has been depleted for production to the effective date of 1 April 2026.
Table 11.10 Mineral Resource Konkola Mine – 1 April 2026
| Classification | Cut-off TCu% | Tonnes (Mt) | TCu% | ASCu% | Cu (kt) | TCo% | Co (kt) | |||||||
| Measured | 1.1 | 4.1 | 3.46 | 0.80 | 140 | 0.08 | 3 | |||||||
| Indicated | 1.1 | 34.6 | 3.72 | 0.46 | 1,289 | 0.07 | 24 | |||||||
| Measured + Indicated | 38.7 | 3.70 | 0.50 | 1,430 | 0.07 | 27 | ||||||||
| Inferred | 1.1 | 249.4 | 3.35 | 0.65 | 8,353 | 0.06 | 150 | |||||||
| Total | 288.0 | 3.40 | 0.63 | 9,783 | 0.06 | 177 |
Notes:
| · | Mineral Resources are reported with an effective date of 1 April 2026. |
| · | No Mineral Reserves are declared as part of this Initial Assessment. Mineral Resources are reported in their entirety. |
| · | Classification in accordance with S-K 1300. |
| · | Approximately 86% of Konkola Mineral Resources are classified as Inferred (249 Mt of 288 Mt). Inferred Mineral Resources are considered too speculative geologically to be categorised as Mineral Reserves at this time, and there is no certainty that Inferred Mineral Resources will be converted to higher confidence categories with additional exploration. |
| · | A geological cut-off grade of 1.1% TCu has been derived using a metal price of US$10,000/t Cu, in conjunction with typical historic mining modifying factors and concept-level mine designs. |
| · | Point of reference: In situ material. |
| · | Metallurgical recovery — Konkola Mine: Concentrator 86.5% Cu (Full Resource Case life-of-mine average; M&I Case 89.2%), 60% Co; Smelter 98.1% Cu, 30% Co; Concentrate Payable Cu 96.8%. |
| · | Processing route: Konkola Concentrator → Nchanga Smelter → Nkana Refinery. |
| · | Tonnage and grade are rounded; this may result in minor computational discrepancies. |
| · | Mineral Resources are 100% attributable to KCM. |
| amcconsultants.com | 150 |
| S-K 1300 TRS: KCM Integrated Operations (Initial Assessment) | |
| Konkola Copper Mines Plc | 0424076 |
| 11.4 | Nchanga assets |
Mineralisation at Nchanga is predominately hosted within two major units, the UOB and the LOB. While there has been significant historic and recent open pit mining there has been less recent underground mining. Many of the assets at Nchanga have downdip extensions and are being assessed in studies for transition to underground mining.
The UOB mineralisation is a stratiform type of mineralisation whose main host rock is the TFQ with some of the mineralisation extending into adjacent UBS formation on the hangingwall and BSSU on the footwall.
The UOB contains both copper and cobalt mineralisation for which the grades have been interpreted and estimated separately.
Mineralisation of the LOB is not continuous and occurs in isolated locations throughout the mining license separated by barren gaps and basement highs. Each isolated LOB deposit has been interpreted and estimated separately. Unlike the UOB, the LOB has very low cobalt grades and in some assets, cobalt is not estimated. LOB is key unit of interest at COP DF and COP E Ext.
Nchanga assets also include tailings dams TD03, TD04, and TD05.
| 11.4.1 | Chingola open pit D and F (COP DF) |
Both COP D and COP F are tabular and with dips ranging from 35° to 40°, with the majority of the mineralisation occurring in the ARK.
Mining at Chingola open pit D (COP D) and Chingola open pit F (COP F) commenced in 2004. Mining has been via open pit with the transition to underground mining part of recent mining studies. Open pit mining is ongoing.
The COP DF resource block model was last updated in 2014, subsequent updates are due to depletion from production.
| 11.4.1.1 | Data |
There are 455 drillholes in the COP DF geological database. Most of the holes were drilled in the 1980’s. Between 2007 and 2010, 138 holes were drilled. There is no QAQC data for either generation of drillholes.
The drillhole spacing varies from 50 m by 50 m, to 30 m by 30 m, to closer spacing of 15 m by 15 m, see the drillhole location plan in Figure 11.21.
| amcconsultants.com | 151 |
| S-K 1300 TRS: KCM Integrated Operations (Initial Assessment) | |
| Konkola Copper Mines Plc | 0424076 |
Figure 11.19 Drillhole location plan – COP DF
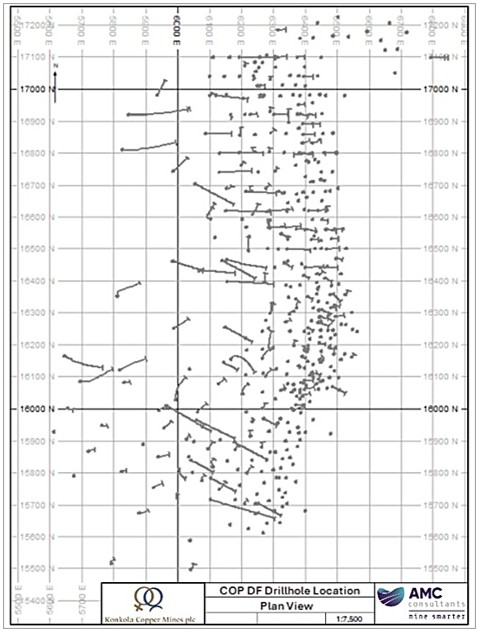
Source: AMC, 2026.
| 11.4.1.2 | Geological interpretation and generation of 3D representation |
COP F is comprised of mixed oxide and sulfide copper minerals extending to a depth of approximately 100 m before transitioning to dominantly sulfide minerals. COP D oriented east-west is the dominant mineralisation thicker with more grade and containing mixed oxides and sulfides at depth.
Wireframes of the 3D geological interpretation were constructed from 60 m space cross section strings, where the strings were snapped to the drillholes. The mineralisation interpretation was defined based on a minimum geological cut-off of 0.5% TCu. Internal waste less than 5 m vertical thickness was included in the mineralisation interpretation.
Strings were wireframed to form a solid which was used for sample selection and generation of the block model.
| 11.4.1.3 | Statistics and compositing |
Drillhole intervals within the 3D geological interpretation wireframes were composited to 2.5 m, see Table 11.11.
| amcconsultants.com | 152 |
| S-K 1300 TRS: KCM Integrated Operations (Initial Assessment) | |
| Konkola Copper Mines Plc | 0424076 |
Table 11.11 Descriptive statistics for COP DF composited samples
| Project area | Variable | TCu% | ASCu% | TCo% | ASCo% | |||||
| Count | 2,901 | 2,842 | 2,725 | 2,390 | ||||||
| Minimum | 0.06 | 0.00 | 0.00 | 0.00 | ||||||
| Maximum | 6.95 | 4.45 | 2.29 | 0.52 | ||||||
| COP D | Mean | 1.37 | 0.44 | 0.06 | 0.01 | |||||
| Std. Dev. | 0.93 | 0.57 | 0.11 | 0.03 | ||||||
| Coeff. Var. | 0.67 | 1.30 | 1.95 | 2.25 | ||||||
| Count | 897 | 876 | 715 | 685 | ||||||
| Minimum | 0.00 | 0.00 | 0.00 | 0.00 | ||||||
| COP F | Maximum | 17.06 | 9.21 | 0.40 | 0.34 | |||||
| Mean | 2.21 | 0.65 | 0.04 | 0.01 | ||||||
| Std. Dev. | 2.31 | 1.00 | 0.05 | 0.02 | ||||||
| Coeff. Var. | 1.04 | 1.54 | 1.12 | 1.74 |
COP F sample interval mean value is higher than for COP D for TCu%. The COP D coefficient of variation (standard deviation divided by the mean) indicates stronger grade continuity for COP D than COP F which has a coefficient of variation of 1.04. The coefficient of variation for COP D cobalt at around two indicates less continuity and more complexity in the estimation.
Omi-directional variograms were generated using the 2.5 m composites. Variogram models are shown in Table 11.12.
Table 11.12 Variogram models – COP DF
| Structure 1 | ||||||||||||||||
| Location | Element | Nugget | Sill | Major (m) | Semi Major (m) | Minor (m) | Rotation Angle Z | Rotation Angle Y | ||||||||
| TCu% | 0.5168 | 0.3636 | 71.8 | 71.8 | 7.5 | 258 | 45 | |||||||||
| COP D | ASCu% | 0.0237 | 0.0234 | 78.4 | 78.4 | 7.5 | 258 | 45 | ||||||||
| TCo% | 0.0029 | 0.0014 | 102.0 | 102.0 | 7.5 | 258 | 45 | |||||||||
| ASCo% | 0.0002 | 0.0004 | 164.0 | 164.0 | 7.5 | 258 | 45 | |||||||||
| TCu% | 1.6860 | 3.8980 | 136.8 | 136.8 | 7.5 | 258 | 45 | |||||||||
| COP F | ASCu% | 0.5403 | 0.3746 | 133.6 | 133.6 | 7.5 | 258 | 45 | ||||||||
| TCo% | 0.0001 | 0.0014 | 208.1 | 208.1 | 7.5 | 258 | 45 | |||||||||
| ASCo% | 0.0000 | 0.0000 | 85.4 | 85.4 | 7.5 | 258 | 45 | |||||||||
| 11.4.1.4 | Block model and estimation parameters |
The parent block dimensions are 30 m in the easting and northing directions and 5 m in the vertical direction (Table 11.13). The narrow vertical dimension is to allow for the preservation of the laminated nature of the mineralisation.
Table 11.13 Block model origin and extents – COP DF
| Direction | Origin (m) | Parent block size (m) | Number of parent blocks | Model extent (m) | Minimum sub block size (m) | |||||
| Easting (m) | 4,110 | 30 | 136 | 4,080 | NA | |||||
| Northing (m) | 13,980 | 30 | 135 | 4,050 | NA | |||||
| Rl (m) | -392 | 5 | 165 | 825 | NA |
| amcconsultants.com | 153 |
| S-K 1300 TRS: KCM Integrated Operations (Initial Assessment) | |
| Konkola Copper Mines Plc | 0424076 |
Wireframes for each lithology were filled with blocks. This also included the Upper Banded Shale to define the upper hangingwall and below the basement surface to the bottom of the block model. Block models for each lithology were stamped with the lithology code and combined into one block model. Mineralisation is represented by the 0.5% TCu wireframe which was filled with blocks and added over the lithological block models.
The grades for TCu%, ASCu%, TCo%, and ASCo% were estimated into the block model using ordinary kriging. Three search passes were used for all grade variables. Estimation parameters are shown in Table 11.14. the second and third passes were only applied to block cells not estimated by earlier search passes.
Table 11.14 Estimation parameters – COP DF
| Search Ellipse (m) | Rotation | Number of samples | ||||||||||||||||
| Search | X | Y | Z | Z Axis | Y Axis | X Axis | Min | Max | Max per drillhole | |||||||||
| 1 | 100 | 100 | 7.5 | 258 | 45 | - | 5 | 10 | NA | |||||||||
| 2 | 200 | 200 | 15 | 258 | 45 | - | 5 | 10 | NA | |||||||||
| 3 | 500 | 500 | 37.5 | 258 | 45 | - | 3 | 5 | NA | |||||||||
Note: Order of rotation is Z, Y.
Approximately 80% of the block grades were estimated during the first search pass and 20% during the second search pass.
| 11.4.1.5 | Bulk density |
There are no bulk density measurements. The historical bulk density of 2.58 t/m3 was used for mineralisation and 2.5 t/m3 for waste.
| 11.4.1.6 | Estimation validation |
Estimation validation was undertaken by visual comparison of drillholes to the estimated block model and by swath (moving average) plots. Swath plots were generated full depth for 16 sections perpendicular to strike and on a bench-by-bench basis.
Swath plots were generated perpendicular to mineralisation over 1,300 m, with overlapping plots due to changes in the orientation of mineralisation. The weighted mean of the drillhole composites and the estimated block grades for TCu%, ASCu%, and TCo% were allocated in 100 m swathes / windows along 16 section lines.
The review indicates that there is very close correspondence between the means of the estimates and the composites in areas of dense drilling data compared to areas of limited drilling.
Swath plots for 15 m high benches were also generated and reviewed graphically. Again, there is a close correspondence between weighted average composite grade and weighted average estimated block grade in areas with more data, that is the area above 1,250 masl which is largely mined out.
| amcconsultants.com | 154 |
| S-K 1300 TRS: KCM Integrated Operations (Initial Assessment) | |
| Konkola Copper Mines Plc | 0424076 |
Figure 11.20 Swath plots – COP DF
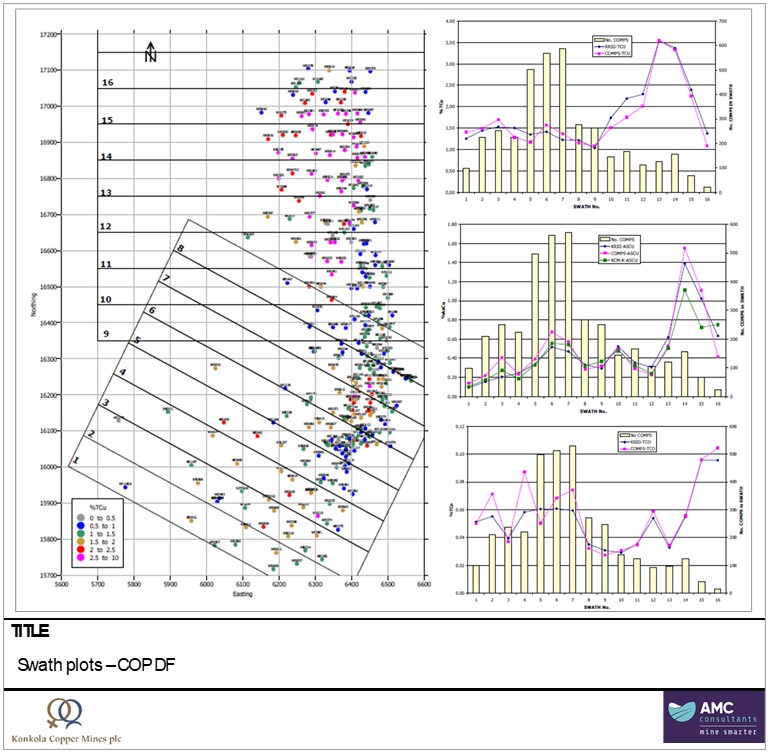
Source: AMC, 2026.
| 11.4.1.7 | Classification criteria |
The Mineral Resource classification criteria and cut-off grade are based on:
| · | Geological and grade continuity |
| · | Drill data density |
| · | Data quality |
| · | Estimation quality |
| · | Proximity of mineralisation to surface |
There is adequate drillhole coverage in the eastern side of the deposits which corresponded to the sub-outcrop positions prior to the commencement of mining. QAQC for data from the 1980’s is not available however there is good correlation and consistency in the copper grade distribution within the mineralisation to imply reliability in the data.
| amcconsultants.com | 155 |
| S-K 1300 TRS: KCM Integrated Operations (Initial Assessment) | |
| Konkola Copper Mines Plc | 0424076 |
Blocks estimated within the first ordinary kriging search pass (search ellipse 100 m × 100 m × 7.5 m; refer Table 11.13) are classified as Indicated, reflecting adequate drillhole coverage and positive estimation validation in areas proximal to sampling. Approximately 80% of block grades were estimated during the first search pass. Blocks requiring the second search pass (200 m × 200 m × 15 m) are also classified as Indicated where geological and grade continuity can be demonstrated. Blocks estimated only within the third search pass (500 m × 500 m × 37.5 m), reflecting wide drill spacing and lower estimation confidence, are classified as Inferred. Resource classification upgrades are achieved through infill drilling to reduce drillhole spacing to within the first search pass criteria.
Current mining has been largely open pit. Studies are ongoing for the transition to underground mining.
For the component to be mined underground a geological cut-off grade for the Mineral Resource of 1.1% TCu has been derived, using a metal price of US$10,000/t Cu, in conjunction with typical historic mining modifying factors and concept level mine designs.
For the component to be mined via open pit a geological cut-off grade for the Mineral Resource of 0.5% TCu has been derived, using a metal price of US$10,000/t Cu, in conjunction with typical historic mining modifying factors and concept level mine designs. For further information see Section 13 to Section 19.
| 11.4.1.8 | Mineral Resource uncertainty |
Mineral Resources are not Mineral Reserves and do not necessarily demonstrate economic viability. There is no certainty that all or any part of this Mineral Resource will be converted into Mineral Reserve.
The COP DF Mineral Resource is classified as an Indicated Mineral Resource.
Mineral Resource estimates may be materially affected by the quality of data, natural geological variability of mineralisation, metallurgical recovery, and the accuracy of the economic assumptions supporting reasonable prospects for economic extraction including metal prices, and mining and processing costs.
The upgrade in the classification of the Mineral Resource from Inferred through to Measured represents an increased understanding of the items that materially impact geological variability. This results in minimisation of uncertainty and reduced risk.
Resource classification upgrades are achieved through increasing geological understanding by reducing the drillhole spacing, for COP DF this will come from proposed infill drilling programs.
| 11.4.1.9 | Mineral Resource estimate |
The Mineral Resource estimate for COP DF is shown in Table 11.15. COP DF contains both open pit and underground mining potential. The Mineral Resource classification considers drillhole spacing studies, data quality, structural and lithological continuity, and estimation confidence.
Cut-off grades are based on mining method:
| · | Open pit: 0.50% TCu (reflecting lower mining costs) |
| · | Underground: 1.10% TCu |
Cut-off grades were derived using a metal price of US$10,000/t Cu in conjunction with typical mining modifying factors and concept-level mine designs. See Section 13.2 for details.
| amcconsultants.com | 156 |
| S-K 1300 TRS: KCM Integrated Operations (Initial Assessment) | |
| Konkola Copper Mines Plc | 0424076 |
Table 11.15 Mineral Resource COP DF– 1 April 2026
| Classification | Cut-off TCu% | Tonnes (Mt) | TCu% | ASCu% | Cu (kt) | TCo% | Co (kt) | |||||||||||||||||||||
| Measured | - | - | - | - | - | - | - | |||||||||||||||||||||
| Indicated - Open Pit | 0.50 | 2.2 | 1.40 | 0.27 | 31 | 0.12 | 3 | |||||||||||||||||||||
| Indicated - Underground | 1.10 | 12.8 | 1.58 | 0.17 | 202 | 0.04 | 5 | |||||||||||||||||||||
| Measured + Indicated | - | 14.9 | 1.56 | 0.18 | 233 | 0.05 | 8 | |||||||||||||||||||||
| Inferred | - | - | - | - | - | - | - | |||||||||||||||||||||
| Total | - | 14.9 | 1.56 | 0.18 | 233 | 0.05 | 8 | |||||||||||||||||||||
Notes:
| · | Mineral Resources are reported with an effective date of 1 April 2026. |
| · | No Mineral Reserves are declared as part of this Initial Assessment. Mineral Resources are reported in their entirety. |
| · | Classification in accordance with S-K 1300. |
| · | Geological cut-off grades of 0.50% TCu (open pit) and 1.10% TCu (underground) have been derived using a metal price of US$10,000/t Cu, in conjunction with typical historic mining modifying factors and concept-level mine designs. |
| · | Point of reference: In situ material. |
| · | Metallurgical recovery – Open Pit: Concentrator 61% Cu, 54% Co; Smelter 98.1% Cu, 30% Co; Concentrate Payable Cu 96.8%. |
| · | Metallurgical recovery – Underground: Concentrator 53% Cu, 23% Co; Smelter 98.1% Cu, 30% Co; Concentrate Payable Cu 96.8%. |
| · | Processing route: Nchanga Concentrator → Nchanga Smelter → Nkana Refinery. |
| · | Tonnage and grade are rounded; this may result in minor computational discrepancies. |
| · | Mineral Resources are 100% attributable to KCM. |
| 11.4.2 | Chingola Open Pit C and E Extension (COP E Ext) |
Chingola Open Pit C and E Extension (COP E Ext) has not been developed; there has been no mining.
COP E Ext resource model was last updated in 2014.
Drilling commenced in late 2025. With 2,726 m drilled from a proposed 7,300 m drilling program, as at end March 2026. There had been insufficient analytical results returned to justify an update in the Mineral Resource estimation as of 15 January 2026. An updated Mineral Resource will be undertaken on completion of the drilling program.
| 11.4.2.1 | Data |
There are 283 drillholes in the COP E Ext database of which 210 are historical and 73 were drilled in 2011 to 2013. See Section 8.8.1 for the QAQC for the CRMs and repeats for the 2011 to 2013 drillholes. No blanks samples were submitted.
The drillhole spacing ranges from 30 m to 120 m. With more density drilled areas averaging 50 m.
Data verification identified two types of anomalous data:
| · | Drillholes the stratigraphic sequence inverted. |
| · | Drillholes with stratigraphic sequence inconsistent with the surrounding drillholes. |
Drillholes unable to be understood in the context of the geology were removed from the database. Drillholes removed from the database are shown in green in Figure 11.26 COP E Ext drillhole location plan.
| amcconsultants.com | 157 |
| S-K 1300 TRS: KCM Integrated Operations (Initial Assessment) | |
| Konkola Copper Mines Plc | 0424076 |
Figure 11.21 Drillhole location plan – COP E Ext
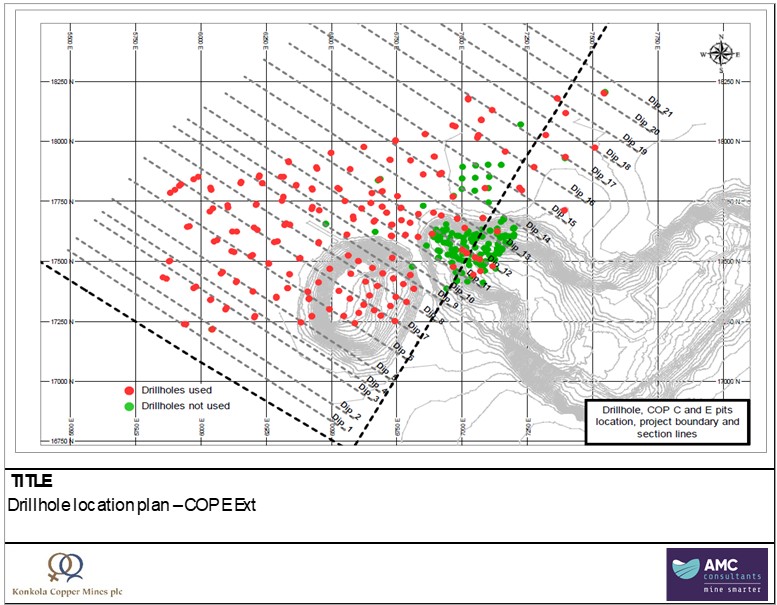
Source: AMC, 2026.
| 11.4.2.2 | Geological interpretation and generation of 3D representation |
Wireframes of the 3D geological interpretation were constructed from digitised cross section strings, where the strings were snapped to the drillholes.
The Pink Quartzite (PQ) from between the Banded Sandstone Lower (BSSL) and Banded Sandstone Upper (BSSU) largely is absent. As such the three units have been combined into one unit the Banded Sandstone (BSS).
The LOB mineralisation was interpreted as ten discrete zones, labelled A to J, of mineralisation at a 0.5% TCu geological cut-off.
Zone A represents a large proportion of the mineralisation. Spatially Zone A is associated with the sediments of the Arkose formation infilling the basement trough. Zone C is associated with a basement high, where the Arkose formation is comparatively thinner and consequently the mineralisation is thinner. Zones F to J are based on one drillhole intersection each.
Figure 11.27 shows a plan view of the drillhole intersections colored by grade with the ten mineralised Zones outlines as dotted lines. This shows a core of TCu% grade greater than 1.5% TCu in Zone A with a halo of lower grade intersections. The ASCu% intersections are lower grade indicating the mineralisation in the LOB is more sulfide rich, see Figure 11.28.
| amcconsultants.com | 158 |
| S-K 1300 TRS: KCM Integrated Operations (Initial Assessment) | |
| Konkola Copper Mines Plc | 0424076 |
Figure 11.22 Plan view of drillhole intersections and interpreted mineralisation Zones TCu% - COP E Ext
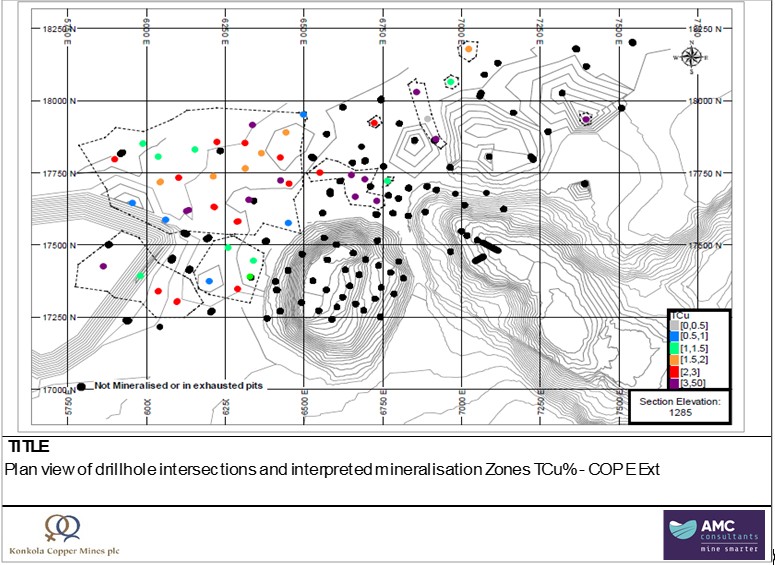
Note: Drillholes colored by TCu%.
Source: AMC, 2026.
| amcconsultants.com | 159 |
| S-K 1300 TRS: KCM Integrated Operations (Initial Assessment) | |
| Konkola Copper Mines Plc | 0424076 |
Figure 11.23 Plan view of drillhole intersections and interpreted mineralisation Zones ASCu% - COP E Ext
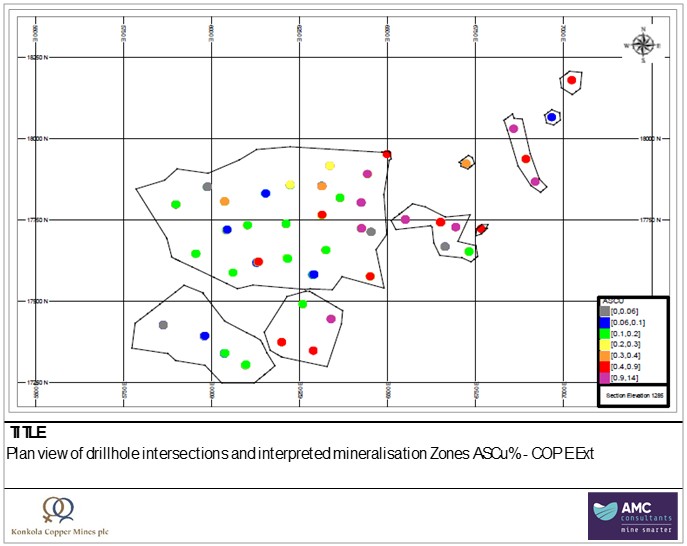
Note: Drillholes colored by ASCu%.
Source: AMC, 2026.
| 11.4.2.3 | Statistics and compositing |
Sample intervals are composited to 2.5 m with a minimum length of 1.25 m. Composited statistics by mineralised Zone is shown in Table 11.16 and the histogram for Zone A composites for TCu% and ASCu% is shown in Figure 11.29.
Table 11.16 Statistics by mineralisation zone for composite data – COP E Ext
| % TCu | % AsCu | |||||||||||||||||||||||||||||||||||||||||||||||
| W/F | No drillholes | No samples | Min | Max | Mean | Stand Dev | CoV | Min | Max | Mean | Stand Dev | CoV | ||||||||||||||||||||||||||||||||||||
| A | 24 | 319 | 0.18 | 14.8 | 2.35 | 1.96 | 0.83 | 0.01 | 8.32 | 0.46 | 0.93 | 2.04 | ||||||||||||||||||||||||||||||||||||
| B | 4 | 50 | 0.18 | 9.21 | 2.32 | 1.74 | 0.75 | 0.03 | 3.28 | 0.22 | 0.53 | 2.43 | ||||||||||||||||||||||||||||||||||||
| C | 4 | 17 | 0.58 | 4.31 | 1.56 | 1.01 | 0.65 | 0.14 | 4.15 | 1.11 | 1.13 | 1.02 | ||||||||||||||||||||||||||||||||||||
| D | 5 | 43 | 0.25 | 14.7 | 4.12 | 3.47 | 0.84 | 0.05 | 7.55 | 1.23 | 1.4 | 1.14 | ||||||||||||||||||||||||||||||||||||
| E | 3 | 6 | 0.44 | 6.83 | 2.94 | 2.6 | 0.89 | 0.29 | 5.29 | 2.46 | 2.18 | 0.89 | ||||||||||||||||||||||||||||||||||||
| F | 1 | 2 | 0.93 | 1.47 | 1.2 | 0.27 | 0.22 | 0.68 | 1.38 | 1.03 | 0.35 | 0.34 | ||||||||||||||||||||||||||||||||||||
| G | 1 | 2 | 0.42 | 5.12 | 2.77 | 2.35 | 0.85 | 0.21 | 4.51 | 2.36 | 2.15 | 0.91 | ||||||||||||||||||||||||||||||||||||
| H | 1 | 3 | 0.85 | 6.34 | 4.26 | 2.43 | 0.57 | 0.32 | 3.87 | 2.62 | 1.63 | 0.62 | ||||||||||||||||||||||||||||||||||||
| I | 1 | 2 | 1.36 | 2.05 | 1.7 | 0.34 | 0.2 | 0.58 | 0.92 | 0.75 | 0.17 | 0.22 | ||||||||||||||||||||||||||||||||||||
| J | 1 | 4 | 0.36 | 2.86 | 1.43 | 0.92 | 0.65 | 0.06 | 0.46 | 0.25 | 0.15 | 0.61 | ||||||||||||||||||||||||||||||||||||
Source: KCM, 2026.
| amcconsultants.com | 160 |
| S-K 1300 TRS: KCM Integrated Operations (Initial Assessment) | |
| Konkola Copper Mines Plc | 0424076 |
Figure 11.24 Histogram composite samples TCu% and ASCu% - Zone A COP E Ext
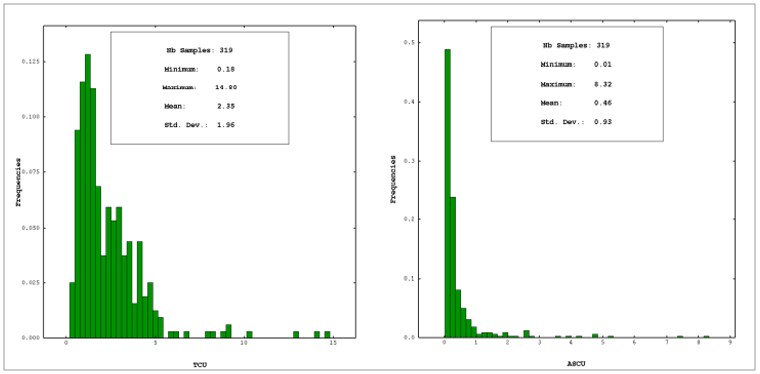
Source: KCM, 2026.
The TCu% histogram shows multiple copper populations.
Semi-variogram modelling was generated in Isatis software. The semi-variograms generated were derived from 2.5 m composites from Zone A. The other zones did not have enough samples to generate variograms.
| 11.4.2.4 | Block model and estimation parameters |
The parent block dimensions are 25 m by 25 m in the easting and northing directions and 5 m in the vertical direction (Table 11.17), which is approximately half the drill spacing.
Table 11.17 Block model origin and extents – COP E Ext
| Direction | Origin (m) | Parent block size (m) | Number of parent blocks | Model extent (m) | Minimum sub block size (m) | |||||
| Easting (m) | 5,500 | 25 | 80 | 2,000 | NA | |||||
| Northing (m) | 17,000 | 25 | 82 | 2,050 | NA | |||||
| Rl (m) | 650 | 5 | 150 | 750 | NA |
Wireframes for each lithology were filled with blocks.
The grades for TCu% and ASCu% were estimated into
the block model using ordinary kriging for Zones A to E. Three search passes were used for all grade variables. Estimation parameters
are shown in
Table 11.18. The second and third passes were only applied to block cells not estimated by earlier search passes.
| amcconsultants.com | 161 |
| S-K 1300 TRS: KCM Integrated Operations (Initial Assessment) | |
| Konkola Copper Mines Plc | 0424076 |
Table 11.18 Estimation parameters – COP E Ext
| Search ellipse (m) | ||||||
| Search | X | Y | Z | |||
| 1 | 150 | 210 | 15 | |||
| 2 | 300 | 420 | 30 | |||
| 3 | 750 | 1,050 | 75 | |||
Note: No rotation was applied. Minimum and maximum sample count constraints were applied per standard ordinary kriging practice.
Zones F to J were each assigned the average composite grade for TCu% and ASCu% from the drillholes passing through each zone.
| 11.4.2.5 | Bulk density |
Bulk density measurements were collected from 432 samples of core drilled from 2011 to 2013. Small pieces of core of approximately 4 cm x 4 cm x 4 cm were weighted at the Nchanga analytical laboratory.
Bulk density was reported by lithology, see Table 11.19. Bulk density was assigned based on the mean value for each lithology.
Table 11.19 Bulk density by lithology – COP E Ext
| Lithology | No. of samples | Minimum | Maximum | Mean | Standard Deviation | Coefficient of Variation | ||||||
| UHW | 111 | 1.86 | 3.30 | 2.46 | 0.26 | 0.11 | ||||||
| UBS | 34 | 2.28 | 3.15 | 2.50 | 0.15 | 0.069 | ||||||
| TFQ | 40 | 2.06 | 2.88 | 2.39 | 0.15 | 0.06 | ||||||
| BSS | 138 | 1.84 | 2.83 | 2.40 | 0.19 | 0.08 | ||||||
| LBS | 52 | 1.98 | 3.20 | 2.37 | 0.21 | 0.09 | ||||||
| ARK | 38 | 2.02 | 2.91 | 2.59 | 0.14 | 0.05 | ||||||
| BAS | 11 | 2.46 | 2.97 | 2.77 | 0.15 | 0.06 |
Source: KCM, 2026.
| 11.4.2.6 | Estimation validation |
Estimation validation was undertaken by visual comparison of drillholes versus the grade estimation, and by swath (moving average) plots.
Visual inspection between individual drillholes and the block grade estimate show a reasonable correlation for both TCu% and ASCu% grades.
Swath plots spaced approximately every 90 m in Zone A. Swath plots for Zone A for TCu% and ASCu% are shown in Figure 11.30. Mean grades of the drillhole data and block model were also compared, Table 11.20.
The average TCu% composite versus block estimate is between 1% and 0.5% TCu difference. This is an average 15% difference in TCu%. Generally, the composite sample grade is lower than the block model grade. Some of the higher-grade composites have been smeared. The same relationship is shown in the ASCu% estimation.
| amcconsultants.com | 162 |
| S-K 1300 TRS: KCM Integrated Operations (Initial Assessment) | |
| Konkola Copper Mines Plc | 0424076 |
Figure 11.25 Swath plots – COP E Ext
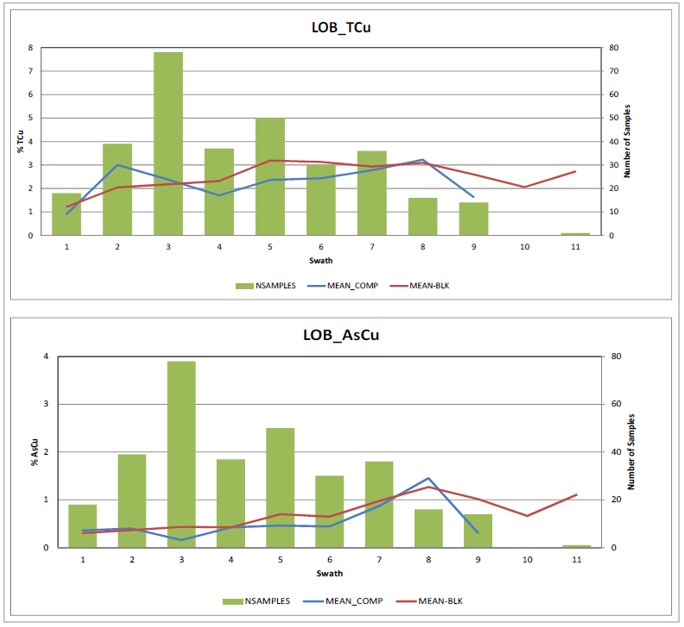
Source: KCM, 2026.
The mean grades of the drillhole data versus block model show the block model grades are slightly higher with less variation than that represented in the drillhole data.
Table 11.20 Drillhole versus block model mean grades – COP E Ext
| Data | Block estimates | |||||||||||||||||||||||||||||||||||
| Field | Minimum | Maximum | Mean | Stand. Dev. | Minimum | Maximum | Mean | Stand. Dev. | % difference | |||||||||||||||||||||||||||
| % TCu | 0.18 | 14.80 | 2.56 | 2.20 | 0.93 | 8.47 | 2.61 | 1.19 | 2.0 | % | ||||||||||||||||||||||||||
| % AsCu | 0.04 | 8.32 | 0.56 | 1.08 | 0.07 | 2.81 | 0.57 | 0.43 | 1.8 | % | ||||||||||||||||||||||||||
| 11.4.2.7 | Classification criteria |
The Mineral Resource classification criteria and cut-off grade are based on:
| · | Geological and grade continuity |
| · | Drill data density |
| · | Data quality |
| · | Estimation quality |
| · | Proximity of mineralisation to surface |
QAQC for data from the 1980’s is not available the QAQC for the 2011 to 2013 drilling is reasonable. Historic drillholes that do not align geologically have been removed from the interpretation and estimation.
A cut-off grade for the Mineral Resource of 1.10% TCu has been derived, using a metal price of US$10,000/t Cu, in conjunction with typical historic mining modifying factors and concept level mine designs. For further information see Section 13 to Section 19.
Zones E to J are not considered to have potential for eventual economic extraction due to their relative size and the spatial location in relation to Zones A to D and were not included in the Mineral Resource estimate.
The well-informed portion of Zone A is classified as Indicated. The peripheral edges of Zone A and surrounding Zone B, C, and D are classified as Inferred, see Figure 11.31.
| amcconsultants.com | 163 |
| S-K 1300 TRS: KCM Integrated Operations (Initial Assessment) | |
| Konkola Copper Mines Plc | 0424076 |
Figure 11.26 Plan view of the Mineral Resource classification – COP E Ext
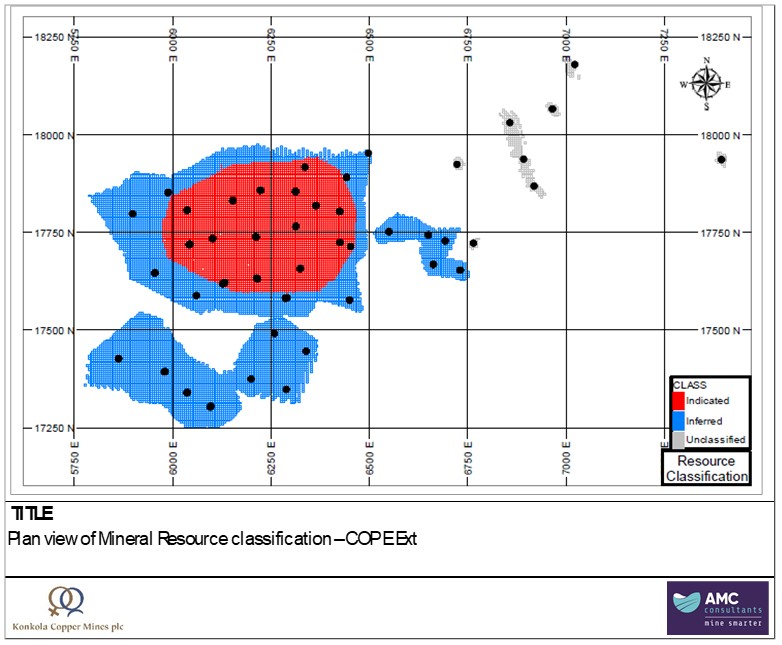
Source: KCM, 2026.
| amcconsultants.com | 164 |
| S-K 1300 TRS: KCM Integrated Operations (Initial Assessment) | |
| Konkola Copper Mines Plc | 0424076 |
Ordinary kriging was used to estimate Zones A to E using three search passes (refer Table 11.17). Blocks within Zone A estimated during the first search pass (search ellipse 150 m × 210 m × 15 m) are classified as Indicated, reflecting adequate drillhole coverage and reasonable estimation validation with a mean grade difference of approximately 2% between composites and block model estimates (refer Table 11.19). Blocks within Zone A estimated only in the second or third search passes (extending to 300 m × 420 m × 30 m and 750 m × 1,050 m × 75 m respectively), and all blocks within Zones B to E, are classified as Inferred, reflecting wider drill spacing and lower estimation confidence. Zones F to J were assigned the average composite grade from passing drillholes rather than by kriging interpolation, reflecting insufficient data density for geostatistical estimation; these zones are accordingly classified as Inferred. Zones E to J have been excluded from the Mineral Resource estimate due to insufficient potential for economic extraction relative to their spatial position. Resource classification upgrades are achievable through infill drilling within Zones B to D to within the first search pass criteria.
Studies are ongoing to assess future mining methods.
| 11.4.2.8 | Mineral Resource uncertainty |
Mineral Resources are not Mineral Reserves and do not necessarily demonstrate economic viability. There is no certainty that all or any part of this Mineral Resource will be converted into Mineral Reserve.
The COP E Extension mineral Resource is classified into an Indicated and Inferred Mineral Resources.
Mineral Resource estimates may be materially affected by the quality of data, natural geological variability of mineralisation, metallurgical recovery, and the accuracy of the economic assumptions supporting reasonable prospects for economic extraction including metal prices, and mining and processing costs.
The classification of Inferred, with the wide drill data spacing, is supported via a good understanding of the geological and grade continuity observed from drilling and the extensive mining history.
The upgrade in the classification of the Mineral Resource from Inferred through to Measured represents an increased understanding of the items that materially impact geological variability. This results in minimisation of uncertainty and reduced risk.
Resource classification upgrades are achieved through increasing geological understanding by reducing the drillhole spacing, for COP E Extension this will come from the resource infill and extension drilling programs.
| 11.4.2.9 | Mineral Resource estimate |
The Mineral Resource estimate (using a 0.9% TCu cut-off grade) for COP E Ext is shown in Table 11.21. The Mineral Resource classification considers drillhole spacing studies, data quality, structural and lithological continuity, and estimation confidence.
Table 11.21 Mineral Resource COP E Extension – 1 April 2026
| Classification | Cut-off TCu% | Tonnes (Mt) | TCu % | ASCu % | Cu (kt) | TCo % | Co (kt) | |||||||||||||||||||||
| Measured | - | - | - | - | - | - | - | |||||||||||||||||||||
| Indicated | 0.9 | 13.1 | 2.63 | 0.51 | 345 | - | - | |||||||||||||||||||||
| Measured + Indicated | 0.9 | 13.1 | 2.63 | 0.51 | 345 | - | - | |||||||||||||||||||||
| Inferred | 0.9 | 9.4 | 2.35 | 0.51 | 221 | - | - | |||||||||||||||||||||
| Total | 22.5 | 2.51 | 0.51 | 566 | - | - | ||||||||||||||||||||||
Notes:
| · | Mineral Resources are reported with an effective date of 1 April 2026. |
| · | No Mineral Reserves are declared as part of this Initial Assessment. Mineral Resources are reported in their entirety. |
| · | Classification in accordance with S-K 1300. |
| · | Approximately 42% of COP E Extension Mineral Resources are classified as Inferred (9.4 Mt of 22.5 Mt). Inferred Mineral Resources are considered too geologically speculative to have modifying factors applied to them that would enable them to be classified as Mineral Reserves, and there is no certainty that all or any part of the Inferred Mineral Resources will be converted to Measured or Indicated Mineral Resources with additional exploration. |
| amcconsultants.com | 165 |
| S-K 1300 TRS: KCM Integrated Operations (Initial Assessment) | |
| Konkola Copper Mines Plc | 0424076 |
| · | A geological cut-off grade of 0.9% TCu has been derived using a metal price of US$10,000/t Cu, in conjunction with typical historic mining modifying factors and concept-level mine designs. |
| · | Point of reference: In situ material. |
| · | Metallurgical recovery: Concentrator 56% Cu; Smelter 98.1% Cu; Concentrate Payable Cu 96.8%. |
| · | Processing route: Nchanga Concentrator → Nchanga Smelter → Nkana Refinery. |
| · | Tonnage and grade are rounded; this may result in minor computational discrepancies. |
| · | Mineral Resources are 100% attributable to KCM. |
| 11.4.3 | Tailings dams TD03 and TD04 |
Flotation tailings from Nchanga concentrators have been treated in a copper solvent extraction–electrowinning tailings leach plant (TLP) since 1974.
The tailings dams were originally identified as having a large resource of oxide copper mineralisation that has the potential to provide material that could be used to partially neutralise excess acid from sulfur dioxide capture at the smelter. With the sulfuric acid produced from smelting off-gas capture being consumed by the TLP leach circuits, improving site-wide acid balance.
A modern expansion of the TLP was commissioned in 2012.
TD03 and TD04 contain tailings material from the Nchanga concentrators that was originally sourced from multiple Nchanga deposits.
| 11.4.3.1 | Data |
In September 2000, 1,645.5 m representing 78 drillholes were drilled at TD03 and 1,090.5 m representing 64 drillholes were drilled at TD04.
The drilling method, sample preparation and analysis, and QAQC are reported in Sections 7.2, 8.2 and 8.6.2 respectively.
Pulp rejects were composited into a four-drillhole grid pattern for leach tests. KCM Nchanga analytical laboratory completed the leach tests at 25°C to determine gangue acid consumption (GAC).
| 11.4.3.2 | Generation of volume / tonnage and grade |
Histograms of the 3 m samples indicate a largely normal grade distribution with a small higher-grade tail for the total copper mineralisation within TD03.
Table 11.22 Summary statistics total copper tailings dam samples
| Total copper (%) | TD03 | TD04 | ||||||
| Number of Samples | 538 | 394 | ||||||
| Minimum | 0.06 | 0.07 | ||||||
| Maximum | 1.27 | 1.61 | ||||||
| Mean | 0.71 | 0.62 | ||||||
| Median | 0.71 | 0.61 | ||||||
| Mode | 0.73 | 0.57 | ||||||
| Standard Deviation | 0.16 | 0.17 | ||||||
| Variance | 0.026 | 0.028 | ||||||
| Standard Error | 0.01 | 0.01 | ||||||
| Confidence Level (95.0%) | 0.0137 | 0.017 | ||||||
| amcconsultants.com | 166 |
| S-K 1300 TRS: KCM Integrated Operations (Initial Assessment) | |
| Konkola Copper Mines Plc | 0424076 |
Table 11.23 Summary statistics acid soluble copper tailings dam samples
| Acid soluble copper (%) | TD03 | TD04 | ||||||
| Number of Samples | 509 | 344 | ||||||
| Minimum | 0.23 | 0.16 | ||||||
| Maximum | 1.06 | 1.49 | ||||||
| Mean | 0.52 | 0.44 | ||||||
| Median | 0.51 | 0.40 | ||||||
| Mode | 0.49 | 0.42 | ||||||
| Standard Deviation | 0.15 | 0.19 | ||||||
| Variance | 0.02 | 0.04 | ||||||
| Standard Error | 0.01 | 0.01 | ||||||
| Confidence Level (95.0%) | 0.013 | 0.019 | ||||||
TD03 and TD04 dam surface profiles were digitised from the Nchanga topographic survey and updated with the drillhole collar spot heights. The pre dam surface topographic profile was used as the based and three-dimensional shells of the volume were created.
Small trenched were dug at both TD03 and TD04 to collect samples for bulk density determination. Samples represented the upper unconsolidated material only. Values measured range from 1.1 to 1.3 t/m3. This value is lower than anticipated, with a historical value of 1.55 t/m3 used to convert the tailings dam volume to a mass.
| 11.4.3.3 | Mining, processing, and recovery |
Mining of TD03 is generally via hydraulic mining. Current mining is of the coarser beached tailings material is by excavator.
Recovery of tailings at the Nchanga TLP in 2024 was 78.3% from acid soluble copper. Combined with the low recovery from non-acid soluble copper this equates to 37% recovery for total copper.
An elevated temperature leach upgrade for the Nchanga TLP is proposed. This will increase the acid soluble recover by approximately 20%. With the total copper recovery proposed to increase to 67%.
Noting the Nchanga TLP treats all tails from Nchanga concentrate and not just material from the tailings dams.
| 11.4.3.4 | Classification criteria |
Material within TD03 and TD04 has been classified as Indicated on the basis of systematic drilling on a nominal 150 m × 150 m grid using 50 mm auger drillholes sampled on 1.5 m intervals, analytical data quality (538 samples for TD03 and 394 samples for TD04 for total copper; refer Table 11.21 and Table 11.22), gangue acid consumption sampling on an effective 300 m × 300 m grid, metallurgical test work on samples from both deposits, and reconciliation against ongoing Nchanga TLP production from TD03. The dam surface profiles were digitised from topographic survey data updated with drillhole collar spot heights and three-dimensional shells created from pre-dam topographic profiles, supporting confidence in the tonnage estimate. All material within the defined tailings dam boundaries is classified as Indicated; no Inferred classification has been applied, reflecting the relatively homogeneous grade distribution and adequate drill coverage across both deposits.
No cut-off grade has been applied as all material will be required to be processed.
TD03 is being processed through the Nchanga TLP. The processing and economic outcomes described within the report underpin support for the eventual economic extraction of the tailing’s material.
| amcconsultants.com | 167 |
| S-K 1300 TRS: KCM Integrated Operations (Initial Assessment) | |
| Konkola Copper Mines Plc | 0424076 |
| 11.4.3.5 | Mineral Resource uncertainty |
Mineral Resources are not Mineral Reserves and do not necessarily demonstrate economic viability. There is no certainty that all or any part of this Mineral Resource will be converted into Mineral Reserve.
The TD03 and TD04 Mineral Resources are classified as an Indicated Mineral Resources.
Mineral Resource estimates may be materially affected by the quality of data, natural geological variability of mineralisation, metallurgical recovery, and the accuracy of the economic assumptions supporting reasonable prospects for economic extraction including metal prices, and mining and processing costs.
| 11.4.3.6 | Mineral Resource estimate |
TD03 is currently in production, with tailings recovered by hydro sluicing and excavator. The Mineral Resource estimates for TD03 and TD04 are tabulated in Table 11.24.
Table 11.24 Mineral Resource TD03 and TD04– 1 April 2026
| Asset | Classification | Cut-off TCu (%) | Tonnes (Mt) | TCu% | ASCu% | Cu (kt) | TCo% | Co (kt) | ||||||||||||||||||||||
| TD03 | Indicated | 0.0 | 3 | 0.75 | 0.60 | 21 | 0.01 | 1 | ||||||||||||||||||||||
| TD04 | Indicated | 0.0 | 22 | 0.62 | 0.42 | 134 | 0.03 | 6 | ||||||||||||||||||||||
| Total | Indicated | 25 | 0.63 | 0.44 | 156 | 0.03 | 6 | |||||||||||||||||||||||
Notes:
| · | Mineral Resources are reported with an effective date of 1 April 2026. |
| · | No Mineral Reserves are declared as part of this Initial Assessment. Mineral Resources are reported in their entirety. |
| · | Classification in accordance with S-K 1300. |
| · | No cut-off grade has been applied; as TD03 and TD04 are existing tailings storage facilities being reclaimed in their entirety, conventional cut-off grade methodology is not applicable. |
| · | TD03 ASCu% reflects the remaining inventory as at 1 April 2026 following reclamation of higher-grade ASCu material since 2021; refer to Table 13.20. |
| · | Point of reference: In situ material. |
| · | Metallurgical recovery: TD03 and TD04 are processed through the existing Nchanga TLP under ambient (conventional) leach conditions during the approximate three-year reclamation period prior to the proposed Elevated Temperature Leach retrofit. Acid soluble copper (ASCu) recovery is 74.8%, derived from the 10-year historical average TLP performance (2010–2019, excluding the 2020–2024 period of operating and financial constraint) and consistent with FY2025/26 actual performance (refer to Table 10.2 and Section 10.4.2). Total copper (TCu) recovery to cathode is approximately 48.5% (refer to Section 10.4.2 for the recovery basis). |
| · | Cobalt is present in situ but is not recovered in the TLP electrowinning process. Cobalt grades are reported for geological completeness; no cobalt revenue is attributed to TD03 or TD04 in the economic analysis. |
| · | Processing route: Nchanga TLP → Copper cathode. |
| · | Tonnage and grade are rounded; this may result in minor computational discrepancies. |
| · | Mineral Resources are 100% attributable to KCM. |
| 11.4.4 | Tailings dam TD05 (Muntimpa) |
Flotation tailings from Nchanga concentrators have been treated in a copper solvent extraction–electrowinning tailings leach plant (TLP) since 1974.
The tailings dams were originally identified as having a large resource of oxide copper mineralisation that has the potential to provide material that could be used to partially neutralise excess acid from sulfur dioxide capture at the smelter. With the sulfuric acid produced from smelting off-gas capture being consumed by the TLP leach circuits, improving site-wide acid balance.
A modern expansion of the TLP was commissioned in 2012.
| amcconsultants.com | 168 |
| S-K 1300 TRS: KCM Integrated Operations (Initial Assessment) | |
| Konkola Copper Mines Plc | 0424076 |
TD05 tailings dam contains tailings material from the Nchanga concentrators and TLP, which was originally sourced from across multiple Nchanga deposits. Deposition of tailings in TD05 tailings dam commenced 1980, prior to the 2012 modern expansion of the TLP. From the 1980’s to the mid 2000’s the annual average tailings grade was around 1% TCu. Mid-2000’s onward the annual average tailings grade reduced to range from approximately 0.5% to 0.7% TCu, post the introduction of the updated TLP circuit. TD05 is an active tailings dam, with the ongoing receipt of tailings from Nchanga TLP.
It is proposed that copper form the tailings material at TD05 can be treated via the TLP and proposed ETL.
The license boundary hosting TD05 (7075-HQ-LML) is shown in yellow in Figure 11.27. In the lower left (west) TD05 crosses the license boundary onto the adjacent license.
| 11.4.4.1 | Data |
There are 245 drillholes in the TD05 geological database. All holes were drilled in 2025. The drilling method, sample preparation and analysis, and QAQC are reported in Sections 7.2, 8.2 and 8.6.3 respectively.
Figure 11.27 shows the drilling at TD05 coloured by drill program type. Pattern drilling is nominally spaced at 125 m by 125 m in easting and northing respectively. Drilling locations were largely determined by the current location of tailings placement, and compaction and potential for liquefaction ensuring personal and equipment safe operations.
Figure 11.27 Drillhole location plan – TD05
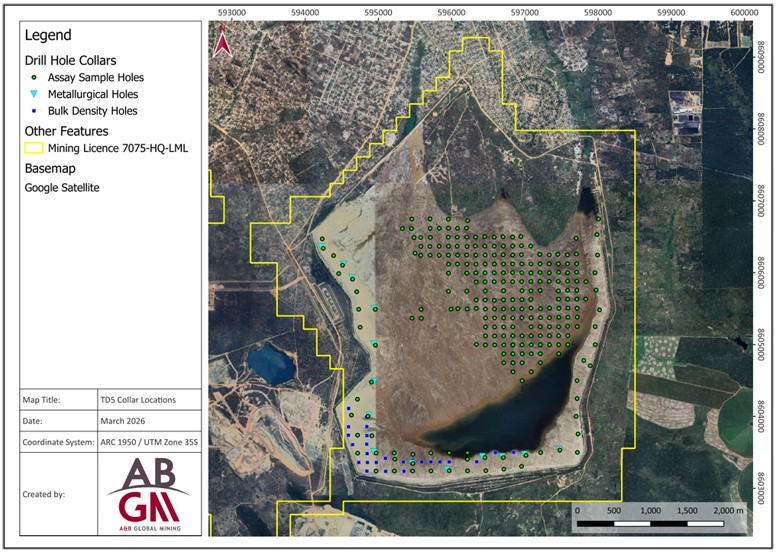
Note: Image as at October 2024, the pooled water in the south has been largely pumped to the northeast discharge area.
Source: ABGM, 2026.
| amcconsultants.com | 169 |
| S-K 1300 TRS: KCM Integrated Operations (Initial Assessment) | |
| Konkola Copper Mines Plc | 0424076 |
| 11.4.4.2 | Generation of volume / tonnage |
A natural pre-depositional 1970’s topographic surface has been used to make a digital basement file. This data is without the survey method or source of data.
A LiDAR generated topographic surface has been used to create an upper limit and surface for TD05.
A discrepancy between the location of the original surface and the points of intersection between the tailings and the basement material from the drillhole data has been identified. An updated basement surface was generated in Datamine StudioRM using the contact points in the drillholes where drilling coverage was good, and using the original surface points where drilling was sparse
A closed solid, created from LiDAR generated topographic surface and the updated basement surface has been generated.
The final TD05 solid wireframe has a volume of 372,167,733 m3 and an average vertical thickness of 26 m, ranging from 0 m to a maximum of 67 m, see Figure 11.28.
Figure 11.28 Histogram of vertical thickness from drilling -TD05
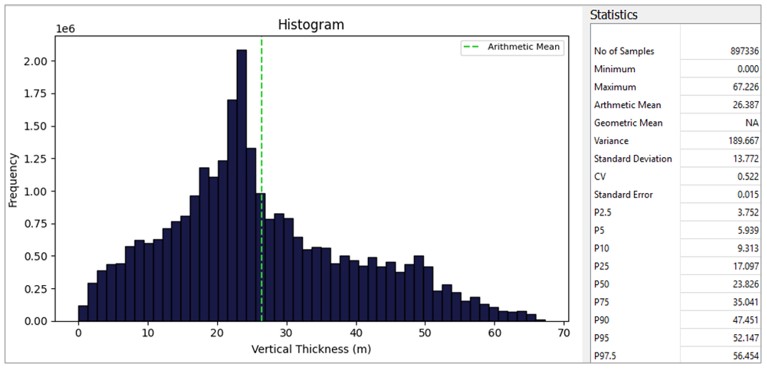
Source: ABGM, 2026.
A loss factor of 5% has been used in estimating the Mineral Resource tonnage due to the requirement to undertaken validation on the position of the natural surface/base of tailings dam and the as yet unknown requirement to leave material in proximity to dam walls due to the dam not being as aged or compacted as TD03 and TD04.
| 11.4.4.3 | Statistics and compositing |
The majority of raw sample intervals are 1 m in length. Samples were composited to 2 m, with residuals excluded. Statistical results indicate no bias in excluding residuals, see Figure 11.29 and Figure 11.30 for TCu% and ASCu% respectively.
Figure 11.31 show a moderately strong relationship between TCu% and ASCu% copper. The more samples demonstrating the same relationship in the scatterplot, the hotter the colours.
| amcconsultants.com | 170 |
| S-K 1300 TRS: KCM Integrated Operations (Initial Assessment) | |
| Konkola Copper Mines Plc | 0424076 |
Figure 11.29 Histogram composite samples TCu% - TD05
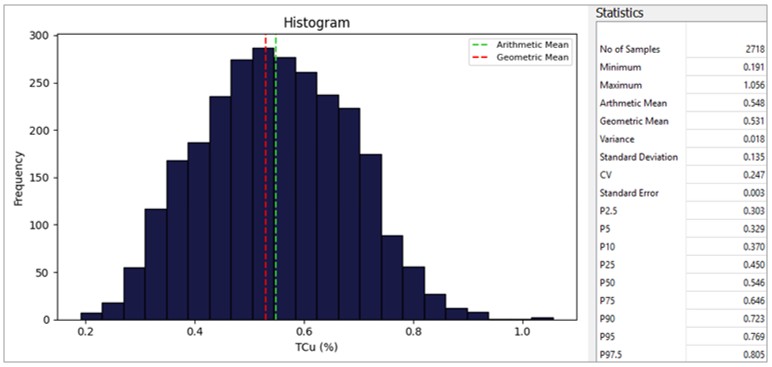
Source: ABGM, 2026.
Figure 11.30 Histogram composite samples ASCu% - TD05
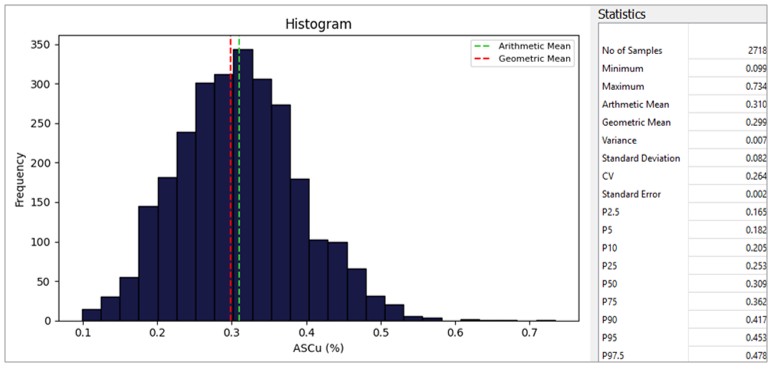
Source: ABGM, 2026.
| amcconsultants.com | 171 |
| S-K 1300 TRS: KCM Integrated Operations (Initial Assessment) | |
| Konkola Copper Mines Plc | 0424076 |
Figure 11.31 Correlation between TCu% and ASCu%- TD05
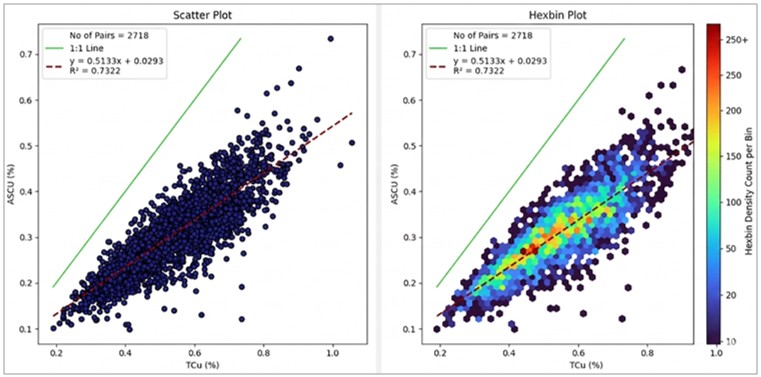
Note: In the right-hand scatterplot the more samples stacked on each other, the hotter the colour.
Source: ABGM, 2026.
Historic annual average tailings grade data indicate TCu% grades have at times been in excess of 1% TCu during the early stages of dam building. The composited drillhole data for TCu% and ASCu% exhibit a very small high-grade tail, see Figure 11.29 and Figure 11.30 respectively. A top-capping assessment was completed, with top-caps applied to both TCu% and ASCu%, see Table 11.25. This resulted in four TCu% and five ASCu% samples being capped at 0.94% TCU and 0.59% ASCu.
Table 11.25 Top-caps – TD05
| Variable | Statistic | Raw | Capped | Change % | Nominal | |||||
| Maximum | 1.06 | 0.94 | -10.98 | |||||||
| Arithmetic mean | 0.55 | 0.55 | -0.02 | |||||||
| Standard deviation | 0.53 | 0.53 | -0.01 | |||||||
| TCu | CoV | 0.14 | 0.14 | -0.23 | ||||||
| Uncapped samples | 2755 | 2751 | -0.21 | |||||||
| Top-cap value percentile | 99.85 | |||||||||
| Samples capped | 4 | |||||||||
| Maximum | 0.73 | 0.59 | -19.62 | |||||||
| Arithmetic mean | 0.31 | 0.31 | -0.04 | |||||||
| Standard deviation | 0.08 | 0.08 | -0.59 | |||||||
| ASCu | CoV | 0.26 | 0.26 | -0.55 | ||||||
| Uncapped samples | 2755 | 2750 | -0.18 | |||||||
| Top-cap value percentile | 99.82 | |||||||||
| Samples capped | 5 |
Source: ABGM, 2026.
Variography was completed in Datamine StudioRM. A lag of 125 m was used in the major and semi-major directions, and 2 m in the minor. Because of the layered delta like nature of deposition and expected continuity, the variograms had no dip and the major direction had an azimuth of 0°/180° (north-south).
| amcconsultants.com | 172 |
| S-K 1300 TRS: KCM Integrated Operations (Initial Assessment) | |
| Konkola Copper Mines Plc | 0424076 |
The experimental variograms displayed zonal anisotropy in the minor (vertical) direction. The last structure was given an exaggerated range to optimize the fit, with the search ellipsoids’ dimensions in the minor direction set to the preceding structure’s range.
Table 11.26 Variogram models – TD05
| Structure 1 | Structure 2 | Structure 3 | ||||||||||||||||||||||||||||||||||||||||||||||||||
| Element | Nugget | Sill | Major (m) | Semi (m) | Minor (m) | Sill | Major (m) | Semi (m) | Minor (m) | Sill | Major (m) | Semi (m) | Minor (m) | |||||||||||||||||||||||||||||||||||||||
| TCu | 0.00183 | 0.00165 | 134.9 | 159.9 | 5 | 0.00742 | 135 | 160 | 28 | 0.00745 | 1,260 | 950 | 300 | |||||||||||||||||||||||||||||||||||||||
| ASCu | 0.000744 | 0.00355 | 130 | 130 | 17.5 | 0.00239 | 1,600 | 1,000 | 130 | - | - | - | - | |||||||||||||||||||||||||||||||||||||||
Source: ABGM 2026
| 11.4.4.4 | Block model and estimation parameters |
Search ranges are aligned with the variogram model orientations and ranges, Table 11.27. A maximum of three samples were allowed from any one drillhole. No octant searching was used.
Two search passes were used. The second search pass was twice the range of the first search pass. The first passed estimated grade to 99.6% of blocks.
Table 11.27 Search orientation and ranges – TD05
| Search pass 1 | Search pass 2 | |||||||||||||||||||||||||||
| Variable | Major Azimuth: 0° Dip: 0° (m) | Semi-major Azimuth: 90° Dip: 0° (m) | Minor Azimuth: 0° Dip: 90° (m) | Minimum samples | Maximum samples | Minimum samples | Maximum samples | |||||||||||||||||||||
| TCu | 1,260 | 950 | 28 | 5 | 15 | 5 | 20 | |||||||||||||||||||||
| ASCu | 1,600 | 1,000 | 17.5 | 5 | 15 | 5 | 20 | |||||||||||||||||||||
| TCo | 1,000 | 1,500 | 30 | 5 | 15 | 5 | 20 | |||||||||||||||||||||
| ASCo | 1,000 | 1,500 | 30 | 5 | 15 | 5 | 20 | |||||||||||||||||||||
Note: Seach pass two was twice the dimensions of search pass one.
Source: ABGM 2026
The block model was constructed with orthogonal parent block dimensions of 50 m in easting, 50 m northing and 2 m vertical direction, with subcelling to better fill the solids edges and upper surface. The small vertical parent block dimension better reflects the lateral deposition of the tailings.
TCu% and ASCu% were estimated with ordinary kriging (OK). TCo% and ASCo% were estimated with inverse distance weighting to the power of four, equivalent to the nearest neighbour estimation method.
Estimation was by parent block estimation, with discretization set to 10 by 10, in easting and northing respectively.
In areas with no or limited drilling negative kriging efficiency was produced indicating that the estimation in these areas should not be relied on. This is due to sparse widely spaced data. In these areas the grade estimation was manually reset to sample composite mean of 0.548% TCu and 0.31% ASCu. These areas are all within the Inferred classification.
| amcconsultants.com | 173 |
| S-K 1300 TRS: KCM Integrated Operations (Initial Assessment) | |
| Konkola Copper Mines Plc | 0424076 |
| 11.4.4.5 | Bulk density |
TD05 is an active dam with additional tailings being added daily. Annual statements of material incorporated into TD05 since construction provide an indication of the quantum of material present. Both wet and dry bulk density test work was completed in late 2025. The dry samples are not representative of compacted aged tailings as they were collected from the top of the dam within 1 m of surface. The wet samples are useful for processing and materials handling purposes but not the estimation of tonnage. Additional density samples are required to be collected from within the tailings profile at depth.
The rounded arithmetic average of dry bulk density test work for the late 2025 dry bulk density samples is 1.2 t/m3, which has been used to covert volume to dry bulk tonnage.
For further information on bulk density see Section 8.2.2.4.
| 11.4.4.6 | Estimation validation |
Multiple validation methods were used including: visual inspection, statistical comparison, and swath/moving average plots.
The block model volume and solid volume have a 0.0006% difference in volume, indicating the solid has been optimally filled.
Ideally parent blocks would be closer in size to the drill spacing of 125 m by 125 m, to reduce potential for conditional bias, that is the over estimation and smoothing of both low and high-grade end members. As all material is proposed to be processed via the TLP and ETL the Mineral Resource will not be subject to cut-off grade optimisation or selectivity analysis consideration of conditional bias is less important.
Cobalt is not recovered in the TLP electrowinning process, it is included for completeness.
Figure 11.32 shows a cross section of the drillholes and grade estimation coloured for TCu%, with the drillholes at approximately 125 m spacing.
Figure 11.32 Cross section of TCu% grades in drillholes and estimated block model – TD05
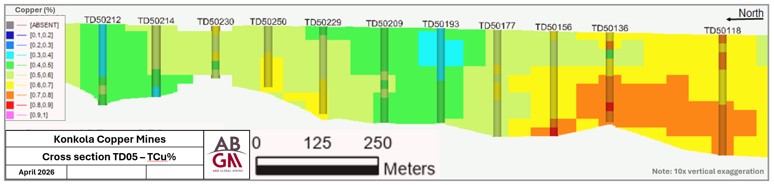
Source: ABGM 2026, modified AMC 2026.
A statistical comparison of the Indicated only material is shown in Figure 11.33. The estimation shows grade smoothing with an over estimation of lower grade and under estimation of higher grade TCu. The mean values compare well. ASCu% drillholes and block model exhibit similar a statistical comparison.
Swath plots illustrated the expected smoothing, but major biases were not apparent. Swath plots for TCu% and ASCu% are shown in Figure 11.34 and Figure 11.35.
| amcconsultants.com | 174 |
| S-K 1300 TRS: KCM Integrated Operations (Initial Assessment) | |
| Konkola Copper Mines Plc | 0424076 |
Figure 11.33 Statistical comparison of drillholes and block model – Indicated only – TD05
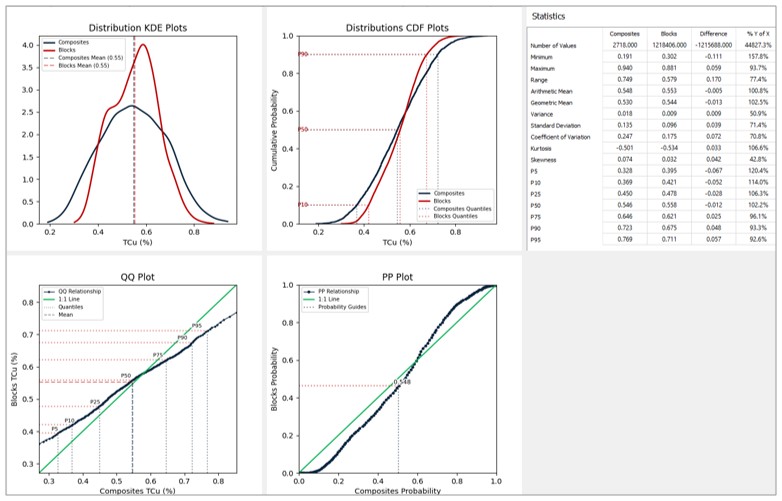
Source: ABGM 2026.
Figure 11.34 Swath plot TCu% in 124 m slices – TD05
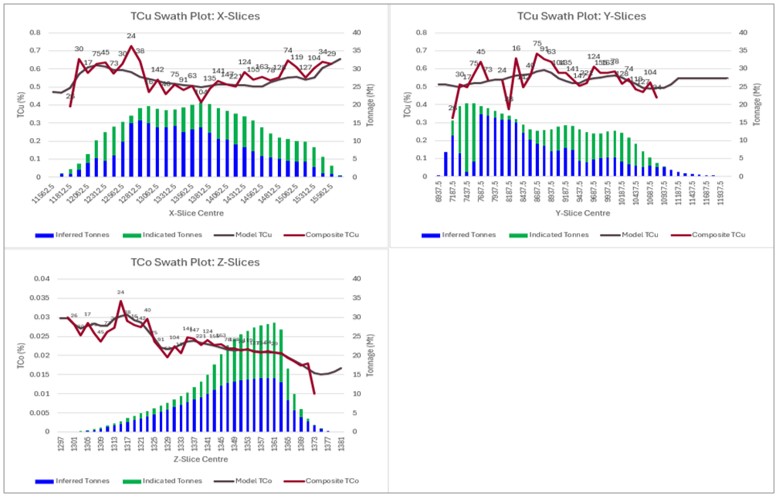
Source: ABGM 2026.
| amcconsultants.com | 175 |
| S-K 1300 TRS: KCM Integrated Operations (Initial Assessment) | |
| Konkola Copper Mines Plc | 0424076 |
Figure 11.35 Swath plot ASCu% in 124 m slices – TD05
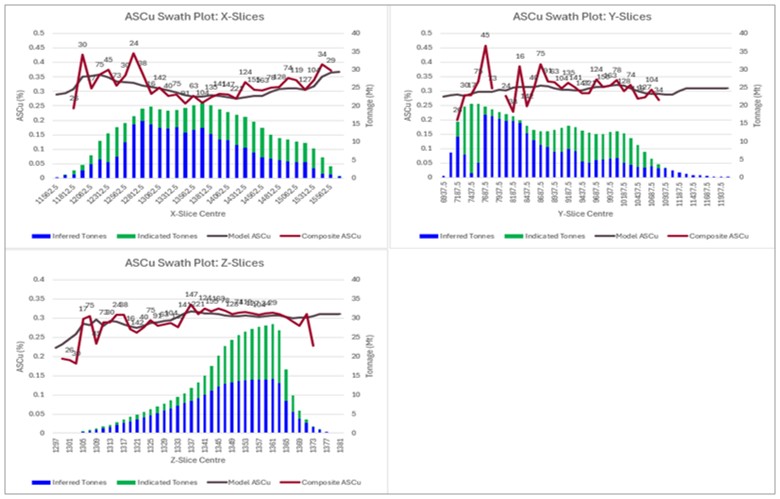
Source: ABGM 2026.
| 11.4.4.7 | Classification criteria |
Material within TD05 has been classified as Indicated and Inferred. No cut-off grade has been applied as all material will be required to be processed. Material located outside of the current mining license (7075-HQ-LML), approximately 1 Mt, is excluded from the Mineral Resource, see Figure 11.27 for location of this material.
The Indicated classification is based on systematic drilling on a nominal 150 m by 150 m grid in easting and northing, with drillholes sampled on 2 m sample intervals. The natural surface/base of the tailings dam is historic data at a low resolution. The base surface has been updated with the 2025 drill results. The historic surface requires follow-up, potentially using seismic to provide a more detailed surface. Analytical QAQC results although identifying a bias in the high-grade CRM samples, which was investigated and understood, are of reasonable quality. A volume was derived and grade estimated using standard techniques. Note the use of a 5% loss on tonnage to allow for investigations of the buttress thickness and natural surface/basement of tailings. The dry bulk density used aligns with the results of the test work completed. The bulk density applied is lower than that used in TD03 and TD04 where the material is more aged and compacted. Dry bulk density samples for TD05 are not considered to be representative of the variety of material from compacted to recent in the dam. Bulk density requires further work.
TD05 is to be processed through the Nchanga TLP and planned ETL. The processing and economic outcomes described within the report underpin support for the eventual economic extraction of the tailing’s material.
The application of the classification is shown in plan view in Figure 11.36 which also shows a blue areas that contains approximately 1 Mt of material comprised of dominantly buttress material that is located on the adjacent lease to the west. As this material is not on the Nchanga license 7075-HQ-LML it is not part of the reported Mineral Resource for TD05.
| amcconsultants.com | 176 |
| S-K 1300 TRS: KCM Integrated Operations (Initial Assessment) | |
| Konkola Copper Mines Plc | 0424076 |
Figure 11.36 Plan view of the Mineral Resource classification – TD05
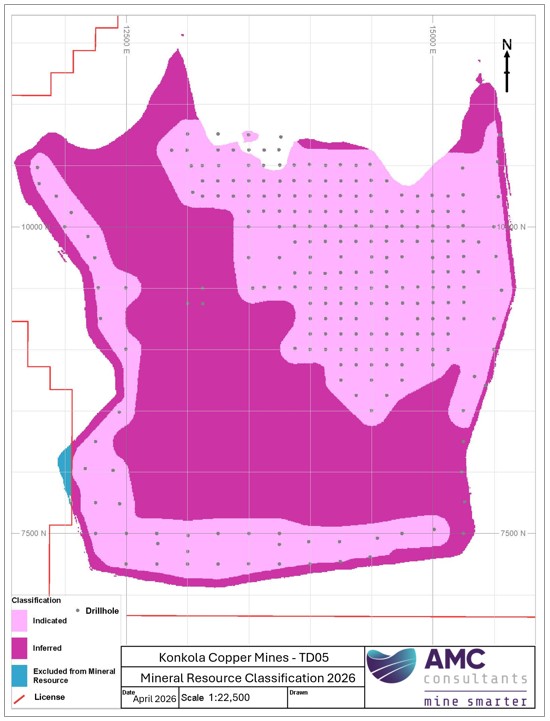
Source: AMC 2026.
| amcconsultants.com | 177 |
| S-K 1300 TRS: KCM Integrated Operations (Initial Assessment) | |
| Konkola Copper Mines Plc | 0424076 |
| 11.4.4.8 | Mineral Resource uncertainty |
Mineral Resources are not Mineral Reserves and do not necessarily demonstrate economic viability. There is no certainty that all or any part of this Mineral Resource will be converted into Mineral Reserve.
The TD05 Mineral Resource is classified as an Indicated and Inferred Mineral Resource.
Mineral Resource estimates may be materially affected by the quality of data, natural geological variability of mineralisation, metallurgical recovery, and the accuracy of the economic assumptions supporting reasonable prospects for economic extraction including metal prices, and mining and processing costs.
The classification of Inferred, with the wide drill data spacing, is supported via a good understanding of the geological and grade continuity observed from drilling and the extensive mining history.
The upgrade in the classification of the Mineral Resource from Inferred through to Measured represents an increased understanding of the items that materially impact geological variability. This results in minimisation of uncertainty and reduced risk.
Resource classification upgrades are achieved through increasing geological understanding by:
| · | Reducing drillhole spacing within the existing deposit extent. |
| · | Increasing the understanding of bulk density. |
| · | Increasing the understanding of the buttress dimensions and natural floor surface location. |
For TD05, this will be achieved through the planned infill drilling programs (refer Section 23) and test work, which are intended to upgrade Inferred Mineral Resources to Indicated classification.
It is not anticipated that the license status of this small area in the west of TD05 would not, over the medium term, materially impact the likelihood of TD05 progressing to a Mineral Reserve.
| 11.4.4.9 | Mineral Resource estimate |
TD05 is an active tailings dam receiving tailings from the Nchanga TLP. The Mineral Resource estimate for TD05 is shown in Table 11.28.
Table 11.28 Mineral Resource TD05 – 1 April 2026
| Classification | Cut-off TCu% | Tonnes (Mt) | TCu % | ASCu % | Cu (kt) | TCo % | Co (kt) | |||||||||||||||||||||
| Measured | - | - | - | - | - | - | - | |||||||||||||||||||||
| Indicated | 0.0 | 198 | 0.55 | 0.31 | 1,091 | 0.02 | 44 | |||||||||||||||||||||
| Measured + Indicated | 0.0 | 198 | 0.55 | 0.31 | 1,091 | 0.02 | 44 | |||||||||||||||||||||
| Inferred | 0.0 | 225 | 0.53 | 0.3 | 1,180 | 0.02 | 49 | |||||||||||||||||||||
| Total | 423 | 0.54 | 0.3 | 2,272 | 0.02 | 93 | ||||||||||||||||||||||
Notes:
| · | Mineral Resources are reported with an effective date of 1 April 2026. |
| · | No Mineral Reserves are declared as part of this Initial Assessment. Mineral Resources are reported in their entirety. |
| · | Classification in accordance with S-K 1300. |
| · | Approximately 53% of the TD05 Mineral Resources are classified as Inferred (225 Mt of 423 Mt). Inferred Mineral Resources are considered too speculative geologically to be categorised as Mineral Reserves at this time, and there is no certainty that Inferred Mineral Resources will be converted to higher confidence categories with additional exploration. |
| · | No cut-off grade has been applied; as TD05 is an existing tailings storage facility being reclaimed in its entirety, conventional cut-off grade methodology is not applicable. |
| · | Point of reference: In situ material. |
| · | Metallurgical recovery — Nchanga TLP processing routes: Recovery assumptions vary by deposit and processing route. TD03 and TD04 — existing Nchanga TLP, ambient leach: 74.8% ASCu recovery, equivalent to approximately 48.5% TCu recovery to cathode. TD05 — processed through the existing Nchanga TLP (retrofitted with elevated temperature leach) under both the M&I Case and the Full Resource Case; under the Full Resource Case, the additional TD05 throughput required to process the larger Mineral Resource scope is also processed through the proposed TLP 2 facility (refer Section 14.5), with both plants operating in parallel and using elevated temperature leach. TCu recovery to cathode is determined by feed grade per Section 10.4.4.5 and capped at 82% for TCu grades above 1.5%. Case-level blended TCu recoveries to cathode are reported in Table 1.13 and Table 19.2 (66.8% Full Resource Case; 56.7% M&I Case) and reflect the deposit mix, feed scheduling, and the timing of the elevated temperature leach upgrade. |
| · | Cobalt is present in situ but is not recovered in the TLP electrowinning process. Cobalt grades are reported for geological completeness; no cobalt revenue is attributed to TD05 in the economic analysis. |
| · | Processing route: Nchanga TLP → Copper cathode. |
| · | Tonnage and grade are rounded; this may result in minor computational discrepancies. |
| · | Mineral Resources are 100% attributable to KCM. |
| amcconsultants.com | 178 |
| S-K 1300 TRS: KCM Integrated Operations (Initial Assessment) | |
| Konkola Copper Mines Plc | 0424076 |
| 11.5 | Qualified Person’s opinion |
It is the QP’s opinion that the Konkola Mineral Resource block models are representative of the informing data and that this data is of sufficient quality to support the Mineral Resource estimate to Measured, Indicated, and Inferred confidence levels.
The Nchanga assets COP DF and COP E Extension informing data has been collected at different historic times, much in the absence of rigorous QAQC, and as a result not all input data is of the same quality. However, mining and processing has successfully been undertaken at both COP DF and COP E Extension in areas based on historic data. This does not wholly negate future uncertainty and additional drilling via select twin holes would be useful to verify some areas with older data. The grade estimation block models although created using all available data should be updated to include lithological interpretations (where absent) and consider the use of new estimation techniques. It is the QP’s opinion that while there is room for improvement the resource estimations for the Nchanga assets COP DF and COP E Extension are representative of the informing data and are of a suitable quality for use as the primary input for reporting the Mineral Resource estimation to Indicated, and Inferred confidence levels.
It is the QP’s opinion that the TD03, TD04 and TD05 tonnage and grade are representative of the informing data and that this data is of sufficient quality to support the Mineral Resource estimate to an Indicated and Inferred confidence level.
| amcconsultants.com | 179 |
| S-K 1300 TRS: KCM Integrated Operations (Initial Assessment) | |
| Konkola Copper Mines Plc | 0424076 |
| 12 | Mineral Reserve estimates |
No Mineral Reserves are declared in this Initial Assessment.
This Initial Assessment has been prepared to evaluate the economic potential of the KCM Mineral Resource base, including Inferred Mineral Resources, in accordance with Item 1302(d)(4)(ii) of Regulation S-K, Subpart 1300. An Initial Assessment is preliminary in nature and does not support the determination of Mineral Reserves.
Mineral Reserves for the KCM Integrated Operations have been separately estimated and declared in the companion Preliminary Feasibility Study Technical Report Summary: KCM Integrated Operations (AMC Consultants, effective 1 April 2026), which demonstrates economic viability based exclusively on Measured and Indicated Mineral Resources after the application of modifying factors. The reader is directed to the PFS TRS for the Mineral Reserve estimate, supporting mine plan, modifying factors, and economic analysis.
Mineral Resources that are not Mineral Reserves do not have demonstrated economic viability.
| amcconsultants.com | 180 |
| S-K 1300 TRS: KCM Integrated Operations (Initial Assessment) | |
| Konkola Copper Mines Plc | 0424076 |
| 13 | Mining methods |
Cautionary Statement Regarding Forward-Looking Information
This section contains forward-looking information and forward-looking statements within the meaning of applicable securities legislation. Forward-looking statements in this section include, but are not limited to, statements regarding: planned mining methods and their expected performance; anticipated production rates, mine life, and development schedules; projected mining dilution and recovery factors; planned underground development, paste fill infrastructure, and ventilation systems; equipment fleet requirements and workforce plans; expected dewatering rates, pump infrastructure upgrades, and groundwater management; and geotechnical assumptions underpinning mine design.
Actual results may differ materially from those expressed or implied by such forward-looking statements due to risks and uncertainties including, but not limited to: variations in actual geotechnical conditions from those modelled; changes in groundwater inflow rates or failure to achieve projected dewatering capacity; delays in commissioning of the paste fill plant, 1390 mL pump station, or ventilation shaft upgrades; contractor performance and equipment productivity below plan; unforeseen geological structures or ground conditions; changes in commodity prices affecting cut-off grades; and regulatory, labour, or supply chain disruptions. See Section 2 for a comprehensive discussion of risk factors.
| 13.1 | Introduction |
KCM operates a range of mining areas across the Zambian Copperbelt. Mining methods are selected and adapted to suit the geological setting, orebody geometry, ground conditions, and infrastructure at each deposit. KCM’s assets include the Konkola Mine and Nchanga mining complex (Figure 13.1).
This Initial Assessment presents a conceptual mining approach for the KCM Integrated Operations based on the full Mineral Resource inventory. The Mineral Resource base of 318.3 Mt @ 3.11% TCu supports a potential mine life of approximately 45 years, subject to conversion of Inferred Resources to higher confidence categories through continued exploration.
Production schedules for the near-term are based on the M&I Case mine plan, with longer-term production contingent on Resource conversion and infrastructure development. The two production scenarios considered in this Initial Assessment are summarised in Table 13.1.
Table 13.1 KCM production scenarios – M&I Case and Full Resource Case
| Scenario | Basis | Mined ore (Mt) | Mined grade (%) | TLP feed (Mt) | TLP grade (%) | Total (Mt) | Integrated Cu (kt) | Mine life | ||||||||||||||||||||
| M&I Case | Measured and Indicated Resources | 29.1 | 2.89 | % | 224.6 | 0.56 | % | 253.7 | 1,446 | ~15 years | ||||||||||||||||||
| Full Resource Case | Measured, Indicated and Inferred Resources | 253.6 | 2.90 | % | 473.6 | 0.57 | % | 727.3 | 7,880 | ~45 years | ||||||||||||||||||
Note: Mined ore comprises KCM and NBU mining production (Konkola Mine plus, in the Full Resource Case, COP DF Open Pit, COP E Extension, and Nchanga Underground). TLP feed comprises reclaimed tailings from TD03, TD04, and (in both cases) the M&I portion of TD05; the Full Resource Case additionally includes the Inferred portion of TD05. Integrated Cu represents total payable copper production across all sources (mining and TLP), as reported in Table 1.13. Grades are LOM weighted averages.
| amcconsultants.com | 181 |
| S-K 1300 TRS: KCM Integrated Operations (Initial Assessment) | |
| Konkola Copper Mines Plc | 0424076 |
Figure 13.1 Location of KCM's Konkola and Nchanga Mining operations
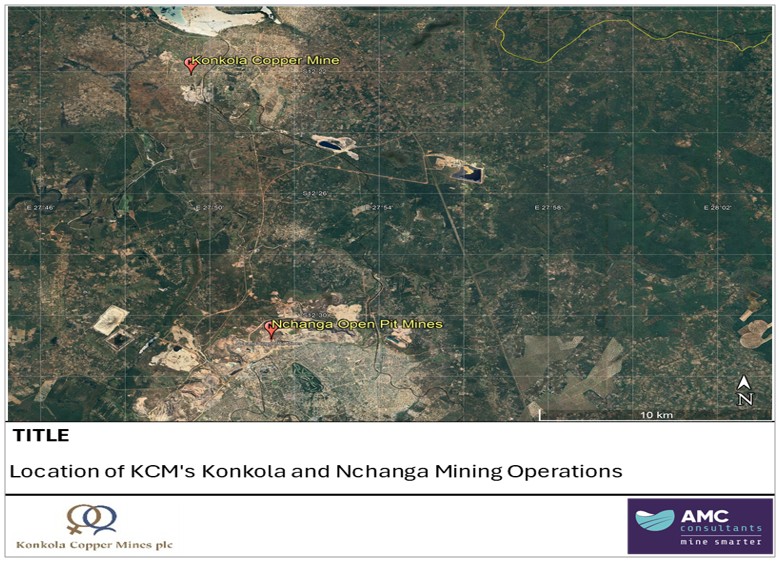
Source: AMC, 2026.
As part of the KCM operations, Table 13.2 identifies the KCM operations that have been included as part of the LOM assessment.
Table 13.2 KCM LOM mining areas
| Mining Zone | Orebody | |
| Konkola Mine (Konkola Mine) |
Konkola East Konkola Flats Konkola Extension Bancroft North Bancroft Central Bancroft South Bancroft Deeps | |
| Nchanga Business Unit (NBU) |
COP DF open pit (OP) COP DF underground (UG) COP E Ext UG Nchanga UG TFQ – New West Mill Nchanga UG BSS – New East Mill Nchanga UG BSS – New West Mill Recovery Blocks Block A Block K Chingola B Tailings reclamation (TD03, TD04, TD05) |
| amcconsultants.com | 182 |
| S-K 1300 TRS: KCM Integrated Operations (Initial Assessment) | |
| Konkola Copper Mines Plc | 0424076 |
| 13.2 | Konkola Mine |
The Konkola Mine is one of the deepest and most geotechnically complex underground mines in the region. Mining methods include longitudinal LHOS and panel stoping with paste fill. The operation is characterised by exceptionally high groundwater inflows (approximately 350,000 m³/day).
| 13.2.1 | Konkola Mine - Geotechnical considerations |
Two classification systems were used to assess the rock mass conditions and to develop design parameters:
| · | Q-system (Barton et al., 1974): Applied to assess rock mass conditions in development. This system incorporates RQD, joint characteristics, water inflow, and stress reduction to classify rock mass quality to enable ground support type recommendations. |
| · | Modified Q’ system (Matthews et al., 1981; Potvin, 1988): Used for evaluating stope stability. This system omits water and stress terms to focus on joint-controlled stability some 10 m either side of the orebody in the hangingwall and footwall, for an assessment of stable stope dimension and an estimate for the potential of unplanned overbreak (ELOS). |
| 13.2.1.1 | Geotechnical domains |
The orientation of the orebody and associated mining areas are aligned with the dip of mineralisation and ground conditions. The orebody dips between 35° and 70°, with an average thickness of 9 m. Konkola East and Flats orebody dips are relatively shallow with ground conditions ranging from fair to good, with localised poor-quality zones typically associated with weaker lithologies such as Unit A. The overall rock mass is competent with manageable stress levels. Ground support requirements are largely influenced by lithological variability and structural intersections. Stope stability will be influenced by the span of the relatively shallow dipping hangingwall.
The orebody steepens from Konkola Extension through the Bancroft zones. The deeper areas show greater variability in rock mass quality, ranging from very poor, particularly near faulted zones, to good. Increased stress magnitudes, rock mass relaxation, and plastic strain zones are evident at depth, especially in the hangingwall where structures intersect weaker units (e.g., Unit A and ore shale). These zones are more prone to deformation and overbreak, necessitating more robust support designs, particularly in development headings and stope hangingwalls.
Primary lithology units include:
| · | Hangingwall quartzite: Generally competent; sequence of siltstones, sandstones, and shales, with interbedded dolomite and gabbro intrusions, localised weak zones at the contact with the ore shale, occasionally where Unit A is present. |
| · | Ore Shale Units A–E: Variable siltstone unit with five subunits (A to E), with mechanical behaviour closely tied to dip and composition. Unit A is the weakest unit, clay-altered, that behaves like a shear surface, correlating with poor ground and higher dilution potential. Thickness increases with orebody dip; Units B–E show improved rock strength, with Unit B being the most massive and competent. Unit D is gradational with carbonate bands, while Unit E marks the orebody top and progressively thickens. |
| · | Footwall quartzite: Generally competent quartzite; supports much of the mine’s infrastructure and comprises conglomerates, sandstones, and aquifer-hosting formations local weakness at lithological contacts. |
| amcconsultants.com | 183 |
| S-K 1300 TRS: KCM Integrated Operations (Initial Assessment) | |
| Konkola Copper Mines Plc | 0424076 |
The mining areas and geotechnical domains are presented in the following zones outlined in Table 13.3 and Table 13.4. Figure 13.2 shows the locations of the geotechnical domains in relation to mine infrastructure. These were assessed independently from available geotechnical mapping data to determine ground conditions and support requirements.
Figure 13.2 Plan view map of the Konkola mine showing the geotechnical domains
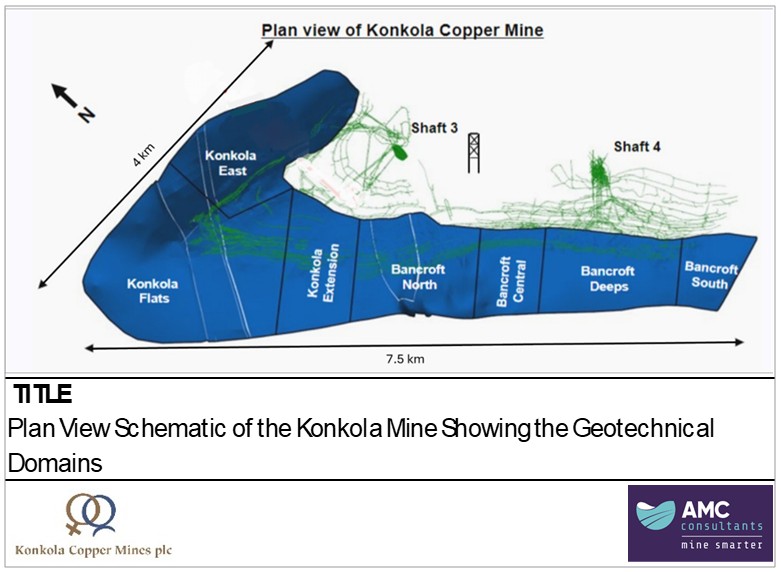
Source: AMC, 2026.
| amcconsultants.com | 184 |
| S-K 1300 TRS: KCM Integrated Operations (Initial Assessment) | |
| Konkola Copper Mines Plc | 0424076 |
Table 13.3 KCM Shaft 3 summary of rock mass properties
| Area |
Zone (mW) |
Rock mass properties |
Hangingwall quartzite |
Ore shale | Unit A | Footwall | Mining method |
|
KONKOLA EAST Average orebody dip is 57° from 800 mRL to 600 mRL Average ore body dip is 25° <600 mRL |
2,200 | RQD | 52 | 81.2 | 0 | 68 |
Shallow dip (below 30°) uphole (panel) LHOS Steep dip (above 45°) LHOS |
| RMR | 67.5 | 58 | 4 | 59 | |||
| Q | 13.6 | 5.0 | 0.02 | 5.6 | |||
| Q' | - | - | - | - | |||
| Intact rock strength (MPa) | >250 | >200 | 12.5 | >200 | |||
| Ground water | Flowing | Flowing | Flowing | Flowing | |||
| Stress state | Low | Low | Low | Low | |||
| Rockmass characterisation | Good | Fair | Very poor | Fair | |||
| 1,800 | RQD | 80 | 24 | 0 | 31 | ||
| RMR | 60 | 57.5 | 4 | 50 | |||
| Q | 6.20 | 4.80 | 0.02 | 2.12 | |||
| Q' | 32.5 | 5.2 | 2.1 | 4.0 | |||
| Intact rock strength (MPa) | >250 | >200 | 12.5 | >200 | |||
| Ground water | Flowing | Flowing | Flowing | Flowing | |||
| Stress state | Low | Low | Low | Low | |||
| Rockmass characterisation | Fair | Fair | Poor | Poor | |||
| 1,400 | RQD | 62 | 21 | 0 | 65 | ||
| RMR | 67.5 | 60 | 4 | 50 | |||
| Q | 13.9 | 6.2 | 0 | 2.1 | |||
| Q' | - | - | - | - | |||
| Intact rock strength (MPa) | >250 | >200 | 12.5 | >200 | |||
| Ground water | Flowing | Flowing | Flowing | Flowing | |||
| Stress state | Low | Low | Low | Low | |||
| Rockmass characterisation | Good | Fair | Very poor | poor | |||
| 1,000 | RQD | 72 | 43 | 0 | 60.5 | ||
| RMR | 69 | 64 | 12 | 65.5 | |||
| Q | 16.4 | 9.6 | 0 | 11.2 | |||
| Q' | 11.5 | 2.7 | 0 | 3.8 - 10.6 | |||
| Intact rock strength (MPa) | >250 | >200 | 12.5 | >200 | |||
| Ground water | Flowing | wet | wet | wet | |||
| Stress state | Low | Low | Low | Low | |||
| Rockmass characterisation | Good | Fair | Very poor | Poor to good | |||
| 600 | RQD | 61 | 43 | 0 | 51 | ||
| RMR | 64.5 | 56 | 12 | 64 | |||
| Q | 10.1 | 4 | 0 | 9.6 | |||
| Q' | 8.4 | 2.3 | 0 | 3.2 – 8.4 | |||
| Intact rock strength (MPa) | >250 | >200 | 12.5 | >200 | |||
| Ground water | Flowing | Flowing | Flowing | Flowing | |||
| Stress state | Low | Low | Low | Low | |||
| Rockmass characterisation | Good | Fair | Very poor | Fair | |||
| 200 | RQD | 61 | 43 | 0 | 51 | ||
| RMR | 64.5 | 56 | 12 | 64 | |||
| Q | 10.1 | 4 | 0 | 9.6 | |||
| Q' | - | - | - | - | |||
| Intact rock strength (MPa) | >250 | >200 | 12.5 | >200 | |||
| Ground water | Flowing | Flowing | Flowing | Flowing | |||
| Stress state | Low | Low | Low | Low | |||
| Rockmass characterisation | Good | Fair | Very poor | Fair |
| amcconsultants.com | 185 |
| S-K 1300 TRS: KCM Integrated Operations (Initial Assessment) | |
| Konkola Copper Mines Plc | 0424076 |
| Area |
Zone (mW) |
Rock mass properties |
Hangingwall quartzite |
Ore shale | Unit A | Footwall | Mining method |
|
KONKOLA EXTENSION Average ore body dip is 30° |
3,200 | RQD | 68 | 47.5 | 21 | 56 | Shallow dip (below 30°) uphole (panel) LHOS |
| RMR | 67.5 | 56.5 | 5 | 64 | |||
| Q | 13.9 | 4.3 | 0 | 9.6 | |||
| Q' | 11.1 | 3.5 | 0 | 2.4 | |||
| Intact rock strength (MPa) | >250 | >200 | 12.5 | >200 | |||
| Ground water | Damp / wet | Damp | Damp | Damp | |||
| Stress state | Moderate to high | Moderate to high | Moderate to high | Moderate to high | |||
| Rockmass characterisation | Good | Fair | Very poor | Fair | |||
| 3,600 | RQD | 86.5 | 66.5 | 0 | 72.5 | ||
| RMR | 60 | 57.5 | 7.5 | 54.5 | |||
| Q | 6.2 | 4.8 | 0 | 3.4 | |||
| Q' | - | - | - | - | |||
| Intact rock strength (MPa) | >250 | >200 | 12.5 | >200 | |||
| Ground water | Damp / wet | Damp | Damp | Damp | |||
| Stress state | Low | Low to moderate | Low | Low | |||
| Rockmass characterisation | Fair | Fair | Very poor | Poor | |||
|
KONKOLA FLATS Average ore body dip is 30° (400 mRL to 600 mRL) Average ore body dip is 20° (<400 mRL) |
4,200 | RQD | 62 | 73.2 | 0 | 63 | Shallow dip (below 30°) uphole (panel) LHOS |
| RMR | 60 | 60 | 9.5 | 62.5 | |||
| Q | 6.2 | 6.2 | 0 | 8.1 | |||
| Q' | 11.1 | 3.8 | 0 | 14.6 | |||
| Intact rock strength (MPa) | >250 | >200 | 12.5 | >200 | |||
| Ground water | Damp | Damp | Damp | Damp | |||
| Stress state | Low | Low | Low | Low | |||
| Rockmass characterisation | Fair | Fair | Very poor | Fair | |||
| 4,800 | RQD | 45 | 57 | 0.2 | - | ||
| RMR | 59 | 53 | 9.5 | 62 | |||
| Q | 5.6 | 2.9 | 0 | 7.7 | |||
| Q' | - | - | - | - | |||
| Intact rock strength (MPa) | >250 | >200 | 12.5 | >200 | |||
| Ground water | Wet / flowing | wet | wet | Wet | |||
| Stress state | Low to moderate | Low | Low | Low | |||
| Rockmass characterisation | Fair | Poor | Very poor | Fair | |||
| 2,520 | RQD | 50 | 85.5 | 0 | 70 | ||
| RMR | 53.5 | 47.5 | 12 | 64 | |||
| Q | 3.1 | 1.6 | 0 | 9.6 | |||
| Q' | - | - | - | - | |||
| Intact rock strength (MPa) | >250 | >200 | 12.5 | >200 | |||
| Ground water | Flowing | wet | wet | Wet | |||
| Stress state | Low To moderate | Moderate to high | Moderate to high | Low to moderate | |||
| Rockmass characterisation | Poor | Poor | Very poor | Fair |
| amcconsultants.com | 186 |
| S-K 1300 TRS: KCM Integrated Operations (Initial Assessment) | |
| Konkola Copper Mines Plc | 0424076 |
Table 13.4 KCM Shaft 4 summary of rock mass properties
| Area | Zone |
Rock mass properties |
Hangingwall Q |
Ore shale | Unit A | Footwall |
Mining method |
|
BANCROFT NORTH (2,475 mN) Average ore body dip is 41° (600 mRL to 400 mRL) Average ore body dip is 48° (<400 mRL) |
2,250 mN – 2,300 mN | RQD | 90 | 80 | 20 | 85 | LHOS |
| RMR | 69 | 55.5 | 17.5 | 63.5 | |||
| Q | 16.4 | 3.8 | 0.1 | 9.1 | |||
| Q' | - | - | - | - | |||
| Intact rock strength (MPa) | 150 | 150 | 150 | 165 | |||
| Joint Orientation | Unfavourable | Fair | Unfavourable | Unfavourable | |||
| Ground water | Damp | Damp | Dry | Damp / wet / drip / flow | |||
| Stress state | Medium | Medium | Medium | Medium | |||
| Rockmass characterisation | Good | Poor | Very poor | Fair | |||
| 2,300 mN – 2,330 mN | RQD | 90 | 80 | 20 | 85 | ||
| RMR | 69 | 60 | 17.5 | 63.5 | |||
| Q | 16.4 | 6.2 | 0.1 | 9.1 | |||
| Q' | - | - | - | - | |||
| Intact rock strength (MPa) | 150 | 150 | 150 | 165 | |||
| Joint Orientation | Unfavourable | Fair | Unfavourable | Unfavourable | |||
| Ground water | Damp / wet | Damp / wet | Dry | Damp / wet | |||
| Stress state | Medium | Medium | Medium | Medium | |||
| Rockmass characterisation | Good | Fair | Very poor | Fair | |||
| 2,330 mN – 2,450 mN | RQD | 87 | - | 20 | 75 | ||
| RMR | 76 | 59 | 17.5 | 63.5 | |||
| Q | 34.8 | 5.6 | 0.1 | 9.1 | |||
| Q' | - | - | - | - | |||
| Intact rock strength (MPa) | 150 | 150 | 150 | 165 | |||
| Joint Orientation | Very favourable | Fair | Unfavourable | Fair | |||
| Ground water | Damp | Damp | Dry | Wet | |||
| Stress state | Medium | Medium | Medium | Low to moderate | |||
| Rockmass characterisation | Good | Fair | Very poor | Fair | |||
| 2,450 mN – 2,650 mN | RQD | 70 | 60 | 10 | 65 | ||
| RMR | 76 | 57.5 | 17.5 | 60 | |||
| Q | 34.8 | 4.8 | 0.1 | 6.2 | |||
| Q' | - | - | - | - | |||
| Intact rock strength (MPa) | 150 | 150 | 150 | 150 | |||
| Joint Orientation | Very favourable | Fair | Unfavourable | Fair | |||
| Ground water | Damp | Dry | Dry | Wet | |||
| Stress state | High | Medium | Medium | Low to moderate | |||
| Rockmass characterisation | Good | Fair | Very poor | Fair | |||
| 2,650 mN – Fault Zone | RQD | 70 | 60 | 10 | 65 | ||
| RMR | 62.5 | 35.5 | 12 | 56 | |||
| Q | 8.1 | 0.4 | 0 | 4 | |||
| Q' | - | - | - | - | |||
| Intact rock strength (MPa) | 150 | 100 | 2 | 129 | |||
| Joint Orientation | Unfavourable | Unfavourable | Very unfavourable | - | |||
| Ground water | Dry | Dry | Dry | - | |||
| Stress state | High | Medium | High | - | |||
| Rockmass characterisation | Fair | Very poor | Very poor | Fair |
| amcconsultants.com | 187 |
| S-K 1300 TRS: KCM Integrated Operations (Initial Assessment) | |
| Konkola Copper Mines Plc | 0424076 |
| Area | Zone |
Rock mass properties |
Hangingwall Q |
Ore shale | Unit A | Footwall |
Mining method |
|
BANCCROFT NORTH (2,120) Average ore body dip is 48° (600 mRl to 300 mRL) Average ore body dip is 65° (<300 mRL) |
1,870 mN – 2,050 mN | RQD | 100 | 100 | 0 | 100 | LHOS |
| RMR | 85 | 79 | 30 | 68 | |||
| Q | 91.5 | 48 | 0.2 | 14.7 | |||
| Q' | - | - | - | - | |||
| Intact rock strength (MPa) | >200 | >200 | 100 | 175 | |||
| Joint Orientation | Favourable | Very favourable | Very favourable | Fair / Unfavourable | |||
| Ground water | Damp | Damp | Damp | Damp / wet / drip / flow | |||
| Stress state | Medium | Medium | Medium | Medium | |||
| Rockmass characterisation | Very good | Very good | Very poor | Good | |||
| 2,050 mN – 2,150 mN | RQD | 87 | 90 | 0 | - | ||
| RMR | 74.5 | 56 | 23 | 63 | |||
| Q | 29.6 | 4 | 0.4 | 8.6 | |||
| Q' | - | - | - | - | |||
| Intact rock strength (MPa) | 150 | 100 | 0 | 150 | |||
| Joint Orientation | Unfavourable | Fair / Very unfavourable | Fair | Unfavourable | |||
| Ground water | Wet | Wet | Wet | Wet | |||
| Stress state | Medium | High | Medium | Medium | |||
| Rockmass characterisation | Good | Fair | Very poor | Fair | |||
| 2,150 mN – 2,200 mN – Fault Zone | RQD | 100 | 82.5 | 0 | 100 | ||
| RMR | 67 | 55.5 | 16 | - | |||
| Q | 13.2 | 3.8 | 0.1 | - | |||
| Q' | - | - | - | - | |||
| Intact rock strength (MPa) | 150 | 87.5 | 0 | 125 | |||
| Joint Orientation | Fair | Fair / Very unfavourable | Very unfavourable | Fair | |||
| Ground water | Wet | Damp / wet | Damp | Flowing | |||
| Stress state | High | High | Low | Medium | |||
| Rockmass characterisation | Good | Poor | Very poor | - | |||
| 2,200 mN – 2,250 mN | RQD | 100 | 100 | 10 | 70 | ||
| RMR | 67 | 61 | 17.5 | 63 | |||
| Q | 13.2 | 6.9 | 0.1 | 8.6 | |||
| Q' | - | 19 | - | - | |||
| Intact rock strength (MPa) | 150 | >200 | 150 | 100 | |||
| Joint Orientation | Fair | Unfavourable | Very unfavourable | Unfavourable | |||
| Ground water | Wet | Wet | Damp / wet | Damp / wet / drip / flow | |||
| Stress state | High | High | Low | Medium | |||
| Rockmass characterisation | Good | Fair | Very poor | Fair |
| amcconsultants.com | 188 |
| S-K 1300 TRS: KCM Integrated Operations (Initial Assessment) | |
| Konkola Copper Mines Plc | 0424076 |
| Area | Zone |
Rock mass properties |
Hangingwall Q |
Ore shale | Unit A | Footwall |
Mining method |
|
BANCROFT NORTH (1,700 mN) Average ore body dip is 48° (600 mRl to 300 mRL) Average ore body dip is 65° (<300 mRL) |
1,500 mN – 1,600 mN | RQD | - | - | - | - | LHOS |
| RMR | 66.5 | 65.5 | 23.5 | 61.5 | |||
| Q | 12.5 | 11.2 | 0.1 | 7.3 | |||
| Q' | - | >424 | - | - | |||
| Intact rock strength (MPa) | 200 | 150 | 3 | 143 | |||
| Joint Orientation | Unfavourable | Very unfavourable | Very unfavourable | - | |||
| Ground water | Dry | Dry | Dry | Wet | |||
| Stress state | High | High | Low | Low to moderate | |||
| Rockmass characterisation | Good | Good | Very poor | Fair | |||
| 1,600 mN – 1,700 mN | RQD | 90 | 100 | 0 | 100 | ||
| RMR | 74 | 79 | 30 | 68 | |||
| Q | 28 | 48 | 0.2 | 14.7 | |||
| Q' | - | - | - | - | |||
| Intact rock strength (MPa) | >200 | >200 | 100 | 175 | |||
| Joint Orientation | Favourable | Very favourable | Very unfavourable | Fair / Unfavourable | |||
| Ground water | Damp | Damp | Damp | Damp / wet / drip / flow | |||
| Stress state | Medium | Medium | Medium | Medium | |||
| Rockmass characterisation | Good | Very good | Very poor | Good | |||
| 1,700 mN – 1,800 mN | RQD | 90 | 100 | 0 | 100 | ||
| RMR | 74 | 79 | 30 | 68 | |||
| Q | 28 | 48 | 0.2 | 14.7 | |||
| Q' | - | - | - | - | |||
| Intact rock strength (MPa) | >200 | >200 | 100 | 175 | |||
| Joint Orientation | Favourable | Very favourable | Very unfavourable | Fair / Unfavourable | |||
| Ground water | Damp | Damp | Damp | Damp / wet / drip / flow | |||
| Stress state | Medium | Medium | Medium | Medium | |||
| Rockmass characterisation | Good | Very good | Very poor | Good | |||
| 1,800 mN – 1,870 mN | RQD | 90 | 100 | 0 | 100 | ||
| RMR | 74 | 79 | 30 | 68 | |||
| Q | 28 | 48 | 0.2 | 14.7 | |||
| Q' | - | - | - | - | |||
| Intact rock strength (MPa) | >200 | >200 | 100 | 175 | |||
| Joint Orientation | Favourable | Very favourable | Very unfavourable | Fair / unfavourable | |||
| Ground water | Damp | Damp | Damp | Damp / wet / drip / flow | |||
| Stress state | Medium | Medium | Medium | Medium | |||
| Rockmass characterisation | Good | Very good | Very poor | Good |
| amcconsultants.com | 189 |
| S-K 1300 TRS: KCM Integrated Operations (Initial Assessment) | |
| Konkola Copper Mines Plc | 0424076 |
| Area | Zone |
Rock mass properties |
Hangingwall Q |
Ore shale | Unit A | Footwall |
Mining method |
|
BANCROFT NORTH (2,800 mN) Average orebody dip is 44° (600 mRL – 400 mRL) Average orebody is dip 67° (<400 mRL) |
2,640 mN – Fault zone | RQD | 70 | 80 | 12.5 | 80 | LHOS |
| RMR | 62.5 | 35.5 | 12 | 56 | |||
| Q | 8.1 | 0.4 | 0 | 4 | |||
| Q' | - | - | 0 | - | |||
| Intact rock strength (MPa) | 150 | 150 | 2 | 129 | |||
| Joint Orientation | Unfavourable | Unfavourable | Unfavourable | Fair | |||
| Ground water | Dry | Dry | Dry | Wet | |||
| Stress state | High | High | High | Medium | |||
| Rockmass characterisation | Fair | Very poor | Very poor | Fair | |||
| 2,640 mN – 2,700 mN | RQD | 69.5 | 66 | 0 | 75 | ||
| RMR | 73 | 66.5 | 24 | 56 | |||
| Q | 25 | 12.5 | 0.1 | 4 | |||
| Q' | - | - | - | - | |||
| Intact rock strength (MPa) | 220 | 200 | 2 | 150 | |||
| Joint Orientation | Fair | Very unfavourable | - | Unfavourable | |||
| Ground water | Dry | Dry | Dry | Dry | |||
| Stress state | - | Medium / High | High | Medium | |||
| Rockmass characterisation | Good | Good | Very poor | Fair | |||
| 2,700 mN – 2,800 mN | RQD | 69.5 | 85 | - | - | ||
| RMR | 73 | 6.5 | 24 | 50 | |||
| Q | 25 | 6.5 | 0.1 | 2 | |||
| Q' | - | - | - | - | |||
| Intact rock strength (MPa) | 220 | 150 | 2 | 175 | |||
| Joint Orientation | Fair | Fair / Unfavourable | Unfavourable | Unfavourable | |||
| Ground water | Dry | Dry | Dry | Dry | |||
| Stress state | Medium | Medium | Medium | Medium | |||
| Rockmass characterisation | Good | Fair | Very poor | Poor | |||
| 2,800 mN – 2,900 mN | RQD | 90 | 85 | 0 | 70 | ||
| RMR | 63 | 58 | 24 | 60 | |||
| Q | 8.6 | 5 | 0.1 | 6 | |||
| Q' | - | - | - | - | |||
| Intact rock strength (Mpa) | 150 | - | 2 | 150 | |||
| Joint Orientation | Unfavourable | Unfavourable | Unfavourable | Unfavourable | |||
| Ground water | Dry / damp | Dry | Dry | Dry | |||
| Stress state | Medium | Medium | Medium | Medium | |||
| Rockmass characterisation | Fair | Fair | Very poor | Fair | |||
| 2,900 mN – 3,000 mN | RQD | 90 | 82.5 | 0 | 82.5 | ||
| RMR | 63 | 64.5 | 24 | 58 | |||
| Q | 8.6 | 10 | 0.1 | 5 | |||
| Q' | - | - | - | - | |||
| Intact rock strength (Mpa) | 150 | 150 | 2 | 160 | |||
| Joint Orientation | Unfavourable | Unfavourable | Very unfavourable | Unfavourable | |||
| Ground water | Dry / Damp | Dry | Dry | Dry | |||
| Stress state | Medium | Medium | Medium | Medium | |||
| Rockmass characterisation | Fair | Fair | Very poor | Fair |
| amcconsultants.com | 190 |
| S-K 1300 TRS: KCM Integrated Operations (Initial Assessment) | |
| Konkola Copper Mines Plc | 0424076 |
| Area | Zone |
Rock mass properties |
Hangingwall Q |
Ore shale | Unit A | Footwall |
Mining method |
|
BANCROFT CENTRAL (920 mN and 1,220 mN) Average orebody dip is 61° |
700 mN – 1,100 mN | RQD | 25 | - | - | - | LHOS |
| RMR | 59.5 | 56 | 28 | 68 | |||
| Q | 5.9 | 4 | 0.2 | 14.7 | |||
| Q' | - | - | - | - | |||
| Intact rock strength (Mpa) | 150 | 150 | 2.5 | >200 | |||
| Joint Orientation | Fair / unfavourable | Fair / unfavourable | Very unfavourable | Unfavourable | |||
| Ground water | Dry / damp | Damp / wet | Dry | Wet | |||
| Stress state | High | High | Low | Medium | |||
| Rockmass characterisation | Fair | Fair | Very poor | Good | |||
| 1,100 mN – 1,500 mN | RQD | 78 | 100 | 35 | - | ||
| RMR | 66.5 | 65.5 | 28.5 | 61.5 | |||
| Q | 12.5 | 11.2 | 0.2 | 7.3 | |||
| Q' | - | >424 | - | - | |||
| Intact rock strength (Mpa) | 200 | 150 | 3 | 193 | |||
| Joint Orientation | Unfavourable | Very unfavourable | Very unfavourable | Unfavourable | |||
| Ground water | Dry | Dry | Dry | Dry | |||
| Stress state | High | High | Low | Low to moderate | |||
| Rockmass characterisation | Good | Good | Very poor | Fair | |||
|
BANCROFT DEEPS (700 mN – 1,000 mS) Average orebody dip is 54° |
500 mN – 700 mN | RQD | 85 | 100 | 35 | 90 | LHOS |
| RMR | 52.5 | 65.5 | 23.5 | 56 | |||
| Q | 2.8 | 11 | 0.1 | 4 | |||
| Q' | - | - | - | - | |||
| Intact rock strength (Mpa) | 150 | 150 | 3 | 152 | |||
| Joint Orientation | Fair / Unfavourable | Very unfavourable | Very unfavourable | Unfavourable | |||
| Ground water | Dry / Damp | Dry | Dry | Dry | |||
| Stress state | High | High | Low | Medium | |||
| Rockmass characterisation | Poor | Good | Very poor | Fair | |||
| 200 mN – 500 mN | RQD | 85 | 80 | 38 | 80 | ||
| RMR | 85 | 74.5 | 39 | 69.5 | |||
| Q | 91.5 | 29.6 | 0.7 | 17.3 | |||
| Q' | - | - | - | - | |||
| Intact rock strength (Mpa) | >200 | >250 | 50 | 200 | |||
| Joint Orientation | Very unfavourable | Very unfavourable | Very unfavourable | Very unfavourable | |||
| Ground water | Dry | Dry | Dry | Dry | |||
| Stress state | Very high (seismicity) | Very high (seismicity) | Very high (seismicity) | Very high (seismicity) | |||
| Rockmass characterisation | Very good | Good | Very poor | Good | |||
| 200 mS – 200 mN | RQD | 100 | 85 | 33 | 80 | ||
| RMR | 57.5 | 41 | 7 | 69 | |||
| Q | 4.8 | 0.8 | 0.02 | 16.4 | |||
| Q' | - | - | - | - | |||
| Intact rock strength (Mpa) | 200 | 40-150 | 5 | 150 | |||
| Joint Orientation | Unfavourable | Unfavourable | Unfavourable | Unfavourable | |||
| Ground water | Wet | Wet | Wet | Wet | |||
| Stress state | Medium | Medium | Medium | Medium | |||
| Rockmass characterisation | Fair | Very poor | Very poor | Good | |||
| 200 mS – 600 mS | RQD | 24 | 65 | 33 | 57.5 | ||
| RMR | 67 | 66 | 7 | 52 | |||
| Q | 13.2 | 11.9 | 0.02 | 2.6 | |||
| Q' | - | - | - | - | |||
| Intact rock strength (Mpa) | 150 | 150 | 5 | 150 | |||
| Joint Orientation | Unfavourable | Unfavourable | Unfavourable | Unfavourable | |||
| Ground water | Wet | Wet | Wet | Wet | |||
| Stress state | Low | High | Medium | Medium | |||
| Rockmass characterisation | Good | Good | Very poor | Poor | |||
| 600 mS – 1,000 mS | RQD | 60 | 70 | 12.5 | 60 | ||
| RMR | 65 | 47 | 3.5 | 45 | |||
| Q | 10.7 | 1.5 | 0.01 | 1.2 | |||
| Q' | - | - | - | - | |||
| Intact rock strength (Mpa) | 150 | 100 | 0 - 5 | 130 | |||
| Joint Orientation | Unfavourable | Unfavourable | Unfavourable | Unfavourable | |||
| Ground water | Wet | Wet | Wet | Wet | |||
| Stress state | Medium | Medium | Low | Medium | |||
| Rockmass characterisation | Good | Poor | Very poor | Poor |
| amcconsultants.com | 191 |
| S-K 1300 TRS: KCM Integrated Operations (Initial Assessment) | |
| Konkola Copper Mines Plc | 0424076 |
| 13.2.1.2 | Structural geology summary |
The structural framework of Konkola Mine is influenced by major regional faults, a fault series local to the mine working, and the associated minor structural features, including bedding planes and joint sets. These structures influence rock mass behaviour, stress redistribution, and excavation stability.
Major structures
The two principal fault systems that dominate the regional setting are the Lubengele Fault to north of Shaft 3 and Luansobe Fault to south of Shaft 1 (Figure 13.3).
Within the mine workings the major structures include the Cross Fault, a brecciated zone with gouge infill up to 2 m wide, which presents a potential risk to development due to its brittle and low-strength nature. In total, 11 significant faults have been modelled within the mine area. These structures trend northeast-southwest and exhibit steep dips, often aligning sub-parallel or oblique to the orebody. When fault orientations align obliquely or sub-parallel to excavations, it modifies stress fields, which can enhance or destabilise excavations depending on their properties and geometry. The location of the modelled faults in relation to the mine workings is presented in Figure 13.4.
| amcconsultants.com | 192 |
| S-K 1300 TRS: KCM Integrated Operations (Initial Assessment) | |
| Konkola Copper Mines Plc | 0424076 |
Figure 13.3 Location of regional faults within the Konkola mine area
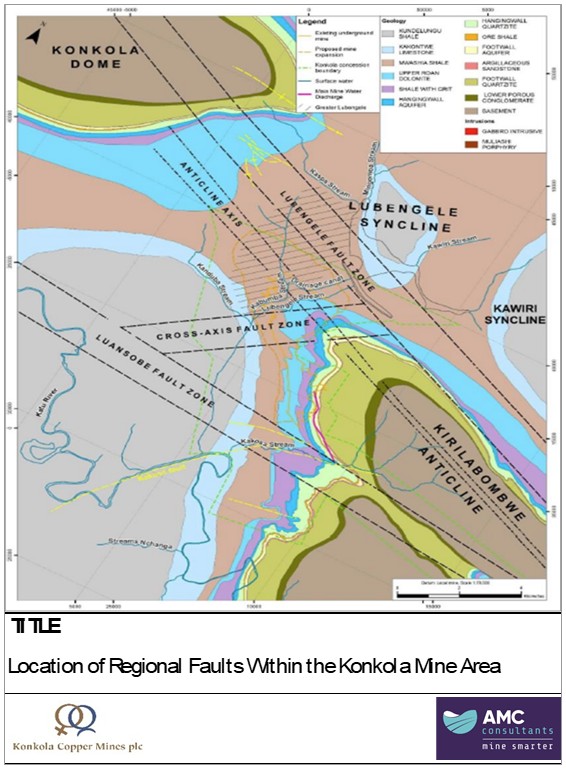
Source: AMC, 2026.
| amcconsultants.com | 193 |
| S-K 1300 TRS: KCM Integrated Operations (Initial Assessment) | |
| Konkola Copper Mines Plc | 0424076 |
Figure 13.4 Location of modelled faults within mine workings
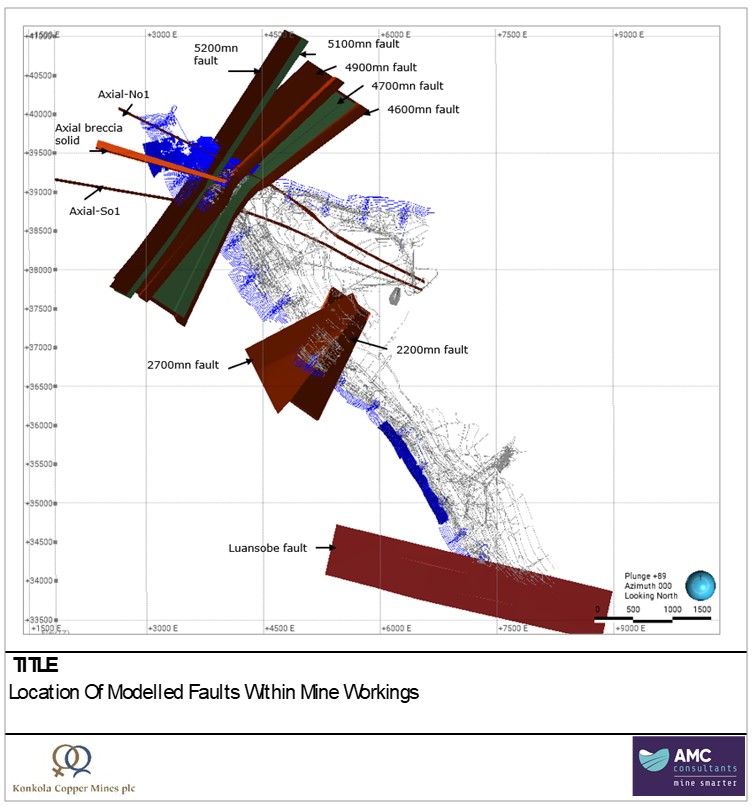
Source: AMC, 2026.
Minor structures
The rock mass is further subdivided by three dominant joint sets:
| 1 | Bedding: Typically found in the ore shale with a dip range of 15o to 70o in the fold axis (nose area), and 51o to 80o is found in the fold hinges. |
| 2 | Oblique joints: Dipping from 33o to 74o, these joints trend at angles relative to bedding, with variable spacing and roughness. |
| 3 | Cross joints: Typically, steeply dipping (54o to 87o), orientated perpendicular to bedding, though often weakly developed. |
| amcconsultants.com | 194 |
| S-K 1300 TRS: KCM Integrated Operations (Initial Assessment) | |
| Konkola Copper Mines Plc | 0424076 |
Joint characteristics vary across the mine. In the northern limb, joints are closely spaced and often partially infilled with clay or rock fragments, reducing rock mass quality. Subsidiary faults tend to follow bedding or orebody geometry and commonly intersect major faults, resulting in structurally complex zones.
| 13.2.2 | Geotechnical considerations for mining |
| 13.2.2.1 | Stope stability and design |
Stability assessed with modified stability graphs (dips 25°, 55°, 70°), resulted in generally stable, with paste backfill improving crown and hangingwall stability particularly in flatter dipping areas. Tactical pillars near major structures may be required. Stopes are to be mined and backfilled sequentially, forming sill pillars where required and cable bolt support is required in zones of variable ground or low dip. Site-specific reassessment is recommended during short-term planning using updated structural and mapping data.
| 13.2.2.2 | Stope dilution estimation |
Dilution was evaluated using the ELOS method (Clark & Pakalnis, 1997). In fair ground, ELOS estimates are low, typically 0.5-1.0 m. Increased overbreak may occur in the Extension and Bancroft North areas, or where stopes intersect major structures. Drill and blast designs should be adjusted to limit overbreak near persistent structures. In flatter dipping areas stope support is likely to be required in the hangingwall to enable mineable stope strike lengths.
| 13.2.2.3 | Infrastructure placement |
Major infrastructure, including declines, should be placed in competent footwall quartzite, maintaining a standoff of at least 20 m from major faults. Alignment should minimise intersections with faults or aquifers. Raise bore assessments are recommended for ore passes and shafts in jointed or near-surface ground.
| 13.2.2.4 | Crown pillar and subsidence risk |
Crown pillar designs consider dynamic loading, structural influence, and blasting effects. Ongoing monitoring and review of open stopes and paste backfill are advised to maintain stability.
Historic shallow mining has resulted in surface subsidence. KCM manages these risks through its Subsidence and Sinkhole Management Plan (2022), aligned with Zambian regulations. AMC recommends satellite-based monitoring for regional subsidence linked to dewatering.
| 13.2.3 | Ground support and numerical modelling |
Ground support requirements at Konkola were assessed using the Q-system and wedge analysis methods. Indicative support designs were developed for decline, level access, and ore drive dimensions under varying ground conditions. The assessment confirmed that current support standards are broadly appropriate, though cable bolting is required in areas of poor ground quality, especially where fault zones or weak units such as Unit A are encountered.
Unwedge modelling identified structurally controlled wedge failures as a potential hazard in certain development orientations. Intersection stability can be achieved with double-strand cable bolts, though high-stress areas and wide spans may require increased support or intersection redesign. Avoiding 4-way intersections at depth is advised to reduce instability risks.
Numerical modelling using FLAC3D was completed for both shallow and steeply dipping stoping zones. Results highlight stress relaxation and strain concentration around stope walls, with hangingwall displacement reaching up to 0.5 m in some areas. Plastic strain thresholds indicate that localised ground damage may occur near faults and in deeper zones, particularly where stopes or development intersect major structures.
| amcconsultants.com | 195 |
| S-K 1300 TRS: KCM Integrated Operations (Initial Assessment) | |
| Konkola Copper Mines Plc | 0424076 |
Stress redistribution is more pronounced in poor ground conditions, and numerical models indicate that hangingwall instability risks increase with depth. Modelling of multiple mining options shows that designs incorporating regional or central pillars offer improved stability, with central pillars performing best overall.
AMC recommends:
| · | Ongoing geotechnical inspections in areas approaching plastic strain thresholds. |
| · | Calibration of models using CMS and stope performance data. |
| · | Consideration of backfilling or sill pillars in critical zones. |
| · | Optimisation of drilling and blasting practices to reduce overbreak. |
| · | Implementation of a site monitoring program to track displacement and ground response. |
| 13.2.4 | Hydrogeology |
| 13.2.4.1 | Hydrology summary |
The hydrogeological conditions across the KCM assets vary significantly, directly impacting dewatering strategies, groundwater inflows, and overall water management. These variations are primarily controlled by structural features, lithological permeability, and the presence of major fault and fracture networks. Regional fault systems and lithological interfaces act as primary groundwater conduits, influencing the connectivity between aquifers and mine workings.
The geological setting of the operation consists of a sequence of sedimentary and metamorphic units with varying degrees of permeability and water-bearing capacity. Structural deformation has further influenced hydrogeological conditions by creating preferential groundwater flow paths, particularly in fault zones and fractured lithologies.
The hydrogeological regime at Konkola Mine is characterised by fractured, permeable fault zones within schists and dolomites that require extensive dewatering. Less permeable lithologies such as quartzites and shales act as hydraulic barriers. Substantial historical inflows have necessitated a robust pumping system to maintain safe and efficient operations.
| 13.2.4.2 | Aquifer parameters and testing |
The following hydrogeological testing and monitoring has been established at Konkola:
| · | Piezometer installation: Monitoring wells established to measure groundwater levels and flow rates. |
| · | Pump testing: Conducted to determine aquifer permeability, hydraulic conductivity, and inflow rates into mine workings. Test well DW01, drilled into the Chingola dolomite, demonstrates high hydraulic conductivity with minimal drawdown under current pumping conditions (~1,800 m³/day). |
| · | Water quality assessments: Routine sampling of mine water to monitor contamination risks and compliance with environmental standards. |
Dewatering at Konkola has been on-going since the 1950s. As such, the operational data collected over more than 70 years of pumping is preferable to theoretical pump testing. Similar to most hard rock mine sites, groundwater flow is controlled by barriers (lithological contacts and structures) and conduits (cave cracks, old exploration drillholes, natural fracture zones) rather than the local-scale properties (K, T, S) of the geological formations.
The best way to assess the bulk-scale aquifer properties is to adjust the inputs to the groundwater model, which was done as part of the work in 2014. The model used 387 surface borehole records, more than 8,500 groundwater level measurements, many of which were related to underground drain hole records, flume flow records, and pumping records from all pump stations. Pumping tests were done in similar formations at a nearby site in 2001. The properties from the pumping tests were used as initial inputs to the 2014 model and were subsequently adjusted during model calibration. Hydraulic conductivity (K) values ranged from 0.7 m/d to 3 m/d. Storativity (S) values ranged from 5x10⁻⁴ to 3x10⁻⁶.
| amcconsultants.com | 196 |
| S-K 1300 TRS: KCM Integrated Operations (Initial Assessment) | |
| Konkola Copper Mines Plc | 0424076 |
There is currently no basis to adjust the aquifer properties that were used in the 2014 calibrated groundwater model. The only recent data is: (i) flow rates measured at the pumping stations, (ii) flow rates measured in underground drainage holes, and (iii) shut in pressures measured in underground drainage holes. All these data have been used as part of the on-going dewatering assessment. Sealed vibrating wire piezometers have been proposed as part of the hydrogeology studies going forward. In the current database, the drillholes (controlled water) only account of about 35% of the inflow, but they do show that sustained flows can be retained on the higher mine levels.
| 13.2.4.3 | Dewatering volumes and rates |
Groundwater inflows average ~350,000 m³/day, with inflows concentrated at levels 720L and 950L. Most discharge is pumped via VS1F (60%) and VS1B (30%) shafts using three main pump stations at 985L, 690L, and 370L. Future inflows are projected to increase moderately with depth.
| 13.2.4.4 | Chingola dolomite |
The Chingola dolomite is a regionally connected aquifer with a flat-water table at ~500L. Subsidence-related cracks tap into this aquifer, providing recharge to the mine. The Mwashia shale acts as a semi-confining layer (Figure 13.5).
Figure 13.5 Cross section showing the interconnected nature of the Chingola dolomite (light blue) between KCM (right) and Lubambe (left)
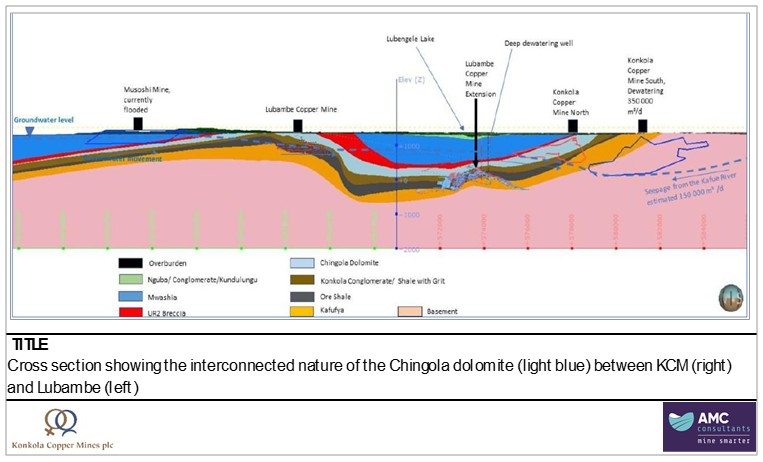
Source: AMC, 2026.
| amcconsultants.com | 197 |
| S-K 1300 TRS: KCM Integrated Operations (Initial Assessment) | |
| Konkola Copper Mines Plc | 0424076 |
| 13.2.4.5 | Recharge |
Recharge is driven primarily by rainfall, with 50–75% of mine water originating from surface infiltration and 25–50% from recirculation. Estimated recharge is ~200–300 mm/year across a 250 km² area. InSAR shows infiltration across the subsidence zone (Figure 13.6).
Figure 13.6 Subsidence area shown on InSAR ascending image
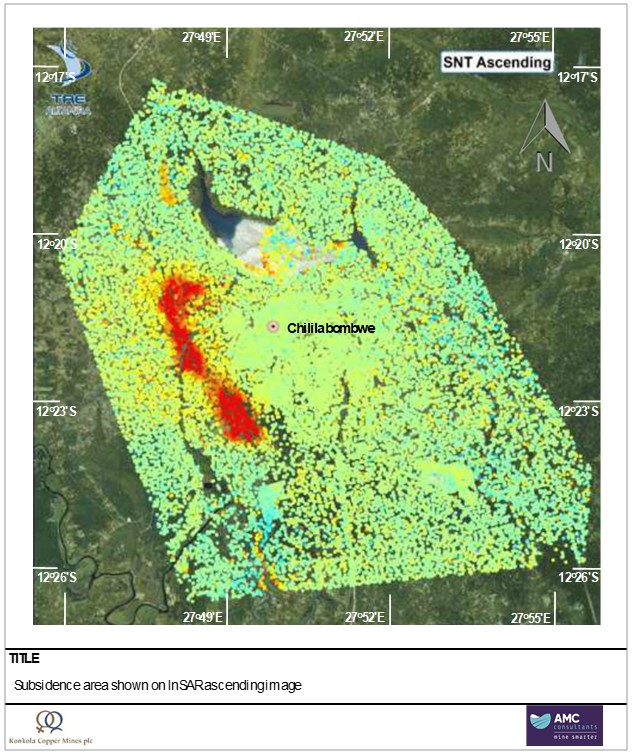
Source: AMC, 2026.
| 13.2.4.6 | Dewatering system and boreholes |
Dewatering relies on a combination of crosscut and drainage hole systems targeting both the footwall and hangingwall aquifers. Crosscuts are spaced approximately every 500 m along strike and provide access for installation of drainage holes, which are drilled upward into the hangingwall and downward into the footwall.
| amcconsultants.com | 198 |
| S-K 1300 TRS: KCM Integrated Operations (Initial Assessment) | |
| Konkola Copper Mines Plc | 0424076 |
A future drilling program aims to deliver ~48,000 m/year of drill length to support sustained depressurisation of the host rock. This approach will be critical to achieving pressure reductions ahead of production development and minimising water ingress into the mine workings. Drilling infrastructure is expected to include ~12 drainage holes per crosscut, with hole lengths typically between 200 to 350 m.
Test well DW01, drilled into the Chingola dolomite, demonstrates high hydraulic conductivity with minimal drawdown under current pumping conditions (~1,800 m³/day). The low drawdown confirms regional interconnectivity of the dolomite and reinforces its role as the principal groundwater contributor to the mine system.
| 13.2.4.7 | Water balance and groundwater model status |
A numerical groundwater flow model is under development to predict future dewatering requirements and optimise water management strategies. Pending completion of this model, the following conceptual water balance is noted:
| · | Total average inflow: ~350,000 m³/day (current conditions, mining above 950 mL). |
| · | Sources: Chingola dolomite (principal contributor), surface infiltration via subsidence cracks, fault-conduit recharge. |
| · | Short-term mining (Years 1–7): Focused on currently dewatered zones (Konkola East, Konkola Flats, Konkola Extension) where inflows are better understood and controlled. |
| · | Longer-term: Production from deeper zones (Bancroft sector) contingent on commissioning of the 1,390 mL pump station. Short-term inflow spikes projected to exceed 450,000 m³/day as mine development progresses along the full 12 km strike. |
The conceptual water balance diagram shown below is based on the most recent data from site. The dominant source in the water balance is the regional dolomite. The pump station capacities are shown in Figure 13.7.
Figure 13.7 Conceptual water balance
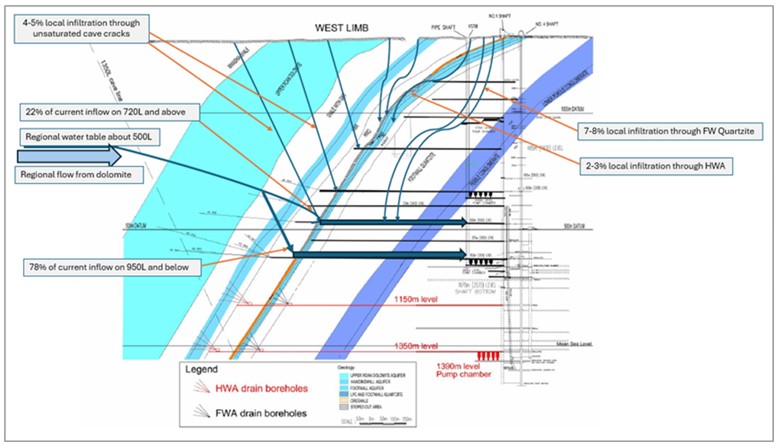
Source: AMC, 2026.
| amcconsultants.com | 199 |
| S-K 1300 TRS: KCM Integrated Operations (Initial Assessment) | |
| Konkola Copper Mines Plc | 0424076 |
The previous numerical model showed that a high proportion of the water can be captured on the 950L or above. The available monitoring data supports the model. The inflow data indicates it should be possible to retain about 40% of the inflow on the 950L, particularly if there is an increased density of future drainage holes. A plan has been prepared to update the 2014 numerical model. The flow rates in Table 13.5 have been predicted based on judgement following review of both the 2014 model and the most recent monitoring data from the drainage holes.
Table 13.5 Summary of water capture extrapolated over time
| Year 1 | Year 2 | Year 3 | Year 4 | Year 3 | Year 6 | Year 7 | Year 10 | Year 20 | Year 30 | |||||||||||||||||||||||||||||||
| Total dewatering rate | 380,000 | 400,000 | 420,000 | 420,000 | 430,000 | 420,000 | 410,000 | 430,000 | 410,000 | 410,000 | ||||||||||||||||||||||||||||||
| Water that can be managed on 970L | 380,000 | 400,000 | 420,000 | 420,000 | 430,000 | 420,000 | 410,000 | 240,000 | 170,000 | 170,000 | ||||||||||||||||||||||||||||||
| Water to be managed on 1150L | 190,000 | 190,000 | 90,000 | |||||||||||||||||||||||||||||||||||||
| Water to be managed on 1350L | 50,000 | 150,000 | ||||||||||||||||||||||||||||||||||||||
Notes: Flow rates in m3/day, assumes no major ground collapse rapid subsidence, assumes no improvement in surface infrastructure, based on preliminary mine planning assumptions.
| 13.2.4.8 | Water quality |
The overall discharge water quality shows near-neutral pH, and major ions within target limits for both HWA and FWA. TSFs water has alkaline pH and elevated nitrate and chloride (beneficial to maintain separation of water pumped from UG from TSFs water). Total suspended solids (TSS) are the key challenge, along with potential copper and zinc levels which occasionally exceed guideline limits of 100 mg/litre.
| 13.2.4.9 | Mine schedule and dewatering plan |
Short-term mining (next 5-7 years), activities will focus on the currently dewatered zones of Konkola East, Konkola Flats, and Konkola Extension, where groundwater inflows are better understood and controlled. This allows mining to progress without requiring major new infrastructure in the immediate term. Figure 13.8 shows the currently inferred phreatic surface based on measurements from the available shut in holes. A pressure head of about 150 m (200 psi) can be inferred for the 720L.
In the longer term, production from deeper zones, particularly the Bancroft sector, will be contingent on the timely development of the 1390L pump station and associated dewatering infrastructure. This pump station is essential for enabling mining below 950L and unlocking the deeper Mineral Resources within the Bancroft sector.
Dewatering efforts must be synchronised with the mine schedule to avoid production delays and to ensure safe working conditions. As mine development progresses along the full 12 km strike of the orebody, inflows are expected to fluctuate, with short-term spikes projected to exceed 450,000 m³/day. Additional pumping capacity and infrastructure upgrades will be critical to maintaining production continuity and managing inflow variability.
| amcconsultants.com | 200 |
| S-K 1300 TRS: KCM Integrated Operations (Initial Assessment) | |
| Konkola Copper Mines Plc | 0424076 |
Figure 13.8 Currently inferred phreatic surface based on measurements from shut in holes
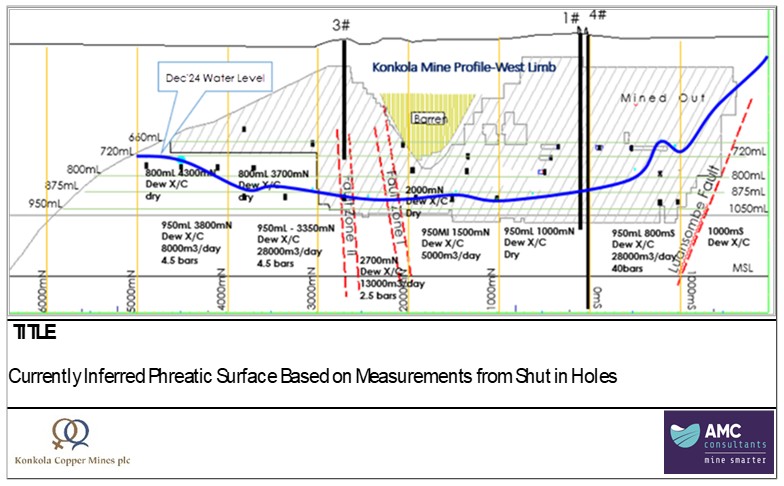
Source: AMC, 2026.
Figure 13.7 and Figure 13.8 show the planned hangingwall dewatering crosscuts located every 500 m strike length. In total, there will be about 15 dewatering crosscuts per level. Given that the main constraint on ore production has historically been slow footwall development because of water, a more systematic dewatering hole drilling plan will be required. This is currently expected to be:
| · | Crosscuts driven from the dewatering level towards the ore shale every 500 m spacing along strike to provide drilling access for advanced dewatering holes. |
| · | Drill stations will be about 100 m into each crosscut. |
| ¾ | The goal is: (i) to depressurise the crosscuts through the footwall in advance of the face, and (ii) to dewater the production development and workings in the ore shale. Given the wider spacing of the footwall dewatering crosscuts, lateral holes will also be required between the crosscuts. |
| ¾ | Most holes can be drilled at less than 45° (upward), but some holes will need to be drilled at steeper angles due to the dip of the orebody and the need to get the higher holes. |
| ¾ | For each crosscut, the budget should be about 4,000 m of drilling for the array of holes from the drill stations and any cover holes that may be required in advance of the crosscut. |
| · | The crosscuts will be terminated about 20 m short of the ore shale (i.e. they don’t go into the hangingwall). A total of 12 drainage holes into the hangingwall is currently assumed: three at 45° up, six at 20° up, and three flat, for a total of 4,000 m of drilling into the hangingwall. The holes would go 5-10 m past the HWA and would terminate within the Shale with Grit. |
| · | Drilling will be carried out at a nominal diameter of 125 mm using LM110 drills (or similar). Most hole lengths would be between 200 and 350 m. Planning should currently assume a total of about 48,000 m per year drilling (based on six crosscuts being advanced per year), so a minimum of three dewatering drills will be required. |
| amcconsultants.com | 201 |
| S-K 1300 TRS: KCM Integrated Operations (Initial Assessment) | |
| Konkola Copper Mines Plc | 0424076 |
Figure 13.9 Rotated section showing the planned footwall dewatering drilling
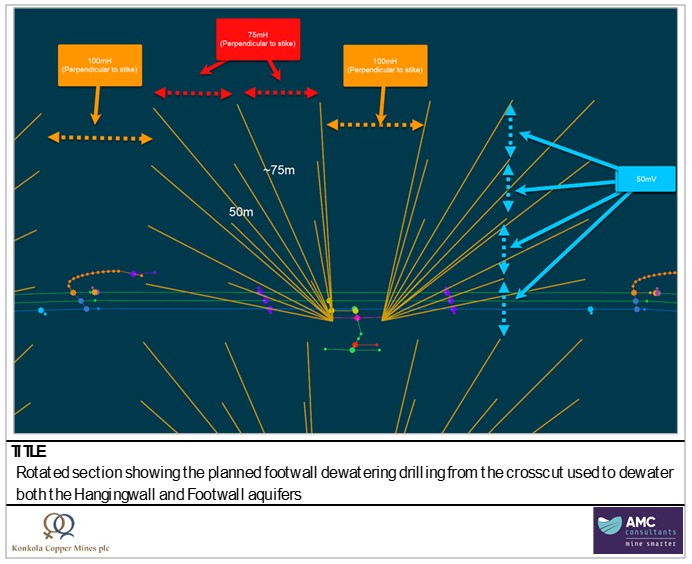
Source: AMC, 2026.
| 13.2.4.10 | Future dewatering rates |
Planned depressurisation using crosscut-based drainage holes will enable 30–50 m pressure reduction in ~6 months with localised inflows of 45,000–60,000 m³/day. Long-term capacity must exceed current system (~360,000 m³/day), aiming for 500,000 m³/day. Current estimated inflow rates are shown in Table 13.6.
Table 13.6 Indicative future mine inflow rates for the next 7-year mine plan
| Year 1 | Year 2 | Year 3 | Year 4 | Year 5 | Year 6 | Year 7 | ||||||||||||||||||||||
| Konkola East 720L | 150,000 | 170,000 | 140,000 | 100,000 | 70,000 | 60,000 | 50,000 | |||||||||||||||||||||
| Konkola East 800L | 40,000 | 30,000 | 30,000 | 40,000 | 60,000 | 30,000 | 20,000 | |||||||||||||||||||||
| Konkola East 870L | - | - | 30,000 | 30,000 | 50,000 | 50,000 | 60,000 | |||||||||||||||||||||
| Konkola Flats 720L | 35,000 | 45,000 | 55,000 | 50,000 | 20,000 | 20,000 | 10,000 | |||||||||||||||||||||
| Konkola Flats 800L | - | - | 10,000 | 30,000 | 40,000 | 50,000 | 40,000 | |||||||||||||||||||||
| Konkola Flats 870L | - | - | - | 20,000 | 40,000 | 40,000 | 60,000 | |||||||||||||||||||||
| Konkola Extension 720L | 60,000 | 60,000 | 40,000 | 20,000 | 20,000 | 20,000 | 10,000 | |||||||||||||||||||||
| Konkola Extension 800L | - | - | 20,000 | 40,000 | 40,000 | 40,000 | 30,000 | |||||||||||||||||||||
| Konkola Extension 870L | - | - | - | 10,000 | 20,000 | 40,000 | 50,000 | |||||||||||||||||||||
| Total 970L and below | 95,000 | 95,000 | 95,000 | 80,000 | 70,000 | 70,000 | 90,000 | |||||||||||||||||||||
| Total dewatering rate | 380,000 | 400,000 | 420,000 | 420,000 | 430,000 | 420,000 | 410,000 | |||||||||||||||||||||
Notes: Flow rates in m3/day. Assumes no major ground collapse or rapid subsidence.
| amcconsultants.com | 202 |
| S-K 1300 TRS: KCM Integrated Operations (Initial Assessment) | |
| Konkola Copper Mines Plc | 0424076 |
| 13.2.4.11 | Pumping infrastructure – Konkola Mine |
The current pumping infrastructure consists of staged systems at 370L, 690L, and 950L, with most inflows handled via VS1F and VS1B shafts. The 950L station is presently the deepest in operation. However, mining below this level, particularly in the Bancroft sector, requires the development of a new pump station at 1390L, along with new drainage drives at 1150L and 1350L, to provide the necessary dewatering capacity and operational redundancy (Figure 13.9).
Upgrades to the existing systems at 690L and 370L are required to increase the pumping rate beyond the current ~360,000 m³/day limit. Planned enhancements include additional pump columns, expansion of settlers and sumps, and optimisation of water handling networks. The target capacity is at least 450,000–500,000 m³/day to accommodate projected peak inflows and ensure resilience during high-water events or power disruptions.
Energy-efficient technologies such as variable frequency drives (VFDs) and automated pump control systems are recommended to reduce operating costs and improve performance. Redundant power supply systems, including diesel generators and ring-fed power lines, are also essential to mitigate the risks associated with load shedding and grid failure.
Emergency infrastructure includes a combination of control valves on dewatering boreholes, penstock valves, surge barriers, flood control doors, and temporary storage in haulage and drainage drives. These systems are critical for responding to short-term pump failures and allow the mine to manage water until backup systems are operational.
Figure 13.10 Konkola Mine dewatered, developed, and mined
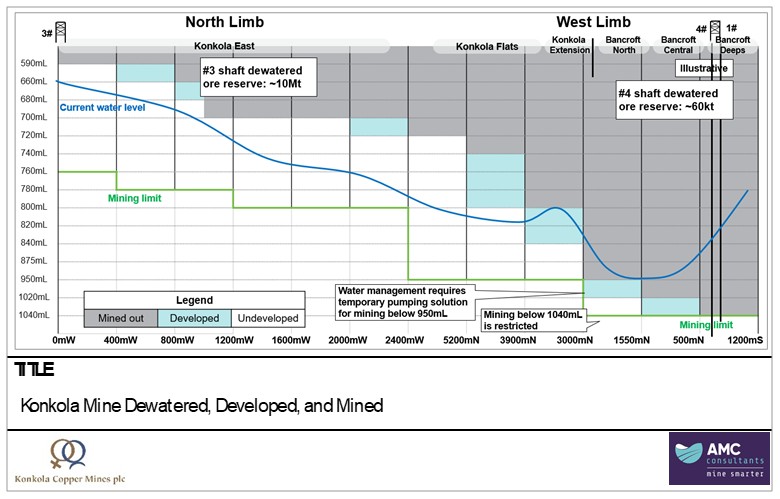
Source: AMC, 2026.
| amcconsultants.com | 203 |
| S-K 1300 TRS: KCM Integrated Operations (Initial Assessment) | |
| Konkola Copper Mines Plc | 0424076 |
| 13.2.4.12 | Konkola Mine water management infrastructure |
Konkola’s underground water management system incorporates a range of control and containment measures to manage inflows and ensure infrastructure protection:
| · | Control valves on dewatering boreholes allow water to be temporarily shut in during pump failures or power outages. Valves are prioritised by flow rate, with higher-flow boreholes closed first. There were 48 such boreholes at 950L during the 2008 national power outage. |
| · | Settlers and sumps provide sedimentation capacity and buffer inflows before pumping. Settlers slow flow to drop suspended solids; sumps store water for transfer to pump stations. |
| · | Surge barriers are temporary blockades in drainage and haulage drives to divert water from critical infrastructure (e.g., No.1 shaft). |
| · | Penstock valves, located near the 950L flood control door, regulate flow to downstream pumping systems and are closed once sump capacity is exceeded. |
| · | Flood control doors on 950L and 850L protect key pump stations during extreme inflow events. Timing of closure is linked to available storage and system response. |
| · | Emergency storage is provided by accessible drives on the footwall side. During major inflow events, these areas offer temporary containment for up to ~2 hours before further controls must be activated to protect infrastructure. |
| 13.2.4.13 | Upgrade of existing pumping infrastructure |
In the medium term (12-18 months), there is a need to upgrade the existing infrastructure from the current 370,000 m3/day to at least 450,000 m3/day. The upgrade works are shown in red on Figure 13.11 and should include:
| · | 690 mL (five additional pumps; and two to three pump columns). |
| · | 370 mL (three Pump Columns). |
| · | Water storage sumps and settlers, drain drives and dewatering crosscuts. |
The series of projects required to complete the upgrade works will require close focus and significant financial support. The pipe columns are 500 mm in diameter and the pipe is a long-lead order item. This is an example component of the system that demonstrates the complexities that will likely be encountered whilst attempting the upgrade works.
The integration of energy-efficient technologies, such as VFDs and automated control systems, is also recommended to optimise power consumption and reduce operational costs. Such improvements would not only enhance system performance but also contribute to the overall sustainability of the mining operation.
| amcconsultants.com | 204 |
| S-K 1300 TRS: KCM Integrated Operations (Initial Assessment) | |
| Konkola Copper Mines Plc | 0424076 |
Figure 13.11 Dewatering schematic, with required upgrades shown in red
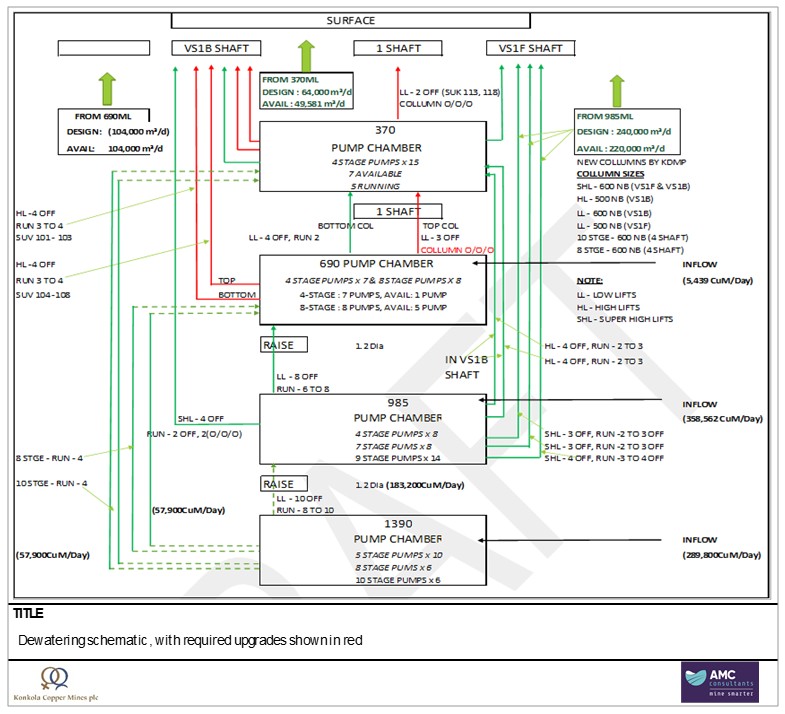
Source: AMC, 2026.
| 13.2.4.14 | Risks |
Due to continuous high groundwater inflows and significant pumping head, the dewatering system and associated emergency procedures must remain robust and highly reliable. Plans must account for power failures, ensuring back-up systems and clearly defined TARPs are in place.
Proactive maintenance and defined KPIs, for pump reliability, flow rates, and energy use; are essential to optimise system performance. In emergencies, short-term inflow reduction (e.g., closing dewatering valves) and underground water storage are key to preserving time for backup power restoration.
The two-day national power outage in January 2008 tested these procedures under real conditions. Groundwater inflows (~292,000 m³/day) were partially managed by closing borehole valves, temporarily reducing inflows and allowing activation of flood doors and emergency systems.
Emergency protocols should be reviewed quarterly, with audits identifying gaps and maintaining the integrity of the underground water management system. The 2008 event and subsequent outages have reinforced the importance of ongoing readiness and redundancy.
| amcconsultants.com | 205 |
| S-K 1300 TRS: KCM Integrated Operations (Initial Assessment) | |
| Konkola Copper Mines Plc | 0424076 |
| 13.2.5 | Existing mining – Konkola Mine |
Konkola Mine extracts ore from the Kirilabombwe anticline orebody using three principal production shafts: 1 Shaft, 3 Shaft, and 4 Shaft. These shafts support mining across two main areas referred to as the 3 Shaft and 4 Shaft mining areas. The operation commenced in 1957 with the commissioning of 1 Shaft, followed by 3 Shaft in 1963 and 4 Shaft in 2007. While 1 Shaft remains in use for personnel and supplementary hoisting, 4 Shaft is now the primary hoisting shaft in the southern portion of the orebody.
The two mining areas are separated above the 720-m level by a geologically barren zone approximately 1.5 km wide. This zone lacks economic mineralisation and is primarily composed of unmineralised lithologies. It presents a natural boundary between the historically distinct 3 Shaft and 4 Shaft operations. Despite this separation, underground development has since connected the two areas, allowing for integrated haulage and dewatering systems.
Three principal mining methods are employed at Konkola Mine: Longhole Open Stoping, Post Pillar Cut and Fill, and a Hybrid Overcut and Bench method. The selection of each method is based on orebody dip, ore thickness, ground conditions, and infrastructure availability. These methods are applied within specific mining zones as summarised in Table 13.7. Ongoing refinement of the mining approach supports improved recovery, stability, and alignment with long-term production planning.
Table 13.7 Mining methods currently employed by mining area at Konkola Mine
| Mining area | Boundaries | Orebody dip (o) |
Orebody thickness (m) |
Primary mining method(s) |
Backfill | |||||
| Bancroft North | 1,750 – 3,000 mN | 45 to 70° | 6 to 10 m | Longhole Open Stoping (LHOS) | Planned | |||||
| Bancroft Central | 1,000 – 1,750 mN | 45 to 65° | 5 to 9 m | LHOS | Planned | |||||
| Bancroft Deeps | 100 mS – 1,000 mN | 55 to 70° | 6 to 10 m | LHOS | Future (awaiting infrastructure) | |||||
| Konkola Extension | 3,000 – 4,000 mN | 25 to 50° | 5 to 10 m | LHOS, PPCF, Hybrid Overcut & Bench | Mixed (some unfilled zones) | |||||
| Konkola Flats | 4,200 – 4,800 mN | 10 to 25° | 10 to 13 m | Post Pillar Cut and Fill (PPCF) | Active | |||||
| Konkola East | 0 – 2,400 mW | 30 to 60° | 6 to 12 m | LHOS | Planned |
| 13.2.6 | Planned mining methods - Konkola Mine |
Planned mining at Konkola Mine aims to progressively unlock deeper mineralised zones through staged dewatering and infrastructure upgrades. The mine will continue to rely on the application of LHOS, Post Pillar Cut and Fill (PPCF), and Modified Overcut and Bench (MOCB) methods, selected based on orebody geometry, dip, and prevailing ground conditions. These methods will be deployed in different areas of the mine according to updated geotechnical assessments and the evolving dewatering strategy.
The long-term mining vision incorporates expansion below the 1040L in the 4 Shaft area and continued extraction across dewatered sections of the 3 Shaft area. Target zones include Bancroft North, Bancroft Central, and Bancroft Deeps in the 4 Shaft area, as well as Konkola Flats, Konkola East, and Konkola Extension in the 3 Shaft area. Mining below 950L in 4 Shaft remains contingent on the commissioning of the 1390L pump station and associated infrastructure.
| amcconsultants.com | 206 |
| S-K 1300 TRS: KCM Integrated Operations (Initial Assessment) | |
| Konkola Copper Mines Plc | 0424076 |
Mining methods have been selected based on orebody geometry, depth, and ground conditions, with all areas anticipated to make use of variations of LHOS or panel stoping. In flatter or structurally complex areas, support-intensive approaches and paste fill are expected to be required to maintain excavation stability. Paste fill will also be used in the majority of steeply dipping zones, particularly where structural complexity is anticipated at depth. Areas accessed via Shaft 4, such as Bancroft South and Bancroft Deeps, represent the deepest high-grade targets, while Konkola East remains an exploratory and developmental area where the final mining method may vary depending on local orebody characteristics. A summary of the planned mining methods for the Konkola Mine, is provided in Table 13.8. Figure 13.12 shows a plan view isometric of the mine zones and key infrastructure .
Table 13.8 Konkola Mine mining methods
| Ore zones | Mining method | Summary | |||
| Konkola East | LHOS and panel stoping | · | Exploratory / developmental area; method subject to geometry. | ||
| · | Moderately to steeply dipping (50–70°) in upper / mid sections; flattens at depth (<45°). Method zoned by dip. Paste fill required for both. | ||||
| Konkola Flats | LHOS and panel stoping | · | Flatter, bullnose geometry with variable dips. Requires zoned extraction. Central to regional stress transfer; high fill reliance. | ||
| · | Paste fill. | ||||
| · | Likely to use support-intensive methods. | ||||
| Konkola Extension | LHOS (Blind Stoping) | · | Steeply dipping (45–70°). Structural complexity at depth. | ||
| · | Minor folding and drag structures. | ||||
| · | LHOS preferred; panel stoping possible in localised flatter areas. | ||||
| · | Paste fill. | ||||
| Bancroft North | LHOS (Blind Stoping) | · | Steeply dipping; increasing structural complexity at depth. Blind LHOS with paste fill. | ||
| · | Paste fill. | ||||
| Bancroft Central | LHOS (Blind Stoping) | · | Steep dips with structural complexity at depth. Paste fill required to manage crown and rib stability. | ||
| Bancroft South | LHOS | · | Zone with steepest orebody dip; high-grade target accessed via Shaft 4. | ||
| · | Paste fill planned. | ||||
| Bancroft Deeps | LHOS | · | Deepest mineralised zone and high-grade target. | ||
| · | Paste fill recommended as mine deepens to preserve stability. | ||||
| · | Shaft 4 access. | ||||
| amcconsultants.com | 207 |
| S-K 1300 TRS: KCM Integrated Operations (Initial Assessment) | |
| Konkola Copper Mines Plc | 0424076 |
Figure 13.12 Final mine outline map - plan view showing mining zone boundaries and key infrastructure
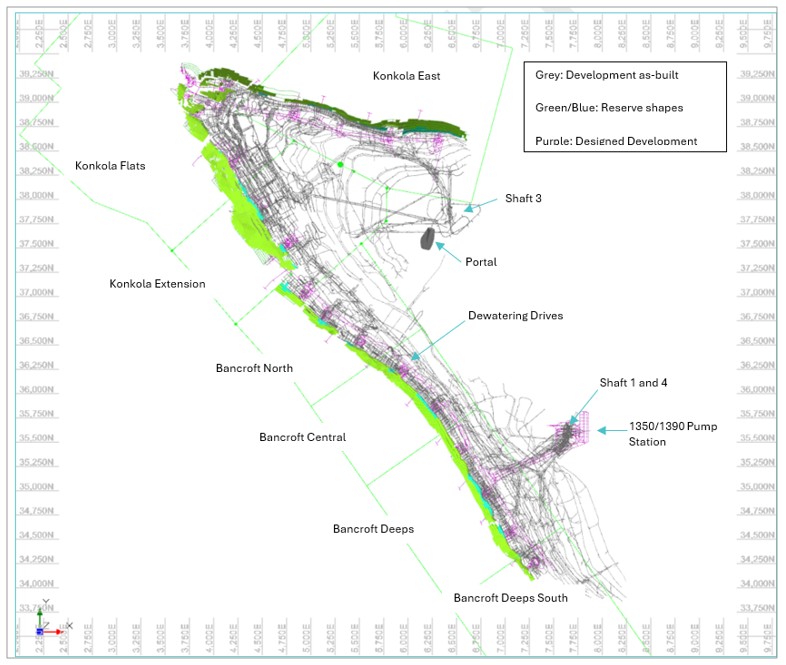
Source: AMC, 2026.
| 13.2.7 | Mining unit dimensions |
Table 13.9 presents the typical stope dimensions for each mining method.
Table 13.9 Typical stope dimensions
| Parameter | LHOS | Panel stoping | Notes | |||
| Stope strike length (m) | 20 m | 20 m | Determined by geotechnical domain and Q’ stability assessment. | |||
| Stope height / dip extent (m) | 30 m | 5 – 10 m | LHOS: sublevel to sublevel. Panel: single cut height. | |||
| Stope width / orebody thickness (m) | 5–15 m (follows ore contacts + ELOS) | 15 m (follows ore contacts + ELOS) | Average ~9 m orebody thickness. | |||
| Hydraulic radius (m) | Approx. 3.5 m | Approx. 4.5 m | Used in Q’ stability graph to assess stable span. | |||
| ELOS — hangingwall (m) | 0.5 | 1.0 | Derived from modified Q’ stability assessment. | |||
| ELOS — footwall (m) | 0.5 | 0.0 | FW ELOS applied to LHOS only. | |||
| Sublevel interval (m) | 30 m | N/A | Determines drilling pattern and slot raise spacing. |
| amcconsultants.com | 208 |
| S-K 1300 TRS: KCM Integrated Operations (Initial Assessment) | |
| Konkola Copper Mines Plc | 0424076 |
| 13.2.8 | Mining dilution and recovery factors |
Mining recovery and dilution estimates at Konkola are based on AMC’s use of the Equivalent Linear Overbreak / Slough (ELOS) method, which estimates undesired material loss or gain during stoping. ELOS values were derived from the modified Q’ stability assessment (Section 13.2.2) and applied as follows:
| · | Panel stopes: ELOS of 1.0 m in the hangingwall, translating to an average planned dilution of 7.5%. |
| · | Longhole open stopes: ELOS of 0.5 m in the hangingwall and 0.5 m in the footwall, translating to an average planned dilution of 9.4%. |
In addition to the ELOS unplanned dilution estimate, an allowance for additional dilution of 5% has been applied to account for operational dilution, such as, backfill contamination at stope contacts, and incorporation of waste floor material during mucking.
Table 13.10 presents the total mining dilution and recovery factors applied to convert in situ Mineral Resource tonnes and grades to run-of-mine production tonnes and grades for the M&I Case mine plan.
Table 13.10 Mining dilution and recovery factors
| Mining method | ELOS Dilution (Predicted Unplanned Dilution) (%) | Unplanned Dilution (an allowance for dilution additional to ELOS (%) | Total Dilution (%) | Mining Recovery (%) | Dilution Grade | |||||
| LHOS | 9.4%% | 5% | 15% | 90% | zero-grade / country rock | |||||
| Panel Stoping | 7.5%% | 5% | 13% | 90% | zero-grade / country rock | |||||
| Post Pillar Cut & Fill | 7.5% | 5% | 13% | 75% | Zero | |||||
| Ore Development | 0 | 0 | 0 | 100 | N/A | |||||
| Waste Development | 3 | 0 | 3 | 100 | N/A |
Recovery factors of 90% account for losses due to stope underbreak, failed mucking, or structural failure. For ore development, 100% recovery is assumed as the full excavation profile is processed. Waste development assumes 3% dilution from incidental material incorporated during excavation.
| 13.2.9 | Mine design |
The underground mine design at Konkola incorporates a series of capital and operating developments to support LHOS and panel stoping across varying geotechnical and orebody conditions. Key development types, dimensions, gradients, and scheduling assumptions are summarised in Table 13.11.
| amcconsultants.com | 209 |
| S-K 1300 TRS: KCM Integrated Operations (Initial Assessment) | |
| Konkola Copper Mines Plc | 0424076 |
Table 13.11 Key development designs
| Development type | Dimensions (W x H, m) | Profile | Gradient | Typical length / notes | Rate (m/month) | Classification | ||||||
| Declines & Inclines | 5.5 x 5.5 | Arched 1 m | ±1:7 to ±1:8 | 500 m spacing, 60 m standoff from orebody | 50 | Capital | ||||||
| Rail & Haulage Drives | 5.0 x 5.0 | Arched 1 m | ±1:200 | One per decline loop, fed by ore / waste passes | 50 | Capital | ||||||
| Drainage Drives | 4.5 x 4.5 | Arched 1 m | ±1:200 | Linked to Shaft 4 pump system | 50 | Capital | ||||||
| Level Accesses | 5.5 x 5.5 | Arched 1 m | ±1:50 | 80–150 m (LHOS), up to 250 m (panel stoping) | 50 | Capital | ||||||
| Return Air Drives | 5.0 x 5.0 | Arched 1 m | +1:50 (or ±1:7) | T-configurations near decline access | 50 | Capital | ||||||
| Fresh Air Drives | 4.5 x 4.5 | Arched 1 m | +1:50 (or ±1:7) | Located off decline and access crosscuts | 50 | Capital | ||||||
| Stockpiles & Loading | 5.5 x 5.0 | Arched 1 m | Flat | 17.5 m (standard), 60 m (LHOS stockpiles) | 50–60 | Capital | ||||||
| Sumps | 4.5 x 4.5 | Arched 1.5 m | Flat | Two per crosscut, 12.5 m each | 50 | Capital | ||||||
| Diamond Drill Drives | 5.0 x 5.0 | Arched 1 m | Flat | 30 m every second decline loop | 50 | Capital |
Figure 13.13 to Figure 13.14 illustrates typical loading configurations for LHOS and panel stoping areas.
Figure 13.13 Plan view of a loading level
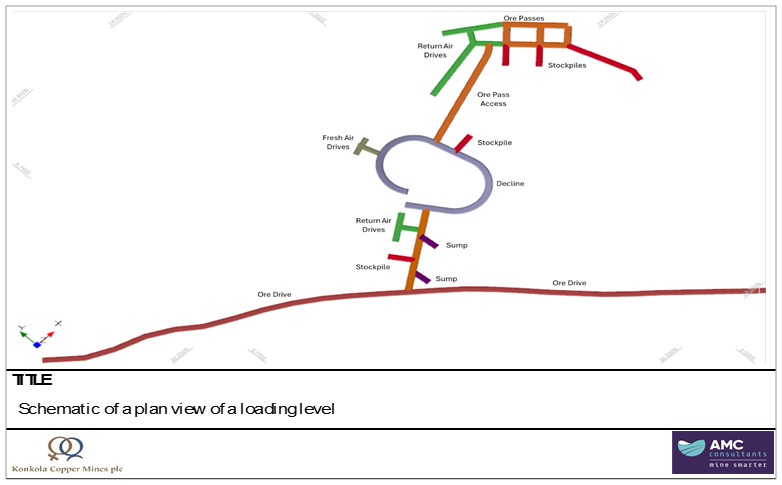
Source: AMC, 2026.
| amcconsultants.com | 210 |
| S-K 1300 TRS: KCM Integrated Operations (Initial Assessment) | |
| Konkola Copper Mines Plc | 0424076 |
Figure 13.14 Isometric view of the loading system (LHOS)
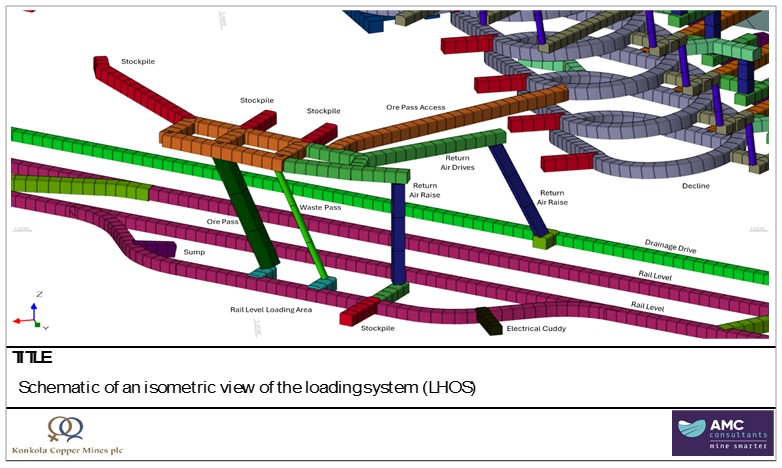
Source: AMC, 2026.
In the panel stoping area in Konkola Flats, a centralised loading area has been established (Figure 13.15), with all ore to be trucked to the loading area.
| amcconsultants.com | 211 |
| S-K 1300 TRS: KCM Integrated Operations (Initial Assessment) | |
| Konkola Copper Mines Plc | 0424076 |
Figure 13.15 Isometric view of the loading system (panel stoping)
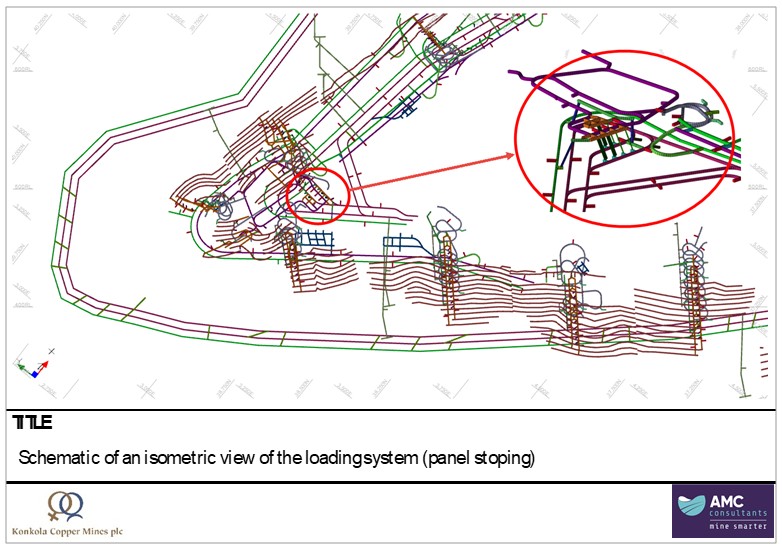
Source: AMC, 2026.
| 13.2.10 | Mining operations |
The Konkola Mine operation manages material movement through a structured haulage network that accommodates both ore and waste. Waste is largely hoisted to surface and processed or dumped, while ore follows designated tramming and hoisting routes to the surface concentrator. Handling systems differ by mining area and depth, reflecting the complexity of the orebody layout.
Waste rock from development headings is generally transported to surface, except for limited quantities in the Konkola Flats area. In this zone, selected development waste is temporarily deposited into open stopes and later recovered through lower access levels for use as backfill in panel stoping operations.
Across the remainder of the mine, waste is transported using the same tramming levels as ore but is segregated at tipping points. Dedicated waste tips are positioned adjacent to ore tips on the 590 mL, 875 mL, and 950 mL tramming levels. Waste is then delivered to shaft-specific passes and hoisted to surface, following this distribution:
| · | Waste hoisted via 3 Shaft is trucked to the 3 Shaft waste dump. |
| · | Waste hoisted via 1 Shaft and 4 Shaft is conveyed to the 1 Shaft waste dump. |
At surface, both dumps are equipped with crushing plants that process the waste rock into construction-grade aggregates for internal use or sale.
| amcconsultants.com | 212 |
| S-K 1300 TRS: KCM Integrated Operations (Initial Assessment) | |
| Konkola Copper Mines Plc | 0424076 |
Ore from stoping and development activities is collected using load haul dump (LHD) units and transferred to haul trucks. Trucks transport the ore to local tipping boxes positioned above the main tramming levels. From these points, the ore is transferred into rail cars and trammed to the shaft-specific tipping points for crushing and hoisting.
Material movement is dictated by both the mining area and the level of origin. Table 13.12 summarises the ore routing by area and tramming level.
Table 13.12 Materials handling locations
| Mining location | Tip location | Tramming | Shaft hoisting | |||||||||
| Mining area | Level | Section | Level | Section | level | Route | ||||||
| 610 mL | 600 mW-475 mW | 520 mL | 1,720 mW | 590 mL | 3 Shaft | |||||||
| Konkola East | 700 mL | 1,000 mW-800 mW | 520 mL | 1,865 mW | 590 mL | 3 Shaft | ||||||
| 760 mL | 2,200 mW-2,230 mW | 760 mL | 2,850 mN | 875 mL | 1 Shaft or 4 Shaft | |||||||
| Konkola Flats | 760 mL | 2,520 mW-4,200 mN | 760 mL | 2,850 mN | 875 mL | 1 Shaft or 4 Shaft | ||||||
| Konkola Extension | 825 mL | 3,700 mN-3,200 mN | 760 mL | 2,850 mN | 875 mL | 1 Shaft or 4 Shaft | ||||||
| 850 mL | 3,600 mN-3,645 mN | 840 mL | 3,600 mN | 875 mL | 1 Shaft or 4 Shaft | |||||||
| Bancroft North | 1,020 mL | 2,475 mN-2,440 mN | 930 mL | 2,120 mN & 2,475 mN | 950 mL | 1 Shaft or 4 Shaft | ||||||
| 13.2.11 | Backfill – Konkola Mine |
Backfilling is a critical component of the planned mining operations at Konkola, supporting stope stability, minimising surface subsidence, and enabling safe recovery of secondary stopes. Due to historical limitations with hydraulic fill systems, AMC have recommended the following:
| · | AMC recommends new paste fill system to replace historic hydraulic fill due to poor recovery rates and unreliable strength. |
| · | A 1,180,000 m3pa paste fill system capacity, supporting Konkola East, Flats, and Extension. |
A summary of the backfill infrastructure and strategic recommendations is provided in Table 13.13. The current hydraulic fill infrastructure is largely decommissioned or incomplete, with poor coarse tailings recovery previously constraining fill strength and performance. The proposed paste fill system incorporates filtration, cyclone classification, binder dosing, and dual-stage high-pressure pumping.
Table 13.13 Backfill infrastructure and strategic recommendations
| Element | Existing status | Recommendation | ||
| East Fill Plant | Decommissioned | N/A | ||
| West Fill Plant | Only tanks in use | Consider rehab for Bancroft | ||
| Waste Rock Crusher | Incomplete | Not feasible | ||
| Paste Plant | Proposed at #3 Shaft | Fully new facility with tailings filtration and binder mixing |
The system is designed to operate at approximately 72% solids content by weight, delivering paste at up to 230 m³/hr through a tandem-pump reticulation system. The estimated transit time to the furthest stopes is approximately 50 minutes. Backfill strength requirements are governed by exposure conditions and vertical stress, with unconfined compressive strength (UCS) targets ranging from 150 to 300 kPa. Geomechanical analysis confirms these values are adequate for the proposed stope geometries.
A dual-stage underground reticulation system will deliver paste from surface to production areas. Piping has been specified to meet pressure and wear requirements, with detailed routing and booster station locations defined. Flow velocities and pressure losses have been modelled using updated rheological inputs to confirm transport viability across a ~5.6 km range.
| amcconsultants.com | 213 |
| S-K 1300 TRS: KCM Integrated Operations (Initial Assessment) | |
| Konkola Copper Mines Plc | 0424076 |
The design also incorporates operational safeguards including in-line flushing systems, emergency sumps, and segmental reticulation control to minimise risk of paste line blockage or failure. Backfill barricades will be constructed using pre-fabricated arch kits and shotcrete. Placement will follow established sequencing, with curing periods prior to mucking secondary stopes.
Test results from 2006 indicate high binder demand when using local cement, with performance improving substantially when using higher-grade imported binders. Future test work will include updated tailings characterisation, rheology, and UCS strength analysis using current tailings output and alternative binder blends.
| 13.2.11.1 | Paste fill geomechanics and fill strength |
AMC’s design follows UCS-based criteria adapted from Terzaghi, Bloss, and Grice for vertical exposures. Stope fill requirements are based on orebody dip and exposure configuration.
Stopes in the shallow-dipping Konkola Flats will be mined as primary and secondary panels, with paste filling beginning after initial extraction. Fill curing is assumed to be 28 days before recovery of secondary stopes. Based on the analysis of the Konkola test work completed in 2006, AMC recommends the cement dosing rates shown in Table 13.14, for paste fill at 72%Cw density. This test work will be repeated as soon as stable mill operations producing representative tailings size fractions are available to confirm this advice.
Figure 13.16 shows the strength calculations for a dual exposure stope and Figure 13.17 shows the strength calculations for a single exposure stope.
Figure 13.16 Target paste design strength – 2 Exposures
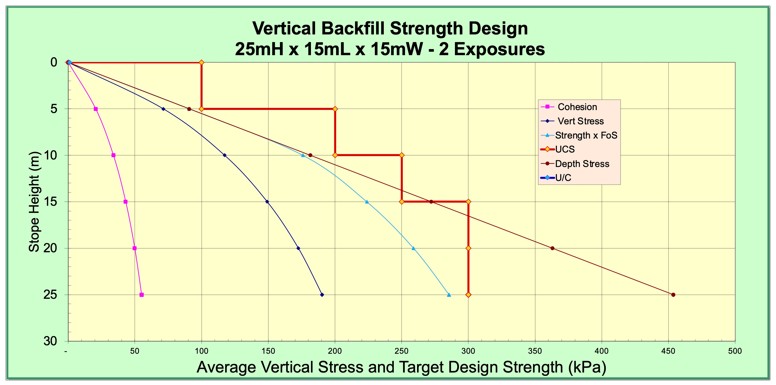
Source: AMC, 2026.
| amcconsultants.com | 214 |
| S-K 1300 TRS: KCM Integrated Operations (Initial Assessment) | |
| Konkola Copper Mines Plc | 0424076 |
Figure 13.17 Target paste design strength – 1 Exposure
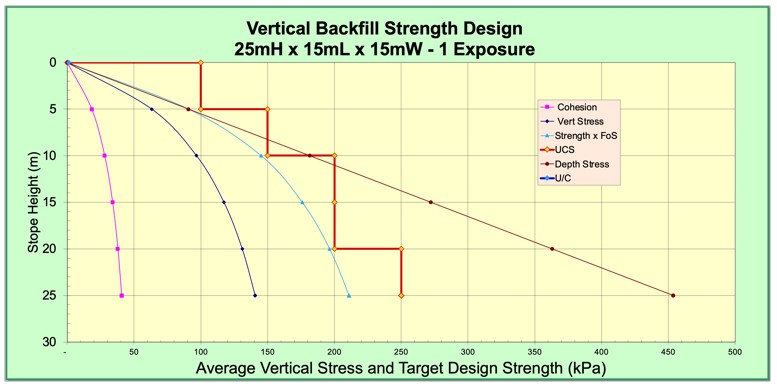
Source: AMC, 2026.
The target design strengths for paste fill are summarised in Table 13.14. These are calculated with a factor of safety of 1.5 and rounded up to the next 50 kPa UCS increment.
Table 13.14 Konkola paste fill design strengths (FoS=1.5) and paste fill recipes at 28 days curing
| Paste fill duty | Paste fill exposures |
Maximum vertical stress (kPa) |
Target strength design (kPa) |
Cement binder dosing (%) | ||||
| Bulk Fill | None | 100 | 150 | 2 | ||||
| Primary and continuous advance | One | 150 | 250 | 3.5 | ||||
| Primary – secondary | Two | 200 | 300 | 4.0 |
Future test work will verify binder content, investigate partial substitution using copper slag from the Chingola smelter, and refine strength / rheology parameters based on stable PSD tailings from the #4 Concentrator.
| 13.2.11.2 | Paste fill placement and retention |
Paste fill is placed using arched shotcrete barricades with standardised Doherty wall frame kits to provide structural support (Figure 13.18).
| amcconsultants.com | 215 |
| S-K 1300 TRS: KCM Integrated Operations (Initial Assessment) | |
| Konkola Copper Mines Plc | 0424076 |
Figure 13.18 Paste fill arched shotcrete barricades
| Doherty wall frame kits | Completed barricade | |
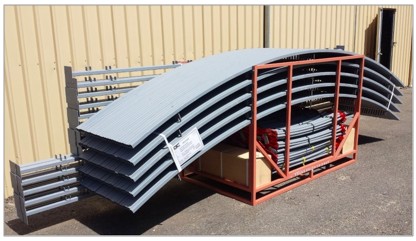 |
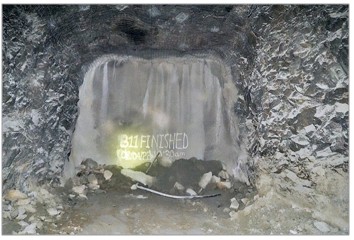 |
Source: AMC, 2026.
| 13.2.12 | Ventilation – Konkola Mine |
The ventilation system at Konkola Mine is essential for maintaining safe working conditions by supplying fresh air, diluting contaminants, controlling heat, and meeting regulatory standards. Airflow requirements are determined from diesel equipment usage, heat loads, depth, and mining methods. Ventilation modelling and empirical calculations were used to optimise airflow distribution.
Airway velocities must fall within defined ranges to ensure efficient airflow and manageable pressure losses. The Primary raises optimally sized at 4.5 m diameter and secondary raises at 3 m × 3 m.
Heat management is crucial due to geothermal gradients and equipment heat load. Refrigeration is required when virgin rock temperature reaches 36°C, particularly in deeper mine areas, using surface and underground cooling systems to maintain a safe environment. While immediate refrigeration may not be necessary based on current heat sources and cooling power, deeper mining may require it as virgin rock temperatures approach 36°C.
The minimum airflow requirement for diesel equipment is 0.06 m³/s per kW of engine power. The mining fleet includes cable bolters, jumbos, production loaders, and trucks, with airflow requirements per unit ranging from 1.9 m³/s to 30.8 m³/s as summarised in Table 13.15.
Table 13.15 Machine types, counts, and utilisation factors
| Equipment description | Rated power (kW) | Vent dilution factor | Duty cycle | Eff diesel power (kW) | Engine
Eff (%) | Heat load (kW) | Vent req (m3/s) | |||||||||||||||||||||
| Sandvik DS422i Cable Bolter | 119 | 0.1 | 18 | % | 20.9 | 90 | % | 18.8 | 1.9 | |||||||||||||||||||
| Sandvik DD422i Jumbo Drill | 119 | 0.1 | 18 | % | 20.9 | 90 | % | 18.8 | 1.9 | |||||||||||||||||||
| Sandvik DL432i Production Drill | 119 | 0.1 | 18 | % | 20.9 | 90 | % | 18.8 | 1.9 | |||||||||||||||||||
| Sandvik LH515i Production Loader | 268 | 0.1 | 51 | % | 135.7 | 90 | % | 122.1 | 12.2 | |||||||||||||||||||
| Sandvik TH663i Production Trucks | 585 | 0.1 | 58 | % | 342.1 | 90 | % | 307.9 | 30.8 | |||||||||||||||||||
The primary ventilation system consists of fresh air supplied via intake shafts and exhaust air via return airways. The current performance impacted by fan maintenance of some fans. The primary ventilation system requirements are summarised in Table 13.16 and Figure 13.19.
| amcconsultants.com | 216 |
| S-K 1300 TRS: KCM Integrated Operations (Initial Assessment) | |
| Konkola Copper Mines Plc | 0424076 |
Table 13.16 Summary of primary ventilation airflows
| Capacity max quantity (m3/s) | Intake (m3/s) | Variance (m3/s) | ||||||||||
| Intake capacity | 2,703 | 2,185 | 520 | |||||||||
| Return capacity | 1,891 | 1,456 | 435 | |||||||||
Figure 13.19 Ventilation compared to production
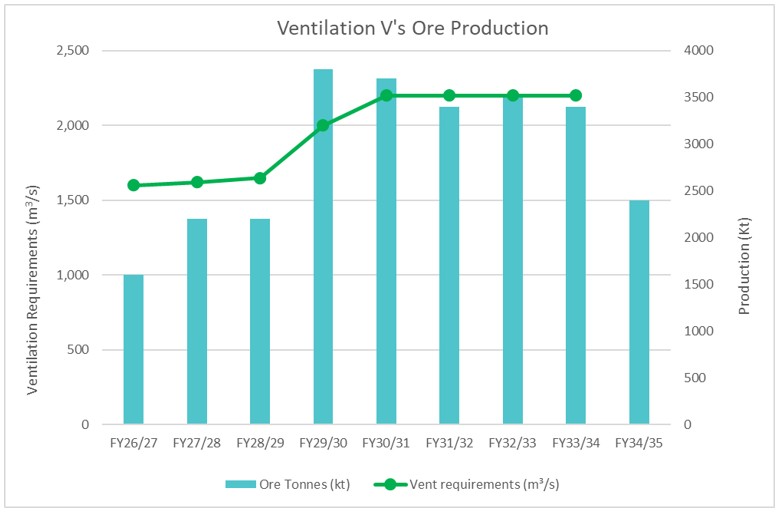
Source: AMC, 2026.
The future ventilation requirements for Konkola to meet production growth is necessary for sustaining planned production levels. To sustain production, a new 7.2 m diameter intake shaft and a matching return shaft are proposed.
| 13.3 | Nchanga Operations |
The Nchanga Business Unit (NBU) spans a broader range of geological variability, incorporating the following mining methods:
| · | Conventional open pit mining at COP DF and F Surface Pit. |
| · | Block caving and remnant stoping in underground areas. |
| · | Tailings reclamation from TD03 and TD04. |
Active production is concentrated in two primary zones:
| · | COP D and F Surface Pit. |
| · | Nchanga Underground (NUG) Inclined Block Cave, which targets the BSF and TFQ ore zones. |
These operational zones are illustrated in Figure 13.15, with the NUG mine situated on the northwestern edge of the historical Nchanga Open Pit (NOP).
| amcconsultants.com | 217 |
| S-K 1300 TRS: KCM Integrated Operations (Initial Assessment) | |
| Konkola Copper Mines Plc | 0424076 |
Figure 13.20 NBU active production zones
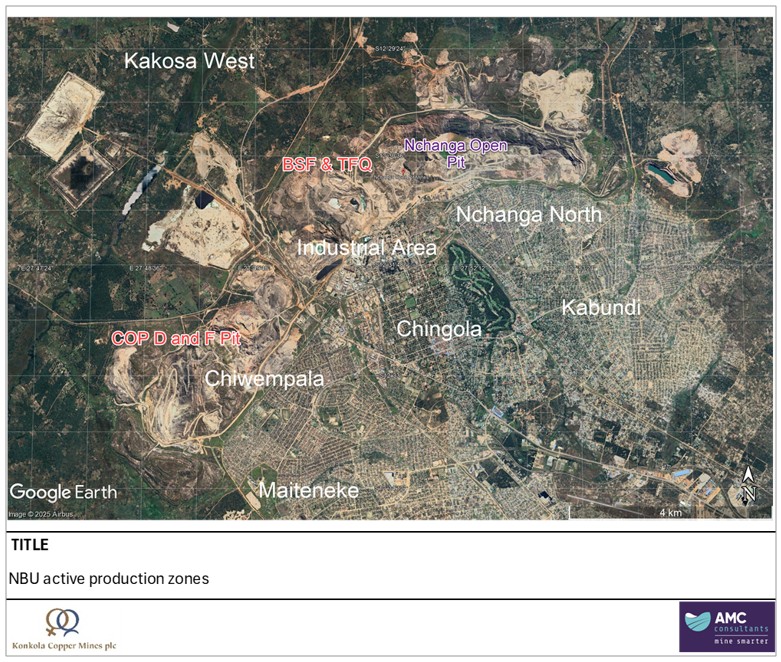
Source: Google Earth, 2026 (modified).
| 13.3.1 | COP D and F surface pit |
Located approximately six kilometres southwest of the historical NOP, the COP D and F pit represents the sole active open pit operation within the Nchanga complex. This pit exploits shallow copper oxide and sulfide mineralisation along the southern limb of the Nchanga Syncline.
Mining activities follow a conventional approach, beginning with drill-and-blast techniques, followed by hydraulic shovel excavation and truck haulage. Extracted ore is transported to a nearby processing facility, while waste material is deposited in adjacent dumps.
The pit is developed through staged pushbacks and top-down benching, guided by Whittle optimisation models. The design integrates both geotechnical slope controls and hydrological management systems to ensure operational safety and efficiency. Current annual production from COP D and F is approximately 1.6 Mt of copper ore.
| 13.3.1.1 | Geotechnical considerations |
Geotechnical assessments were completed for both underground and open pit operations at Nchanga, drawing on historical ground control plans and current observations. The underground mine comprises the UOB and LOB, while open pit assessments focus on NOP Cut II and the COP DF.
| amcconsultants.com | 218 |
| S-K 1300 TRS: KCM Integrated Operations (Initial Assessment) | |
| Konkola Copper Mines Plc | 0424076 |
Rock mass conditions
Geotechnical characterisation based on Q-System and RMR classifications indicates that the LOB is generally defined by fair to very good ground conditions. Key units such as Arkose and Rhyolite-Gabbro exhibit competent behaviour, while Lower Banded Shale presents more variable quality. In the UOB, conditions are more heterogeneous, ranging from very poor to very good, depending on lithology. Particularly poor ground is associated with the Banded Siltstone Shale, while better conditions are observed in Arkose and TFQ units.
No in situ stress measurements have been conducted. However, field observations suggest that mining along strike increases joint opening and localised rock mass damage. Minor rock spalling has been reported near fault zones and around remnant pillars. Seismic monitoring is not currently installed.
Structural observations
The LOB features moderate to steeply dipping joint sets with flat bedding, whereas the UOB includes moderately dipping structures with smooth, planar surfaces. These may present stability challenges where weathering is present. Both GCMPs provide protocols for managing structural risks, although AMC recommends updating these documents to reflect current best practice.
| 13.3.1.2 | Geotechnical considerations Nchanga open pits |
This section summarises the geotechnical findings for the KCM open pits, including the NOP and the COP DF. The primary focus is on COP DF, where further development is planned.
The Nchanga Mineral Resources are situated around the northern edge of the township of Chingola. Figure 13.21 shows the aerial photo and locations of open pits at Nchanga. This geotechnical gap analysis to identify fatal flaws covers both NOP Cut II and COP DF open pits with the priority focus on COP DF.
There is a good knowledge of the geology and hydrogeological units around the Nchanga Open Pit area. There appears to be ongoing slope monitoring at both NOP Cut II and COP DF pits using pit inspections, Slope Stability Radar (SSR) and prism systems. The ground water monitoring is undertaken regularly at COP DF and water level measurements are up to date.
| amcconsultants.com | 219 |
| S-K 1300 TRS: KCM Integrated Operations (Initial Assessment) | |
| Konkola Copper Mines Plc | 0424076 |
Figure 13.21 Aerial photo and locations of open pits at Nchanga
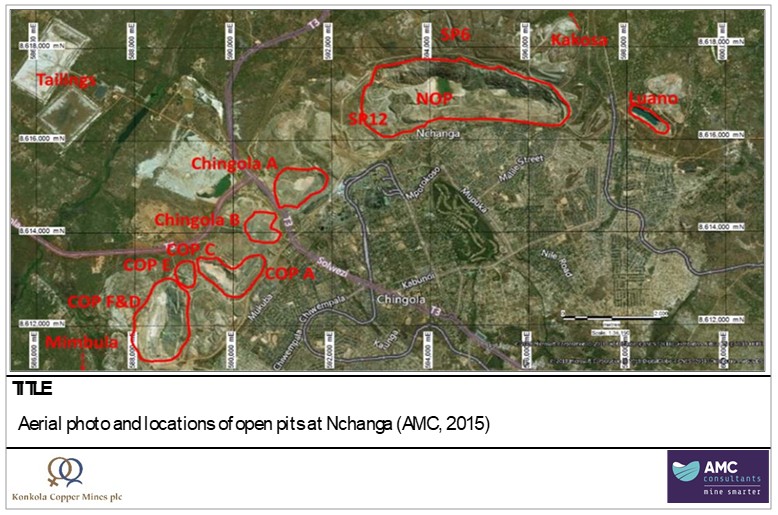
Source: AMC, 2015.
NOP Cut II
NOP Cut II is the largest historic open pit at Nchanga, previously mined to a depth of 435 m and partially backfilled. The orebody dips north at ~25°, with mineralisation hosted in Feldspathic Quartzite (TFQ) and Upper Banded Shale (UBS). The north wall (hanging wall) maintains a stable slope of ~42°, while the footwall follows the orebody dip.
A formal geotechnical design review has been completed, supported by slope monitoring via SSR, pit inspections, and prism systems. NOP Cut II geotechnical domains are shown in Figure 13.22 (GCMP, 2020). Mapping from existing pit exposures were used as the primary data source for identifying areas of poor rock quality within the pit design. The design parameters are presented in Table 13.17.
| amcconsultants.com | 220 |
| S-K 1300 TRS: KCM Integrated Operations (Initial Assessment) | |
| Konkola Copper Mines Plc | 0424076 |
Figure 13.22 NOP Cut II geotechnical domains
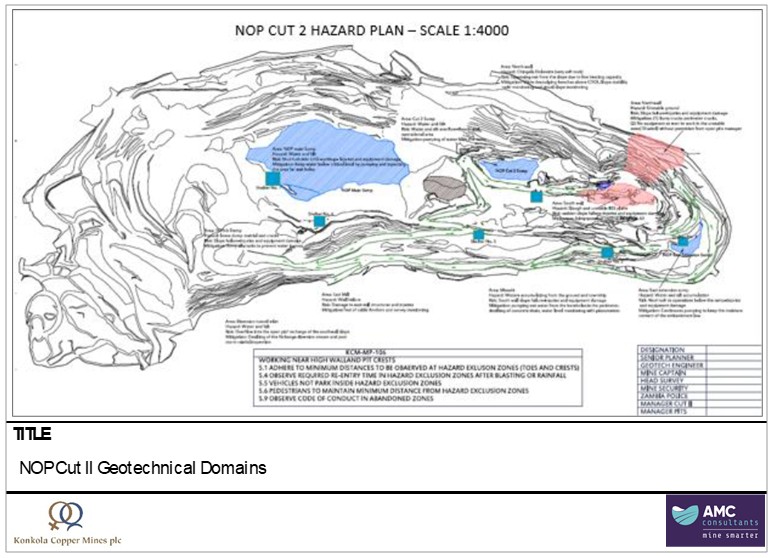
Source: GCMP, 2020.
Table 13.17 NOP Cut II design parameters
| Location | Stack | Bench height (m) | Bench face angle (°) | Bench width (m) | Stack angle (°) | Elevation | ||||||
| Upper | 15 | 38 | 9 - 12 | 20 | URD | |||||||
| North wall (hangingwall) | Middle | 15 | 60 | 9 - 12 | 35 | Above CDOL | ||||||
| Lower | 15 | 70 | 9 - 12 | 48 | Below CDOL | |||||||
| South wall (footwall) | Overall | 15 | 70 | 9 - 12 | Follow dip of TFQ | Overall wall |
Bench design includes 15 m high benches with varying face and stack angles depending on elevation and lithology. Dewatering is managed via two sumps that feed into underground drainage systems for surface treatment.
COP DF Pit
COP DF is a separate and currently active open pit area, located southwest of the exhausted COP A, COP C, and COP E pits. The pits are planned to reach ~270 m depth (Pit F) and ~345 m depth (Pit D).
Mineralisation occurs within the Arkose Formation, adjacent to the basement unconformity, with the hanging wall located in the lower banded shale. Rock types include feldspathic quartzites, calc-schists, and local conglomerates.
| amcconsultants.com | 221 |
| S-K 1300 TRS: KCM Integrated Operations (Initial Assessment) | |
| Konkola Copper Mines Plc | 0424076 |
Daily groundwater level monitoring and active dewatering are in place via surface and in-pit boreholes targeting key aquifers (URD, Chingola Dolomite, Banded Sandstone). A geotechnical domain model supports slope design and ongoing monitoring. Geotechnical domains determined by KCM for the COP DF are presented in Figure 13.23.
Figure 13.23 COP DF geotechnical zones
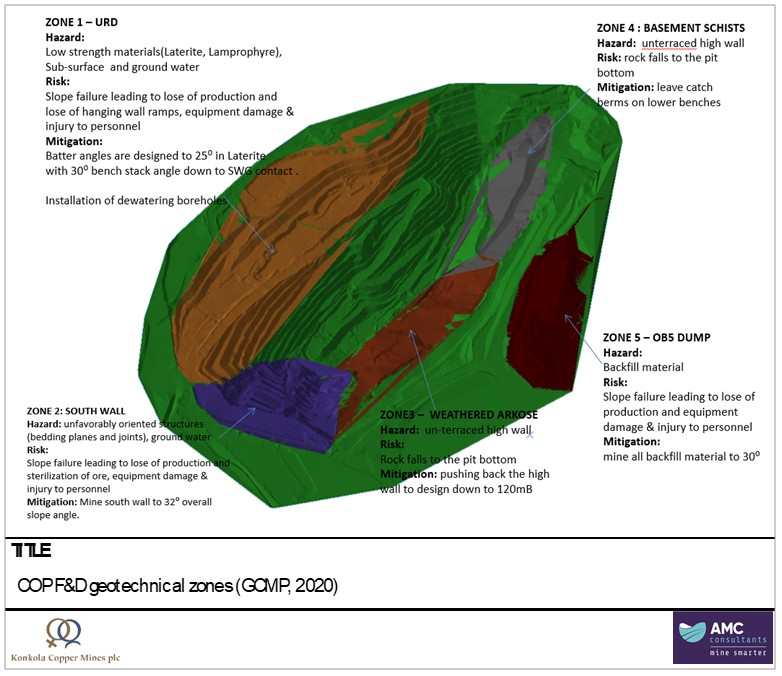
Source: GCMP, 2020.
Key geotechnical risks for COP DF open pit include:
| · | Western Wall: Historical tension cracks and circular failures were observed in the northwest pit sector. Geotechnical assessment is recommended to manage and implement appropriate design and controls. |
| · | South Wall: A major wall slip in 2012 involved toppling and circular failure. While material has stabilised, a wide berm was established to mitigate future risk. Geotechnical assessment is recommended to manage and implement appropriate design and controls. |
| · | Additional hazards include slab collapses from unterraced high walls and low rock mass strength zones. |
| · | Ongoing slope monitoring and regular review of groundwater behaviour and slope conditions are recommended. |
| · | Mapping the open pits slopes for voids relating to artisanal mining is recommended implementation of a void management plan. |
| amcconsultants.com | 222 |
| S-K 1300 TRS: KCM Integrated Operations (Initial Assessment) | |
| Konkola Copper Mines Plc | 0424076 |
The additional geotechnical data should be used to confirm the geotechnical domains and update or confirm the supporting information. Ongoing monitoring in the existing mined areas will be important to develop an understanding of the actual performance of all excavations, development, and stopes. The additional geotechnical and monitoring data must be used to inform an update to the geotechnical hazard management plan for Nchanga operations.
| 13.3.2 | Planned underground mining – Nchanga |
The following section outlines the underground assets that form part of the Nchanga Operations these include COP D and F, COPE Extension. Locations of these deposits are shown in Figure 13.24.
Figure 13.24 Nchanga Underground mining operations (NUG)
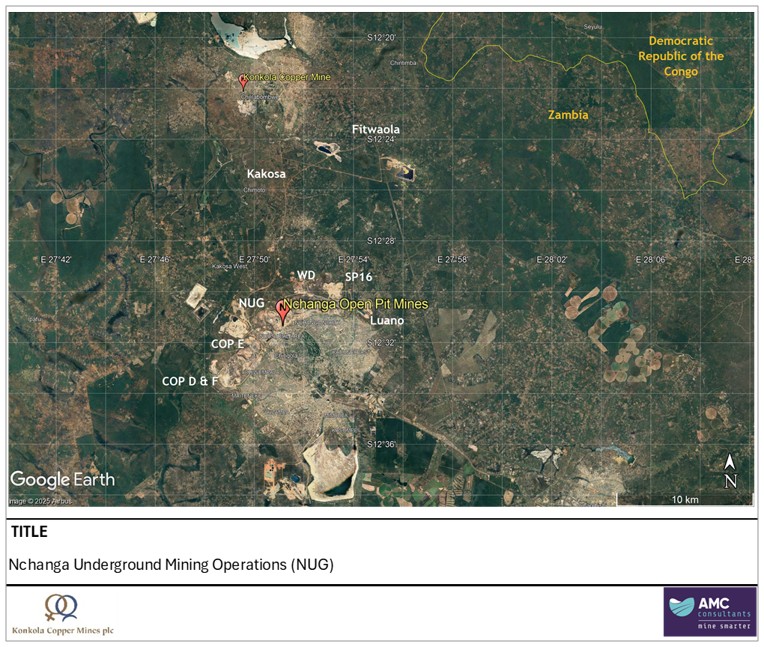
Source: Google Earth, 2026.
Table 13.18 summarises the proposed mining methods for the key ore zones currently considered as part of the LOM production strategy.
Table 13.18 Nchanga underground mining methods
| Orebody | Mining method | Description | ||
| COP DF, COPE | Transverse sub-level open stoping. | Orebody widths justify transverse development layouts and wider stope spans. |
| amcconsultants.com | 223 |
| S-K 1300 TRS: KCM Integrated Operations (Initial Assessment) | |
| Konkola Copper Mines Plc | 0424076 |
| 13.3.2.1 | Mining dilution and recovery factors |
Modifying factors applied to the Nchanga Underground operations were developed to account for the impact of dilution, ore loss, and overbreak during mining. These factors reflect the anticipated performance of the selected mining methods under the geological and geotechnical conditions observed across the various deposits.
Where scheduling quantities were prepared for the Nchanga LOM areas, ore recovery and dilution factors were tailored to individual deposits. The following modifying factors were applied to schedule quantities as summarised in Table 13.19.
Table 13.19 Schedule modifying factors
| Modifying factors | COP DF | COP E | ||
| Ore Recovery | 90% | 90% | ||
| Ore Dilution | 15% | 15% |
| 13.4 | Tailings reclamation |
| 13.4.1 | Sources of production TD03, TD04, TD05 |
Tailings reclamation at the Nchanga site forms an important component of the production strategy, primarily supplying the Nchanga TLP with low-grade oxide material. Tailings originate from:
| · | Historical wet tailings deposited in Tailings Dams TD03 and TD04. |
| · | Dry coarse tailings remaining on the walls of TD03 after previous hydraulic mining campaigns. |
| · | Direct tailings streams from the New West Mill (NWM), New East Mill (NEM), and Old East Mill (OEM) concentrators. |
| · | The TD05 Mineral Resource (Indicated portion under the M&I Case; Indicated plus Inferred under the Full Resource Case) is included in both case mine plans. |
The Nchanga TLP is designed to recover copper not previously extracted during initial flotation, including acid-soluble copper, residual sulfides, and fine unliberated particles. Leaching is supported by an on-site acid plant with a capacity of 1,850 tonnes per day, supplemented by third-party acid purchases as required.
Under the Full Resource Case, the proposed new TLP 2 facility will operate in parallel with the existing Nchanga TLP to process the larger TD05 throughput. Both facilities will incorporate Elevated Temperature Leach (ETL) under the Full Resource Case (refer Section 14.5); the existing Nchanga TLP will also be retrofitted with ETL under the M&I Case.
TD03 and TD04 are located approximately 7 km west of the main processing facilities (Figure 13.25). The wet tailings are recovered via hydraulic mining, while dry tailings from TD03 are loaded using conventional earthmoving equipment and transported by truck to the NEM, where they are re-slurried and pumped to the Nchanga TLP for leaching.
The TD05 Mineral Resource (Muntimpa TSF) is located just to the south of Chingola, in proximity to the Nchanga concentrator complex.
| amcconsultants.com | 224 |
| S-K 1300 TRS: KCM Integrated Operations (Initial Assessment) | |
| Konkola Copper Mines Plc | 0424076 |
Figure 13.25 Nchanga site layout
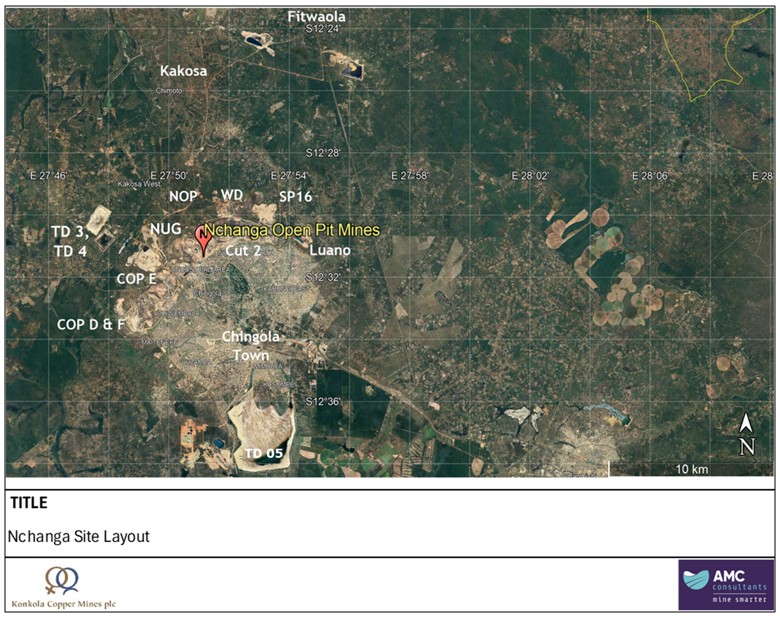
Source: Google Earth.
| 13.4.2 | Tailings dam inventory |
The March 2024 baseline tonnage estimate for the tailings deposits recorded 10.34 Mt dry tailings in TD03 and 27.65 Mt wet tailings in TD04. The inventory available for processing as at 1 April 2026, updated to reflect cumulative tailings reclamation at TD03, TD04, and TD5 from FY2026, is set out in Table 13.20 below. TCo is presented for information purposes and is not recovered in the solvent extraction process.
Table 13.20 Available inventory from TD03, TD04 and TD05 for the Nchanga TLP from 1 April 2026
| Facility | Cut-off TCu% | Tonnes (Mt) | TCu% | AsCu% | TCo% | |||||||||||||||
| TD03 | 0.0 | 2.8 | 0.75 | 0.60 | 0.01 | |||||||||||||||
| TD04 | 0.0 | 21.7 | 0.62 | 0.42 | 0.03 | |||||||||||||||
| TD05 | 0.0 | 423.3 | 0.54 | 0.30 | 0.01 | |||||||||||||||
Note: Inventory reflects Mineral Resources as at 1 April 2026. The total Mineral Resource for TD03 and TD04 is 24.5 Mt (see Table 11.24). Mineral Resources for TD05 are reported in this Initial Assessment. Advancement to PFS-level confidence would require additional metallurgical test work (including pilot- or demonstration-scale leach testing at intended plant operating temperature and feed variability studies) to validate the recovery assumptions, alongside engineering refinement of the proposed Elevated Temperature Leach retrofit and TLP 2 design.
| amcconsultants.com | 225 |
| S-K 1300 TRS: KCM Integrated Operations (Initial Assessment) | |
| Konkola Copper Mines Plc | 0424076 |
| 13.4.3 | Processing methodology and plant design |
The Nchanga TLP processes tailings at a nominal rate of 11 to 16 million tonnes per annum using a well-established three-stage hydrometallurgical process:
| 1 | Sulfuric Acid Leaching: dissolves acid-soluble copper fractions from tailings material. |
| 2 | Solvent Extraction (SX): selectively recovers and purifies copper in solution. |
| 3 | Electrowinning (EW): produces high-purity copper cathode suitable for LME Grade A certification. |
Under both the M&I Case and the Full Resource Case, the existing Nchanga TLP is proposed to be retrofitted with Elevated Temperature Leach (ETL) technology to increase copper recovery from refractory acid-insoluble copper (AICu) in the TD05 feed. The ETL retrofit operates at elevated temperature (approximately 80°C) using sulfuric acid, achieving higher overall TCu recovery to cathode than conventional ambient-temperature leach (refer Section 10.4.3).
Under the Full Resource Case, the proposed new TLP 2 facility will operate at a nominal rate of approximately 17.7 Mtpa in parallel with the existing Nchanga TLP, providing additional tailings processing capacity for the larger TD05 throughput required to process the Inferred portion of the TD05 Mineral Resource. TLP 2 is designed with integrated ETL and uses the same three-stage hydrometallurgical process (leach → SX → EW) as the existing facility (refer Section 14.5).
Dry tailings from TD03 are first ground at the New East Mill (NEM) or Old East Mill (OEM) before entering the leach circuit. Wet tailings from TD04 are pumped directly to the Nchanga TLP following hydraulic reclamation. TD05 reclamation under both cases is undertaken using hydraulic methods and pumped to the leach circuits at the existing Nchanga TLP and (under the Full Resource Case) TLP 2.
| 13.4.4 | Production schedule |
Tailings recovery will be staged to align with Nchanga TLP throughput and acid availability. The dry reclaim contract at TD03 is targeting an output of 2.84 Mt over its remaining reclamation period. Wet tailings recovery from TD04 is expected to ramp up progressively. AMC estimated the production tonnes for TD04. Mineral Resources in TD05 are included in both the M&I Case and the Full Resource Case mine plans.
The existing Nchanga TLP has an assumed throughput rate of approximately 16.7 Mtpa. Under the Full Resource Case, the proposed TLP 2 facility has an additional throughput rate of approximately 17.7 Mtpa, operating in parallel with the existing TLP (refer Section 14.5).
Total acid-soluble copper (ASCu) recovery from TD03 is projected at approximately 11,891 tonnes, while TD04 is expected to yield approximately 67,460 tonnes of ASCu across its reclamation schedule, assuming an ASCu recovery of 74.8%.
Over its reclamation life, TD05 is forecast to yield approximately 1,540 kt of payable copper under the Full Resource Case, processed over the period FY2027/28 to FY2041/42 (15 years) at an average of approximately 103 ktpa. Under the M&I Case, TD05 yields approximately 713 kt over the period FY2027/28 to FY2040/41 (14 years) at an average of approximately 51 ktpa. The difference between the two cases reflects the exclusion of the Inferred portion of the TD05 Mineral Resource from the M&I Case and, consequently, the absence of TLP 2 from the M&I Case mine plan.
Detailed year-by-year production schedules for both cases are presented in the Production Schedule sections of this report (refer Table 19.3 for the Full Resource Case schedule and Table 19.4 for the M&I Case schedule).
| amcconsultants.com | 226 |
| S-K 1300 TRS: KCM Integrated Operations (Initial Assessment) | |
| Konkola Copper Mines Plc | 0424076 |
| 13.4.5 | Materials handling, slurry pumping |
The dry tailings at TD03 are reclaimed by Hanhe Industries Zambia, using 70-tonne haul trucks over a 9.9 km haul route to the NEM plant. Dry tailings are then re-slurried and pumped to the Nchanga TLP for processing.
The wet tailings reclamation operation at TD04 is contracted to Fraser Alexander Zambia under a five-year agreement that commenced 1 December 2024. The scope of work includes:
| · | Hydro-mining using 5 to 6 high-pressure water cannons. |
| · | Operation of two intermediate pumping stations. |
| · | Full operational staffing (157 to 193 personnel) and maintenance responsibilities. |
KCM retains responsibility for power, water, major infrastructure, lime for pH control, and electrical maintenance.
TD05 reclamation under both the M&I Case and the Full Resource Case is anticipated to be undertaken using hydraulic mining methods similar to those currently in operation at TD04, leveraging the operational experience from the Fraser Alexander Zambia contract. Slurried material will be pumped to the existing Nchanga TLP (under both cases) and, under the Full Resource Case, also to the proposed TLP 2 facility. Detailed contractor selection, contractual arrangements, and operating method confirmation for TD05 reclamation have not been finalised at the date of this Initial Assessment.
Under the Full Resource Case, the higher TD05 throughput required to process the Inferred portion of the Mineral Resource will necessitate either expansion of the TD05 hydraulic reclamation capacity, parallel reclamation operations, or a combination of both. The operational details will be confirmed as part of advancement to PFS-level confidence.
| 13.5 | Konkola Mine – conceptual mining plan |
| 13.5.1 | Near-term production (Measured and Indicated Resources) |
The near-term production profile for Konkola Mine, based on Measured and Indicated Resources, spans the period from 2025 to 2035. Ore production from Konkola Mine comprises 29 Mt of ore at a mined grade of 2.9% TCu and 0.06% TCo, with contained metal of 899 kt total copper and 19 kt total cobalt, delivered to the processing facility.
The total Konkola Mine development schedule (Figure 13.26) comprises a total of 33 km of lateral capital development meters, 5 km of capital vertical development and 60 km of lateral operating development.
The Konkola development has a high upfront lateral development requirement of 32,000 m which tapers down over the life of the mine M&I Case mine plan.
| amcconsultants.com | 227 |
| S-K 1300 TRS: KCM Integrated Operations (Initial Assessment) | |
| Konkola Copper Mines Plc | 0424076 |
Figure 13.26 Konkola Mine development schedule
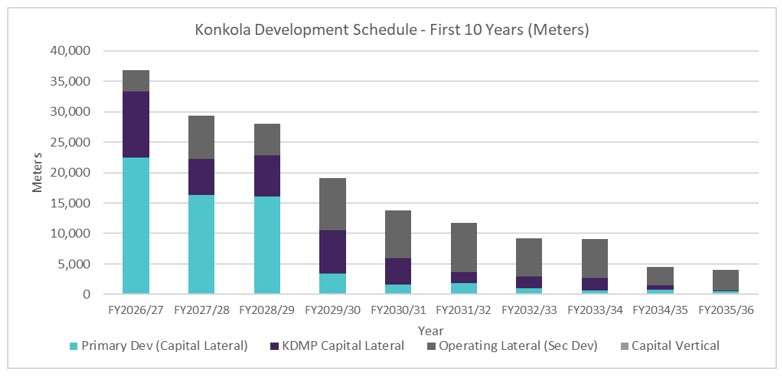
Source: AMC, 2026.
| 13.5.2 | Full Resource Case |
The mined inventory in Table 13.21 is less than the in-situ Mineral Resource of 288 Mt @ 3.4% TCu (Section 11.3) due to mining recovery and dilution factors applied consistent with the proposed mining methods. Mining recovery accounts for material lost to pillars and un-mineable shapes; dilution introduces waste into the mined ore and reduces the head grade. Combined, these factors produce an approximately 19% reduction in tonnage and 15% reduction in grade in the Full Resource Case mined inventory, with the same factor framework applied to the M&I Case.
The two scenarios reflect different confidence bases for production planning. The M&I Case is constrained to Measured and Indicated Mineral Resources and supports a higher-confidence ~15-year mine life that maps directly to the companion PFS Mineral Reserve estimate (Section 12 of the PFS TRS). The Full Resource Case extends the production schedule to ~45 years at steady-state rates of 5–6 Mtpa by incorporating Inferred Mineral Resources, subject to the conversion and development activities listed below. Inferred Mineral Resources are considered too speculative geologically to have economic considerations applied that would enable categorisation as Mineral Reserves; there is no certainty that the Full Resource Case production will be realised.
Realisation of the Full Resource Case is contingent on:
| · | Conversion of Inferred Mineral Resources to Indicated and Measured categories through infill drilling. |
| · | Staged development of dewatering infrastructure, including the 1390L pump station. |
| · | Expansion of ventilation capacity (new intake and return shafts). |
| · | Construction and commissioning of a paste fill plant (1,180,000 m3pa paste fill). |
| · | Progressive development of deeper mining zones (Bancroft sector below 950L). |
Table 13.21 Konkola Mine production scenarios
| Case | Basis | Tonnage (Mt) | TCu% | Cu (kt) | Mine Life | |||||||||||
| M&I Case | M&I Resources | 29 | 2.9 | 839 | ~15years | |||||||||||
| Full Resource Case | M&I+Inf Resources | 233 | 2.9 | 6,852 | ~45 years | |||||||||||
Notes:
| · | M&I Case based on Measured and Indicated Mineral Resources per Section 11. |
| · | Full Resource Case based on Measured, Indicated and Inferred Mineral Resources per Section 11. |
| · | Approximately 86% of Konkola Mine Resources are classified as Inferred. |
| amcconsultants.com | 228 |
| S-K 1300 TRS: KCM Integrated Operations (Initial Assessment) | |
| Konkola Copper Mines Plc | 0424076 |
Total project copper production in the Full Resource Case ramps from approximately 95 ktpa recovered copper in FY2026/27 to a peak of approximately 314 ktpa in FY2032/33, drawing on three contributing sources: Konkola Mine ROM ore, Nchanga ROM ore (processed through the Nchanga concentrators), and tailings processed through the Nchanga TLP and the proposed TLP 2 facility (14.3.2.2). Konkola Mine reaches its steady-state production rate of approximately 6 Mtpa from FY2032/33, contributing an average of 130 ktpa recovered copper over the life of mine. Combined TLP throughput grows from approximately 13 Mtpa in FY2026/27 to approximately 34 Mtpa from FY2030/31 onwards, drawing on fresh tailings from the Nchanga concentrators supplemented by reclaimed material from TD03 and TD04 (via the existing Nchanga TLP) and TD05. D05 is included in the Mineral Resource for the first time following completion of the 2025/26 auger drilling and characterisation campaign (refer Section 11.4.4), and is processed via the proposed TLP 2 facility (refer Section 14.3) (via the proposed TLP 2 facility - refer Sections 14.3 and 18.6). The first 10 years of the project ore feed and copper production schedule is shown in Figure 13.27.
Figure 13.27 Total project ore mining schedule
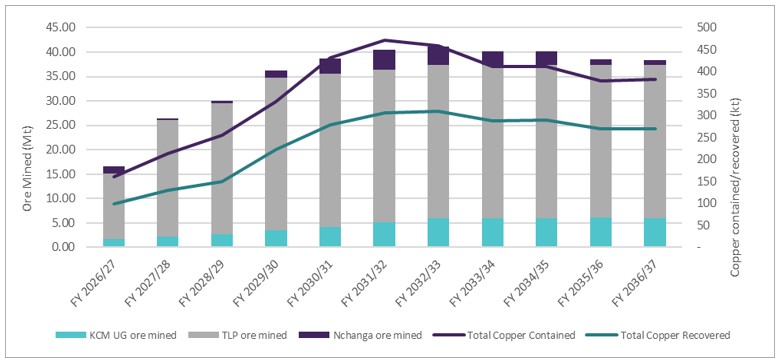
Source: AMC, 2026.
| 13.6 | Mining personnel |
The Konkola Mine is an existing and ongoing operation the workforce consists of a combination of, up to five, different mining contractors and fixed level of supporting KCM personnel. The costing and productivity planning for mining activities has been planned on unit cost rates from mining contractors and not on individual personnel allocations. The operations occupy a well populated area with a long history of mining exposure. It has been assumed that the KCM workforce will continue to be drawn from the local population, with a very limited number of temporary ex-patriot specialist advisors. As production levels increase, staff will be re-assigned from parts of the operations that are being depleted. Additional staff will be drawn from the local population and trained appropriately along with specialist partner mining contracting companies.
| 13.7 | Full resource scenario |
This IA evaluates the economic potential of the full KCM Mineral Resource base, comprising the Konkola Mine, the Nchanga Business Unit (COP DF and COP E Extension), and the tailings reclamation operations at TD03, TD04 and TD05. The following table summarises the Mineral Resources available for the conceptual mine plan.
| amcconsultants.com | 229 |
| S-K 1300 TRS: KCM Integrated Operations (Initial Assessment) | |
| Konkola Copper Mines Plc | 0424076 |
Table 13.22 KCM Mineral Resources by asset – 1 April 2026
| Asset | Measured & Indicated (Mt) | Inferred (Mt) | Total (Mt) | TCu% | Cu (kt) | |||||||||||||||
| Konkola Mine | 39 | 249 | 288 | 3.5 | 9,783 | |||||||||||||||
| COP DF | 15 | - | 15 | 1.6 | 233 | |||||||||||||||
| COP E Extension | 13 | 9 | 23 | 2.5 | 566 | |||||||||||||||
| TD03/TD04 | 25 | - | 25 | 0.6 | 157 | |||||||||||||||
| TD05 | 198 | 225 | 423 | 0.5 | 2,272 | |||||||||||||||
| Total | 290 | 483 | 773 | 1.68 | 13,009 | |||||||||||||||
Notes:
| · | Mineral Resources are reported with an effective date of 1 April 2026. No Mineral Reserves are declared as part of this Initial Assessment; the Reserve estimate is presented in the companion Pre-Feasibility Study Technical Report Summary. |
| · | Approximately 63% of KCM Mineral Resources are classified as Inferred (483 Mt of 773 Mt). Inferred Mineral Resources are considered too geologically speculative to have modifying factors applied to them that would enable them to be classified as Mineral Reserves, and there is no certainty that Inferred Mineral Resources will be converted to higher confidence categories with additional exploration. |
| · | TD03 / TD04 figures represent the combined Indicated Resource (TD03 3 Mt + TD04 22 Mt) reclaimed via the existing Nchanga TLP. |
| · | TD05 is processed via the existing Nchanga TLP (retrofitted with Elevated Temperature Leach) under both the M&I Case and the Full Resource Case; under the Full Resource Case, the additional TD05 throughput required to process the larger Mineral Resource scope is also processed via the proposed TLP 2 facility (refer Section 14.5), with both plants operating in parallel and using elevated temperature leach. |
| · | Cobalt grades and contained metal are reported in the underlying Mineral Resource statements (refer Section 11) and are not summarised here. Cobalt is recovered from Konkola Mine and Nchanga Business Unit ore via the smelter and refinery; cobalt is not recovered from the TLP route (TD03, TD04, TD05). |
| · | Classification in accordance with S-K 1300. |
| · | Rounding may cause apparent computational discrepancies. |
| 13.7.1 | Full Resource Case scenario assumptions |
The Full Resource Case scenario assumes:
| · | Continued exploration is assumed to support potential future conversion of Inferred Mineral Resources to Indicated and Measured categories. No certainty exists that any of the Inferred Resources will be converted to higher confidence categories. |
| · | Staged infrastructure development at Konkola Mine, including dewatering to 1390L, expanded ventilation (new intake and return shafts), and construction and commissioning of a 3 Mtpa paste fill plant. |
| · | Progressive development of Nchanga Business Unit deposits (COP DF Open Pit, COP DF Underground, COP E Extension), with Nchanga ROM depletion completing by approximately FY2037/38. |
| · | Tailings reclamation from TD03 and TD04 (per the M&I Case mine plan schedule, processed through the existing Nchanga TLP with conventional ambient leach during the initial reclamation period); TD05 reclamation through the existing Nchanga TLP (retrofitted with Elevated Temperature Leach) commencing in Year 2. |
| · | Commissioning of TD06 as a new active tailings storage facility, enabling cessation of fresh tailings deposition at TD05. |
| · | Construction and commissioning of TLP 2 in parallel with the existing Nchanga TLP (both facilities designed with / retrofitted with Elevated Temperature Leach), supported by the larger Mineral Resource base (including Inferred Resources) processed under the Full Resource Case (refer Section 14.5). Combined throughput across both facilities grows to approximately 34 Mtpa, with TD05 reclamation commencing in Year 2 and full TD05 inventory exhausted by approximately FY2041/42. |
| · | Steady-state Konkola Mine production of approximately 6 Mtpa, supplemented by Nchanga Business Unit ROM until depletion. |
| amcconsultants.com | 230 |
| S-K 1300 TRS: KCM Integrated Operations (Initial Assessment) | |
| Konkola Copper Mines Plc | 0424076 |
| · | Total Full Resource Case mine life of approximately 45 years (FY2026/27 to FY2070/71), anchored by Konkola Mine. Tailings-derived production from the combined existing Nchanga TLP and TLP 2 extends through to FY2041/42, after which the remaining ~28 years of mine life are sustained by Konkola Mine production alone. |
| 13.7.2 | Conceptual production profile |
The conceptual production profile for the Full Resource Case is summarised in Table 13.23.
Table 13.23 Conceptual production profile – Full Resource scenario
| Phase | Years | Ore (Mtpa) | Cu (ktpa) | Primary source | ||||
| Ramp-up | 1-5 | 9-36 | 265-465 | Combined TLP ramping 13→34 Mt (TD03/TD04 reclamation plus current Nchanga concentrator tails through existing TLP in Years 1–2; TD05 reclamation via TLP 2 commences in Year 3 and reaches steady-state ~34 Mt by Year 4); KCM UG ramping 0→4 Mt; COP DF Open Pit 0.3–1.2 Mt. | ||||
| Peak | 6-15 | 38-41 | 592-675 | TD05-dominated combined TLP at ~34 Mtpa + Konkola Mine UG at 5–6 Mtpa + Nchanga Business Unit (COP E Extension, COP DF Open Pit, COP DF Underground) | ||||
| Steady-state (post-TLP) | 16-40 | 6 | 380-438 | Konkola Mine UG (~6 Mtpa); TD05/TLP and Nchanga Business Unit operations exhausted by approximately FY2041/42 (Year 16) | ||||
| Decline | 41-45 | 1-5 | 140-360 | Konkola Mine UG (deep zones tapering off) |
Note: Ore figures represent total ore processed across all facilities (KCM mining + NBU mining + TLP/TLP 2 reclamation). Cu (ktpa, payable) represents payable copper production. Phase year ranges are approximate; year-by-year detail is presented in the Production Schedule section (refer Table 19.3 for the Full Resource Case schedule).
| 13.7.3 | Inferred Mineral Resource cautionary statement |
|
INFERRED MINERAL RESOURCE Cautionary Statement
Approximately 63% of KCM Mineral Resources are classified as Inferred (483 t of 773 Mt). At Konkola Mine, approximately 86% of Mineral Resources are classified as Inferred (249 Mt of 288 Mt).
Inferred Mineral Resources have a lower level of geological confidence than Indicated or Measured Resources. There is no certainty that further exploration will result in conversion of Inferred Resources to higher confidence categories, or that the full Resource scenario will be realised. It is reasonably expected, however, that the majority of Inferred Resources could be upgraded to Indicated category with continued infill drilling.
|
| amcconsultants.com | 231 |
| S-K 1300 TRS: KCM Integrated Operations (Initial Assessment) | |
| Konkola Copper Mines Plc | 0424076 |
| 14 | Processing and recovery methods |
The processing capability of KCM consists of assets at three sites:
| · | Konkola - concentrator and tailings storage facility. |
| · | Nchanga - concentrators, the existing Nchanga TLP (with proposed Elevated Temperature Leach retrofit), the proposed TLP 2 facility (refer Section 14.5), flash smelter, the acid plant, and the existing Muntimpa (TD05) and proposed TD06 tailings storage facilities. |
| · | Kitwe – Nkana refinery. |
Current and future requirements and provision of utilities such as power, water and related infrastructure is described in Section 15 of this TRS. The KCM processing sites are an existing and ongoing operation, and current personnel levels are maintained during the life of operations for each site. As production rates improve, it is anticipated that the improved productivity will be absorbed by a reasonably static workforce contingent.
The existing processing infrastructure has sufficient capacity to support both the M&I Case and the Full Resource Case for the Konkola Mine, the Nchanga Business Unit ROM (Full Resource Case only), and tailings reclamation from TD03, TD04, and TD05 (Measured and Indicated portion under the M&I Case; full Mineral Resource under the Full Resource Case; refer Sections 11.4.4 and Table 11.28). This infrastructure comprises the Konkola concentrator (6 Mtpa capacity), the Nchanga concentrators (13.4 Mtpa combined capacity across OEM, NEM and NWM), the existing Nchanga TLP (nominal throughput approximately 16.7 Mtpa, retrofitted with Elevated Temperature Leach under both cases), processing fresh Nchanga concentrator tails and reclaimed material from TD03, TD04, and TD05, the Nchanga flash smelter and acid plant, and the Nkana refinery. These facilities accommodate the Konkola Mine over its full production schedule under either case, Nchanga Business Unit operations through ROM depletion (approximately FY2037/38, Full Resource Case only), and the integrated M&I Case mine life of approximately 15 years, without further processing-capacity expansion under the M&I Case.
A new active tailings storage facility, TD06, is required under both economic cases. Fresh tailings deposition currently directed to Muntimpa (TD05) must cease by approximately end of 2028, both to address the stability constraint on TD05's expandable capacity and to enable reclamation of the TD05 inventory under either case. TD06 is scheduled for commissioning by end of 2028 to take over fresh tailings from the Nchanga concentrators and barren leach residue from the existing Nchanga TLP (refer Section 15.9.2). A civil buttress program at TD05 (US$30M) extends its deposition life through the ramp-up years until TD06 is commissioned.
Additional processing infrastructure is required under the Full Resource Case only:
| · | TLP 2: a new tailings leach plant constructed and operated in parallel with the existing Nchanga TLP, designed with integrated Elevated Temperature Leach (ETL). TLP 2 is supported by the larger Mineral Resource base (including Inferred Resources) processed under the Full Resource Case, lifting combined tailings throughput from approximately 17 Mtpa to approximately 34 Mtpa, accelerating recovery of the TD05 inventory under the Full Resource Case and bringing forward associated revenue. The existing infrastructure could in principle process the full TD05 Resource over a longer period; the construction of TLP 2 under the Full Resource Case reflects an economic decision, supported by the larger Resource base, rather than a strict technical requirement. TLP 2 operates from Year 3 with TD05 reclamation fully exhausted by approximately FY2041/42 (refer Section 14.5). |
The total flowsheet is highly integrated due to material flows between each asset as shown in Figure 14.1.
| amcconsultants.com | 232 |
| S-K 1300 TRS: KCM Integrated Operations (Initial Assessment) | |
| Konkola Copper Mines Plc | 0424076 |
Figure 14.1 KCM total flowsheet
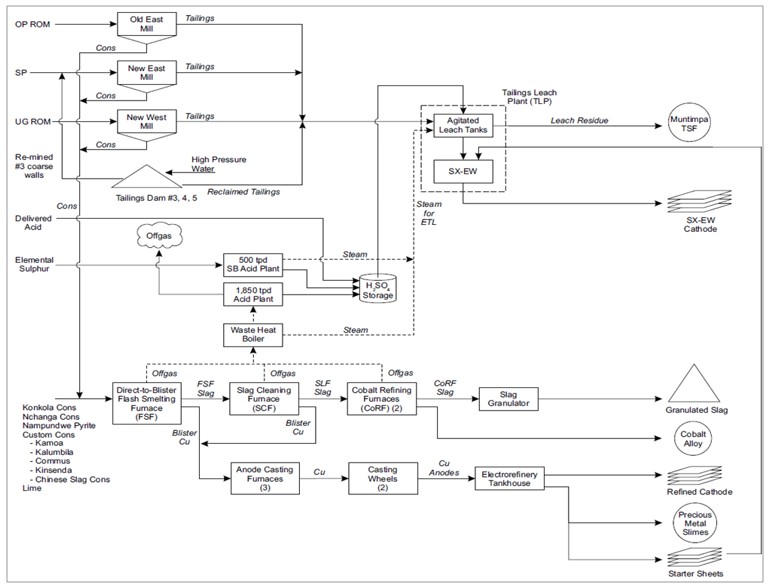
Source: KCM, 2026.
The overall processing philosophy is to treat sulfide ores where the valuable fraction is comprised mainly of chalcopyrite with 10% to 20% acid soluble copper minerals from the Konkola Mine and Nchanga Business Unit (open pit and underground operations) via conventional sulfide flotation to produce copper concentrates. Copper concentrates with copper grades exceeding 33% Cu are processed in the Nchanga flash smelter to produce copper anodes. Concentrates with lower grade copper content are produced by the Nchanga concentrators and are sold to third parties or may be blended with higher-grade concentrates for processing in the flash smelter. The smelter also produces cobalt alloy for sale from the Cobalt Refining Furnaces (see Figure 14.1).
Tails from the Nchanga concentrators at up to 16.7 Mtpa contain acid soluble copper and are processed in the Nchanga TLP. Reclaimed tails from historic TSFs are combined with the Nchanga concentrator tails to increase the available throughput to the Nchanga TLP. The Nchanga TLP is a sulfuric acid leaching plant that produces copper cathodes via solvent extraction and electrowinning.
Sulfuric acid for the Nchanga TLP and (under the Full Resource Case) TLP 2 is supplied by a sulfuric acid plant treating the flash smelter off-gas stream (1,850 tpd Acid Plant) and by a sulfur-burning acid plant (500 tpd SB Acid Plant). Under both the M&I Case and the Full Resource Case, total acid demand is anticipated to exceed internal smelter-derived supply, necessitating third-party acid purchases (refer Section 18 for the acid balance cost analysis). Smelter operation for acid production is a critical unit operation and a bottleneck where concentrate supplies are restricted. If insufficient acid is available for the Nchanga TLP, Nchanga concentrator operational throughput may be curtailed.
| amcconsultants.com | 233 |
| S-K 1300 TRS: KCM Integrated Operations (Initial Assessment) | |
| Konkola Copper Mines Plc | 0424076 |
The Nkana electrolytic refinery processes anodes from the Nchanga flash smelter and produces LME grade A copper cathodes, pure copper starter sheets for the Nchanga TLP electrowinning tank house, and slimes (residue from anode dissolution) containing precious metals for sale.
| 14.1 | Konkola concentrator |
The Konkola concentrator was designed as a nameplate 6.0 Mtpa throughput concentrator producing copper concentrate from an ore with copper sulfides and oxidised copper minerals.
| 14.1.1 | Konkola process description |
The flowsheet is shown in Figure 14.2.
Figure 14.2 Konkola concentrator flowsheet
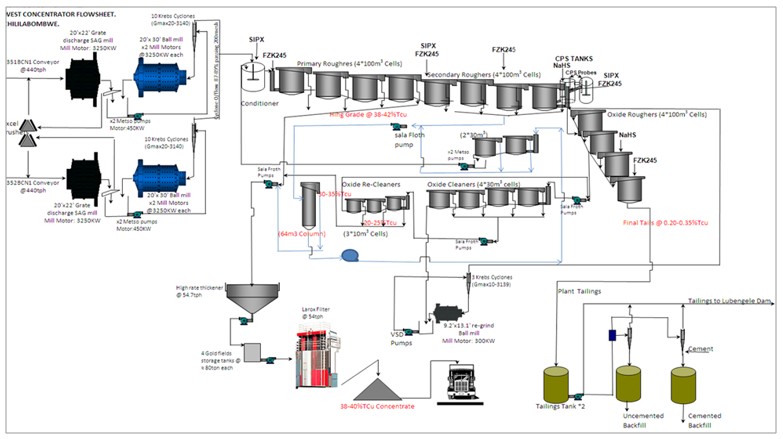
Source: KCM, 2025.
Ore is recovered from underground via shaft haulage and conveyed or trucked to the stockpile. The ore is stored on a 21,000-t live capacity stockpile before it is fed to either one of two comminution circuits. Each circuit consists of a SAG mill in series with a ball mill in closed circuit with a 10-cyclone hydro cyclone cluster. Both mills use trommel screens at discharge with undersize streams combined in the cyclone feed sump. The cyclone overflows are combined, lime is added for pH control – target 9 to 9.5 – and the total stream is fed to a common flotation circuit. Each comminution circuit has a capacity of 3 Mtpa. The combined cyclone overflow has a product size of 90-92% passing 75 µm (P90-92 of 75 µm).
The flotation circuit is a conventional design comprised of a conditioning tank, Primary and Secondary sulfide Rougher flotation banks, CPS circuit, Oxide Roughers, Oxide Cleaners, Oxide Re-cleaners, a Flotation Column for cleaning of secondary rougher sulfide concentrate, and Scavenger cells. The flotation circuit has a design capacity of 6 Mtpa. Cyclone overflow feeds a conditioning tank where collectors Sodium Iso Propyl Xanthate (SIPX) and Flex 31 (an enhanced Xanthate collector) are added. Frother is added to the feed well of the first flotation cell, the junction between rougher and scavenger. Rougher concentrate reports directly to the high rate concentrate thickener. Rougher flotation tails report to secondary roughers and further collector added. Secondary rougher concentrate reports to the column cleaner cell. Column concentrate is combined with primary rougher concentrate and reports to the high rate concentrate thickener.
| amcconsultants.com | 234 |
| S-K 1300 TRS: KCM Integrated Operations (Initial Assessment) | |
| Konkola Copper Mines Plc | 0424076 |
Secondary rougher tails report to the controlled potential sulfidation tank of the oxide flotation circuit. NaHS, additional collector and frother are added to the slurry and then pumped to the oxide rougher cells. Oxide rougher tails report to final tails. Oxide rougher concentrates are pumped to the oxide cleaner cells. Oxide cleaner concentrate is pumped to the oxide recleaner cells. Oxide recleaner concentrates are pumped to the concentrate high-rate thickener. Oxide recleaner tails are recirculated to the oxide cleaner cells. Oxide cleaner cell tails report to the oxide circuit regrind mill discharge sump. Mill discharge is pumped to a cyclone classifier with overflow directed to the head of the oxide rougher circuit. Cyclone underflow is reground in the regrind mill and reports to the mill discharge sump.
The column cleaner cell tail is pumped to two scavenger flotation cells. The scavenger concentrate is combined with the secondary sulfide rougher concentrate and pumped to the column cleaner cell. Tails from the oxide scavengers is recombined with the main flotation circuit feed in the primary conditioning tank.
Tailings are stored in tailings holding tanks where the tailings feed a backfill plant or are pumped to the Lubengele tailings dam.
| 14.1.1.1 | Historical performance |
Performance prior to the 2023 shutdown is shown in the figures below.
The concentrator operation has been characterised by ongoing under design capacity performance (Figure 14.3).
Figure 14.3 Konkola historical ore treatment
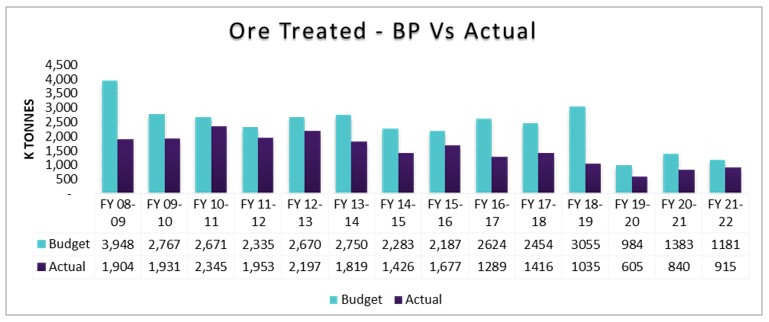
Source: AMC, 2025.
| 14.1.1.2 | Restart performance |
The concentrator recommenced operations in August 2024. Performance since the restart is shown in the figures below (Figure 14.4 to Figure 14.7).
| amcconsultants.com | 235 |
| S-K 1300 TRS: KCM Integrated Operations (Initial Assessment) | |
| Konkola Copper Mines Plc | 0424076 |
Figure 14.4 Konkola daily ore received since restart
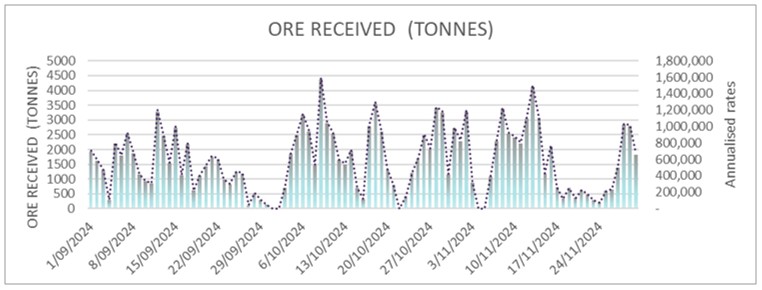
Source: AMC, 2025.
Figure 14.5 Konkola ore processed since restart
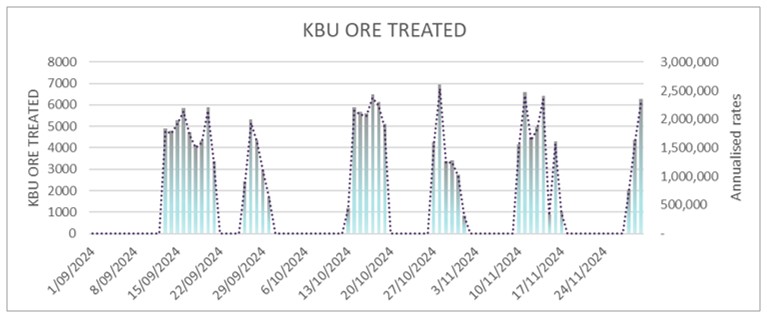
Source: AMC, 2025.
Figure 14.6 Konkola recoveries since restart
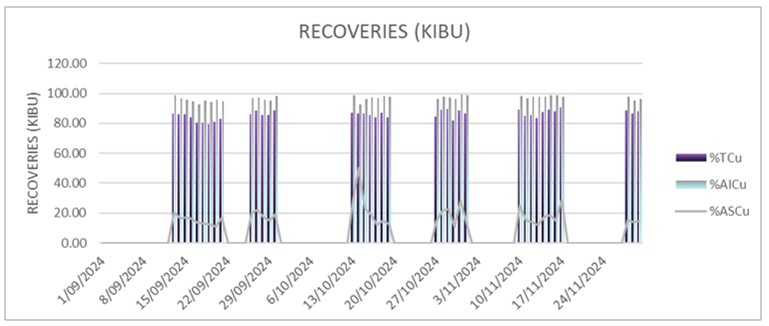
Source: AMC, 2025.
| amcconsultants.com | 236 |
| S-K 1300 TRS: KCM Integrated Operations (Initial Assessment) | |
| Konkola Copper Mines Plc | 0424076 |
Figure 14.7 Konkola concentrate produced since restart
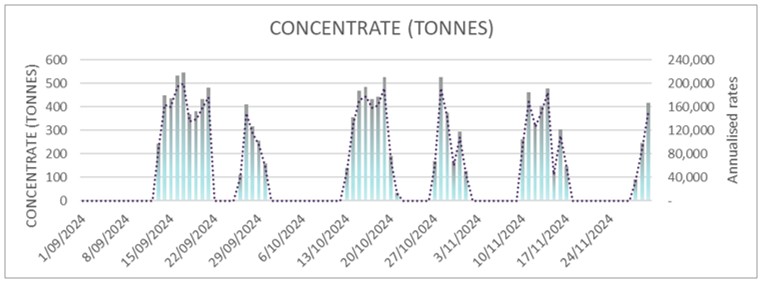
Source: AMC, 2025.
Since the recommencement of operations, the concentrator has operated in an on / off mode to accommodate low ore supply. Ore is stockpiled until sufficient ore is available to operate for approximately seven days at a nominal daily throughput of 5,000 to 6,000 tonnes or approximately 2/3rds of capacity. This enables the concentrator to operate at acceptable efficiency for those periods. Copper recoveries and concentrate grades were generally close to plan for the period. Concentrate production and grade, and copper production and recovery for the restart period and the FY25-26 plan are shown in Figure 14.8 and Figure 14.9 below.
Figure 14.8 Concentrate production and grade - Restart and FY25-26 plan
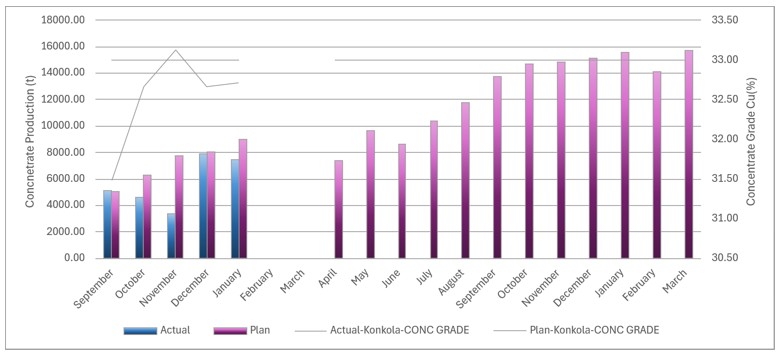
Source: AMC, 2026.
| amcconsultants.com | 237 |
| S-K 1300 TRS: KCM Integrated Operations (Initial Assessment) | |
| Konkola Copper Mines Plc | 0424076 |
Figure 14.9 Copper production and recoveries - Restart and FY25-26 plan
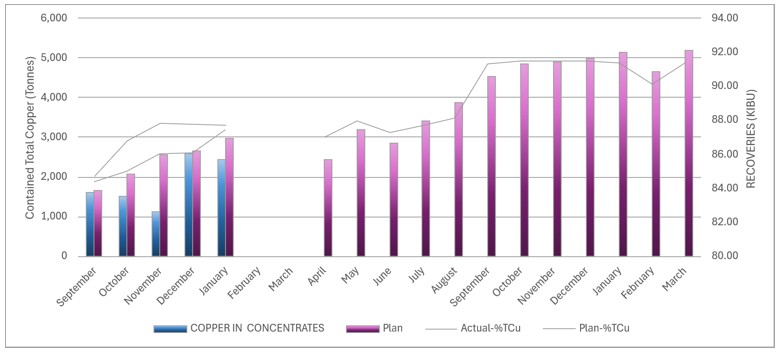
Source: AMC, 2026.
| 14.1.2 | Plant design and equipment |
Major items of equipment are outlined in Table 14.1.
Table 14.1 Konkola concentrator major equipment
| Item | Size | Number | ||
| SAG mill | 6.1 m x 6.7 m | 2 | ||
| Ball mill | 6.1 m x 9.1 m | 2 | ||
| Cyclone cluster | 10 x Krebs Gmax20 | 2 | ||
| Primary roughers | 100 m3 | 4 | ||
| Secondary roughers | 100 m3 | 4 | ||
| Oxide roughers | 100 m3 | 4 | ||
| Oxide cleaners | 30 m3 | 4 | ||
| Oxide recleaners | 10 m3 | 3 | ||
| Scavengers | 30 m3 | 2 | ||
| Column cleaner | 64 m3 | 1 | ||
| Regrind ball mill | 2.8 m x 4 m | 1 | ||
| Regrind cyclone cluster | 3 x Krebs Gmax10 | 1 | ||
| High rate thickener | 12 m | 1 | ||
| Pressure filter | 54 tph | 1 |
| 14.1.3 | Plant operations |
Current operating design criteria are given in Table 14.2, Table 14.3, and Table 14.4.
| amcconsultants.com | 238 |
| S-K 1300 TRS: KCM Integrated Operations (Initial Assessment) | |
| Konkola Copper Mines Plc | 0424076 |
Table 14.2 Capacity criteria
| Production capacity of plant | 6,000,000 dry MT/year (Nominal) | |
| Operating days / year | 330 | |
| Shifts / day | 2 | |
| Crushing | ||
| Effective working hours per shift | 8 | |
| Effective operating hours / year | 5,280 | |
| Average hourly throughput of the plant | 1,136.37 dry MTPH (Nominal) | |
| Average moisture | 5% | |
| Capacity of feeding system | 1,200 dry MTPH or 19,200 MT/DAY | |
| Design Capacity | 1,500 dry MTPH | |
| Dust emission from stack | within 150 mg/Nm3 | |
| Milling | ||
| Production of mined ore | 19,200 MT/DAY for two stream operation | |
| Operating hrs / day | 24 | |
| Shifts / day | 3 | |
| Moisture | 5% | |
| Mill availability | 95% | |
| Capacity of the Grinding system / stream | 380 DMTPH | |
| Capacity of the Grinding system / stream | 400 dry MTPH | |
| Design capacity (with 10% margin) / stream | 440 dry MTPH | |
| Stockpile live capacity | ||
| Minimum hour feed considered | 30 hours | |
| Capacity per hour (for both streams) | 842 MTPH | |
| Live capacity of the Stockpile | 25,260 MT | |
| Design live feed capacity of the Stockpile | 26,000 Tons | |
Table 14.3 Comminution criteria
| SAG Mill | Criteria | |
| Specific Gravity | 2.75 | |
| Bulk density | 1.6 t/m3 | |
| Feed moisture | 5% average | |
| Feed size | 80% < 150 mm, 100% < 250 mm | |
| Crusher Work Index | 18.8 KWH/T | |
| Rod mill work index | 12.1 KWH/T | |
| JK Drop parameters | Ta= 0.48, b=0.88, A=53.2, A*b= 46.8 | |
| Ball Mill | ||
| Specific Gravity | 2.75 | |
| Bulk density | 1.6 t/m3 | |
| Feed size | Approx. 80% < 2.8 mm | |
| Ball Mill work index | 13.8 KWH/T | |
| Product size | 85-88% < 74 microns |
| amcconsultants.com | 239 |
| S-K 1300 TRS: KCM Integrated Operations (Initial Assessment) | |
| Konkola Copper Mines Plc | 0424076 |
Table 14.4 Flotation criteria
| Flotation | Criteria | |
| Specific gravity of ore | 2.75 | |
| Bulk density | 1.59-1.62 t/m3 | |
| Total copper grade | 3.1-3.34% | |
| Acid soluble copper grade | 0.25-0.6% | |
| Acid insoluble copper grade | 2.5-2.99% | |
| Design recovery - total copper | 89% | |
| Design grade of recoverable copper | 40-41% | |
| Feed rate | 880 MTPH (dry) | |
| Solid concentration in feed slurry | 33/+2-1 % solids w/w | |
| Collector | SIPX at 5% v/v | |
| CPS reagent | NAHS at 2% v/v | |
| Frother | BETA at 85% v/v | |
| pH of feed slurry to flotation section | 7-8 | |
| Feed particle size | 85% (-) 74 microns | |
| Regrinding cyclone overflow particle size | 80% (-) 44 microns | |
| pH modifier | Milk of Lime at 4% v/v | |
| Froth factor | 3 minimum | |
| Process water pH | Neutral pH | |
| Sulfide rougher pH | 10 – 10.5 | |
| Dosage SIPX | 48-50 g/t ore | |
| Dosage Beta Froth | 72-75 g/t ore | |
| Dosage NAHS | 130-135 g/t ore | |
| Dosage Lime | 50 g/t ore |
| 14.1.4 | Konkola LOMP production schedule |
The LOMP Konkola concentrator production schedule is shown in Figure 14.10 based on planned ore receipts from the Konkola mine.
Figure 14.10 Konkola LOM ore feed
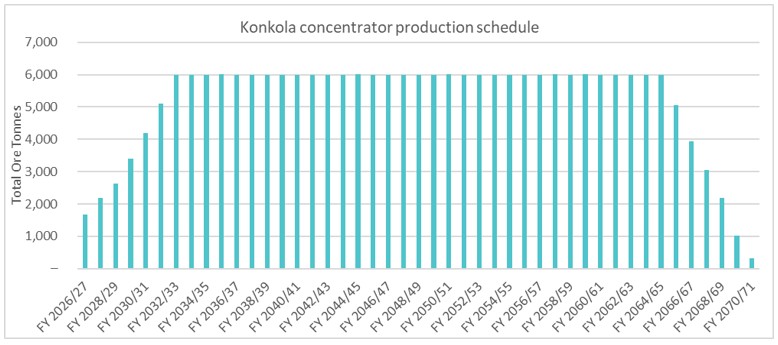
Source: AMC, 2026.
| amcconsultants.com | 240 |
| S-K 1300 TRS: KCM Integrated Operations (Initial Assessment) | |
| Konkola Copper Mines Plc | 0424076 |
Concentrate produced by the concentrator is transported by road to the Nchanga smelter. The main assumptions for the LOMP are shown in Table 14.5.
Table 14.5 Konkola concentrator key assumptions
| Parameter | Unit | Value | ||
| Total Cu recovery | % | TCu rec = -95.824*(ASCu/TCu) + 99.146 | ||
| Acid soluble Cu recovery | % | 35 | ||
| Cu concentrate grade | % | 33 |
Annual concentrate production is shown in Figure 14.11.
Figure 14.11 Konkola concentrate production
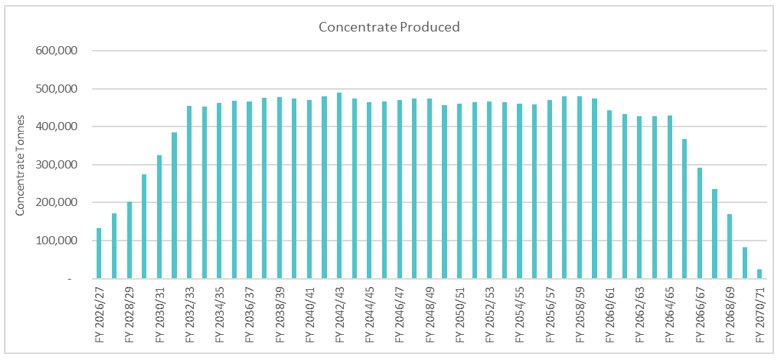
Source: AMC, 2026.
Total copper metal in concentrate is shown in Figure 14.12.
Figure 14.12 Total copper metal in Konkola concentrate
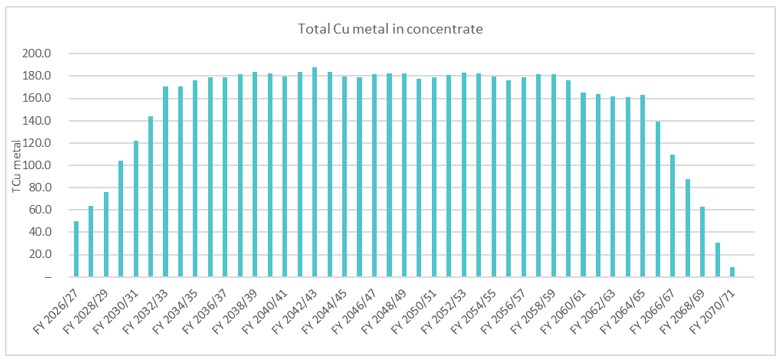
Source: AMC, 2026.
| amcconsultants.com | 241 |
| S-K 1300 TRS: KCM Integrated Operations (Initial Assessment) | |
| Konkola Copper Mines Plc | 0424076 |
| 14.2 | Nchanga concentrators |
The Nchanga concentrator group consists of three concentrators treating ore from underground, open pits, and reclaimed from stockpiles. The material flows are shown in Figure 14.13.
Figure 14.13 Nchanga business unit material flows
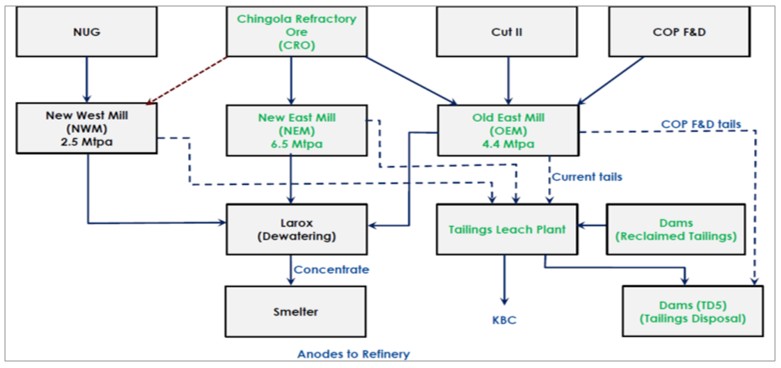
Source: KCM, 2025.
Capacities of the concentrators are given in Table 14.6.
Table 14.6 Nchanga concentrator capacities
| Concentrator | Capacity | Ore feed | ||
| Old East Mill | 4.4 | Cut II / CRO / COP | ||
| New East Mill | 6.5 | CRO | ||
| New West Mill | 2.5 | NUG |
| 14.2.1 | Historical performance |
Historical performance from 2015 to 2023 is shown in Figure 14.14, Figure 14.15, and Figure 14.16 below. The concentrators rarely achieved planned ore throughputs primarily due to mining constraints.
Figure 14.14 Old East Mill historical actual vs budget ore milled (t)
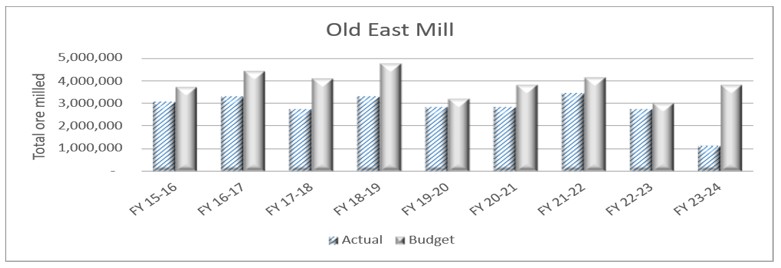
Source: AMC, 2025.
| amcconsultants.com | 242 |
| S-K 1300 TRS: KCM Integrated Operations (Initial Assessment) | |
| Konkola Copper Mines Plc | 0424076 |
Figure 14.15 New East Mill historical actual vs budget ore milled (t)
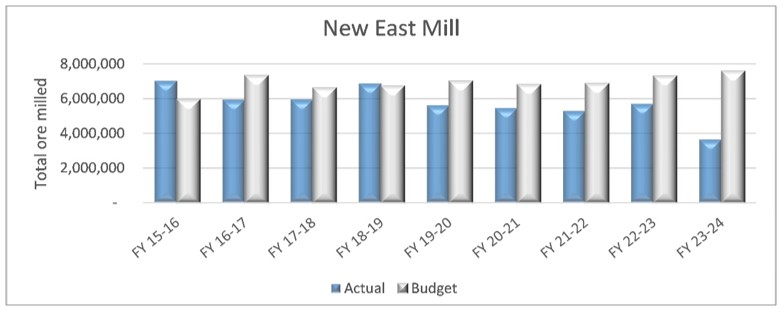
Source: AMC, 2025.
Figure 14.16 New West Mill historical actual vs budget ore milled (t)
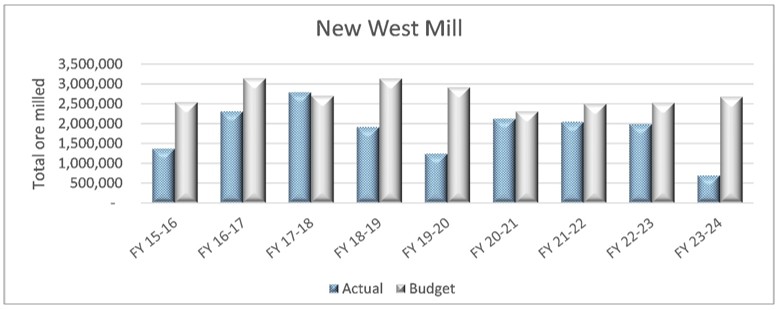
Source: AMC, 2025.
Concentrate production and grades are also shown in Figure 14.17, Figure 14.18, and Figure 14.19. The ore feed to these concentrators has generally been low copper grades with high proportions of acid soluble copper minerals. Flotation recoveries consequently were poor and final copper grades in concentrates were generally very low and unsuitable as feeds to the smelter. A lower limit of approximately 20% Cu has been applied to concentrates to be blended with higher-grade concentrates to meet the copper grade feed specifications of the smelter.
| amcconsultants.com | 243 |
| S-K 1300 TRS: KCM Integrated Operations (Initial Assessment) | |
| Konkola Copper Mines Plc | 0424076 |
Figure 14.17 Old East Mill concentrate tonnes and grades
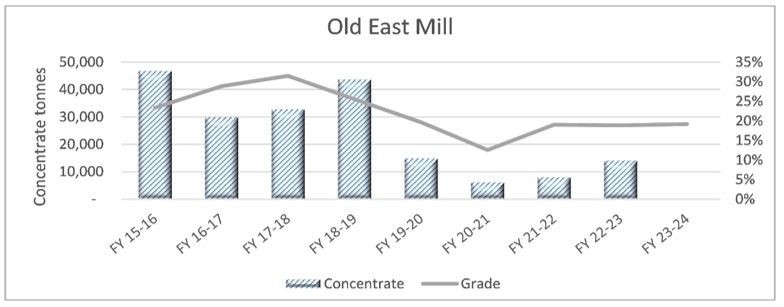
Source: AMC, 2025.
Figure 14.18 New East Mill concentrate tonnes and grades
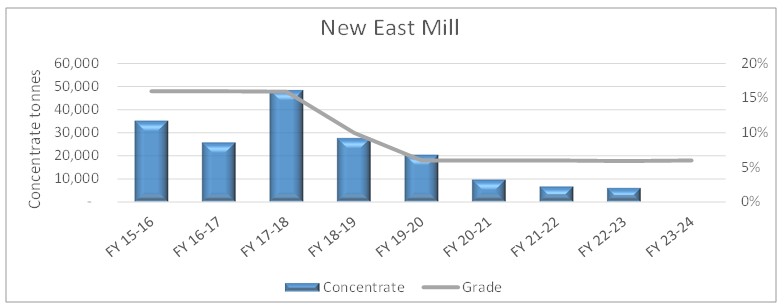
Source: AMC, 2025.
Figure 14.19 New West Mill concentrate tonnes and grades
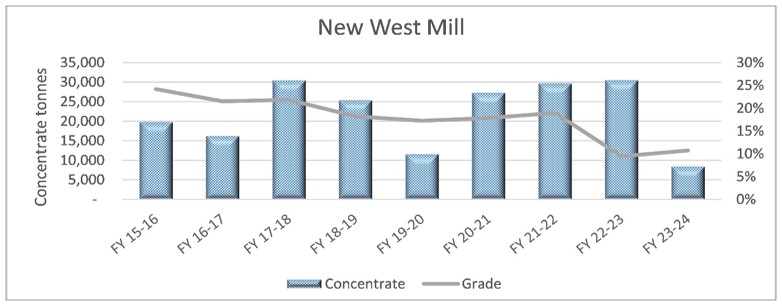
Source: AMC, 2025.
| amcconsultants.com | 244 |
| S-K 1300 TRS: KCM Integrated Operations (Initial Assessment) | |
| Konkola Copper Mines Plc | 0424076 |
| 14.2.2 | Nchanga LOM production |
The LOM production schedule for Nchanga is shown in Figure 14.20, Figure 14.21, and Figure 14.22. The schedule depletes Mineral Resources by 2037 / 2038. All three concentrators are in production for the period but are all underutilised with utilisations between 25 and 50% each. Efficiencies could be captured by consolidating feeds to two or even a single concentrator.
Figure 14.20 Total LOM ore feed to the Nchanga concentrators
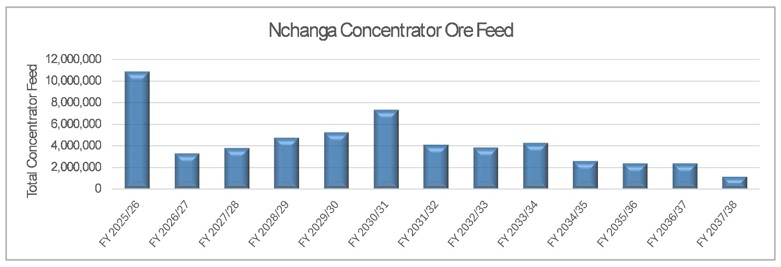
Source: AMC, 2025.
Figure 14.21 Nchanga LOM high-grade concentrate production and grade
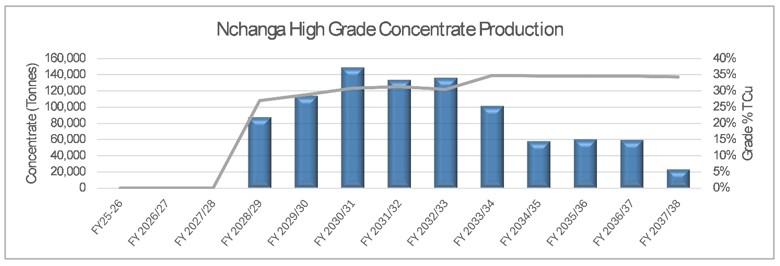
Source: AMC, 2025.
Figure 14.22 Nchanga LOM low-grade concentrate production and grade
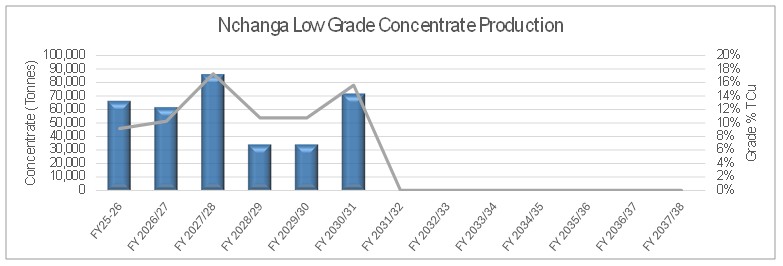
Source: AMC, 2025.
| amcconsultants.com | 245 |
| S-K 1300 TRS: KCM Integrated Operations (Initial Assessment) | |
| Konkola Copper Mines Plc | 0424076 |
The high-grade concentrate is derived from higher-grade satellite underground deposits and assumes lower recoveries with the maintenance of higher copper grades in the concentrates. This material is assumed suitable as a smelter feed. Low-grade concentrates are derived from lower grade refractory ores.
| 14.3 | Nchanga TLP |
The Nchanga TLP processes low-grade oxide tailings from the Nchanga concentrators (Old East Mill, New East Mill, New West Mill) and the Tailings Dam (TD03 and TD04).
The key operations are:
| · | Sulfuric Acid Leaching: Dissolves acid-soluble copper from tailings (~0.35% Cu feed grade). |
| · | SX: Extracts copper from solution and concentrates it for EW. |
| · | EW: Produces Grade A LME copper cathode. |
The Nchanga TLP flowsheet is given in Figure 14.23.
Figure 14.23 Nchanga TLP flowsheet
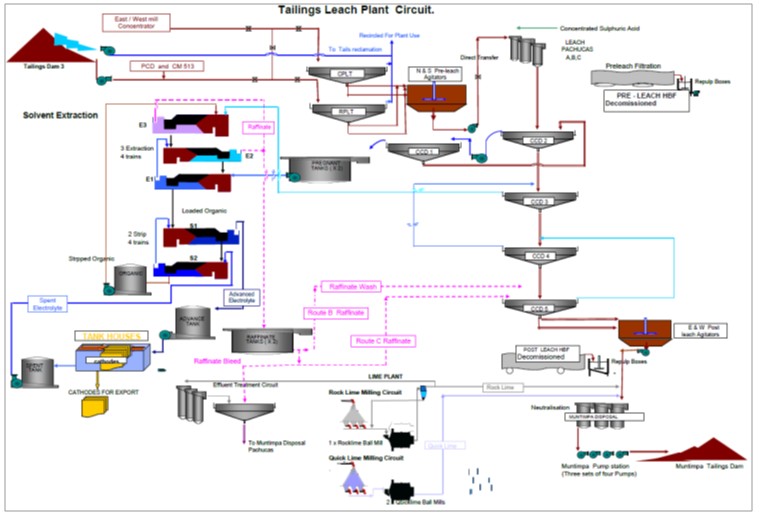
Source: KCM, 2025.
The tailings streams from the Nchanga concentrators are combined and pumped to a pre-leach thickener (PLT) at up to 13.4 Mtpa. Hydraulically remined tailings from tailings dams TD03 and TD04 are combined and pumped to a second pre-leach thickener. Process water recovered from the PLTs is reused in tails reclamation and for general plant use. Thickened underflows from the PLTs are pumped to two pre-leach agitated tanks and then pumped directly to 4 leach pachucas (air agitated reaction tanks) – 3 operating, 1 standby. Concentrated sulfuric acid is added to the pachuca feed. Residence time in the pachucas is approximately two hours. Acidified and leached slurry is pumped to a counter current decantation train (CCD). Slurry enters at CCD2. The overflow consisting of pregnant copper containing leach solution (PLS) is pumped to CCD1 for further clarification before the clarified overflow is pumped to 2 pregnant liquor tanks. Underflow from CCD1 is returned to CCD2 to minimise solution losses. Underflow from CCD2 feeds CCD3 and subsequently CCD4 and 5. Overflow from CCD3 is pumped to the solvent extraction circuit. Overflows from CCD4 and CCD5 are returned to the previous CCD.
| amcconsultants.com | 246 |
| S-K 1300 TRS: KCM Integrated Operations (Initial Assessment) | |
| Konkola Copper Mines Plc | 0424076 |
The now barren underflow from CCD5 is pumped to a neutralisation circuit where lime is added to neutralise acid and increase the pH to ~7. The neutralised product is pumped to the Muntimpa tailings dam.
The SX circuit consists of four trains each comprised of three extraction stages and two stripping stages. The PLS from the holding tanks is pumped to the SX circuit where it is mixed with a copper complexing reagent (lixiviant) in kerosene to remove the copper from the acidic aqueous PLS. The loaded organic phase now containing the copper is pumped to the stripping circuit where it contacts spent electrolyte from the tank house and the copper is redissolved in the aqueous electrolyte. The now high copper solution (advanced electrolyte) is pumped to the tank house for electrowinning of the copper onto cathodes. The solid copper cathodes are bundled for sale and export. The barren aqueous phase from the extraction circuit (raffinate) is collected and neutralised in the effluent treatment circuit for disposal.
| 14.3.1 | Historical performance |
The performance of the Nchanga TLP prior to 2023 is shown in Figure 14.24.
Figure 14.24 Historical Nchanga TLP throughput
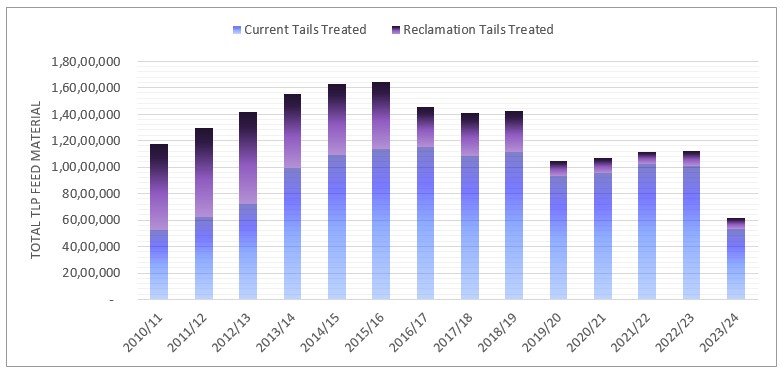
Source: AMC, 2025.
| amcconsultants.com | 247 |
| S-K 1300 TRS: KCM Integrated Operations (Initial Assessment) | |
| Konkola Copper Mines Plc | 0424076 |
The recovery performance is in Figure 14.25.
Figure 14.25 Nchanga TLP historical recoveries
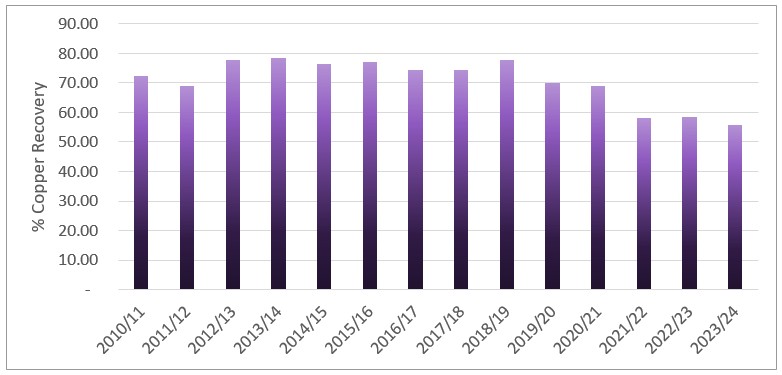
Source: AMC, 2025.
Recovery performance was reduced in the four-year period from 2020 to 2024 due to operating and financial constraints. Maintenance, manpower, working capital reductions combined to impact availability and utilisation.
Historically the Nchanga TLP had highest annual throughput in 2015 / 2016 (Table 14.7).
Table 14.7 Nchanga TLP highest annual performance
| Item | Value | |||
| Annual Nchanga concentrator tailings (Mt) | 11.4 | |||
| Annual tailings reclaim (Mt) | 5.0 | |||
| Weighted average ASCu % | 0.44 | |||
| Copper recovery (%) | 77 | |||
| Copper produced (t/d) | 151 | |||
AMC estimates the following copper production is achievable (Table 14.8). The reduced recovery for future processing through the Nchanga TLP relates to the reduced expected ASCu% grade to be fed through the plant.
Table 14.8 Copper production estimate
| Item | Value | |||
| Existing TLP Plant capacity (tpd) | 50,800 | |||
| Weighted average ASCu (%) | 0.35 | |||
| Existing TLP ASCu Copper recovery (%) | 74.8 | |||
| Existing TLP Total Copper recovery (%) | 48.5 | |||
| Existing TLP with ETL Copper Recovery (%) | 59.3 | |||
| TLP 2 Total Copper recovery (%) | 73.9 | |||
| Operational availability (%) | 90 | |||
| Existing TLP Operational capacity (tpd) | 45,750 | |||
| TLP 2 Operational capacity (tpd) | 48,150 | |||
| Combined operational capacity | 93,900 | |||
| Combined Copper production (t/d) | 380 | |||
| amcconsultants.com | 248 |
| S-K 1300 TRS: KCM Integrated Operations (Initial Assessment) | |
| Konkola Copper Mines Plc | 0424076 |
| 14.3.2 | Restart performance |
The Nchanga TLP recommenced operations in August 2024. Overall recovery performance, to January 2025, is shown in Figure 14.26.
Figure 14.26 Nchanga TLP copper recovery since restart
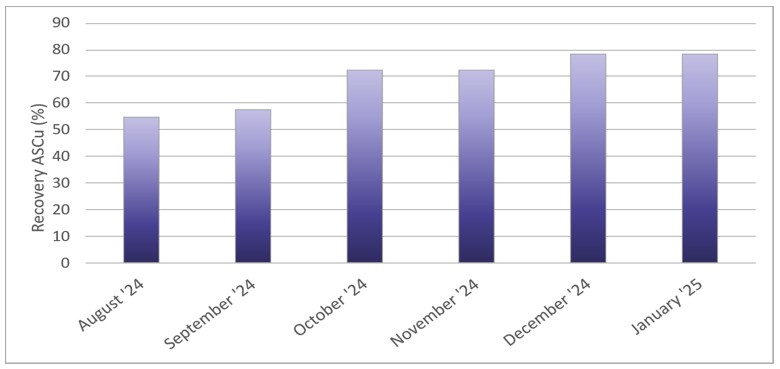
Source: AMC, 2025.
The throughput since the restart is shown below in Figure 14.27.
Figure 14.27 Nchanga TLP throughput since restart
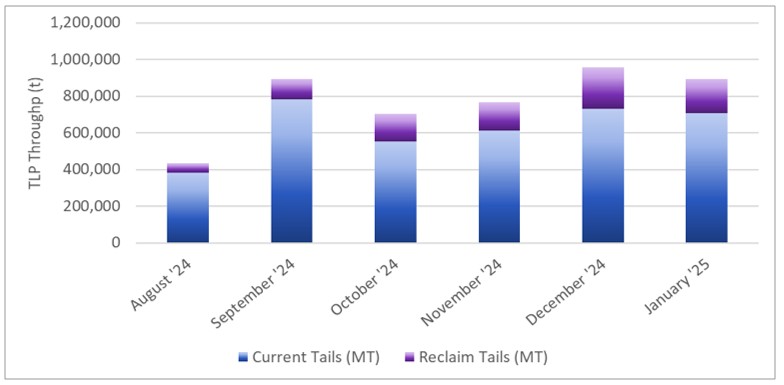
Source: AMC, 2025.
| amcconsultants.com | 249 |
| S-K 1300 TRS: KCM Integrated Operations (Initial Assessment) | |
| Konkola Copper Mines Plc | 0424076 |
| 14.3.2.1 | Plant design and equipment |
Nchanga TLP major unit processes are in Table 14.9.
Table 14.9 Nchanga TLP major unit processes
| Equipment | Capacity / size | Units | ||
| Pre-leach thickeners | >25,000 tpd | 2 | ||
| Pachuca leach | ~4,000 tph at 2-hour residence | 4 | ||
| Counter current decant | ~2,500 tph/unit | 5 | ||
| Neutralisation circuit | ~2,500 tph | 1 | ||
| Solvent Extraction and stripping | ~2,100 m3/hr | 4 | ||
| Tank house - EW | 280 tpd Cu | 1 | ||
| Neutralisation circuit | 1 |
| 14.3.2.2 | Combined TLP and TLP 2 production schedule |
The combined feed schedule for the existing Nchanga TLP and the proposed TLP 2 facility is shown in Figure 14.28. Combined throughput ramps from approximately 13 Mt in FY2026/27 to a steady-state level of approximately 34 Mtpa from FY2029/30, sustained through to FY2041/42 as TD05 reclamation runs in parallel with continuous Nchanga concentrator tails processing and the late-life completion of TD03 and TD04 reclamation.
Under the M&I Case, the existing Nchanga TLP (with ETL retrofit) operates without TLP 2, processing approximately 16–17 Mtpa of combined TD03/TD04/TD05 reclamation feed and Nchanga concentrator tails over the 15-year M&I Case mine life. Cathode production averages approximately 49 ktpa under the M&I Case, with blended TCu recovery of approximately 56.7% reflecting ETL operation on the existing TLP only.
Figure 14.28 Combined Nchanga TLP and TLP 2 LOMP feed schedule
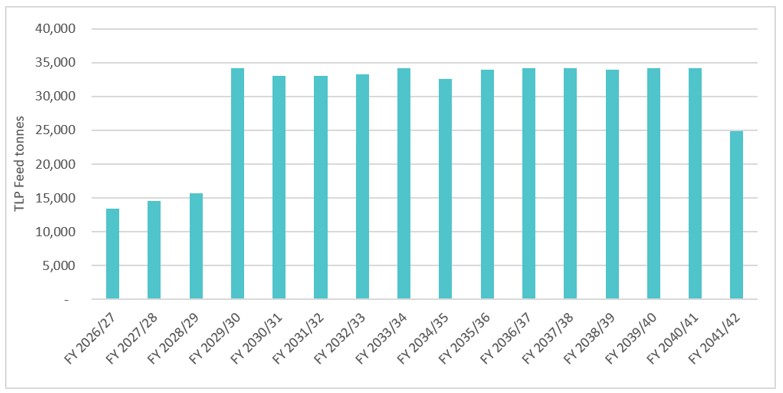
Source: AMC, 2026.
The LOMP production schedule is outlined in Figure 14.28 below. Copper production and copper recovery are shown in Figure 14.29.
| amcconsultants.com | 250 |
| S-K 1300 TRS: KCM Integrated Operations (Initial Assessment) | |
| Konkola Copper Mines Plc | 0424076 |
Combined cathode copper production and total copper recovery are shown in Figure 14.29. Cathode production ramps from approximately 46 kt in FY2026/27 to a peak of approximately 138 kt in FY2029/30, with total copper recovery improving from approximately 53% to approximately 69% over the same period as the elevated temperature leach (ETL) upgrade is implemented to the existing TLP (refer Section 14.3) and the high efficiency TLP 2 plant is commissioned. Cathode production averages approxamitely125 ktpa following the commissioning of TLP 2.
Figure 14.29 Combined Nchanga TLP and TLP 2 LOMP cathode production and total copper recovery
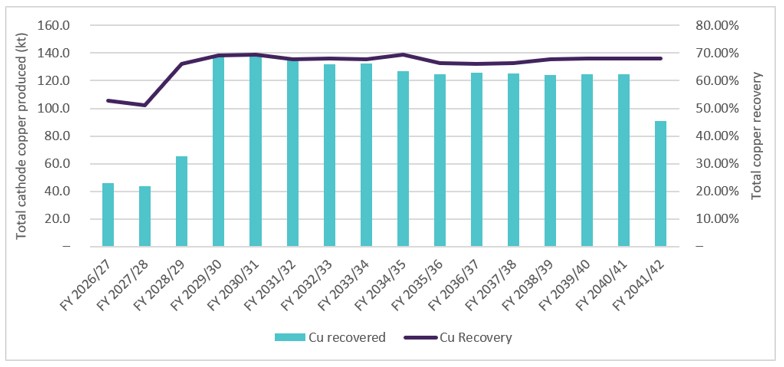
Source: AMC, 2026.
The combined steady-state throughput of approximately 34 Mtpa exceeds the existing Nchanga TLP nameplate capacity (~17 Mtpa); TLP 2 is therefore required to operate in parallel with the existing TLP rather than as an expansion, in order to accommodate the additional TD05 reclamation feed alongside continuous Nchanga concentrator tails processing.
| 14.4 | Nchanga smelter |
Figure 14.30 shows a basic block flow diagram of the smelter and the design values for internal flow parameters. Table 14.10 shows basic design production parameters for the smelter. Key assumptions used are as follows:
| · | Concentrate throughput of 850 ktpa results from feed rate of 112.5 tph and overall time utilisation of 86.1%. |
| · | Cu production of 311.86 ktpa results from feed Cu content of 37.6% and Cu recovery of 97.7%. |
| · | Strong acid production of 1,850 tpd results from sulfur (S) conversion of 2.9 (~95%). |
| amcconsultants.com | 251 |
| S-K 1300 TRS: KCM Integrated Operations (Initial Assessment) | |
| Konkola Copper Mines Plc | 0424076 |
Figure 14.30 Nchanga smelter block flow diagram – design rates shown
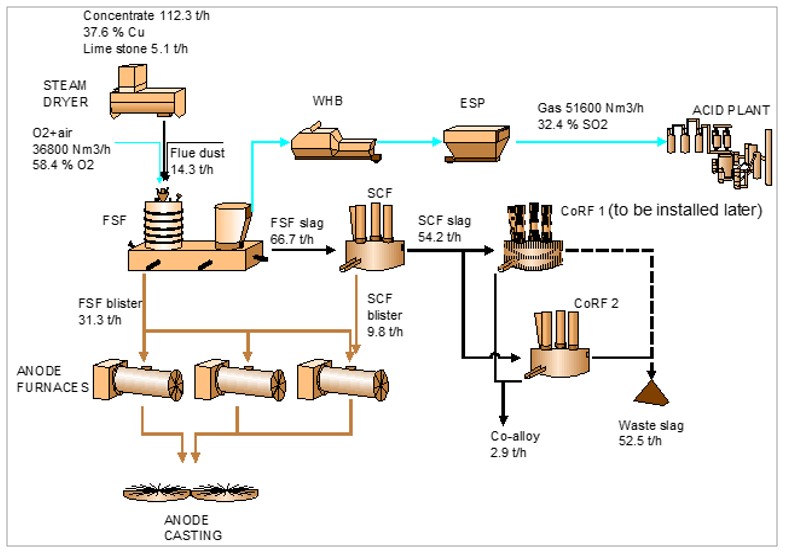
Source: KCM, 2025.
Table 14.10 Nchanga smelter – basic design production parameters
| No. | Parameter | Units | Design value | |||||
| 1 | Feed rate | t/h | 112.5 | |||||
| 2 | Feed rate | kt/a (annum) | 850 | |||||
| 3 | Copper production | t Cu/a | 311,860 | |||||
| 4 | Strong acid production | t/day | 1,850 | |||||
| 5 | Cobalt Alloy | t/hr | 2.9 | |||||
| amcconsultants.com | 252 |
| S-K 1300 TRS: KCM Integrated Operations (Initial Assessment) | |
| Konkola Copper Mines Plc | 0424076 |
| 14.4.1 | Recent smelter performance |
The smelter completed a major shutdown (40 days duration) in 2016 when required repairs to the Flash Smelting Furnace (FSF) and slag cleaning furnace (SCF) were completed. In addition, major repairs to other in line, critical units, such as the waste heat boiler (WHB) and electrostatic precipitator (ESP) were completed. Table 14.11 shows smelter performance from FY2017 to FY2023.
Table 14.11 Nchanga smelter – historical production
| 2017/18 | 2018/19 | 2019/20 | 2020/21 | 2021/22 | 2022/23 YTD | | |||||||||||||||||||
| Particulars | Budget | Actual | Budget | Actual | Budget | Actual | Budget | Actual | ||||||||||||||||
| Cu-recovery | 98.70% | 98.78% | 98.70% | 98.8% | 98.646 | 97.838 | 98.70% | 98.50% | 98.70% | 98.47% | 98.70% | 98.23% | ||||||||||||
| Avg. Dry Cone Feed rate - FSF T/Hr | 93.83 | 69.98 | 105.25 | 67.293 | 86.625 | 63.222 | 75.42 | 67.46 | 67.08 | 65.73 | 65.00 | 66.40 | ||||||||||||
| Dry Concentrate feed (without Lime) | 693541 | 503741 | 781747 | 436268 | 569185 | 276399 | 569080 | 447115 | 447818 | 389361 | 223900 | 148561 | ||||||||||||
| Lime Requirement | 36502 | 25696 | 32573 | 12931 | 29957 | 11123 | 28454 | 17335 | 25846 | 15613 | 11784 | 5778 | ||||||||||||
| Avg Dry Cone Cu-Grade | 32.63% | 29.47% | 29.96% | 29% | 27% | 29% | 31.16% | 33.49% | 28.83% | 32.97% | 31.53% | 31.41% | ||||||||||||
| Gross Anodes Production | 210482 | 138066 | 207618 | 113274 | 139018 | 75550 | 153672 | 133752 | 140269 | 118208 | 63853 | 39023 | ||||||||||||
| Secondary Anode Production | 3300 | 6437 | 3600 | 5628 | 3600 | 4720 | 3600 | 3432 | 3300 | 2920 | 1500 | 1704 | ||||||||||||
| Primary Production (Including Cu in alloy & Chunks) | 236780 | 155842 | 240021 | 129235 | 159315 | 82926 | 175361 | 149005 | 161140 | 136090 | 73357 | 44963 | ||||||||||||
| Primary Anodes | 207182 | 131629 | 204018 | 107646 | 135418 | 70830 | 149057 | 130320 | 136969 | 115289 | 62353 | 37319 | ||||||||||||
| Cobalt Alloy Generation | 42534 | 31124 | 51972 | 28241 | 35047 | 13541 | 30705 | 21295 | 31297 | 21193 | 14935 | 8500 | ||||||||||||
| Cu in Cobalt Alloy | 29597 | 23028 | 36003 | 20001 | 23897 | 10409 | 26304 | 17219 | 24171 | 18517 | 11004 | 7140 | ||||||||||||
| Co in Cobalt Alloy | 1718 | 916 | 2082 | 802 | 747 | 325 | 689 | 280 | 652 | 206 | 209 | 96 | ||||||||||||
| Cu in Alloy/Primary Cu | 13% | 15% | 15% | 15% | 15% | 13% | 15% | 12% | 0.15% | 0.14% | 0.15% | 0.16% | ||||||||||||
| Cu in Alloy/Total Alloy | 70% | 74% | 69% | 71% | 68% | 77% | 86% | 81% | 77% | 87% | 74% | 84% | ||||||||||||
In April 2024, the FSF was forced to execute an emergency shutdown, permitting the contents of the furnace to freeze without drainage, leaving 70 cm of blister and 20 cm of slag in the hearth. Following cooling, the top slag layer was manually dug out. The smelter recommenced operations in October 2024 and an estimated 960 t of blister copper were melted out of the FSF during the restart sequence. The start-up was well managed, and no boiler leaks or other collateral damage were incurred.
The smelter is now operating steadily at 60-75 tph dry feed (see Table 14.12). Hearth temperatures remain a concern. Localised elevated readings on under-hearth thermocouples under the reaction shaft are likely indicative of diminished refractory lining in the area and the risk of a burn-through and liquid runout exists. Increased heat extraction fan capacity has been deployed beneath the furnace and thermocouple temperatures are being monitored continually. Operators intend to limit feed rate to the current range until the major shutdown in October 2025. The smelter processed 406.2 kt through Dec YTD which is an annualised run rate of 542 ktpa. Average Dec YTD feed rate was 72 tph. However, the smelter remains concentrate constrained and has been forced to take unplanned stoppages due to inability to assemble an appropriate concentrate feed blend while operating at 75 tph. Operators intend to continue with a feed rate set point of 70-75 tph as this rate generates a more pyrometallurgically stable environment in the FSF than when operating at 60-65 tph.
A feed rate of 102 tph has been demonstrated (FY11/12) and KCM operators express confidence that the design feed rate of 112.3 tph can be safely maintained subject to appropriate concentrates being available to present a feed blend that is within the thermodynamic operating envelope of the FSF. On-line time for the FSF (which determines the production rate of the smelter together with the concentrate feed rate) is planned to use the following downtime factors:
| · | 45 days every five years - Major rebuilds of furnaces, acid plant, oxygen plant. |
| · | 2 days per month - repairs requiring feed being off. |
| · | 30 minutes per day - time allotted for minor repairs requiring feed to be off. |
| · | This schedule results in an overall time utilisation of 89.2% which is reasonable and in line with similar smelter installations. |
| amcconsultants.com | 253 |
| S-K 1300 TRS: KCM Integrated Operations (Initial Assessment) | |
| Konkola Copper Mines Plc | 0424076 |
Figure 14.31 shows the major sources of smelter downtime in the last three years. All of the unplanned downtime events shown are preventable:
| · | Low feed stock - Inability to source sufficient feed concentrates has been the largest contributor over the last two years. The Konkola mine has not been able to supply concentrate to plan and KCM has not been able to locally source appropriate replacement concentrate of appropriate metallurgical quality at acceptable commercial terms. The effects of this item can be expected to decrease as output from the Konkola mine increases. |
| · | Significant downtime has also been recorded to repair waste heat recovery boiler (WHRB) leaks and for routine clearing of WHRB throat leaks. Throat build-up and WHRB leaks are accentuated by slow running (low feed rate) and erratic running (stop-start operation of the FSF). Steady operation at feed rates inside the designed range can be expected to decrease the effects of these items. |
Figure 14.31 Smelter downtime - FY22, FY23, FY24
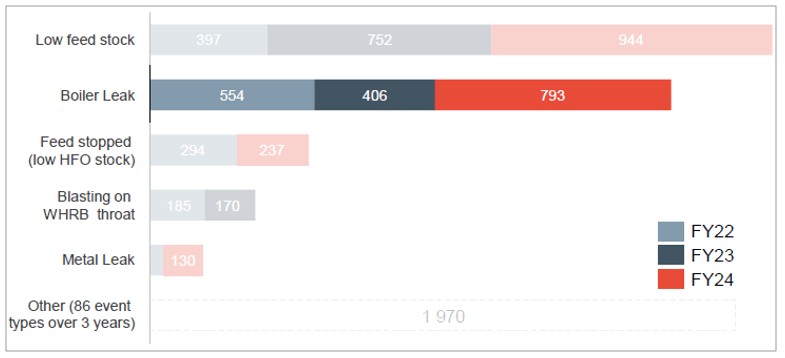
Source: AMC, 2025.
Copper recoveries averaged 97.27% in October which is ~1% below plan, however discard slag assays are now between 0.2% and 0.3% which will result in recoveries increasing to the planned level of 98.4%.
| amcconsultants.com | 254 |
| S-K 1300 TRS: KCM Integrated Operations (Initial Assessment) | |
| Konkola Copper Mines Plc | 0424076 |
Table 14.12 Nchanga smelter production – October 2024
Smelter October performance and November Plan
| September | October, 2024 | November | |||||||||||
| 2024 | Description | MTD as at October 31t | 2024 | ||||||||||
| Plan | Actual | Input metrics | Plan | Actual | Var | Projection | |||||||
| 0 | 0 | Operating hours hrs. | 589 | 496 | -92 | 589 | |||||||
| 0 | 0 | Total Concentrates Fed | 36,200 | 30,662 | -5,538 | 37,342 | |||||||
| 0 | 0 | Primary Cu Input | 10,496 | 7649.61 | -2,846 | 10,446 | |||||||
| 0 | 0 | Avg. Dry Feed rate - FSF t/h | 62 | 61 | -1 | 62 | |||||||
| 0.00% | 0.00% | Avg Dry Cone Cu-Grade | 28.99% | 24.95% | -4.05% | 27.98% | |||||||
| 0.00% | 0.00% | Avg Dry Cone S-Grade | 17.84% | 18.27% | 0.43% | 18.18% | |||||||
| Efficiency metrics | |||||||||||||
| 0.00% | 0.00% | Cu-recovery - Operational | 98.40% | 97.27% | -1.13% | 98.40% | |||||||
| 0.00% | 0.00% | Co-recovery | 60.00% | 60.02% | 0.02% | 60.00% | |||||||
| 0.00% | 0.00% | Cu in Alloy/Total Alloy | 75.00% | 80.46% | 5.46% | 85.48% | |||||||
| Output metrics | |||||||||||||
| 0 | 76 | Primary Production Mt | 10,328 | 6,981 | -3,348 | 10,279 | |||||||
| 0 | 76 | Primary Anodes Mt | 8,779 | 5,615 | -3,164 | 8,737 | |||||||
| 0 | 0 | Sulphuric Acid Prod Mt | 17,590 | 13,411 | -4,179 | 18,485 | |||||||
| 0 | 0 | Sulphuric Acid Prod Mt 500TPD | 0 | 0 | 0 | 0 | |||||||
Source: KCM, 2025.
Regardless of the availability of KCM concentrate, particularly Konkola high-grade concentrate, the smelter must run due to the tightly integrated flowsheet of the overall KCM operation. Starter sheets for the conventional-style, Nchanga TLP EW are manufactured by the Nkana Refinery using stripper anodes produced by the Nchanga Smelter. Sulfuric acid produced from smelter off gas and from the 500 tpd sulfur-burning acid plant is essential for low-cost operation of the Nchanga TLP.
The smelter is now running at 65-75 tph. Although operation at the minimum, technically feasible, feed rate of 60-65 tph of dry concentrate feed is practical and has the advantage of conserving concentrate stocks and minimising the need for repeated shutdowns due to the shortage of concentrate, the FSF is thermodynamically more stable at 70-75 tph and the overall risk profile of the integrated complex is lowered.
| 14.4.2 | Smelter condition |
Following the unplanned shutdown of the Smelter in 2024, Hatch Limited (Hatch), a global multidisciplinary management, engineering and development company conducted a detailed assessment of the KCM concentrators, the Nchanga TLP, the Smelter and the Refinery. Hatch’s remit was to assess process condition and readiness for re-start and to formulate a ramp-up plan and to identify risks to stable continued operation. Hatch delivered their final report in July 2024.
The Smelter successfully restarted in September 2024. The FSF is now due for a campaign rebuild including a full relining of the FSF including the hearth, having run since 2016 on the current hearth lining. The hearth brick was installed in 2008 and has lasted well. A major shutdown is planned for 45 days and is scheduled to begin in April 2026. KCM has drawn on the detailed condition assessments conducted by Hatch to develop the repair / rebuild program to be undertaken in conjunction with the relining of the FSF, SCF, and two cobalt refining furnaces (CoRFs).
| amcconsultants.com | 255 |
| S-K 1300 TRS: KCM Integrated Operations (Initial Assessment) | |
| Konkola Copper Mines Plc | 0424076 |
Capital expenditure allocated for the campaign rebuild is US$32.8M - US$10.0M in FY24/25 for advance purchase of long lead items such as specialty furnace refractories and bespoke water-cooled copper furnace cooling elements and $23.0M for replacement equipment, specialty contractors and consumables to be spent in FY25/26. Table 14.13 shows a breakdown of capital expenditure by smelter section. The scope of the rebuild has been thoroughly developed by Hatch and KCM operators and engineers. This work was aided by the extended, unplanned downtime in 2024 which permitted internal inspections and assessments that would not otherwise have been possible.
Table 14.13 Smelter rebuild CAPEX – by section
| Section | Cost (US$) | |||
| Furnace rebuilds, WHB repairs, Dryer refurbishment, anode wheel upgrade | 19,100,550 | |||
| Acid plant refurbishment | 10,041,470 | |||
| Oxygen Plant refurbishment | 726,230 | |||
| Miscellaneous items | 2,886,875 | |||
| Smelter rebuild total | 32,755,125 | |||
The next campaign is planned for five years which is aligned with worldwide industry performance for similar furnaces and systems.
| 14.4.3 | Concentrate blending and third-party feed requirements |
Stable thermodynamic operation of the direct-to-blister smelting process relies on operators maintaining an appropriate feed concentrate blend to the FSF. The FSF requires a feed blend that achieves a specific Fe / SiO₂ ratio, a target total copper content, and controlled sulfur content. Multiple blending metrics are targeted simultaneously, as summarized in the example blend plan at Table 14.14.
Table 14.14 Example monthly concentrate blend plan – June 2025
Jun’ 2025-26 blend plan | Blend (%) | 100 (%) | DMT | Cu (%) | Fe
(%) | SiO2 (%) | CaO (%) | S
(%) | Bi (ppm) | Co (%) | AsCu (%) | Au | ||||||||||||||||||||||||||||||||||||
| Nchanga | 5.0 | 5.00 | 2,303 | 5.0 | 6.7 | 22.0 | 0.0 | 7.2 | 272.00 | 0.4 | 1.83 | 0.00 | ||||||||||||||||||||||||||||||||||||
| Konkola | 20.0 | 20.00 | 9,212 | 20.0 | 7.6 | 21.8 | 0.0 | 15.1 | 161.00 | 0.8 | 1.78 | 0.00 | ||||||||||||||||||||||||||||||||||||
| Pyrite | 8.0 | 8.00 | 3,685 | 8.0 | 23.6 | 1.4 | 11.3 | 30.4 | 0.00 | 0.0 | 0.00 | 0.00 | ||||||||||||||||||||||||||||||||||||
| Zambian Chalcopyrite A | 36.0 | 36.00 | 16,582 | 36.0 | 20.8 | 12.9 | 0.2 | 26.4 | 28.00 | 0.1 | 1.48 | 0.00 | ||||||||||||||||||||||||||||||||||||
| Zambian Chalcopyrite B | 0.0 | 0.00 | 0 | 0.0 | 24.5 | 8.0 | 0.1 | 28.7 | 474.30 | 0.0 | 0.48 | 0.00 | ||||||||||||||||||||||||||||||||||||
| Zambian Chalcopyrite C | 0.0 | 0.00 | 0 | 0.0 | 6.8 | 12.4 | 0.7 | 19.9 | 474.83 | 0.0 | 4.04 | |||||||||||||||||||||||||||||||||||||
| Zambian Chalcopyrite D | 0.0 | 0.00 | 0 | 0.0 | 15.8 | 15.9 | 0.1 | 23.1 | 73.23 | 0.1 | 1.04 | 0.01 | ||||||||||||||||||||||||||||||||||||
| Slag Concentrate (local) | 4.0 | 4.00 | 1,842 | 4.0 | 14.5 | 13.5 | 2.9 | 17.3 | 146.00 | 0.5 | 3.59 | |||||||||||||||||||||||||||||||||||||
| DRC Chalcopyrite | 0.0 | 0.00 | 0 | 0.0 | 1.6 | 16.3 | 1.1 | 12.4 | 131.00 | 0.0 | 7.47 | |||||||||||||||||||||||||||||||||||||
| DRC Chalcocite A | 14.0 | 14.00 | 6,448 | 14.0 | 2.6 | 21.9 | 0.6 | 5.1 | 13.00 | 0.0 | 1.12 | 0.00 | ||||||||||||||||||||||||||||||||||||
| DRC Chalcocite B | 8.0 | 8.00 | 3,685 | 8.0 | 6.7 | 0.2 | 0.1 | 10.3 | 95.00 | 0.1 | 4.90 | |||||||||||||||||||||||||||||||||||||
| DRC Chalcocite C | 0.0 | 0.00 | 0 | 0.0 | 17.6 | 25.8 | 0.4 | 28.0 | 85.00 | 0.0 | 4.17 | |||||||||||||||||||||||||||||||||||||
| Lime | 5.0 | 5.00 | 2,303 | 5.0 | 0.0 | 2.6 | 49.0 | 0.0 | 0.00 | 0.1 | 0.00 | |||||||||||||||||||||||||||||||||||||
| Total | 100.00 | 100.00 | 46060 | 20.0 | 12.63 | 13.95 | 3.64 | 17.54 | 70.34 | 0.26 | 1.67 | 0.00 | ||||||||||||||||||||||||||||||||||||
| Fe / SiO2 | 0.91 | |||||||||||||||||||||||||||||||||||||||||||||||
| Normalised Silica | 21.4 |
Note: Third-party concentrate sources are identified by concentrate type and origin. The blend chemistry and proportions shown are representative of actual operational blending as at the effective date.
| amcconsultants.com | 256 |
| S-K 1300 TRS: KCM Integrated Operations (Initial Assessment) | |
| Konkola Copper Mines Plc | 0424076 |
KCM's own concentrates, produced at the Konkola Concentrator and Nchanga Concentrators, carry elevated silica content, typically 20–22% SiO₂, which materially exceeds the preferred smelter feed limit of less than 15% SiO₂. Operating the FSF on KCM's own concentrates alone would result in an Fe / SiO₂ ratio below the thermodynamic operating envelope of the furnace, causing instability in the reaction shaft, reduced copper recovery into the blister phase, increased slag losses, and potential damage to the refractory lining. To correct this imbalance, chalcopyrite-dominant concentrates with higher iron and lower silica content must be incorporated into the feed blend. This is a metallurgical design requirement of the FSF and is not a matter of commercial preference.
Third-party concentrate sourced from other Copperbelt mines serves this blending function. The principal feeds used in the current blend are chalcopyrite-dominant concentrates sourced from large-scale Zambian open pit producers and high-grade chalcocite concentrates from DRC underground operations proximate to the Zambian border, where available. These feeds are high-iron, lower-silica concentrates that counterbalance the silica-rich KCM internal feed and bring the blended FSF input within its operating parameters.
| 14.4.3.1 | Sources of third-party concentrate |
Third-party concentrate is sourced from copper mines operating in the Zambian and DRC Copperbelt region, which constitutes the world's second largest copper-producing region and generated an estimated combined 4.3 million tonnes of copper in 2025. The proximity of these mines, the majority within 200 to 500 kilometres of the Nchanga Smelter, enables road-based concentrate logistics at commercially viable freight rates.
Principal sources in recent supply history include large-scale Zambian open pit operations producing chalcopyrite concentrate at approximately 29% Cu with low silica content; Zambian chalcopyrite producers at approximately 23–24% Cu; high-grade DRC chalcocite concentrate sources at approximately 47% Cu with very low silica, which have historically been among KCM's preferred high-grade feed sources due to their proximity to the Zambian border and favourable blend chemistry; and various smaller Copperbelt producers including slag concentrate facilities located in the Chingola and Chililabombwe areas.
| 14.4.3.2 | Availability of third-party concentrate |
The overall concentrate supply environment on the Zambian and DRC Copperbelt is assessed as favourable for continued third-party procurement, for the following reasons.
Total copper production in the two-country Copperbelt region is growing materially. Zambia's copper output reached approximately 890,000 tonnes in calendar year 2025, up approximately 8% year-on-year, and the Zambian government has set a production target of 3 million tonnes per annum by 2031, underpinned by approximately US$10B in committed mining investment over 2022–2026. DRC production was approximately 3.4 million tonnes in 2025. Collectively the Copperbelt produced approximately 4.3 million tonnes of copper in 2025 and output is forecast to grow further through 2030.
| amcconsultants.com | 257 |
| S-K 1300 TRS: KCM Integrated Operations (Initial Assessment) | |
| Konkola Copper Mines Plc | 0424076 |
Not all of this production, however, generates concentrate available to third-party smelters such as the Nchanga FSF. A critical structural development occurred in December 2025 when Ivanhoe Mines commissioned the Kamoa-Kakula on-site direct-to-blister copper smelter (500,000 tpa capacity) in the DRC. This facility, constructed at a capital cost of approximately US$1.1B, is designed to process Kamoa-Kakula's own concentrate internally, transitioning the mine from a concentrate exporter to a refined anode producer. At full ramp-up (targeted by end of 2026), Kamoa-Kakula's own smelter is expected to absorb the approximately 400,000 tonnes per annum of copper produced at the complex, materially reducing the volume of Kamoa concentrate available to third-party smelters. Prior to this commissioning, Kamoa-Kakula concentrate was a sought-after high-grade, low-silica feed for regional smelters including the Nchanga FSF.
This development illustrates an important structural dynamic in the Copperbelt concentrate market: while total copper production is growing, a number of the largest individual mine expansions are being accompanied by dedicated on-site smelting and refining capacity. Large-scale projects with sufficient production volumes, power supply access, and capital availability, such as Kamoa-Kakula, can justify the investment in proprietary smelting infrastructure. Smaller producers and mines that lack access to reliable power supply, cannot justify the capital outlay (in excess of US$500M for a facility of meaningful scale), or are located outside established acid and logistics corridors, are not able to replicate this model and continue to sell concentrate into the regional market. The Nchanga Smelter, as an established 850 ktpa facility with existing acid plant infrastructure and Copperbelt logistics connectivity, is well-positioned to service these producers.
A further structural factor supporting supply continuity is the Zambian regulatory framework governing concentrate exports. The Government of Zambia applies a 10% export levy on copper concentrate, reflecting a deliberate national policy of encouraging value addition within Zambia rather than export of unprocessed or semi-processed material. This levy creates a material economic disincentive for Zambian concentrate producers to divert supply to export markets or to non-Zambian smelters, effectively anchoring domestically produced concentrate within the Zambian processing value chain. For Zambian producers, the export levy, combined with the additional logistics cost of trucking concentrate to Dar es Salaam or other export corridors for onward shipment, makes supply to regional Copperbelt smelters such as the Nchanga Smelter the economically dominant off-take route. An equivalent structural dynamic applies to high-grade concentrate sources located in the DRC proximate to the Zambian border. The cost of trucking DRC-origin concentrate to deep-water ports for shipment to smelters in Asia is substantially higher than the road freight cost to regional Copperbelt smelters; accordingly, DRC mines within the relevant catchment area have a strong commercial preference for supplying regional Zambian smelters. These structural economics provide a durable basis for the QPs' assessment that third-party concentrate will remain available to KCM throughout the life of operations at commercially reasonable terms. They do not, however, eliminate the commercial risk associated with the absence of binding long-term supply contracts, which is identified as a material risk to the LOM plan and is assessed in Section 14.4.3.5 below.
The net effect is that regional concentrate availability is expected to remain adequate, though sourcing requires active commercial management as the largest individual contributors reduce their open market volumes. KCM's smelting capacity, its position as a regional concentration hub, and its established relationships with multiple concentrate suppliers provide a structural advantage in securing ongoing supply.
| 14.4.3.3 | Existing contracts and commercial terms |
As of the effective date of this report (1 April 2026), KCM has entered into supply agreements with multiple third-party concentrate suppliers covering for the supply of concentrate during FY26/27. These agreements are short-term in nature, consistent with industry practice for concentrate trading in the Copperbelt region. Concentrate purchases are made on a metal-return basis, meaning KCM takes ownership of the purchased concentrate and pays a concentrate purchase price linked to the contained metal value, less treatment and refining charges, payability deductions, and freight. This is a standard commercial purchase arrangement, KCM is not operating as a toll processor of third-party material; it acquires the concentrate as a feedstock input and retains the processed metal output, bearing the associated market price risk on both the purchase and the refined product sale.
| amcconsultants.com | 258 |
| S-K 1300 TRS: KCM Integrated Operations (Initial Assessment) | |
| Konkola Copper Mines Plc | 0424076 |
The terms of current supply agreements, as reflected in the FY2025/26 business plan blending schedule (Table 14.15), include: concentrate purchase prices calculated by reference to prevailing LME copper prices less treatment charges (at prevailing TC / RC rates in the African market, estimated at US$60/dmt and US$0.06/lb respectively for long-term planning purposes, consistent with the payability terms in Table 16.3); volumes procured under individual contracts ranging from approximately 10,000 to 60,000 dry metric tonnes per month per supplier, with multiple concurrent suppliers engaged to provide blend flexibility and supply security; and contract durations of one fiscal year or less, with renewal subject to commercial negotiation.
Table 14.15 Concentrate blending plan – FY25/26 business plan
| Opening stock | Receipts | Treatment | Closing stock | |||||||||||||||||||||||||||||||||||||||||||||
| Own
concentrates | DMT | TCu
(%) | Fine
Cu | DMT | TCu
(%) | Fine Cu | DMT | TCu
(%) | Fine Cu | DMT | TCu
(%) | Fine
Cu | ||||||||||||||||||||||||||||||||||||
| Nchanga hg | 20.0 | 63,995 | 20.0 | 12,799 | 19,415 | 20.0 | 3,883 | 44,580 | 20.0 | 8,916 | ||||||||||||||||||||||||||||||||||||||
| Konkola hg | 483 | 33.0 | 159 | 151,608 | 33.00 | 50,031 | 151,653 | 33.00 | 50,045 | 438 | 33.00 | 145 | ||||||||||||||||||||||||||||||||||||
| Pyrite | 1,000 | 0.3 | 3 | 72,001 | 0 | 216 | 43,288 | 0.3 | 130 | 29,713 | 0.3 | 89 | ||||||||||||||||||||||||||||||||||||
| Total own | 1,483 | 162 | 287,604 | 63,046 | 214,355 | 54,058 | 74,732 | 9,150 | ||||||||||||||||||||||||||||||||||||||||
| Purchased concentrates | ||||||||||||||||||||||||||||||||||||||||||||||||
| Zambian Chalcopyrite A | 29.1 | 185,233 | 29.00 | 53,718 | 185,233 | 29.00 | 53,718 | 0.0 | ||||||||||||||||||||||||||||||||||||||||
| Zambian Chalcopyrite C | 44.5 | 0.0 | 0.0 | 0.0 | ||||||||||||||||||||||||||||||||||||||||||||
| Zambian Chalcopyrite D | 26.0 | 0.0 | 0.0 | 0.0 | ||||||||||||||||||||||||||||||||||||||||||||
| Slag Concentrate (local) | 325 | 25.0 | 81 | 13,416 | 25.0 | 3,354 | 13,416 | 25.0 | 3,354 | 325 | 25.0 | 81 | ||||||||||||||||||||||||||||||||||||
| Zambian Chalcopyrite B | 0.0 | 12,569 | 0.0 | 12,569 | 0.0 | 0.0 | ||||||||||||||||||||||||||||||||||||||||||
| DRC Chalcopyrite | 49.1 | 4,688 | 48.00 | 2,250 | 4,688 | 48.0 | 2,250 | 0.0 | ||||||||||||||||||||||||||||||||||||||||
| DRC Chalcocite A | 235 | 48.0 | 113 | 60,101 | 48.00 | 28,848 | 60,101 | 48.0 | 28,848 | 235 | 48.0 | 113 | ||||||||||||||||||||||||||||||||||||
| DRC Chalcocite B | 200 | 47.0 | 94 | 29,333 | 47.0 | 13,786 | 29,333 | 47.0 | 13,786 | 200 | 47.0 | 94 | ||||||||||||||||||||||||||||||||||||
| DRC Chalcocite C | 29.6 | 0 | 0.0 | 0.0 | ||||||||||||||||||||||||||||||||||||||||||||
| Total purchased | 759 | 288 | 292,771 | 101,957 | 292,771 | 101,957 | 759 | 288 | ||||||||||||||||||||||||||||||||||||||||
| Total concentrates | 2,242 | 450 | 580,375 | 165,002 | 507,126 | 30.76 | 156,015 | 75,491 | 9,438 | |||||||||||||||||||||||||||||||||||||||
Note: Third-party concentrate sources are identified by concentrate type and origin. The blend plan volumes and grades shown are based on the KCM FY25/26 business plan as at the effective date.
No binding concentrate supply contracts extend beyond 2026, and this is identified as a critical commercial risk requiring ongoing management. The LOM plan assumes that 300,000-315,000 tpa of third-party concentrate will be available throughout the mine life at commercially reasonable terms. This assumption is consistent with the observed regional supply environment but is not supported by binding long-term contractual commitments. The ability to renew and extend supply arrangements will depend on continued growth in Copperbelt concentrate production from mines that do not have access to proprietary smelting capacity, ongoing commercial relationships with concentrate traders and producers, and KCM's ability to offer competitive processing terms relative to alternative smelting routes available to concentrate sellers.
| 14.4.3.4 | Alternatives to third-party concentrate procurement |
In the absence of sufficient third-party concentrate, KCM has identified the following alternative pathways, each with differing economics and operability implications.
The primary operational mitigation is blend management using additional lime addition and pyrite concentrate from the Nampundwe Mine to partially adjust the FSF feed chemistry. These materials are available in limited volumes and can partially compensate for the silica imbalance, but cannot fully replicate the blend correction provided by high-volume chalcopyrite concentrate feed at required tonnages. Operating on a lime-heavy blend reduces smelter throughput and copper recovery into the blister phase.
| amcconsultants.com | 259 |
| S-K 1300 TRS: KCM Integrated Operations (Initial Assessment) | |
| Konkola Copper Mines Plc | 0424076 |
A second mitigation is operation of the sulfur-burning acid plant (500 tpd capacity) to partially compensate for reduced off-gas acid production where smelter throughput declines. This reduces the incremental acid shortfall but does not eliminate it; if off-gas acid production falls by more than 500 tpd (i.e. if smelter throughput falls to less than approximately 60% of current operating rate), net TLP acid availability would be constrained.
Third-party acid procurement from regional suppliers in Zambia, Namibia, and South Africa represents the fall-back option for KCM's tailings leaching operations under both economic cases. Current market prices for sulfuric acid on the Zambian Copperbelt have been elevated, with spot prices reaching up to US$700 per tonne in Kolwezi, DRC, in late 2025 following Zambia's imposition of an acid export ban in September 2025. The economic model applies an internal acid transfer price of US$130 per tonne, representing the estimated avoided cost of external procurement under normalised market conditions, credited against TLP operating costs.
If third-party concentrate were unavailable and the resulting LOM acid shortfall were sourced externally at the assumed market price of US$175 per tonne, the incremental NPV₈% impact, calculated as the US$45 per tonne delta between the external market price and the internal transfer price applied to the case-specific external acid volume, is approximately US$70M for the M&I Case (acid shortfall approximately 1.9 Mt, reflecting the third-party concentrate share of smelter feed over the M&I Case LOM) and approximately US$100M for the Full Resource Case (acid shortfall approximately 6.4 Mt, reflecting the longer combined operating life of the existing Nchanga TLP and TLP 2 and the higher LOM acid requirement under the Full Resource Case as fresh Nchanga concentrator tails processing continues through to approximately FY2037/38). At current Copperbelt spot acid prices, both impacts would be substantially higher. The acid cost exposure under each case is incorporated in the fully integrated third-party concentrate sensitivity analysis presented in Section 19.
| 14.4.3.5 | Assessment of supply certainty |
The QPs' assessment is that the availability of regional third-party concentrate at volumes sufficient to meet the LOM Full Resource plan requirements of 300,000–315,000tpa is plausible but not certain. The risk is assessed as moderate. Supporting factors for continued availability include the overall volume of Copperbelt concentrate production (which substantially exceeds KCM's requirements and is growing), the structural inability of many smaller regional producers to build proprietary smelting capacity, the established commercial relationships KCM has maintained with concentrate traders and mine operators, the geographical advantage of the Nchanga Smelter's location within the Zambian Copperbelt, and the competitive processing terms KCM can offer. Countervailing risk factors include the absence of long-term supply contracts, the Kamoa-Kakula smelter commissioning reducing one of the region's largest open-market concentrate sources, the potential for further mine-site smelter developments to reduce regional third-party concentrate availability over the LOM, and the competitive demand for regional concentrate from other Copperbelt smelters.
The NPV impact of losing third-party concentrate supply, incorporating both the direct smelter contribution and the incremental acid procurement cost, is estimated at approximately US$210M for the Measured and Indicated Case (an 8% reduction from the post-tax base case NPV₈% of US$2,640M, reducing to US$2,430M) and approximately US$296M for the Full Resource Case (a 3% reduction from the post-tax base case NPV₈% of US$8,637M, reducing to US$8,341M), as set out in the full sensitivity analysis in Section 19.
| amcconsultants.com | 260 |
| S-K 1300 TRS: KCM Integrated Operations (Initial Assessment) | |
| Konkola Copper Mines Plc | 0424076 |
| 14.4.4 | Nkana refinery |
| 14.4.4.1 | Mode of operation, general condition |
The Nkana Refinery (Tank house, Refinery) is a large, conventional electro-refinery with a nominal capacity of 300 ktpa of grade A refined cathode (see Figure 14.32). Production utilises the starter sheet process whereby thin starter sheets of refined copper are plated on titanium blanks in the Stripper Section of the Tank house. Sheets are manually stripped and fabricated prior to loading in the commercial sections of the Tank house where they are grown to full weight. Anodes are consumed in two 11-day cycles and two refined cathodes are produced per anode. Approximately 18% of the anode weight is returned to the smelter as anode scrap. Overall scrap rate for the refinery is 22%.
The commercial section of the Tank house is arranged in 72 independently powered sections. Nine independent electrolyte circuits service eight sections each.
The Refinery operated reliably and well in the past, achieving >95% current efficiency and producing >95% grade A quality refined copper. In recent years the capacity of the refinery was reduced to 50% due to issues related to inability to maintain the facility in full operating condition.
Figure 14.32 Nkana refinery – process flowsheet
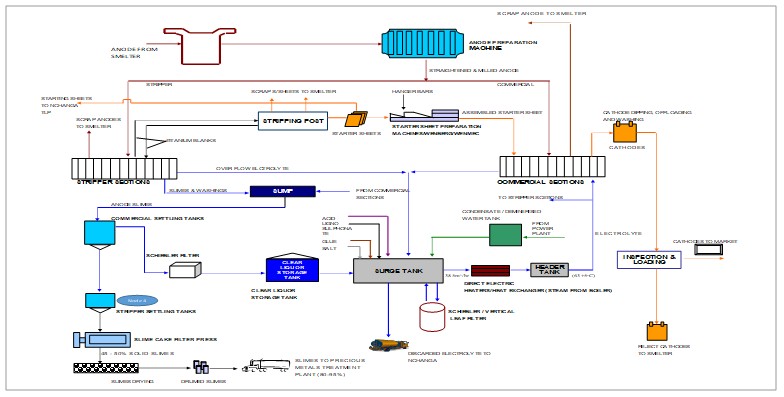
Source: KCM, 2025.
The current mission of the Refinery is to produce starter sheets for the Nchanga TLP EW tank house. To accomplish this, stripper anodes are supplied by the Nchanga Smelter and consumed in the stripper section. Anodes produce good quality sheets while still dimensionally consistent which is about ½ weight. After this point the anodes are transferred to a commercial section to consume the remainder of the anodes and to produce refined cathode for sale. Anode scrap from these sections is returned to the Smelter for remelting.
In this mode of operation, one commercial electrolyte circuit is in service. As two sections only are required for this stripper anode refining duty, six sections in the operational electrolyte circuit are currently available for refining should copper be available in the smelter to produce and supply commercial anodes. Refining of such copper would be accomplished at minimal additional cost for power and reagents as operation of the electrolyte circuit (including labour) is a stay in business expense already incurred for production of Nchanga TLP starter sheets. The Refinery could currently be characterised as neat and tidy but very run down, with general observations as follows:
| amcconsultants.com | 261 |
| S-K 1300 TRS: KCM Integrated Operations (Initial Assessment) | |
| Konkola Copper Mines Plc | 0424076 |
| · | Some cell-top hardware is in storage and available. |
| · | Cells are in serviceable condition. |
| · | Structures are not painted and are acid affected but appear to be sound. |
| · | Basement floors and sumps are acid compromised. While the damage is significant, acid infiltration below the basement concrete floor has not yet resulted in sufficient “swell and heaving” to distort the basic structure of the building. |
Operators are aware of the conditions described and the most critical areas have already been repaired. The worst floor area has been dug out, acid has been neutralised and the floor has been re-concreted. Plans are in place for similar repair of a second high-priority area. One high-priority area of steel structure has been sand blasted, repaired and re-painted.
| 14.4.4.2 | Production |
Table 14.16 shows Refinery production for 2024-2025 YTD to January 2025. Gross copper production was 4,763.1 t versus the business plan (BP) of 12,033 t. This significant production shortfall is largely due to availability of anodes from the Smelter. Basic refinery performance parameters were as follows:
| · | Current efficiency | 91.8% v. 96.0% planned |
| · | Anode scrap rate | 34.2% v. 18.0% |
| · | Plant utilisation | 93.3% v. 90.0% |
| · | Dispatchability | 84.9% v. 95.0% |
Although operators are experiencing some difficulties maintaining stable electro-chemical conditions in the Tank house due to the small number of sections operating and are not meeting planned current efficiency, scrap rate and cathode dispatchability levels, the operation is stable and the primary mission of supplying acceptable quality starter sheets to the Nchanga TLP is being met.
Table 14.16 Nkana Refinery production – 2024-2025
| 2024 -2025 YTD | Januarv-25 | Feb-25 | ||||||||||||||||||||
| Actual | BP | Var
[Actual- BP] | DECEMBER- 24 Actual | Parameter | Units | Actual | Projection | BP | Var
[Actual- BP] | Projection | BP | |||||||||||
| 4,763.1 | 12,033 | (7,269.6) | 1084 | Gross Copper production | MT | 981 | 1,707.0 | 4,059.6 | (3,078.7) | 1,584.0 | 4,197.1 | |||||||||||
| 2,221 | 6,997 | (4,776.2) | 580 | REC Production | MT | 473 | 700.0 | 2,611.7 | (2,138.936) | 800.0 | 2,914.0 | |||||||||||
| 2,128 | 3,293 | (1,165.3) | 504 | S/S to TLP | MT | 508 | 656.0 | 840.4 | (332.246) | 550.0 | 675.6 | |||||||||||
| 414 | 1,743 | (1,328.1) | 0 | Q12 production | MT | 0.00 | 351.0 | 607.5 | (607.500) | 234.0 | 607.5 | |||||||||||
| 420 | 1,743 | (1,322.8) | 0 | Q12 Dispatch | MT | 0.00 | 351.0 | 607.5 | (607.5) | 234.0 | 607.5 | |||||||||||
| 6,971 | 22,000 | (15,028.7) | 1,194 | Nchanga Anodes Receipt | MT | 1,578 | 2,700.0 | 4,500.0 | (2,922.1) | 2,160.0 | 4,500 | |||||||||||
| 9.6 | 20.7 | (11.1) | 1 | Slimes Production | MT | 1.32 | 2.0 | 7.2 | (5.9) | 2.00 | 7.2 | |||||||||||
| 91.8 | 96.0 | (4.3) | 93 | Current Efficiency | % | 91.1 | 96.0 | 96.0 | (4.9) | 96.0 | 96.0 | |||||||||||
| 34.2 | 18.0 | (16.2) | 38 | Anodes Scrap Rate | % | 22.0 | 18.0 | 18.0 | 4.0 | 18.0 | 18.0 | |||||||||||
| 4.2 | 10.0 | 5.8 | 3 | Starter sheet scrap | % | 4.90 | 5.0 | 10.0 | 0.1 | 5.0 | 10.0 | |||||||||||
| 84.9 | 95.0 | (10.1) | 80 | Dispatchability | % | 88.2 | 95.0 | 95.0 | (6.8) | 95.0 | 95.0 | |||||||||||
| 93.3 | 90.0 | 3.3 | 94 | Plant Utilisation | % | 92 | 92 | 90.0 | 2.0 | 92 | 90.0 | |||||||||||
Source: KCM, 2025.
| 14.5 | Proposed processing methods |
One new processing facility is proposed under the Full Resource Case: a second Tailings Leach Plant (TLP 2) to process reclaimed material from the TD05 Mineral Resource. TLP 2 is at Concept Study level (NERIN, completed November 2025) and is accordingly included in the Initial Assessment Full Resource Case only; it is not included in the Mineral Reserve estimate or the M&I Case mine plan in the companion PFS Technical Report Summary. No other new processing methods are proposed; the Konkola Concentrator (Section 14.1), Nchanga Concentrators (Section 14.2), existing Nchanga TLP (Section 14.3), and Nchanga Smelter and Nkana Refinery (Section 14.4) continue to operate as currently configured.
| amcconsultants.com | 262 |
| S-K 1300 TRS: KCM Integrated Operations (Initial Assessment) | |
| Konkola Copper Mines Plc | 0424076 |
The proposed TLP 2 facility is a new tailings leach plant designed to process reclaimed material from the TD05 (Muntimpa) tailings storage facility under the Full Resource Case. The project has been progressed to concept study level by NERIN with metallurgical test work completed by AHK on 611 samples from 585 m of reverse circulation drilling. The total project capital cost at IA-level disclosure is approximately US$741M (including engineering and contingency allowances appropriate to IA-level accuracy).
| 14.5.1 | Process description |
The TLP 2 flowsheet replicates the established hydrometallurgical route used at the existing Nchanga TLP, with adaptations to address the TD05 mineralogy:
| · | Hydro-mining of TD05 tailings using high-pressure water to produce a slurry feed |
| · | Pumped slurry transfer to TLP 2 |
| · | Elevated temperature acid leaching at 70–80°C using on-site sulfuric acid |
| · | Solvent extraction (SX) to recover and concentrate copper from the pregnant leach solution |
| · | Electrowinning (EW) to produce LME Grade A copper cathode (>99.9935% Cu) |
| · | Neutralisation and pumped transfer of barren leach residue to TD06 (the new tailings storage facility) |
The elevated temperature leach circuit is required to achieve the design metallurgical recovery from TD05 material, which contains predominantly cupriferous mica (4–7%) with minor malachite, pseudomalachite, chrysocolla and chalcocite. Steam for elevated temperature leaching is generated on-site via coal combustion (175 kg coal per tonne of steam; approximately 277,000 tpa coal at design throughput).
| 14.5.2 | Design parameters |
Table 14.17 TLP 2 design parameters
| Parameter | Value | |
| Design throughput | 53,500 tpd / 19.5 Mtpa | |
| Nominal throughput | 17.66 Mtpa | |
| Plant availability / utilisation | 90.4% | |
| TD05 head grade (TCu) | 0.55% | |
| TCu leach efficiency | See Section 10.4.4.3 | |
| TCu wash efficiency | 98.5% | |
| SX-EW efficiency | 99.5% | |
| Current efficiency | 91.0% | |
| Overall TCu recovery | 73.9% | |
| Annual cathode production | 70,470 tpa Grade A Cu | |
| Power demand | 38 MW (3.7 MWh per tonne Cu) |
| 14.5.3 | TD06 tailings storage facility |
A new tailings storage facility (TD06) is required to receive both fresh tailings from the Nchanga concentrators (currently directed to TD05) at approximately 13.4 Mtpa, and barren leach residue from TLP 2 at approximately 17.6 Mtpa (TCu grade 0.14% post-leach).
| 14.6 | Proposed flow sheet |
The proposed TLP 2 flowsheet is shown in Figure 14.33.
| amcconsultants.com | 263 |
| S-K 1300 TRS: KCM Integrated Operations (Initial Assessment) | |
| Konkola Copper Mines Plc | 0424076 |
Figure 14.33 Proposed TLP 2 flowsheet
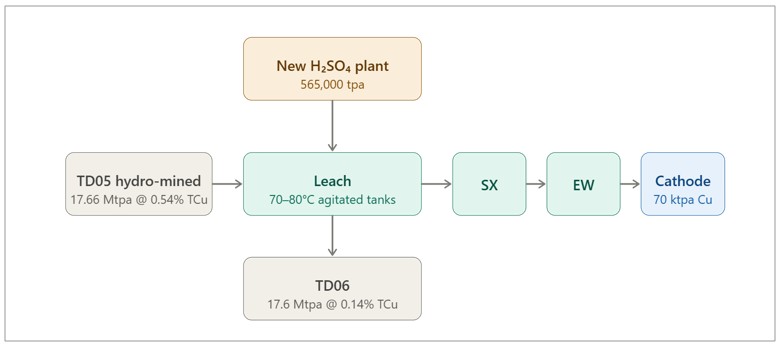
Source: AMC, 2026.
Key features of the flowsheet are:
| · | Hydro-mined TD05 tailings pumped to TLP 2 at 17.7 Mtpa and leached at elevated temperature (70–80°C), supplied by steam from an on-site coal-fired boiler. |
| · | Conventional solvent extraction and electrowinning recovers 70.4 ktpa at design rate of LME Grade A copper cathode at an overall TCu recovery of 73.9%. |
| · | Barren leach residue reports to the new TD06 tailings storage facility at approximately 17.6 Mtpa, which also receives continuous fresh tailings from the Nchanga concentrators following cessation of TD05 deposition. |
| 14.7 | Plant design and equipment |
See Sections 14.1.2 and 14.1.4.
| 14.8 | Plant operations |
The smelter operates on the concentrate blending plan shown in Table 14.15. Planned throughput for the period FY2026/27 to FY2030/31 ramps to a maximum of 724 kt, requiring a feed rate of 91 tph at the standard time utilisation of 91.5% (downtime allowance of 0.5 hours per day and two days per month). FY2030/31 is a transition year as throughput ramps from the FY2029/30 level to the nominal maximum capacity. From FY2032/33 onwards, throughput is planned at approximately 850 ktpa - the nominal designed maximum production rate - requiring a feed rate of 112.3 tph at 86.4% time utilisation. Smelter technical staff are confident this rate can be maintained provided an appropriate feed blend can be sourced. AMC concurs with this opinion.
Basic operating performance parameters calculated by smelter technical staff (98.13% Cu recovery, 30% Co recovery, S conversion to sulfuric acid) have been used to model the planned performance of the smelter and refinery.
| amcconsultants.com | 264 |
| S-K 1300 TRS: KCM Integrated Operations (Initial Assessment) | |
| Konkola Copper Mines Plc | 0424076 |
| 15 | Infrastructure |
KCM benefits from established infrastructure including road and rail access, grid power supply, water supply from the Kafue River system, and extensive processing and materials handling facilities developed over decades of operation. This infrastructure is sufficient to support the full Mineral Resource scenario presented in this Initial Assessment, with the exception of tailings storage capacity which will require expansion beyond the near-term production period.
This section of the report outlines the various infrastructure components supporting the ongoing mining and processing operations at the KCM mine site. It provides an overview of roads, railways, water dams, dumps, and tailings disposals, detailing their locations and roles in sustaining operations. Additionally, it summarises essential services such as power and water, including their sources and overall usage statistics. Ancillary service infrastructure supporting mining and processing activities is also addressed.
Furthermore, the report highlights planned future infrastructure expansions where applicable, offering insights into upcoming developments.
| 15.1 | Roads |
The mine sites are all existing operations and are connected to multiple local roads in the Chililabombwe, Chingola, Kitwe and adjacent towns. Internal town roads in these areas are primarily not always marked roadways and are a mix of dirt and tar roads. However, the main interconnecting roadway through the towns, Chingola-Chililabombwe Rd (T3), is a tar road that is kept in a decent and usable state and serves as the major route between towns and various mining sites, operations and the DRC Border. Thus, road access to support ongoing and future operations is well established in the area.
Roads in the local area are however prone to deterioration especially during the rainy seasons, and potholes are a frequent occurrence and risk to be aware of and dealt with when travelling on roadways. The map below visualises the main roadway, Chingola-Chililabombwe Rd (T3), and also shows existing railway infrastructure in-between towns covered in the next section (see Figure 15.1).
| amcconsultants.com | 265 |
| S-K 1300 TRS: KCM Integrated Operations (Initial Assessment) | |
| Konkola Copper Mines Plc | 0424076 |
Figure 15.1 Map showing main roads connecting towns of Chingola and Chililabombwe
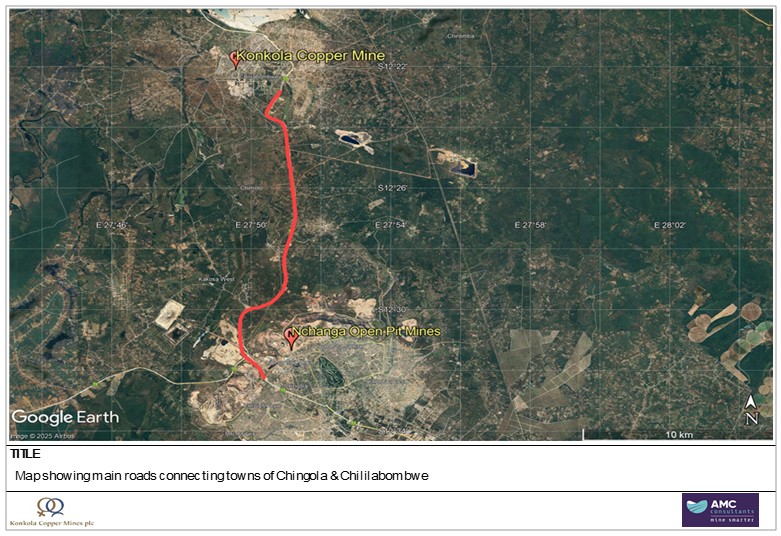
Source: Google Earth Pro. (2025). Map showing main roads and railways around Chingola & Chililabombwe, Zambia. Google Earth. Available at: https://earth.google.com. Accessed 12 March 2025.
On a national scale, Zambia has a functioning network of major highways that is the lifeline for mining operations in the Copperbelt region. Major highways also connected to the neighboring countries of Tanzania and Namibia where access can be gained to port infrastructure for exports. Through highways connected to the neighboring countries of Botswana and Zimbabwe, access can also be gained to South Africa for port access for exports.
| 15.2 | Rail |
In recent years, Zambia’s railways in the areas surrounding KCM are characterised by aged infrastructure and similarly aged rolling stock. This has resulted in significant operational challenges with operating rail services in the local areas surrounding the mine. Due to the deteriorating condition of existing railways running through the towns of Chililabombwe and Chingola, final product is not initially transported by railway. The primary method of transporting final product, and for inbound shipments of equipment or consumables, is road freight.
A viable rail export corridor that has been utilised in the past by KCM includes the Tazara railway line that stretches from the Zambian town of Kapiri Mphosi, through Tanzania and to the port of Der-es-salaam. Product still needs to be trucked via road for the initial 200 km from site to Kapiri Mphosi due to non-functioning local railways in the Copperbelt province. The Tazara railway is however not without its own challenges and has in recent years been plagued by operation challenges and infrastructure issues. At the time of reporting however the railway line is reported as open for freight and passenger use but needs extensive infrastructure upgrade and repair work. The below map shows current railway infrastructure reported in Zambia, showing both functioning and non-functioning networks (see Figure 15.2).
| amcconsultants.com | 266 |
| S-K 1300 TRS: KCM Integrated Operations (Initial Assessment) | |
| Konkola Copper Mines Plc | 0424076 |
There is a potential future rail corridor referred to as the Lubito Corridor that is planned to connect Angola’s port of Lobito through the DRC to Zambia’s Copperbelt. Current projections are for a completion date of 2029 (Lobito Corridor: What It Is & Why It Matters, 2025).
Figure 15.2 Map showing rail infrastructure of Zambia Railways Limited
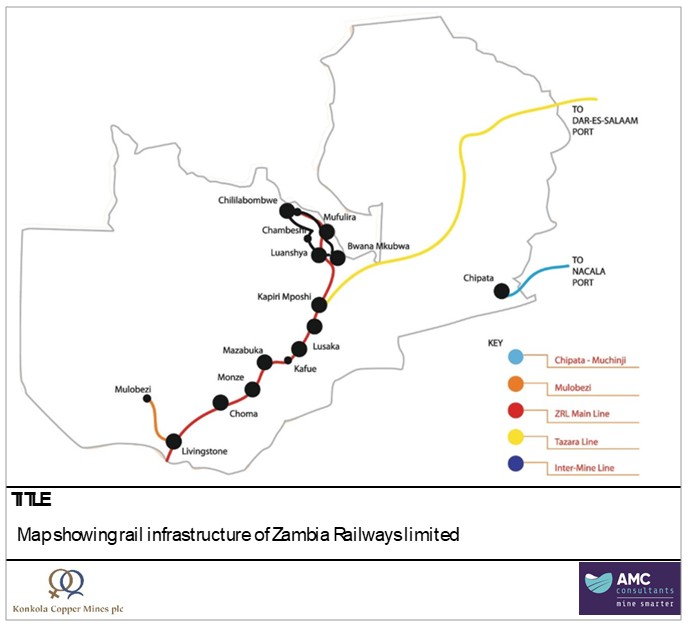
Source: Zambia railways ltd, railway network Map showing major railway infrastructure. Available at: zrl.com.zm/rail -Accessed 17 March 2025.
| 15.3 | Port facilities |
Zambia is a landlocked country with no direct access to port facilities. Consequently, the transport of goods to and from the country and the mine relies exclusively on rail and road infrastructure. Accessible ports in other countries that have been utilised for product exports via existing logistical corridors include:
| · | Tanzania – Port of Dar-es-Salaam |
| · | Namibia – Port of Walvis Bay |
| · | South Africa – Port of Durban |
| 15.4 | Water dams |
Due to the primary source of raw water for operations being derived from underground dewatering activities, there is no significant need for above-ground water storage. The volume of water inflows into the underground mine operations at Konkola Mine far exceeds the required raw water usage. At Nchanga Mining operations, raw water from underground dewatering is supplemented with water abstracted from the Kafue River pump station. Consequently, there is no substantial water dam infrastructure for surface operations. The only operational dam is an emergency pollution control dam, constructed from the footprint of an old, reclaimed stockpile located adjacent to the TD02 historical TSF, which has been successfully reclaimed.
| amcconsultants.com | 267 |
| S-K 1300 TRS: KCM Integrated Operations (Initial Assessment) | |
| Konkola Copper Mines Plc | 0424076 |
| 15.5 | Dumps |
As part of operations of both the Konkola and Nchanga Operations, waste rock dumps are utilised to dispose of any waste rock generated through mining operations. These facilities are subject to statutory compliance and operating waste rock dumps at Konkola Mine is subjected to statutory inspections conducted by an independent 3rd party inspector to ensure compliance to the applicable legislation.
| 15.6 | Licensing and permitting |
The framework for the independent inspection of mine dumps is outlined in The Mines and Minerals (Environmental) Regulations, 1997 (Statutory Instrument No. 29 of 1997), a subsidiary legislation of The Mines and Minerals Development Act (MMDA).
Licensing to own and operate waste dumps at Konkola is subject to The Environmental Management Act (EMA), 2011, Environmental Management (Licensing) Regulations, 2013. Statutory inspections are carried out in line with the required legislation to ensure compliance of the operated waste dumps.
| 15.7 | Konkola operation waste dumps |
The Konkola Mine, located on the outskirts of the town Chililabombwe, operates primarily two waste dumps, Dump A & B. Dump A is located west of the mine adjacent to shafts 1 & 4, and handles waste from these operations. Dump B is located North-west of shaft 3 about 2.5 km north of Dump A. Both dumps are in operation and are actively used to support ongoing operations, they respectively have coverage areas of approximately 48 ha for Dump B, and 48 – 50 ha for Dump A (see Figure 15.3).
| amcconsultants.com | 268 |
| S-K 1300 TRS: KCM Integrated Operations (Initial Assessment) | |
| Konkola Copper Mines Plc | 0424076 |
Figure 15.3 Map showing waste dump locations at KCM
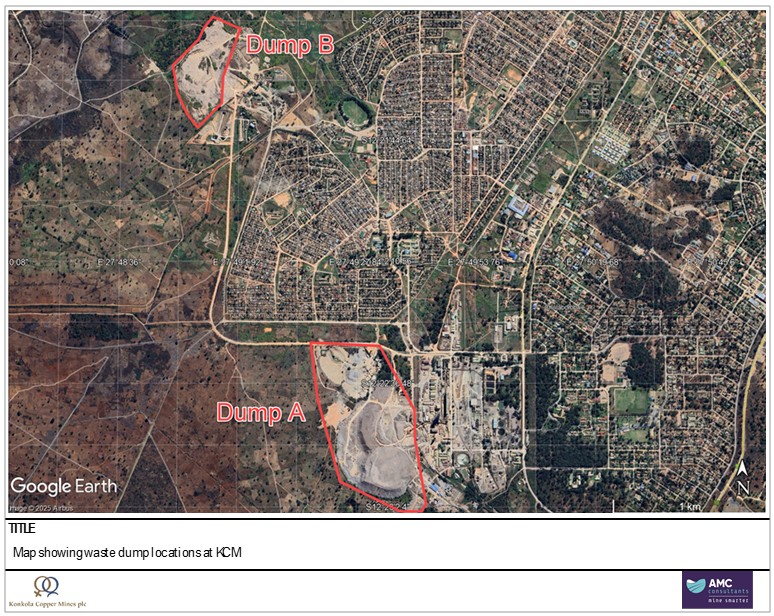
Source: Google Earth Pro., 2025. Map showing waste dumps of Konkola Mine at Chililabombwe, Zambia. Google Earth. Available at: https://earth.google.com. Accessed 19 March 2025.
| 15.8 | Nchanga Operation waste dumps |
The primary source of waste dumps in the Nchanga mining operations is from historical open pit mining overburden stockpiles. The stockpiles are primarily located in the areas shown in the image below. The stockpiles in these areas are estimated to cover an area of over 1,200 ha based on historical overburden inventory dumps data from the mine (see Figure 15.4).
| amcconsultants.com | 269 |
| S-K 1300 TRS: KCM Integrated Operations (Initial Assessment) | |
| Konkola Copper Mines Plc | 0424076 |
Figure 15.4 Map showing locations of various waste dumps at Nchanga Mines
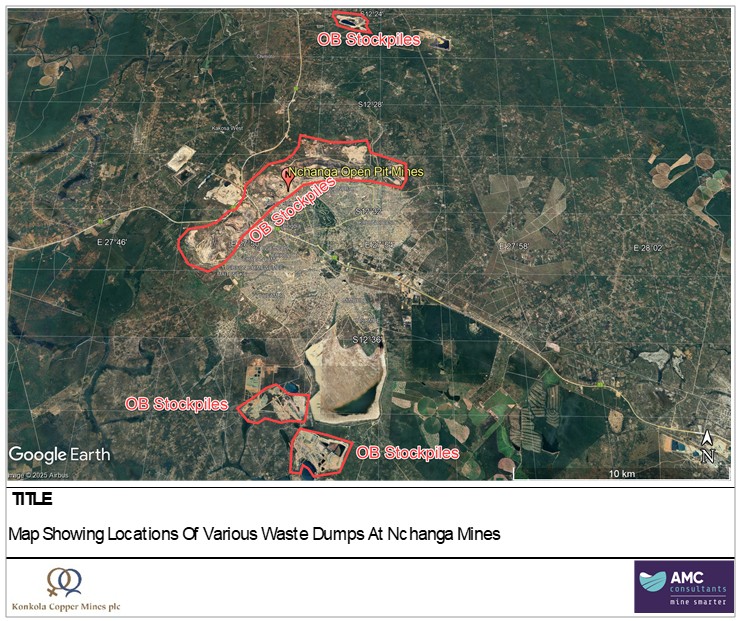
Source: Google Earth Pro., 2025. Map showing waste dump locations of Nchanga Mine located at Chingola, Zambia. Google Earth. Available at: https://earth.google.com. Accessed 19 March 2025.
| 15.9 | Tailings disposal |
| 15.9.1 | Tailings deposition locations |
Tailings disposal is achieved through pumped tailings to various TSFs located at different geographical locations throughout the Konkola Mines operational footprint. The operations include historic tailings facilities that are no longer in operation and in various stages of reclamation, and two operational facilities.
The current overview and state of TSFs in summary includes:
| · | TD02 – No longer in operation and fully reclaimed. |
| · | TD03 – No longer used for deposition of tailings and currently in process of being reclaimed through hydraulic mining and truck and shovel operations. |
| · | TD04 – No longer used for deposition of tailings and earmarked for reclamation by hydraulic mining. |
| · | TD05 – in operation and nearing maximum capacity. Investigation into stability and capacity increase conducted, but opportunity was limited due to stability issues (details below). |
| · | Lubengele – in operation, no plans for expansion, however facility has about 50% of design capacity left. |
| amcconsultants.com | 270 |
| S-K 1300 TRS: KCM Integrated Operations (Initial Assessment) | |
| Konkola Copper Mines Plc | 0424076 |
Locations of various TSFs in relation to neighboring towns and the main mining operations shown below (see Figure 15.5).
Figure 15.5 Map showing locations of all TSFs of Konkola and Nchanga Operations
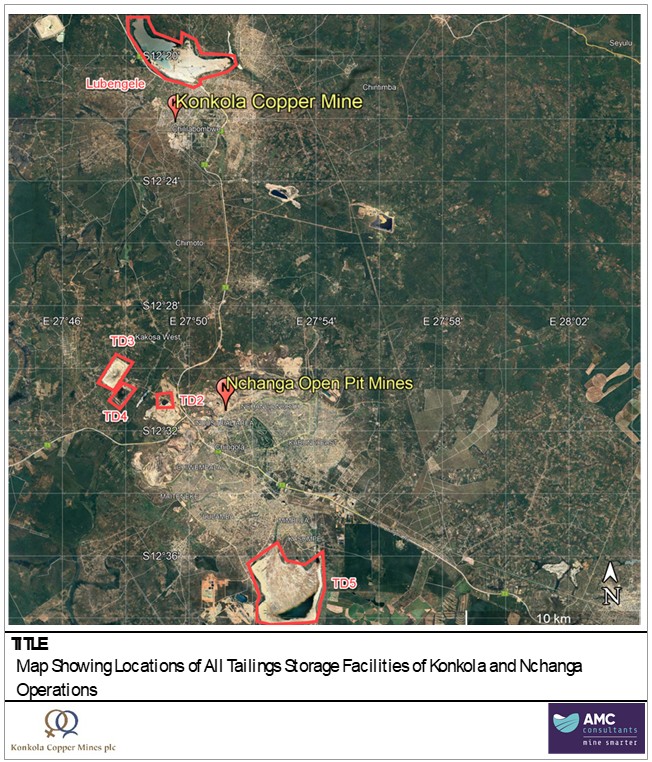
Source: Google Earth Pro., 2025. Map showing the location TSF and mining operations of Konkola Mines, Zambia. Google Earth. Available at: https://earth.google.com. Accessed 12 March 2025.
| amcconsultants.com | 271 |
| S-K 1300 TRS: KCM Integrated Operations (Initial Assessment) | |
| Konkola Copper Mines Plc | 0424076 |
The two operational facilities which include Muntimpa (TD05) and Lubengele are each located in proximity to local towns and in close proximity to mining operations at Konkola and Nchanga.
The Muntimpa (TD05) facility is located just to the south of the town of Chingola and borders the outskirts of town (12°36'51.66"S, 27°53'13.16"E) (see Figure 15.6).
Figure 15.6 Map showing detail view of TD05 Muntimpa TSF
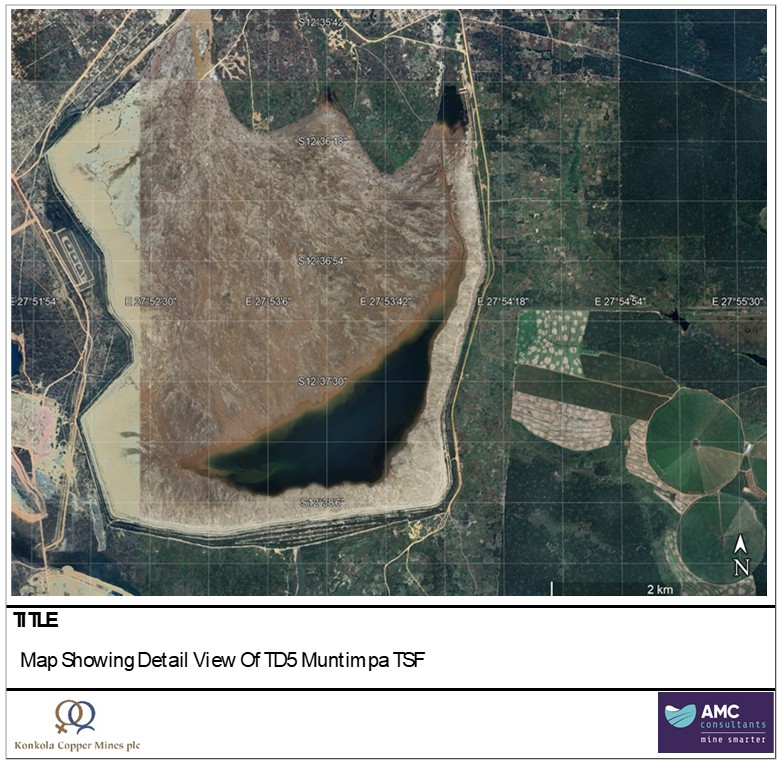
Source: Google Earth Pro., 2025. Map showing the location of Muntimpa TSF in Chingola, Zambia. Google Earth. Available at: https://earth.google.com. Accessed 12 March 2025.
| amcconsultants.com | 272 |
| S-K 1300 TRS: KCM Integrated Operations (Initial Assessment) | |
| Konkola Copper Mines Plc | 0424076 |
The Lubengele facility is located just to the north of the town of Chililabombwe and borders the outskirts of town (12°20'27.25"S, 27°49'53.35"E) (see Figure 15.7).
Figure 15.7 Map showing detail view of Lubengele TSF
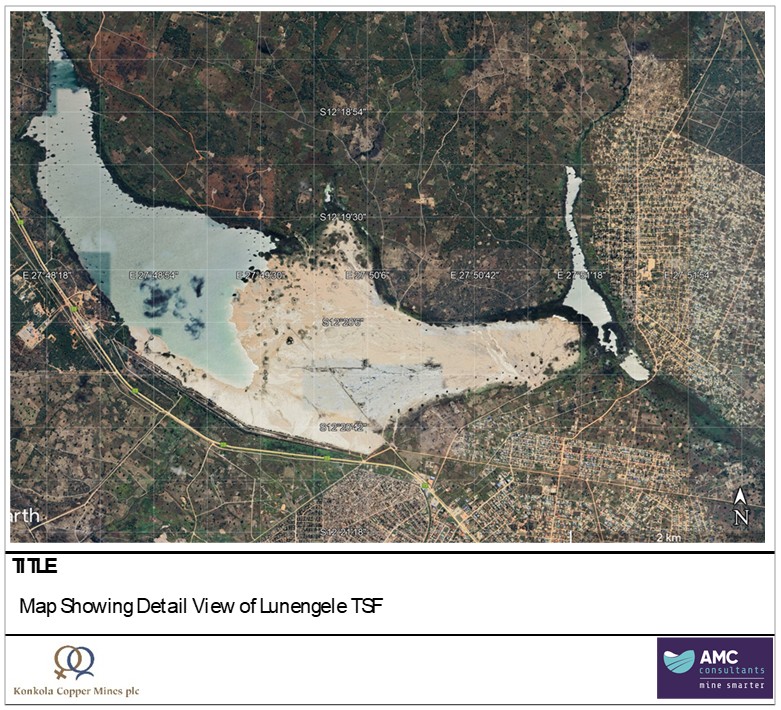
Source: Google Earth Pro. (2025). Map showing the location of Lubengele TSF in Chililabombwe, Zambia. Google Earth. Available at: https://earth.google.com. Accessed 12 March 2025.
| 15.9.2 | LOM capacity and expansion opportunities |
The principal active tailings storage facility, Muntimpa (TD05), is approaching the end of its useful life as a deposition facility, with fresh tailings deposition scheduled to cease by approximately end of 2028. An inspection into increasing its capacity by an independent third-party contractor was constrained by stability concerns to a maximum expandable capacity of 590 Mt against an initial target of 780 Mt. A civil buttress program (US$30M) is provided in the sustaining capital plan to extend TD05's deposition life through the ramp-up years until the new TD06 facility is commissioned.
| amcconsultants.com | 273 |
| S-K 1300 TRS: KCM Integrated Operations (Initial Assessment) | |
| Konkola Copper Mines Plc | 0424076 |
To replace TD05 as the active deposition facility, a new tailings storage facility (TD06) is proposed for commissioning by end of 2028. TD06 is required under both economic cases - the cessation of TD05 deposition is driven by TD05's expandable capacity constraint, and reclamation of the TD05 inventory under either case requires deposition to have ceased. TD06 will receive fresh tailings from the Nchanga concentrators (approximately 13.4 Mtpa combined output of the OEM, NEM, and NWM concentrators) and barren leach residue from the existing Nchanga TLP, and additionally, under the Full Resource Case, from the proposed TLP 2 facility (refer Section 14.3).
Concurrent with the cessation of TD05 deposition, the TD05 inventory transitions from a deposition destination to a reclamation feed source. Under the M&I Case, the Measured and Indicated portion of TD05 (198 Mt - refer Table 11.28) is processed through the existing Nchanga TLP as a life-of-mine extension following TD03 and TD04 depletion, contributing to the integrated M&I Case mine life of approximately 15 years. Under the Full Resource Case, the larger Inferred-inclusive TD05 resource base (423 Mt total) supports the capital investment in the proposed TLP 2 facility (refer Sections 11.4.4 and 14.3), which is constructed in parallel with the existing Nchanga TLP. The combined facilities lift total tailings throughput from approximately 13 Mtpa to approximately 34 Mtpa, accelerating recovery of the TD05 inventory under the FRC and bringing forward associated revenue, with TD05 reclamation extending to depletion in approximately FY2042/43.
There are no plans to extend the Lubengele TSF, which retains approximately 50% of its design capacity and continues to receive Konkola Mine concentrator tailings. Lubengele is being progressed as a future Mineral Resource exploration target, with auger drilling and characterisation now underway.
The combined infrastructure plan supports both the M&I Case and the Full Resource Case mine plans: continued use of TD05 to end of 2028, commissioning of TD06 from end of 2028, ongoing Lubengele deposition, and reclamation of TD03, TD04, and the M&I portion of TD05 through the existing Nchanga TLP. Under the Full Resource Case, this plan additionally includes construction of TLP 2 to enable parallel reclamation of the larger Inferred-inclusive TD05 resource base. Future TD06 expansion and additional capacity development remain available as long lead-time options as the project progresses.
Table 15.1 summarises the current conditions of operational TSF facilities.
Table 15.1 Operational TSF conditions, TD05 (Muntimpa) and Lubengele
| Description | TD05 - Muntimpa | Lubengele | ||
| Last Assessment conducted available | Nov 2024, Capacity increase investigation report & Quarterly inspection report. | Quarterly inspection report Jan 2025. | ||
| Management Standard / guidelines Followed | Global Industry Standard on Tailings Management (GISTM). | Global Industry Standard on Tailings Management (GISTM). | ||
| Total Storage capacity original Design [Mt] | 534.8 | 200 | ||
| Total Storage Used [Mt] | 546 (against the approved increased design capacity of 590 Mt) | 101 | ||
| Total Remaining [Mt] | 44 (Based on the 590 Mt increased capacity option). | 99 | ||
| Planned Capacity Increase [Mt] | 245 | None planned. | ||
| Final Planned Capacity [Mt] | 590 (780 not possible due to stability concerns). | 200 | ||
| Yearly deposition target [Mt] | To be confirmed based on new mining plan. | To be confirmed based on new mining plan. | ||
| Operational comments [During last reporting periods available] |
Operating close to design freeboard and pond level reduction required. Supernatant pond distance above limits, work was undertaken to lower levels. |
Operating well within design freeboard limits. Supernatant pond distance within limits. Drains and spillways operational but needs repair work & cleaning. | ||
| Highlighted Major Risk / Scope required |
Regardless of capacity increase, assessments pointed to stability issues, constraining the opportunity for additional capacity. Increasing capacity is constrained to max of 590 Mt subject to the construction of a large Rockfill buttress to the south of the main wall, with interface filter drainage required. |
Stability assessment update is required urgently to confirm stability in line with GISTM standards. Could infer additional scope for stability improvement dependent on outcome of work. Needs update of 5YP deposition strategy to also infer LOM planning. |
| amcconsultants.com | 274 |
| S-K 1300 TRS: KCM Integrated Operations (Initial Assessment) | |
| Konkola Copper Mines Plc | 0424076 |
| 15.9.3 | Licensing and permitting |
TSF facilities are managed by conducting routine statutory inspections carried out by an independent consultant on TSF facilities in line with compliance with the MMDA No. of 2015, the principal Act, and its subsidiary legislation the Mines and Minerals (Environmental) Regulations, 1997 (Statutory Instrument No. 29 of 1997).
In addition, the reports produced on statutory compliance follows the licensing requirements as provided for under the Zambian EMA of 2011 and its subsidiary legislation the Environmental Management (Licensing) Regulations, 2013 (Statutory Instrument Number 112 of 2013).
| 15.9.4 | Stability and TSF management processes |
KCM tailing management systems are aligned with the GISTM.
Quarterly assessments are conducted by an independent consultant to report on TSF conditions and management. The inspections focus on:
| · | Tailings deposition in the quarter compared to planned targets. |
| · | Pond water management and freeboard, also with focus on stability to deal with rainfall events. |
| · | Beach profile. |
| · | Piezometer readings are taken monthly at strategic locations on TSF dam walls for stability assessment. |
| · | Environmental management is checked with effluent quality and limits of statutory limits of effluent discharge verified. Air quality with regards to dust generation is checked. |
| · | Appurtenant facilities inspected with focus on spillways and canals, wall slopes and toe areas and Filter drains. |
Quarterly reports are accompanied by dashboards highlighting risks, and priority of risks identified during the period of inspection, quarterly reports highlight any deviations from standards and advises remedial actions to be implemented to ensure continued compliance and safety of facilities.
In addition to the mentioned activities for statutory compliance as listed above, KCM also implement the following as part of their TSF Management policy:
| · | Maintaining a robust emergency response system, which includes developing plans in collaboration with local communities and emergency services, as well as conducting regular mock exercises to test their emergency response procedures. |
| · | Avoiding riverine and submarine tailings disposals in new projects. |
| · | Maintaining transparency and building mutual trust with their stakeholders by keeping them informed about tailings are managed and engaging with stakeholders throughout the entire lifecycle of the facilities. |
| · | Working collaboratively with their community partners to develop long-term recovery actions required in case of a tailing's facility failures. |
| · | Review the performance on a periodic basis against their policy including the sharing of good practices throughout the organization and stakeholders. |
| amcconsultants.com | 275 |
| S-K 1300 TRS: KCM Integrated Operations (Initial Assessment) | |
| Konkola Copper Mines Plc | 0424076 |
| 15.10 | Power |
KCM operations primarily draw their power from the CEC which owns and operates electricity transmission infrastructure in the Copperbelt region. CEC primarily purchases electricity from ZESCO, the national power utility in Zambia a state-owned power company. The primary sources of power for the CEC include:
| · | ZESCO is the primary source of power purchased. |
| · | CEC owns thermal power generation assets totalling 80 MW capacity. |
| · | Approximately 34 MW of Solar PV located at Riverside Solar PV park, Kitwe. |
| · | Future plans also include development of a 40 MW hydropower plant in the North-Western province of Zambia. |
| · | There are future KCM plans for renewable energy at Chililabombwe (150 MW) and thermal South Province (150 MW). |
The ZESCO national grid in Zambia is limited geographically and is plagued by an overall supply deficit, with many parts of the country not currently under electrification. The primary source of electricity is hydroelectric, with the rest coming from thermal coal and imports from various neighbouring countries.
Power sources that feed into the ZESCO national grid include:
| · | Hydroelectric power from various hydro power plants including Kariba North Bank, Kafue Gorge, Victoria Falls, ITPC, Lunzua, Lusiwasi Lower, Chishimba Falls, Lunsemfwa Hydro. |
| · | Thermo Coal plant located at Maamba Collieries. |
| · | Imports come from various countries including South Africa, Mozambique, Malawi, and Zimbabwe. |
| · | During times of additional power demand, like during smelter start-ups, or when grid failures occur, emergency power capacity is available through the use of generators. |
Some of the main characteristics of the power transmission system in the area of operations of Konkola Mines include:
| · | Transmission system has various voltage levels including 220 kV, 66 kV, and 11 kV. |
| · | Konkola Mining operations tie into the 66 kV voltage lines at substations located in the towns of Chililabombwe and Chingola. |
| · | At the 66 kV substations, power is stepped down primarily to 11 kV, and in some cases to 33 kV, whereafter power is then distributed to various other KCM operations substations before being stepped down further for use. |
| · | Underground power reticulation is done at 11 kV, whereafter underground substations steps down power further into required final usable voltages. |
| 15.10.1 | Existing operating power supply capacity and expansion |
The existing operations at KCM have a current overall power capacity requirement of approximately 194 MW to fully operate all mining operations and supporting infrastructure. Power is distributed from substations located in Chingola, Chililabombwe, Nampundwe and Kitwe towns.
Power outages are a major threat to operations with emergency power only enough to cover critical loads and not continued operations. During unavailability of grid power, operations cannot continue until power is restored.
To support the expansion of mining operations and supporting infrastructure, power requirements are estimated to increase to approximately 250 MW during the initial development and ramp-up phase (Years 1-10). Power requirements for the steady-state production phase of the full Mineral Resource scenario will be confirmed as part of ongoing infrastructure planning.
| amcconsultants.com | 276 |
| S-K 1300 TRS: KCM Integrated Operations (Initial Assessment) | |
| Konkola Copper Mines Plc | 0424076 |
| 15.10.2 | Emergency power supply and expansion |
Current emergency power is limited to a 24 MW capacity backup power plant located at Konkola mine in Chililabombwe and also includes two generators owned by a utility company in the plant areas which has a combined 20 MW emergency generator capacity. Thus, current total emergency power capacity is around 44 MW installed across the mine locations.
Due to further mine expansions, especially expansions relating to the KDMP underground expansions, more critical infrastructure is being introduced that will require emergency backup power in the event of grid failures. Due to this increased requirement of emergency power, an expansion of the existing backup power plant is planned, increasing the 24 MW capacity by 16 MW with the installation of two additional generators of 8 MW each. This will bring the total capacity of the backup power facility to 40 MW, and the total backup power across the entire operation to 60 MW.
| 15.11 | Water |
Konkola Mine is among the wettest underground mines globally, with recent underground dewatering pumping rates peaking at approximately 360,000 m³/day. Although the Nchanga Underground Mine is not as wet as Konkola, it also experiences substantial water inflow, with pumping rates frequently reaching peaks of around 75,000 m³/day.
The overall raw water balance at Konkola Mine is significantly net positive, primarily due to the substantial water inflow from underground operations at Konkola Mines. Additionally, a large amount of potable water, sourced from a local water services provider, is utilised by various operations and supporting infrastructure.
| 15.11.1 | Raw water |
The primary source of raw water is derived from underground mining dewatering activities at the Nchanga and Konkola Mines. Both mines experience significant water inflows and seepage, necessitating continuous dewatering to maintain access to mining faces. Water is extracted by underground pumping chambers and pumped through mining shafts and brought to the surface.
With the expansion of operations at Konkola through the KDMP, the volume of water inflow is anticipated to increase as mining activities further intersect groundwater aquifers, which will further increase water quantities being pumped to the surface.
| 15.11.2 | Konkola Operations raw water balance |
Konkola Mine's water balance involves discharging approximately 90% of the abstracted raw water from underground dewatering activities (360,000 m³/day) back into surface streams. The water is brought to the surface and discharged into surface channels, which then deposit it into the Kakosa Stream, ultimately leading to the Kafue River.
The remaining water is recirculated and used for various underground services, as process top-up water for the Konkola concentrator plant operations, and approximately 20,000 to 30,000 m³/day is supplied to the Mulonga Water and Sewerage Company, a local water and sewerage service provider. The Konkola Concentrator is reported to have a usage of up to 20,000 m³/day. However recent usage figures of operations show the usage over past few months being closer to around the 5,000 – 8,000 m³/day mark.
A significant portion of the water used in the Konkola Concentrator also eventually ends up in the Lubengele TSF as part of pumped tailings. A large portion of this water is mostly lost due to evaporation, seepage, and overflow, which is directed back to the Kafue River.
| amcconsultants.com | 277 |
| S-K 1300 TRS: KCM Integrated Operations (Initial Assessment) | |
| Konkola Copper Mines Plc | 0424076 |
| 15.11.3 | Nchanga Operations raw water balance |
The Nchanga Operations raw water supply is made up of a combination of water abstracted from the Nchanga Underground Mine and also abstraction from the Kafue River pump station, located just north of Nchanga mining operations. According to recent site water balances from operations, the balance between these sources is close to a 50% split between the two, with fluctuations of around 10% being witnessed on either end. According to recent operational water balance figures, the Nchanga Operations on average used fresh raw water feed of around 120,000 to 140,000 m³/day.
The primary usage of this raw water is for the operations of the Old East Mill, New East Mill and New West Mill. With a large portion of this water ultimately ending up in the Tailings Leaching plant and the Muntimpa tailings storage facility, where it is either lost through evaporation, seepage or overflow into surface level streams. A portion of raw water is also re-directed to the Mulonga water treatment plant.
| 15.11.4 | Potable water (domestic water) |
Potable water supply and infrastructure around Chingola, Mufulira, and Chililabombwe is provided by The Mulonga Water and Sewerage Company (MWSC). The existing infrastructure is aging and most of it has been in operation for about 50 years but still manages to provide the various operations with domestic water supply. In recent years local planned projects being led by MWSC is aiming to upgrade water treatment plants, pump stations, reservoirs and supply and transfer piping in the distribution network. According to recent operational water balances Nchanga Operations has used on average between 800 – 900 m³ of domestic water per day in the last few months of 2024 and beginning of 2025, a figure that seems to have steadily declined over the years from usage figures reported as far back as 2019. The Konkola operations is reported to use around anything from 1,500 up as high as 8,000 m³/day of domestic water, based on operational water balances from the last few months of 2024 and beginning of 2025. A value that seems to be fluctuating heavily on a month-by-month basis.
| 15.12 | Pipelines |
Operations do not rely heavily on services from overland pipelines, except for lines running to and from TSF at Lubengele and Muntimpa (TD05).
At Lubengele tailings is transported to the TSF from the Konkola Concentrator plant by an approximately 5 km line running north through the town of Chililabombwe in the same corridor as railway infrastructure. Because of deposition locations that can change depending on TSF management, this distance can vary over time.
Another tailings pipeline, running more on the outskirts of the town connects the Konkola concentrator plant and the operations at 3 Shaft just north of the concentrator plant. This line is approximately 3 km in length. These lines are running mostly on surface with a few culvert crossings along the way where roads are intersected.
A new return line is also planned to run between the paste plant at 3 Shaft and the Lubengele TSF. This new line will be approximately 3 km in length but would be subject to final design.
At the Nchanga Operations, the main pipeline being utilised is a pipe corridor that connects TD05, Muntimpa and the process operations at Nchanga mine. Depending on final deposition location at the TSF, this pipeline is estimated to be around 8-9 km in length and is used for transporting tailings.
| 15.13 | Ancillary surface infrastructure and expansions |
As an existing operation, supporting infrastructure is in place to support current operations at the various mining and processing facilities which include:
| amcconsultants.com | 278 |
| S-K 1300 TRS: KCM Integrated Operations (Initial Assessment) | |
| Konkola Copper Mines Plc | 0424076 |
| · | Various process plant infrastructure at Konkola & Nchanga Concentrators plants, Old East Mill, New East Mill, New West Mill, Nchanga TLP, Nchanga Smelter, and the Nkana Refinery. |
| · | Warehouses, maintenance shops, administration offices and other supporting infrastructure at the various facilities. |
| · | Other supporting infrastructure, various service workshops, wash bays, explosive storage sheds, water treatment plant. |
| · | Existing network of access and in in-plant roads, and railway infrastructure. |
| · | Water supply and distribution systems. |
| · | Existing power supply infrastructure including various substations for grid power tie-in, and power reticulation and distribution to existing operations. |
| · | Tailing storage facilities and paste backfill plants. |
Following the implementation of the revival plan to restart operations, and ramp up production at existing operations , to support ongoing operations of mining at Konkola’s 4 Shaft, the KDMP is also undertaken as an intensive brownfields capital upgrade project not only including underground expansions of mining and underground infrastructure, but also expansion of surface infrastructure which will include the development of additional surface level supporting infrastructure for mining operations at Shaft No.4. These upgrade items include:
| · | Various surface infrastructure including warehouses, maintenance workshops, administration offices, kitchen and canteen, clinic, and change houses. |
| · | Network of surface roads and railways. |
| · | Network of surface canals. |
| · | Upgrade of emergency power capacity. |
| 15.13.1 | Internal rail network |
The rail system envisaged will be constructed to connect with No.1 shaft existing rail infrastructure and will service all five conveyance compartments. The rail system will also interconnect the newly planned workshops, storage areas and hard standings. The rail system will also include marshalling yard.
| 15.13.2 | Office building |
An administration building is provided for within the surface infrastructure. A three-story brick building shall be provided to include:
| · | Large open plan office space on all 3 levels for approximately 340 people total. |
| · | Central control room on ground level. |
| · | 1x boardroom on ground level. |
| · | Kitchen facilities on all floors. |
| · | Reception area on ground level. |
| amcconsultants.com | 279 |
| S-K 1300 TRS: KCM Integrated Operations (Initial Assessment) | |
| Konkola Copper Mines Plc | 0424076 |
| 15.13.3 | Change houses and other buildings |
Other supporting infrastructure for staff will include change houses with shower, laundry and locker room access, and to provide other services as follows:
| · | Managerial change house |
| · | General payroll change house |
| · | Lamp houses with racks to house approximately 1,000 cap lamps |
| · | Kitchen and tea-room |
| · | Banksman’s cabin |
| · | Winder and raise bore workshop |
| · | Explosives storage shed |
| · | Diesel storage |
| · | Parking areas |
| · | Storage sheds (wire rope, skip and sheave, roper reeler) |
| · | Hard standings and waste bin areas |
| · | First aid clinic |
| 15.13.4 | Infrastructure related to life of mine expansions |
The KCM LOM plan comprises operations under both the M&I Case and the Full Resource Case. Beyond the Konkola Mine expansion project, the Konkola Deep Mining Project, and the reclamation of TD03 and TD04 through hydro mining, all included in the M&I Case, the Full Resource Case additionally considers:
| · | TD05 Mineral Resource reclamation via the proposed TLP 2 facility (refer Section 14.5) |
| · | Konkola Mine Inferred Resources |
| · | COP E, D & F |
| · | Nchanga Open Pit |
| amcconsultants.com | 280 |
| S-K 1300 TRS: KCM Integrated Operations (Initial Assessment) | |
| Konkola Copper Mines Plc | 0424076 |
| 16 | Market studies and contracts |
Copper demand is expected to remain strong due to electrification, the energy transition, AI infrastructure build-out, and continued urbanisation and industrialisation in emerging economies. KCM sells refined copper through established market channels with pricing based on LME copper prices. The approximately 45-year mine life presented in this IA provides long-term exposure to forecast copper demand growth.
| 16.1 | Market information |
Copper is a transition metal known for several distinctive properties – it is highly malleable, ductile, a notably good conductor of thermal and electrical energy, and does not readily corrode. These properties make copper especially useful for the manufacture of electrical wires; it is also widely used for piping, building material, and in alloys.
Copper is relatively abundant in the earth's crust, particularly in the South American Andes and the Central African Copperbelt. Copper concentrates and cathode are the most widely traded and shipped forms of the metal, the latter being made by purification of copper ores or scrap metal via smelting and/or electrowinning. Cathode takes the form of high (>99.5%) purity metal sheets, which can be directly processed by downstream manufacturers.
Cobalt is a ferromagnetic transition metal that historically was extensively used in blue pigments. Modern use is predominantly in "superalloys" that are resistant to wear, corrosion, and high temperatures, and – since the 1990s – in lithium-ion batteries (principally nickel-cobalt-manganese (NCM) chemistries used in higher-energy-density electric vehicle applications).
The large majority of the world's exploitable cobalt deposits are found in the Central African Copperbelt, where it is typically found alongside copper-containing ores. Crude cobalt hydroxide is the most widely traded and shipped form, alongside refined products such as cobalt metal and pure cobalt nitrate, sulfate, or hydroxide.
| 16.1.1 | Market for KCM’s products |
KCM's assets form an integrated mine-concentrator-smelter-refinery complex, the end products of which are (and will continue to be) copper anode, copper cathode, and Co-Cu alloy. Since the smelter is a separate business unit, for the purpose of this study the marketed products are copper sulfide concentrates and copper-cobalt concentrates (produced by the concentrator and Nchanga TLP).
| 16.1.2 | Copper demand |
Demand elasticity: Copper demand is strongly dependent on prevailing global economic conditions, with consumption dominated by Asia and China alone accounting for approximately 58% of global refined copper usage in 2024. Growth in demand is influenced by the rate of economic and technological development, urbanisation, mechanisation, electrification, digitisation, the transition to renewable energy sources, and increasingly the build-out of AI infrastructure and data centres
Because of copper's unique physical properties, it is not readily substituted as an electrical conductor, hence demand has a significant impact on price. It is primarily traded in US$, so exchange rates may also influence price independently of underlying macroeconomic demand.
Short-term demand (2026–2027) will be primarily influenced by Chinese, US, and European economic conditions, the trajectory of the China property sector recovery, the impact of US tariff policy on global trade flows (a US Commerce Department recommendation on refined copper tariffs is expected by mid-2026), the pace of AI and data centre infrastructure build-out, and global EV adoption rates.
| amcconsultants.com | 281 |
| S-K 1300 TRS: KCM Integrated Operations (Initial Assessment) | |
| Konkola Copper Mines Plc | 0424076 |
Medium-term demand is expected to grow at approximately 2.5-3.0% per annum to 2030, supported by accelerating energy transition demand, AI infrastructure, and continued industrialisation in India and Southeast Asia. The ICSG forecasts global refined copper consumption growth of approximately 2.1% in 2026, slowing from 3% in 2025, with the market transitioning to a structural deficit.
Long-term demand for copper will be heavily influenced by the success of the energy transition, the scale of AI and data centre build-out, and emerging demand from India and Southeast Asia. Wood Mackenzie projects AI infrastructure alone could require approximately 1.1 Mtpa of copper for grid-related needs by 2030, while India and Southeast Asia industrialisation could add approximately 3.3 Mtpa of demand by 2035. Unlike metals such as nickel and cobalt, copper is agnostic to changes in battery technology. Estimates vary, but many sources expect total copper demand to reach 45-50 Mt by 2050.
| 16.1.3 | Copper supply |
The ICSG reports 2024 global copper production at approximately 23.0 Mt of mined output and 27.5 Mt of refined copper. Preliminary 2025 figures indicate mine production grew approximately 1% (constrained by operational disruptions at Grasberg in Indonesia and Kamoa in DRC) and refined production grew 4.2%, leaving an estimated refined market surplus of 380 kt. For 2026, ICSG forecasts mine production growth of 2.3% and refined production growth of 0.9%, with the market transitioning to a forecast 150 kt refined deficit.
Supply elasticity: Copper supply is inelastic due to the very long timescales (often 10+ years) and large financial commitments required to bring new mines into production, expand existing sites, or restart mothballed facilities. This slow supply-side response can create significant short-term price volatility even when medium-term supply is broadly balanced, as illustrated by the record LME copper price of approximately US$13,388/t reached in early January 2026, driven by a combination of supply disruptions, low exchange inventories, and rising demand expectations
Short-term supply (2026–2027) is expected to remain tight, with the global concentrate market continuing to face deficit conditions. Key factors include:
| · | The ongoing closure of FQM's Cobre Panamá mine (which produced 350 kt of copper in 2022 prior to suspension in November 2023). In April 2026, the Government of Panama formally approved processing of approximately 38 Mt of stockpiled ore at the site (containing approximately 70 kt of recoverable copper), and a decision on the broader mine restart is anticipated by mid-2026, with S&P Global Ratings expecting a restart and ramp-up during the second half of 2026. |
| · | Continuing impacts from operational disruptions at Grasberg (Indonesia) and Kamoa (DRC) reported in 2025. |
| · | Robust Chinese smelter capacity additions, with concentrate treatment charges having fallen to record lows. |
| · | Limited greenfield production growth, with relatively few large projects in advanced stages of development. |
Medium-term, S&P Global, Wood Mackenzie, ICSG, and major investment bank forecasts converge on a structural copper market deficit emerging in 2026 and persisting through the late 2020s and 2030s, with JP Morgan forecasting a deficit of approximately 330 kt in 2026 alone and ICSG forecasting 150 kt. Despite the contribution of brownfield expansions, scrap recycling, and improved leaching technologies, supply growth is unlikely to keep pace with structural demand growth.
Long-term supply (2030 onwards) is widely expected to remain in deficit. By 2035, the world's existing mines are expected to produce approximately 15% less copper than in 2024, with Wood Mackenzie estimating that meeting projected demand will require approximately 8 Mt of new mine capacity plus 3.5 Mt of additional scrap. A limited number of greenfield projects have been confirmed, leaving copper supply in the 2030-2050 period significantly dependent on metals prices - higher prices being required to justify the very large amounts of capital needed for greenfield and brownfield expansion.
| amcconsultants.com | 282 |
| S-K 1300 TRS: KCM Integrated Operations (Initial Assessment) | |
| Konkola Copper Mines Plc | 0424076 |
| 16.1.4 | Cobalt demand |
Global cobalt demand has grown rapidly over the past decade, from approximately 80 kt in 2014 to >190 kt in 2024, driven primarily by the increasing demand for electric vehicles (EVs) and renewable energy technologies.
The rise of lithium-iron-phosphate (LFP) batteries in EV applications has suppressed demand for cobalt chemicals, and global cobalt prices declined sharply through 2023 and 2024 to multi-decade lows in early 2025 prior to the DRC export restrictions. However, cobalt remains crucial for battery stability and performance in NCM chemistries, which retain a substantial share of the EV battery market and dominate in higher-energy-density applications. The IEA projects cobalt demand will rise to 344,000 metric tonnes in 2030 and 454,000 metric tonnes in 2040, supporting cobalt's continued importance in the energy transition.
| 16.1.5 | Cobalt supply |
Global cobalt mined production reached approximately 280 kt in 2025, with the Democratic Republic of Congo (DRC) continuing to account for more than 70% of global supply. Following a period of cobalt market oversupply that drove prices to nine-year lows in early 2025, the DRC government implemented a series of supply restrictions:
| · | February 2025: Complete cobalt export ban imposed (initially 4 months, subsequently extended). |
| · | October 2025: Export ban lifted on 16 October and replaced with a quota system that will remain in place through at least 2027. |
| · | Q4 2025 quota: 18,125 tonnes (subsequently extended through end-Q1 2026 and again to April 2026 due to logistical and administrative bottlenecks). |
| · | 2026 quota: 87,000 tonnes for all DRC producers, with an additional 9,600 tonne strategic reserve at the discretion of the regulator ARECOMS. |
| · | 2027 quota: 96,600 tonnes. |
As at 1 April 2026, less than 50% of allocated Q4 2025 / Q1 2026 export volumes are estimated to have shipped, due to logistical disruptions including infrastructure damage and administrative delays in implementing the new quota framework.
The combination of restricted supply and structural demand growth has driven cobalt prices to multi-year highs. The DRC quota system is widely expected to maintain a structural supply deficit in cobalt markets through 2026 and 2027.
In the medium term, Australian and Indonesian producers are projected to ramp up production, partially offsetting DRC supply constraints. In the longer term, expansions in copper and nickel mining will further boost cobalt supply, since cobalt is typically found alongside copper- and nickel-containing ores.
| 16.1.6 | Study price and sales terms |
Copper pricing: The copper price used in the cashflow analysis of this report is based on P75 consensus price forecasts (as at March 2026). P75 represents the 75th percentile of analyst forecasts, meaning 75% of forecasts are at or below this price level. The pricing ranges from US$11,101/t to US$12,793/t over the LOM production period, with long-term prices from 2032 onwards at US$11,101/t. These forecasts are shown in Table 16.1. Table 16.2 shows five years of trailing prices.
| amcconsultants.com | 283 |
| S-K 1300 TRS: KCM Integrated Operations (Initial Assessment) | |
| Konkola Copper Mines Plc | 0424076 |
Table 16.1 Five-year copper forward prices (real US$ 2025)
| Year | 2026 | 2027 | 2028 | 2029 | 2030 | 2031 | 2032 + LT | |||||||||||||||||||||
| Price (US$/tonne) | 12,793 | 12,556 | 12,297 | 12,295 | 11,848 | 11,101 | 11,101 | |||||||||||||||||||||
Source: S&P Global Capital IQ Dec 2025 forecast.
Table 16.2 Five-year copper trailing prices
| Year | 2020 | 2021 | 2022 | 2023 | 2024 | 2025 | ||||||||||||||||||
| Price (US$/tonne) | 6,175 | 9,317 | 8,822 | 8,490 | 9,250 | 9,940 | ||||||||||||||||||
Note: The 3-year trailing average is US$9,227/tonne (2023 – US$8,490/t; 2024 – US$9,250; 2025 – US$9,940/t).
Source: Statista, 2025.
Copper payability: Copper payability rates are taken from current internal Konkola and Nchanga rates. These are shown in Table 16.3. Treatment, refining and freight charges are taken from long term recent consensus forecasts within Africa however it should be noted that these are higher than current consensus forecasts in China where treatment and refining charges are currently forecast at $20/dmt and US$0.02/lb respectively and forecast to rise towards $67/dmt and US$0.07/lb in the long term. Current low treatment and refining charges put the smelters profitability at risk in the short-term.
Table 16.3 Copper payability terms for Konkola and Nchanga Copper Concentrate
| Item | Unit | Konkola | Nchanga TLP | |||||||
| Copper Payability | % | 96.75 | 100.00 | |||||||
| Treatment Charge and premium adjustments | US$/dmt | 60 | 179 | |||||||
| Refining Charge | US$/lb | 0.06 | - | |||||||
| Freight Charge | US$/wmt | 175 | 180 | |||||||
Cobalt pricing: Cobalt is contained in the Copper-Cobalt Concentrates produced but is not recognised as revenue within the Konkola and Nchanga mines. Cobalt alloy is recovered at the Nchanga Smelter where revenue is recognised. The cobalt value is recognised in the NSR calculations, at low payability rates, when assessing cut-off decisions. Payable rates for contained Copper and Cobalt within the Cobalt alloy are based on current short-term contracts with a sliding scale based on the Copper and Cobalt percentages contained within the alloy.
Pricing note: Commodity price forecasting is an inherently forward-looking exercise dependent upon numerous assumptions. Natural volatility in the copper and cobalt markets due to supply and demand factors, government export regulations, and developments in battery technology means that future copper and especially cobalt prices will move significantly above and below the selected study price over the expected approximately 45-year life of the Project. In light of this expected volatility, the chosen prices represent transparent, neutral price point both in line with historical pricing and with expected long-term pricing. AMC and KCM take no responsibility for future metals pricing.
| 16.1.7 | Copper pricing for NSR cut-off grade estimation |
The copper price used for NSR cut-off grade determination is US$10,000 per tonne, applied consistently across all sulfide and mixed sulfide and oxide copper mineralisation. This price is intentionally conservative relative to the study price (Section 16.1.6) to ensure Mineral Resources reflect a robust reasonable prospect for eventual economic extraction across a range of market conditions. The NSR methodology, input parameters, and resulting cut-off grade by asset are set out in Section 11.2.2.
| amcconsultants.com | 284 |
| S-K 1300 TRS: KCM Integrated Operations (Initial Assessment) | |
| Konkola Copper Mines Plc | 0424076 |
| 16.2 | Contracts and status |
| 16.2.1 | Forward sales and hedging |
KCM currently does not engage in forward sales for the minerals produced.
| 16.2.2 | Site development contracts |
KCM will need to enter into a variety of contracts to develop the site expansion. As a brownfield expansion, certain contracts covering existing operations can be extended to cover the development areas (e.g. utilities, security, waste disposal). Some design work has already been contracted and carried out, but most construction contracts are still to be awarded.
Major proposed contracts for development are show in Table 16.4.
Table 16.4 Major development contracts
| Area | Major contracts |
| Ops & Maintenance – Underground Mining | Drilling & Blasting – currently contracted |
| Backfill | |
| Production – currently contracted | |
| Development & Materials handling – currently contracted | |
| Ventilation | |
| SIB Projects | |
| Professional & Technical Services | |
| Equipment Maintenance – locomotive maintenance contracted; UG production machinery maintenance contracted | |
| Building Maintenance | |
| Other | |
| Ops & Maintenance – Open pit Mining | Drilling & Blasting |
| Production – Rehandle at Old East Mill and L&H from TD03 and TD04 currently contracted | |
| Development – COP DF currently contracted | |
| SIB Projects | |
| Professional & Technical Services | |
| Equipment Maintenance | |
| Building Maintenance | |
| Other | |
| Ops & Maintenance – Concentrator, Smelter, SXEW | Production Operations |
| Professional & Technical Services | |
| Equipment Maintenance | |
| Building Maintenance | |
| Other | |
| Ops & Maintenance – Tailings Facilities | Operations – material movement contracted |
| Professional & Technical Services | |
| Equipment Maintenance | |
| Ops & Maintenance – Infrastructure, Utilities, Civil Works | Fuel Farm / Emergency Power Station |
| Electrical Infrastructure | |
| Water (supply / treatment) Infrastructure | |
| Dewatering Infrastructure – UG pump ops & maintenance contracted. Piping unknown | |
| Data / telecoms / surveillance / security Infrastructure | |
| Air and Ventilation Plants & Infrastructure | |
| Lighting Infrastructure | |
| Roads Infrastructure | |
| Warehouse / Transport / Logistics Infrastructure | |
| Other Infrastructure (e.g. fire suppression systems) |
| amcconsultants.com | 285 |
| S-K 1300 TRS: KCM Integrated Operations (Initial Assessment) | |
| Konkola Copper Mines Plc | 0424076 |
| Area | Major contracts |
| Ops & Maintenance – Ancillary Plants (e.g. cement, acid) | Cement / Paste backfill plant |
| Acid plant | |
| Lime Plant | |
| Ops & Maintenance – Supply Chain, Procurement & Logistics | Inbound transport & clearing |
| Outbound transport & clearing | |
| Other | |
| Ops & Maintenance – Camp & Site Services | Catering |
| Housekeeping, cleaning & laundry | |
| Pest Control | |
| Landscaping | |
| Transport (within site and local) | |
| Clinic & OT | |
| Entertainment & Leisure | |
| Admin, Leisure, Residential & Security Buildings Maintenance | |
| Security & Surveillance services | |
| Emergency Response services | |
| Waste Disposal (biological, chemical, industrial) | |
| Environmental & Biodiversity Monitoring | |
| Health & Safety Monitoring | |
| Social and Community Services | |
| Ops – General & Administrative | Legal Services |
| Finance, Audit, Risk Services | |
| HR, Recruitment, Payroll Services & work permits | |
| International Travel & Visas | |
| Training & Educational | |
| IT services | |
| Professional Services & other G&A – | |
| Key Consumables & Reagents | Concentrates |
| Scrap Copper | |
| Diesel Fuel | |
| Reagents (e.g. acid, lime, floccs) | |
| Explosives | |
| Grinding Media | |
| Cement | |
| Ground Engaging Tools | |
| Other | |
| Power & Other utilities supply | Electricity – ESP in place with ZESCO till 2035 |
| Water | |
| Data & Telecommunication | |
| Other | |
| Equipment Rental | Underground Equipment |
| Open pit Mining Equipment | |
| TMF Equipment | |
| Processing Equipment | |
| Logistics Equipment | |
| Maintenance, SIB & Civils Equipment | |
| Pumps & Generators | |
| Other Equipment (LVs, buses, ERT, landscaping) |
| amcconsultants.com | 286 |
| S-K 1300 TRS: KCM Integrated Operations (Initial Assessment) | |
| Konkola Copper Mines Plc | 0424076 |
| 16.2.3 | Operating contracts |
The current major long-term contracts in place at Konkola and / or Nchanga include:
| · | Underground mining – drill and blast, production, development, materials handling, locomotive maintenance, machinery maintenance. |
| · | Open pit mining – load & haul of material from TD03 and TD04, rehandle at Old East Mill, Nchanga open pit zones COP DF. |
| · | Dewatering pump operations and maintenance. |
| · | TSF material movement. |
| · | Power. |
Table 16.5 Example of long-term contract components
| Area | Major contracts | |
| Ops & Maintenance – Underground Mining |
Drilling & Blasting – currently contracted Backfill Production – currently contracted Development & Materials handling – currently contracted Ventilation SIB Projects Professional & Technical Services Equipment Maintenance – locomotive maintenance contracted; UG production machinery maintenance contracted Building Maintenance Other | |
| Ops & Maintenance – Open pit Mining |
Drilling & Blasting Production – Rehandle at Old East Mill and L&H from TD03 and TD04 currently contracted Development – COP DF currently contracted SIB Projects Professional & Technical Services Equipment Maintenance Building Maintenance Other | |
| Ops & Maintenance – Concentrator, Smelter, SXEW |
Production Operations Professional & Technical Services Equipment Maintenance Building Maintenance Other | |
| Ops & Maintenance – Tailings Facilities |
Operations – material movement contracted Professional & Technical Services Equipment Maintenance | |
| Ops & Maintenance – Infrastructure, Utilities, Civil Works |
Fuel Farm / Emergency Power Station Electrical Infrastructure Water (supply / treatment) Infrastructure Dewatering Infrastructure – UG pump ops & maintenance contracted. Piping unknown Data / telecoms / surveillance / security Infrastructure Air and Ventilation Plants & Infrastructure Lighting Infrastructure Roads Infrastructure Warehouse / Transport / Logistics Infrastructure Other Infrastructure (e.g. fire suppression systems) | |
| Ops & Maintenance – Ancillary Plants (e.g. cement, acid) |
Cement / Paste backfill plant Acid plant Lime Plant | |
| Ops & Maintenance – Supply Chain, Procurement & Logistics |
Inbound transport & clearing Outbound transport & clearing Other | |
| Ops & Maintenance – Camp & Site Services |
Catering Housekeeping, cleaning & laundry Pest Control Landscaping Transport (within site and local) Clinic & OT Entertainment & Leisure Admin, Leisure, Residential & Security Buildings Maintenance Security & Surveillance services Emergency Response services Waste Disposal (biological, chemical, industrial) Environmental & Biodiversity Monitoring Health & Safety Monitoring Social and Community Services |
| amcconsultants.com | 287 |
| S-K 1300 TRS: KCM Integrated Operations (Initial Assessment) | |
| Konkola Copper Mines Plc | 0424076 |
| Area | Major contracts | |
| Ops – General & Administrative |
Legal Services Finance, Audit, Risk Services HR, Recruitment, Payroll Services & work permits International Travel & Visas Training & Educational IT services Professional Services & other G&A – | |
| Key Consumables & Reagents |
Concentrates Scrap Copper Diesel Fuel Reagents (e.g. acid, lime, floccs) Explosives Grinding Media Cement Ground Engaging Tools Other | |
| Power & Other utilities supply |
Electricity – ESP in place with ZESCO till 2035 Water Data & Telecommunication Other | |
| Equipment Rental |
Underground Equipment Open pit Mining Equipment TMF Equipment Processing Equipment Logistics Equipment Maintenance, SIB & Civils Equipment Pumps & Generators Other Equipment (LVs, buses, ERT, landscaping) |
| 16.2.4 | Other agreements and contracts |
As a condition of the commercial and licensing agreement with the Government of Zambia, mining and processing production is subject to a royalty on copper (depending on the copper spot price). Mining and processing operations are also subject to 30% Corporate Income Tax, from which the royalty tax is deductible (see Table 16.6).
Table 16.6 Royalty charge relation to copper price
| Price range | Rate (%) | Taxable amount | ||
| Less than US$4,000 per tonne | 4.0 | The first US$4,000 per tonne | ||
| Between US$4,001 and US$5,000 per tonne | 6.5 | The next US$1,000 per tonne | ||
| Between US$5,001 and US$7,000 per tonne | 8.5 | The next US$2,000 per tonne | ||
| US$7,001 per tonne or more | 10.0 | Balance |
| 17 | Environmental studies, permitting, and plans |
KCM operates under environmental permits issued by the ZEMA. Environmental management programs are in place for tailings, water quality, air emissions, and closure planning. The existing environmental approvals and management frameworks are expected to support the approximately 45-year mine life presented in this Initial Assessment, subject to periodic renewal and updates as operations progress.
| 17.1 | Environmental studies, permitting, and social or community impact |
Currently, the identified environmental and social risks, baseline information, and management measures for the Project are based on a 2001 site-wide comprehensive ESIA assessment and associated Final Environmental Management Plan (FEMP), subsequently updated in 2009. Closure plans and associated cost estimates have historically been derived from these 2009 FEMPs, supported by annual statutory audits. To strengthen compliance and provide an updated position, KCM commissioned an independent third-party assessment of EPF liabilities as at 31 December 2025, which assessed the total EPF liability at US$144M. The 2024 Zambian closure guidelines introduced enhanced requirements for long-term monitoring, water treatment, and community transition support, the financial implications of which have been incorporated into the December 2025 assessment. Estimated closure costs of US$133M for the Full Resource Case and US$133M for the M&I Case, based on preliminary closure planning, have been included in the economic analysis presented in Section 19 and may be refined as the updated closure plans are finalised.
Although still valid, the 2001/2009 baseline ESIA reports and management plans are no longer fully relevant to the current and proposed activities and do not accurately reflect the status of the operations (including demolished or decommissioned infrastructure). KCM has identified this risk and has commenced a consolidated update to reassess impacts and mitigation measures across all sites. New comprehensive ESIAs, Environmental and Social Management Plans (ESMPs), and Closure Plans are being prepared for all unit operations, with completion targeted for end of 2026.
KCM routinely engages with the national regulators to ensure it maintains a set of valid licenses and authorisations. Permitting and approvals encompass ESIA approvals, water access and discharge, emissions to atmosphere, waste, and other specific requirements, as well as exploration, mining, and processing licenses. As a member of the International Council on Mining and Metals (ICMM), KCM is in the process of aligning its tailings management practices with the Global Industry Standard on Tailings Management (GISTM, August 2020). Key elements - including independent reviews, emergency response planning, and stakeholder engagement - are in place, with full conformance targeted by end of 2027.
KCM operations are characterised by high water inflows, with the assets known as among the wettest mining operations in the world. Tailings dams have historically been encroached upon by communities who either reside in close proximity to the dams or plant seasonal crops within the tailings footprint due to a lack of alternative land. The socio-economic environment presents challenges common to a declining industry, exacerbated by a characteristic local dependency on mining activity. Additionally, artisanal manual and mechanised illegal mining occurs within the premises of KCM's Nchanga Operations.
Actions to address Restoration Orders and Compliance Orders issued by ZEMA from 2017 to address major non-compliances remain in progress. KCM has established action plans and expects progressive resolution through 2026 and 2027. These matters do not currently affect the validity of operating permits.
KCM is actively engaged in updating Environmental Impact Assessments and Closure Plans for all KCM operations. Progress, stakeholder communications, and reporting are managed by the KCM environmental management team. Environmental and Social Management Plans and Closure Plans for all KCM sites have been submitted to ZEMA.
| amcconsultants.com | 288 |
| S-K 1300 TRS: KCM Integrated Operations (Initial Assessment) | |
| Konkola Copper Mines Plc | 0424076 |
| 17.2 | Permitting requirements |
KCM operations are governed by Zambia’s Mining and Minerals Development Act (2015) and associated environmental and labour regulations.
The Konkola operation is currently permitted under a valid Large-Scale Mining License 7076-HQ-LML, with Nchanga Operations permitted under license 7075-HQ-LML. These licenses allow for underground or open pit and underground copper extraction respectively, and associated processing activities through to March 2050.
Environmental approvals are in place through the EPF and project-specific Environmental Management Plans (EMPs), which govern water management, tailings disposal, and rehabilitation obligations. KCM maintains active compliance with these requirements through regular monitoring, internal audits, and reporting to the ZEMA.
Additional permits cover water abstraction, effluent discharge, and waste handling. Social and land-use agreements have been established with local communities to address resettlement, access, and stakeholder engagement obligations. These agreements are managed through structured compensation and sustainability programs.
No material permitting constraints are currently identified that would prevent continued operation under the current LOM plan. However, the renewal of certain licenses and approvals will require periodic reassessment to align with project expansion, infrastructure upgrades, and future resource development.
The current Large-Scale Mining Licenses expire in March 2050. For the full Mineral Resource scenario extending to approximately FY2069/70, license renewals will be required. Under the Zambia Mining and Minerals Development Act (2015), license renewals are routinely granted for operations in good standing, and KCM does not anticipate material constraints to renewal.
| 17.3 | Rehabilitation, closure, and post closure planning |
KCM has prepared updated closure plans in line with the IFC Environmental and Social Performance Standards which are currently pending before ZEMA. Closure plans address physical and socio-economic closure. The closure plans have been developed through a process of closure framework establishment, stakeholder consultation, and closure cost estimation.
The KCM operations are long-life operations, and closure plans will be subject to ongoing review as the operations progress. KCM aims to conduct progressive rehabilitation during the operational phase without hindering regular mining activities in areas no longer affected by mining operations.
Estimated closure costs of US$133M have been included in the economic analysis (refer Section 19), based on preliminary closure planning. The independent third-party assessment of EPF liabilities as at 31 December 2025 assessed the total EPF liability at US$144M, incorporating the enhanced requirements introduced by the 2024 Zambian closure guidelines for long-term monitoring, water treatment, and community transition support. Updated comprehensive closure cost estimates will be finalised following ZEMA approval, and closure plans may be refined in subsequent studies.
| amcconsultants.com | 289 |
| S-K 1300 TRS: KCM Integrated Operations (Initial Assessment) | |
| Konkola Copper Mines Plc | 0424076 |
| 18 | Capital and operating costs |
This section presents capital and operating cost estimates for the approximately 45-year life of mine of the KCM Integrated Operations. All cost figures are in real 2026 US dollars (1 April 2026 base date) unless otherwise stated. Cost estimates have been developed at varying study levels for individual asset components, ranging from Pre-Feasibility for the established Konkola and Nchanga TLP operations to Scoping Study or Concept level for the new underground projects (Nchanga COP E and COP DF) and the future TLP capacity expansion. A summary of the accuracy ranges and contingency allowances applied to each component is set out in Section 18.8. The overall confidence in the economic assessment is at an Initial Assessment level.
| 18.1 | Konkola Mine operating cost estimate |
The Konkola Mine operating cost estimate has been developed using a combination of historical site data, the FY2026/27 budget, current contractor agreements with KCM’s mining business partners (Hahne, Tauro, Opermin, Reliant, and AAC), and AMC’s benchmarking against comparable underground operations in the Central African Copperbelt. Operating cost categories comprise mining (production stoping, operating development, underground rail tramming, mine services, backfill, and dewatering), processing, KCM-direct labour, power, mill consumables and freight, stores and spares, site administration, and corporate overheads.
Operating development and stoping production are completed under contractor agreements at activity-based rates; for development profiles where established rates were not available, AMC developed proxy estimates based on comparable cross-section dimensions and expected ground support requirements. Power is supplied under a long-term agreement with Copperbelt Energy Corporation, supplemented by ZESCO grid power; the tariff structure assumed in the model reflects a transition from the current elevated import tariff back to a standard tariff structure from FY2030/31 onwards as drought-related grid constraints ease. Backfill is delivered through a new paste fill plant supplying both surface batching and underground reticulation, with the binder cost forming the principal operating cost component. Underground rail tramming has been costed at US$2.85 per tonne of rock moved, supported by an internal productivity assessment and review against the Costmine reference database. KCM-direct labour costs reflect the FY2026 organisation structure and tiered wage rates provided by the Registrant. Other operating cost categories (mill consumables, mine services, stores and spares, freight, water, site administration, and corporate overheads) have been estimated from the FY2026/27 budget, held broadly flat across the life of mine where appropriate, with consumption-based scaling applied to power and mill reagents.
The Konkola Mine LOM operating cost build-up by major cost line is summarised in Table 18.1. Production stoping, power, processing, and operating development together account for approximately 81% of total Konkola Mine operating cost. The LOM-average unit operating cost is US$94.3 per tonne of ore feed to mill.
Table 18.1 Konkola Mine cost build-up
| Cost line | LOM total (US$M) | Unit cost (US$/t ore) | ||||||
| Production Stoping | 6,477 | 27.8 | ||||||
| Operating Development | 2,819 | 12.1 | ||||||
| Backfill Operations | 366 | 1.6 | ||||||
| Power Costs | 5,057 | 21.7 | ||||||
| KCM Laour (direct) | 1,344 | 5.8 | ||||||
| G&A | 1,195 | 5.1 | ||||||
| Mine Services | 313 | 1.3 | ||||||
| Tramming | 852 | 3.7 | ||||||
| Mining Opex Subtotal | 18,423 | 79.1 | ||||||
| Processing Costs | 3,524 | 15.1 | ||||||
| Total Konkola Miner Operating Cost | 21,948 | 94.3 | ||||||
Source: AMC, 2026.
| amcconsultants.com | 290 |
| S-K 1300 TRS: KCM Integrated Operations (Initial Assessment) | |
| Konkola Copper Mines Plc | 0424076 |
Figure 18.1 Konkola Mine operating cost profile for LOM schedule
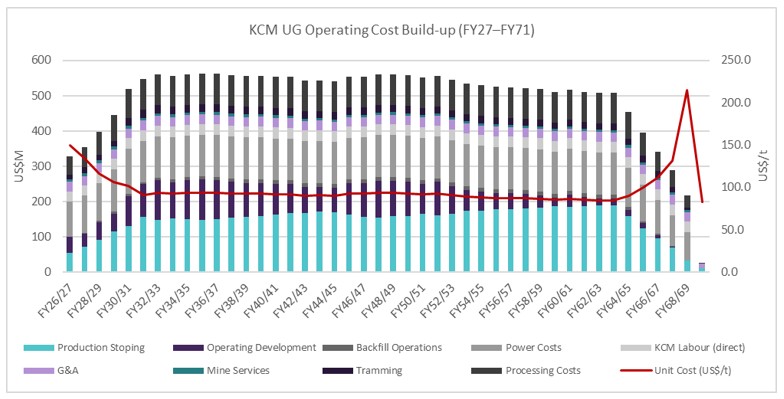
Source: AMC, 2026.
Figure 18.2 Konkola LOM split by activity
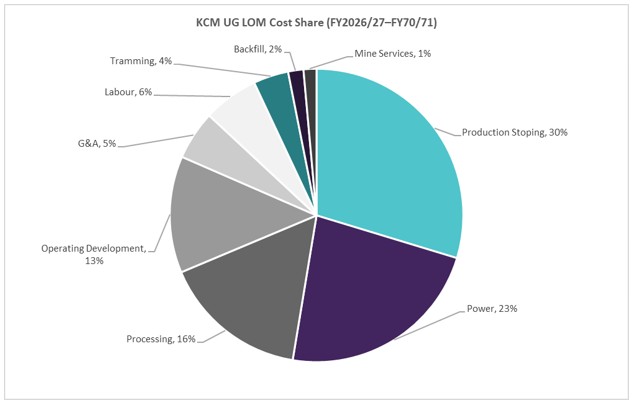
Source: AMC, 2026.
| 18.2 | Nchanga Business Unit operating cost estimate |
The Nchanga Business Unit operating cost has been built up by activity, comprising:
| amcconsultants.com | 291 |
| S-K 1300 TRS: KCM Integrated Operations (Initial Assessment) | |
| Konkola Copper Mines Plc | 0424076 |
| · | Mining cost for the existing tailings reclamation operations at Tailings Dams 3 and 4, processed through the Nchanga TLP. |
| · | Mining cost for the new underground projects (COP E, COP DF) and the residual COP DF open pit. |
| · | Processing cost across the three Nchanga concentrators (Old East Mill, New East Mill, New West Mill). |
| · | Processing cost for the Nchanga TLP, including the attached anode production circuit. |
| · | Operating cost for the active TD05 tailings storage facility and its replacement (TD06). |
| · | Engineering services, site administration, and corporate overheads. |
Tailings Dam 3 reclamation is scheduled for completion by the end of FY2027/28; the bulk of the material is mined by conventional truck-and-shovel and trucked to the TLP at a combined mining and transport cost of US$5.50 per tonne of feed. Tailings Dam 4 is reclaimed by hydraulic mining. The COP E and COP DF underground projects are estimated at Scoping Study level using assumed contractor rates of US$31.26/t for production stoping and US$324.06/m and US$152.68/m³ for capital lateral development. The processing cost estimates for the Nchanga concentrators and the TLP have been developed in accordance with the FY2025/26 KCM business plan, covering power, reagents, labour, and repairs and maintenance.
Treatment costs and payability rates for the Nchanga Smelter and the Nkana Refinery have been applied in line with the FY2026/27 business plan.
| 18.3 | Operating cost summary - KCM Integrated Operations |
Table 18.2 presents the average LOM operating cost per tonne of ore for each operation, categorised by Mining, Processing, and G&A costs. Konkola Mine has the highest total operating cost at US$94.3/t, reflecting the deep-level underground mining requirements, while Nchanga TLP Operations has the lowest at US$16.1/t due to the nature of tailings reprocessing.
Table 18.2 Average LOM operating cost by operation
| Operation | Mining (US$/t) | Processing (US$/t) | G&A (US$/t) | Total (US$/t) | ||||||||||||
| Konkola Mine | 74.0 | 15.1 | 5.1 | 94.3 | ||||||||||||
| Nchanga (OP + UG) | 56.0 | 18.2 | 4.0 | 78.1 | ||||||||||||
| Nchanga TLP Operations | 0.8 | 14.4 | 0.9 | 16.1 | ||||||||||||
Source: AMC, 2026.
| 18.4 | Konkola Mine capital cost estimate |
The Konkola Mine capital cost estimate covers the underground mine and connected shaft infrastructure, the Konkola Concentrator, the Lubengele Tailings Storage Facility, and supporting surface infrastructure. The estimate is split into four components:
| · | Initial Project Capital Package (KDMP): a defined list of projects identified as critical to restoring and uprating the operation to support 6 Mtpa concentrator throughput. These projects are scheduled for completion within the first ten years and comprise a mix of growth and “fix-up” capital. |
| · | Lateral and vertical capital development: mine-wide backbone development (rail horizons, dewatering drives, primary access) and panel-level access development, scheduled within the Deswik LOM mine plan. |
| · | Standardised infrastructure modules (IMODs): a library of pre-priced fit-out modules (dewatering pump stations, paste fill extensions, ventilation upgrades, mobile fleet workshops, electrical substations, refuge chambers, and similar) applied to the LOM schedule on a unit basis as the production front advances and deepens. |
| · | Sustaining capital: annual allowances for maintenance, refurbishment, and minor replacement of installed facilities, with periodic larger expenditures at approximately 7- to 10-year intervals reflecting major overhauls. |
| amcconsultants.com | 292 |
| S-K 1300 TRS: KCM Integrated Operations (Initial Assessment) | |
| Konkola Copper Mines Plc | 0424076 |
The Initial Project Capital Package totals US$510.9M, comprising US$104.9M of indirect cost (EPCM, owner’s costs, and contingency) and US$406.0M of direct cost across approximately 22 individual project packages. The dominant direct-cost packages are the 1390 mL Pump Chamber (US$123.6M), the Vent Shafts (US$51.6M), the Backfill Plant (US$46.9M), and the Emergency Power Plant (US$39.5M); the balance comprises shaft loading, tramming, and surface development packages.
Diamond drilling campaigns to increase Mineral Resource confidence are treated as capital. KCM has committed to a substantial drilling program in the early years of the assessment period to support upgrade of the Inferred Mineral Resource base. Closure costs for Konkola have been estimated separately and are presented in Section 19.
The Konkola Mine capital expenditure profile is summarised in Table 18.3.
Table 18.3 Capital expenditure plan - Konkola Mine
| Capital category | LOM Total (US$M) | |||
| Growth Capital | 455 | |||
| Capital Development | 2,887 | |||
| Sustaining Capital | 1,612 | |||
| Total | 4,954 | |||
Source: AMC, 2026.
| 18.5 | Nchanga Business Unit capital cost estimate |
The Nchanga Business Unit capital cost estimate covers the existing tailings reclamation operations at TD03 and TD04, the proposed COP E and COP DF underground developments, and the three Nchanga concentrators (Old East, New East, and New West Mills). The Nchanga TLP and associated tailings storage facilities are presented separately in Section 18.6, reflecting their scale and distinct project execution profile.
There is no capital requirement for the existing tailings reclamation operations at TD03 and TD04. The COP E and COP DF underground projects are estimated at Scoping Study level on the basis of an underground capital fit-out appropriate for the indicative 13-year mine life, comprising portal establishment, surface workshop and laydown, paste fill supply, ventilation, electrical reticulation, and underground refuge and refuelling infrastructure. Capital allowances for the three Nchanga concentrators reflect a steady annual sustaining spend with periodic 5- to 6-yearly overhauls; no growth capital is provided for, as no expansion of baseplate capacity is planned.
The Nchanga Business Unit capital expenditure profile is summarised in Table 18.4.
Table 18.4 Capital expenditure plan - Nchanga Business Unit
| Capital category | LOM Total (US$M) | |||
| Growth Capital | 247 | |||
| Capital Development | 532 | |||
| Sustaining Capital | 44 | |||
| Total | 823 | |||
Source: AMC, 2026.
| amcconsultants.com | 293 |
| S-K 1300 TRS: KCM Integrated Operations (Initial Assessment) | |
| Konkola Copper Mines Plc | 0424076 |
| 18.6 | Nchanga TLP and tailings facilities capital cost estimate |
The Nchanga Tailings Leach Plant and associated tailings storage infrastructure represent the single largest capital allocation across the KCM Integrated Operations after the Konkola Mine, with life-of-mine capital of approximately US$1,420M comprising Growth Capital (US$924M) and Sustaining Capital (US$496M). The capital plan supports four principal investment streams: the TLP capacity expansion (TLP 2), the Elevated Temperature Leach (ETL) upgrade, the TD5 reclamation infrastructure, and ongoing TLP and tailings storage sustaining capital.
| 18.6.1 | TLP capacity expansion (TLP 2) |
The combined TLP throughput (existing Nchanga TLP plus the proposed TLP 2 facility) is scheduled to ramp from approximately 13 Mtpa in FY2026/27 to approximately 34 Mtpa from FY2029/30 onwards, supporting the integrated processing of the TD03, TD04, and TD05 tailings inventory and the increased final tailings stream from the expanded Konkola and Nchanga concentrator throughput. Total TLP 2 project capital is estimated at approximately US$741.3M at IA-level disclosure, comprising direct project scope of approximately US$607.6M (process plant including the leach circuit, expanded solvent extraction and electrowinning, and slurry handling infrastructure; new tailings storage facility; tailings transfer pipelines and pumps; site preparation and regulatory approvals; and pre-operating costs and first fill), additional engineering and owner's costs of approximately US$42.5M (7% of direct project scope), and scope growth contingency of approximately US$91.1M (15% of direct project scope) appropriate to IA-level accuracy (±50% per S-K 1300 Item 1302(d)(4)(ii)). TLP 2 is scheduled for commissioning within the first five years of the assessment period, in line with the TLP throughput ramp.
| 18.6.2 | Elevated Temperature Leach (ETL) upgrade |
The ETL upgrade comprises the retrofit of the existing Nchanga TLP with heat exchange, thermal engineering, steam supply, and modified tank metallurgy required to enable elevated-temperature leaching at 70–80°C. The retrofit is scheduled to take place following the initial reclamation of the TD03 and TD04 inventory through the existing TLP under ambient leach conditions, with ETL operation commencing prior to the introduction of TD05 feed under both the M&I Case and the Full Resource Case (refer Sections 10.4.3 and 14.3).
Elevated-temperature leaching is required to achieve the design metallurgical recovery from TD05 material. The TD05 mineralogy is dominated by cupriferous mica with minor malachite, pseudomalachite, chrysocolla, and chalcocite, and responds poorly to ambient-temperature acid leaching. ETL conditions enable the higher case-level blended TCu recoveries reported in Section 10.4.3, and underpin the TD05 recovery basis adopted for the Mineral Resource economic analysis in this Initial Assessment. The TD03 and TD04 Mineral Reserves declared in the companion Preliminary Feasibility Study are based on ambient leach recovery (74.8% ASCu equivalent to approximately 48.5% TCu recovery to cathode) and do not depend on ETL.
Total project capital is estimated at US$86.8M, comprising US$60.0M of supply (heat exchangers, thermal engineering, electrical and instrumentation, piping, structural steel, and water and drainage infrastructure) and US$26.8M of site construction, fabrication, and installation. Steam for elevated-temperature leaching is generated on-site via coal combustion (175 kg coal per tonne of steam), consistent with the steam generation basis adopted for TLP 2 under the Full Resource Case (refer Section 14.5.1). The capital estimate is at AACE Class 4–5 (Concept / Pre-Feasibility) accuracy of ±50%, appropriate to an Initial Assessment under S-K 1300 Item 1302(d)(4)(ii).
Incremental operating costs associated with the ETL retrofit comprise coal-fired steam generation, additional acid demand (over ambient baseline), incremental electrical power, and additional minor reagents. These costs are captured within the Nchanga TLP operating cost build and are reflected in the C1 Cash Cost and AISC figures presented in Table 1.13 and Table 19.2 under both the M&I Case and the Full Resource Case.
| amcconsultants.com | 294 |
| S-K 1300 TRS: KCM Integrated Operations (Initial Assessment) | |
| Konkola Copper Mines Plc | 0424076 |
| 18.6.3 | TD5 reclamation infrastructure (Phase 1) |
A new hydro-mining reclamation system is required to mobilise TD5 inventory as feed for the TLP once TD5 has been transitioned from active tailings storage. Phase 1 of the reclamation infrastructure is sized for 40 ktpd nominal capacity and comprises four remotely operated mining units (ROMUs), high-pressure water supply systems, barge-mounted vertical sump pumps, booster pump stations, slurry transfer pipelines, and screening and reclaim facilities. Phase 1 project capital is estimated at US$28.5M at AACE Class 4 (Concept / Pre-Feasibility) accuracy of −30% / +50%, including US$24.2M for system supply and core infrastructure, US$1.4M for electrical cables, US$2.0M for construction and installation, and US$0.8M for logistics and import duties. Subsequent phases of TD5 reclamation are accommodated within the TLP sustaining capital allowance, and enable a ramp up to the design capacity of 53.5 ktpd, whilst also creating redundancy with the TD05 tailings mining process
TD05 tailings storage life extension. The active TD05 facility requires a sustaining capital civil buttress program (US$30M) to extend its operating life through the ramp-up years until commissioning of the new TD06 storage facility (provided for within the TLP 2 capital scope above).
Other TLP capital. The TLP project capital also includes replacement of the existing electrowinning cathodes with permanent cathodes (US$19.5M, growth capital), supporting improved cathode quality and reduced maintenance intervals. Ongoing TLP plant and tailings storage facility sustaining capital is provided over the life of mine, including a general sustaining allowance of US$0.50 per tonne of ore processed for the active tailings storage facility.
The Nchanga TLP and tailings facilities capital expenditure profile is summarised in Table 18.5.
Table 18.5 Capital expenditure plan - TLP and Tailings Reclamation
| Capital category | LOM Total (US$M) | |||
| Growth Capital | 924 | |||
| Capital Development | – | |||
| Sustaining Capital | 496 | |||
| Total | 1,420 | |||
Source: AMC, 2026; project-level capital estimates supplied by KCM.
| 18.7 | Capital cost summary — KCM Integrated Operations |
A summary of the capital expenditure plan for the KCM Integrated Operations is presented in Table 18.6. Total life-of-mine capital for the Full Resource Case is US$7,595M, comprising Capital Development (US$3,419M), Growth Capital (US$1,626M), and Sustaining Capital (US$2,551M). For the M&I Case (Excluding Inferred), total capital is US$1,699M over the approximately 15-year life of mine. In addition to the above capital totals, closure costs of US$133M are included in the economic analysis at Section 19 and are described in Sections 17.1 and 17.3.
Table 18.6 Capital expenditure plan - KCM Integrated Operations
| Capital category | Full Resource Case (US$M) | M&I Case (US$M) | ||||||
| Growth Capital | 1,626 | 342 | ||||||
| Capital Development | 3,419 | 569 | ||||||
| Sustaining Capital | 2,551 | 788 | ||||||
| Total Capital | 7,595 | 1,699 | ||||||
Source: AMC, 2026.
The allocation of life-of-mine capital across the four principal operating units is set out in Table 18.7. The Konkola Mine accounts for approximately 65% of total capital, reflecting the scale of underground development and sustaining capital required to support the long-life production profile, with the Nchanga TLP (19%) and the Nchanga Business Unit (11%) representing the bulk of the balance.
| amcconsultants.com | 295 |
| S-K 1300 TRS: KCM Integrated Operations (Initial Assessment) | |
| Konkola Copper Mines Plc | 0424076 |
Table 18.7 Capital allocation by operation — Full Resource Case
| Operation | Growth (US$M) | Development (US$M) | Sustaining (US$M) | Total (US$M) | ||||||||||||
| Konkola Mine | 455 | 2,887 | 1,612 | 4,954 | ||||||||||||
| Nchanga Business Unit | 247 | 532 | 44 | 823 | ||||||||||||
| Nchanga TLP | 924 | – | 496 | 1,420 | ||||||||||||
| Nchanga Smelter & Refinery | – | – | 399 | 399 | ||||||||||||
| Total Capital | 1,626 | 3,419 | 2,551 | 7,595 | ||||||||||||
Source: AMC, 2026.
Capital intensity is heavily front-loaded: approximately 36% of life-of-mine capital, and 85% of Growth Capital, is scheduled within the first five years. The five-year forward schedule and the balance of life-of-mine spend are set out in Table 18.8. Total capital expenditure peaks in FY2026/27 at US$761M as the principal infrastructure investments are commissioned, before tapering from FY2028/29 onwards as the operation transitions to a profile dominated by capitalised development and sustaining capital.
Table 18.8 KCM Integrated Operations capital expenditure schedule
| Fiscal year | Capital Development (US$M) | Growth Capital (US$M) | Sustaining Capital (US$M) | Total (US$M) | ||||||||||||
| FY2026/27 | 196 | 223 | 103 | 521 | ||||||||||||
| FY2027/28 | 166 | 493 | 103 | 761 | ||||||||||||
| FY2028/29 | 177 | 471 | 98 | 746 | ||||||||||||
| FY2029/30 | 146 | 70 | 97 | 312 | ||||||||||||
| FY2030/31 | 178 | 121 | 86 | 385 | ||||||||||||
| First five years (FY2026/27–FY2030/31) | 861 | 1,378 | 486 | 2,726 | ||||||||||||
| FY2031/32 – FY2069/70 | 2,558 | 247 | 2,064 | 4,869 | ||||||||||||
| LOM Total | 3,419 | 1,626 | 2,551 | 7,595 | ||||||||||||
Source: AMC, 2026.
The first-five-years capital expenditure is allocated by operation in Table 18.9. Of the US$2,726M scheduled across the KCM Integrated Operations over FY2026/27 to FY2030/31, approximately US$1,211M is attributable to the Konkola Complex, US$355M to the Nchanga Complex, US$1,087M to the Nchanga TLP, and US$74M to the Nchanga Smelter and Refinery, in each case comprising growth, capital development and sustaining capital.
Table 18.9 First five years capital expenditure by operation (FY2026/27–FY2030/31)
| Operation | Capital Development (US$M) | Growth Capital (US$M) | Sustaining Capital (US$M) | Total (US$M) | ||||||||||||
| Konkola Complex | 703 | 284 | 224 | 1,211 | ||||||||||||
| Nchanga Complex | 159 | 171 | 26 | 355 | ||||||||||||
| Nchanga TLP | - | 924 | 163 | 1,087 | ||||||||||||
| Nchanga Smelter & Refinery | - | - | 74 | 74 | ||||||||||||
| Total Capital | 861 | 1,378 | 486 | 2,726 | ||||||||||||
Source: AMC, 2026.
| 18.8 | Cost estimate accuracy |
The accuracy ranges and contingency allowances applied to each principal cost component are summarised in Table 18.10. The Konkola Mine, the Nchanga TLP (existing facility), and the Nchanga Smelter and Refinery are each estimated at Pre-Feasibility level. The new Nchanga underground projects (COP E and COP DF) are estimated at Scoping Study level, and the TD5 reclamation infrastructure is estimated at AACE Class 4 (Concept / Pre-Feasibility) level, reflecting their earlier stage of technical definition.
Table 18.10 KCM cost estimation accuracy
| Cost category | Study level | Accuracy | Contingency | |||
| Konkola Mining Operations | Pre-Feasibility | ±25% | 10% | |||
| Konkola Processing & Tailings | Pre-Feasibility | ±25% | 15% | |||
| Nchanga TLP – Existing Operations | Pre-Feasibility | ±25% | 15% | |||
| Nchanga Smelter & Refinery | Pre-Feasibility | ±25% | 15% | |||
| Nchanga COP DF Open Pit | Initial Assessment | ±25–35% | 25% | |||
| Nchanga COP E, DF Underground | Initial Assessment | ±35–50% | 25% | |||
| Nchanga TLP ETL Retrofit | Initial Assessment | ±35% | 15% | |||
| TLP 2 (new facility) | Initial Assessment | ±35–50% | 25% | |||
| TD05 reclamation infrastructure | Initial Assessment | ±35–50% | Included | |||
| TD05 buttress civil works | Pre-Feasibility | ±25% | 15% |
Note: Cost estimates and contingencies are as derived for the Initial Assessment cases (M&I Case and Full Resource Case). For the Reserve Case (PFS scope), the corresponding accuracy and contingency disclosure is presented in PFS Table 18.1. 'Included' indicates contingency is incorporated within the stated cost estimate rather than disclosed as a separate line item.
Source: AMC, 2026.
| amcconsultants.com | 296 |
| S-K 1300 TRS: KCM Integrated Operations (Initial Assessment) | |
| Konkola Copper Mines Plc | 0424076 |
| 19 | Economic analysis |
|
CAUTIONARY STATEMENT REGARDING INITIAL ASSESSMENT This Initial Assessment is preliminary in nature and includes Inferred Mineral Resources that are considered too speculative geologically to be categorised as Mineral Reserves. There is no certainty that this Initial Assessment will be realised. Mineral Resources that are not Mineral Reserves do not have demonstrated economic viability. Economic results are presented for two cases - Full Resource Case (including Inferred) and M&I Case (excluding Inferred) - with equal prominence in accordance with Item 1302(d)(4)(ii)(C) of Regulation S-K.
|
|
INFERRED MINERAL RESOURCE PROPORTION
Approximately 63% of KCM Mineral Resources are classified as Inferred (483 Mt of 773 Mt); at Konkola Mine approximately 87% are classified as Inferred (249 Mt of 288 Mt). Inferred Mineral Resources cannot currently be categorised as Mineral Reserves and are included in the Full Resource Case only - the M&I Case in Section 19.2 excludes all Inferred Mineral Resources. It is reasonably expected, though not certain, that continued drilling could upgrade the majority of Inferred Mineral Resources to higher confidence categories.
|
| 19.1 | Full Resource Case (Including Inferred) |
The first scenario is an Initial Assessment based on a comprehensive LOM Plan that includes mining from:
| · | Konkola Mine – Measured, Indicated, and Inferred Mineral Resources (operating). |
| · | Nchanga Indicated and Inferred Resources: |
| ¾ | COP DF open pit mine – Indicated Resources (status to be confirmed). |
| ¾ | Nchanga COP E Extension – Indicated and Inferred Resources (planned). |
| ¾ | Nchanga COP DF Underground – Indicated and Inferred Resources (planned). |
| · | Reclamation of Tailings Dams 03 and 04, and the full TD05 Mineral Resource (Indicated and Inferred), processed through the existing Nchanga TLP (retrofitted with Elevated Temperature Leach) and the proposed TLP 2 facility operating in parallel (refer Section 14.5). |
The Initial Assessment is a preliminary technical and economic study of the KCM Integrated Operations, including Konkola Mine, Nchanga Business Unit (open pit and underground operations), Nchanga Tailings Recovery (TD03, TD04, and TD05), the existing Nchanga TLP (with proposed ETL retrofit), the proposed TLP 2 facility, the Nchanga Smelter, and the Nkana Refinery. The confidence in the overall LOM scenario is at an Initial Assessment level of confidence.
The Initial Assessment of the Nchanga deposits and the Inferred Mineral Resource component of the Konkola Mine is preliminary in nature. It includes Inferred Mineral Resources that are considered too geologically speculative to have modifying factors applied to them that would enable them to be classified as Mineral Reserves; as such, these Mineral Resources have not been classified as Mineral Reserves. There is no certainty that the results of the Initial Assessment will be realized.
| amcconsultants.com | 297 |
| S-K 1300 TRS: KCM Integrated Operations (Initial Assessment) | |
| Konkola Copper Mines Plc | 0424076 |
| 19.2 | Measured and Indicated Resource Case |
In accordance with Item 1302(d)(4)(ii)(C) of Regulation S-K, the economic analysis excluding Inferred Mineral Resources is presented with equal prominence to the Full Resource Case. This scenario is referred to as the 'M&I Case' throughout this report.
The M&I Case is a sub-set of the Full Resource Case Life-of-Mine plan, limited to the mining of Measured and Indicated Mineral Resources at the Konkola Mine and the recovery of tailings from TD03, TD04, and TD05 (Measured and Indicated portion only) all processed through the existing Nchanga TLP, retrofitted with Elevated Temperature Leach (ETL) to enable processing of TD05 reclamation feed. The Inferred portion of TD05 is excluded by virtue of its classification, as is the proposed TLP 2 facility, the capital investment for which is supported by the larger Inferred-inclusive resource base available under the Full Resource Case. Measured and Indicated Resources comprise approximately 13% of the total Konkola Mineral Resource by tonnage (39 Mt of 288 Mt); for TD05, the Measured and Indicated portion represents approximately 47% of the total TD05 resource (198 Mt of 423 Mt).
This Initial Assessment does not declare Mineral Reserves. The formal Mineral Reserve estimate, presented in the companion PFS Technical Report Summary (AMC, 2026), comprises the Konkola Mine, TD03, and TD04, and is a subset of the M&I Case scope. The TD05 Measured and Indicated portion is included in the M&I Case for the purpose of the economic analysis required under Item 1302(d)(4)(ii)(C) of Regulation S-K but has not been declared as a Mineral Reserve in the companion PFS, pending Pre-Feasibility-level study to support such a declaration.
The M&I Case mine plan has been constructed to reflect production from the Measured and Indicated Mineral Resources only, with any Inferred Mineral Resources included in the production profile treated as waste and assigned zero grade.
The Konkola Mine underground development plan has been focused on accessing and recovering the Measured and Indicated Mineral Resources at Konkola. The capital investment program has also been limited to expenditure that relates to the M&I Case mine plan only.
The purpose of the M&I Case is to demonstrate that the Measured and Indicated Mineral Resource portion of the KCM operations can support a positive economic outcome independent of Inferred Mineral Resources, and that the mine plan meets the technical requirements of a viable production schedule.
It should be noted that KCM intends to continue resource infill drilling to expand confidence in the Mineral Resource base and to continually develop the mine plan to adapt to improving resource definition of the Konkola Mine deposit. KCM will invest capital and drilling to develop the potential of the LOM plan scenario based on the positive potential from the investments.
The tailings recovery schedule for TD03 and TD04 is unchanged between the Full Resource Case and the M&I Case. NBU mining operations (COP DF Open Pit, COP DF Underground, and COP E Extension) are not included in the M&I Case. Although Measured and Indicated Mineral Resources have been estimated for COP DF (15 Mt M+I) and COP E Extension (13 Mt M+I), the mining plans and supporting capital and operating cost estimates for these operations have not been developed to a level of confidence sufficient to support inclusion in the M&I Case. The NBU mine plan and associated capital investment, supported by the larger Resource base available under the Full Resource Case (including Inferred Resources), is presented in the Full Resource Case only.
| amcconsultants.com | 298 |
| S-K 1300 TRS: KCM Integrated Operations (Initial Assessment) | |
| Konkola Copper Mines Plc | 0424076 |
| 19.3 | Key assumptions |
| · | Copper Price: P75 consensus pricing as per Table 16.1 (ranging from US$11,101/t to US$12,793/t over the LOM assessment period). |
| · | Cobalt Price: P50 consensus pricing (ranging from US$42,262/t to US$52,465/t over the LOM assessment period). |
| · | Discount Rate: 8% real, pre-tax. |
| · | Royalty: 4-10% sliding scale based on copper price. |
| 19.3.1 | Byproducts |
The KCM Integrated Operations generates two principal byproducts from the smelting and refining circuit: cobalt alloy and sulfuric acid. Both are credited against operating costs within the financial model. The quantities and price assumptions for each byproduct, for the Full Resource Case (45-year LOM) and the Measured and Indicated Case (15-year LOM), are set out in Table 19.1 below.
Table 19.1 Byproducts: Type, Quantity and Price Assumption
| Full Resource Case (FRC) 45-Year LOM | Measured & Indicated Case 15-Year LOM | Revenue | ||||||||||||||
| Byproduct | Unit | LOM Quantity | Price
Assumption | LOM
Quantity | Price
Assumption | Treatment
in Financial Model | ||||||||||
| Cobalt alloy (all smelter sources)1 | t alloy | 2,047,432 | US$42,262 – 52,465/t Co2 | 334,286 | US$42,262 – 52,465/t Co2 | Credited in Smelting & Credits line; sold externally | ||||||||||
| of which: KCM & Nchanga own concentrate | t alloy | 1,233,891 | – | 138,081 | – | - | ||||||||||
| of which: third-party external concentrate³ | t alloy | 813,541 | – | 196,205 | – | - | ||||||||||
| Cobalt (Co) content in alloy | t Co | 53,858 | US$42,262 – 52,465/t Co2 | 8,052 | US$42,262 – 52,465/t Co2 | Payable Co fraction applied to market price | ||||||||||
| Sulfuric acid⁴ | t | 17,554,977 | US$130/t5 | 3,669,650 | US$130/t5 | Transfer-priced credit; consumed internally by Nchanga TLP for copper leaching | ||||||||||
Notes:
| 1 | Cobalt alloy is produced from blended smelter feed comprising KCM/Nchanga concentrate and third-party concentrate processed through the Nchanga Flash Smelter. |
| 2 | Cobalt price assumption represents the consensus forecast range, declining from US$52,465/t in FY26 to US$42,262/t and held flat from FY31 onwards. |
| 3 | Third-party concentrate volumes are required to maintain Nchanga Smelter throughput utilisation; refer to Section 19.3.2.1 for further discussion. |
| 4 | Includes strong and weak acid streams produced by the smelter acid plant. |
| 5 | Internal transfer price between Nchanga Smelter (producer) and Nchanga TLP (consumer). External market price of US$175/t applies in the third-party concentrate sensitivity (Section 19.3.2.1). |
Source: AMC, 2026.
| 19.3.2 | Third-party concentrate: basis for inclusion in economic analysis |
The economic analysis for both the Full Resource Case and the M&I Case includes revenue and costs attributable to the purchase and processing of third-party copper concentrate through the Nchanga Flash Smelter. The QPs consider the inclusion of these cash flows to be appropriate and consistent with the requirements of Item 601(b)(96)(iii)(B)(19)(ii) of Regulation S-K for the reasons set out below.
| amcconsultants.com | 299 |
| S-K 1300 TRS: KCM Integrated Operations (Initial Assessment) | |
| Konkola Copper Mines Plc | 0424076 |
The primary basis for this inclusion is metallurgical. KCM's own concentrates, produced at the Konkola and Nchanga Concentrators, carry elevated silica content of typically 20–22% SiO₂, materially exceeding the preferred FSF feed limit of less than 15% SiO₂. Operating the flash smelter on KCM's own concentrates alone would produce an Fe/SiO₂ ratio outside the thermodynamic operating envelope of the furnace, causing instability in the reaction shaft, increased slag losses, reduced copper recovery into the blister phase, and potential refractory damage. To correct this imbalance, chalcopyrite-dominant concentrates with higher iron and lower silica content must be incorporated into the feed blend. This is a design requirement of the FSF, not a matter of commercial preference. The Nchanga Flash Smelter has a design throughput capacity of approximately 850 ktpa of concentrate, and KCM's own mining operations do not generate sufficient concentrate volume to sustain that throughput across the life of operations. As a consequence of both the blending requirement and the capacity utilisation profile, the LOM plan assumes the purchase of 300,000–315,000tpa of third-party concentrate to supplement KCM's own feed (see Section 14.4.3 and the smelter feed profiles in Figure 19.1 and Figure 19.2).
The smelting of sulfide concentrates, whether KCM's own or third-party, is also the primary source of sulfur dioxide from which sulfuric acid is produced at the Nchanga acid plant (capacity 1,850 tpd). This acid is the essential reagent for KCM's tailings leaching operations: the existing Nchanga TLP under both economic cases, and the proposed TLP 2 facility operating in parallel with the existing TLP under the Full Resource Case (refer Section 14.3). The existing TLP and TLP 2 together contributed 1,825kt of payable copper over the Full Resource Case LOM, and the existing TLP contributed 550 kt over the M&I Case LOM, representing a material component of KCM's own integrated production. Without third-party concentrate supplementing smelter feed, sulfuric acid output would be materially reduced; the shortfall would need to be sourced from external third-party acid suppliers at significantly higher cost (as disclosed in Section 14.4.3), materially altering the economics attributable to KCM's own mineralisation under both cases.
The QPs therefore conclude that the third-party concentrate processing activity is operationally integral to the economic viability of KCM’s own Mineral Resources. The inclusion of associated revenues and costs in the economic model does not misrepresent the economics of the property’s own mineralisation; rather, their exclusion would produce a materially distorted result by removing a cost-offset that is structurally dependent on KCM’s own processing infrastructure and resource base.
In the interests of transparency, the financial contribution of third-party concentrate processing is separately identified throughout this report. Table 19.1 presents third-party concentrate volumes, grade, and attributable metal production as distinct line items. In Table 19.3 and Table 19.4, concentrate purchase costs (Full Resource Case: US$41.3B; M&I Case: US$11.5B) and smelter and refinery credits (Full Resource Case: US$4.1B; M&I Case: US$0.7B) are disclosed as separate cost line items, enabling readers to assess the net economic contribution of third-party processing activity. C1 and AISC unit cost metrics are calculated on KCM’s integrated metal production only, excluding third-party concentrate metal, as noted in the footnotes to Table 19.3 and Table 19.4.
| 19.3.2.1 | Third-party concentrate sensitivity (partial and adjusted scenarios) |
To assess the sensitivity of project economics to the dependency on third-party concentrate, the following analysis models the removal of third-party concentrate from the LOM plan entirely for both the Full Resource Case and the M&I Case. The total NPV₈% impacts (post-tax basis) and their component parts are set out below.
M&I Case
The combined NPV₈% impact for the M&I Case is approximately US$210M, representing a reduction of approximately 8% from the base case post-tax NPV₈% of US$2,640M, reducing it to approximately US$2,430M. The KCM Integrated Operations remain economic under this sensitivity on the basis of KCM's own Mineral Resource production.
| amcconsultants.com | 300 |
| S-K 1300 TRS: KCM Integrated Operations (Initial Assessment) | |
| Konkola Copper Mines Plc | 0424076 |
The total impact comprises two components. The first is the direct smelter contribution. Under the M&I Case, third-party external concentrate represents approximately 60% of total smelter concentrate feed (3,425 kt of 5,644 kt LOM concentrate feed). Removal of the EBITDA contribution from external concentrate, treating smelter fixed costs as stranded (i.e. unsaved when external concentrate is removed), reduces NPV₈% by approximately US$140M, or approximately 5% of base case. The second is the incremental acid procurement cost. Reduced smelter throughput reduces internal sulfuric acid production proportionally, requiring the existing Nchanga TLP to source the shortfall externally. The incremental cost is calculated on the delta between the external market price for sulfuric acid on the Copperbelt (US$175/t) and the internal transfer price (US$130/t), or US$45 per tonne, applied to the incremental external acid volumes. The NPV₈% impact is approximately US$70M, or approximately 3% of base case.
Full Resource Case
The combined NPV₈% impact for the Full Resource Case is approximately US$296M, representing a reduction of approximately 3% from the base case post-tax NPV₈% of US$8,637M, reducing it to approximately US$8,341M. The KCM Integrated Operations remain economic under this sensitivity on the basis of KCM's own Mineral Resource production.
The two impact components are calculated on the same basis as the M&I Case. Direct smelter contribution: third-party external concentrate represents approximately 36% of total LOM smelter concentrate feed (12,833 kt of 31,233 kt LOM smelter feed). Removal of the EBITDA contribution, treating smelter fixed costs as stranded, reduces NPV₈% by approximately US$196M, or approximately 2% of base case. The lower percentage impact relative to the M&I Case reflects two factors: a larger base case NPV against which the impact is measured, and a higher internal concentrate share supported by Nchanga Business Unit ROM under the FRC. Incremental acid procurement cost: applying the US$45/t delta to the incremental external acid volumes generates an NPV₈% impact of approximately US$100M, or approximately 1% of base case. The longer FRC smelter operating life generates a larger absolute acid impact than under the M&I Case but a smaller percentage impact.
Conservative assumptions
The analysis uses conservative assumptions throughout both cases. The US$130/t acid transfer price reflects the QPs' estimate of normalised external procurement cost as at the effective date of this report. Acid prices on the Central African Copperbelt are subject to variability depending on regional smelter operating rates, export policy, and logistics availability; in periods of tighter supply the market price for sulfuric acid has historically exceeded the US$130/t assumption, which would increase the cost impact accordingly. The KCM Integrated Operations remain economic under this sensitivity in both cases on the basis of KCM's own Mineral Resource production, and the uninterrupted sourcing of third-party concentrate is identified as an essential operational and commercial requirement throughout the life of mine.
| 19.3.3 | Royalties and taxation |
The economic analysis incorporates Zambian corporate income tax at the statutory mining rate of 30%, applied uniformly to taxable income across the life of mine. The taxable income calculation reflects revenue net of operating costs (including mineral royalties, which are deducted as an operating cost and not duplicated within this section), interest, and tax depreciation, with the opening tax loss pool described below applied subject to the statutory utilisation cap.
Capital expenditure (growth capital, capitalised development, and sustaining capital) is depreciated for tax purposes on a straight-line basis over an 8.33-year economic life, equivalent to a 12% annual allowance. This rate is adopted as a simplifying assumption that approximates the blended outcome of the capital-allowance regime under the Zambian Income Tax Act, which provides for differing rates across plant and machinery, industrial buildings, and mine development expenditure. The QPs consider this simplification reasonable for an Initial Assessment, where the precision of asset-class apportionment is below the level of detail otherwise applied in the economic analysis.
| amcconsultants.com | 301 |
| S-K 1300 TRS: KCM Integrated Operations (Initial Assessment) | |
| Konkola Copper Mines Plc | 0424076 |
Tax losses are carried forward for ten years from the year of incurrence in accordance with the Zambian Income Tax Act, and may offset up to 50% of taxable mining income in any given year.
No mineral variable profit tax, windfall tax, or other Zambian-specific resource tax is modelled. Withholding taxes on dividend distributions, deferred tax balances, and value-added tax on capital and operating expenditure inputs are not separately reflected in the economic analysis; VAT is assumed to be either recoverable or already embedded in input cost estimates as appropriate. The QPs have relied on the Registrant for the interpretation of Zambian fiscal legislation and the determination of the opening tax loss balance, as set out in Section 25.6.
The resulting cash taxes over the life of mine are US$11,674M for the Full Resource Case and US$1,290M for the M&I Case, as presented in Table 1.13 and Table 19.3.
| 19.4 | Production plans |
| · | The basis of the economic model is the mining, processing and smelting schedule as presented in this report which includes mined tonnes (ore and waste), development meters, processed ore tonnes, grade and recoveries. |
| · | The KCM Full Resource Case comprises production from Measured, Indicated and Inferred Resources. |
| · | The KCM M&I Case comprises production from Measured and Indicated Mineral Resources at Konkola Mine and Indicated Mineral Resources in TD03, TD04 and TD05. |
| · | A concept blend plan was developed to determine the copper metal and cobalt alloy produced from the available feed sources. Based on instructions from KCM, it was assumed that the excess smelter capacity in each year is filled by concentrates purchased from external third parties. These concentrates are assumed to meet the specifications required by the smelter over the life of the operations. No material (concentrate nor produced copper) generated from third party purchased concentrates has been included in any Mineral Resource estimates for KCM. |
The smelter feed profiles for both scenarios are shown in Figure 19.1 and Figure 19.2.
Figure 19.1 KCM Smelter Feed Profile – Full Resource Case (incl. external purchased concentrates)
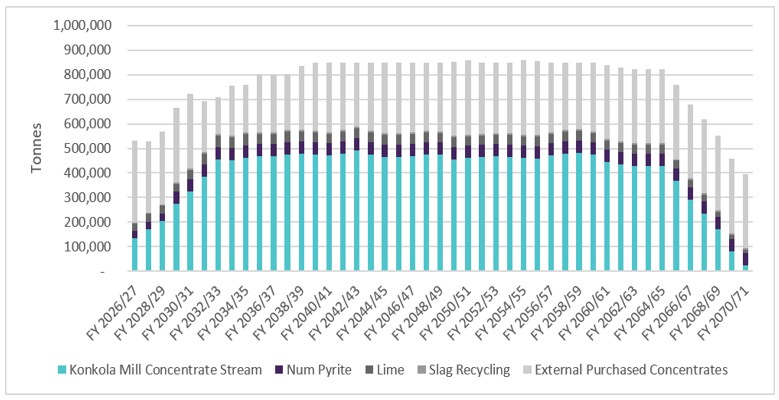
Source: AMC, 2026.
| amcconsultants.com | 302 |
| S-K 1300 TRS: KCM Integrated Operations (Initial Assessment) | |
| Konkola Copper Mines Plc | 0424076 |
Figure 19.2 KCM Smelter Feed Profile – M&I Case (incl. external purchased concentrates)
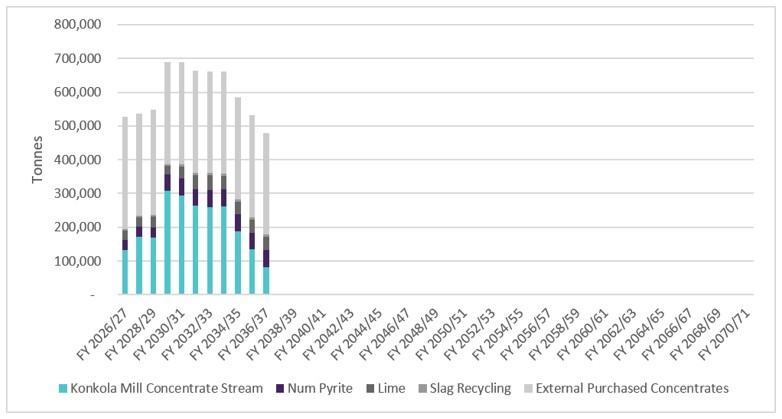
Source: AMC, 2026.
The projected overall mining schedules for both scenarios, showing annual payable copper production by source, are shown in Figure 19.3 (Full Resource Case) and Figure 19.4 (M&I Case). The Full Resource Case recovers a total of 7,880kt (7.88 Mt) of payable copper over approximately 45 years, and the M&I Case recovers a total of 1,446 kt (1.45 Mt) of payable copper over approximately 15 years.
Figure 19.3 Projected overall mining schedule – Full Resource Case
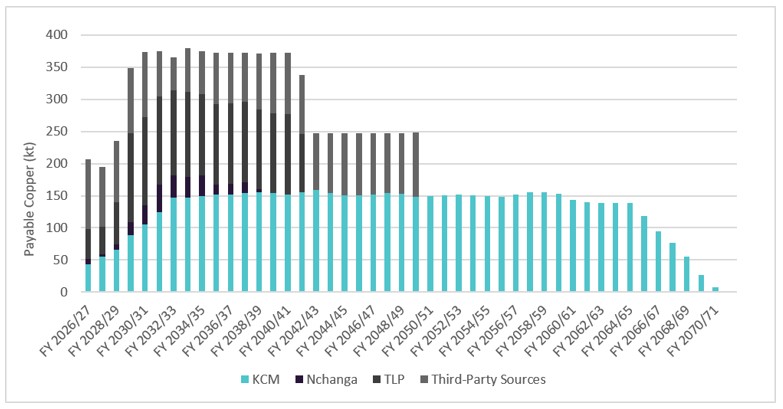
Source: AMC, 2026.
Figure 19.4 Projected overall mining schedule – M&I Case
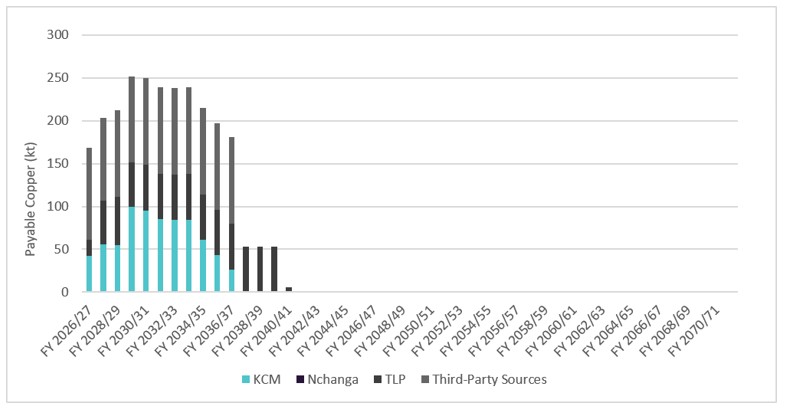
Source: AMC, 2026.
| amcconsultants.com | 303 |
| S-K 1300 TRS: KCM Integrated Operations (Initial Assessment) | |
| Konkola Copper Mines Plc | 0424076 |
| 19.5 | Economic results - dual presentation |
In accordance with Item 1302(d)(4)(ii)(C), economic results are presented with equal prominence for two scenarios: Full Resource Case (Including Inferred, based on Measured, Indicated, and Inferred Mineral Resources) and M&I Case (Excluding Inferred, based on Measured and Indicated Mineral Resources). The M&I Case demonstrates economic viability; a separate PFS TRS has been prepared for this case. A summary of the economic results is presented in Table 19.2.
Table 19.2 Economic results – KCM Integrated Operations
| Item | Unit | Full Resource Case (With Inferred) | M&I Case (Without Inferred) | |||||||
| Production | ||||||||||
| Konkola Mine Ore mined | kt | 232,775 | 29,066 | |||||||
| Konkola Ore head grade | %T Cu | 2.94 | 2.89 | |||||||
| Konkola Ore Recovery | % | 86.5 | 89.2 | |||||||
| Smelter Recovery | % | 98.10 | 98.10 | |||||||
| Konkola Mine Cu Payable | kt | 5,816 | 734 | |||||||
| NBU Ore mined | kt | 20,861 | - | |||||||
| NBU Ore head grade | %T Cu | 2.42 | - | |||||||
| NBU Ore Recovery | % | 53.9 | - | |||||||
| NBU Cu Payable | kt | 266 | - | |||||||
| Nchanga TLP Ore mined | kt | 473,636 | 224,607 | |||||||
| Nchanga TLP Ore head grade | %T Cu | 0.57 | 0.56 | |||||||
| Nchanga TLP Total Cu Recovery | % | 66.8 | 56.7 | |||||||
| Nchanga TLP Cu Payable | kt | 1,798 | 713 | |||||||
| Integrated Metal Production (1) | kt | 7,880 | 1,446 | |||||||
| Third-Party Concentrate processed | kt | 12,833 | 3,425 | |||||||
| Third-Party Metal Production | kt | 4,180 | 1,112 | |||||||
| Total Metal (2) | kt | 12,060 | 2,558 | |||||||
| Mine Life | years | 45 | 15 | |||||||
| Revenue | ||||||||||
| Gross Copper Revenue (3) | US$M | 129,510 | 28,235 | |||||||
| Concentrate Purchase Cost (third-party) | US$M | (41,317 | ) | (11,511 | ) | |||||
| Net Revenue (4) | US$M | 88,194 | 16,724 | |||||||
| C1 Cash Cost Build (5) | ||||||||||
| Mining Operating Costs (Konkola + NBU + Nchanga TLP) | US$M | 31,378 | 7,355 | |||||||
| Smelter & Refinery Operating Costs — in-house share | US$M | (3,347 | ) | (1,390 | ) | |||||
| Smelter & Refinery By-Product Credits — in-house share | US$M | 2,288 | 737 | |||||||
| Net Smelter & Refinery Cost — in-house share | US$M | (1,059 | ) | (653 | ) | |||||
| C1 Cash Cost (6) | US$M | 32,437 | 6,701 | |||||||
| C1 Cash Cost per pound (7) | US$/lb Cu | 1.87 | 2.10 | |||||||
| AISC Build (8) | ||||||||||
| C1 Cash Cost | US$M | 32,437 | 6,701 | |||||||
| Total Royalties | US$M | 6,443 | 1,097 | |||||||
| Sustaining Capital (9) | US$M | 2,551 | 788 | |||||||
| All-in Sustaining Cost (AISC) | US$M | 41,430 | 8,586 | |||||||
| AISC per pound (8) | US$/lb Cu | 2.38 | 2.69 | |||||||
| Reconciliation: C1 to Total Operating Costs (10) | ||||||||||
| C1 Cash Cost | US$M | 32,437 | 6,701 | |||||||
| Smelter & Refinery — net of credits, total | US$M | 1,898 | 647 | |||||||
| less: In-house share included in C1 ⁽⁶⁾ | US$M | 1,059 | 653 | |||||||
| Third-party share of smelter & refinery (net) ⁽⁶⁾ | US$M | 839 | 1,300 | |||||||
| Total Operating Costs | US$M | 33,276 | 8,002 | |||||||
| Capital Costs | ||||||||||
| Growth Capital | US$M | 1,626 | 342 | |||||||
| Capital Development | US$M | 3,419 | 569 | |||||||
| Sustaining Capital | US$M | 2,551 | 788 | |||||||
| Total Capital Expenditure | US$M | 7,595 | 1,699 | |||||||
| Closure Costs | US$M | 133 | 133 | |||||||
| Economic Metrics | ||||||||||
| Free Cash Flow (pre-tax) | US$M | 40,746 | 5,586 | |||||||
| Cash Taxes | US$M | (11,674 | ) | (1,290 | ) | |||||
| Free Cash Flow (post-tax) | US$M | 29,072 | 4,296 | |||||||
| NPV₈% (pre-tax, real basis) | US$M | 12,050 | 3,418 | |||||||
| NPV₈% (post-tax, real basis) | US$M | 8,637 | 2,640 | |||||||
| IRR (pre-tax) (11) | % | 65 | N/A | |||||||
| IRR (post-tax) (11) | % | 52 | N/A | |||||||
| Payback Period (12) | years | ~3.3 | ~1.7 | |||||||
Notes:
| 1. | Integrated Metal Production is the sum of payable copper from KCM's own mining and processing operations: Konkola Mine, NBU, and Nchanga TLP. Excludes copper from third-party concentrate processed at Nchanga Smelter and Nkana Refinery. |
| 2. | Total Metal is the sum of Integrated Metal Production and Third-Party Metal Production from processing third-party concentrate at Nchanga Smelter and Nkana Refinery. |
| 3. | Gross Copper Revenue calculated on payable copper sold at consensus P75 copper pricing of US$11,101/t to US$12,793/t over the production period. No adjustment for TC/RC or freight, which are presented as revenue deductions in the C1 framework. |
| amcconsultants.com | 304 |
| S-K 1300 TRS: KCM Integrated Operations (Initial Assessment) | |
| Konkola Copper Mines Plc | 0424076 |
| 4. | Net Revenue is Gross Copper Revenue less third-party concentrate purchase cost (cash outflow to suppliers of third-party concentrate feed to Nchanga Smelter). Net Revenue is the figure used in free cash flow calculations. |
| 5. | C1 Cash Cost is a non-GAAP measure widely used in the mining industry to compare operating cost performance. It represents the direct cash cost per pound of payable copper, comprising mining and processing costs (incl. site G&A) and the in-house share of net smelter and refinery operating costs. Excludes royalties, sustaining capital, closure costs, D&A and financing costs. Calculated on KCM's own payable copper (Integrated Metal Production basis). |
| 6. | C1 Cash Cost formula: C1 = Mining Op Costs + (Smelter & Refinery Op Costs − By-Product Credits) × Integrated Metal Production / Total Metal. |
| 7. | Unit cost denominator: both C1 and AISC per-pound figures use Integrated Metal Production, not Total Metal. On a Total Metal basis, unit costs would be lower but would not reflect KCM's own production economics. |
| 8. | All-in Sustaining Cost (AISC) is a non-GAAP measure widely used in the mining industry as a comprehensive indicator of total cash and sustaining capital cost per pound of payable copper. AISC = C1 Cash Cost + Total Royalties + Sustaining Capital. Excludes growth capital, capital development on incremental projects, and closure costs. Calculated on the same Integrated Metal Production basis as C1. |
| 9. | Sustaining Capital is shown both in Capital Costs and AISC Build sections but is a single figure that should not be double-counted. |
| 10. | Total Operating Costs Reconciliation. Total Operating Costs represent all cash operating expenditure of KCM. Differs from C1 by components excluded from C1: (i) third-party share of net smelter and refinery costs (net = cost less credits); (ii) freight on copper sales; and (iii) TC/RC on third-party concentrate. These are presented as revenue deductions and revenue offsets in the C1 framework. Refer to Section 18. |
| 11. | IRR not reported for the Reserve Case. KCM is a brownfield producing operation; cumulative free cash flow is positive from Year 1 of the Reserve Case, and a conventional IRR does not produce a meaningful measure of economic viability for an operation with no greenfield-type construction outflow. IRR is calculable and reported for the Full Resource Case which includes the proposed TLP 2 construction capital deployment phase. |
| 12. | Payback Period is calculated as cumulative time from Year 1. |
At an 8% annual discount rate, the Full Resource Case yields a post-tax NPV of US$8.6B (US$12.1B pre-tax), while the M&I Case yields US$2.6B post-tax (US$3.4B pre-tax). The annual cashflow profile for the Full Resource Case (With Inferred) is shown in Figure 19.5 and Table 19.3, and for the M&I Case (Without Inferred) is shown in Figure 19.6 and Table 19.4.
| amcconsultants.com | 305 |
| S-K 1300 TRS: KCM Integrated Operations (Initial Assessment) | |
| Konkola Copper Mines Plc | 0424076 |
Figure 19.5 Full Resource Case cashflow
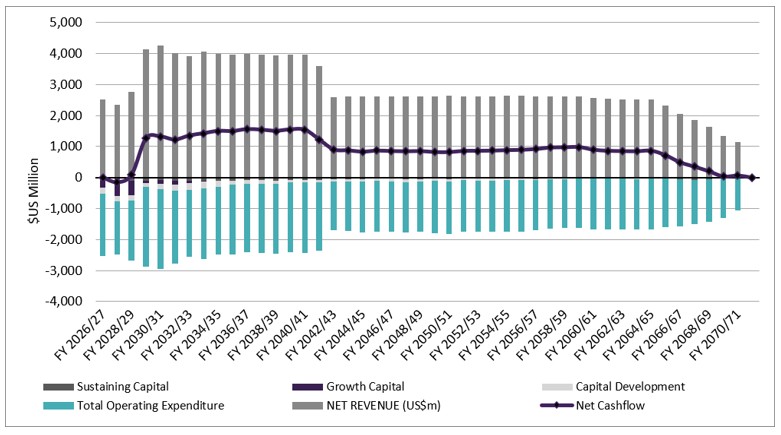
Source: AMC, 2026.
Figure 19.6 M&I Case cashflow
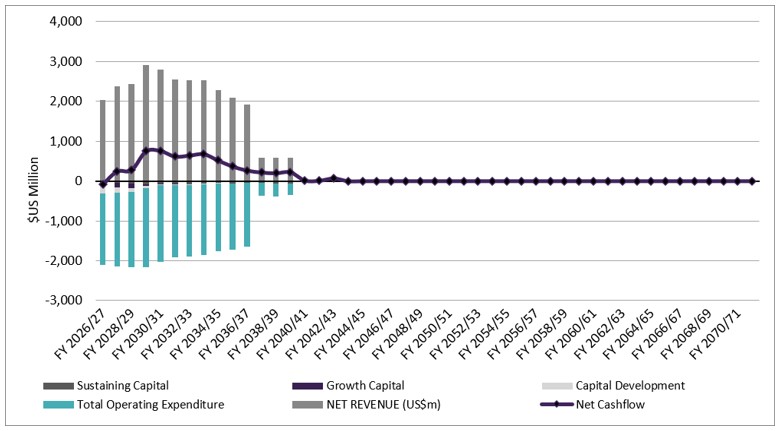
Source: AMC, 2026.
| amcconsultants.com | 306 |
| S-K 1300 TRS: KCM Integrated Operations (Initial Assessment) | |
| Konkola Copper Mines Plc | 0424076 |
Table 19.3 Full Resource Case production and cashflow schedule
| Item | Unit | FY2026/27 | FY2027/28 | FY2028/29 | FY2029/30 | FY2030/31 | FY2031/32 | FY2032/33 | FY2033/34 | FY2034/35 | FY2035/36 | FY2036/37 | FY2037/38 | FY2038/39 | FY2039/40 | FY2040/41 | Block 17 Subtotal | |||||||||||||||||||||||||||||||||||||||||||||||||
| Production | ||||||||||||||||||||||||||||||||||||||||||||||||||||||||||||||||||
| KCM UG Ore Mined | kt | 1,669 | 2,180 | 2,639 | 3,400 | 4,189 | 5,105 | 5,998 | 6,002 | 6,000 | 6,004 | 6,000 | 5,999 | 6,000 | 6,002 | 6,000 | 73,187 | |||||||||||||||||||||||||||||||||||||||||||||||||
| KCM UG Head Grade | %TCu | 2.99 | % | 2.91 | % | 2.87 | % | 3.06 | % | 2.91 | % | 2.81 | % | 2.84 | % | 2.85 | % | 2.94 | % | 2.98 | % | 2.99 | % | 3.02 | % | 3.06 | % | 3.04 | % | 2.99 | % | 2.95 | % | |||||||||||||||||||||||||||||||||
| KCM UG Recovery | % | 87.89 | % | 89.57 | % | 88.80 | % | 86.93 | % | 87.85 | % | 88.31 | % | 88.08 | % | 87.33 | % | 86.63 | % | 86.32 | % | 86.06 | % | 86.73 | % | 86.08 | % | 85.85 | % | 86.46 | % | 87.01 | % | |||||||||||||||||||||||||||||||||
| KCM UG Cu Payable | kt | 43 | 56 | 66 | 89 | 105 | 124 | 147 | 147 | 150 | 152 | 151 | 154 | 155 | 154 | 152 | 1,845 | |||||||||||||||||||||||||||||||||||||||||||||||||
| NBU Ore Mined (OP + UG) | kt | 1,397 | 340 | 490 | 1,458 | 1,958 | 2,902 | 2,902 | 2,902 | 2,902 | 1,228 | 1,014 | 1,014 | 356 | 0 | 0 | 20,861 | |||||||||||||||||||||||||||||||||||||||||||||||||
| NBU Cu Payable | kt | 9.2 | 2.8 | 8.4 | 20.6 | 29.6 | 42.6 | 34.4 | 32.7 | 31.3 | 16.1 | 17.0 | 16.0 | 5.2 | 0.0 | 0.0 | 265.9 | |||||||||||||||||||||||||||||||||||||||||||||||||
| Nchanga TLP Ore Mined | kt | 13,473 | 14,529 | 15,735 | 34,200 | 33,025 | 33,020 | 33,296 | 34,200 | 32,606 | 33,991 | 34,200 | 34,200 | 33,930 | 34,200 | 34,200 | 448,804 | |||||||||||||||||||||||||||||||||||||||||||||||||
| Nchanga TLP Head Grade | %TCu | 0.65 | % | 0.59 | % | 0.63 | % | 0.58 | % | 0.60 | % | 0.61 | % | 0.58 | % | 0.57 | % | 0.56 | % | 0.55 | % | 0.55 | % | 0.55 | % | 0.54 | % | 0.54 | % | 0.54 | % | 0.57 | % | |||||||||||||||||||||||||||||||||
| Nchanga TLP Recovery | % | 52.88 | % | 51.13 | % | 66.12 | % | 69.10 | % | 69.37 | % | 67.63 | % | 67.91 | % | 67.75 | % | 69.47 | % | 66.49 | % | 66.16 | % | 66.26 | % | 67.86 | % | 67.99 | % | 67.99 | % | 66.77 | % | |||||||||||||||||||||||||||||||||
| Nchanga TLP Cu Payable | kt | 46 | 44 | 65 | 138 | 137 | 137 | 132 | 133 | 127 | 125 | 126 | 125 | 124 | 125 | 125 | 1,708 | |||||||||||||||||||||||||||||||||||||||||||||||||
| Third Party Concentrate | kt | 338 | 295 | 303 | 308 | 308 | 215 | 157 | 208 | 202 | 243 | 241 | 234 | 266 | 286 | 290 | 3,894 | |||||||||||||||||||||||||||||||||||||||||||||||||
| Third Party Concentrate Grade | % | 32.53 | % | 31.80 | % | 32.04 | % | 33.29 | % | 33.29 | % | 33.21 | % | 33.12 | % | 33.20 | % | 33.19 | % | 33.24 | % | 33.24 | % | 33.23 | % | 33.26 | % | 33.27 | % | 33.28 | % | 32.98 | % | |||||||||||||||||||||||||||||||||
| Third Party Metal Production | kt | 108 | 92 | 95 | 101 | 101 | 70 | 51 | 68 | 66 | 79 | 79 | 76 | 87 | 93 | 95 | 1,260 | |||||||||||||||||||||||||||||||||||||||||||||||||
| Integrated Metal Production | kt | 98 | 102 | 140 | 248 | 272 | 304 | 314 | 312 | 308 | 292 | 294 | 296 | 284 | 279 | 277 | 3,819 | |||||||||||||||||||||||||||||||||||||||||||||||||
| Total Payable Copper | kt | 206 | 194 | 235 | 348 | 373 | 374 | 365 | 380 | 374 | 372 | 373 | 372 | 371 | 372 | 372 | 5,079 | |||||||||||||||||||||||||||||||||||||||||||||||||
| Revenue | ||||||||||||||||||||||||||||||||||||||||||||||||||||||||||||||||||
| Gross Revenue | US$M | 2,525 | 2,347 | 2,777 | 4,134 | 4,269 | 4,008 | 3,908 | 4,058 | 3,993 | 3,969 | 3,979 | 3,974 | 3,954 | 3,967 | 3,968 | 55,829 | |||||||||||||||||||||||||||||||||||||||||||||||||
| Operating Costs | ||||||||||||||||||||||||||||||||||||||||||||||||||||||||||||||||||
| Mining Operating Costs | US$M | 605 | 542 | 693 | 1,141 | 1,185 | 1,363 | 1,359 | 1,310 | 1,261 | 1,183 | 1,161 | 1,204 | 1,120 | 1,071 | 1,071 | 16,271 | |||||||||||||||||||||||||||||||||||||||||||||||||
| Smelter & Refinery OPEX | US$M | 124 | 130 | 132 | 139 | 146 | 146 | 137 | 138 | 138 | 138 | 138 | 138 | 136 | 136 | 136 | 2,049 | |||||||||||||||||||||||||||||||||||||||||||||||||
| Smelter & Refinery Credits | US$M | -73 | -72 | -65 | -78 | -92 | -97 | -98 | -99 | -100 | -99 | -99 | -98 | -100 | -101 | -102 | -1,372 | |||||||||||||||||||||||||||||||||||||||||||||||||
| Concentrate Purchase Cost | US$M | 1,247 | 1,036 | 1,049 | 1,104 | 1,059 | 679 | 489 | 656 | 634 | 769 | 763 | 740 | 842 | 908 | 922 | 12,899 | |||||||||||||||||||||||||||||||||||||||||||||||||
| Total Royalties | US$M | 96 | 97 | 129 | 229 | 239 | 245 | 253 | 251 | 248 | 235 | 237 | 238 | 229 | 224 | 223 | 3,173 | |||||||||||||||||||||||||||||||||||||||||||||||||
| Capital Costs | ||||||||||||||||||||||||||||||||||||||||||||||||||||||||||||||||||
| Growth Capital | US$M | 223 | 493 | 471 | 70 | 121 | 120 | 69 | 35 | 21 | 0 | 0 | 0 | 0 | 1 | 1 | 1,626 | |||||||||||||||||||||||||||||||||||||||||||||||||
| Capital Development | US$M | 196 | 166 | 177 | 146 | 178 | 209 | 207 | 216 | 175 | 119 | 111 | 110 | 103 | 85 | 86 | 2,282 | |||||||||||||||||||||||||||||||||||||||||||||||||
| Sustaining Capital | US$M | 103 | 103 | 98 | 97 | 86 | 97 | 116 | 104 | 95 | 107 | 90 | 82 | 101 | 74 | 72 | 1,423 | |||||||||||||||||||||||||||||||||||||||||||||||||
| Total Capital | US$M | 521 | 761 | 746 | 312 | 385 | 425 | 392 | 355 | 291 | 226 | 201 | 192 | 204 | 160 | 159 | 5,331 | |||||||||||||||||||||||||||||||||||||||||||||||||
| Unit Costs | ||||||||||||||||||||||||||||||||||||||||||||||||||||||||||||||||||
| C1 Cash Cost⁴ | US$M | 622 | 564 | 722 | 1,173 | 1,216 | 1,397 | 1,389 | 1,338 | 1,289 | 1,209 | 1,188 | 1,231 | 1,143 | 1,092 | 1,092 | 16,668 | |||||||||||||||||||||||||||||||||||||||||||||||||
| C1 Cash Cost⁴ | US$/lb Cu | 2.87 | 2.50 | 2.35 | 2.15 | 2.03 | 2.08 | 2.01 | 1.95 | 1.90 | 1.88 | 1.83 | 1.89 | 1.83 | 1.78 | 1.79 | 1.98 | |||||||||||||||||||||||||||||||||||||||||||||||||
| AISC⁴ | US$M | 821 | 764 | 950 | 1,499 | 1,541 | 1,739 | 1,758 | 1,693 | 1,632 | 1,551 | 1,514 | 1,551 | 1,474 | 1,390 | 1,387 | 21,264 | |||||||||||||||||||||||||||||||||||||||||||||||||
| AISC⁴ | US$/lb Cu | 3.78 | 3.39 | 3.09 | 2.75 | 2.57 | 2.59 | 2.54 | 2.46 | 2.40 | 2.41 | 2.34 | 2.38 | 2.35 | 2.26 | 2.27 | 2.53 | |||||||||||||||||||||||||||||||||||||||||||||||||
| Cash Flow | ||||||||||||||||||||||||||||||||||||||||||||||||||||||||||||||||||
| Free Cash Flow (pre-tax) | US$M | 3 | -147 | 92 | 1,286 | 1,347 | 1,247 | 1,376 | 1,447 | 1,522 | 1,516 | 1,579 | 1,560 | 1,523 | 1,569 | 1,558 | 17,479 | |||||||||||||||||||||||||||||||||||||||||||||||||
| Free Cash Flow (post-tax) | US$M | -65 | -215 | 4 | 1,090 | 1,101 | 861 | 975 | 1,050 | 1,116 | 1,115 | 1,147 | 1,127 | 1,092 | 1,128 | 1,112 | 12,640 | |||||||||||||||||||||||||||||||||||||||||||||||||
| amcconsultants.com | 307 |
| S-K 1300 TRS: KCM Integrated Operations (Initial Assessment) | |
| Konkola Copper Mines Plc | 0424076 |
| Item | Unit | FY2041/42 | FY2042/43 | FY2043/44 | FY2044/45 | FY2045/46 | FY2046/47 | FY2047/48 | FY2048/49 | FY2049/50 | FY2050/51 | FY2051/52 | FY2052/53 | FY2053/54 | FY2054/55 | FY2055/56 | Block 27 Subtotal | |||||||||||||||||||||||||||||||||||||||||||||||||
| Production | ||||||||||||||||||||||||||||||||||||||||||||||||||||||||||||||||||
| KCM UG Ore Mined | kt | 6,001 | 6,000 | 6,002 | 6,003 | 6,000 | 6,000 | 6,000 | 6,002 | 6,002 | 6,004 | 6,000 | 6,000 | 5,999 | 6,000 | 6,000 | 90,014 | |||||||||||||||||||||||||||||||||||||||||||||||||
| KCM UG Head Grade | %TCu | 3.06 | % | 3.13 | % | 3.07 | % | 2.99 | % | 2.99 | % | 3.03 | % | 3.04 | % | 3.04 | % | 2.95 | % | 2.98 | % | 3.02 | % | 3.05 | % | 3.04 | % | 2.99 | % | 2.94 | % | 3.02 | % | |||||||||||||||||||||||||||||||||
| KCM UG Recovery | % | 86.17 | % | 86.25 | % | 85.19 | % | 85.39 | % | 85.73 | % | 85.37 | % | 85.75 | % | 85.74 | % | 84.91 | % | 85.09 | % | 84.48 | % | 84.09 | % | 84.18 | % | 84.66 | % | 85.89 | % | 85.26 | % | |||||||||||||||||||||||||||||||||
| KCM UG Cu Payable | kt | 155 | 159 | 154 | 151 | 151 | 152 | 154 | 153 | 148 | 149 | 150 | 151 | 151 | 149 | 149 | 2,275 | |||||||||||||||||||||||||||||||||||||||||||||||||
| NBU Ore Mined (OP + UG) | kt | 0 | 0 | 0 | 0 | 0 | 0 | 0 | 0 | 0 | 0 | 0 | 0 | 0 | 0 | 0 | 0 | |||||||||||||||||||||||||||||||||||||||||||||||||
| NBU Cu Payable | kt | 0.0 | 0.0 | 0.0 | 0.0 | 0.0 | 0.0 | 0.0 | 0.0 | 0.0 | 0.0 | 0.0 | 0.0 | 0.0 | 0.0 | 0.0 | 0.0 | |||||||||||||||||||||||||||||||||||||||||||||||||
| Nchanga TLP Ore Mined | kt | 24,832 | 0 | 0 | 0 | 0 | 0 | 0 | 0 | 0 | 0 | 0 | 0 | 0 | 0 | 0 | 24,832 | |||||||||||||||||||||||||||||||||||||||||||||||||
| Nchanga TLP Head Grade | %TCu | 0.54 | % | 0.00 | % | 0.00 | % | 0.00 | % | 0.00 | % | 0.00 | % | 0.00 | % | 0.00 | % | 0.00 | % | 0.00 | % | 0.00 | % | 0.00 | % | 0.00 | % | 0.00 | % | 0.00 | % | 0.54 | % | |||||||||||||||||||||||||||||||||
| Nchanga TLP Recovery | % | 67.99 | % | 0.00 | % | 0.00 | % | 0.00 | % | 0.00 | % | 0.00 | % | 0.00 | % | 0.00 | % | 0.00 | % | 0.00 | % | 0.00 | % | 0.00 | % | 0.00 | % | 0.00 | % | 0.00 | % | 67.99 | % | |||||||||||||||||||||||||||||||||
| Nchanga TLP Cu Payable | kt | 91 | 0 | 0 | 0 | 0 | 0 | 0 | 0 | 0 | 0 | 0 | 0 | 0 | 0 | 0 | 91 | |||||||||||||||||||||||||||||||||||||||||||||||||
| Third Party Concentrate | kt | 281 | 269 | 285 | 296 | 295 | 291 | 286 | 287 | 308 | 308 | 297 | 294 | 296 | 308 | 308 | 4,410 | |||||||||||||||||||||||||||||||||||||||||||||||||
| Third Party Concentrate Grade | % | 33.27 | % | 33.26 | % | 33.27 | % | 33.28 | % | 33.28 | % | 33.28 | % | 33.27 | % | 33.27 | % | 33.29 | % | 33.29 | % | 34.56 | % | 33.64 | % | 33.05 | % | 31.93 | % | 33.29 | % | 33.28 | % | |||||||||||||||||||||||||||||||||
| Third Party Metal Production | kt | 92 | 88 | 93 | 97 | 96 | 95 | 93 | 94 | 101 | 101 | 101 | 97 | 96 | 97 | 101 | 1,440 | |||||||||||||||||||||||||||||||||||||||||||||||||
| Integrated Metal Production | kt | 246 | 159 | 154 | 151 | 151 | 152 | 154 | 153 | 148 | 149 | 150 | 151 | 151 | 149 | 149 | 2,366 | |||||||||||||||||||||||||||||||||||||||||||||||||
| Total Payable Copper | kt | 338 | 247 | 247 | 247 | 247 | 247 | 247 | 247 | 248 | 250 | 251 | 248 | 247 | 246 | 249 | 3,806 | |||||||||||||||||||||||||||||||||||||||||||||||||
| Revenue | ||||||||||||||||||||||||||||||||||||||||||||||||||||||||||||||||||
| Gross Revenue | US$M | 3,593 | 2,603 | 2,607 | 2,610 | 2,610 | 2,609 | 2,607 | 2,608 | 2,623 | 2,639 | 2,610 | 2,609 | 2,610 | 2,639 | 2,631 | 40,209 | |||||||||||||||||||||||||||||||||||||||||||||||||
| Operating Costs | ||||||||||||||||||||||||||||||||||||||||||||||||||||||||||||||||||
| Mining Operating Costs | US$M | 1,065 | 552 | 542 | 543 | 540 | 553 | 554 | 560 | 560 | 558 | 552 | 557 | 545 | 535 | 529 | 8,745 | |||||||||||||||||||||||||||||||||||||||||||||||||
| Smelter & Refinery OPEX | US$M | 136 | 136 | 136 | 136 | 136 | 136 | 136 | 136 | 136 | 136 | 136 | 136 | 136 | 136 | 136 | 2,037 | |||||||||||||||||||||||||||||||||||||||||||||||||
| Smelter & Refinery Credits | US$M | -101 | -100 | -100 | -101 | -101 | -100 | -99 | -99 | -100 | -100 | -92 | -92 | -99 | -93 | -93 | -1,471 | |||||||||||||||||||||||||||||||||||||||||||||||||
| Concentrate Purchase Cost | US$M | 892 | 853 | 906 | 940 | 939 | 925 | 907 | 911 | 981 | 981 | 944 | 934 | 941 | 981 | 981 | 14,016 | |||||||||||||||||||||||||||||||||||||||||||||||||
| Total Royalties | US$M | 198 | 128 | 124 | 121 | 121 | 122 | 124 | 123 | 119 | 120 | 121 | 122 | 121 | 120 | 120 | 1,905 | |||||||||||||||||||||||||||||||||||||||||||||||||
| Capital Costs | ||||||||||||||||||||||||||||||||||||||||||||||||||||||||||||||||||
| Growth Capital | US$M | 0 | 0 | 0 | 0 | 0 | 0 | 0 | 0 | 0 | 0 | 0 | 0 | 0 | 0 | 0 | 0 | |||||||||||||||||||||||||||||||||||||||||||||||||
| Capital Development | US$M | 94 | 81 | 68 | 76 | 69 | 83 | 77 | 69 | 70 | 72 | 60 | 60 | 62 | 51 | 40 | 1,032 | |||||||||||||||||||||||||||||||||||||||||||||||||
| Sustaining Capital | US$M | 72 | 49 | 56 | 61 | 39 | 38 | 66 | 55 | 35 | 53 | 31 | 33 | 39 | 29 | 27 | 684 | |||||||||||||||||||||||||||||||||||||||||||||||||
| Total Capital | US$M | 165 | 131 | 124 | 137 | 108 | 120 | 143 | 124 | 106 | 125 | 91 | 93 | 101 | 79 | 68 | 1,716 | |||||||||||||||||||||||||||||||||||||||||||||||||
| Unit Costs | ||||||||||||||||||||||||||||||||||||||||||||||||||||||||||||||||||
| C1 Cash Cost⁴ | US$M | 1,086 | 575 | 564 | 564 | 561 | 575 | 576 | 583 | 582 | 579 | 578 | 583 | 567 | 561 | 554 | 9,092 | |||||||||||||||||||||||||||||||||||||||||||||||||
| C1 Cash Cost⁴ | US$/lb Cu | 2.00 | 1.64 | 1.66 | 1.70 | 1.69 | 1.72 | 1.70 | 1.72 | 1.79 | 1.76 | 1.75 | 1.75 | 1.71 | 1.70 | 1.69 | 1.74 | |||||||||||||||||||||||||||||||||||||||||||||||||
| AISC⁴ | US$M | 1,356 | 752 | 744 | 747 | 722 | 735 | 766 | 761 | 736 | 753 | 731 | 738 | 727 | 710 | 701 | 11,680 | |||||||||||||||||||||||||||||||||||||||||||||||||
| AISC⁴ | US$/lb Cu | 2.50 | 2.15 | 2.19 | 2.25 | 2.17 | 2.19 | 2.26 | 2.25 | 2.26 | 2.29 | 2.21 | 2.21 | 2.19 | 2.16 | 2.14 | 2.24 | |||||||||||||||||||||||||||||||||||||||||||||||||
| Cash Flow | ||||||||||||||||||||||||||||||||||||||||||||||||||||||||||||||||||
| Free Cash Flow (pre-tax) | US$M | 1,239 | 904 | 876 | 833 | 867 | 852 | 843 | 852 | 820 | 818 | 858 | 860 | 865 | 881 | 891 | 13,260 | |||||||||||||||||||||||||||||||||||||||||||||||||
| Free Cash Flow (post-tax) | US$M | 880 | 649 | 627 | 590 | 619 | 603 | 588 | 599 | 580 | 572 | 609 | 609 | 609 | 625 | 634 | 9,393 | |||||||||||||||||||||||||||||||||||||||||||||||||
| amcconsultants.com | 308 |
| S-K 1300 TRS: KCM Integrated Operations (Initial Assessment) | |
| Konkola Copper Mines Plc | 0424076 |
| Item | Unit | FY2056/57 | FY2057/58 | FY2058/59 | FY2059/60 | FY2060/61 | FY2061/62 | FY2062/63 | FY2063/64 | FY2064/65 | FY2065/66 | FY2066/67 | FY2067/68 | FY2068/69 | FY2069/70 | FY2070/71 | Block 37 Subtotal | LOM Total | ||||||||||||||||||||||||||||||||||||||||||||||||||||
| Production | ||||||||||||||||||||||||||||||||||||||||||||||||||||||||||||||||||||||
| KCM UG Ore Mined | kt | 6,003 | 6,007 | 6,000 | 6,005 | 6,002 | 6,002 | 6,001 | 6,002 | 6,000 | 5,047 | 3,947 | 3,052 | 2,185 | 1,012 | 311 | 69,575 | 232,775 | ||||||||||||||||||||||||||||||||||||||||||||||||||||
| KCM UG Head Grade | %TCu | 2.98 | % | 3.03 | % | 3.02 | % | 2.94 | % | 2.76 | % | 2.73 | % | 2.70 | % | 2.69 | % | 2.72 | % | 2.75 | % | 2.77 | % | 2.88 | % | 2.86 | % | 3.02 | % | 2.76 | % | 2.83 | % | 2.94 | % | |||||||||||||||||||||||||||||||||||
| KCM UG Recovery | % | 86.78 | % | 87.10 | % | 87.41 | % | 88.72 | % | 88.46 | % | 87.47 | % | 87.09 | % | 87.50 | % | 86.67 | % | 87.10 | % | 88.03 | % | 88.54 | % | 89.81 | % | 88.41 | % | 93.00 | % | 87.63 | % | 86.52 | % | |||||||||||||||||||||||||||||||||||
| KCM UG Cu Payable | kt | 152 | 155 | 156 | 153 | 144 | 140 | 138 | 138 | 139 | 119 | 94 | 76 | 55 | 27 | 8 | 1,695 | 5,816 | ||||||||||||||||||||||||||||||||||||||||||||||||||||
| NBU Ore Mined (OP + UG) | kt | 0 | 0 | 0 | 0 | 0 | 0 | 0 | 0 | 0 | 0 | 0 | 0 | 0 | 0 | 0 | 0 | 20,861 | ||||||||||||||||||||||||||||||||||||||||||||||||||||
| NBU Cu Payable | kt | 0.0 | 0.0 | 0.0 | 0.0 | 0.0 | 0.0 | 0.0 | 0.0 | 0.0 | 0.0 | 0.0 | 0.0 | 0.0 | 0.0 | 0.0 | 0.0 | 266 | ||||||||||||||||||||||||||||||||||||||||||||||||||||
| Nchanga TLP Ore Mined | kt | 0 | 0 | 0 | 0 | 0 | 0 | 0 | 0 | 0 | 0 | 0 | 0 | 0 | 0 | 0 | 0 | 473,636 | ||||||||||||||||||||||||||||||||||||||||||||||||||||
| Nchanga TLP Head Grade | %TCu | 0.00 | % | 0.00 | % | 0.00 | % | 0.00 | % | 0.00 | % | 0.00 | % | 0.00 | % | 0.00 | % | 0.00 | % | 0.00 | % | 0.00 | % | 0.00 | % | 0.00 | % | 0.00 | % | 0.00 | % | 0.00 | % | 0.57 | % | |||||||||||||||||||||||||||||||||||
| Nchanga TLP Recovery | % | 0.00 | % | 0.00 | % | 0.00 | % | 0.00 | % | 0.00 | % | 0.00 | % | 0.00 | % | 0.00 | % | 0.00 | % | 0.00 | % | 0.00 | % | 0.00 | % | 0.00 | % | 0.00 | % | 0.00 | % | 0.00 | % | 66.76 | % | |||||||||||||||||||||||||||||||||||
| Nchanga TLP Cu Payable | kt | 0 | 0 | 0 | 0 | 0 | 0 | 0 | 0 | 0 | 0 | 0 | 0 | 0 | 0 | 0 | 0 | 1,798 | ||||||||||||||||||||||||||||||||||||||||||||||||||||
| Third Party Concentrate | kt | 290 | 280 | 279 | 287 | 308 | 308 | 308 | 308 | 308 | 308 | 308 | 308 | 308 | 308 | 308 | 4,529 | 12,833 | ||||||||||||||||||||||||||||||||||||||||||||||||||||
| Third Party Concentrate Grade | % | 35.36 | % | 34.47 | % | 33.38 | % | 32.44 | % | 30.91 | % | 33.29 | % | 33.29 | % | 33.29 | % | 33.29 | % | 33.29 | % | 33.29 | % | 33.29 | % | 33.29 | % | 33.29 | % | 33.29 | % | 33.28 | % | 33.19 | % | |||||||||||||||||||||||||||||||||||
| Third Party Metal Production | kt | 101 | 95 | 92 | 91 | 94 | 101 | 101 | 101 | 101 | 101 | 101 | 101 | 101 | 101 | 101 | 1,479 | 4,180 | ||||||||||||||||||||||||||||||||||||||||||||||||||||
| Integrated Metal Production | kt | 152 | 155 | 156 | 153 | 144 | 140 | 138 | 138 | 139 | 119 | 94 | 76 | 55 | 27 | 8 | 1,695 | 7,880 | ||||||||||||||||||||||||||||||||||||||||||||||||||||
| Total Payable Copper | kt | 253 | 250 | 247 | 245 | 237 | 241 | 239 | 239 | 240 | 219 | 195 | 177 | 156 | 127 | 109 | 3,175 | 12,060 | ||||||||||||||||||||||||||||||||||||||||||||||||||||
| Revenue | ||||||||||||||||||||||||||||||||||||||||||||||||||||||||||||||||||||||
| Gross Revenue | US$M | 2,609 | 2,606 | 2,606 | 2,608 | 2,579 | 2,545 | 2,522 | 2,524 | 2,528 | 2,315 | 2,056 | 1,864 | 1,639 | 1,335 | 1,136 | 33,472 | 129,510 | ||||||||||||||||||||||||||||||||||||||||||||||||||||
| Operating Costs | ||||||||||||||||||||||||||||||||||||||||||||||||||||||||||||||||||||||
| Mining Operating Costs | US$M | 525 | 524 | 521 | 518 | 510 | 518 | 511 | 508 | 507 | 454 | 394 | 341 | 288 | 218 | 26 | 6,361 | 31,378 | ||||||||||||||||||||||||||||||||||||||||||||||||||||
| Smelter & Refinery OPEX | US$M | 136 | 136 | 136 | 136 | 135 | 135 | 134 | 134 | 134 | 130 | 126 | 122 | 118 | 105 | 97 | 1,913 | 5,999 | ||||||||||||||||||||||||||||||||||||||||||||||||||||
| Smelter & Refinery Credits | US$M | -92 | -92 | -92 | -92 | -98 | -98 | -99 | -99 | -99 | -91 | -77 | -70 | -62 | -51 | -46 | -1,258 | -4,101 | ||||||||||||||||||||||||||||||||||||||||||||||||||||
| Concentrate Purchase Cost | US$M | 922 | 890 | 887 | 910 | 981 | 981 | 981 | 981 | 981 | 981 | 981 | 981 | 981 | 981 | 981 | 14,401 | 41,317 | ||||||||||||||||||||||||||||||||||||||||||||||||||||
| Total Royalties | US$M | 123 | 125 | 125 | 124 | 116 | 113 | 111 | 111 | 112 | 96 | 76 | 61 | 44 | 21 | 6 | 1,365 | 6,443 | ||||||||||||||||||||||||||||||||||||||||||||||||||||
| Capital Costs | ||||||||||||||||||||||||||||||||||||||||||||||||||||||||||||||||||||||
| Growth Capital | US$M | 0 | 0 | 0 | 0 | 0 | 0 | 0 | 0 | 0 | 0 | 0 | 0 | 0 | 0 | 0 | 0 | 1,626 | ||||||||||||||||||||||||||||||||||||||||||||||||||||
| Capital Development | US$M | 30 | 25 | 23 | 5 | 3 | 3 | 3 | 3 | 3 | 2 | 2 | 1 | 1 | 0 | 0 | 105 | 3,419 | ||||||||||||||||||||||||||||||||||||||||||||||||||||
| Sustaining Capital | US$M | 48 | 33 | 33 | 26 | 39 | 34 | 31 | 40 | 27 | 26 | 27 | 25 | 27 | 23 | 5 | 444 | 2,551 | ||||||||||||||||||||||||||||||||||||||||||||||||||||
| Total Capital | US$M | 79 | 58 | 56 | 31 | 42 | 36 | 33 | 43 | 30 | 29 | 29 | 27 | 28 | 23 | 5 | 549 | 7,595 | ||||||||||||||||||||||||||||||||||||||||||||||||||||
| Unit Costs | ||||||||||||||||||||||||||||||||||||||||||||||||||||||||||||||||||||||
| C1 Cash Cost⁴ | US$M | 551 | 551 | 548 | 545 | 532 | 539 | 531 | 528 | 528 | 475 | 418 | 364 | 308 | 229 | 29 | 6,677 | 32,437 | ||||||||||||||||||||||||||||||||||||||||||||||||||||
| C1 Cash Cost⁴ | US$/lb Cu | 1.64 | 1.61 | 1.60 | 1.61 | 1.68 | 1.74 | 1.74 | 1.73 | 1.72 | 1.82 | 2.01 | 2.16 | 2.53 | 3.91 | 1.71 | 1.79 | 1.87 | ||||||||||||||||||||||||||||||||||||||||||||||||||||
| AISC⁴ | US$M | 722 | 709 | 707 | 695 | 687 | 685 | 673 | 680 | 666 | 597 | 521 | 451 | 379 | 273 | 40 | 8,486 | 41,430 | ||||||||||||||||||||||||||||||||||||||||||||||||||||
| AISC⁴ | US$/lb Cu | 2.15 | 2.07 | 2.06 | 2.06 | 2.17 | 2.21 | 2.21 | 2.23 | 2.18 | 2.28 | 2.50 | 2.68 | 3.11 | 4.67 | 2.34 | 2.27 | 2.38 | ||||||||||||||||||||||||||||||||||||||||||||||||||||
| Cash Flow | ||||||||||||||||||||||||||||||||||||||||||||||||||||||||||||||||||||||
| Free Cash Flow (pre-tax) | US$M | 916 | 966 | 973 | 981 | 893 | 861 | 850 | 845 | 863 | 716 | 489 | 351 | 203 | 36 | 66 | 10,010 | 40,746 | ||||||||||||||||||||||||||||||||||||||||||||||||||||
| Free Cash Flow (post-tax) | US$M | 646 | 685 | 688 | 699 | 632 | 609 | 601 | 593 | 608 | 504 | 333 | 233 | 132 | 27 | 52 | 7,042 | 29,072 | ||||||||||||||||||||||||||||||||||||||||||||||||||||
| amcconsultants.com | 309 |
| S-K 1300 TRS: KCM Integrated Operations (Initial Assessment) | |
| Konkola Copper Mines Plc | 0424076 |
Notes:
| 1 | This Initial Assessment is preliminary in nature and includes Inferred Mineral Resources that are considered too geologically speculative to have modifying factors applied to them that would enable them to be classified as Mineral Reserves. There is no certainty that the results of this Initial Assessment will be realized. |
| 2 | Approximately 63% of the Mineral Resources included in this case are classified as Inferred (483 Mt of 773 Mt). Inferred Mineral Resources have not been classified as Mineral Reserves and the economic viability of Inferred Mineral Resources has not been demonstrated. |
| 3 | Period head grades and recoveries represent weighted averages of ore processed during each period. |
| 4 | C1 Cash Cost and All-in Sustaining Cost (AISC) are non-GAAP measures. C1 Cash Cost includes all direct mining, processing, and site G&A costs, and smelter and refinery costs net of by-product credits (acid and cobalt revenue and incremental copper profit generated by the Nchanga Smelter and Refinery from KCM concentrates). The incremental smelter margin attributable to third-party concentrate processing is excluded from the C1 calculation. Treatment and refining charges (TC/RC) and freight remain as revenue deductions and are excluded from C1. AISC is defined as C1 Cash Cost plus royalties and sustaining capital expenditure. Full definitions and reconciliation provided in Section 18. |
| 5 | Pre-tax, real (2026) basis. Discount rate: 8%. |
| 6 | Rounding may cause apparent computational discrepancies. |
| 7 | Total Capital excludes Closure Costs. Closure Cost is included within Sustaining Capital and is presented separately in Table 1.13 for transparency; refer Sections 17.1, 17.3, and 19 for closure cost detail. |
| 8 | Block 1 covers the first 15 years of the schedule (FY2026/27–FY2040/41). Includes Konkola Mine ramp-up from ~43 ktpa to ~150 ktpa, full TD03/TD04 TLP reclamation (FY2026/27–FY2029/30), and Nchanga Business Unit (NBU) production from COP DF and COP E Extension open pit and underground operations. The companion PFS TRS Mineral Reserve scope (Konkola Mine, TD03, and TD04 only) completes within approximately the first 11 years of this block. Capital intensity is highest in this block as the Konkola Deep Mine Project is executed. |
| 9 | Block 2 covers the next 15 years (FY2041/42–FY2055/56) of Konkola Mine operating at sustained steady-state throughput of approximately 6 Mtpa, delivering ~150 ktpa of payable copper. NBU and existing-TLP operations have ceased; TLP 2 completes TD05 reclamation in the early years of Block 2 (FY2041/42). The smelter runs at near-nameplate capacity with third-party concentrate supplementing Konkola feed. Capital requirements reduce materially to sustaining-only levels. Unit costs reach their lowest point across the LOM. |
| 10 | Block 3 covers the final 15 years (FY2056/57–FY2070/71) of Konkola Mine operations as the orebody transitions to deeper, lower-productivity zones and approaches mine closure. Production declines progressively from ~150 ktpa to ~8 ktpa in the final year. Sustaining capital remains active; closure costs of US$133M are incurred in the final years. Unit costs increase relative to Block 2 as fixed costs are spread over declining volumes. |
| 11 | Gross Revenue represents total revenue from all copper sold (including copper produced from third-party concentrate), net of freight and refining costs. Net Revenue, as presented in Table 1.13, is Gross Revenue less third-party concentrate purchase cost. Over the life of mine, Gross Revenue of US$129,510M less concentrate purchase cost of US$41,317M equals Net Revenue of US$88,194M. |
| amcconsultants.com | 310 |
| S-K 1300 TRS: KCM Integrated Operations (Initial Assessment) | |
| Konkola Copper Mines Plc | 0424076 |
Table 19.4 M&I Case production and cashflow schedule
| Item | Unit | FY2026/27 | FY2027/28 | FY2028/29 | FY2029/30 | FY2030/31 | FY2031/32 | FY2032/33 | FY2033/34 | FY2034/35 | FY2035/36 | FY2036/37 | FY2037/38 | FY2038/39 | FY2039/40 | FY2040/41 | Total | |||||||||||||||||||||||||||||||||||||||||||||||||
| Production | ||||||||||||||||||||||||||||||||||||||||||||||||||||||||||||||||||
| KCM UG Ore Mined | kt | 1,640 | 2,194 | 2,185 | 3,828 | 3,651 | 3,417 | 3,455 | 3,424 | 2,428 | 1,757 | 1,087 | 0 | 0 | 0 | 0 | 29,066 | |||||||||||||||||||||||||||||||||||||||||||||||||
| KCM UG Head Grade | %TCu | 3.01 | % | 2.89 | % | 2.81 | % | 3.01 | % | 3.02 | % | 2.87 | % | 2.79 | % | 2.81 | % | 2.85 | % | 2.80 | % | 2.79 | % | 0.00 | % | 0.00 | % | 0.00 | % | 0.00 | % | 2.89 | % | |||||||||||||||||||||||||||||||||
| KCM UG Recovery | % | 88.30 | % | 90.00 | % | 91.22 | % | 88.07 | % | 88.35 | % | 88.39 | % | 89.00 | % | 89.95 | % | 89.90 | % | 89.71 | % | 89.31 | % | 0.00 | % | 0.00 | % | 0.00 | % | 0.00 | % | 89.17 | % | |||||||||||||||||||||||||||||||||
| KCM UG Cu Payable | kt | 43 | 56 | 55 | 99 | 96 | 85 | 84 | 85 | 61 | 43 | 27 | 0 | 0 | 0 | 0 | 734 | |||||||||||||||||||||||||||||||||||||||||||||||||
| NBU Ore Mined (OP + UG) | kt | 0 | 0 | 0 | 0 | 0 | 0 | 0 | 0 | 0 | 0 | 0 | 0 | 0 | 0 | 0 | 0 | |||||||||||||||||||||||||||||||||||||||||||||||||
| NBU Cu Payable | kt | 0.0 | 0.0 | 0.0 | 0.0 | 0.0 | 0.0 | 0.0 | 0.0 | 0.0 | 0.0 | 0.0 | 0.0 | 0.0 | 0.0 | 0.0 | 0.0 | |||||||||||||||||||||||||||||||||||||||||||||||||
| Nchanga TLP Ore Mined | kt | 6,490 | 15,207 | 16,707 | 16,707 | 16,707 | 16,707 | 16,707 | 16,707 | 16,707 | 16,707 | 16,707 | 16,707 | 16,707 | 16,707 | 2,425 | 224,607 | |||||||||||||||||||||||||||||||||||||||||||||||||
| Nchanga TLP Head Grade | %TCu | 0.57 | % | 0.61 | % | 0.61 | % | 0.55 | % | 0.55 | % | 0.55 | % | 0.55 | % | 0.55 | % | 0.55 | % | 0.55 | % | 0.55 | % | 0.55 | % | 0.55 | % | 0.55 | % | 0.55 | % | 0.56 | % | |||||||||||||||||||||||||||||||||
| Nchanga TLP Recovery | % | 49.05 | % | 54.56 | % | 54.83 | % | 56.12 | % | 57.72 | % | 57.72 | % | 57.72 | % | 57.72 | % | 57.72 | % | 57.72 | % | 57.72 | % | 57.72 | % | 57.72 | % | 57.72 | % | 43.32 | % | 56.73 | % | |||||||||||||||||||||||||||||||||
| Nchanga TLP Cu Payable | kt | 18 | 50 | 56 | 52 | 53 | 53 | 53 | 53 | 53 | 53 | 53 | 53 | 53 | 53 | 6 | 713 | |||||||||||||||||||||||||||||||||||||||||||||||||
| Third Party Concentrate | kt | 338 | 306 | 315 | 308 | 308 | 308 | 308 | 308 | 308 | 308 | 308 | 0 | 0 | 0 | 0 | 3,425 | |||||||||||||||||||||||||||||||||||||||||||||||||
| Third Party Concentrate Grade | % | 32.53 | % | 32.40 | % | 32.61 | % | 33.29 | % | 33.29 | % | 33.29 | % | 33.29 | % | 33.29 | % | 33.29 | % | 33.29 | % | 33.29 | % | 0.00 | % | 0.00 | % | 0.00 | % | 0.00 | % | 33.07 | % | |||||||||||||||||||||||||||||||||
| Third Party Metal Production | kt | 108 | 97 | 101 | 101 | 101 | 101 | 101 | 101 | 101 | 101 | 101 | 0 | 0 | 0 | 0 | 1,112 | |||||||||||||||||||||||||||||||||||||||||||||||||
| Integrated Metal Production | kt | 61 | 106 | 111 | 151 | 149 | 138 | 137 | 138 | 114 | 96 | 80 | 53 | 53 | 53 | 6 | 1,446 | |||||||||||||||||||||||||||||||||||||||||||||||||
| Total Payable Copper | kt | 169 | 204 | 212 | 252 | 249 | 239 | 238 | 239 | 215 | 197 | 180 | 53 | 53 | 53 | 6 | 2,558 | |||||||||||||||||||||||||||||||||||||||||||||||||
| Revenue | ||||||||||||||||||||||||||||||||||||||||||||||||||||||||||||||||||
| Gross Revenue | US$M | 2,023 | 2,382 | 2,437 | 2,907 | 2,792 | 2,539 | 2,528 | 2,534 | 2,280 | 2,092 | 1,914 | 580 | 580 | 584 | 64 | 28,235 | |||||||||||||||||||||||||||||||||||||||||||||||||
| Operating Costs | ||||||||||||||||||||||||||||||||||||||||||||||||||||||||||||||||||
| Mining Operating Costs | US$M | 425 | 574 | 595 | 677 | 676 | 663 | 634 | 632 | 567 | 531 | 482 | 269 | 269 | 268 | 93 | 7,355 | |||||||||||||||||||||||||||||||||||||||||||||||||
| Smelter & Refinery OPEX | US$M | 122 | 128 | 129 | 135 | 135 | 132 | 124 | 124 | 119 | 116 | 112 | 0 | 0 | 0 | 0 | 1,376 | |||||||||||||||||||||||||||||||||||||||||||||||||
| Smelter & Refinery Credits | US$M | -59 | -59 | -60 | -78 | -76 | -73 | -73 | -74 | -66 | -59 | -52 | 0 | 0 | 0 | 0 | -729 | |||||||||||||||||||||||||||||||||||||||||||||||||
| Concentrate Purchase Cost | US$M | 1,247 | 1,098 | 1,110 | 1,104 | 1,059 | 985 | 983 | 982 | 981 | 981 | 981 | 0 | 0 | 0 | 0 | 11,511 | |||||||||||||||||||||||||||||||||||||||||||||||||
| Total Royalties | US$M | 59 | 91 | 95 | 130 | 121 | 102 | 102 | 102 | 83 | 69 | 55 | 34 | 34 | 20 | 0 | 1,097 | |||||||||||||||||||||||||||||||||||||||||||||||||
| Capital Costs | ||||||||||||||||||||||||||||||||||||||||||||||||||||||||||||||||||
| Growth Capital | US$M | 60 | 110 | 103 | 38 | 12 | 10 | 7 | 3 | 0 | 0 | 0 | 0 | 0 | 0 | 0 | 342 | |||||||||||||||||||||||||||||||||||||||||||||||||
| Capital Development | US$M | 191 | 134 | 109 | 48 | 28 | 19 | 15 | 13 | 8 | 4 | 1 | 0 | 0 | 0 | 0 | 569 | |||||||||||||||||||||||||||||||||||||||||||||||||
| Sustaining Capital | US$M | 67 | 55 | 68 | 90 | 64 | 67 | 81 | 59 | 55 | 68 | 39 | 26 | 24 | 24 | 0 | 788 | |||||||||||||||||||||||||||||||||||||||||||||||||
| Total Capital | US$M | 318 | 299 | 279 | 176 | 104 | 96 | 102 | 75 | 63 | 72 | 40 | 26 | 24 | 24 | 0 | 1,699 | |||||||||||||||||||||||||||||||||||||||||||||||||
| Unit Costs | ||||||||||||||||||||||||||||||||||||||||||||||||||||||||||||||||||
| C1 Cash Cost⁴ | US$M | 442 | 600 | 619 | 706 | 704 | 690 | 657 | 654 | 587 | 548 | 494 | 0 | 0 | 0 | 0 | 6,701 | |||||||||||||||||||||||||||||||||||||||||||||||||
| C1 Cash Cost⁴ | US$/lb Cu | 3.30 | 2.56 | 2.52 | 2.12 | 2.15 | 2.26 | 2.17 | 2.15 | 2.34 | 2.58 | 2.82 | 0.00 | 0.00 | 0.00 | 0.00 | 2.10 | |||||||||||||||||||||||||||||||||||||||||||||||||
| AISC⁴ | US$M | 569 | 746 | 782 | 926 | 889 | 860 | 839 | 815 | 725 | 685 | 589 | 59 | 58 | 44 | 0 | 8,586 | |||||||||||||||||||||||||||||||||||||||||||||||||
| AISC⁴ | US$/lb Cu | 4.24 | 3.18 | 3.19 | 2.78 | 2.71 | 2.82 | 2.77 | 2.68 | 2.88 | 3.23 | 3.35 | 0.51 | 0.50 | 0.38 | 0.00 | 2.69 | |||||||||||||||||||||||||||||||||||||||||||||||||
| Cash Flow | ||||||||||||||||||||||||||||||||||||||||||||||||||||||||||||||||||
| Free Cash Flow (pre-tax) | US$M | -89 | 242 | 274 | 746 | 757 | 617 | 639 | 676 | 516 | 366 | 265 | 216 | 197 | 157 | 7 | 5,586 | |||||||||||||||||||||||||||||||||||||||||||||||||
| Free Cash Flow (post-tax) | US$M | -117 | 172 | 207 | 627 | 649 | 533 | 466 | 503 | 389 | 273 | 198 | 160 | 138 | 90 | 7 | 4,296 | |||||||||||||||||||||||||||||||||||||||||||||||||
Notes:
| 1 | The M&I Case is presented in accordance with Item 1302(d)(4)(ii)(C) and is based on Measured and Indicated Mineral Resources only. Any Inferred Mineral Resources within mine designs are treated as waste and assigned zero grade. |
| 2 | No Mineral Reserves are declared in this Initial Assessment. The M&I Case mine plan and technical parameters are consistent with those underpinning the Mineral Reserve estimate declared in the companion PFS Technical Report Summary (AMC, 2026). |
| 3 | NBU operations are excluded from the M&I Case as no Measured or Indicated Resources have been estimated for Nchanga open pit and underground deposits. |
| 4 | C1 and AISC are non-GAAP measures. C1 Cash Cost includes all direct mining, processing, and site G&A costs, and smelter and refinery costs net of by-product credits (acid and cobalt revenue and incremental copper profit generated by the Nchanga Smelter and refinery from KCM concentrates). The incremental smelter margin attributable to third-party concentrate processing is excluded from the C1 calculation. Treatment and refining charges (TC/RC) and freight deductions, normally accounted for as reductions in revenue, are added back to C1 cash costs to derive an approximate cost of finished metal. |
| 5 | Total Capital excludes Closure Costs, which are presented separately in Table 1.13 and discussed in Sections 17.1, 17.3, and 19. |
| 6 | Pre-tax, real (2026) basis. Discount rate: 8%. |
| 7 | Rounding may cause apparent computational discrepancies. |
| 8 | Gross Revenue represents total revenue from all copper sold, including copper produced from third-party concentrate. Net Revenue, as presented in Table 1.13, is Gross Revenue less third-party concentrate purchase cost. Over the life of mine, Gross Revenue of US$28,235M less concentrate purchase cost of US$11,511M equals Net Revenue of US$16,724M. |
| amcconsultants.com | 311 |
| S-K 1300 TRS: KCM Integrated Operations (Initial Assessment) | |
| Konkola Copper Mines Plc | 0424076 |
| 19.6 | Sensitivity analysis |
A sensitivity analysis on the NPV₈% was undertaken for both the Full Resource Case and M&I Case, testing copper price, cobalt price, operating costs, and capital costs. The results are shown in Figure 19.7, Figure 19.8, Table 19.5, and Table 19.6. In both cases, the project is most sensitive to changes in copper price and operating costs.
Figure 19.7 Sensitivity analysis graph – Full Resource Case
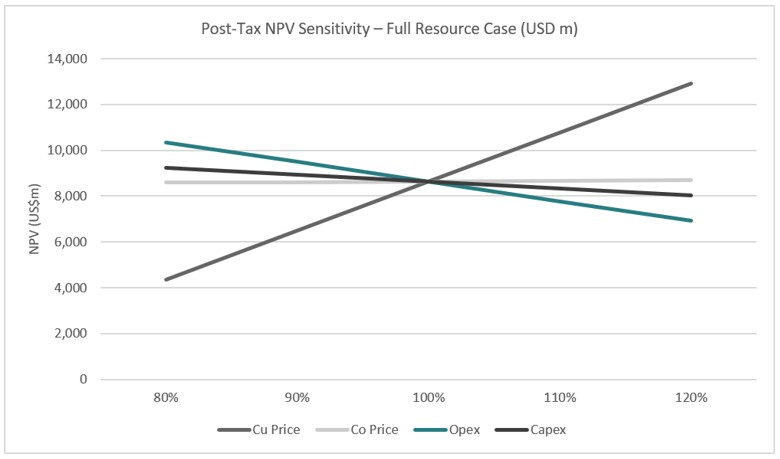
Source: AMC, 2026.
Sensitivity analysis on the NPV₈% for the Full Resource Case:
Table 19.5 Sensitivity analysis results – Full Resource Case
| Parameter | 80% | 90% | 100% | 110% | 120% | |||||||||||||||
| Cu Price (NPV US$M) | 4,344 | 6,491 | 8,637 | 10,784 | 12,930 | |||||||||||||||
| Co Price (NPV US$M) | 8,587 | 8,612 | 8,637 | 8,662 | 8,687 | |||||||||||||||
| OPEX (NPV US$M) | 10,355 | 9,496 | 8,637 | 7,778 | 6,919 | |||||||||||||||
| CAPEX (NPV US$M) | 9,240 | 8,938 | 8,637 | 8,336 | 8,034 | |||||||||||||||
| amcconsultants.com | 312 |
| S-K 1300 TRS: KCM Integrated Operations (Initial Assessment) | |
| Konkola Copper Mines Plc | 0424076 |
Figure 19.8 Sensitivity analysis graph – M&I Case
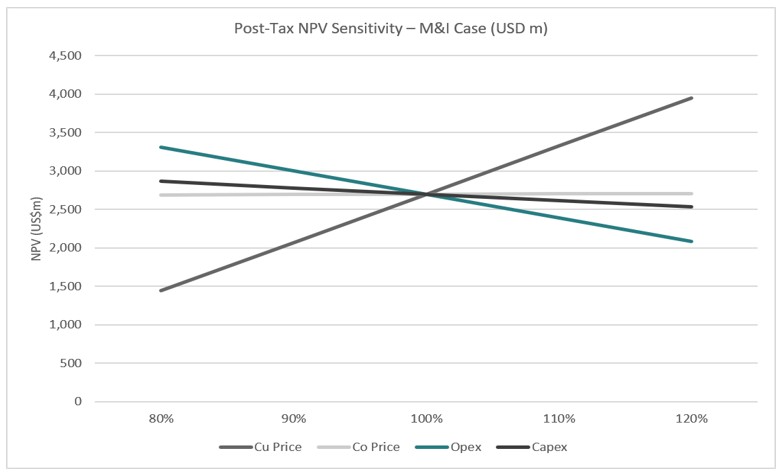
Source: AMC, 2026.
Sensitivity analysis on the NPV₈% for the M&I Case:
Table 19.6 Sensitivity analysis results – M&I Case
| Parameter | 80% | 90% | 100% | 110% | 120% | |||||||||||||||
| Cu Price (NPV US$M) | 1,385 | 2,013 | 2,640 | 3,268 | 3,895 | |||||||||||||||
| Co Price (NPV US$M) | 2,630 | 2,635 | 2,640 | 2,645 | 2,650 | |||||||||||||||
| OPEX (NPV US$M) | 3,254 | 2,947 | 2,640 | 2,333 | 2,026 | |||||||||||||||
| CAPEX (NPV US$M) | 2,807 | 2,724 | 2,640 | 2,556 | 2,473 | |||||||||||||||
| amcconsultants.com | 313 |
| S-K 1300 TRS: KCM Integrated Operations (Initial Assessment) | |
| Konkola Copper Mines Plc | 0424076 |
| 20 | Adjacent properties |
Properties within the immediate vicinity of the KCM license area, at different Copperbelt towns, that are engaged in the extraction of copper are listed in Table 20.1.
The descriptions provided here are based on publicly available information disclosed by the respective owners. The Qualified Person is unable to verify the information presented, and it is not necessarily indicative of the mineralisation, geological characteristics, or economic potential of the KCM properties that are the subject of this TRS.
Table 20.1 Summary of adjacent properties
| Property | Owner / Operator | Location | Commodity | Status | Adjacent KCM License | |||||
| Lubambe Mine | EMR Capital / ZCCM-IH | Chililabombwe | Cu | Operating (UG) | 7076-HQ-LML | |||||
| Mingomba Project | KoBold Metals / ZCCM-IH | Chililabombwe | Cu | Exploration | 7076-HQ-LML | |||||
| Mimbula Project | Moxico Resources | Chingola | Cu | Operating (OP) | 7075-HQ-LML | |||||
| Mopani Nkana Complex | ZCCM-IH (100%) | Kitwe | Cu, Co | Operating (UG) | 20945-HQ-MPL |
Note: UG = underground, OP = open pit. Ownership and status based on publicly available information as of 1 April 2026.
| 20.1 | Chililabombwe area |
The Konkola mining license (7076-HQ-LML) is bordered to the north by the Lubambe Mine and the KoBold Mingomba exploration project, as shown in Figure 20.1 below. Both properties are hosted within the Konkola–Musoshi Basin and share geological continuity with the Konkola deposit through the Copperbelt Orebody Member (Ore Shale) of the Kitwe Formation.
| amcconsultants.com | 314 |
| S-K 1300 TRS: KCM Integrated Operations (Initial Assessment) | |
| Konkola Copper Mines Plc | 0424076 |
Figure 20.1 Konkola deposit and surrounding properties
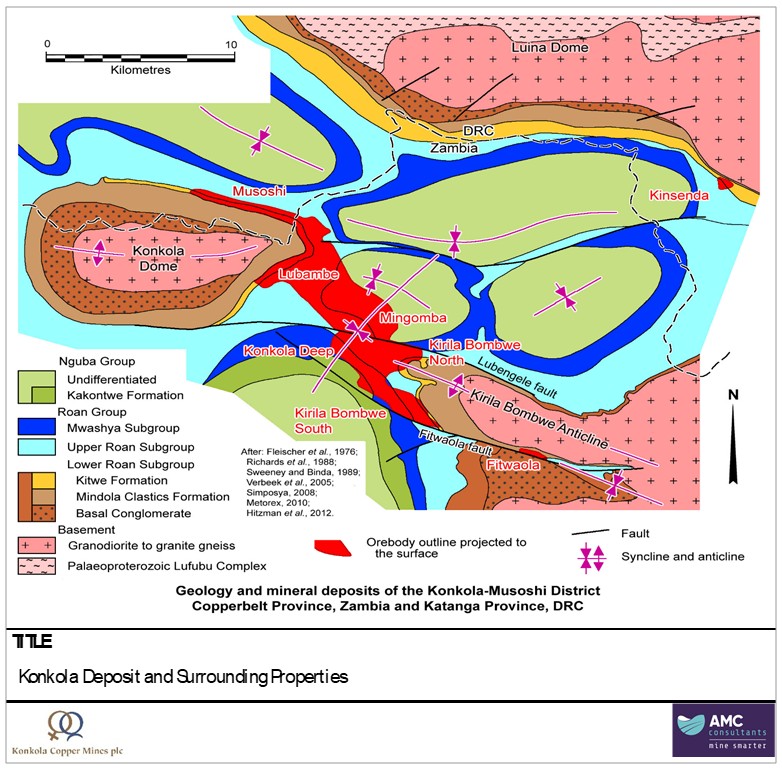
Source: PorterGeo.
| 20.1.1 | Lubambe Copper Mine |
The Lubambe Copper Mine is an underground operation situated on a tenement area of approximately 58.1 km² within the Konkola–Musoshi Basin. The deposit is hosted within the same Copperbelt Orebody Member (Ore Shale) that hosts the Konkola deposit, reflecting geological continuity of the Lower Roan sedimentary sequence across the basin. Mineralisation has a global mean grade of approximately 1.95% TCu with orebody thickness ranging from 2.0 to 6.0 m across a strike length of approximately 5 km. The mine produces a high-grade concentrate averaging 40% Cu, sold under offtake agreements to smelters in Zambia. (Lubambe Copper Mine website, (https://lubambe.com/, 1 April 2025).
| amcconsultants.com | 315 |
| S-K 1300 TRS: KCM Integrated Operations (Initial Assessment) | |
| Konkola Copper Mines Plc | 0424076 |
| 20.1.2 | Mingomba Project |
The Mingomba Project is being developed by KoBold Metals in partnership with ZCCM-IH on a license area adjacent to the northern boundary of the Konkola license. The project is at the exploration stage, with approximately 120,000 m of drilling completed over 17 months as of the date of the public disclosure referenced below. According to KoBold’s public disclosures, the company has stated an aspiration for production capacity of 300,000 t per annum of copper in concentrates, with an anticipated investment of approximately US$2.3 billion. The project has not advanced to a feasibility study and no Mineral Resource or Mineral Reserve has been publicly reported under S-K 1300 or any equivalent standard. However construction and shaft sinking has commenced. (KoBold Metals website, https://koboldmetals.com/mingomba/, 1 April 2026).
| 20.2 | Chingola area |
| 20.2.1 | Mimbula Copper Project |
In the Chingola area, adjacent to Nchanga license(7075-HQ-LML) the main project is Mimbula Minerals operated by Moxico Resources plc (Moxico).
Moxico’s portfolio of mineral rights includes three mining licenses within the Chingola cluster under which the Mimbula Copper Project currently operates, namely the 92.5% owned Mimbula (21816-HQ-LML) and the 100% owned Zuka (8440-HQ-SML) mining license.
The Mimbula Copper Project is Moxico’s first producing asset. The Phase 1 operations commenced in December 2022, producing approximately 10,000 tonnes of copper cathode per annum using a heap leach and SX / EW process. Mimbula Phase 2 expansion consisting of additional SX capacity is due for completion in early 2026, https://www.moxicoresources.com/projects/republic-of-zambia/operations. Mimbula website 1 April 2026.
| 20.3 | Kitwe area |
| 20.3.1 | Mopani Copper Mines |
The Mopani Nkana mining complex is situated immediately adjacent to the KCM Nkana Refinery license (20945-HQ-MPL) in Kitwe. In January 2021, Glencore transferred its 73.1% equity interest in Mopani Copper Mines Plc to ZCCM-IH, making Mopani a wholly state-owned operation. In 2024 Delta Mining Limited (a subsidiary of International Resources Holdings Plc of the United Arib Emirates) acquired a 51 percent shareholding from ZCCM-IH.
The Nkana complex comprises several underground mine sections, including the South Ore Body, Central Shaft, and Synclinorium shaft complexes to the south, and the Mindolo Deep Mine to the northwest.
Processing infrastructure includes the New Nkana Synclinorium Concentrator commissioned in March 2022, Mufilira ISA Smelter, and Refinery. and a cobalt plant (currently decommissioned).
The Nkana deposits are hosted within the Mine Series of the Lower Roan Group, the same broad stratigraphic sequence that characterises copper–cobalt mineralisation across the Zambian Copperbelt. The complex has been in continuous operation since the 1930s and produces copper in concentrates. (Mopani Copper Mines Plc, https://mopani.com.zm/, 1 April 2026).
| 20.4 | Qualified Person’s statement on adjacent properties |
The Qualified Person is not aware of any material information regarding the adjacent properties described above that would affect the Mineral Resource or Mineral Reserve estimates, or the conclusions, of this TRS. The geological continuity between certain adjacent deposits and the KCM properties is noted for context only and does not imply that the characteristics of adjacent properties are indicative of those within the KCM license areas.
All adjacent properties described in this section are independently owned and operated. There are no current joint ventures, cooperative development agreements, or shared infrastructure arrangements between KCM and the owners of these adjacent properties, other than the processing of third-party purchased concentrates through the Nchanga Smelter under arm’s-length commercial terms (refer to Section 19).
All information presented in this section is derived from publicly available sources as cited and has not been independently verified by the QP.
| amcconsultants.com | 316 |
| S-K 1300 TRS: KCM Integrated Operations (Initial Assessment) | |
| Konkola Copper Mines Plc | 0424076 |
| 21 | Other relevant data and information |
This section presents information on potential expansion opportunities that are incremental to the Full Resource Case mine plan presented in Section 13.7. These opportunities are based on Inferred Mineral Resources and conceptual studies that require further work to demonstrate technical and economic viability.
The TD05 Mineral Resource is included in the Mineral Resource statement (Section 11) and reclaimed under both economic cases. Under the M&I Case, the Measured and Indicated portion of TD05 is processed through the existing Nchanga TLP. Under the Full Resource Case, the larger reclamation scope (which incorporates the Inferred portion of TD05) is processed through the existing Nchanga TLP and the proposed TLP 2 facility operating in parallel (refer Section 14.5).
| 21.1 | Konkola Deeps production expansion project |
A conceptual study by AMC, utilising the HoV® modelling framework, evaluated the potential for the Konkola Deeps Mining Project (KDMP) to achieve a copper production rate of 300 ktpa, a step change beyond the current Konkola Mine production of approximately 167,500 tpa Cu and the steady-state Konkola production rate of approximately 170-200 ktpa Cu contemplated in the Full Resource Case. The study identified the need for significant infrastructure investment, including a new vertical hoisting shaft and additional concentrator plant capacity, with estimated capital expenditure exceeding US$3.0B.
The Konkola Mine Inferred Mineral Resource of 249 million tonnes at 3.4% TCu provides the geological foundation for this target. However, the unconfirmed nature of Inferred Mineral Resources and high execution complexity, particularly dewatering challenges in the Bancroft zones, introduce significant risks that have not yet been addressed to an appropriate level of confidence for further reporting to the market.
| 21.1.1 | Project outlook |
The 300 ktpa production target for Konkola Mine is technically possible but requires further studies to confirm economic viability. Production could be expanded through targeted upgrading of the mine's infrastructure and mining capacity, potentially increasing project value through significant capital investment.
However, achieving this target requires various assumptions to be validated, including:
| · | Significant improvements in underground systems such as dewatering, materials handling, and backfill supply. |
| · | Substantial decrease in cut-off grade through increased productivities, removal of systemic inefficiencies, cost savings through benefits of scale, application of new technology, and optimisation of mining methods. |
| · | Significant improvement in the availability of utilities. |
There is no certainty that additional resource infill drilling of Inferred Mineral Resources will result in an expanded Mineral Resource or Mineral Reserve, and investors are cautioned that these estimates are preliminary. Any decision to pursue this production target would be contingent on further detailed analysis and modelling to demonstrate, at the appropriate level of confidence, that value would be added to the operation.
| 21.1.2 | Strategic opportunities |
Opportunities exist to increase the current 167,500 tpa production through further drilling to convert Inferred Resources to Indicated Resources, supporting increased orebody definition, confidence and higher development and production rates. Investment in advanced infrastructure could enhance production scalability, subject to successful studies and risk mitigation.
| amcconsultants.com | 317 |
| S-K 1300 TRS: KCM Integrated Operations (Initial Assessment) | |
| Konkola Copper Mines Plc | 0424076 |
| 21.1.3 | Recommended approach |
To advance the KDMP toward the 300 ktpa copper production target, the following work is recommended. This work should be conducted by applying an integrated project development framework appropriate to the available information and investment appetite of the company:
| · | Conduct further study to validate the technical and economic viability of the proposed new vertical shaft, concentrator plant expansion. The study costs are estimated at $3.5M over 24 months. |
| · | Implement a $5M infill drilling program (15,000 m) over 18 months to convert Inferred Mineral Resources (248.9 million tonnes at 3.35% TCu) to an Indicated Resource category, reducing geological uncertainty. |
| · | Perform geotechnical and hydrogeological studies ($1M over 12 months) to address dewatering risks in the Bancroft zones, critical to project execution. These recommendations aim to confirm the project’s scalability, but there is no assurance that they will result in expanded resources. |
These recommendations aim to confirm the project's scalability, but there is no assurance that they will result in expanded Mineral Resources.
| 21.2 | Nchanga LP and Smelter expansion studies |
A high-level assessment was undertaken to evaluate the conditions required to reach 500 ktpa total copper output from the KCM operations. This target is incremental to the Full Resource Case base case (which incorporates the proposed TLP 2 facility processing reclaimed TD05 - refer Section 14.5) and is inclusive of the KDMP 300 ktpa opportunity discussed in Section 21.1.
| 21.2.1 | Project outlook |
To reach the targeted 500 ktpa output, the following conditions require assessment to demonstrate technical and economic viability. This assessment work has not been completed, and results have not been confirmed:
| · | Complete the design, engineering, and investment for the Konkola 300 ktpa project described in Section 21.1. |
| · | Construct an additional TLP at Konkola Mine to recover acid-soluble copper from fresh tailings from the Konkola Concentrator and from the recovery and re-treatment of tailings deposited on the Lubengele TSF. This proposed facility is distinct from the TLP 2 facility at Nchanga, which is included in the Full Resource Case. |
| · | Expand the capacity of the Nchanga Smelter from approximately 850 ktpa to 1,300 ktpa of concentrate feed. |
| · | Increase the purchase of third-party concentrate to feed the smelter and maintain maximum capacity. |
| 21.2.2 | Recommended approach |
To increase the certainty of this assessment, the following work is recommended:
| · | Conduct further studies to validate the technical and economic viability of a proposed new TLP at Konkola Mine. |
| · | Complete sampling and test work on fresh and TSF tailings at Konkola Mine to confirm acid leach performance for copper recovery. |
| · | Quantify the amount and distribution of tailings on the Lubengele TSF. |
| · | Conduct technical and economic studies on the expansion of the smelter. |
| · | Confirm that sufficient third-party concentrate at an appropriate specification will be available to fill the capacity of the expanded smelter. |
| · | Upon confirmation of the feasibility, execute an effective, integrated implementation plan to achieve these production levels. |
The cost of these studies and test work is estimated at US$3-4M over 24 months. This estimate is separate from the cost of any development work to execute these projects. There is no assurance that these recommendations will result in expanded Mineral Resources.
| amcconsultants.com | 318 |
| S-K 1300 TRS: KCM Integrated Operations (Initial Assessment) | |
| Konkola Copper Mines Plc | 0424076 |
| 22 | Qualified Person's interpretation and conclusions |
| 22.1 | Mineral Resource data |
The QP notes that QAQC analysis identified some standards plotting outside two standard deviations (2SD), which may affect accuracy and precision. However, the QP is of the opinion that this adds a degree of uncertainty but does not materially affect the outcome of grade estimation.
| 22.2 | Mineral Resources |
The Konkola Mine resource block model is representative of the informing data and supports the Mineral Resource estimate at Measured, Indicated, and Inferred confidence levels. The Konkola Mineral Resource has the potential to increase in both confidence and size through campaigns of infill and extension drilling.
| 22.3 | Initial Assessment conclusions |
The QP emphasises that:
| · | This Initial Assessment is preliminary in nature and includes Inferred Mineral Resources that are considered too speculative geologically to have economic considerations applied that would enable them to be categorised as Mineral Reserves. |
| · | Approximately 87% of the Mineral Resources at Konkola Mine (249 Mt of 288 Mt) are classified as Inferred. |
| · | There is no certainty that the Initial Assessment will be realised. Mineral Resources that are not Mineral Reserves do not have demonstrated economic viability. |
| · | Significant additional drilling and technical studies are required to upgrade Inferred Resources to higher confidence categories. |
| 22.4 | Project economics |
The economic analysis demonstrates substantial potential value from the KCM operations:
| · | The Full Resource Case (Including Inferred) returns a post-tax NPV₈% of US$8,637M (US$12,050M pre-tax) over an approximately 45-year mine life. |
| · | The M&I Case (Excluding Inferred) returns a post-tax NPV₈% of US$2,640M (US$3,418M pre-tax) over an approximately 15-year mine life, demonstrating that the Measured and Indicated Mineral Resource portion of the KCM operations has a positive economic outcome independent of Inferred Resources. |
Realisation of this value is dependent on adequate and timely investment of capital and the successful upgrade of Inferred Resources to higher confidence categories through continued drilling programs.
| 22.5 | Effective date and subsequent events |
The effective date of the Mineral Resource estimates is 1 April 2026.
The QP confirms, based on a review of production records and mine planning data, that no material changes to the underlying geological model, grade estimates, resource classification, or economic assumptions have occurred since the effective date. There have been no changes from the effective date of the TRS that would materially disaffirm or otherwise change any aspect of the TRS or require the filing of a new TRS in accordance with Regulation S-K.
| amcconsultants.com | 319 |
| S-K 1300 TRS: KCM Integrated Operations (Initial Assessment) | |
| Konkola Copper Mines Plc | 0424076 |
| 23 | Recommendations |
Based on the findings of this Initial Assessment, the QP recommends the following work programs to advance the KCM Integrated Operations toward higher confidence levels and to support future investment and funding processes.
| 23.1 | Mineral Resource and geological recommendations |
| 23.1.1 | Konkola resource infill and extension drilling |
A structured drilling program is recommended to increase geological confidence and upgrade the Mineral Resource classification at Konkola Mine. Approximately 87% of the Mineral Resources at Konkola Mine (249 Mt of 288 Mt) are classified as Inferred. The program comprises four phases:
Phase 1 – Measured Resource Definition (Years 1–5 Production)
| · | Objective: Achieve Measured classification for the first five years of production. |
| · | Method: Underground and surface directional drilling at 60 m spacing. |
| · | Estimated cost: US$3.0M. |
| · | Duration: 12 months. |
Phase 2 – Indicated Resource Expansion (Years 6–15 Production)
| · | Objective: Convert Inferred to Indicated Mineral Resources for an additional ten years of production. |
| · | Method: Combination of surface directional and vertical drilling. |
| · | Estimated cost: US$5.0M. |
| · | Duration: 18 months. |
Phase 3 – Inferred Resource Confidence
| · | Objective: Enhance confidence in the Inferred Mineral Resource through reduced drillhole spacing. |
| · | Method: Infill drilling targeting areas of higher geological uncertainty. |
| · | Estimated cost: US$2.0M. |
| · | Duration: 12 months. |
Phase 4 – Resource Extension
| · | Objective: Test for mineralisation extensions within the lease boundary. |
| · | Method: Limited surface drillholes with average depth of 1,500 m. |
| · | Estimated cost: US$1.5M. |
| · | Duration: 12 months. |
| 23.1.2 | Nchanga |
| · | Objective: Increase confidence and upgrade classification of COP E Extension and COP DF. |
| · | Method: Infill and extension drilling. |
| · | Objective: Identify additional mineralisation within historic region and along strike of known assets. |
| · | Method: Generation of a digital regional Nchanga geological model, to identify potential additional mineralisation along strike of and down dip of known mineralisation. |
| amcconsultants.com | 320 |
| S-K 1300 TRS: KCM Integrated Operations (Initial Assessment) | |
| Konkola Copper Mines Plc | 0424076 |
| 23.1.2.1 | Tailings storage facility drilling and test work |
| · | Continue infill drilling at the TD05 Muntimpa (Nchanga) tailings storage facility to upgrade the classification of the Inferred portion of the Mineral Resource to Indicated, through reduced drillhole spacing within the existing deposit extent. |
| · | Complete the Lubengele (Konkola) auger drilling program currently underway to generate a first-time Mineral Resource estimate. |
| · | Investigation of relationship between 2021 and 2025 test work results. |
| · | Additional metallurgical test work. |
| · | Estimated cost: US$0.5M. |
| 23.1.3 | QAQC and data management |
| · | Update standard operating procedures for sample preparation and analysis. |
| · | Implement comprehensive QAQC protocols on all future drillholes. |
| · | Undertake batch-by-batch review of all QAQC. |
| · | Generate master QAQC reports and Mineral Resource statement reports. |
| · | Prepare documentation for external audit of Mineral Resource estimates. |
| · | Estimated cost: US$0.3M. |
| 23.2 | Mining recommendations |
| 23.2.1 | Konkola Mine |
| · | Complete detailed mine design and scheduling to Feasibility Study level. |
| · | Finalise contractor engagement strategy for underground mining operations. |
| · | Complete geotechnical studies to confirm stope designs and ground support requirements. |
| · | Advance dewatering infrastructure design, particularly the 1390 level pumping system. |
| · | Complete paste fill plant detailed engineering. |
| · | Estimated cost: US$2.0M. |
| 23.2.2 | TD03/TD04 tailings reclamation |
| · | Continue ongoing tailings characterisation to refine recovery estimates. |
| · | Optimise hydro sluicing operations based on current performance data. |
| · | Estimated cost: US$0.2M. |
| 23.2.3 | Nchanga Underground projects |
| · | Review and assess the geological understanding, inputs, and resource estimates for COP DF Underground and COP E Underground. |
| · | Complete Pre-Feasibility Study level work on COP E and COP DF Underground projects to advance these toward potential Mineral Reserve estimates. |
| · | Complete concept-level geotechnical and hydrogeological assessments. |
| · | Estimated cost: US$1.5M. |
| 23.3 | Processing and metallurgical recommendations |
| 23.3.1 | Konkola Concentrator |
| · | Complete Concentrator Stream 2 refurbishment to restore baseplate capacity. |
| · | Conduct variability test work on ore from different mining areas. |
| · | Estimated cost: US$0.5M (test work only; refurbishment capital included in economic analysis). |
| amcconsultants.com | 321 |
| S-K 1300 TRS: KCM Integrated Operations (Initial Assessment) | |
| Konkola Copper Mines Plc | 0424076 |
| 23.3.2 | Nchanga TLP |
| · | Complete detailed engineering for the elevated temperature leaching upgrade. |
| · | Conduct confirmatory test work on TD03/TD04/TD05 material to verify recovery assumptions. |
| · | Estimated cost: US$0.3M. |
| 23.3.3 | TLP 2 / TD05 prefeasibility study |
| · | Prefeasibility-level engineering and economic study covering the proposed TLP 2 facility design, capital and operating cost estimation, and TD05 reclamation mining method. |
| · | Update the TD05 Mineral Resource estimate to reflect additional infill drilling data, supporting the upgrade of Inferred Mineral Resources to Indicated classification within the existing TD05 deposit footprint. |
| · | Advance the Measured and Indicated portion of the TD05 Mineral Resource toward Mineral Reserve estimation. |
| · | Estimated cost: US$1.5M. |
| 23.4 | Infrastructure recommendations |
| · | Complete detailed engineering for ventilation upgrades. |
| · | Finalise power supply arrangements with ZESCO. |
| · | Advance dewatering system detailed design. |
| · | Complete closure cost estimate update. |
| · | Estimated cost: US$0.5M. |
| 23.5 | Economic and commercial recommendations |
| · | Secure third-party concentrate supply agreements beyond 2026 to fill smelter capacity. |
| · | Complete Feasibility Study on the KCM Integrated Operations to support future investment and funding processes. |
| · | Update economic model with results from recommended studies. |
| · | Estimated cost: US$1.0M (Feasibility Study). |
| amcconsultants.com | 322 |
| S-K 1300 TRS: KCM Integrated Operations (Initial Assessment) | |
| Konkola Copper Mines Plc | 0424076 |
| 23.6 | Summary of recommended work program |
Table 23.1 Recommended work program
| Work program | Estimated Cost (US$M) | Duration | ||
| Phase 1 Drilling – Measured Resource | 3.0 | 12 months | ||
| Phase 2 Drilling – Indicated Resource | 5.0 | 18 months | ||
| Phase 3 Drilling – Inferred Confidence | 2.0 | 12 months | ||
| Phase 4 Drilling – Resource Extension | 1.5 | 12 months | ||
| Tailings Facility Drilling (TD05/Lubengele) | 0.5 | 6 months | ||
| QAQC and Data Management | 0.3 | 6 months | ||
| Mining Studies (Konkola Mine) | 2.0 | 12 months | ||
| Mining Studies (TD03/TD04) | 0.2 | 6 months | ||
| TLP 2 / TD05 prefeasibility study | 1.5 | 6 months | ||
| Mining Studies (Nchanga UG Projects) | 1.5 | 12 months | ||
| Processing and Metallurgical Studies | 0.8 | 12 months | ||
| Infrastructure Studies | 0.5 | 12 months | ||
| Feasibility Study and Commercial | 1.0 | 18 months | ||
| Total | 19.8 | 18–24 months |
The QP recommends that these work programs be undertaken to advance the project to Feasibility Study level, to support the conversion of Inferred Resources to higher confidence categories, and to reduce the risks and uncertainties identified in this Initial Assessment.
| amcconsultants.com | 323 |
| S-K 1300 TRS: KCM Integrated Operations (Initial Assessment) | |
| Konkola Copper Mines Plc | 0424076 |
| 24 | References |
See companion PFS TRS document for full reference list.
The sources of data and information used in the preparation of this TRS are presented in Table 24.1.
Table 24.1 TRS data and information sources
| Category | Source | Date | File type | Title |
| Mineral Resources | KCM | 2025 | KCM Resource Reporting Procedure 2025 | |
| KCM | 2024 | Geology of the Konkola Mine Area | ||
| KCM | 2025 | docx | Initial assessment report Nchanga Fitwaola | |
| KCM | 2025 | docx | Initial assessment report Nchanga Mineral Resources R2 - Kakosa North and South | |
| KCM | 2025 | docx | Initial assessment report Nchanga Mineral Resources R4 - Nchanga Deposits | |
| KCM | 2025 | docx | Konkola Geological and Resource model update-v8 | |
| KCM | 2016 | SRK Review of the update of the Konkola Mine resource model | ||
| KCM | 2019 | Appendix B - Drilling grid optimisation - Konkola Mine | ||
| KCM | 2000 | doc | KCM TD03_TD04 model November 2000 | |
| KCM | 2021 | 05.01.15 TD5-Prefeasibility Test Work Report December 2021 Final R0 | ||
| KCM | 2006 | xlsx | XXXX MRMR tables | |
| KCM | 2026 | XXXX- xpl update | ||
| ABGM | 2026 | E1234_KCM_TD5 Resource Classification Methodology Memo | ||
| AHK | 2025 | MET 102217 KCM Final Report | ||
| KCM | 2025 | docx | Scope of Work for Muntimpa Tailings Storage Facility (TD05)_Reverse Circulation Drilling_04062025 | |
| AMC | 2025 | 0424061 Konkola KDMP Exploration Strategy Report – 31 Jan 2025 | ||
| Mineral Processing | KCM | 2023 | Konkola Concentrator Flow Sheet | |
| KCM | 2023 | xlsx | Historical Production Numbers BP Vs Actual | |
| KCM | 2023 | xlsx | KBU Concentrator Production Cost for FY2022-23 | |
| KCM | 2023 | xlsx | KBU Concentrator Production Cost for FY2021-22 | |
| KCM | 2023 | docx | Design Technical Specification Ball Mill and SAG Mill | |
| KCM | 2023 | Mass & Water Balance_West Mill | ||
| KCM | 2023 | PFD Cum Mass Balance_East Mill | ||
| KCM | 2023 | xlsx | Old East Mill Flow Sheet (Crushing, Milling and Flotation) | |
| KCM | 2023 | xlsx | Historical Operating Performance | |
| KCM | 2023 | xlsx | Production Cost for FY2022-23 | |
| KCM | 2023 | PFD Cum Mass Balance_East Mill | ||
| KCM | 2023 | Mass & Water Balance_West Mill_R6 | ||
| KCM | 2024 | xlsx | Historical Performance 042024 | |
| Hatch | 2024 | Nchanga TLP Start-up Plan Review | ||
| Hatch | 2024 | Concentrator Report | ||
| Smelter | KCM | 2023 | xlsx | Historical Nchanga Smelter Production Performance and Plant Capacity |
| KCM | 2023 | docx | Smelter Process Flow Chart | |
| Refinery | KCM | 2024 | ppt | Nkana Refinery Process flow Sheet - December 2024 |
| amcconsultants.com | 324 |
| S-K 1300 TRS: KCM Integrated Operations (Initial Assessment) | |
| Konkola Copper Mines Plc | 0424076 |
| Category | Source | Date | File type | Title |
| Hydrology | WSP | 2018 | 2018 Groundwater Model Calibration Update Report Final | |
| WSP | 2018 | 2018 Groundwater Numerical Modeling History | ||
| WSP | 2018 | 2018 Hydrogeological Conceptual Model Report Final | ||
| KCM | 2024 | xlsx | Dewatering Crosscut Flows 2023-2024 | |
| KCM | 2024 | ppt | 3FY Dewatering Crosscut Plan and Water Predictions | |
| Environmental and Social | IBIS | 2024 | IBIS_KCM E&S Review Report_Draft V1.0_submission | |
| Life of Mine Plan | AMC | 2025 | 0424076 KCM LoM Report_29 August 2025 | |
| Mineral Reserves | AMC | 2026 | 0424076 S-K 1300 TRS: KCM Integrated Operations (PFS) | |
| Mine Designs | AMC | 2025 | Deswik | 010 Report Export Per MLD_v4.9.9_FY |
| AMC | 2025 | Deswik | 042014 KCM Schedule_Master_v4.9.9 | |
| AMC | 2025 | Deswik | 042014 KCM Schedule_Master_v4.9.9 | |
| AMC | 2025 | Deswik | KCM_LOM_Animation_875 v4.9.9 | |
| KCM | 2021 | xlsx | 590 mL tramming capacity study analysis - 3 Shaft 07122021 | |
| KCM | 2021 | xlsx | 950 mL tramming capacity study analysis - 4 Shaft 21102021 | |
| KCM | 2022 | Scheduling Parameters-KBU - 11.02.2022 | ||
| Cost and Cashflow | AMC | 2026 | xlsx | Full_KCM Cost Model_300Ktpa_V34_EndApril2026_COMBINED_CASES |
| 24.1 | Unit of measurement and abbreviations |
| 24.1.1 | Units of measurement |
| Unit | Description | |
| % | percent | |
| °C | degrees Celsius | |
| g | gram | |
| g/t | grams per tonne | |
| ha | hectare | |
| kg | kilogram | |
| km | kilometer | |
| kt | kilotonne (1,000 tonnes) | |
| ktpa | kilotonnes per annum | |
| kW | kilowatt | |
| L | liter | |
| m | meter | |
| m² | square meter | |
| m³ | cubic meter | |
| m³/s | cubic meters per second | |
| mm | millimeter | |
| Mt | million tonnes | |
| MW | megawatt | |
| t | metric tonne | |
| t/m³ | tonnes per cubic meter | |
| tpa | tonnes per annum | |
| tpm | tonnes per month |
| amcconsultants.com | 325 |
| S-K 1300 TRS: KCM Integrated Operations (Initial Assessment) | |
| Konkola Copper Mines Plc | 0424076 |
| 24.1.2 | Abbreviations |
| Abbreviation | Description | |
| AISC | All-in Sustaining Cost | |
| AMC | AMC Consultants Pty Ltd | |
| ASCu | Acid Soluble Copper | |
| CIM | Canadian Institute of Mining, Metallurgy and Petroleum | |
| Cu | Copper | |
| Co | Cobalt | |
| DRC | Democratic Republic of the Congo | |
| E&S | Environmental and Social | |
| EIA | Environmental Impact Assessment | |
| FS | Feasibility Study | |
| FY | Fiscal Year | |
| HoV | Hierarchy of Value | |
| IA | Initial Assessment | |
| KCM | Konkola Copper Mines PLC | |
| KDMP | Konkola Deeps Mining Project | |
| LOM | Life of Mine | |
| M&I | Measured and Indicated | |
| mRL | meters Relative Level | |
| NPV | Net Present Value | |
| NSR | Net Smelter Return | |
| PFS | Preliminary Feasibility Study | |
| QAQC | Quality Assurance / Quality Control | |
| QP | Qualified Person | |
| ROM | Run of Mine | |
| S-K 1300 | Subpart 1300 of Regulation S-K | |
| SEC | U.S. Securities and Exchange Commission | |
| SG | Specific Gravity | |
| TCu | Total Copper | |
| TD03 | Tailings Dam 03 | |
| TD04 | Tailings Dam 04 | |
| TD05 | Tailings Dam 05 | |
| Nchanga TLP | Nchanga TLP | |
| TRS | Technical Report Summary | |
| TSF | Tailings Storage Facility | |
| UG | Underground | |
| US$ | United States Dollar | |
| US$M | United States Dollar (millions) | |
| ZESCO | Zambia Electricity Supply Corporation | |
| NPV₈% | Net Present Value calculated using an 8% discount rate |
| amcconsultants.com | 326 |
| S-K 1300 TRS: KCM Integrated Operations (Initial Assessment) | |
| Konkola Copper Mines Plc | 0424076 |
| 25 | Reliance on information provided by the Registrant |
In accordance with S-K Item 601(b)(96)(iii)(B)(25), this section: (i) identifies the categories of information provided by the Registrant upon which the QPs have relied; (ii) identifies the portions of this TRS prepared in reliance on such information; and (iii) explains why the QPs consider such reliance to be reasonable.
The QPs have relied on information provided by KCM, the Registrant, for various aspects of the KCM Integrated Operations. The QPs have not independently verified all information but have exercised professional judgment, assuming the information is accurate and complete as of the effective date of this report. Given the preliminary nature of this Initial Assessment and the inclusion of Inferred Mineral Resources, certain information may be subject to change as the project advances.
KCM staff provided the information openly and transparently during the preparation of this TRS. The QPs note that any material inaccuracies in the provided information could affect the reliability of this TRS.
The specific areas of reliance are as follows:
| 25.1 | Legal matters |
The QPs have not independently reviewed ownership of the KCM properties, underlying mineral tenure, surface rights, or permit conditions. Reliance is placed on representations provided by KCM.
Relevant Sections: 3, 16, and 17.
The QPs consider this reliance reasonable because verification of legal title, mineral tenure, and permit conditions requires legal expertise and access to official registries that are outside the technical scope of the QPs.
| 25.2 | Environmental and community matters |
The QPs have reviewed existing environmental and community matters and engaged with the Registrant to confirm understanding of the status of these matters at the time of review. The Registrant has provided, and the QPs have relied upon, information regarding the status and outlook for environmental impact assessments, closure plans, closure cost estimates, environmental bonds and liabilities, community impact and engagement, and related permitting.
Relevant Sections: 17.
The QPs consider this reliance reasonable because the Registrant has direct responsibility for environmental management and community engagement and has provided supporting documentation from qualified environmental specialists.
| 25.3 | Tailings storage facilities |
The Registrant has provided representations, independent expert reports, and plans for ongoing management of all active and dormant TSFs, confirming compliance with required standards. The QPs have relied on information and assurance provided by KCM and several specialists employed by KCM regarding the monitoring and stability assessment of the TSFs at the KCM operations.
Relevant Sections: 3, 12, 13, and 17.
The QPs consider this reliance reasonable because the Registrant has engaged independent specialists to assess TSF stability and compliance, and the QPs have reviewed the findings of these assessments.
| amcconsultants.com | 327 |
| S-K 1300 TRS: KCM Integrated Operations (Initial Assessment) | |
| Konkola Copper Mines Plc | 0424076 |
The QPs consider this reliance reasonable because marketing arrangements and commercial terms for product sales are within the control of and negotiated by the Registrant.
| 25.4 | Macroeconomic assumptions |
The QPs have relied on macroeconomic assumptions provided by the Registrant and third-party sources, including foreign exchange rates, inflation rates, and discount rates used in the economic analysis. The copper and cobalt price forecasts are based on consensus pricing data from independent analyst forecasts (March 2026) as disclosed in Section 19.
Relevant Sections: 18 and 19.
| 25.4.1 | Market information |
The QPs have relied on information provided by the Registrant regarding market and pricing assumptions for the sale of copper products and the purchase of third-party concentrates.
Relevant Sections: 16 and 19.
The QPs consider this reliance reasonable because macroeconomic forecasting is outside the technical expertise of the QPs, and the assumptions used are derived from reputable third-party sources and are consistent with industry practice for initial assessments.
| 25.5 | Community accommodations |
The QPs have relied on information provided by the Registrant regarding commitments and plans to provide accommodations to local individuals and communities in connection with the mine plan, including resettlement programs, community development agreements, and stakeholder engagement activities.
Relevant Sections: 3 and 17.
The QPs consider this reliance reasonable because community relations and social commitments are within the control of and managed by the Registrant.
| 25.6 | Governmental factors |
The QPs have relied on information provided by the Registrant regarding governmental factors outside the expertise of the QPs, including the status and interpretation of mining legislation, regulatory approvals, and licence terms in the Republic of Zambia; the applicable mineral royalty structure and rates; the corporate income tax rate, the capital-allowance regime applied for tax depreciation purposes, and the tax loss carry-forward provisions under the Zambian Income Tax Act; the opening tax loss balance as at 31 March 2026 and its apportionment by year of incurrence; and the applicability to KCM of recent and prospective Zambian fiscal measures, including the Minimum Alternative Tax introduced under the Income Tax (Amendment) Act No. 10 of 2025.
Relevant Sections: 3, 12, 16, 17, and 19.
The QPs consider this reliance reasonable because interpretation of Zambian mining law, government policy, and fiscal regulations, and the determination of historical tax loss balances, requires local legal, accounting, and regulatory expertise that is outside the technical scope of the QPs.
| 25.7 | Historical production and operating data |
The QPs have relied on historical production records, operating costs, and performance data provided by the Registrant for the Konkola Mine, Nchanga operations, and Nchanga TLP.
| amcconsultants.com | 328 |
| S-K 1300 TRS: KCM Integrated Operations (Initial Assessment) | |
| Konkola Copper Mines Plc | 0424076 |
Relevant Sections: 7, 14, 15, and 18.
The QPs consider this reliance reasonable because the Registrant maintains operational records in the normal course of business, and the QPs have reviewed the data for internal consistency and reasonableness.
| 25.8 | Contractor and business partner information |
The QPs have relied on contractual rates and productivity assumptions provided by the Registrant from agreements with mining contractors and business partners (including Hahne, Tauro, Opermin, Reliant, and AAC) for the development of operating cost estimates.
Relevant Sections: 18.
The QPs consider this reliance reasonable because the Registrant has existing contractual arrangements with these parties and has provided copies of relevant agreements for review.
| amcconsultants.com | 329 |
| S-K 1300 TRS: KCM Integrated Operations (Initial Assessment) | |
| Konkola Copper Mines Plc | 0424076 |
Our offices
| 0BAustralia | ||
|
Adelaide
Level 2, 12 Pirie Street Adelaide SA 5000 Australia
T +61 8 8201 1800 E adelaide@amcconsultants.com |
2BBrisbane
Level 15, 100 Creek Street Brisbane Qld 4000 Australia
T +61 7 3230 9000 E brisbane@amcconsultants.com | |
|
Melbourne
Level 12, 477 Collins Street Melbourne Vic 3000 Australia
T +61 3 8601 3300 E melbourne@amcconsultants.com |
4BPerth
Level 3, 1100 Hay Street West Perth WA 6005 Australia
T +61 8 6330 1100 E perth@amcconsultants.com | |
| Canada | ||
|
Toronto
140 Yonge Street, Suite 200 Toronto ON M5C 1X6 Canada T +1 647 953 9730 E toronto@amcconsultants.com |
7BVancouver
200 Granville Street, Suite 202 Vancouver BC V6C 1S4 Canada T +1 604 669 0044 E vancouver@amcconsultants.com | |
| South Africa | ||
|
Cape Town
First Floor, Willowbridge Centre Carl Cronje Drive Cape Town 7530 South Africa T +27 720 833 231 E capetown@amcconsultants.com
|
Centurion
Ground Floor (G05), Building 14, Block B Byls Bridge Office Park Corner of Olievenhoutbosch and Jean Ave Centurion 0157 South Africa T +27 720 833 231 E capetown@amcconsultants.com | |
| United Kingdom | ||
|
Breading
Registered in England and Wales Company No. 3688365 Office 336a, Davidson House Forbury Square Reading, Berkshire RG1 3EU United Kingdom
T +44 1628 778 256 E unitedkingdom@amcconsultants.com
Registered Office: Kinetic Centre Theobald Street Elstree Hertfordshire WD6 4PG United Kingdom |
amcconsultants.com