Shareholder Report
Mar. 31, 2026
USD ($)
Holding
Shareholder Report |
12 Months Ended |
|---|---|
|
Mar. 31, 2026
USD ($)
Holding
| |
| Shareholder Report [Line Items] | |
| Document Type | N-CSR |
| Amendment Flag | false |
| Registrant Name | CYBER HORNET TRUST |
| Entity Central Index Key | 0001345125 |
| Entity Investment Company Type | N-1A |
| Document Period End Date | Mar. 31, 2026 |
| Shareholder Report Annual or Semi-Annual | Annual Shareholder Report |
| C000146106 | |
| Shareholder Report [Line Items] | |
| Fund Name | CYBER HORNET S&P 500<sup style="inset: 1.5px 0px 4px; box-sizing: border-box; color: rgb(0, 0, 0); display: inline; flex-wrap: nowrap; font-size: 12px; font-weight: 700; grid-area: auto; line-height: 0px; margin: 0px; overflow: visible; position: relative; text-align: left; text-align-last: auto; white-space-collapse: preserve-breaks;">®</sup> |
| Trading Symbol | INDEX |
| Additional Information Phone Number | 1-844-464-6339 |
| Additional Information Website | https://funddocs.filepoint.com/onefund/ |
| Expenses [Text Block] | |
| Expenses Paid, Amount | $ 27 |
| Expense Ratio, Percent | 0.25% |
| Performance Past Does Not Indicate Future [Text] | The Fund’s past performance is not a good predictor of how the Fund will perform in the future. |
| No Deduction of Taxes [Text Block] | The graph and table do not reflect the deduction of taxes that a shareholder would pay on fund distributions or redemption of fund shares. |
| AssetsNet | $ 147,863,663 |
| Holdings Count | Holding | 505 |
| Advisory Fees Paid, Amount | $ 0 |
| InvestmentCompanyPortfolioTurnover | 30.00% |
| Additional Fund Statistics [Text Block] | |
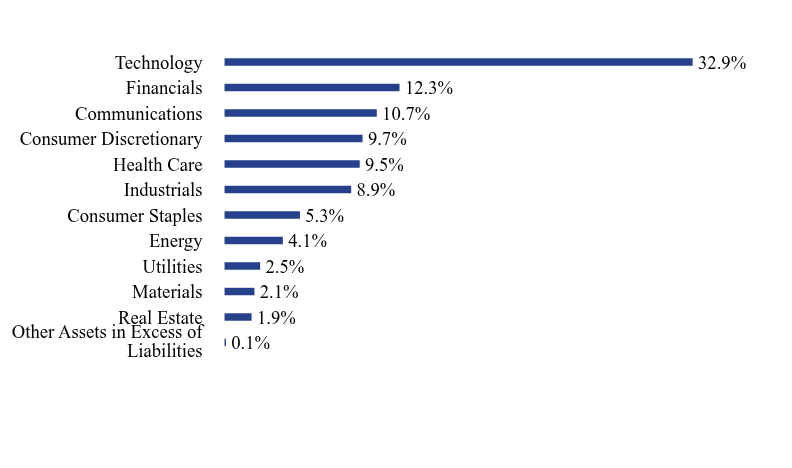
| Holdings [Text Block] |