Exhibit 99.1
TOYOTA FINANCIAL SERVICES 1 •• PROTECTED 関係者外秘 Presentation Materials for Investors June 2026
TOYOTA FINANCIAL SERVICES 2 •• PROTECTED 関係者外秘 Disclaimer • This presentation includes certain “forward - looking statements” within the meaning of The U.S. Private Securities Litigation Ref orm Act of 1995. • These statements are based on current expectations and currently available information. • Actual results may differ materially from these expectations due to certain risks, uncertainties and other important factors, in cluding the risk factors set forth in the most recent annual and periodic reports of Toyota Motor Corporation and Toyota Motor Credit Corporation. • We do not undertake to update the forward - looking statements to reflect actual results or changes in the factors affecting the f orward - looking statements. • This presentation does not constitute an offer to sell or a solicitation of an offer to purchase any securities. Any offer or sa le of securities will be made only by means of a prospectus and related documentation. • Investors and others should note that we announce material financial information using the investor relations section of our cor porate website ( http://www.toyotafinancial.com ) and SEC filings. We use these channels, press releases, as well as social media to communicate with our investors, customers and the general public about our company, our services and other issues. While not all of the information that we post on our website or social media is of a material nature, some information could be material. Ther efo re, we encourage investors, the media, and others interested in our company to review the information we post on the investor relati ons section of our website and on our social media. We may update our social media channels from time to time on the investor relat ions section of our corporate website.
TOYOTA FINANCIAL SERVICES 3 •• PROTECTED 関係者外秘 Disclaimer • This presentation includes certain “forward - looking statements” within the meaning of The U.S. Private Securities Litigation Ref orm Act of 1995. • These statements are based on current expectations and currently available information. • Actual results may differ materially from these expectations due to certain risks, uncertainties and other important factors, in cluding the risk factors set forth in the most recent annual and periodic reports of Toyota Motor Corporation and Toyota Motor Credit Corporation (“TMCC”). • We do not undertake to update the forward - looking statements to reflect actual results or changes in the factors affecting the f orward - looking statements. • This presentation does not constitute or form part of and should not be construed as, an offer to sell or issue or the solici tat ion of an offer to purchase or subscribe for securities of TMCC in any jurisdiction or an inducement to enter into investment activity in any jurisdiction. Neither this presentation nor any part thereof, nor the fact of its distribution, sh all form the basis of, or be relied on in connection with, any contract or commitment or investment decision whatsoever. Any offer or sale of securities by TMCC will be made only by means of a prospectus and related documentation. • Investors and prospective investors in securities of TMCC are required to make their own independent investigation and apprai sal of the business and financial condition of TMCC and the nature of its securities. This presentation does not constitute a recommendation regarding securities of TMCC. Any prospective purchaser of securities in TMCC is recommended to s eek its own independent financial advice. • This presentation and its contents are directed only at and may only be communicated to (a) persons in member states of the E uro pean Economic Area who are “qualified investors” within the meaning of Article 2 of the Prospectus Regulation (EU) 2017/1129 and (b) persons in the United Kingdom who are “qualified investors” as defined in paragraph 15 of S che dule 1 to the Public Offers and Admission to Trading Regulations 2024 who are ( i ) persons who have professional experience in matters relating to investments falling within Article 19(5) of the Financial Services and Markets Ac t 2000 (Financial Promotion) Order 2005 (the “Order”), or (ii) high net worth entities and other persons to whom it may lawfully be communicated, falling within Article 49(2)(a) to (d) of the Order, or (iii) other persons to whom it may othe rwi se lawfully be communicated (all such persons in (a) through (b) are collectively referred to as “Relevant Persons”); and in all cases are capable of being categorized as ( i ) in the European Economic Area, an eligible counterparty or a professional client, each as defined in Directive 2014/65/EU ( as amended) or (ii) in the United Kingdom, an eligible counterparty (as defined in the FCA Handbook Conduct of Business Sourcebook) or a professional client (as defined in Regulati on (EU) No 600/2014 as it forms part of United Kingdom domestic law by virtue of the European Union (Withdrawal) Act 2018, as amended) (such persons in ( i ) and (ii) being referred to as “Eligible Persons”). • This presentation must not be acted or relied on by persons who are not both Relevant Persons and Eligible Persons. Any inves tme nt or investment activity to which this presentation relates is available only to persons who are both Relevant Persons and Eligible Persons and will be engaged in only with persons who are both Relevant Persons and Eligible Persons. • This presentation is an advertisement and not a prospectus and investors should not subscribe for or purchase any securities of TMCC referred to in this presentation or otherwise except on the basis of information in the Euro Medium Term Note Programme base prospectus of Toyota Motor Finance (Netherlands) B.V., Toyota Credit Canada Inc., Toyota Finance Australi a L imited and Toyota Motor Credit Corporation dated, 12 September 2025, as supplemented from time to time (together, the “Prospectus”) together with the applicable final terms which are or will be, as applicable, available on the w ebs ite of the London Stock Exchange plc at https://www.londonstockexchange.com/news?tab=news - explorer. Investors should read the Prospectus before making an investment decision in order to fully understand the potential risks an d r ewards associated with the decision to invest in any securities of TMCC issued under the Euro Medium Term Note Programme. Approval of the Prospectus by the Central Bank of Ireland and the United Kingdom’s Financial Conduct Authori ty should not be understood as an endorsement of securities issued by TMCC under the Euro Medium Term Note Programme. • Investors and others should note that we announce material financial information using the investor relations section of our cor porate website ( http://www.toyotafinancial.com ) and SEC filings. We use these channels, press releases, as well as social media to communicate with our investors, customers and the general public about our company, our services and other is sues. While not all of the information that we post on our website or social media is of a material nature, some information could be material. Therefore, we encourage investors, the media, and others interested in our company to rev iew the information we post on the investor relations section of our website and on our social media. We may update our social media channels from time to time on the investor relations section of our corporate website.
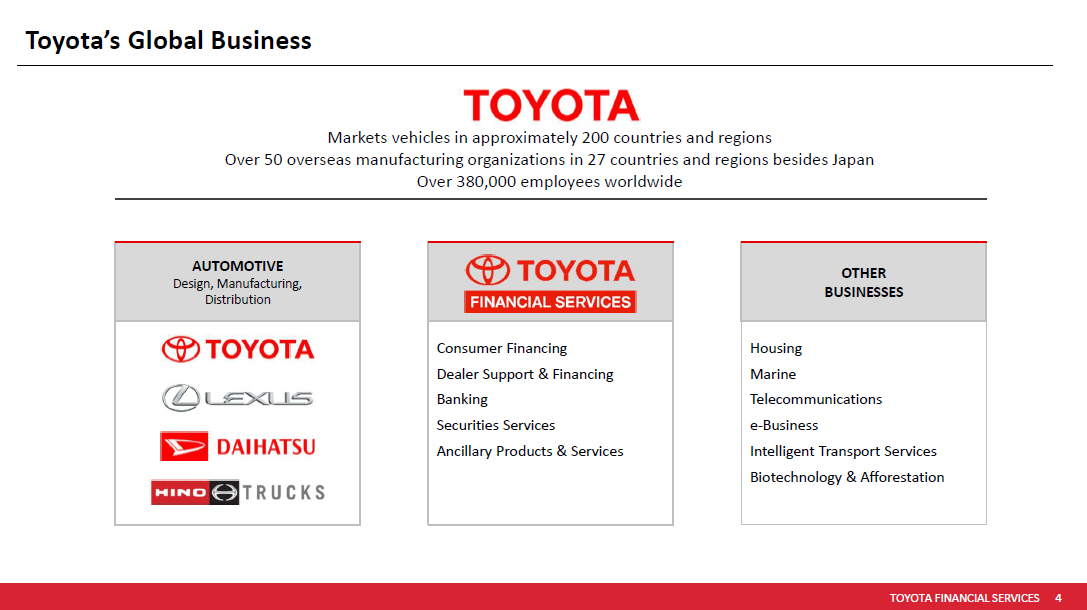
TOYOTA FINANCIAL SERVICES 4 •• PROTECTED 関係者外秘 Toyota’s Global Business Markets vehicles in approximately 200 countries and regions Over 50 overseas manufacturing organizations in 27 countries and regions besides Japan Over 380,000 employees worldwide AUTOMOTIVE Design, Manufacturing, Distribution Consumer Financing Dealer Support & Financing Banking Securities Services Ancillary Products & Services OTHER BUSINESSES Housing Marine Telecommunications e - Business Intelligent Transport Services Biotechnology & Afforestation
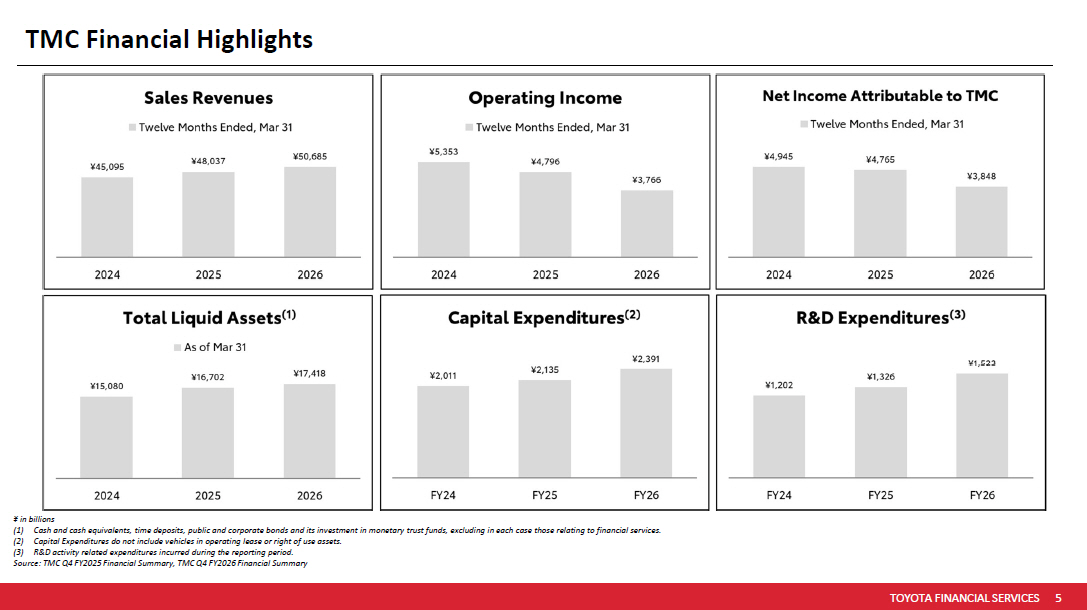
TOYOTA FINANCIAL SERVICES 5 •• PROTECTED 関係者外秘 TMC Financial Highlights ¥ in billions (1) Cash and cash equivalents, time deposits, public and corporate bonds and its investment in monetary trust funds, excluding in ea ch case those relating to financial services. (2) Capital Expenditures do not include vehicles in operating lease or right of use assets. (3) R&D activity related expenditures incurred during the reporting period. Source: TMC Q4 FY2025 Financial Summary, TMC Q4 FY2026 Financial Summary
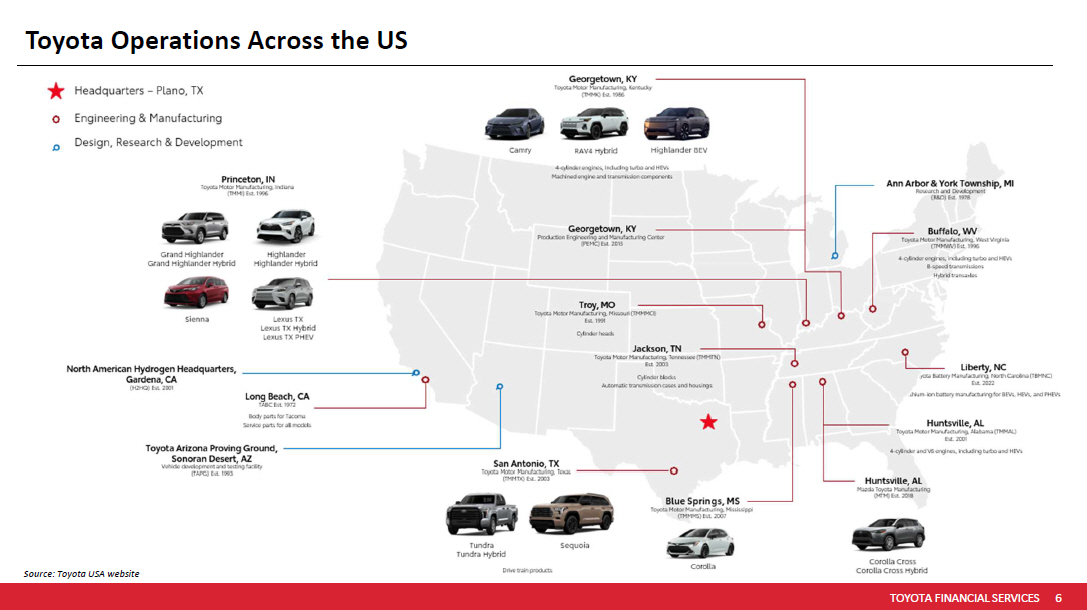
TOYOTA FINANCIAL SERVICES 6 •• PROTECTED 関係者外秘 Toyota Operations Across the US Source : Toyota USA website
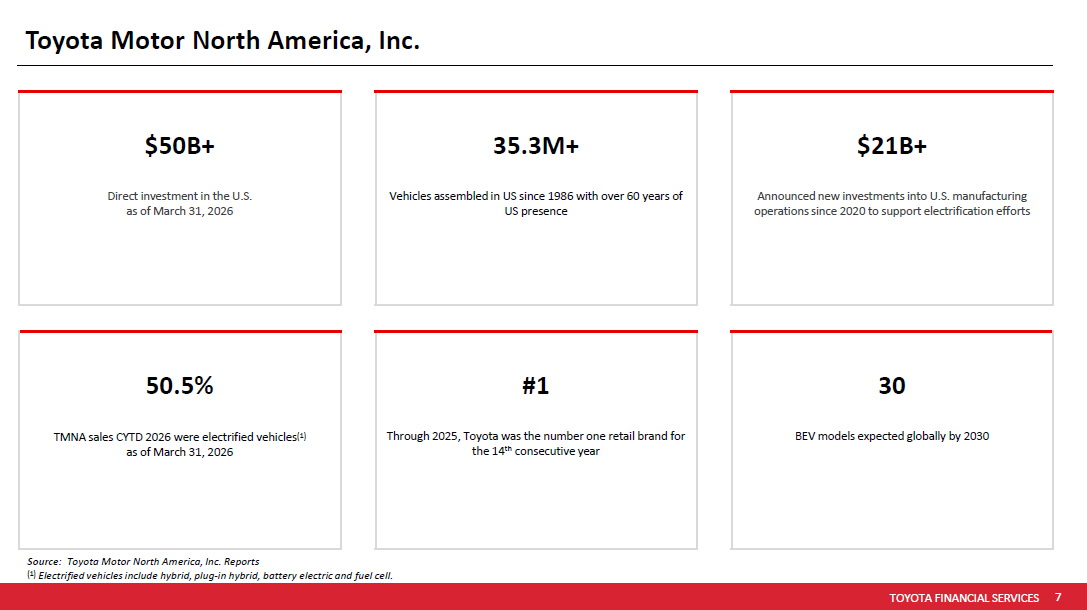
TOYOTA FINANCIAL SERVICES 7 •• PROTECTED 関係者外秘 Toyota Motor North America, Inc. $21B+ Announced new investments into U.S. manufacturing operations since 2020 to support electrification efforts 35.3M+ Vehicles assembled in US since 1986 with over 60 years of US presence $50B+ Direct investment in the U.S. as of March 31, 2026 30 BEV models expected globally by 2030 #1 Through 2025, Toyota was the number one retail brand for the 14 th consecutive year 50.5% TMNA sales CYTD 2026 were electrified vehicles (1) as of March 31, 2026 Source : Toyota Motor North America, Inc. Reports (1) Electrified vehicles include hybrid, plug - in hybrid, battery electric and fuel cell.
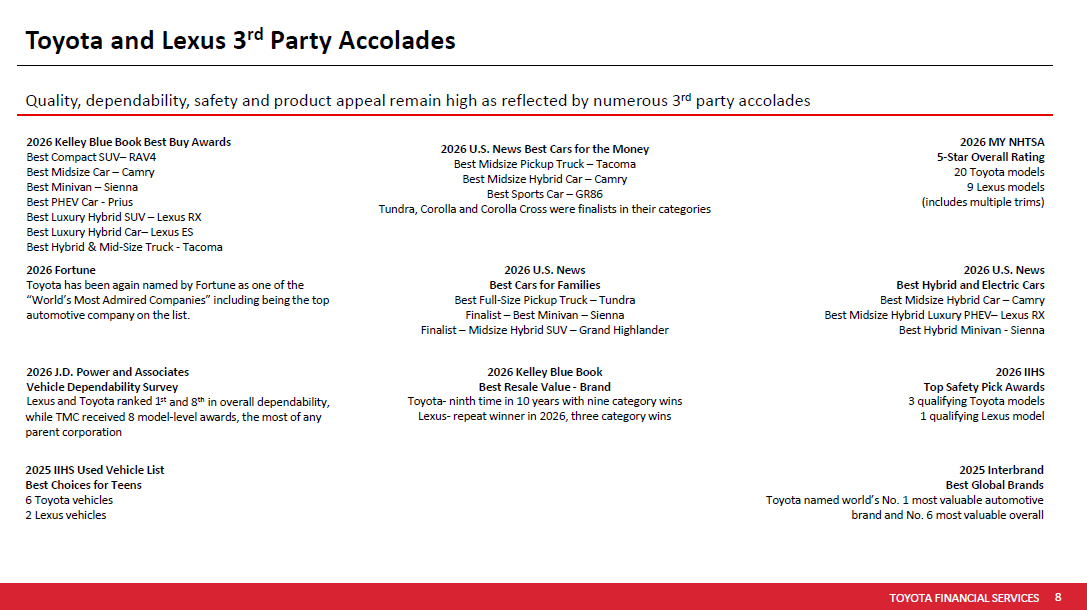
TOYOTA FINANCIAL SERVICES 8 •• PROTECTED 関係者外秘 Toyota and Lexus 3 rd Party Accolades Quality, dependability, safety and product appeal remain high as reflected by numerous 3 rd party accolades 2026 MY NHTSA 5 - Star Overall Rating 20 Toyota models 9 Lexus models (includes multiple trims) 2026 U.S. News Best Cars for the Money Best Midsize Pickup Truck – Tacoma Best Midsize Hybrid Car – Camry Best Sports Car – GR86 Tundra, Corolla and Corolla Cross were finalists in their categories 2026 Kelley Blue Book Best Buy Awards Best Compact SUV – RAV4 Best Midsize Car – Camry Best Minivan – Sienna Best PHEV Car - Prius Best Luxury Hybrid SUV – Lexus RX Best Luxury Hybrid Car – Lexus ES Best Hybrid & Mid - Size Truck - Tacoma 2026 U.S. News Best Hybrid and Electric Cars Best Midsize Hybrid Car – Camry Best Midsize Hybrid Luxury PHEV – Lexus RX Best Hybrid Minivan - Sienna 2026 U.S. News Best Cars for Families Best Full - Size Pickup Truck – Tundra Finalist – Best Minivan – Sienna Finalist – Midsize Hybrid SUV – Grand Highlander 2026 Fortune Toyota has been again named by Fortune as one of the “World’s Most Admired Companies” including being the top automotive company on the list. 2026 IIHS Top Safety Pick Awards 3 qualifying Toyota models 1 qualifying Lexus model 2026 Kelley Blue Book Best Resale Value - Brand Toyota - ninth time in 10 years with nine category wins Lexus - repeat winner in 2026, three category wins 2026 J.D. Power and Associates Vehicle Dependability Survey Lexus and Toyota ranked 1 st and 8 th in overall dependability, while TMC received 8 model - level awards, the most of any parent corporation 2025 Interbrand Best Global Brands Toyota named world’s No. 1 most valuable automotive brand and No. 6 most valuable overall 2025 IIHS Used Vehicle List Best Choices for Teens 6 Toyota vehicles 2 Lexus vehicles
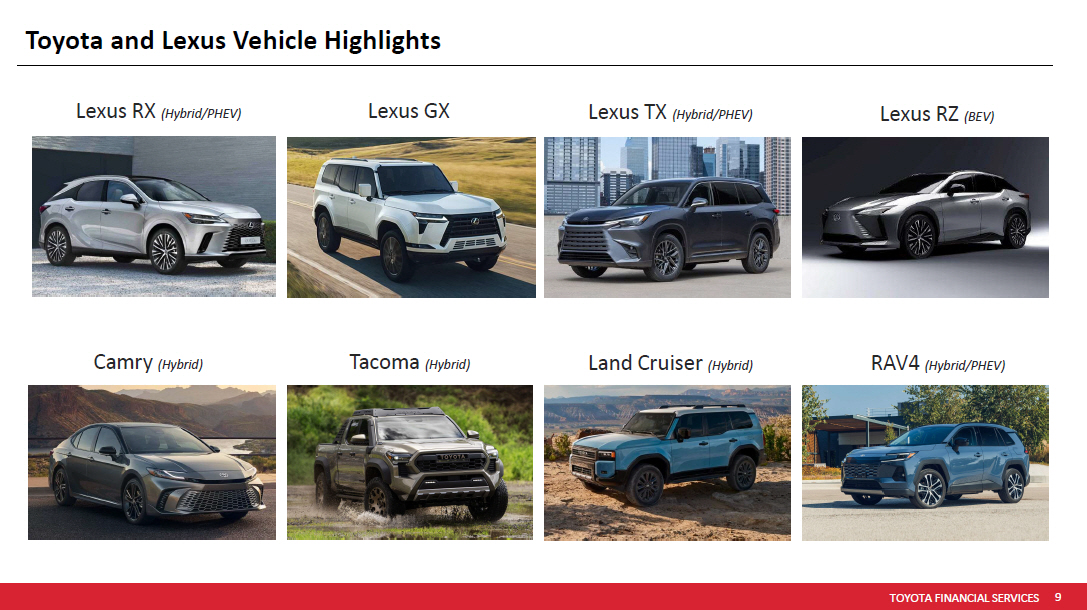
TOYOTA FINANCIAL SERVICES 9 •• PROTECTED 関係者外秘 Toyota and Lexus Vehicle Highlights Lexus GX Lexus TX (Hybrid/PHEV) Camry (Hybrid) Tacoma (Hybrid) Land Cruiser (Hybrid) Lexus RZ (BEV) Lexus RX (Hybrid/PHEV) RAV4 (Hybrid/PHEV)
TOYOTA FINANCIAL SERVICES 10 •• PROTECTED 関係者外秘 Toyota Financial Services
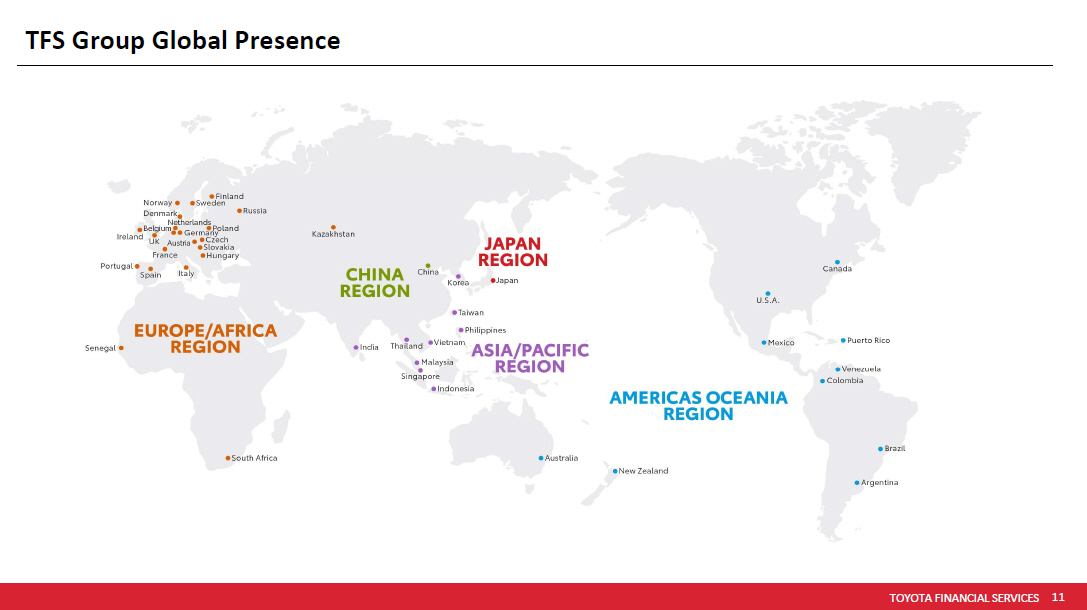
TOYOTA FINANCIAL SERVICES 11 •• PROTECTED 関係者外秘 TFS Group Global Presence
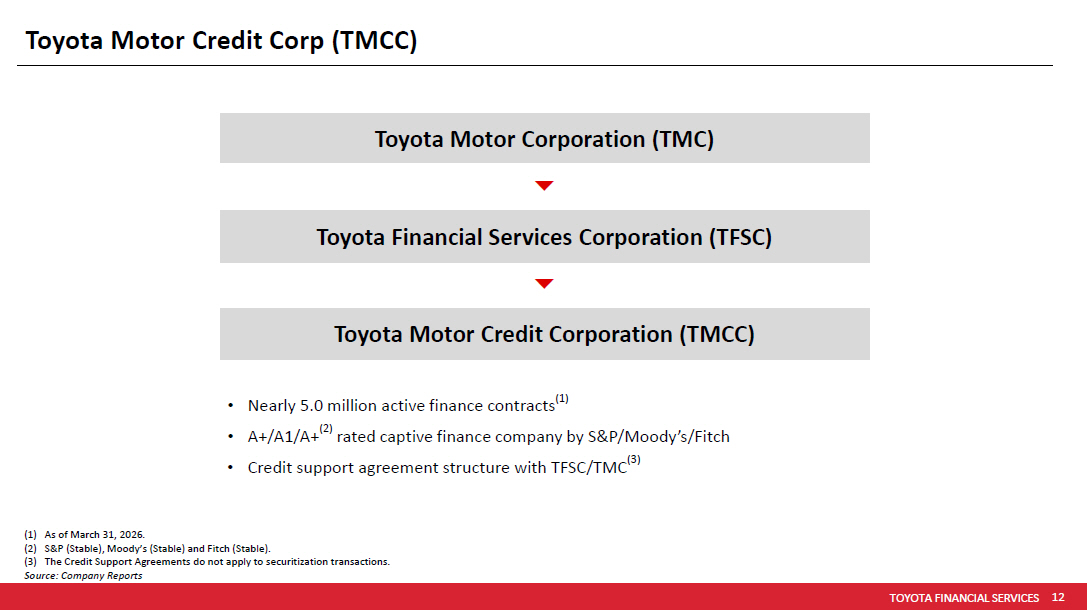
TOYOTA FINANCIAL SERVICES 12 •• PROTECTED 関係者外秘 Toyota Motor Credit Corp (TMCC) Toyota Motor Corporation (TMC) Toyota Financial Services Corporation (TFSC) Toyota Motor Credit Corporation (TMCC) • Nearly 5.0 million active finance contracts (1) • A+/A1/A+ (2) rated captive finance company by S&P/Moody’s/Fitch • Credit support agreement structure with TFSC/TMC (3) (1) As of March 31, 2026 . (2) S&P (Stable), Moody’s (Stable) and Fitch (Stable). (3) The Credit Support Agreements do not apply to securitization transactions. Source : Company Reports
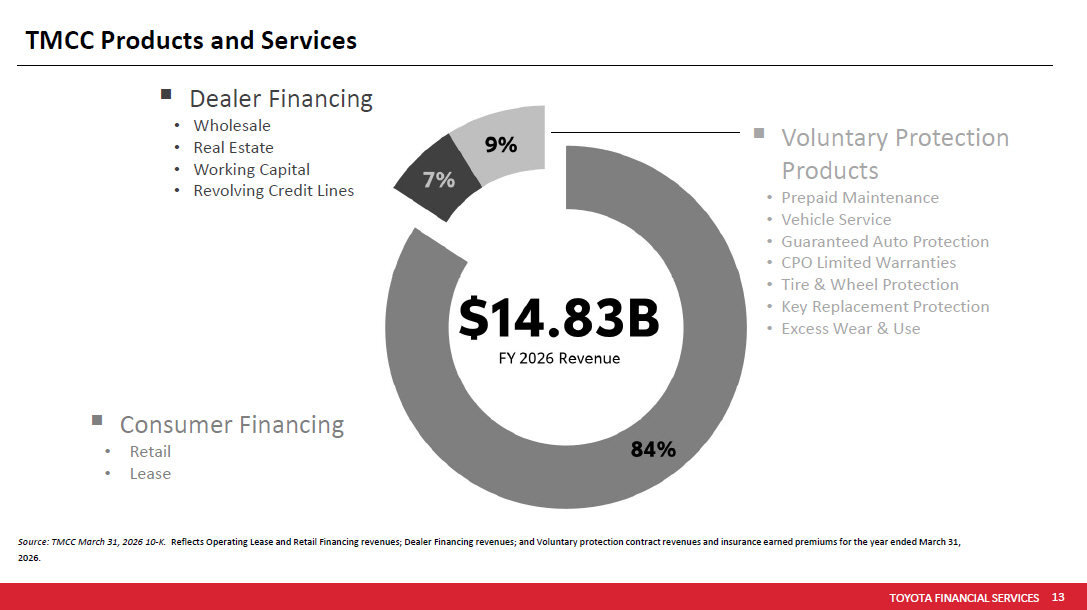
TOYOTA FINANCIAL SERVICES 13 •• PROTECTED 関係者外秘 ▪ Voluntary Protection Products • Prepaid Maintenance • Vehicle Service • Guaranteed Auto Protection • CPO Limited Warranties • Tire & Wheel Protection • Key Replacement Protection • Excess Wear & Use TMCC Products and Services ▪ Dealer Financing • Wholesale • Real Estate • Working Capital • Revolving Credit Lines ▪ Consumer Financing • Retail • Lease Source : TMCC March 31, 2026 10 - K . Reflects Operating Lease and Retail Financing revenues; Dealer Financing revenues; and Voluntary protection contract revenues and insurance earned premiums for the year ended March 31, 2026.
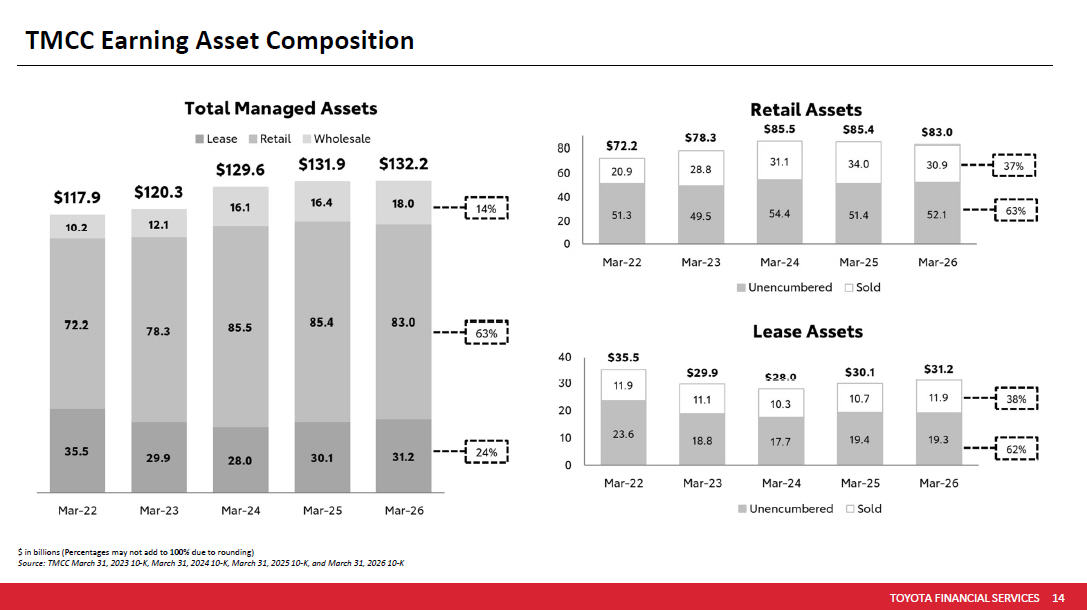
TOYOTA FINANCIAL SERVICES 14 •• PROTECTED 関係者外秘 TMCC Earning Asset Composition $ in billions (P ercentages may not add to 100% due to rounding) Source: TMCC March 31, 2023 10 - K, March 31, 2024 10 - K, March 31, 2025 10 - K, and March 31, 2026 10 - K
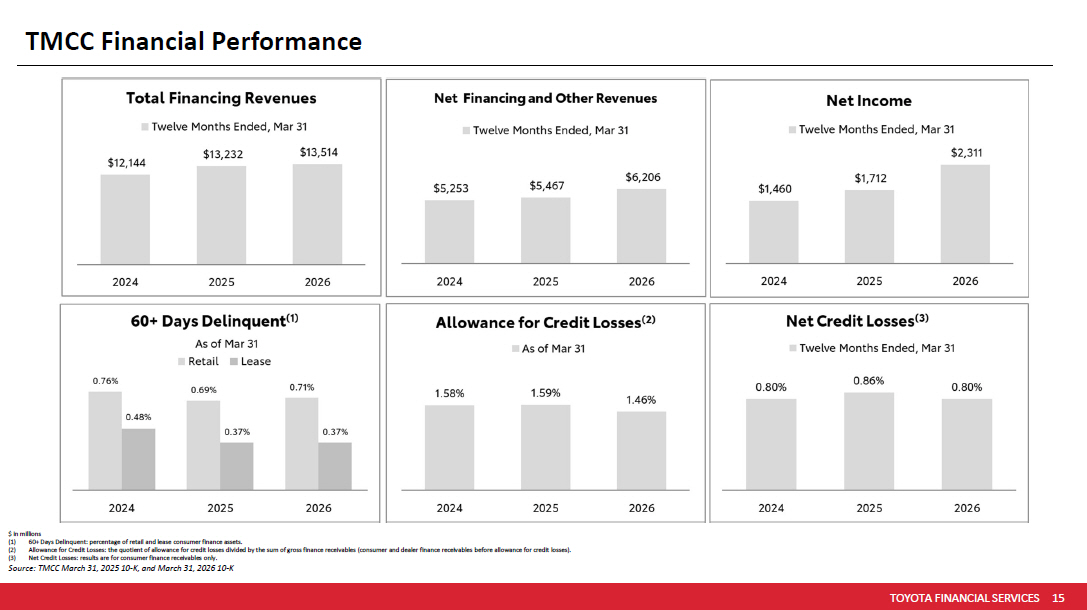
TOYOTA FINANCIAL SERVICES 15 •• PROTECTED 関係者外秘 TMCC Financial Performance $ in millions (1) 60+ Days Delinquent: percentage of retail and lease consumer finance assets. (2) Allowance for Credit Losses: the quotient of allowance for credit losses divided by the sum of gross finance receivables (con sum er and dealer finance receivables before allowance for credit losses). (3) Net Credit Losses: results are for consumer finance receivables only. Source: TMCC March 31, 2025 10 - K, and March 31, 2026 10 - K
TOYOTA FINANCIAL SERVICES 16 •• PROTECTED 関係者外秘 TMCC Funding Programs
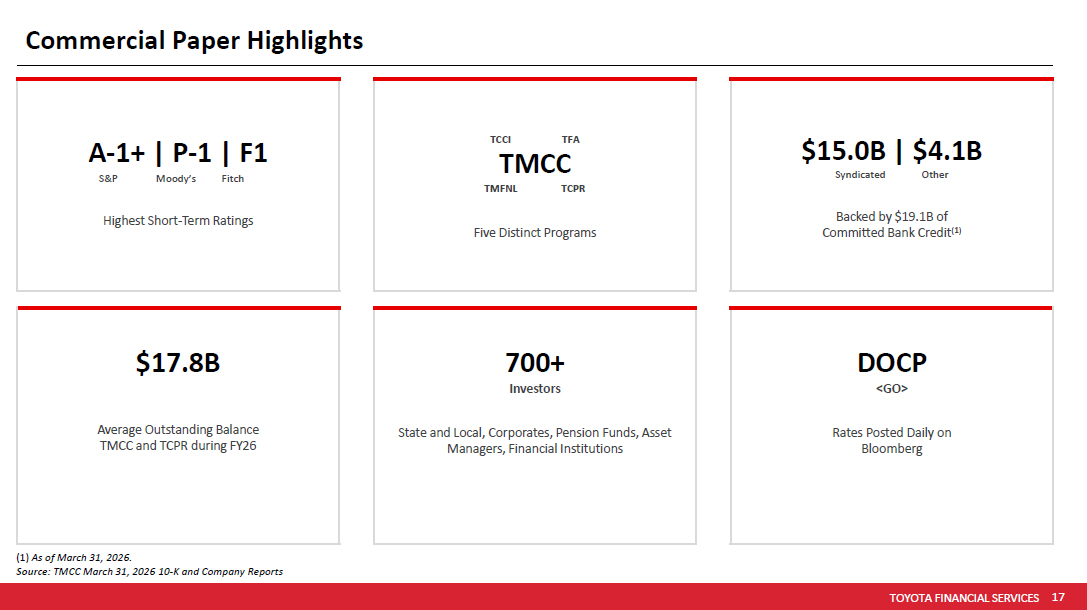
TOYOTA FINANCIAL SERVICES 17 •• PROTECTED 関係者外秘 Commercial Paper Highlights (1) As of March 31, 2026. Source : TMCC March 31, 2026 10 - K and Company Reports $15.0B | $4.1B Syndicated Other Backed by $19.1B of Committed Bank Credit (1) TCCI TFA TMCC TMFNL TCPR Five Distinct Programs A - 1+ | P - 1 | F1 S&P Moody’s Fitch Highest Short - Term Ratings DOCP <GO> Rates Posted Daily on Bloomberg 700+ Investors State and Local, Corporates, Pension Funds, Asset Managers, Financial Institutions $17.8B Average Outstanding Balance TMCC and TCPR during FY26
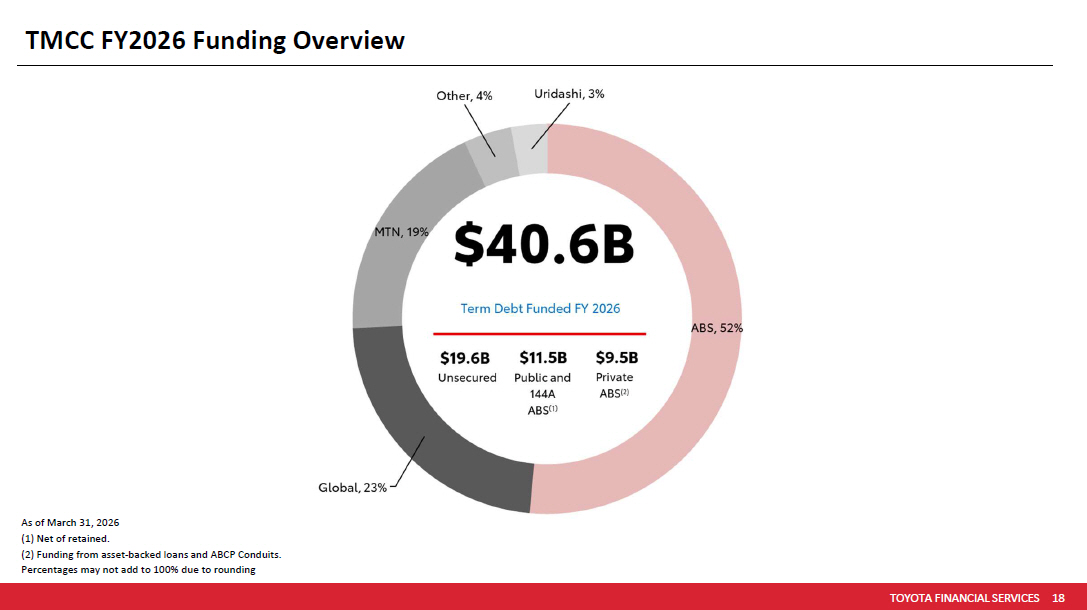
TOYOTA FINANCIAL SERVICES 18 •• PROTECTED 関係者外秘 TMCC FY2026 Funding Overview As of March 31, 2026 (1) Net of retained. (2) Funding from asset - backed loans and ABCP Conduits. Percentages may not add to 100% due to rounding
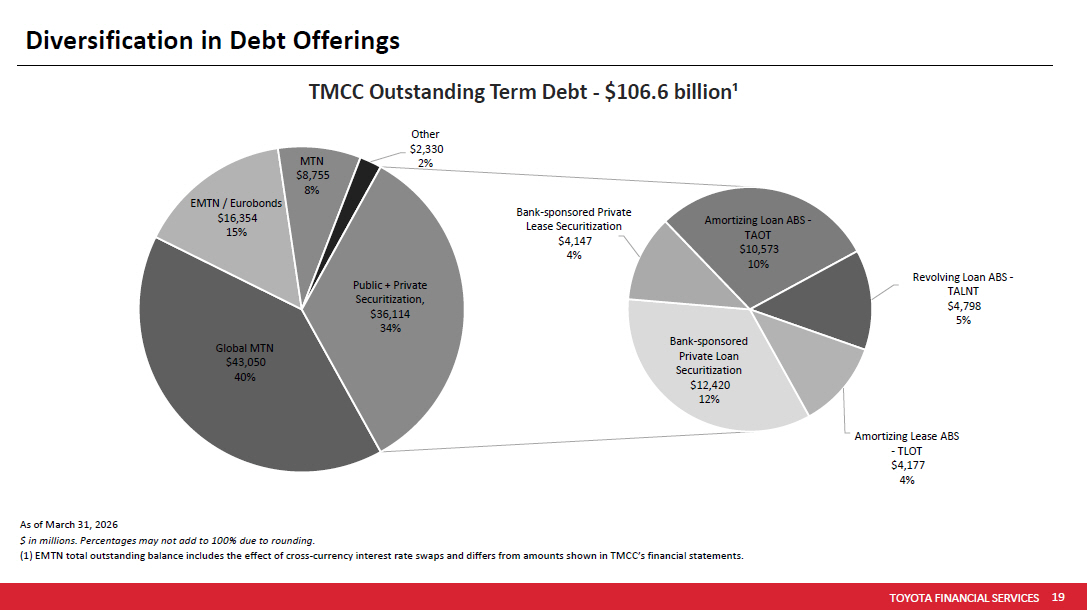
TOYOTA FINANCIAL SERVICES 19 •• PROTECTED 関係者外秘 Diversification in Debt Offerings As of March 31, 2026 $ in millions. Percentages may not add to 100% due to rounding. (1) EMTN total outstanding balance includes the effect of cross - currency interest rate swaps and differs from amounts shown in T MCC’s financial statements. Global MTN $43,050 40% EMTN / Eurobonds $16,354 15% MTN $8,755 8% Other $2,330 2% Bank - sponsored Private Loan Securitization $12,420 12% Bank - sponsored Private Lease Securitization $4,147 4% Amortizing Loan ABS - TAOT $10,573 10% Revolving Loan ABS - TALNT $4,798 5% Amortizing Lease ABS - TLOT $4,177 4% Public + Private Securitization, $36,114 34% TMCC Outstanding Term Debt - $106.6 billion¹
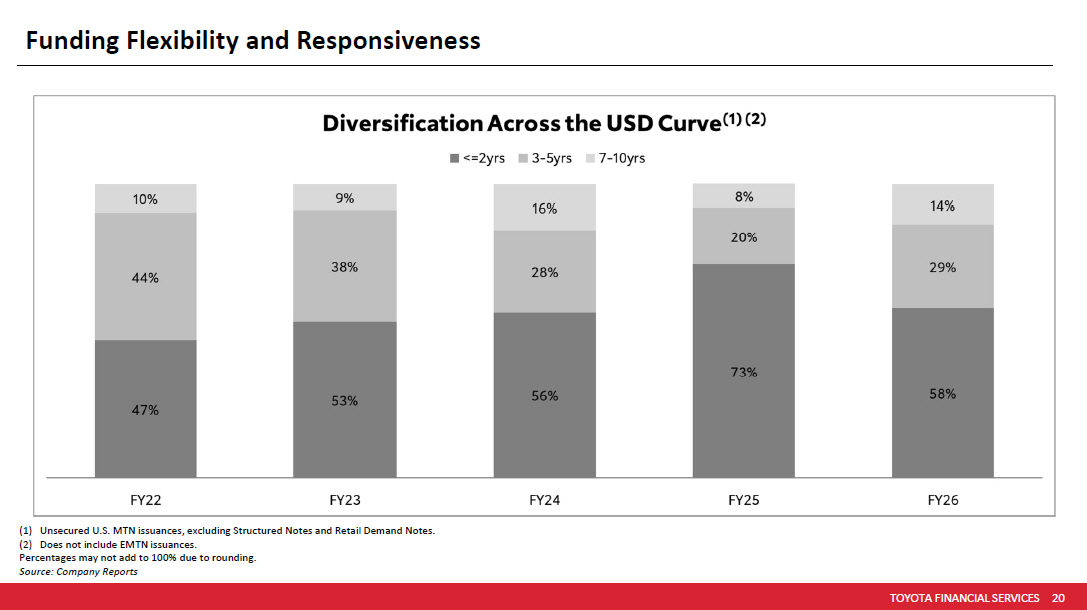
TOYOTA FINANCIAL SERVICES 20 •• PROTECTED 関係者外秘 Funding Flexibility and Responsiveness (1) Unsecured U.S. MTN issuances, excluding Structured Notes and Retail Demand Notes. (2) Does not include EMTN issuances. Percentages may not add to 100% due to rounding. Source: Company Reports
TOYOTA FINANCIAL SERVICES 21 •• PROTECTED 関係者外秘 Retail Loan and Lease Origination and Portfolio Performance
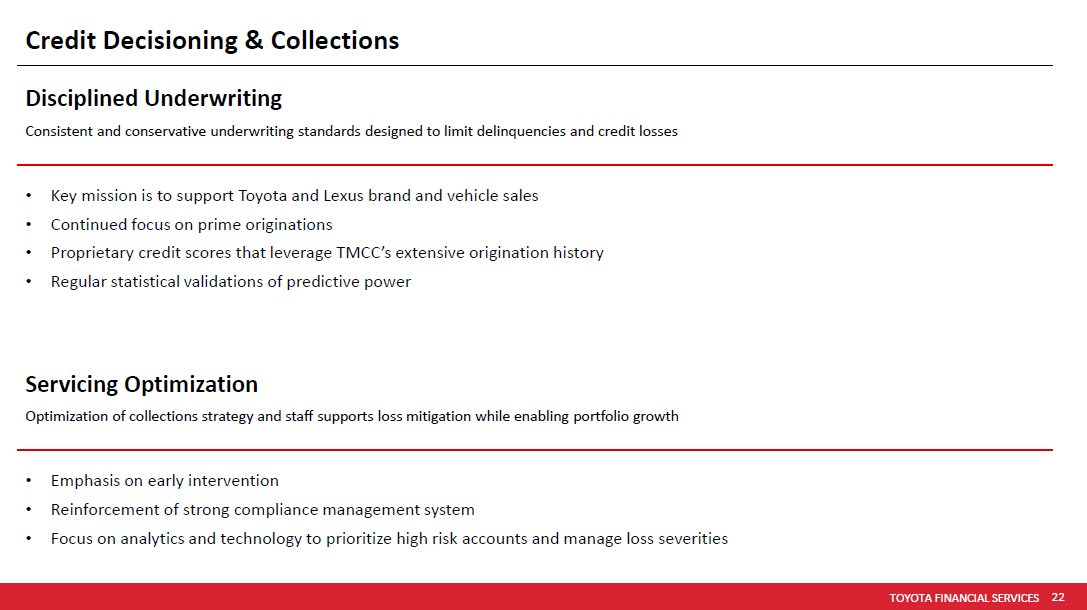
TOYOTA FINANCIAL SERVICES 22 •• PROTECTED 関係者外秘 Credit Decisioning & Collections Disciplined Underwriting Consistent and conservative underwriting standards designed to limit delinquencies and credit losses • Key mission is to support Toyota and Lexus brand and vehicle sales • Continued focus on prime originations • Proprietary credit scores that leverage TMCC’s extensive origination history • Regular statistical validations of predictive power Servicing Optimization Optimization of collections strategy and staff supports loss mitigation while enabling portfolio growth • Emphasis on early intervention • Reinforcement of strong compliance management system • Focus on analytics and technology to prioritize high risk accounts and manage loss severities
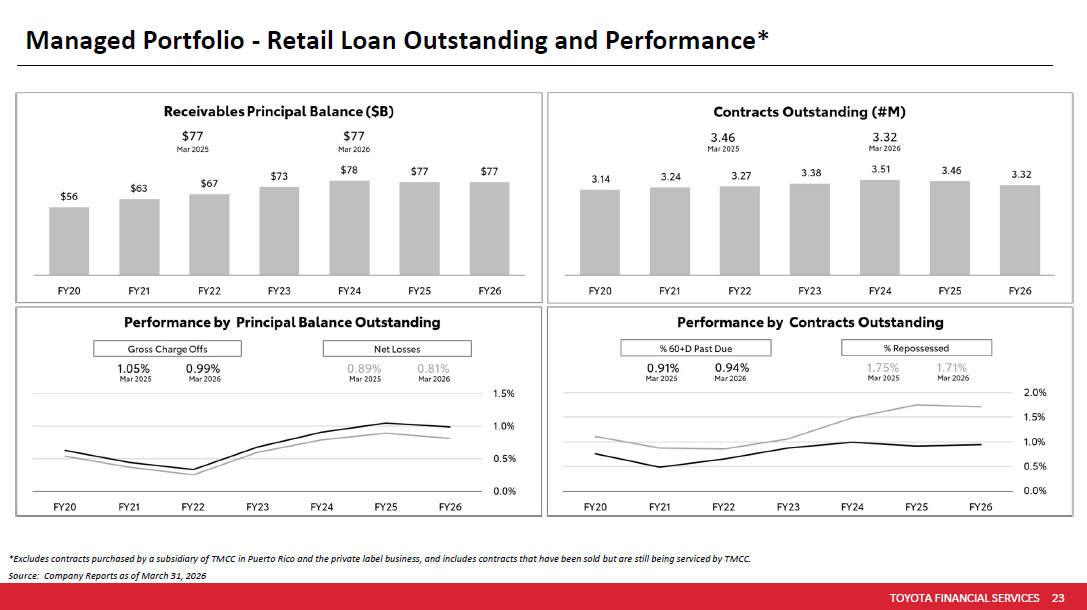
TOYOTA FINANCIAL SERVICES 23 •• PROTECTED 関係者外秘 Managed Portfolio - Retail Loan Outstanding and Performance* Source: Company Reports as of March 31, 2026 *Excludes contracts purchased by a subsidiary of TMCC in Puerto Rico and the private label business, and includes contracts t hat have been sold but are still being serviced by TMCC.
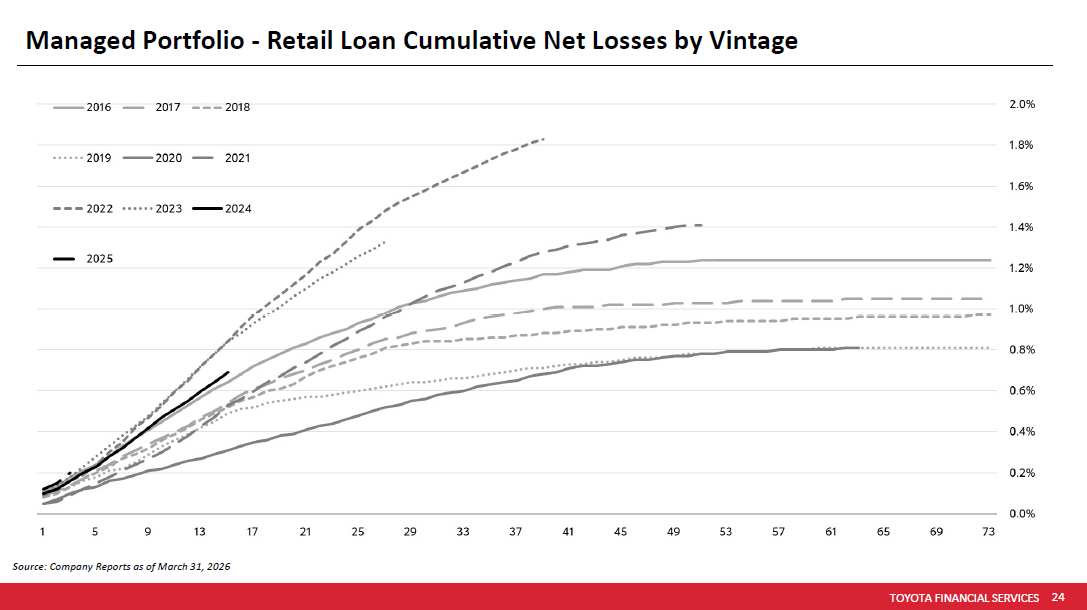
TOYOTA FINANCIAL SERVICES 24 •• PROTECTED 関係者外秘 Managed Portfolio - Retail Loan Cumulative Net Losses by Vintage Source : Company Reports as of March 31, 2026
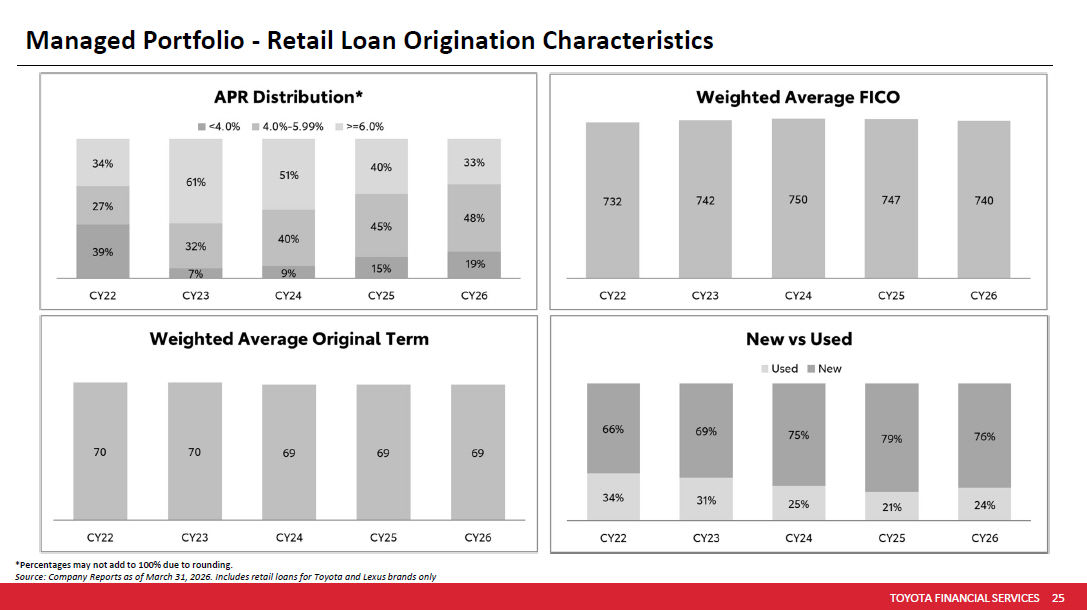
TOYOTA FINANCIAL SERVICES 25 •• PROTECTED 関係者外秘 Managed Portfolio - Retail Loan Origination Characteristics *Percentages may not add to 100% due to rounding. Source: Company Reports as of March 31, 2026. Includes retail loans for Toyota and Lexus brands only
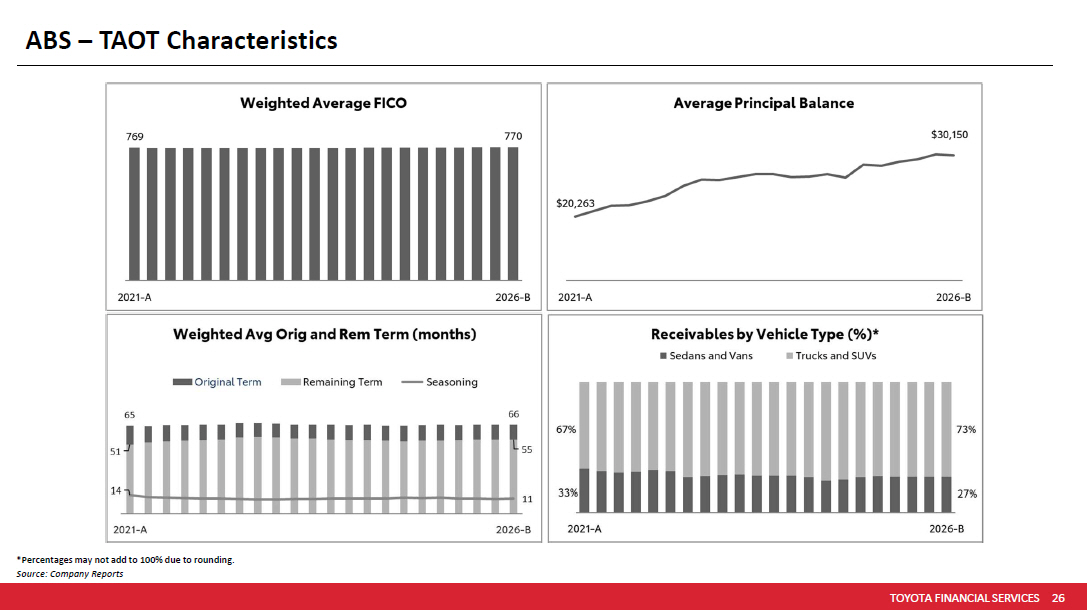
TOYOTA FINANCIAL SERVICES 26 •• PROTECTED 関係者外秘 ABS – TAOT Characteristics *Percentages may not add to 100% due to rounding. Source: Company Reports
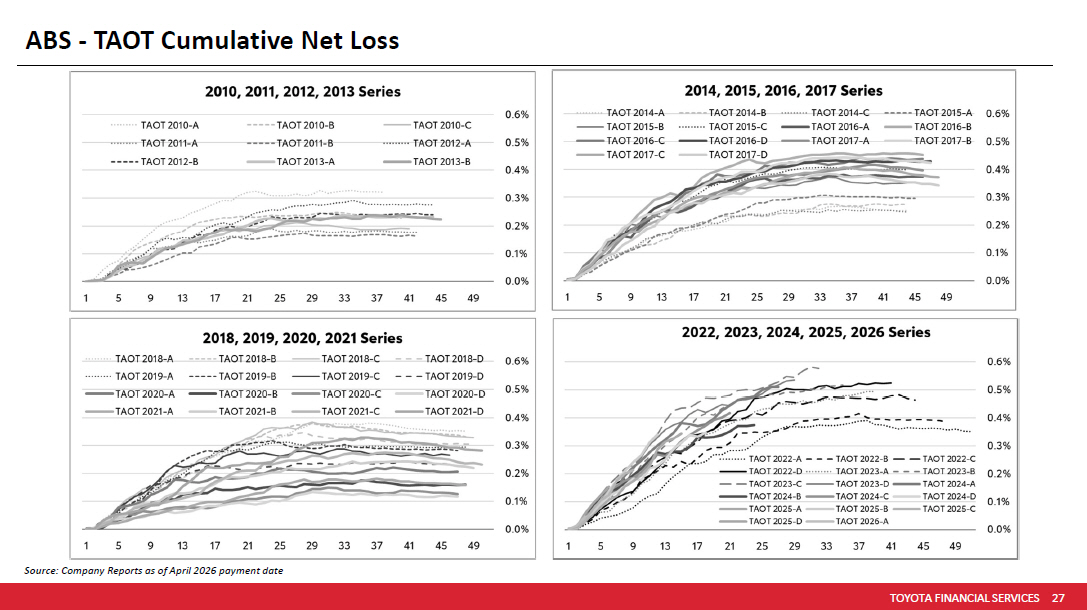
TOYOTA FINANCIAL SERVICES 27 •• PROTECTED 関係者外秘 ABS - TAOT Cumulative Net Loss Source : Company Reports as of April 2026 payment date
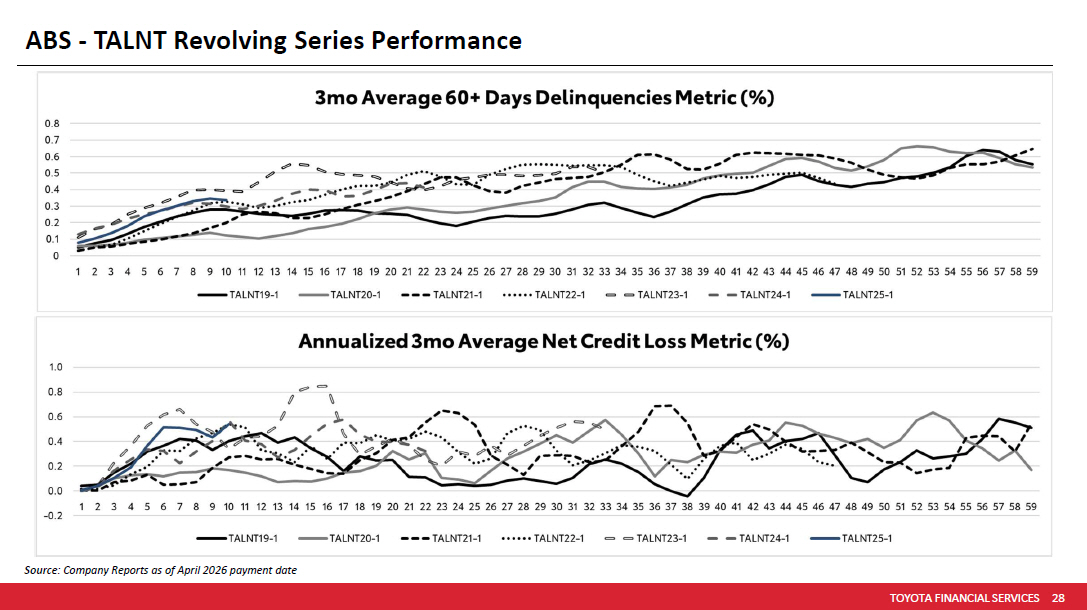
TOYOTA FINANCIAL SERVICES 28 •• PROTECTED 関係者外秘 ABS - TALNT Revolving Series Performance Source : Company Reports as of April 2026 payment date
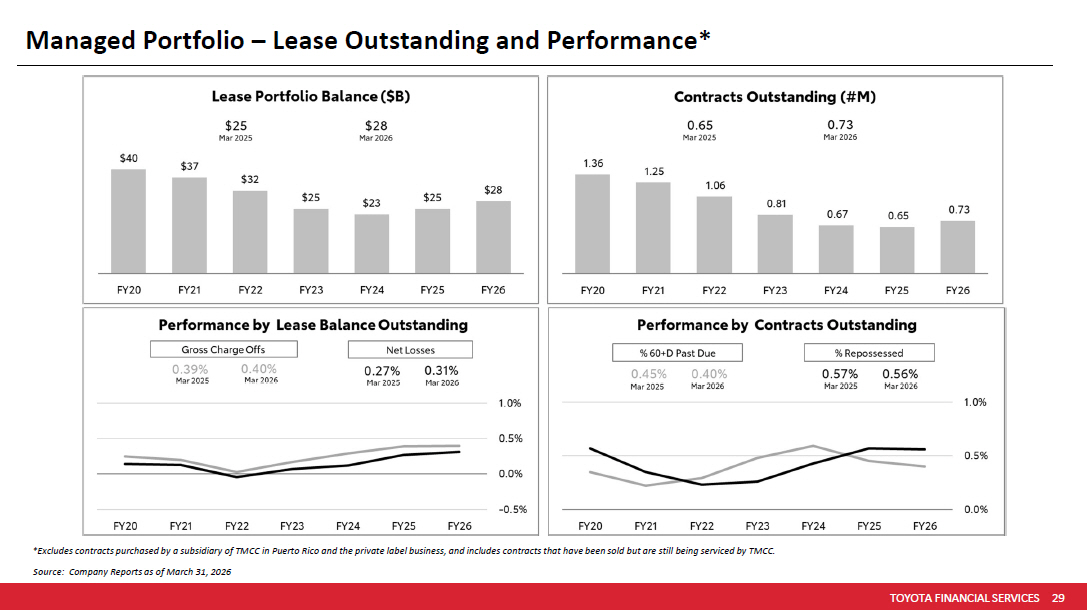
TOYOTA FINANCIAL SERVICES 29 •• PROTECTED 関係者外秘 Source: Company Reports as of March 31, 2026 Managed Portfolio – Lease Outstanding and Performance* *Excludes contracts purchased by a subsidiary of TMCC in Puerto Rico and the private label business, and includes contracts t hat have been sold but are still being serviced by TMCC.
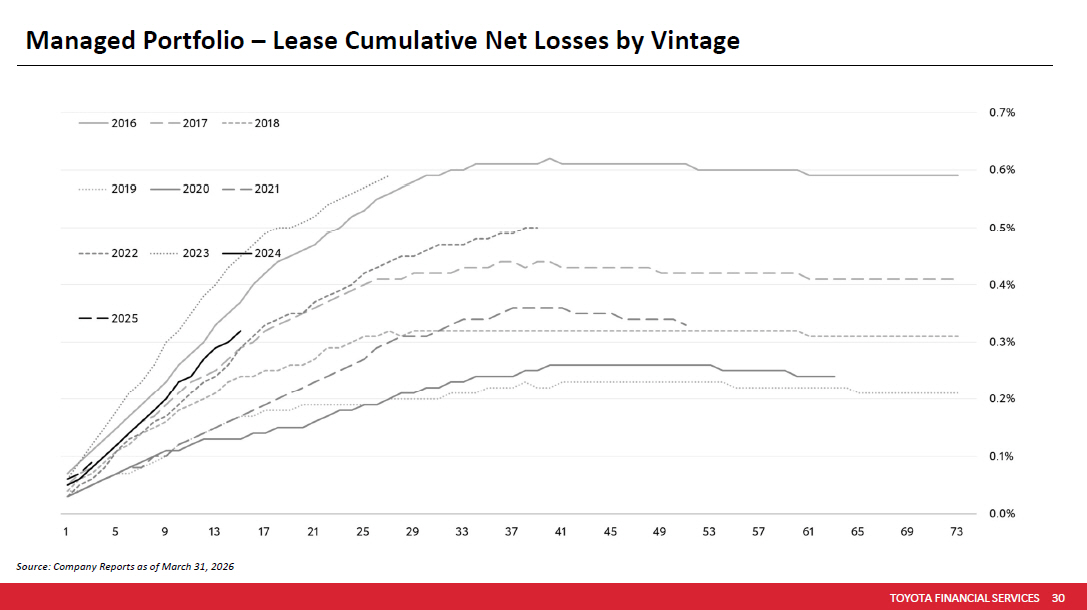
TOYOTA FINANCIAL SERVICES 30 •• PROTECTED 関係者外秘 Managed Portfolio – Lease Cumulative Net Losses by Vintage Source : Company Reports as of March 31, 2026
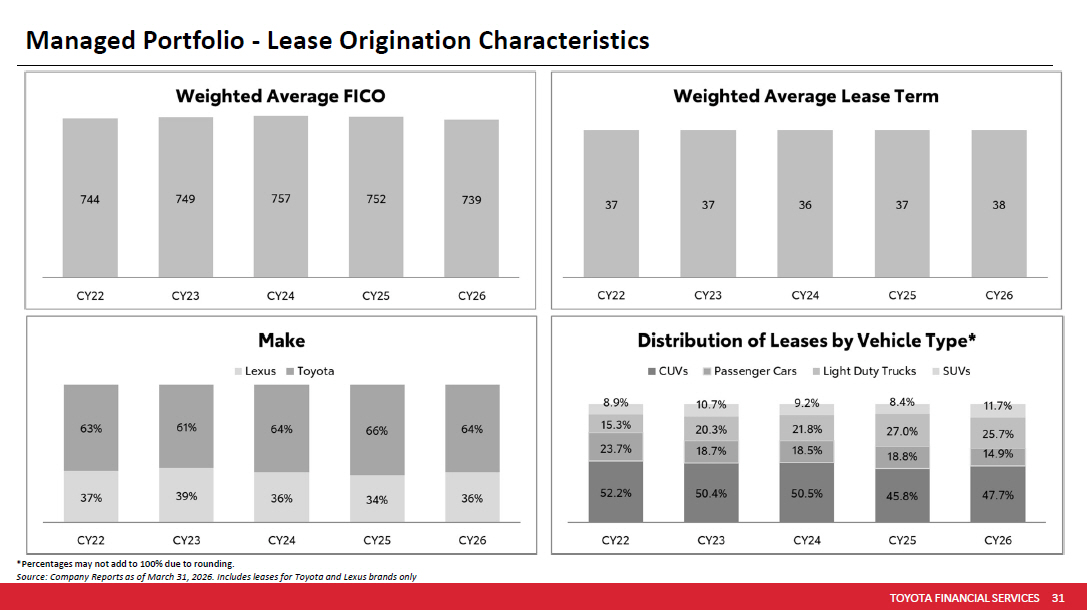
TOYOTA FINANCIAL SERVICES 31 •• PROTECTED 関係者外秘 Managed Portfolio - Lease Origination Characteristics *Percentages may not add to 100% due to rounding. Source: Company Reports as of March 31, 2026. Includes leases for Toyota and Lexus brands only
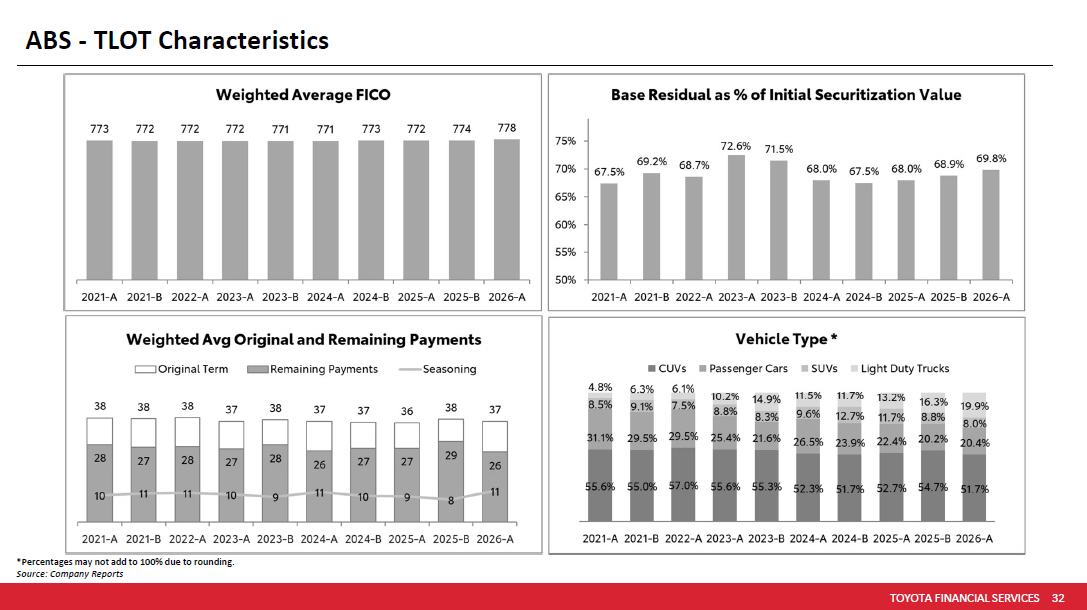
TOYOTA FINANCIAL SERVICES 32 •• PROTECTED 関係者外秘 ABS - TLOT Characteristics *Percentages may not add to 100% due to rounding. Source: Company Reports
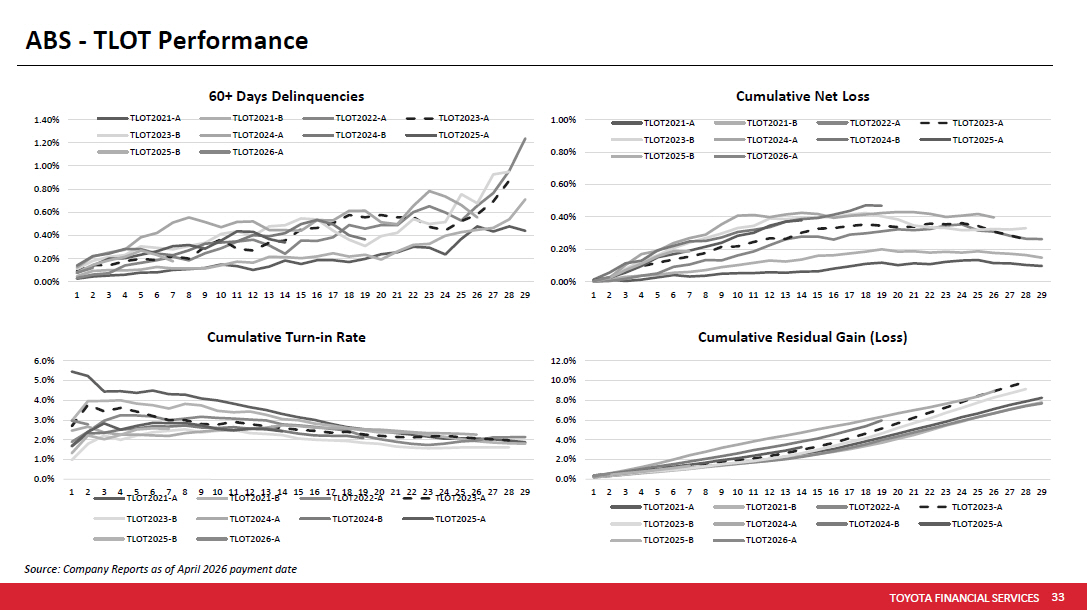
TOYOTA FINANCIAL SERVICES 33 •• PROTECTED 関係者外秘 Source : Company Reports as of April 2026 payment date ABS - TLOT Performance 0.00% 0.20% 0.40% 0.60% 0.80% 1.00% 1 2 3 4 5 6 7 8 9 10 11 12 13 14 15 16 17 18 19 20 21 22 23 24 25 26 27 28 29 Cumulative Net Loss TLOT2021-A TLOT2021-B TLOT2022-A TLOT2023-A TLOT2023-B TLOT2024-A TLOT2024-B TLOT2025-A TLOT2025-B TLOT2026-A 0.0% 2.0% 4.0% 6.0% 8.0% 10.0% 12.0% 1 2 3 4 5 6 7 8 9 10 11 12 13 14 15 16 17 18 19 20 21 22 23 24 25 26 27 28 29 Cumulative Residual Gain (Loss) TLOT2021-A TLOT2021-B TLOT2022-A TLOT2023-A TLOT2023-B TLOT2024-A TLOT2024-B TLOT2025-A TLOT2025-B TLOT2026-A 0.00% 0.20% 0.40% 0.60% 0.80% 1.00% 1.20% 1.40% 1 2 3 4 5 6 7 8 9 10 11 12 13 14 15 16 17 18 19 20 21 22 23 24 25 26 27 28 29 60+ Days Delinquencies TLOT2021-A TLOT2021-B TLOT2022-A TLOT2023-A TLOT2023-B TLOT2024-A TLOT2024-B TLOT2025-A TLOT2025-B TLOT2026-A 0.0% 1.0% 2.0% 3.0% 4.0% 5.0% 6.0% 1 2 3 4 5 6 7 8 9 10 11 12 13 14 15 16 17 18 19 20 21 22 23 24 25 26 27 28 29 Cumulative Turn - in Rate TLOT2021-A TLOT2021-B TLOT2022-A TLOT2023-A TLOT2023-B TLOT2024-A TLOT2024-B TLOT2025-A TLOT2025-B TLOT2026-A
TOYOTA FINANCIAL SERVICES 34 •• PROTECTED 関係者外秘 Appendix
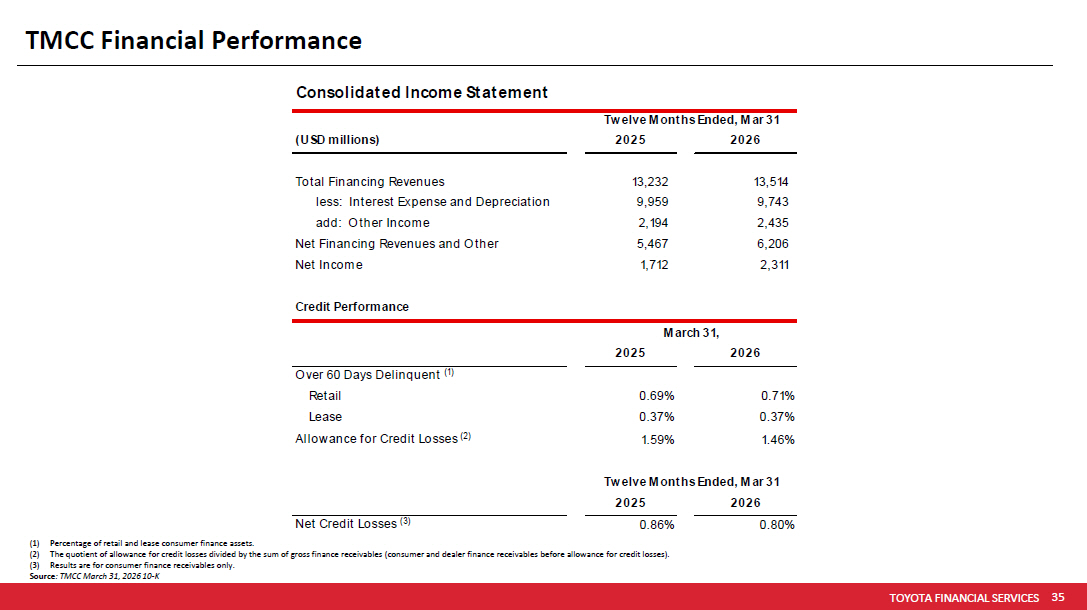
TOYOTA FINANCIAL SERVICES 35 •• PROTECTED 関係者外秘 TMCC Financial Performance (1) Percentage of retail and lease consumer finance assets. (2) The quotient of allowance for credit losses divided by the sum of gross finance receivables (consumer and dealer finance rece iva bles before allowance for credit losses). (3) Results are for consumer finance receivables only. Source : TMCC March 31, 2026 10 - K Consolidated Income Statement (USD millions) 2025 2026 Total Financing Revenues 13,232 13,514 less: Interest Expense and Depreciation 9,959 9,743 add: Other Income 2,194 2,435 Net Financing Revenues and Other 5,467 6,206 Net Income 1,712 2,311 Credit Performance 2025 2026 Over 60 Days Delinquent (1) Retail 0.69% 0.71% Lease 0.37% 0.37% Allowance for Credit Losses (2) 1.59% 1.46% 2025 2026 Net Credit Losses (3) 0.86% 0.80% Twelve Months Ended, Mar 31 March 31, Twelve Months Ended, Mar 31 RK1
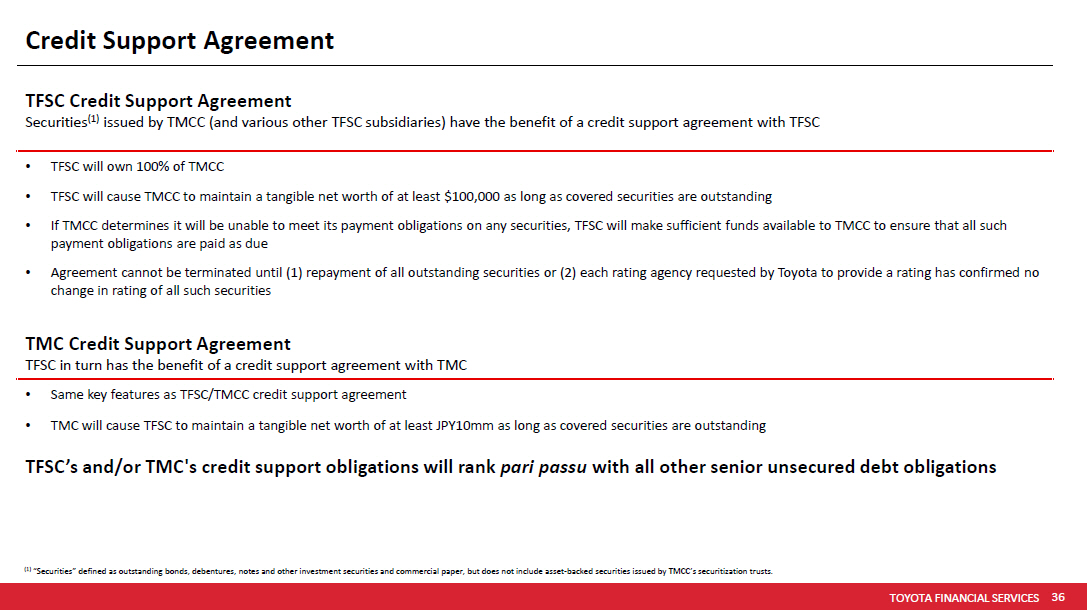
TOYOTA FINANCIAL SERVICES 36 •• PROTECTED 関係者外秘 Credit Support Agreement TFSC Credit Support Agreement Securities (1) issued by TMCC (and various other TFSC subsidiaries) have the benefit of a credit support agreement with TFSC • TFSC will own 100% of TMCC • TFSC will cause TMCC to maintain a tangible net worth of at least $100,000 as long as covered securities are outstanding • If TMCC determines it will be unable to meet its payment obligations on any securities, TFSC will make sufficient funds avail abl e to TMCC to ensure that all such payment obligations are paid as due • Agreement cannot be terminated until (1) repayment of all outstanding securities or (2) each rating agency requested by Toyot a t o provide a rating has confirmed no change in rating of all such securities TMC Credit Support Agreement TFSC in turn has the benefit of a credit support agreement with TMC • Same key features as TFSC/TMCC credit support agreement • TMC will cause TFSC to maintain a tangible net worth of at least JPY10mm as long as covered securities are outstanding TFSC’s and/or TMC's credit support obligations will rank pari passu with all other senior unsecured debt obligations (1) “Securities” defined as outstanding bonds, debentures, notes and other investment securities and commercial paper, but does n ot include asset - backed securities issued by TMCC’s securitization trusts.
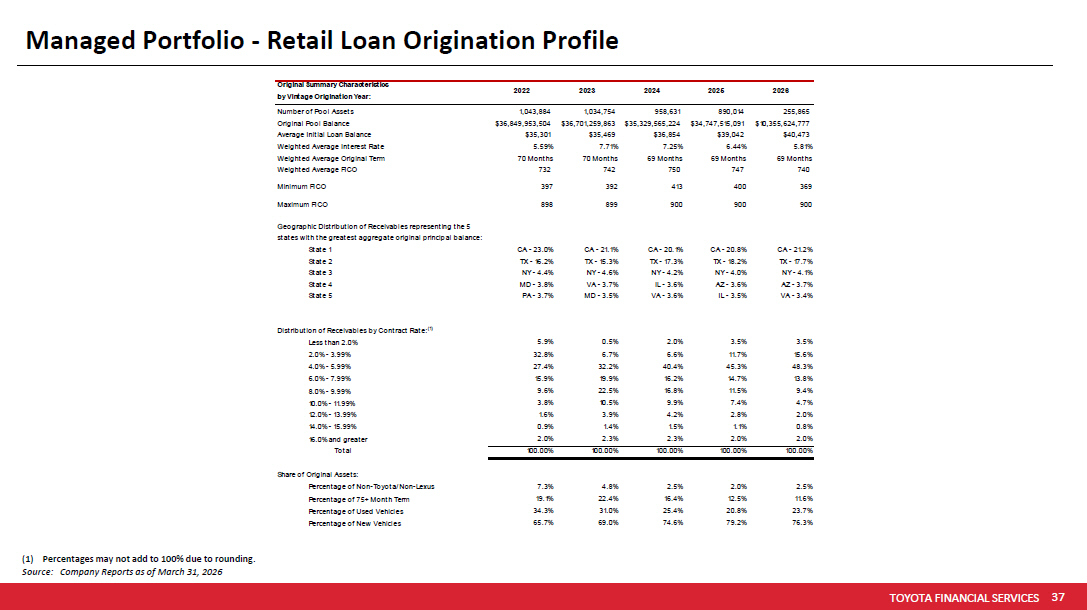
TOYOTA FINANCIAL SERVICES 37 •• PROTECTED 関係者外秘 Managed Portfolio - Retail Loan Origination Profile (1) Percentages may not add to 100% due to rounding. Source: Company Reports as of March 31, 2026 Original Summary Characteristics by Vintage Origination Year: 2022 2023 2024 2025 2026 Number of Pool Assets 1,043,884 1,034,754 958,631 890,014 255,865 Original Pool Balance $36,849,953,504 $36,701,259,863 $35,329,565,224 $34,747,515,091 $10,355,624,777 Average Initial Loan Balance $35,301 $35,469 $36,854 $39,042 $40,473 Weighted Average Interest Rate 5.59% 7.71% 7.25% 6.44% 5.81% Weighted Average Original Term 70 Months 70 Months 69 Months 69 Months 69 Months Weighted Average FICO 732 742 750 747 740 Minimum FICO 397 392 413 400 369 Maximum FICO 898 899 900 900 900 Geographic Distribution of Receivables representing the 5 states with the greatest aggregate original principal balance: State 1 CA - 23.0% CA - 21.1% CA - 20.1% CA - 20.8% CA - 21.2% State 2 TX - 16.2% TX - 15.3% TX - 17.3% TX - 18.2% TX - 17.7% State 3 NY - 4.4% NY - 4.6% NY - 4.2% NY - 4.0% NY - 4.1% State 4 MD - 3.8% VA - 3.7% IL - 3.6% AZ - 3.6% AZ - 3.7% State 5 PA - 3.7% MD - 3.5% VA - 3.6% IL - 3.5% VA - 3.4% Distribution of Receivables by Contract Rate: (1) Less than 2.0% 5.9% 0.5% 2.0% 3.5% 3.5% 2.0% - 3.99% 32.8% 6.7% 6.6% 11.7% 15.6% 4.0% - 5.99% 27.4% 32.2% 40.4% 45.3% 48.3% 6.0% - 7.99% 15.9% 19.9% 16.2% 14.7% 13.8% 8.0% - 9.99% 9.6% 22.5% 16.8% 11.5% 9.4% 10.0% - 11.99% 3.8% 10.5% 9.9% 7.4% 4.7% 12.0% - 13.99% 1.6% 3.9% 4.2% 2.8% 2.0% 14.0% - 15.99% 0.9% 1.4% 1.5% 1.1% 0.8% 16.0% and greater 2.0% 2.3% 2.3% 2.0% 2.0% Total 100.00% 100.00% 100.00% 100.00% 100.00% Share of Original Assets: Percentage of Non-Toyota/Non-Lexus 7.3% 4.8% 2.5% 2.0% 2.5% Percentage of 75+ Month Term 19.1% 22.4% 16.4% 12.5% 11.6% Percentage of Used Vehicles 34.3% 31.0% 25.4% 20.8% 23.7% Percentage of New Vehicles 65.7% 69.0% 74.6% 79.2% 76.3%
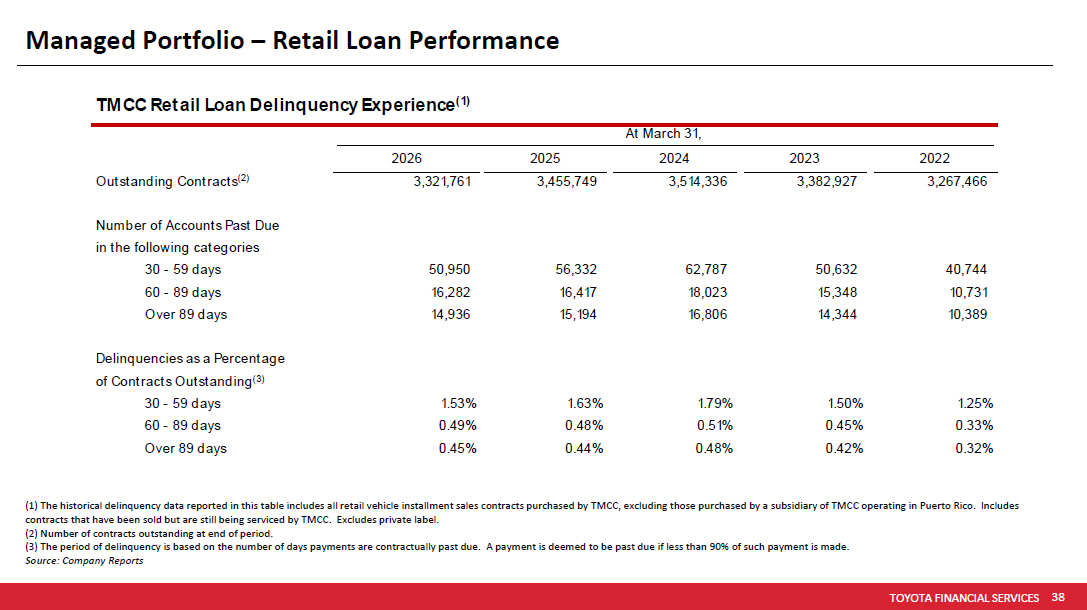
TOYOTA FINANCIAL SERVICES 38 •• PROTECTED 関係者外秘 Managed Portfolio – Retail Loan Performance (1) The historical delinquency data reported in this table includes all retail vehicle installment sales contracts purchased by TMCC, excluding those purchased by a subsidiary of TMCC operating in Puerto Rico. Includes contracts that have been sold but are still being serviced by TMCC. Excludes private label. (2) Number of contracts outstanding at end of period. (3) The period of delinquency is based on the number of days payments are contractually past due. A payment is deemed to be pas t due if less than 90% of such payment is made. Source: Company Reports 2026 2025 2024 2023 2022 Outstanding Contracts (2) 3,321,761 3,455,749 3,514,336 3,382,927 3,267,466 Number of Accounts Past Due in the following categories 30 - 59 days 50,950 56,332 62,787 50,632 40,744 60 - 89 days 16,282 16,417 18,023 15,348 10,731 Over 89 days 14,936 15,194 16,806 14,344 10,389 Delinquencies as a Percentage of Contracts Outstanding (3) 30 - 59 days 1.53% 1.63% 1.79% 1.50% 1.25% 60 - 89 days 0.49% 0.48% 0.51% 0.45% 0.33% Over 89 days 0.45% 0.44% 0.48% 0.42% 0.32% TMCC Retail Loan Delinquency Experience (1) At March 31,
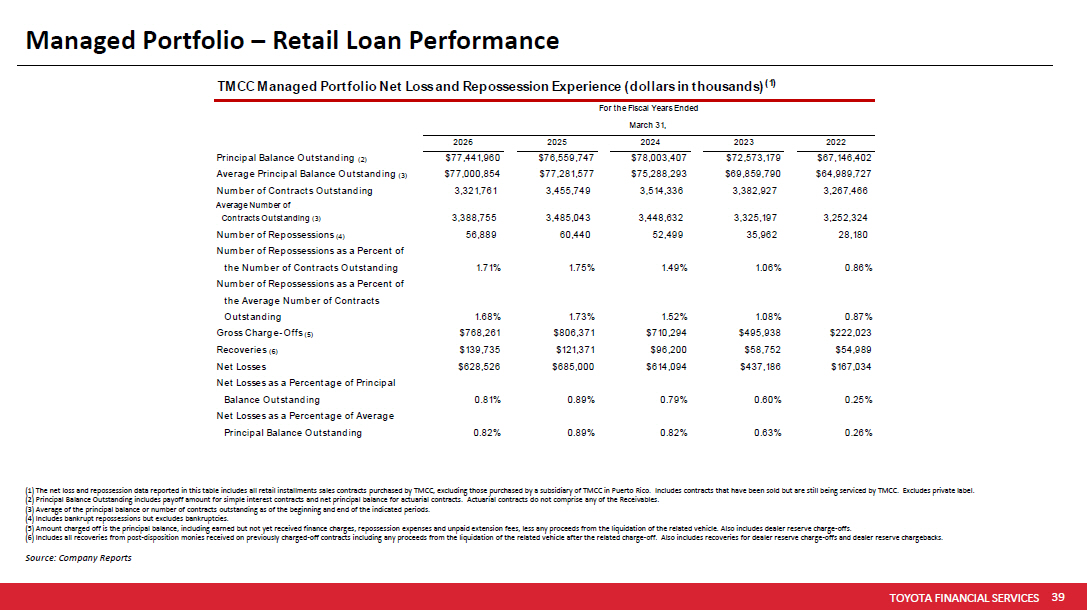
TOYOTA FINANCIAL SERVICES 39 •• PROTECTED 関係者外秘 Managed Portfolio – Retail Loan Performance (1) The net loss and repossession data reported in this table includes all retail installments sales contracts purchased by T MCC , excluding those purchased by a subsidiary of TMCC in Puerto Rico. Includes contracts that have been sold but are still bei ng serviced by TMCC. Excludes private label. (2) Principal Balance Outstanding includes payoff amount for simple interest contracts and net principal balance for actuaria l c ontracts. Actuarial contracts do not comprise any of the Receivables. (3) Average of the principal balance or number of contracts outstanding as of the beginning and end of the indicated periods. (4) Includes bankrupt repossessions but excludes bankruptcies. (5) Amount charged off is the principal balance, including earned but not yet received finance charges, repossession expenses an d unpaid extension fees, less any proceeds from the liquidation of the related vehicle. Also includes dealer reserve charge - offs . (6) Includes all recoveries from post - disposition monies received on previously charged - off contracts including any proceeds fro m the liquidation of the related vehicle after the related charge - off. Also includes recoveries for dealer reserve charge - offs and dealer reserve chargebacks. Source : Company Reports 2026 2025 2024 2023 2022 Principal Balance Outstanding (2) $77,441,960 $76,559,747 $78,003,407 $72,573,179 $67,146,402 Average Principal Balance Outstanding (3) $77,000,854 $77,281,577 $75,288,293 $69,859,790 $64,989,727 Number of Contracts Outstanding 3,321,761 3,455,749 3,514,336 3,382,927 3,267,466 Average Number of Contracts Outstanding (3) 3,388,755 3,485,043 3,448,632 3,325,197 3,252,324 Number of Repossessions (4) 56,889 60,440 52,499 35,962 28,180 Number of Repossessions as a Percent of the Number of Contracts Outstanding 1.71% 1.75% 1.49% 1.06% 0.86% Number of Repossessions as a Percent of the Average Number of Contracts Outstanding 1.68% 1.73% 1.52% 1.08% 0.87% Gross Charge-Offs (5) $768,261 $806,371 $710,294 $495,938 $222,023 Recoveries (6) $139,735 $121,371 $96,200 $58,752 $54,989 Net Losses $628,526 $685,000 $614,094 $437,186 $167,034 Net Losses as a Percentage of Principal Balance Outstanding 0.81% 0.89% 0.79% 0.60% 0.25% Net Losses as a Percentage of Average Principal Balance Outstanding 0.82% 0.89% 0.82% 0.63% 0.26% TMCC Managed Portfolio Net Loss and Repossession Experience (dollars in thousands) (1) For the Fiscal Years Ended March 31,
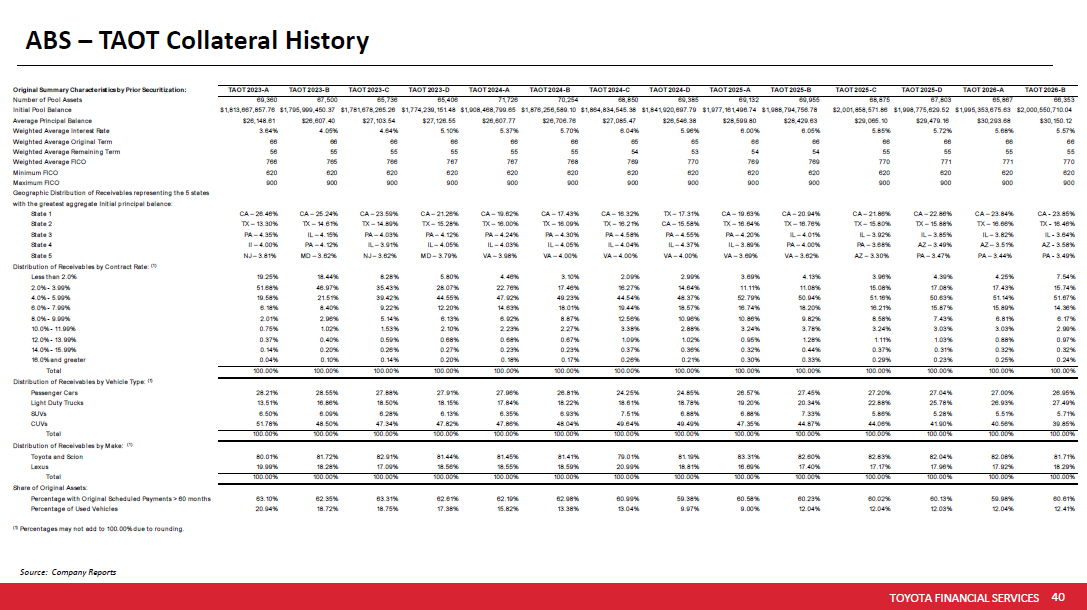
TOYOTA FINANCIAL SERVICES 40 •• PROTECTED 関係者外秘 Source : Company Reports ABS – TAOT Collateral History Original Summary Characteristics by Prior Securitization: TAOT 2023-A TAOT 2023-B TAOT 2023-C TAOT 2023-D TAOT 2024-A TAOT 2024-B TAOT 2024-C TAOT 2024-D TAOT 2025-A TAOT 2025-B TAOT 2025-C TAOT 2025-D TAOT 2026-A TAOT 2026-B Number of Pool Assets 69,360 67,500 65,736 65,406 71,726 70,254 68,850 69,385 69,132 69,955 68,875 67,803 65,867 66,353 Initial Pool Balance $1,813,667,857.76 $1,795,999,450.37 $1,781,678,265.26 $1,774,239,151.48 $1,908,468,799.65 $1,876,256,589.10 $1,864,834,545.38 $1,841,920,697.79 $1,977,161,496.74 $1,988,794,756.78 $2,001,858,571.86 $1,998,775,629.52 $1,995,353,675.63 $2,000,550,710.04 Average Principal Balance $26,148.61 $26,607.40 $27,103.54 $27,126.55 $26,607.77 $26,706.76 $27,085.47 $26,546.38 $28,599.80 $28,429.63 $29,065.10 $29,479.16 $30,293.68 $30,150.12 Weighted Average Interest Rate 3.64% 4.05% 4.64% 5.10% 5.37% 5.70% 6.04% 5.96% 6.00% 6.05% 5.85% 5.72% 5.68% 5.57% Weighted Average Original Term 66 66 66 66 66 66 65 65 66 66 66 66 66 66 Weighted Average Remaining Term 56 55 55 55 55 55 54 53 54 54 55 55 55 55 Weighted Average FICO 766 765 766 767 767 768 769 770 769 769 770 771 771 770 Minimum FICO 620 620 620 620 620 620 620 620 620 620 620 620 620 620 Maximum FICO 900 900 900 900 900 900 900 900 900 900 900 900 900 900 Geographic Distribution of Receivables representing the 5 states with the greatest aggregate Initial principal balance: 900 State 1 CA – 26.46% CA – 25.24% CA – 23.59% CA – 21.26% CA – 19.62% CA – 17.43% CA – 16.32% TX – 17.31% CA – 19.63% CA – 20.94% CA – 21.86% CA – 22.86% CA – 23.84% CA - 23.85% State 2 TX – 13.30% TX – 14.61% TX – 14.89% TX – 15.28% TX – 16.00% TX – 16.09% TX – 16.21% CA – 15.58% TX – 16.64% TX – 16.76% TX – 15.80% TX – 15.88% TX – 16.66% TX - 16.46% State 3 PA – 4.35% IL – 4.15% PA – 4.03% PA – 4.12% PA – 4.24% PA – 4.30% PA – 4.58% PA – 4.55% PA – 4.20% IL – 4.01% IL – 3.92% IL – 3.85% IL – 3.82% IL - 3.64% State 4 Il – 4.00% PA – 4.12% IL – 3.91% IL – 4.05% IL – 4.03% IL – 4.05% IL – 4.04% IL – 4.37% IL – 3.89% PA – 4.00% PA – 3.68% AZ – 3.49% AZ – 3.51% AZ - 3.58% State 5 NJ – 3.81% MD – 3.62% NJ – 3.62% MD – 3.79% VA – 3.98% VA – 4.00% VA – 4.00% VA – 4.00% VA – 3.69% VA – 3.62% AZ – 3.30% PA – 3.47% PA – 3.44% PA - 3.49% Distribution of Receivables by Contract Rate: (1) MD – 3.62% VA – 3.62% AZ – 3.49% Less than 2.0% 19.25% 18.44% 8.28% 5.80% 4.46% 3.10% 2.09% 2.99% 3.69% 4.13% 3.96% 4.39% 4.25% 7.54% 2.0% - 3.99% 51.68% 46.97% 35.43% 28.07% 22.76% 17.46% 16.27% 14.64% 11.11% 11.08% 15.08% 17.08% 17.43% 15.74% 4.0% - 5.99% 19.58% 21.51% 39.42% 44.55% 47.92% 49.23% 44.54% 48.37% 52.79% 50.94% 51.16% 50.63% 51.14% 51.67% 6.0% - 7.99% 6.18% 8.40% 9.22% 12.20% 14.63% 18.01% 19.44% 18.57% 16.74% 18.20% 16.21% 15.87% 15.89% 14.36% 8.0% - 9.99% 2.01% 2.96% 5.14% 6.13% 6.92% 8.87% 12.56% 10.96% 10.86% 9.82% 8.58% 7.43% 6.81% 6.17% 10.0% - 11.99% 0.75% 1.02% 1.53% 2.10% 2.23% 2.27% 3.38% 2.88% 3.24% 3.78% 3.24% 3.03% 3.03% 2.99% 12.0% - 13.99% 0.37% 0.40% 0.59% 0.68% 0.68% 0.67% 1.09% 1.02% 0.95% 1.28% 1.11% 1.03% 0.88% 0.97% 14.0% - 15.99% 0.14% 0.20% 0.26% 0.27% 0.23% 0.23% 0.37% 0.36% 0.32% 0.44% 0.37% 0.31% 0.32% 0.32% 16.0% and greater 0.04% 0.10% 0.14% 0.20% 0.18% 0.17% 0.26% 0.21% 0.30% 0.33% 0.29% 0.23% 0.25% 0.24% Total 100.00% 100.00% 100.00% 100.00% 100.00% 100.00% 100.00% 100.00% 100.00% 100.00% 100.00% 100.00% 100.00% 100.00% Distribution of Receivables by Vehicle Type: (1) Passenger Cars 28.21% 28.55% 27.88% 27.91% 27.96% 26.81% 24.25% 24.85% 26.57% 27.45% 27.20% 27.04% 27.00% 26.95% Light Duty Trucks 13.51% 16.86% 18.50% 18.15% 17.84% 18.22% 18.61% 18.78% 19.20% 20.34% 22.88% 25.78% 26.93% 27.49% SUVs 6.50% 6.09% 6.28% 6.13% 6.35% 6.93% 7.51% 6.88% 6.88% 7.33% 5.86% 5.28% 5.51% 5.71% CUVs 51.78% 48.50% 47.34% 47.82% 47.86% 48.04% 49.64% 49.49% 47.35% 44.87% 44.06% 41.90% 40.56% 39.85% Total 100.00% 100.00% 100.00% 100.00% 100.00% 100.00% 100.00% 100.00% 100.00% 100.00% 100.00% 100.00% 100.00% 100.00% Distribution of Receivables by Make: (1) Toyota and Scion 80.01% 81.72% 82.91% 81.44% 81.45% 81.41% 79.01% 81.19% 83.31% 82.60% 82.83% 82.04% 82.08% 81.71% Lexus 19.99% 18.28% 17.09% 18.56% 18.55% 18.59% 20.99% 18.81% 16.69% 17.40% 17.17% 17.96% 17.92% 18.29% Total 100.00% 100.00% 100.00% 100.00% 100.00% 100.00% 100.00% 100.00% 100.00% 100.00% 100.00% 100.00% 100.00% 100.00% Share of Original Assets: Percentage with Original Scheduled Payments > 60 months 63.10% 62.35% 63.31% 62.61% 62.19% 62.98% 60.99% 59.38% 60.58% 60.23% 60.02% 60.13% 59.98% 60.61% Percentage of Used Vehicles 20.94% 18.72% 18.75% 17.38% 15.82% 13.38% 13.04% 9.97% 9.00% 12.04% 12.04% 12.03% 12.04% 12.41% (1) Percentages may not add to 100.00% due to rounding.
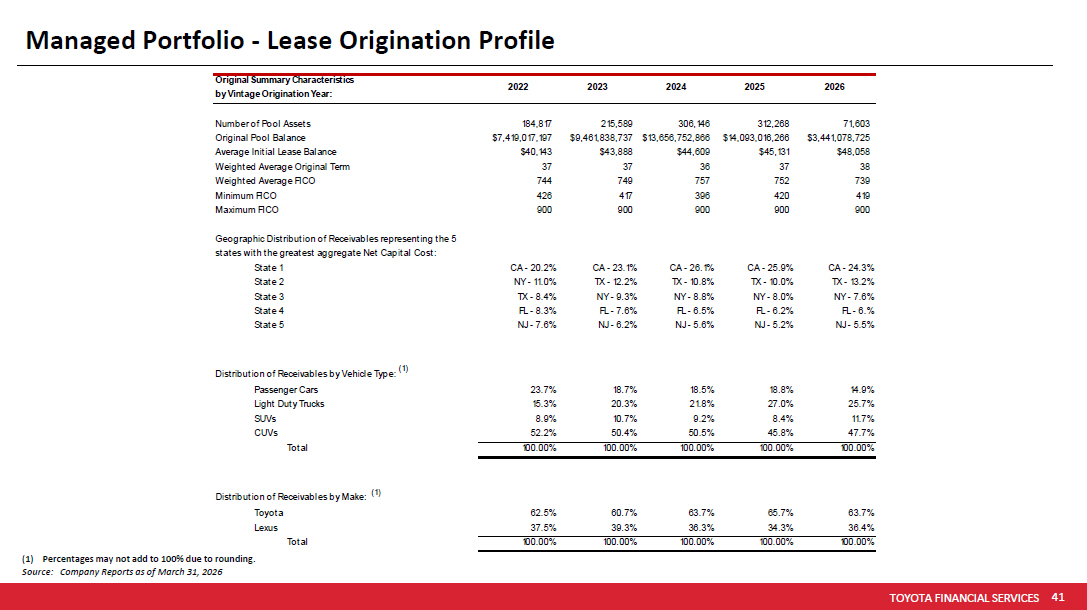
TOYOTA FINANCIAL SERVICES 41 •• PROTECTED 関係者外秘 Managed Portfolio - Lease Origination Profile (1) Percentages may not add to 100% due to rounding. Source: Company Reports as of March 31, 2026 Original Summary Characteristics by Vintage Origination Year: 2022 2023 2024 2025 2026 Number of Pool Assets 184,817 215,589 306,146 312,268 71,603 Original Pool Balance $7,419,017,197 $9,461,838,737 $13,656,752,866 $14,093,016,266 $3,441,078,725 Average Initial Lease Balance $40,143 $43,888 $44,609 $45,131 $48,058 Weighted Average Original Term 37 37 36 37 38 Weighted Average FICO 744 749 757 752 739 Minimum FICO 426 417 396 420 419 Maximum FICO 900 900 900 900 900 Geographic Distribution of Receivables representing the 5 states with the greatest aggregate Net Capital Cost: State 1 CA - 20.2% CA - 23.1% CA - 26.1% CA - 25.9% CA - 24.3% State 2 NY - 11.0% TX - 12.2% TX - 10.8% TX - 10.0% TX - 13.2% State 3 TX - 8.4% NY - 9.3% NY - 8.8% NY - 8.0% NY - 7.6% State 4 FL - 8.3% FL - 7.6% FL - 6.5% FL - 6.2% FL - 6.% State 5 NJ - 7.6% NJ - 6.2% NJ - 5.6% NJ - 5.2% NJ - 5.5% Distribution of Receivables by Vehicle Type: (1) Passenger Cars 23.7% 18.7% 18.5% 18.8% 14.9% Light Duty Trucks 15.3% 20.3% 21.8% 27.0% 25.7% SUVs 8.9% 10.7% 9.2% 8.4% 11.7% CUVs 52.2% 50.4% 50.5% 45.8% 47.7% Total 100.00% 100.00% 100.00% 100.00% 100.00% Distribution of Receivables by Make: (1) Toyota 62.5% 60.7% 63.7% 65.7% 63.7% Lexus 37.5% 39.3% 36.3% 34.3% 36.4% Total 100.00% 100.00% 100.00% 100.00% 100.00%
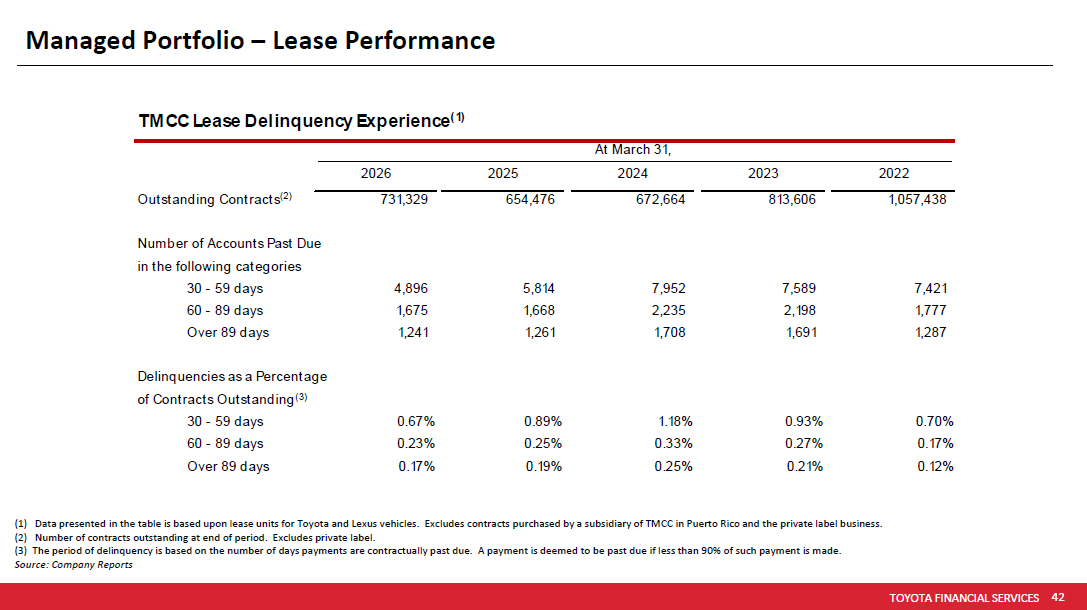
TOYOTA FINANCIAL SERVICES 42 •• PROTECTED 関係者外秘 Managed Portfolio – Lease Performance (1) Data presented in the table is based upon lease units for Toyota and Lexus vehicles. Excludes contracts purchased by a subsi dia ry of TMCC in Puerto Rico and the private label business. (2) Number of contracts outstanding at end of period. Excludes private label. (3) The period of delinquency is based on the number of days payments are contractually past due. A payment is deemed to be pa st due if less than 90% of such payment is made. Source: Company Reports 2026 2025 2024 2023 2022 Outstanding Contracts (2) 731,329 654,476 672,664 813,606 1,057,438 Number of Accounts Past Due in the following categories 30 - 59 days 4,896 5,814 7,952 7,589 7,421 60 - 89 days 1,675 1,668 2,235 2,198 1,777 Over 89 days 1,241 1,261 1,708 1,691 1,287 Delinquencies as a Percentage of Contracts Outstanding (3) 30 - 59 days 0.67% 0.89% 1.18% 0.93% 0.70% 60 - 89 days 0.23% 0.25% 0.33% 0.27% 0.17% Over 89 days 0.17% 0.19% 0.25% 0.21% 0.12% TMCC Lease Delinquency Experience (1) At March 31,
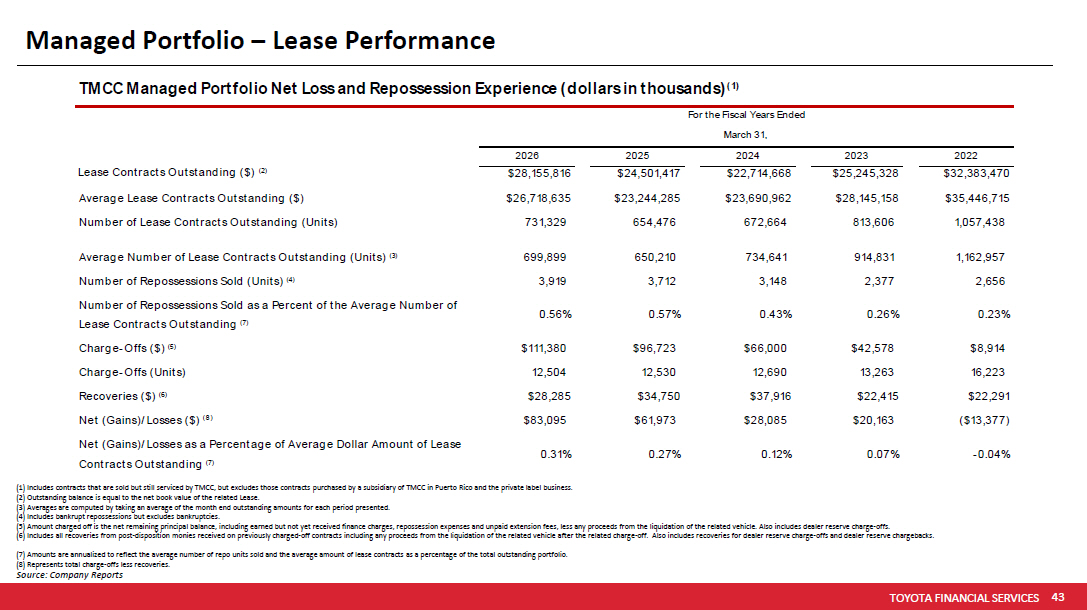
TOYOTA FINANCIAL SERVICES 43 •• PROTECTED 関係者外秘 Managed Portfolio – Lease Performance (1) Includes contracts that are sold but still serviced by TMCC, but excludes those contracts purchased by a subsidiary of TM CC in Puerto Rico and the private label business. (2) Outstanding balance is equal to the net book value of the related Lease. (3) Averages are computed by taking an average of the month end outstanding amounts for each period presented. (4) Includes bankrupt repossessions but excludes bankruptcies. (5) Amount charged off is the net remaining principal balance, including earned but not yet received finance charges, reposse ssi on expenses and unpaid extension fees, less any proceeds from the liquidation of the related vehicle. Also includes dealer re ser ve charge - offs. (6) Includes all recoveries from post - disposition monies received on previously charged - off contracts including any proceeds fro m the liquidation of the related vehicle after the related charge - off. Also includes recoveries for dealer reserve charge - offs and dealer reserve chargebacks. (7) Amounts are annualized to reflect the average number of repo units sold and the average amount of lease contracts as a pe rce ntage of the total outstanding portfolio. (8) Represents total charge - offs less recoveries. Source : Company Reports 2026 2025 2024 2023 2022 Lease Contracts Outstanding ($) (2) $28,155,816 $24,501,417 $22,714,668 $25,245,328 $32,383,470 Average Lease Contracts Outstanding ($) $26,718,635 $23,244,285 $23,690,962 $28,145,158 $35,446,715 Number of Lease Contracts Outstanding (Units) 731,329 654,476 672,664 813,606 1,057,438 Average Number of Lease Contracts Outstanding (Units) (3) 699,899 650,210 734,641 914,831 1,162,957 Number of Repossessions Sold (Units) (4) 3,919 3,712 3,148 2,377 2,656 Number of Repossessions Sold as a Percent of the Average Number of Lease Contracts Outstanding (7) 0.56% 0.57% 0.43% 0.26% 0.23% Charge-Offs ($) (5) $111,380 $96,723 $66,000 $42,578 $8,914 Charge-Offs (Units) 12,504 12,530 12,690 13,263 16,223 Recoveries ($) (6) $28,285 $34,750 $37,916 $22,415 $22,291 Net (Gains)/Losses ($) (8) $83,095 $61,973 $28,085 $20,163 ($13,377) Net (Gains)/Losses as a Percentage of Average Dollar Amount of Lease Contracts Outstanding (7) 0.31% 0.27% 0.12% 0.07% -0.04% TMCC Managed Portfolio Net Loss and Repossession Experience (dollars in thousands) (1) For the Fiscal Years Ended March 31,
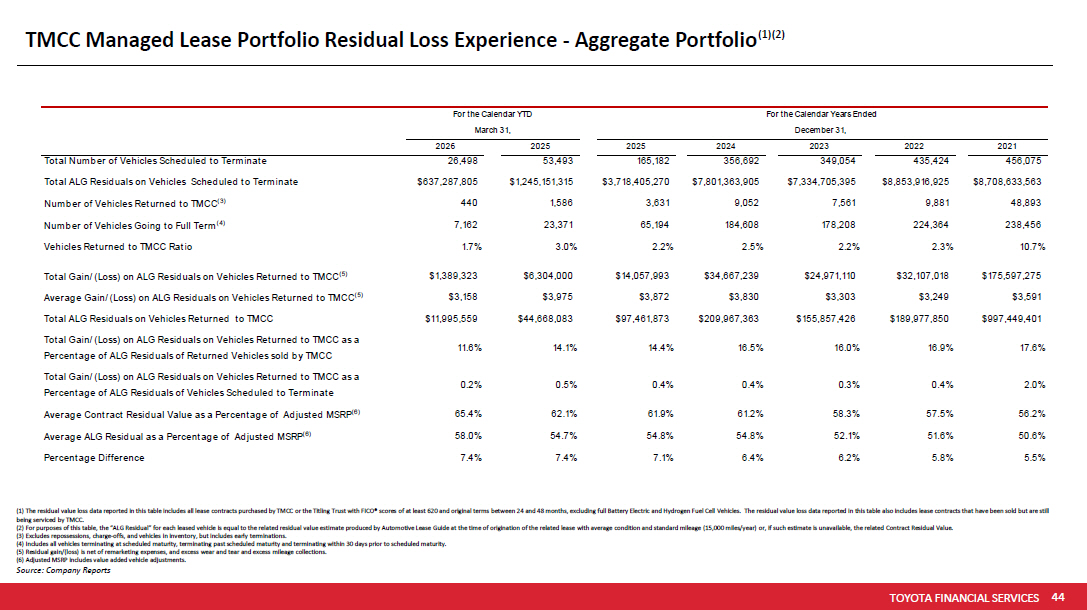
TOYOTA FINANCIAL SERVICES 44 •• PROTECTED 関係者外秘 TMCC Managed Lease Portfolio Residual Loss Experience - Aggregate Portfolio (1)(2) (1) The residual value loss data reported in this table includes all lease contracts purchased by TMCC or the Titling Trust w ith FICO® scores of at least 620 and original terms between 24 and 48 months, excluding full Battery Electric and Hydrogen Fuel C el l Vehicles. The residual value loss data reported in this table also includes lease contracts that have been sold but are st ill being serviced by TMCC. (2) For purposes of this table, the “ALG Residual” for each leased vehicle is equal to the related residual value estimate pr odu ced by Automotive Lease Guide at the time of origination of the related lease with average condition and standard mileage (15 ,00 0 miles/year) or, if such estimate is unavailable, the related Contract Residual Value. (3) Excludes repossessions, charge - offs, and vehicles in inventory, but includes early terminations. (4) Includes all vehicles terminating at scheduled maturity, terminating past scheduled maturity and terminating within 30 da ys prior to scheduled maturity. (5) Residual gain/(loss) is net of remarketing expenses, and excess wear and tear and excess mileage collections. (6) Adjusted MSRP includes value added vehicle adjustments. Source : Company Reports 2026 2025 2025 2024 2023 2022 2021 Total Number of Vehicles Scheduled to Terminate 26,498 53,493 165,182 356,692 349,054 435,424 456,075 Total ALG Residuals on Vehicles Scheduled to Terminate $637,287,805 $1,245,151,315 $3,718,405,270 $7,801,363,905 $7,334,705,395 $8,853,916,925 $8,708,633,563 Number of Vehicles Returned to TMCC (3) 440 1,586 3,631 9,052 7,561 9,881 48,893 Number of Vehicles Going to Full Term (4) 7,162 23,371 65,194 184,608 178,208 224,364 238,456 Vehicles Returned to TMCC Ratio 1.7% 3.0% 2.2% 2.5% 2.2% 2.3% 10.7% Total Gain/(Loss) on ALG Residuals on Vehicles Returned to TMCC (5) $1,389,323 $6,304,000 $14,057,993 $34,667,239 $24,971,110 $32,107,018 $175,597,275 Average Gain/(Loss) on ALG Residuals on Vehicles Returned to TMCC (5) $3,158 $3,975 $3,872 $3,830 $3,303 $3,249 $3,591 Total ALG Residuals on Vehicles Returned to TMCC $11,995,559 $44,668,083 $97,461,873 $209,967,363 $155,857,426 $189,977,850 $997,449,401 Total Gain/(Loss) on ALG Residuals on Vehicles Returned to TMCC as a Percentage of ALG Residuals of Returned Vehicles sold by TMCC 11.6% 14.1% 14.4% 16.5% 16.0% 16.9% 17.6% Total Gain/(Loss) on ALG Residuals on Vehicles Returned to TMCC as a Percentage of ALG Residuals of Vehicles Scheduled to Terminate 0.2% 0.5% 0.4% 0.4% 0.3% 0.4% 2.0% Average Contract Residual Value as a Percentage of Adjusted MSRP (6) 65.4% 62.1% 61.9% 61.2% 58.3% 57.5% 56.2% Average ALG Residual as a Percentage of Adjusted MSRP (6) 58.0% 54.7% 54.8% 54.8% 52.1% 51.6% 50.6% Percentage Difference 7.4% 7.4% 7.1% 6.4% 6.2% 5.8% 5.5% For the Calendar YTD For the Calendar Years Ended March 31, December 31,
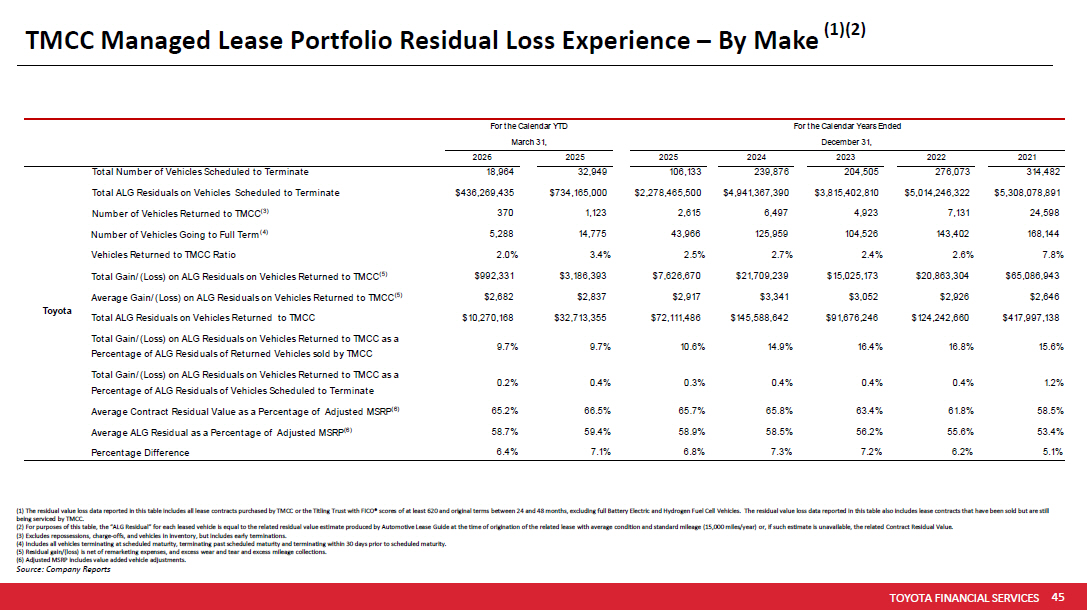
TOYOTA FINANCIAL SERVICES 45 •• PROTECTED 関係者外秘 TMCC Managed Lease Portfolio Residual Loss Experience – By Make (1)(2) (1) The residual value loss data reported in this table includes all lease contracts purchased by TMCC or the Titling Trust w ith FICO® scores of at least 620 and original terms between 24 and 48 months, excluding full Battery Electric and Hydrogen Fuel C el l Vehicles. The residual value loss data reported in this table also includes lease contracts that have been sold but are st ill being serviced by TMCC. (2) For purposes of this table, the “ALG Residual” for each leased vehicle is equal to the related residual value estimate pr odu ced by Automotive Lease Guide at the time of origination of the related lease with average condition and standard mileage (15 ,00 0 miles/year) or, if such estimate is unavailable, the related Contract Residual Value. (3) Excludes repossessions, charge - offs, and vehicles in inventory, but includes early terminations. (4) Includes all vehicles terminating at scheduled maturity, terminating past scheduled maturity and terminating within 30 da ys prior to scheduled maturity. (5) Residual gain/(loss) is net of remarketing expenses, and excess wear and tear and excess mileage collections. (6) Adjusted MSRP includes value added vehicle adjustments. Source : Company Reports 2026 2025 2025 2024 2023 2022 2021 Total Number of Vehicles Scheduled to Terminate 18,964 32,949 106,133 239,876 204,505 276,073 314,482 Total ALG Residuals on Vehicles Scheduled to Terminate $436,269,435 $734,165,000 $2,278,465,500 $4,941,367,390 $3,815,402,810 $5,014,246,322 $5,308,078,891 Number of Vehicles Returned to TMCC (3) 370 1,123 2,615 6,497 4,923 7,131 24,598 Number of Vehicles Going to Full Term (4) 5,288 14,775 43,966 125,959 104,526 143,402 168,144 Vehicles Returned to TMCC Ratio 2.0% 3.4% 2.5% 2.7% 2.4% 2.6% 7.8% Total Gain/(Loss) on ALG Residuals on Vehicles Returned to TMCC (5) $992,331 $3,186,393 $7,626,670 $21,709,239 $15,025,173 $20,863,304 $65,086,943 Average Gain/(Loss) on ALG Residuals on Vehicles Returned to TMCC (5) $2,682 $2,837 $2,917 $3,341 $3,052 $2,926 $2,646 Total ALG Residuals on Vehicles Returned to TMCC $10,270,168 $32,713,355 $72,111,486 $145,588,642 $91,676,246 $124,242,660 $417,997,138 Total Gain/(Loss) on ALG Residuals on Vehicles Returned to TMCC as a Percentage of ALG Residuals of Returned Vehicles sold by TMCC 9.7% 9.7% 10.6% 14.9% 16.4% 16.8% 15.6% Total Gain/(Loss) on ALG Residuals on Vehicles Returned to TMCC as a Percentage of ALG Residuals of Vehicles Scheduled to Terminate 0.2% 0.4% 0.3% 0.4% 0.4% 0.4% 1.2% Average Contract Residual Value as a Percentage of Adjusted MSRP (6) 65.2% 66.5% 65.7% 65.8% 63.4% 61.8% 58.5% Average ALG Residual as a Percentage of Adjusted MSRP (6) 58.7% 59.4% 58.9% 58.5% 56.2% 55.6% 53.4% Percentage Difference 6.4% 7.1% 6.8% 7.3% 7.2% 6.2% 5.1% Toyota For the Calendar YTD For the Calendar Years Ended March 31, December 31,
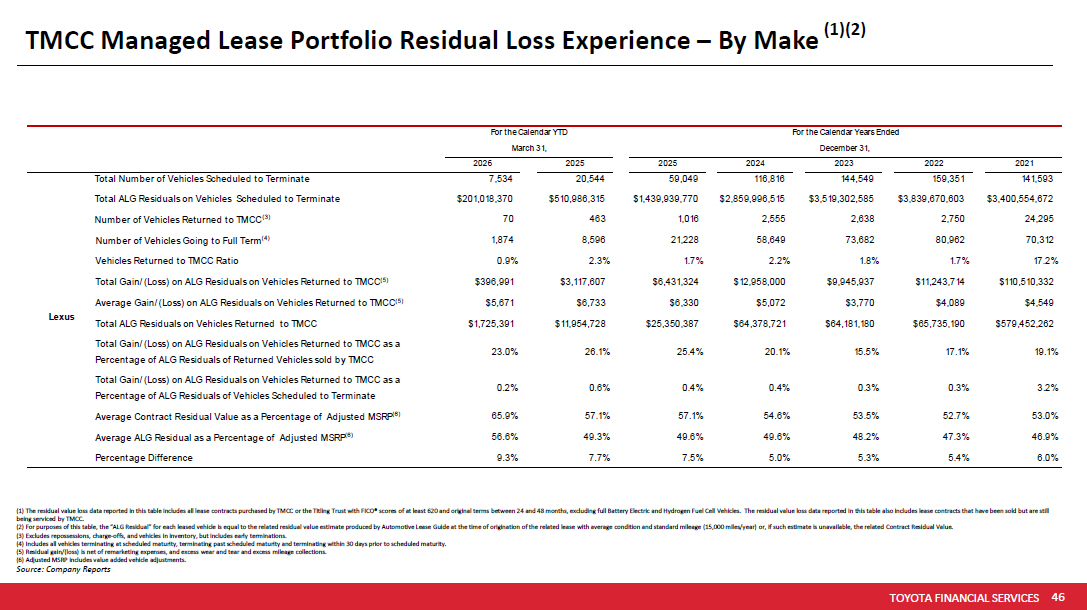
TOYOTA FINANCIAL SERVICES 46 •• PROTECTED 関係者外秘 TMCC Managed Lease Portfolio Residual Loss Experience – By Make (1)(2) (1) The residual value loss data reported in this table includes all lease contracts purchased by TMCC or the Titling Trust w ith FICO® scores of at least 620 and original terms between 24 and 48 months, excluding full Battery Electric and Hydrogen Fuel C el l Vehicles. The residual value loss data reported in this table also includes lease contracts that have been sold but are st ill being serviced by TMCC. (2) For purposes of this table, the “ALG Residual” for each leased vehicle is equal to the related residual value estimate pr odu ced by Automotive Lease Guide at the time of origination of the related lease with average condition and standard mileage (15 ,00 0 miles/year) or, if such estimate is unavailable, the related Contract Residual Value. (3) Excludes repossessions, charge - offs, and vehicles in inventory, but includes early terminations. (4) Includes all vehicles terminating at scheduled maturity, terminating past scheduled maturity and terminating within 30 da ys prior to scheduled maturity. (5) Residual gain/(loss) is net of remarketing expenses, and excess wear and tear and excess mileage collections. (6) Adjusted MSRP includes value added vehicle adjustments. Source : Company Reports 2026 2025 2025 2024 2023 2022 2021 Total Number of Vehicles Scheduled to Terminate 7,534 20,544 59,049 116,816 144,549 159,351 141,593 Total ALG Residuals on Vehicles Scheduled to Terminate $201,018,370 $510,986,315 $1,439,939,770 $2,859,996,515 $3,519,302,585 $3,839,670,603 $3,400,554,672 Number of Vehicles Returned to TMCC (3) 70 463 1,016 2,555 2,638 2,750 24,295 Number of Vehicles Going to Full Term (4) 1,874 8,596 21,228 58,649 73,682 80,962 70,312 Vehicles Returned to TMCC Ratio 0.9% 2.3% 1.7% 2.2% 1.8% 1.7% 17.2% Total Gain/(Loss) on ALG Residuals on Vehicles Returned to TMCC (5) $396,991 $3,117,607 $6,431,324 $12,958,000 $9,945,937 $11,243,714 $110,510,332 Average Gain/(Loss) on ALG Residuals on Vehicles Returned to TMCC (5) $5,671 $6,733 $6,330 $5,072 $3,770 $4,089 $4,549 Total ALG Residuals on Vehicles Returned to TMCC $1,725,391 $11,954,728 $25,350,387 $64,378,721 $64,181,180 $65,735,190 $579,452,262 Total Gain/(Loss) on ALG Residuals on Vehicles Returned to TMCC as a Percentage of ALG Residuals of Returned Vehicles sold by TMCC 23.0% 26.1% 25.4% 20.1% 15.5% 17.1% 19.1% Total Gain/(Loss) on ALG Residuals on Vehicles Returned to TMCC as a Percentage of ALG Residuals of Vehicles Scheduled to Terminate 0.2% 0.6% 0.4% 0.4% 0.3% 0.3% 3.2% Average Contract Residual Value as a Percentage of Adjusted MSRP (6) 65.9% 57.1% 57.1% 54.6% 53.5% 52.7% 53.0% Average ALG Residual as a Percentage of Adjusted MSRP (6) 56.6% 49.3% 49.6% 49.6% 48.2% 47.3% 46.9% Percentage Difference 9.3% 7.7% 7.5% 5.0% 5.3% 5.4% 6.0% Lexus For the Calendar YTD For the Calendar Years Ended March 31, December 31,
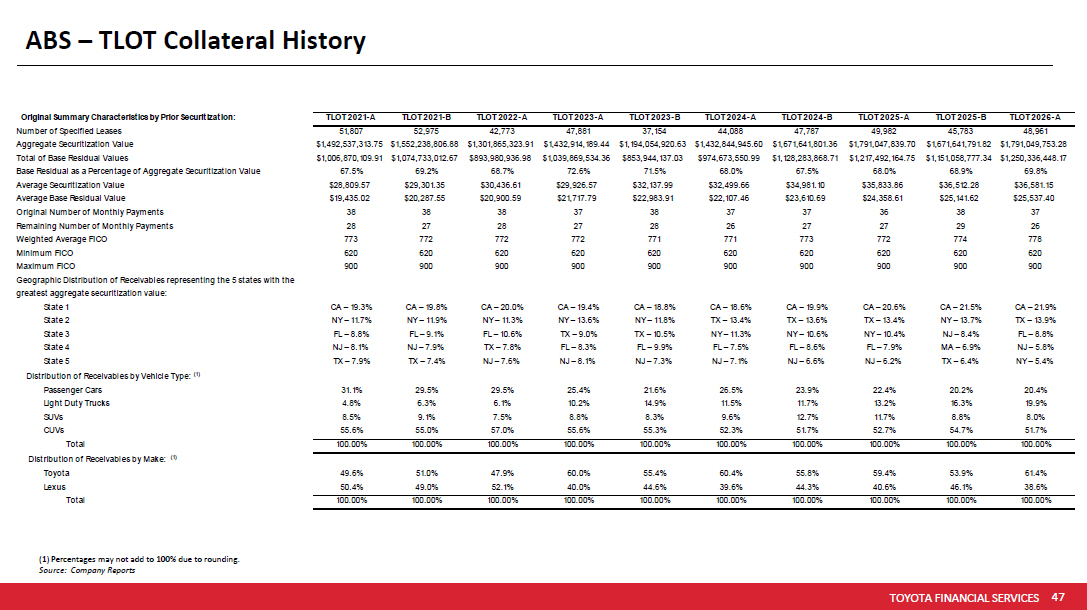
TOYOTA FINANCIAL SERVICES 47 •• PROTECTED 関係者外秘 (1) Percentages may not add to 100% due to rounding. Source : Company Reports ABS – TLOT Collateral History Original Summary Characteristics by Prior Securitization: TLOT 2021-A TLOT 2021-B TLOT 2022-A TLOT 2023-A TLOT 2023-B TLOT 2024-A TLOT 2024-B TLOT 2025-A TLOT 2025-B TLOT 2026-A Number of Specified Leases 51,807 52,975 42,773 47,881 37,154 44,088 47,787 49,982 45,783 48,961 Aggregate Securitization Value $1,492,537,313.75 $1,552,238,806.88 $1,301,865,323.91 $1,432,914,189.44 $1,194,054,920.63 $1,432,844,945.60 $1,671,641,801.36 $1,791,047,839.70 $1,671,641,791.82 $1,791,049,753.28 Total of Base Residual Values $1,006,870,109.91 $1,074,733,012.67 $893,980,936.98 $1,039,869,534.36 $853,944,137.03 $974,673,550.99 $1,128,283,868.71 $1,217,492,164.75 $1,151,058,777.34 $1,250,336,448.17 Base Residual as a Percentage of Aggregate Securitization Value 67.5% 69.2% 68.7% 72.6% 71.5% 68.0% 67.5% 68.0% 68.9% 69.8% Average Securitization Value $28,809.57 $29,301.35 $30,436.61 $29,926.57 $32,137.99 $32,499.66 $34,981.10 $35,833.86 $36,512.28 $36,581.15 Average Base Residual Value $19,435.02 $20,287.55 $20,900.59 $21,717.79 $22,983.91 $22,107.46 $23,610.69 $24,358.61 $25,141.62 $25,537.40 Original Number of Monthly Payments 38 38 38 37 38 37 37 36 38 37 Remaining Number of Monthly Payments 28 27 28 27 28 26 27 27 29 26 Weighted Average FICO 773 772 772 772 771 771 773 772 774 778 Minimum FICO 620 620 620 620 620 620 620 620 620 620 Maximum FICO 900 900 900 900 900 900 900 900 900 900 Geographic Distribution of Receivables representing the 5 states with the greatest aggregate securitization value: State 1 CA – 19.3% CA – 19.8% CA – 20.0% CA – 19.4% CA – 18.8% CA – 18.6% CA – 19.9% CA – 20.6% CA – 21.5% CA – 21.9% State 2 NY – 11.7% NY – 11.9% NY – 11.3% NY – 13.6% NY – 11.8% TX – 13.4% TX – 13.6% TX – 13.4% NY – 13.7% TX – 13.9% State 3 FL – 8.8% FL – 9.1% FL – 10.6% TX – 9.0% TX – 10.5% NY – 11.3% NY – 10.6% NY – 10.4% NJ – 8.4% FL – 8.8% State 4 NJ – 8.1% NJ – 7.9% TX – 7.8% FL – 8.3% FL – 9.9% FL – 7.5% FL – 8.6% FL – 7.9% MA – 6.9% NJ – 5.8% State 5 TX – 7.9% TX – 7.4% NJ – 7.6% NJ – 8.1% NJ – 7.3% NJ – 7.1% NJ – 6.6% NJ – 6.2% TX – 6.4% NY – 5.4% Distribution of Receivables by Vehicle Type: (1) Passenger Cars 31.1% 29.5% 29.5% 25.4% 21.6% 26.5% 23.9% 22.4% 20.2% 20.4% Light Duty Trucks 4.8% 6.3% 6.1% 10.2% 14.9% 11.5% 11.7% 13.2% 16.3% 19.9% SUVs 8.5% 9.1% 7.5% 8.8% 8.3% 9.6% 12.7% 11.7% 8.8% 8.0% CUVs 55.6% 55.0% 57.0% 55.6% 55.3% 52.3% 51.7% 52.7% 54.7% 51.7% Total 100.00% 100.00% 100.00% 100.00% 100.00% 100.00% 100.00% 100.00% 100.00% 100.00% Distribution of Receivables by Make: (1) Toyota 49.6% 51.0% 47.9% 60.0% 55.4% 60.4% 55.8% 59.4% 53.9% 61.4% Lexus 50.4% 49.0% 52.1% 40.0% 44.6% 39.6% 44.3% 40.6% 46.1% 38.6% Total 100.00% 100.00% 100.00% 100.00% 100.00% 100.00% 100.00% 100.00% 100.00% 100.00%