Pay vs Performance Disclosure - USD ($)
|
2 Months Ended |
10 Months Ended |
12 Months Ended |
Jan. 31, 2026 |
Dec. 04, 2025 |
Jan. 31, 2026 |
Jan. 31, 2025 |
Jan. 31, 2024 |
Jan. 31, 2023 |
Jan. 31, 2022 |
| Pay vs Performance Disclosure |
|
|
|
|
|
|
|
| Pay vs Performance Disclosure, Table |
|
|
| | | | | | | | | | | | | | | | | | | | | | | | | | | | | | | | | | | | | | | | | | | | | | | | Value of Initial Fixed $100 Investment Based on: | | | Fiscal Year(1) | Summary Compensation Table Total for First PEO | Compensation Actually Paid to First PEO(2) | Summary Compensation Table Total for Second PEO | Compensation Actually Paid to Second PEO(2) | Summary Compensation Table Total for Third PEO | Compensation Actually Paid to Third PEO(2) | Average Summary Compensation Table Total for Non-PEO NEOs(3) | Average Compensation Actually Paid to Non-PEO NEOs(3) | Company Total Shareholder Return(4) | Peer Group Total Shareholder Return(5) | Net Loss (millions) | Company Selected Measure: Billings (millions) (6) | | 2026 | $9,576,002 | $3,395,486 | $— | $— | $2,194,039 | $1,729,820 | $3,158,961 | $3,119,412 | $9.26 | $256.43 | $(59.3) | $318.7 | | 2025 | $2,689,747 | $704,372 | $— | $— | $— | $— | $1,328,486 | $917,712 | $13.36 | $204.12 | $(81.9) | $310.1 | | 2024 | $13,847,800 | $10,798,300 | $827,312 | $(1,174,372) | $— | $— | $2,509,411 | $1,716,485 | $17.15 | $159.97 | $(75.6) | $321.1 | | 2023 | $95,002 | $(18,141,098) | $7,815,728 | $462,588 | $— | $— | $3,886,205 | $(765,462) | $24.47 | $106.58 | $(105.6) | $323.8 | | 2022 | $8,007,285 | $1,363,710 | $— | $— | $— | $— | $4,116,694 | $2,607,066 | $74.08 | $126.43 | $(102.1) | $296.5 |
|
|
|
|
|
| Company Selected Measure Name |
|
|
billings
|
|
|
|
|
| Named Executive Officers, Footnote |
|
|
For fiscal 2026, Joshua G. James served as our principal executive officer (“PEO”) from the beginning of the fiscal year to December 4, 2025 when Daren Thayne was appointed as interim PEO (designated Third PEO) for the remainder of the fiscal year. Our non-PEO named executive officers (“NEOs”) for fiscal 2026 were Tod Crane and Mark Maughan. For fiscal 2025, Joshua G. James served as our PEO and our Non-PEO NEOs were Tod Crane, David Jolley, and Daren Thayne. For fiscal 2024, Joshua G. James served as our first PEO, John Mellor served as our second PEO and our Non-PEO NEOs were Bruce Felt, David Jolley, and Daren Thayne. For fiscal 2023, Joshua G. James served as our first PEO, John Mellor served as our second PEO and our Non-PEO NEOs were Bruce Felt, Catherine Wong, and Daren Thayne. For fiscal 2022, Joshua G. James served as our PEO and our Non-PEO NEOs were Bruce Felt and Catherine Wong.
|
|
|
|
|
| Peer Group Issuers, Footnote |
|
|
The peer group used is the S&P 500 Information Technology Index, as used in the performance graph shown in our annual report pursuant to Item 201(e) of Regulation S-K. Total shareholder return is calculated by assuming that a $100 investment was made at the close of trading on January 31, 2021 and reinvesting all dividends until the last day of each reported fiscal year. Total shareholder returns for fiscal years 2022, 2023, 2024, 2025 and 2026 have been updated to reflect our fiscal year end instead of the calendar year end previously used.
|
|
|
|
|
| Adjustment To PEO Compensation, Footnote |
|
|
The following table presents a reconciliation of total compensation paid to our PEOs for the fiscal years shown in the Summary Compensation Table, further above, to the compensation actually paid to our PEOs, calculated in accordance with Item 402(v) of Regulation S-K, as reported in the Pay Versus Performance table to which this footnote relates: | | | | | | | | | | | | | | | | | | | | | | | | | | | | First PEO | Second PEO | Third PEO | | 2022 | 2023 | 2024 | 2025 | 2026 | 2023 | 2024 | 2026 | Summary Compensation Table Total(a) | $8,007,285 | $95,002 | $13,847,800 | $2,689,747 | $9,576,002 | $7,815,728 | $827,312 | $2,194,039 | Subtract Grant Date Fair Value of Option Awards and Stock Awards Granted in Fiscal Year(b) | $(7,478,400) | $— | $(13,376,000) | $(2,171,730) | $(8,357,004) | $(7,359,007) | $— | $(1,135,598) | Add Fair Value at Fiscal Year-End of Outstanding and Unvested Option Awards and Stock Awards Granted in Fiscal Year(c) | $5,635,200 | $— | $10,326,500 | $2,117,500 | $1,758,515 | $2,952,747 | $— | $410,900 | Add Change in Fair Value of Outstanding and Unvested Option Awards and Stock Awards Granted in Prior Fiscal Years(c) | $(5,545,125) | $— | $— | $(1,282,500) | $(1,178,125) | $(2,162,188) | $(458,884) | $(279,500) | Adjust for Fair Value at Vesting of Option Awards and Stock Awards Granted in Fiscal Year That Vested During Fiscal Year(c) | $— | $— | $— | $341,730 | $360,004 | $466,764 | $— | $233,998 | Adjust for Change in Fair Value as of Vesting Date of Option Awards and Stock Awards Granted in Prior Fiscal Years For Which Applicable Vesting Conditions Were Satisfied During Fiscal Year(c) | $744,750 | $78,300 | $— | $(990,375) | $1,236,094 | $(1,251,456) | $(401,139) | $305,981 | Subtract Fair Value as of Prior Fiscal Year-End of Option Awards and Stock Awards Granted in Prior Fiscal Years That Failed to Meet Applicable Vesting Conditions During Fiscal Year(c) | $— | $(18,314,400) | $— | $— | $— | $— | $(1,141,661) | $— | Add Value of Dividends or other Earnings Paid on Stock or Option Awards not Otherwise Reflected in Fair Value or Total Compensation | $— | $— | $— | $— | $— | $— | $— | $— | | Compensation Actually Paid | $1,363,710 | $(18,141,098) | $10,798,300 | $704,372 | $3,395,486 | $462,588 | $(1,174,372) | $1,729,820 |
(a) We have not reported any amounts in our Summary Compensation Table with respect to “Change in Pension and Nonqualified Deferred Compensation” and, accordingly, the adjustments with respect to such items prescribed by the pay-versus-performance rules are not relevant to our analysis and no adjustments have been made. (b) The amounts reflect the aggregate grant date fair value reported in the “Stock Awards” columns in the Summary Compensation Table for the applicable year. (c) In accordance with Item 402(v) requirements, the fair values of unvested and outstanding equity awards to our PEOs and NEOs were remeasured as of the end of each fiscal year, and as of each vesting date, during the years displayed in the table above. We approached the determination of fair value in the same way as we historically have determined fair value and fair values as of each measurement date were determined using valuation assumptions and methodologies (including expected term, volatility, dividend yield, and risk-free interest rates) that are generally consistent with those used to estimate fair value at grant under US GAAP. For a discussion of valuation assumptions used in the calculation of such amounts, see the notes to our financial statements included in our annual report on Form 10-K for the fiscal year ended January 31, 2026.
|
|
|
|
|
| Non-PEO NEO Average Total Compensation Amount |
|
|
$ 3,158,961
|
$ 1,328,486
|
$ 2,509,411
|
$ 3,886,205
|
$ 4,116,694
|
| Non-PEO NEO Average Compensation Actually Paid Amount |
|
|
$ 3,119,412
|
917,712
|
1,716,485
|
(765,462)
|
2,607,066
|
| Adjustment to Non-PEO NEO Compensation Footnote |
|
|
The following table presents a reconciliation of average total compensation paid to our Non-PEO NEOs for the fiscal years shown in the Summary Compensation Table, further above, to the average compensation actually paid to our Non-PEO NEOs, calculated in accordance with Item 402(v) of Regulation S-K, as reported in the Pay Versus Performance table to which this footnote relates: | | | | | | | | | | | | | | | | | | | | | | | | | | | | | | | | | | | 2022 | | 2023 | | 2024 | | 2025 | | 2026 | Summary Compensation Table Total(a) | | $4,116,694 | | $3,886,205 | | $2,509,411 | | $1,328,486 | | $3,158,961 | Subtract Grant Date Fair Value of Option Awards and Stock Awards Granted in Fiscal Year(b) | | $(3,116,000) | | $(3,275,630) | | $(2,059,308) | | $(930,274) | | $(1,365,560) | Add Fair Value at Fiscal Year-End of Outstanding and Unvested Option Awards and Stock Awards Granted in Fiscal Year(c) | | $2,348,000 | | $1,226,009 | | $1,539,917 | | $741,125 | | $924,525 | Add Change in Fair Value of Outstanding and Unvested Option Awards and Stock Awards Granted in Prior Fiscal Years(c) | | $(970,398) | | $(2,296,511) | | $(189,468) | | $(208,326) | | $(114,767) | Adjust for Fair Value at Vesting of Option Awards and Stock Awards Granted in Fiscal Year That Vested During Fiscal Year(c) | | $— | | $574,825 | | $83,367 | | $188,632 | | $298,760 | Adjust for Change in Fair Value as of Vesting Date of Option Awards and Stock Awards Granted in Prior Fiscal Years For Which Applicable Vesting Conditions Were Satisfied During Fiscal Year(c) | | $228,770 | | $(880,360) | | $(167,434) | | $(201,931) | | $217,493 | Subtract Fair Value as of Prior Fiscal Year-End of Option Awards and Stock Awards Granted in Prior Fiscal Years That Failed to Meet Applicable Vesting Conditions During Fiscal Year(c) | | $— | | $— | | $— | | $— | | $— | Add Value of Dividends or other Earnings Paid on Stock or Option Awards not Otherwise Reflected in Fair Value or Total Compensation | | $— | | $— | | $— | | $— | | $— | | Compensation Actually Paid | | $2,607,066 | | $(765,462) | | $1,716,485 | | $917,712 | | $3,119,412 |
(a) We have not reported any amounts in our Summary Compensation Table with respect to “Change in Pension and Nonqualified Deferred Compensation” and, accordingly, the adjustments with respect to such items prescribed by the pay-versus-performance rules are not relevant to our analysis and no adjustments have been made. (b) The amounts reflect the aggregate grant date fair value reported in the “Stock Awards” columns in the Summary Compensation Table for the applicable year. (c) In accordance with Item 402(v) requirements, the fair values of unvested and outstanding equity awards to our PEOs and NEOs were remeasured as of the end of each fiscal year, and as of each vesting date, during the years displayed in the table above. We approached the determination of fair value in the same way as we historically have determined fair value and fair values as of each measurement date were determined using valuation assumptions and methodologies (including expected term, volatility, dividend yield, and risk-free interest rates) that are generally consistent with those used to estimate fair value at grant under US GAAP. For a discussion of valuation assumptions used in the calculation of such amounts, see the notes to our financial statements included in our annual report on Form 10-K for the fiscal year ended January 31, 2026.
|
|
|
|
|
| Compensation Actually Paid vs. Total Shareholder Return |
|
|
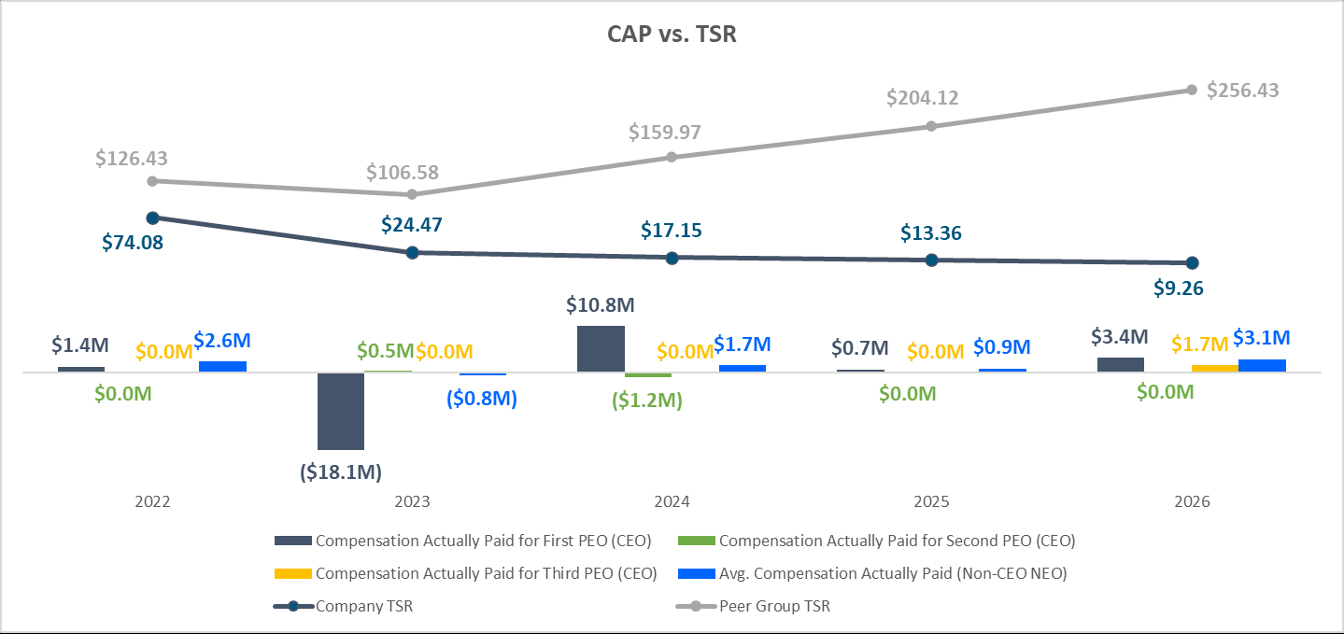
The following graphs illustrate the relationship between compensation actually paid (“CAP”) to our PEOs and average compensation actually paid to our Non-PEO NEOs for fiscal years 2026, 2025, 2024, 2023 and 2022 versus (i) our cumulative total shareholder return (“TSR”) and our peer group’s TSR for the years shown, (ii) our net income, and (iii) our billings.
|
|
|
|
|
| Compensation Actually Paid vs. Net Income |
|
|
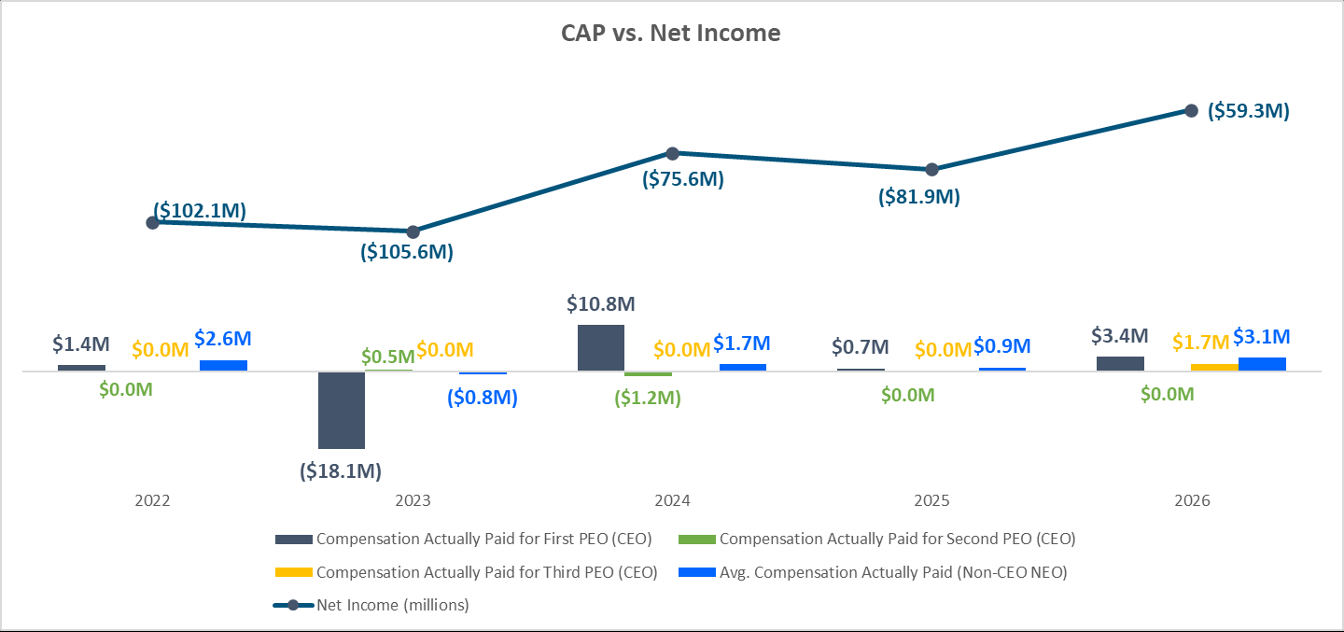
The following graphs illustrate the relationship between compensation actually paid (“CAP”) to our PEOs and average compensation actually paid to our Non-PEO NEOs for fiscal years 2026, 2025, 2024, 2023 and 2022 versus (i) our cumulative total shareholder return (“TSR”) and our peer group’s TSR for the years shown, (ii) our net income, and (iii) our billings.
|
|
|
|
|
| Compensation Actually Paid vs. Company Selected Measure |
|
|
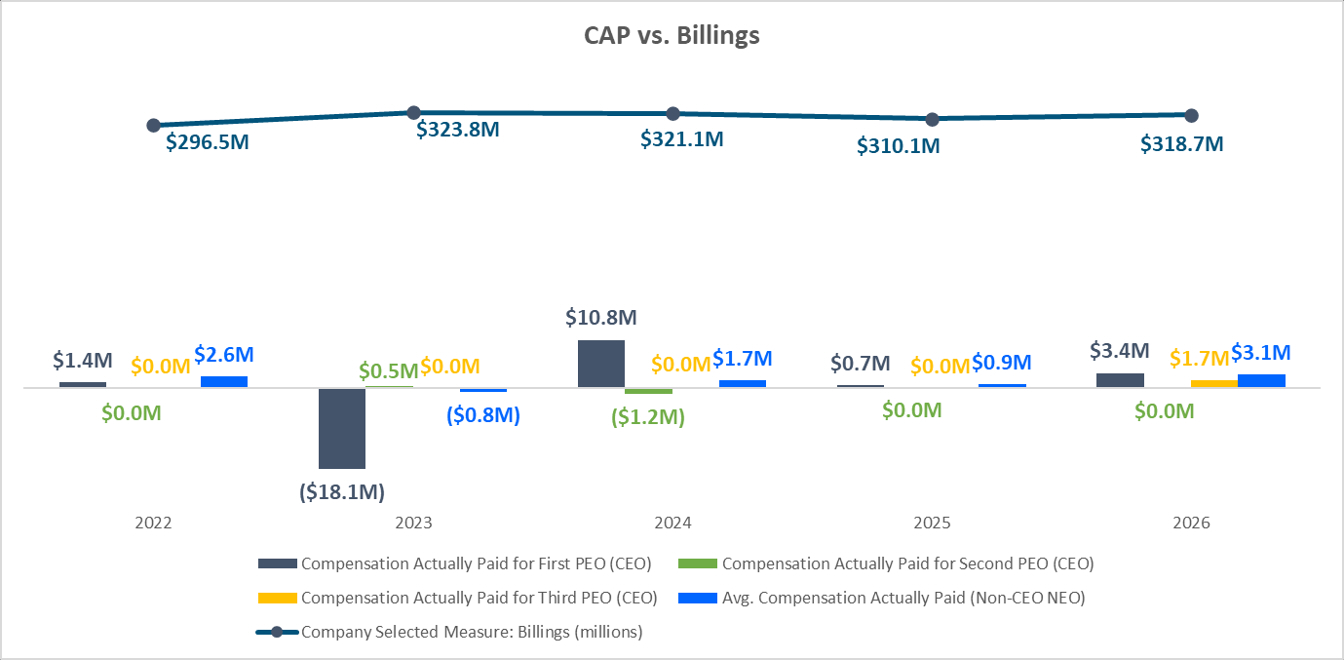
The following graphs illustrate the relationship between compensation actually paid (“CAP”) to our PEOs and average compensation actually paid to our Non-PEO NEOs for fiscal years 2026, 2025, 2024, 2023 and 2022 versus (i) our cumulative total shareholder return (“TSR”) and our peer group’s TSR for the years shown, (ii) our net income, and (iii) our billings.
|
|
|
|
|
| Total Shareholder Return Vs Peer Group |
|
|
The following graphs illustrate the relationship between compensation actually paid (“CAP”) to our PEOs and average compensation actually paid to our Non-PEO NEOs for fiscal years 2026, 2025, 2024, 2023 and 2022 versus (i) our cumulative total shareholder return (“TSR”) and our peer group’s TSR for the years shown, (ii) our net income, and (iii) our billings.
|
|
|
|
|
| Tabular List, Table |
|
|
| | | | Most Important Financial Measures for Fiscal 2026 | | Gross Retention Rate | | Remaining Performance Obligations | | Subscription Annual Contract Value | | Billings | | Adjusted Free Cash Flow (Annual) | | Adjusted Free Cash Flow (Quarterly) | | Subscription Gross Margin | | Strategic Partner Annual Contract Value | | Operating Margin |
|
|
|
|
|
| Total Shareholder Return Amount |
|
|
$ 9.26
|
13.36
|
17.15
|
24.47
|
74.08
|
| Peer Group Total Shareholder Return Amount |
|
|
256.43
|
204.12
|
159.97
|
106.58
|
126.43
|
| Net Income (Loss) |
|
|
$ (59,300,000)
|
$ (81,900,000)
|
$ (75,600,000)
|
$ (105,600,000)
|
$ (102,100,000)
|
| Company Selected Measure Amount |
|
|
318,700,000
|
310,100,000
|
321,100,000
|
323,800,000
|
296,500,000
|
| Additional 402(v) Disclosure |
|
|
Total shareholder return is calculated by assuming that a $100 investment was made at the closing of trading on January 31, 2021, the last trading day prior to the earliest fiscal year shown in the table above, and reinvesting all dividends until the last day of each reported fiscal year. Total shareholder returns for fiscal years 2022, 2023, 2024, 2025 and 2026 have been updated to reflect our fiscal year end instead of the calendar year end previously used.
|
|
|
|
|
| Measure:: 1 |
|
|
|
|
|
|
|
| Pay vs Performance Disclosure |
|
|
|
|
|
|
|
| Name |
|
|
Gross Retention Rate
|
|
|
|
|
| Measure:: 2 |
|
|
|
|
|
|
|
| Pay vs Performance Disclosure |
|
|
|
|
|
|
|
| Name |
|
|
Remaining Performance Obligations
|
|
|
|
|
| Measure:: 3 |
|
|
|
|
|
|
|
| Pay vs Performance Disclosure |
|
|
|
|
|
|
|
| Name |
|
|
Subscription Annual Contract Value
|
|
|
|
|
| Measure:: 4 |
|
|
|
|
|
|
|
| Pay vs Performance Disclosure |
|
|
|
|
|
|
|
| Name |
|
|
Billings
|
|
|
|
|
| Non-GAAP Measure Description |
|
|
In our assessment, billings is the most important financial performance measure that we used in fiscal 2026 to link compensation actually paid to performance. Billings is a non-GAAP financial measure. See Appendix A for a reconciliation of Billings to related GAAP metrics.
|
|
|
|
|
| Measure:: 5 |
|
|
|
|
|
|
|
| Pay vs Performance Disclosure |
|
|
|
|
|
|
|
| Name |
|
|
Adjusted Free Cash Flow (Annual)
|
|
|
|
|
| Measure:: 6 |
|
|
|
|
|
|
|
| Pay vs Performance Disclosure |
|
|
|
|
|
|
|
| Name |
|
|
Adjusted Free Cash Flow (Quarterly)
|
|
|
|
|
| Measure:: 7 |
|
|
|
|
|
|
|
| Pay vs Performance Disclosure |
|
|
|
|
|
|
|
| Name |
|
|
Subscription Gross Margin
|
|
|
|
|
| Measure:: 8 |
|
|
|
|
|
|
|
| Pay vs Performance Disclosure |
|
|
|
|
|
|
|
| Name |
|
|
Strategic Partner Annual Contract Value
|
|
|
|
|
| Measure:: 9 |
|
|
|
|
|
|
|
| Pay vs Performance Disclosure |
|
|
|
|
|
|
|
| Name |
|
|
Operating Margin
|
|
|
|
|
| Joshua G. James [Member] |
|
|
|
|
|
|
|
| Pay vs Performance Disclosure |
|
|
|
|
|
|
|
| PEO Total Compensation Amount |
|
|
$ 9,576,002
|
$ 2,689,747
|
$ 13,847,800
|
$ 95,002
|
$ 8,007,285
|
| PEO Actually Paid Compensation Amount |
|
|
3,395,486
|
$ 704,372
|
$ 10,798,300
|
$ (18,141,098)
|
$ 1,363,710
|
| PEO Name |
|
Joshua G. James
|
|
Joshua G. James
|
Joshua G. James
|
Joshua G. James
|
Joshua G. James
|
| Daren Thayne [Member] |
|
|
|
|
|
|
|
| Pay vs Performance Disclosure |
|
|
|
|
|
|
|
| PEO Total Compensation Amount |
|
|
2,194,039
|
|
|
|
|
| PEO Actually Paid Compensation Amount |
|
|
1,729,820
|
|
|
|
|
| PEO Name |
Daren Thayne
|
|
|
|
|
|
|
| John Mellor [Member] |
|
|
|
|
|
|
|
| Pay vs Performance Disclosure |
|
|
|
|
|
|
|
| PEO Total Compensation Amount |
|
|
|
|
$ 827,312
|
$ 7,815,728
|
|
| PEO Actually Paid Compensation Amount |
|
|
|
|
$ (1,174,372)
|
$ 462,588
|
|
| PEO Name |
|
|
|
|
John Mellor
|
John Mellor
|
|
| PEO | Joshua G. James [Member] | Aggregate Grant Date Fair Value of Equity Award Amounts Reported in Summary Compensation Table |
|
|
|
|
|
|
|
| Pay vs Performance Disclosure |
|
|
|
|
|
|
|
| Adjustment to Compensation, Amount |
|
|
(8,357,004)
|
$ (2,171,730)
|
$ (13,376,000)
|
$ 0
|
$ (7,478,400)
|
| PEO | Joshua G. James [Member] | Year-end Fair Value of Equity Awards Granted in Covered Year that are Outstanding and Unvested |
|
|
|
|
|
|
|
| Pay vs Performance Disclosure |
|
|
|
|
|
|
|
| Adjustment to Compensation, Amount |
|
|
1,758,515
|
2,117,500
|
10,326,500
|
0
|
5,635,200
|
| PEO | Joshua G. James [Member] | Year-over-Year Change in Fair Value of Equity Awards Granted in Prior Years That are Outstanding and Unvested |
|
|
|
|
|
|
|
| Pay vs Performance Disclosure |
|
|
|
|
|
|
|
| Adjustment to Compensation, Amount |
|
|
(1,178,125)
|
(1,282,500)
|
0
|
0
|
(5,545,125)
|
| PEO | Joshua G. James [Member] | Vesting Date Fair Value of Equity Awards Granted and Vested in Covered Year |
|
|
|
|
|
|
|
| Pay vs Performance Disclosure |
|
|
|
|
|
|
|
| Adjustment to Compensation, Amount |
|
|
360,004
|
341,730
|
0
|
0
|
0
|
| PEO | Joshua G. James [Member] | Change in Fair Value as of Vesting Date of Prior Year Equity Awards Vested in Covered Year |
|
|
|
|
|
|
|
| Pay vs Performance Disclosure |
|
|
|
|
|
|
|
| Adjustment to Compensation, Amount |
|
|
1,236,094
|
(990,375)
|
0
|
78,300
|
744,750
|
| PEO | Joshua G. James [Member] | Prior Year End Fair Value of Equity Awards Granted in Any Prior Year that Fail to Meet Applicable Vesting Conditions During Covered Year |
|
|
|
|
|
|
|
| Pay vs Performance Disclosure |
|
|
|
|
|
|
|
| Adjustment to Compensation, Amount |
|
|
0
|
0
|
0
|
(18,314,400)
|
0
|
| PEO | Joshua G. James [Member] | Dividends or Other Earnings Paid on Equity Awards not Otherwise Reflected in Total Compensation for Covered Year |
|
|
|
|
|
|
|
| Pay vs Performance Disclosure |
|
|
|
|
|
|
|
| Adjustment to Compensation, Amount |
|
|
0
|
0
|
0
|
0
|
0
|
| PEO | Daren Thayne [Member] | Aggregate Grant Date Fair Value of Equity Award Amounts Reported in Summary Compensation Table |
|
|
|
|
|
|
|
| Pay vs Performance Disclosure |
|
|
|
|
|
|
|
| Adjustment to Compensation, Amount |
|
|
(1,135,598)
|
|
|
|
|
| PEO | Daren Thayne [Member] | Year-end Fair Value of Equity Awards Granted in Covered Year that are Outstanding and Unvested |
|
|
|
|
|
|
|
| Pay vs Performance Disclosure |
|
|
|
|
|
|
|
| Adjustment to Compensation, Amount |
|
|
410,900
|
|
|
|
|
| PEO | Daren Thayne [Member] | Year-over-Year Change in Fair Value of Equity Awards Granted in Prior Years That are Outstanding and Unvested |
|
|
|
|
|
|
|
| Pay vs Performance Disclosure |
|
|
|
|
|
|
|
| Adjustment to Compensation, Amount |
|
|
(279,500)
|
|
|
|
|
| PEO | Daren Thayne [Member] | Vesting Date Fair Value of Equity Awards Granted and Vested in Covered Year |
|
|
|
|
|
|
|
| Pay vs Performance Disclosure |
|
|
|
|
|
|
|
| Adjustment to Compensation, Amount |
|
|
233,998
|
|
|
|
|
| PEO | Daren Thayne [Member] | Change in Fair Value as of Vesting Date of Prior Year Equity Awards Vested in Covered Year |
|
|
|
|
|
|
|
| Pay vs Performance Disclosure |
|
|
|
|
|
|
|
| Adjustment to Compensation, Amount |
|
|
305,981
|
|
|
|
|
| PEO | Daren Thayne [Member] | Prior Year End Fair Value of Equity Awards Granted in Any Prior Year that Fail to Meet Applicable Vesting Conditions During Covered Year |
|
|
|
|
|
|
|
| Pay vs Performance Disclosure |
|
|
|
|
|
|
|
| Adjustment to Compensation, Amount |
|
|
0
|
|
|
|
|
| PEO | Daren Thayne [Member] | Dividends or Other Earnings Paid on Equity Awards not Otherwise Reflected in Total Compensation for Covered Year |
|
|
|
|
|
|
|
| Pay vs Performance Disclosure |
|
|
|
|
|
|
|
| Adjustment to Compensation, Amount |
|
|
0
|
|
|
|
|
| PEO | John Mellor [Member] | Aggregate Grant Date Fair Value of Equity Award Amounts Reported in Summary Compensation Table |
|
|
|
|
|
|
|
| Pay vs Performance Disclosure |
|
|
|
|
|
|
|
| Adjustment to Compensation, Amount |
|
|
|
|
0
|
(7,359,007)
|
|
| PEO | John Mellor [Member] | Year-end Fair Value of Equity Awards Granted in Covered Year that are Outstanding and Unvested |
|
|
|
|
|
|
|
| Pay vs Performance Disclosure |
|
|
|
|
|
|
|
| Adjustment to Compensation, Amount |
|
|
|
|
0
|
2,952,747
|
|
| PEO | John Mellor [Member] | Year-over-Year Change in Fair Value of Equity Awards Granted in Prior Years That are Outstanding and Unvested |
|
|
|
|
|
|
|
| Pay vs Performance Disclosure |
|
|
|
|
|
|
|
| Adjustment to Compensation, Amount |
|
|
|
|
(458,884)
|
(2,162,188)
|
|
| PEO | John Mellor [Member] | Vesting Date Fair Value of Equity Awards Granted and Vested in Covered Year |
|
|
|
|
|
|
|
| Pay vs Performance Disclosure |
|
|
|
|
|
|
|
| Adjustment to Compensation, Amount |
|
|
|
|
0
|
466,764
|
|
| PEO | John Mellor [Member] | Change in Fair Value as of Vesting Date of Prior Year Equity Awards Vested in Covered Year |
|
|
|
|
|
|
|
| Pay vs Performance Disclosure |
|
|
|
|
|
|
|
| Adjustment to Compensation, Amount |
|
|
|
|
(401,139)
|
(1,251,456)
|
|
| PEO | John Mellor [Member] | Prior Year End Fair Value of Equity Awards Granted in Any Prior Year that Fail to Meet Applicable Vesting Conditions During Covered Year |
|
|
|
|
|
|
|
| Pay vs Performance Disclosure |
|
|
|
|
|
|
|
| Adjustment to Compensation, Amount |
|
|
|
|
(1,141,661)
|
0
|
|
| PEO | John Mellor [Member] | Dividends or Other Earnings Paid on Equity Awards not Otherwise Reflected in Total Compensation for Covered Year |
|
|
|
|
|
|
|
| Pay vs Performance Disclosure |
|
|
|
|
|
|
|
| Adjustment to Compensation, Amount |
|
|
|
|
0
|
0
|
|
| Non-PEO NEO | Aggregate Grant Date Fair Value of Equity Award Amounts Reported in Summary Compensation Table |
|
|
|
|
|
|
|
| Pay vs Performance Disclosure |
|
|
|
|
|
|
|
| Adjustment to Compensation, Amount |
|
|
(1,365,560)
|
(930,274)
|
(2,059,308)
|
(3,275,630)
|
(3,116,000)
|
| Non-PEO NEO | Year-end Fair Value of Equity Awards Granted in Covered Year that are Outstanding and Unvested |
|
|
|
|
|
|
|
| Pay vs Performance Disclosure |
|
|
|
|
|
|
|
| Adjustment to Compensation, Amount |
|
|
924,525
|
741,125
|
1,539,917
|
1,226,009
|
2,348,000
|
| Non-PEO NEO | Year-over-Year Change in Fair Value of Equity Awards Granted in Prior Years That are Outstanding and Unvested |
|
|
|
|
|
|
|
| Pay vs Performance Disclosure |
|
|
|
|
|
|
|
| Adjustment to Compensation, Amount |
|
|
(114,767)
|
(208,326)
|
(189,468)
|
(2,296,511)
|
(970,398)
|
| Non-PEO NEO | Vesting Date Fair Value of Equity Awards Granted and Vested in Covered Year |
|
|
|
|
|
|
|
| Pay vs Performance Disclosure |
|
|
|
|
|
|
|
| Adjustment to Compensation, Amount |
|
|
298,760
|
188,632
|
83,367
|
574,825
|
0
|
| Non-PEO NEO | Change in Fair Value as of Vesting Date of Prior Year Equity Awards Vested in Covered Year |
|
|
|
|
|
|
|
| Pay vs Performance Disclosure |
|
|
|
|
|
|
|
| Adjustment to Compensation, Amount |
|
|
217,493
|
(201,931)
|
(167,434)
|
(880,360)
|
228,770
|
| Non-PEO NEO | Prior Year End Fair Value of Equity Awards Granted in Any Prior Year that Fail to Meet Applicable Vesting Conditions During Covered Year |
|
|
|
|
|
|
|
| Pay vs Performance Disclosure |
|
|
|
|
|
|
|
| Adjustment to Compensation, Amount |
|
|
0
|
0
|
0
|
0
|
0
|
| Non-PEO NEO | Dividends or Other Earnings Paid on Equity Awards not Otherwise Reflected in Total Compensation for Covered Year |
|
|
|
|
|
|
|
| Pay vs Performance Disclosure |
|
|
|
|
|
|
|
| Adjustment to Compensation, Amount |
|
|
$ 0
|
$ 0
|
$ 0
|
$ 0
|
$ 0
|