Shareholder Report
Mar. 31, 2026
USD ($)
shares
What were the Fund costs for the last six months?
(based on a hypothetical $10,000 investment)
| Costs of a $10,000 investment | Costs paid as a percentage of a $10,000 investment | |
|---|---|---|
| Northeast Investors Trust | $207 | 2.06% |
Fund Statistics
(as of March 31, 2026)
| Net Assets ($) | $124,563,692 |
|---|---|
| Number of Portfolio Holdings | |
| Portfolio Turnover Rate (%) | 13.16% |
| Total Trustee Fees Paid ($) | $316,403 |
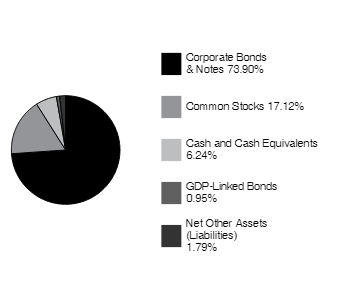
What did the Fund invest in? (as of March 31, 2026)
Asset Allocation (% of Net Assets)
Top Ten Holdings* (% of Net Assets)
| Homer City Holdings, LLC | |
| Pyxus Holdings, Inc., 8.125%, 12/31/27 | |
| Tidewater, Inc., 9.125%, 7/15/30 | |
| KB Home 7.25%, 7/15/30 | |
| XPO, Inc. 6.25%, 6/1/28 | |
| Anywhere Real Estate Group LLP, 7%, 4/15/30 | |
| SS&C Technologies 5.5%, 9/30/27 | |
| Moog, Inc., 4.25%, 12/15/27 | |
| Pitney Bowes, Inc., 6.875%, 3/15/27 | |
| Under Armour, Inc., 3.25%, 6/15/26 |
* Does Not Include Cash Equivalents
Top Ten Industry Breakdown* (% of Net Assets)
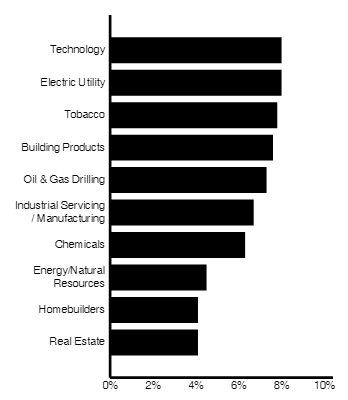
* Does Not Include Cash Equivalents
Top Ten Holdings* (% of Net Assets)
| Homer City Holdings, LLC | |
| Pyxus Holdings, Inc., 8.125%, 12/31/27 | |
| Tidewater, Inc., 9.125%, 7/15/30 | |
| KB Home 7.25%, 7/15/30 | |
| XPO, Inc. 6.25%, 6/1/28 | |
| Anywhere Real Estate Group LLP, 7%, 4/15/30 | |
| SS&C Technologies 5.5%, 9/30/27 | |
| Moog, Inc., 4.25%, 12/15/27 | |
| Pitney Bowes, Inc., 6.875%, 3/15/27 | |
| Under Armour, Inc., 3.25%, 6/15/26 |
* Does Not Include Cash Equivalents