
Exhibit 99.1 DeutschE bank global consumer Conference Jun e 2, 2026 1
Safe harbor & Non-gaap measures Forward-Looking Statements This presentation contains statements by Celsius Holdings, Inc. (“Celsius Holdings”, “we”, “us”, “our” or the “Company”) that are not historical facts and are considered forward-looking statements within the meaning of the Private Securities Litigation Reform Act of 1995. These forward-looking statements may address, among other things, our prospects, plans, business strategy and expected financial and operational results. You can identify these statements by the use of words such as “anticipate,” “believe,” “could,” “estimate,” “expect,” “intend,” “may,” “should,” “will,” “would”, ”could”, ”project”, ”plan”, “potential”, ”designed”, “seek”, “target”, variations of these terms, the negatives of such terms and similar expressions. These statements are based on certain assumptions that we have made in light of our experience in the industry as well as our perceptions of historical trends, current conditions, expected future developments and other factors we believe are appropriate in these circumstances. These forward-looking statements are based on our current expectations and beliefs concerning future developments and their potential effect on us. You should not rely on forward-looking statements because our actual results may differ materially from those indicated by forward-looking statements as a result of a number of important factors. These factors include, but are not limited to: changes to our commercial agreements with PepsiCo, Inc.; management’s plans and objectives for international expansion and global operations; general economic and business conditions; our business strategy for expanding our presence in our industry; our expectations of revenue; operating costs and profitability; our expectations regarding our strategy and investments; our ability to successfully integrate business that we may acquire, including Alani Nutrition LLC (“Alani Nu”) and Rockstar Energy; our ability to achieve the benefits that we expect to realize as a result of our acquisitions, including Alani Nu and Rockstar Energy; the potential negative impact on our financial condition and results of operations if we fail to achieve the benefits that we expect to realize as a result of our business acquisitions, including Alani Nu and Rockstar Energy; liabilities of the businesses that we acquire that are not known to us; our expectations regarding our business, including market opportunity, consumer demand and our competitive advantage; anticipated trends in our financial condition and results of operation; the impact of competition and technology change; existing and future regulations affecting our business; the Company’s ability to comply with the rules and regulations of the Securities and Exchange Commission (the “SEC”);ongoing and potential litigation matters; the impact of third parties attempting to replicate our product attributes; and those other risks and uncertainties discussed in our most recently filed Annual Report on Form 10-K and in our other reports filed with the Securities and Exchange Commission, including our Quarterly Reports on Form 10-Q and Current Reports on Form 8-K. Forward-looking statements speak only as of the date the statements were made. We do not undertake any obligation to update forward-looking information, except to the extent required by applicable law. Use of Non-GAAP Measures Celsius defines Adjusted EBITDA as net income before net interest (expense) income, income tax expense (benefit), and depreciation and amortization expense, further adjusted by excluding stock-based compensation expense, foreign exchange gains or losses, distributor termination fees, legal settlement costs, reorganization costs, acquisition and integration costs, penalties, and inventory step-up adjustment. Adjusted EBITDA Margin is the ratio between the company’s Adjusted EBITDA and net revenue, expressed as a percentage. Adjusted diluted earnings per share is GAAP diluted earnings per share net of add backs and deductions for distributor termination, legal settlement costs, reorganization costs, acquisitions and integration costs, penalties, and inventory step-up adjustment. Adjusted SG&A is GAAP SG&A adjusted for acquisition costs, distributor termination fees, penalties and certain legal accruals. Adjusted SG&A as a % of revenue is the ratio between Adjusted SG&A and net revenue. Adjusted EBITDA, Adjusted EBITDA Margin, Adjusted diluted earnings per share, Adjusted SG&A, and Adjusted SG&A as a percentage of revenue are non-GAAP financial measures. Celsius uses Adjusted EBITDA, Adjusted EBITDA Margin, Adjusted diluted earnings per share, Adjusted SG&A, and Adjusted SG&A as a percentage of revenue for operational and financial decision- making and believes these measures are useful in evaluating its performance because they eliminate certain items that management does not consider indicators of Celsius’ operating performance. Adjusted EBITDA, Adjusted EBITDA Margin, Adjusted diluted earnings per share, Adjusted SG&A, and Adjusted SG&A as a percentage of revenue may also be used by many of Celsius’ investors, securities analysts, and other interested parties in evaluating its operational and financial performance across reporting periods. Celsius believes that the presentation of Adjusted EBITDA, Adjusted EBITDA Margin, Adjusted diluted earnings per share, Adjusted SG&A, and Adjusted SG&A as a percentage of revenue, provides useful information to investors by allowing an understanding of measures that it uses internally for operational decision-making, budgeting and assessing operating performance. Adjusted EBITDA, Adjusted EBITDA Margin, Adjusted diluted earnings per share, Adjusted SG&A, and Adjusted SG&A as a percentage of revenue are not recognized terms under GAAP and should not be considered as a substitute for net income or any other financial measure presented in accordance with GAAP. Non-GAAP financial measures have limitations as analytical tools and should not be considered in isolation or as substitutes for analysis of Celsius’ results as reported under GAAP. Celsius strongly encourages investors to review its financial statements and publicly filed reports in their entirety and not to rely on any single financial measure. Because non-GAAP financial measures are not standardized, Adjusted EBITDA, Adjusted EBITDA Margin, Adjusted diluted earnings per share. Adjusted SG&A, and Adjusted SG&A as percentage of revenue as defined by Celsius, may not be comparable to similarly titled measures reported by other companies. It therefore may not be possible to compare Celsius’ use of these non-GAAP financial measures with those used by other companies. Industry and Market Data Unless otherwise indicated, information contained in this presentation concerning our industry, competitive position and the markets in which we operate is based on information from independent industry and research organizations, other third-party sources and management estimates. Management estimates are derived from publicly available information released by third-party sources, as well as data from our internal research, and are based on assumptions made by us upon reviewing such data, and our experience in, and knowledge of, such industry and markets, which we believe to be reasonable, but we have not independently verified the accuracy of this information. Any industry forecasts are based on data (including third-party data), models and experience of various professionals and are based on various assumptions, all of which are subject to change without notice. In addition, projections, assumptions and estimates of the future performance of the industry in which we operate and our future performance are necessarily subject to uncertainty and risk due to a variety of factors, including those described in “Forward- Looking Statements.” These and other factors could cause results to differ materially from those expressed in the estimates made by the independent parties and by us. 2
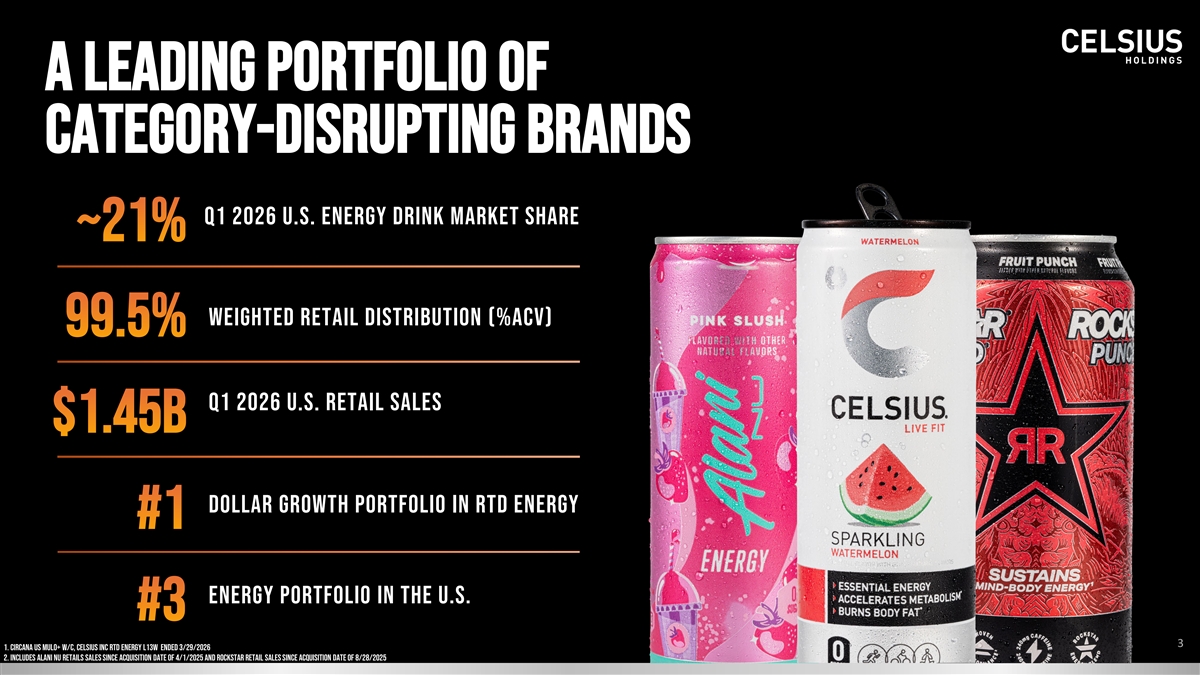
A LEADING portfolio of category-disrupting brands Q1 2026 U.S. Energy Drink Market Share Weighted retail distribution (%acv) Q1 2026 U.S. Retail Sales Dollar Growth Portfolio In RTD Energy Energy Portfolio In the U.S. 3 1. Circana US MULO+ W/C, CELSIUS INC RTD Energy L13W ended 3/29/2026 2. Includes Alani Nu retails sales since acquisition date of 4/1/2025 and Rockstar retail sales since acquisition date of 8/28/2025
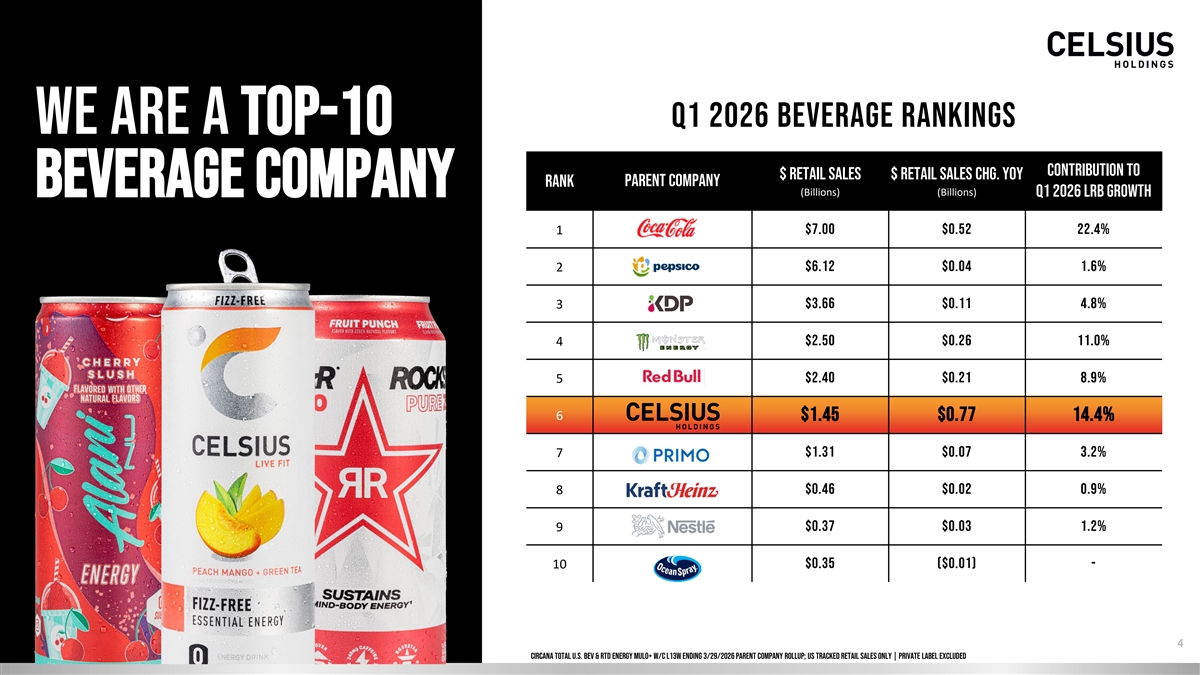
Q1 2026 BEVERAGE RANKINGS WE ARE A TOP-10 Contribution to $ Retail Sales $ Retail Sales Chg. yoy Parent Company Rank beverage COMPANY (Billions) (Billions) q1 2026 LRB Growth $7.00 $0.52 22.4% 1 2 $6.12 $0.04 1.6% 3 $3.66 $0.11 4.8% $2.50 $0.26 11.0% 4 5 $2.40 $0.21 8.9% 6 $1.45 $0.77 14.4% $1.31 $0.07 3.2% 7 $0.46 $0.02 0.9% 8 9 $0.37 $0.03 1.2% 10 $0.35 ($0.01) - 4 Circana TOTAL U.S. Bev & RTD ENERGY MULO+ W/C L13W Ending 3/29/2026 Parent Company Rollup; US Tracked Retail Sales Only | Private Label Excluded

CELSIUS: Powering Performance in Modern Energy PERFORMANCE Function Fitness-first positioning built for Sustained energy, zero sugar, workouts and daily movement metabolism support CONSUMER FLAVOR INNOVATION Active, health-conscious Fruit-forward, crisp flavors consumers fueling performance 5 5 5

ALANI Nu: Igniting A new era of energy Shifted An Entire category 1 #4 in Energy 2 70% Women AGE 18-44 Thrives on 3 Pillars FLAVOR FUN Fans Nostalgic, INVITING, Escapism, fueled Passionate, iconic by design dedicated community 6 1. Circana TOTAL U.S. MULO+ w/C, RTD Energy L52W ending 12/28/2025 6 2. Numerator survey, TTL market, L26W pe 10/6/2024

ROCKSTAR: Next Generation Energy for the Core Consumer Broad Energy Distinct Portfolio Category Reach ROLE 2 Caters to a $17.8 billion core ~70% male age 18-44 1 2 energy market Full-flavor energy for core occasions: sports, music, gaming Powering 25 years Iconic flavors a new era of of disrupting and time-tested ingredients high-performance lifestyles conventional appealing to the next energy generation energy consumer 1. Circana TOTAL U.S. MULO+ w/C, Legacy RTD Energy L52W Ending 12/28/2025 7 2. Celsius Consumer Studies N=1,500
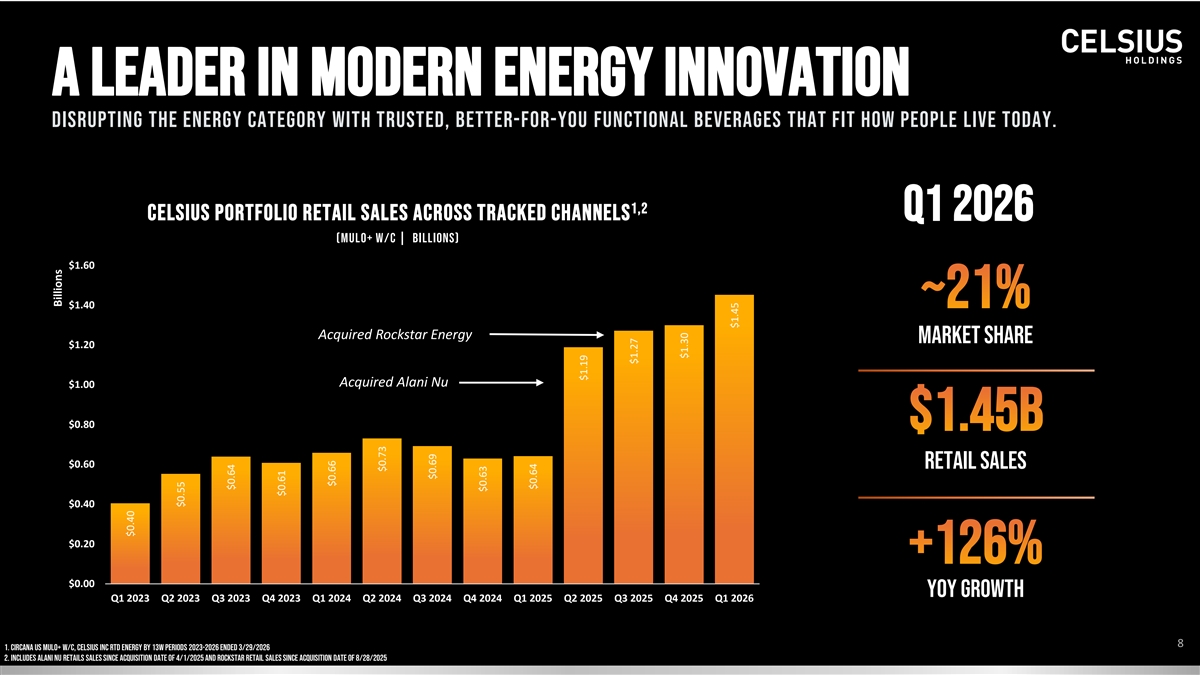
Disrupting the energy category with trusted, better-for-you functional beverages that fit how people live today. 1,2 CELSIUS PORTFOLIO RETAIL SALES ACROSS TRACKED CHANNELS Q1 2026 (MULO+ W/C | BILLIONS) $1.60 $1.40 Acquired Rockstar Energy Market share $1.20 Acquired Alani Nu $1.00 $0.80 $0.60 Retail sales $0.40 $0.20 $0.00 YOY Growth Q1 2023 Q2 2023 Q3 2023 Q4 2023 Q1 2024 Q2 2024 Q3 2024 Q4 2024 Q1 2025 Q2 2025 Q3 2025 Q4 2025 Q1 2026 8 1. Circana US MULO+ W/C, CELSIUS INC RTD Energy by 13W Periods 2023-2026 ended 3/29/2026 2. Includes Alani Nu retails sales since acquisition date of 4/1/2025 and Rockstar retail sales since acquisition date of 8/28/2025 Billions $0.40 $0.55 $0.64 $0.61 $0.66 $0.73 $0.69 $0.63 $0.64 $1.19 $1.27 $1.30 $1.45
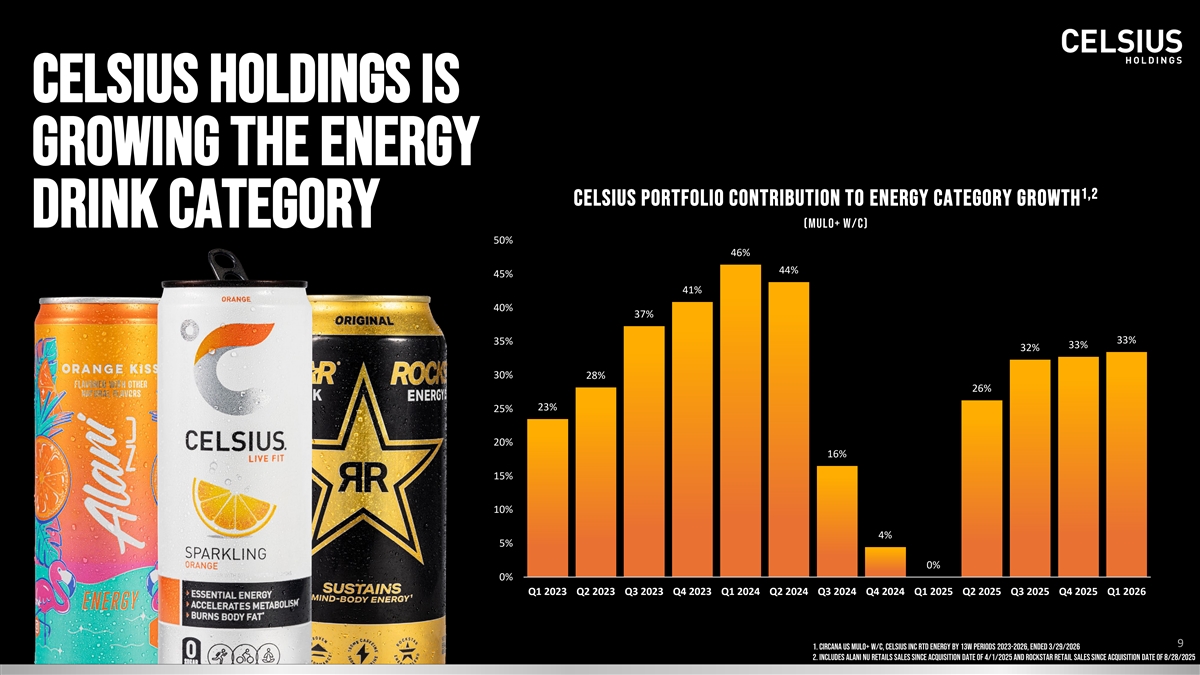
is growing the energy 1,2 CELSIUS PORTFOLIO CONTRIBUTION TO ENERGY CATEGORY GROWTH drink Category (MULO+ W/C) 50% 46% 44% 45% 41% 40% 37% 33% 35% 33% 32% 30% 28% 26% 23% 25% 20% 16% 15% 10% 4% 5% 0% 0% Q1 2023 Q2 2023 Q3 2023 Q4 2023 Q1 2024 Q2 2024 Q3 2024 Q4 2024 Q1 2025 Q2 2025 Q3 2025 Q4 2025 Q1 2026 9 1. Circana US MULO+ W/C, CELSIUS INC RTD Energy by 13W Periods 2023-2026, ended 3/29/2026 9 2. Includes Alani Nu retails sales since acquisition date of 4/1/2025 and Rockstar retail sales since acquisition date of 8/28/2025

WHY CELSIUS HOLDINGS We operate in a rapidly growing category We are capitalizing on evolving consumer trends that are driving increased demand We have a leading total energy portfolio that is positioned to win We have an evolved, scaled operating model We Believe we are well positioned for continued growth & improving profitability C E L SIU S H O L D IN G S, IN C . | C A G N Y IN V E STO R P R E SE N TATIO N 10

Proven growth strategy with disciplined execution PEOPLE PLACES OFTEN Executing our growth strategy in an evolved way 11 The FDA recommends healthy adults consume no more than 400mg of caffeine per day.
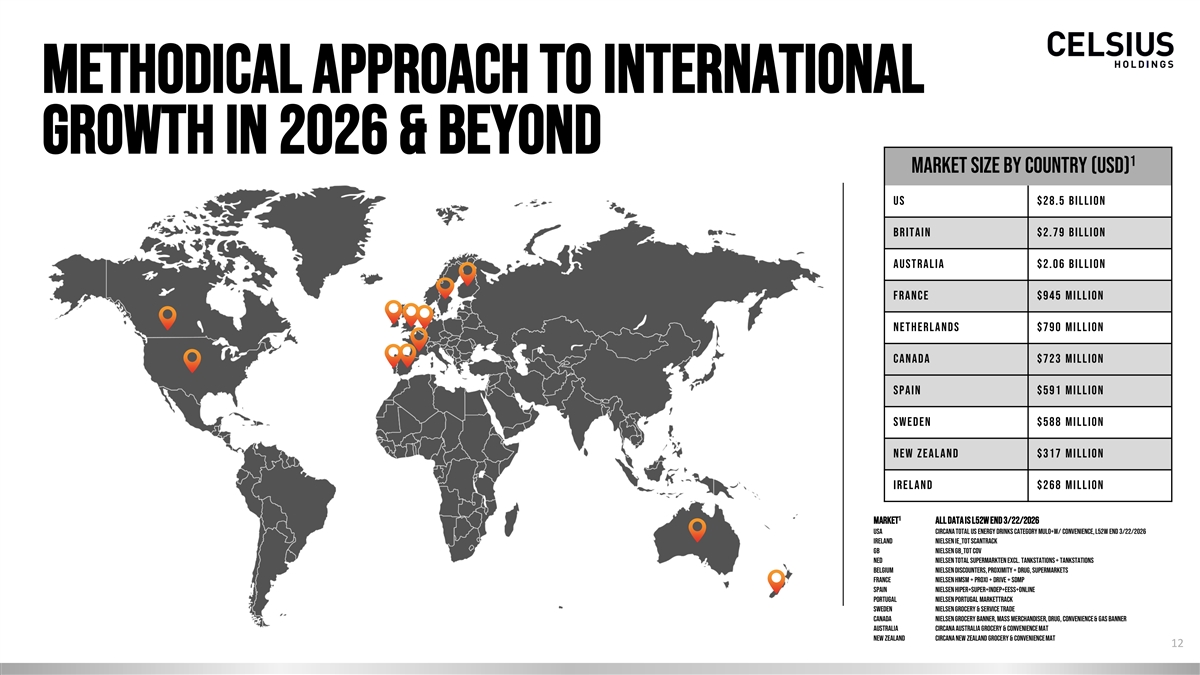
METHODICAL APPROACH TO INTERNATIONAL GROWTH in 2026 & beyond 1 Market Size by Country (USD) US $28.5 billion B r it a in $2.79 billion Au s t r al i a $2.06 billion F ra nc e $945 million Ne t h e rl a nd s $790 million C an ad a $723 million S p a i n $591 million S w ed en $588 million New Zealand $317 million I re l a nd $268 million 1 Market All Data is L52W End 3/22/2026 USA Circana total us energy drinks category mulo+w/ convenience, L52w end 3/22/2026 Ireland Nielsen IE_Tot Scantrack GB Nielsen GB_Tot Cov NED Nielsen Total Supermarkten Excl. Tankstations + Tankstations Belgium Nielsen Discounters, Proximity + Drug, Supermarkets France Nielsen HMSM + PROXI + DRIVE + SDMP Spain Nielsen HIPER+SUPER+INDEP+EESS+ONLINE Portugal Nielsen PORTUGAL MARKETTRACK Sweden Nielsen Grocery & Service Trade Canada Nielsen Grocery Banner, Mass Merchandiser, Drug, Convenience & Gas Banner Australia Circana Australia Grocery & Convenience MAT New zealand circana New Zealand Grocery & Convenience MAT 12
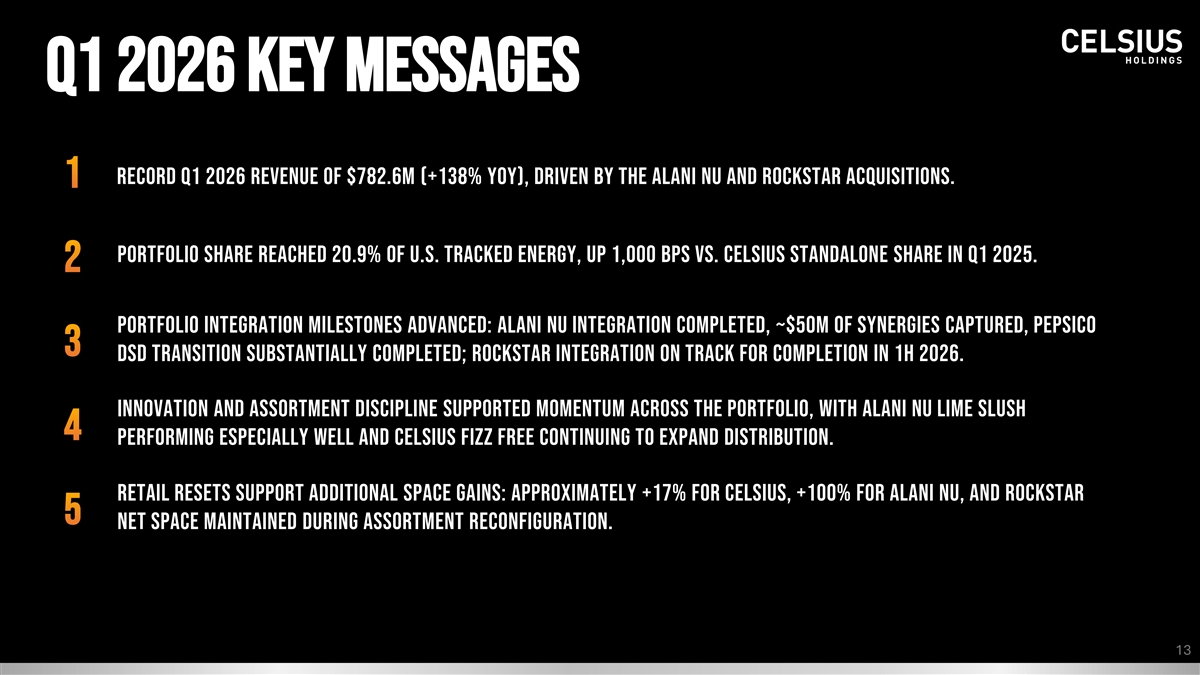
Q1 2026 key messages Record Q1 2026 revenue of $782.6M (+138% YoY), driven by the Alani Nu and Rockstar acquisitions. Portfolio share reached 20.9% of U.S. tracked energy, up 1,000 bps vs. CELSIUS standalone share in Q1 2025. Portfolio integration milestones advanced: Alani Nu integration completed, ~$50M of synergies captured, PepsiCo DSD transition substantially completed; Rockstar integration on track for completion in 1H 2026. Innovation and assortment discipline supported momentum across the portfolio, with Alani Nu Lime Slush performing especially well and CELSIUS Fizz Free continuing to expand distribution. Retail resets support additional space gains: approximately +17% for CELSIUS, +100% for Alani Nu, and Rockstar net space maintained during assortment reconfiguration. 13
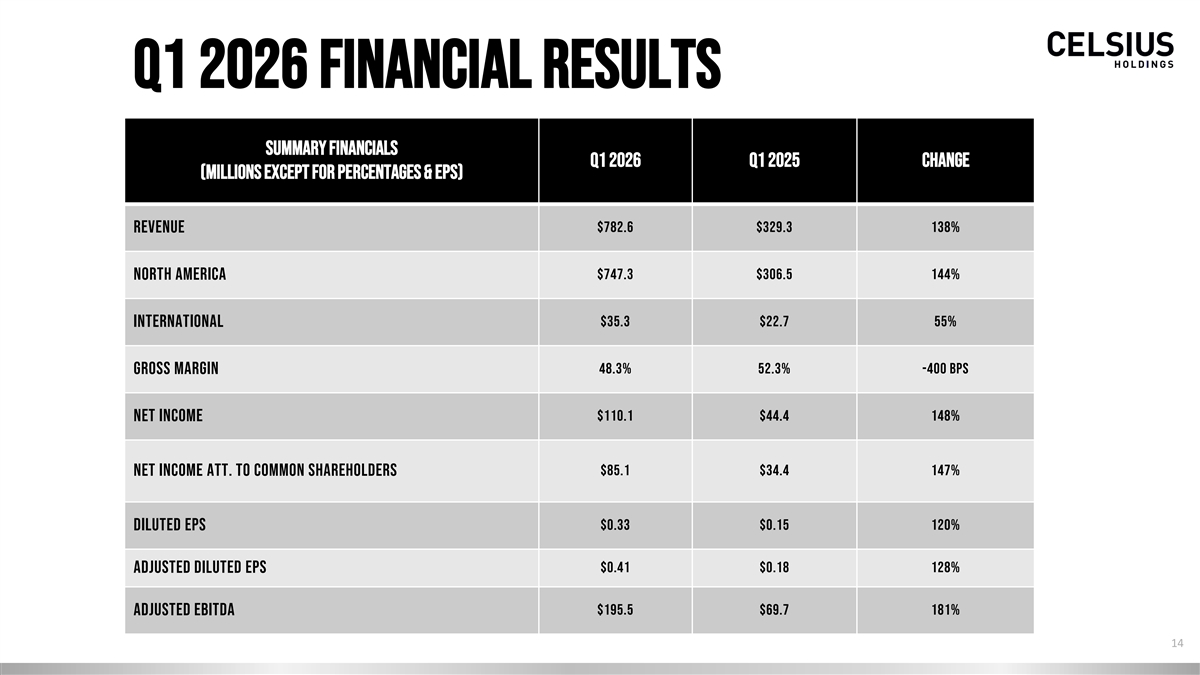
Q1 2026 financial Results Summary Financials Q1 2026 Q1 2025 Change (millions except for percentages & EPS) Revenue $782.6 $329.3 138% $747.3 $306.5 144% North America $35.3 $22.7 55% International Gross Margin 48.3% 52.3% -400 BPS Net Income $110.1 $44.4 148% $85.1 $34.4 147% Net Income att. to Common Shareholders Diluted EPS $0.33 $0.15 120% Adjusted Diluted EPS $0.41 $0.18 128% Adjusted EBITDA $195.5 $69.7 181% 14
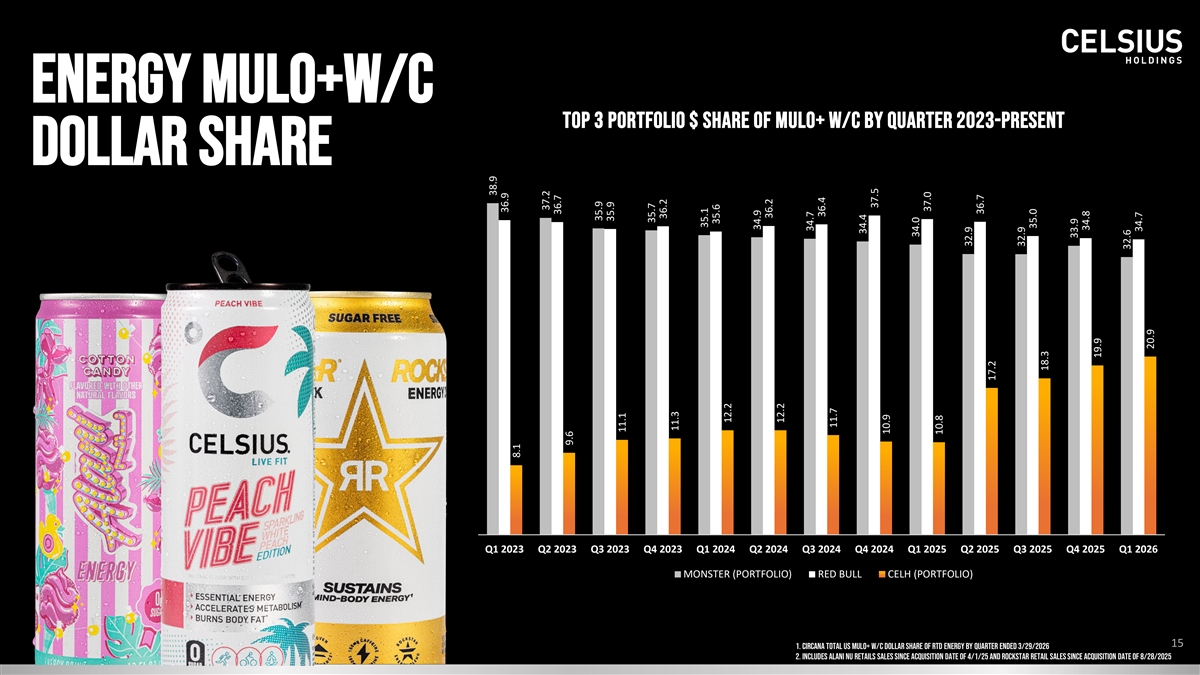
Energy mulo+w/c TOP 3 PORTFOLIO $ SHARE OF MULO+ W/C BY QUARTER 2023-PRESENT dollar share Q1 2023 Q2 2023 Q3 2023 Q4 2023 Q1 2024 Q2 2024 Q3 2024 Q4 2024 Q1 2025 Q2 2025 Q3 2025 Q4 2025 Q1 2026 MONSTER (PORTFOLIO) RED BULL CELH (PORTFOLIO) 15 1. Circana Total US MULO+ W/C dollar share of RTD Energy by quarter ended 3/29/2026 15 2. Includes Alani Nu retails sales since acquisition date of 4/1/25 and Rockstar retail sales since acquisition date of 8/28/2025 38.9 36.9 8.1 37.2 36.7 9.6 35.9 35.9 11.1 35.7 36.2 11.3 35.1 35.6 12.2 34.9 36.2 12.2 34.7 36.4 11.7 34.4 37.5 10.9 34.0 37.0 10.8 32.9 36.7 17.2 32.9 35.0 18.3 33.9 34.8 19.9 32.6 34.7 20.9
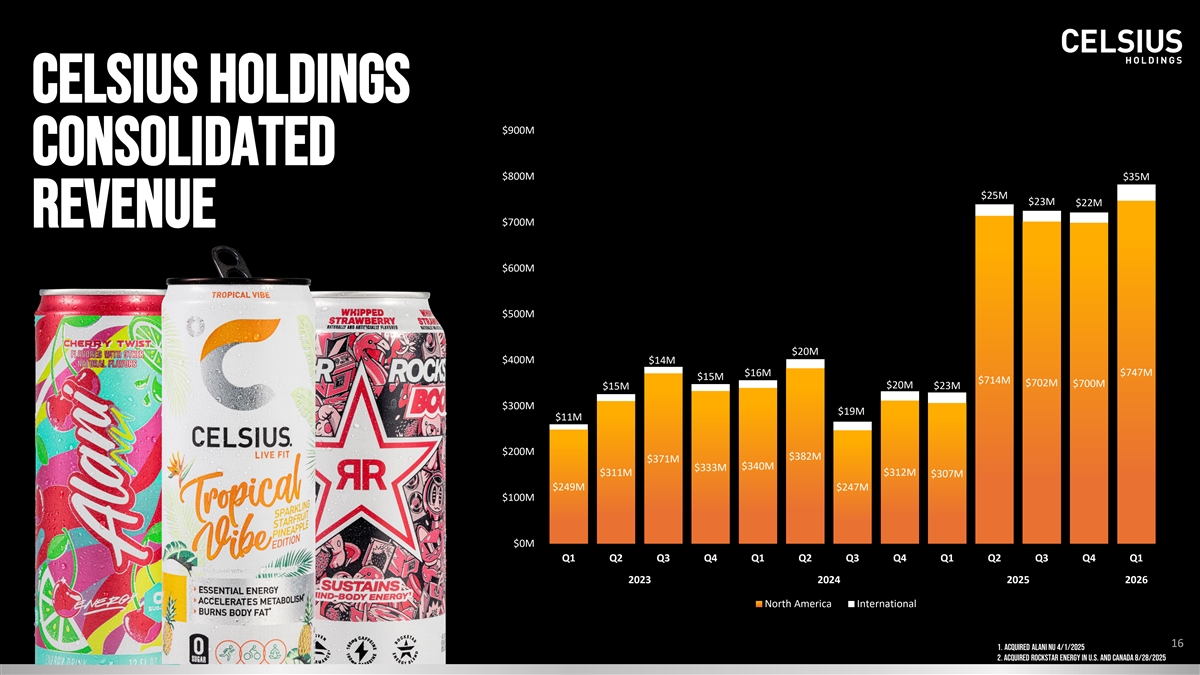
CELSIUS HOLDINGS $900M Consolidated $800M $35M $25M $23M $22M revenue $700M $600M $500M $20M $400M $14M $16M $747M $15M $714M $702M $700M $20M $23M $15M $300M $19M $11M $200M $382M $371M $340M $333M $311M $312M $307M $249M $247M $100M $0M Q1 Q2 Q3 Q4 Q1 Q2 Q3 Q4 Q1 Q2 Q3 Q4 Q1 2023 2024 2025 2026 North America International 16 1. Acquired Alani Nu 4/1/2025 2. Acquired Rockstar Energy in U.S. and Canada 8/28/2025
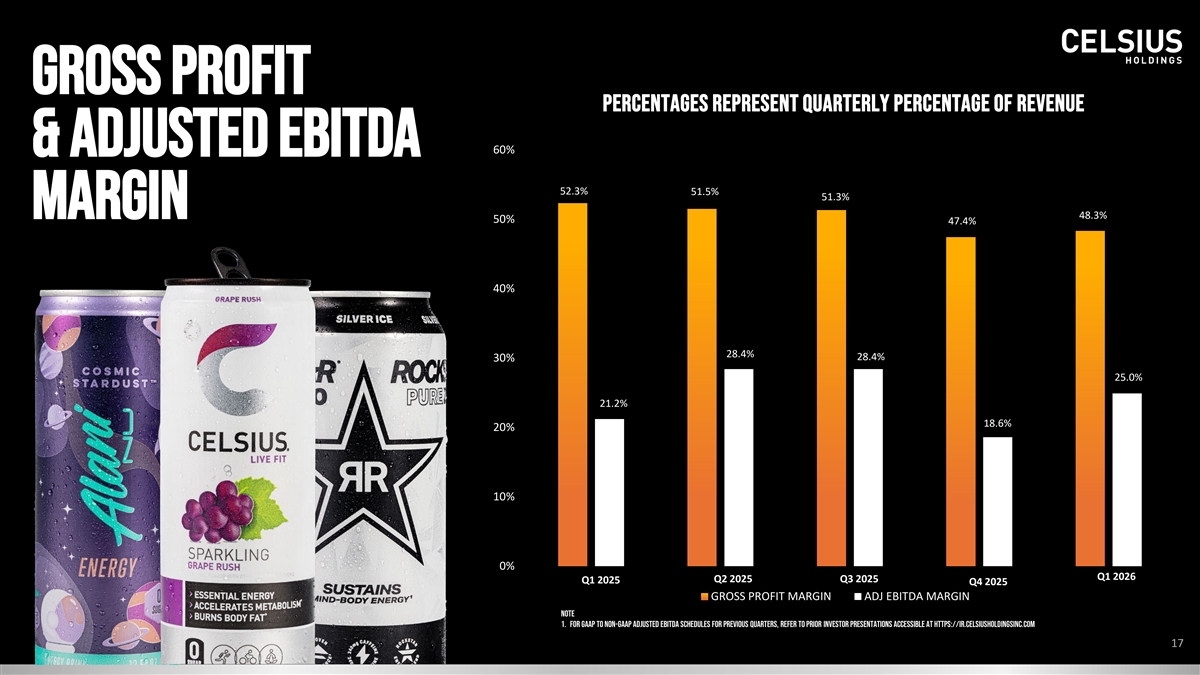
Gross profit PERCENTAGES REPRESENT QUARTERLY PERCENTAGE OF REVENUE 60% & Adjusted Ebitda 52.3% 51.5% 51.3% Margin 48.3% 50% 47.4% 40% 28.4% 28.4% 30% 25.0% 21.2% 18.6% 20% 10% 0% Q1 2026 Q2 2025 Q3 2025 Q1 2025 Q4 2025 GROSS PROFIT MARGIN ADJ EBITDA MARGIN NOTE 1. For GAAP to non-GAAP Adjusted EBITDA schedules for previous quarters, refer to prior investor presentations accessible at https://ir.celsiusholdingsinc.com 17

Q2 2026 updates Tracked CIRCANA DATA Portfolio brand updates C E L SIU S H O L D IN G S, IN C . | C A G N Y IN V E STO R P R E SE N TATIO N 18
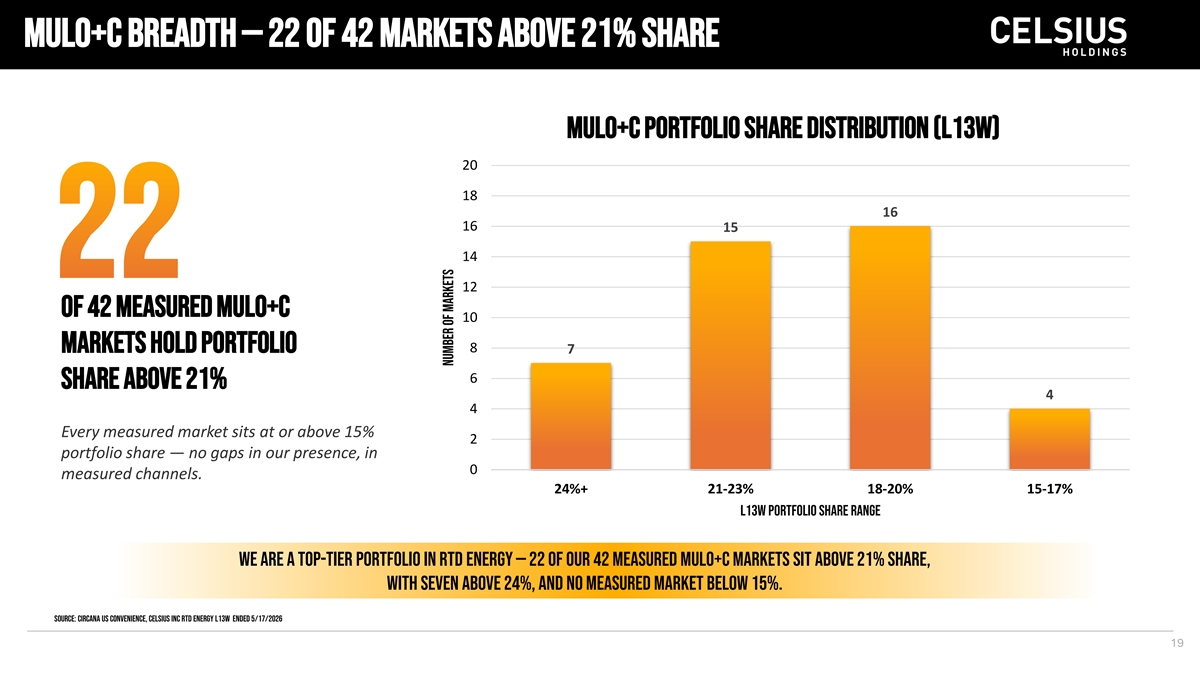
MULO+C BREADTH — 22 OF 42 MARKETS ABOVE 21% SHARE MULO+C Portfolio Share Distribution (L13W) 20 18 16 16 15 14 12 of 42 measured MULO+C 10 markets hold portfolio 8 7 6 share above 21% 4 4 Every measured market sits at or above 15% 2 portfolio share — no gaps in our presence, in 0 measured channels. 24%+ 21-23% 18-20% 15-17% L13W Portfolio Share Range We are a top-tier portfolio in RTD Energy — 22 of our 42 measured MULO+C markets sit above 21% share, with seven above 24%, and no measured market below 15%. Source: Circana US Convenience, CELSIUS INC RTD Energy L13W ended 5/17/2026 19 Number of Markets
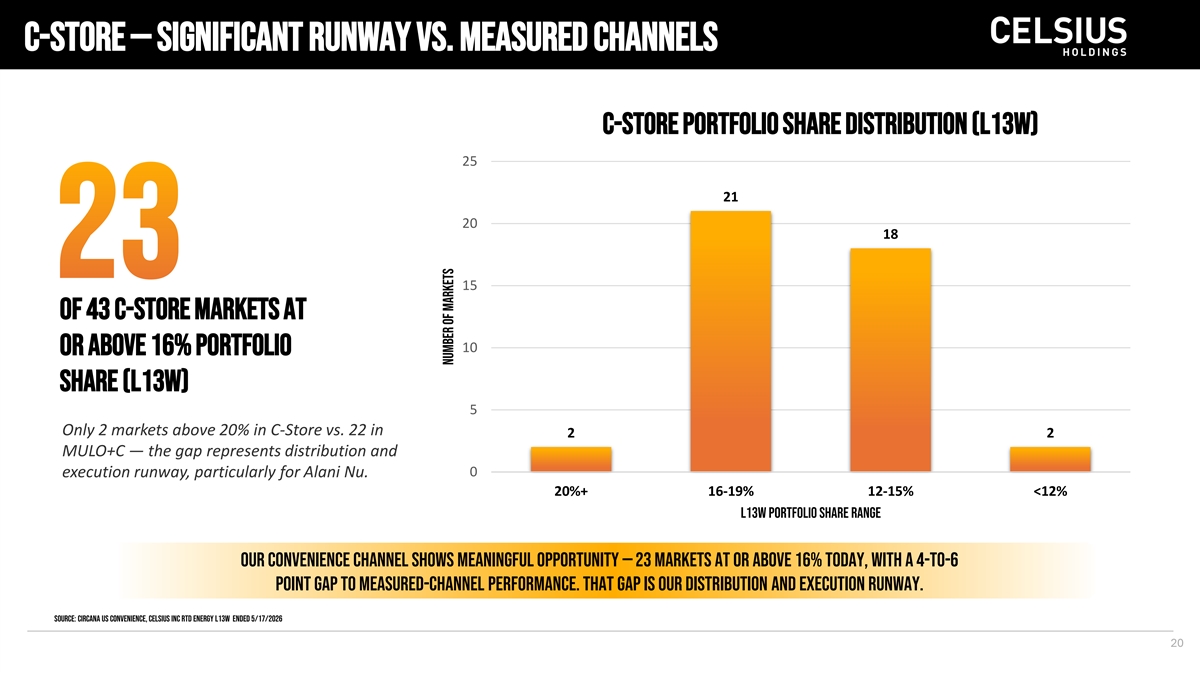
C-STORE — SIGNIFICANT RUNWAY VS. MEASURED CHANNELS C-Store Portfolio Share Distribution (L13W) 25 21 20 18 15 of 43 C-Store markets at 10 or above 16% portfolio share (L13W) 5 Only 2 markets above 20% in C-Store vs. 22 in 2 2 MULO+C — the gap represents distribution and 0 execution runway, particularly for Alani Nu. 20%+ 16-19% 12-15% <12% L13W Portfolio Share Range Our convenience channel shows meaningful opportunity — 23 markets at or above 16% today, with a 4-to-6 point gap to measured-channel performance. That gap is our distribution and execution runway. Source: Circana US Convenience, CELSIUS INC RTD Energy L13W ended 5/17/2026 20 Number of Markets

THREE BRANDS, THREE ROLES, ONE DISCIPLINED SYSTEM 21
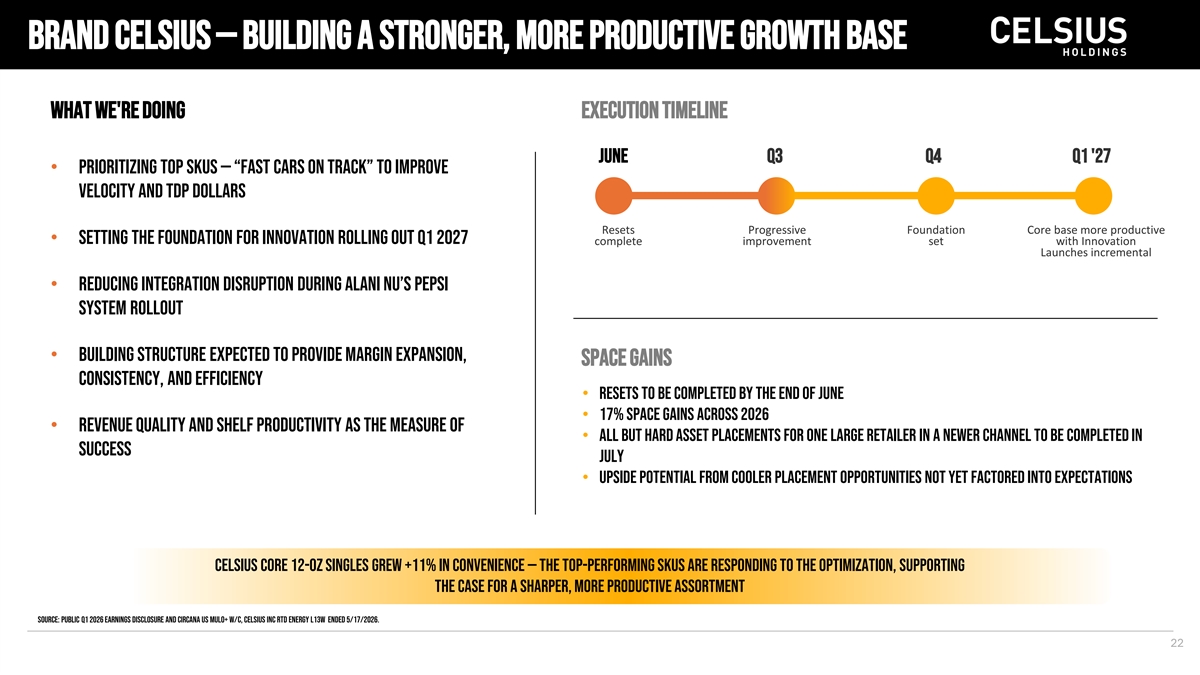
Brand CELSIUS — BUILDING A STRONGER, MORE PRODUCTIVE GROWTH BASE WHAT WE'RE DOING EXECUTION TIMELINE JUNE Q3 Q4 Q1 '27 • Prioritizing top SKUs — “fast cars on track” to improve velocity and TDP Dollars Resets Progressive Foundation Core base more productive • Setting the foundation for innovation rolling out Q1 2027 complete improvement set with Innovation Launches incremental • Reducing integration disruption during Alani Nu’s Pepsi system rollout • Building structure expected to provide margin expansion, SPACE GAINS consistency, and efficiency • Resets to be completed by the end of june • 17% space gains across 2026 • Revenue quality and shelf productivity as the measure of • All but hard asset placements for one large retailer in a newer channel to be completed in success July • Upside Potential from cooler placement opportunities not yet factored into expectations CELSIUS core 12-oz singles grew +11% in convenience — the top-performing SKUs are responding to the optimization, supporting the case for a sharper, more productive assortment Source: Public Q1 2026 earnings disclosure and Circana US MULO+ W/C, CELSIUS INC RTD Energy L13W ended 5/17/2026. 22
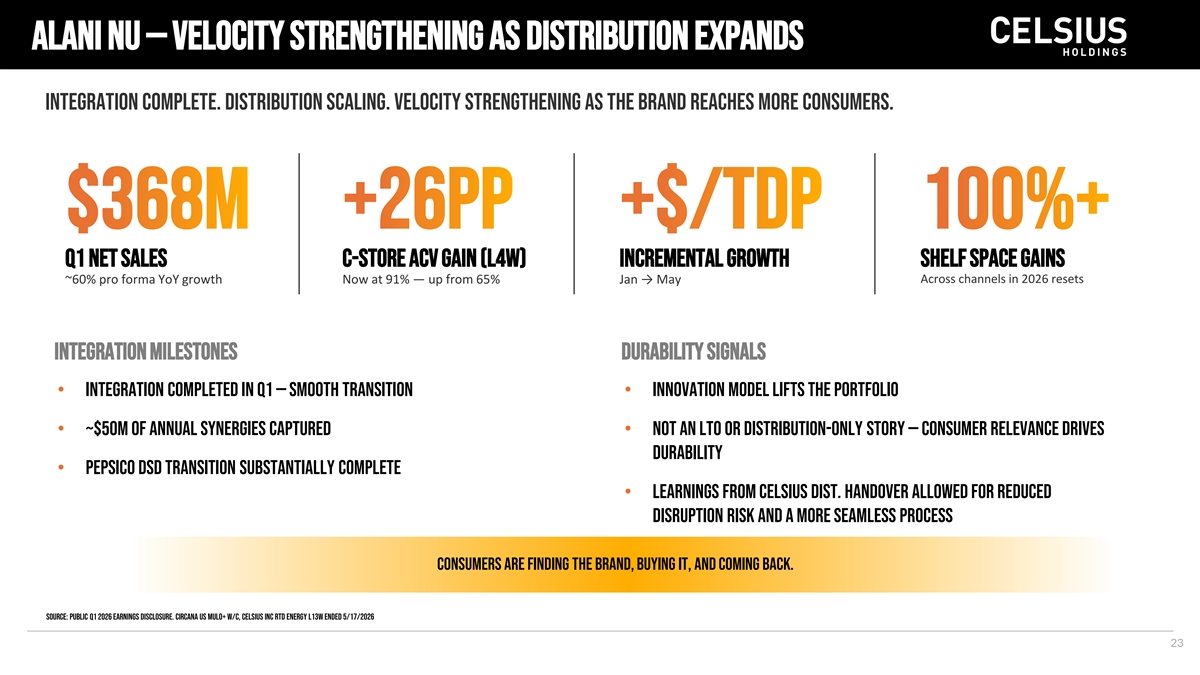
ALANI NU — VELOCITY STRENGTHENING AS DISTRIBUTION EXPANDS Integration complete. Distribution scaling. Velocity strengthening as the brand reaches more consumers. Q1 net sales C-Store ACV gain (l4W) Incremental Growth Shelf space gains ~60% pro forma YoY growth Now at 91% — up from 65% Jan → May Across channels in 2026 resets INTEGRATION MILESTONES DURABILITY SIGNALS • Integration completed in Q1 — smooth transition • innovation model lifts the portfolio • ~$50M of annual synergies captured • Not an LTO or distribution-only story — consumer relevance drives durability • PepsiCo DSD transition substantially complete • Learnings from Celsius dist. handover allowed for reduced disruption risk and a more seamless process Consumers are finding the brand, buying it, and coming back. Source: Public Q1 2026 earnings disclosure. Circana US MULO+ W/C, CELSIUS INC RTD Energy L13W ended 5/17/2026 23
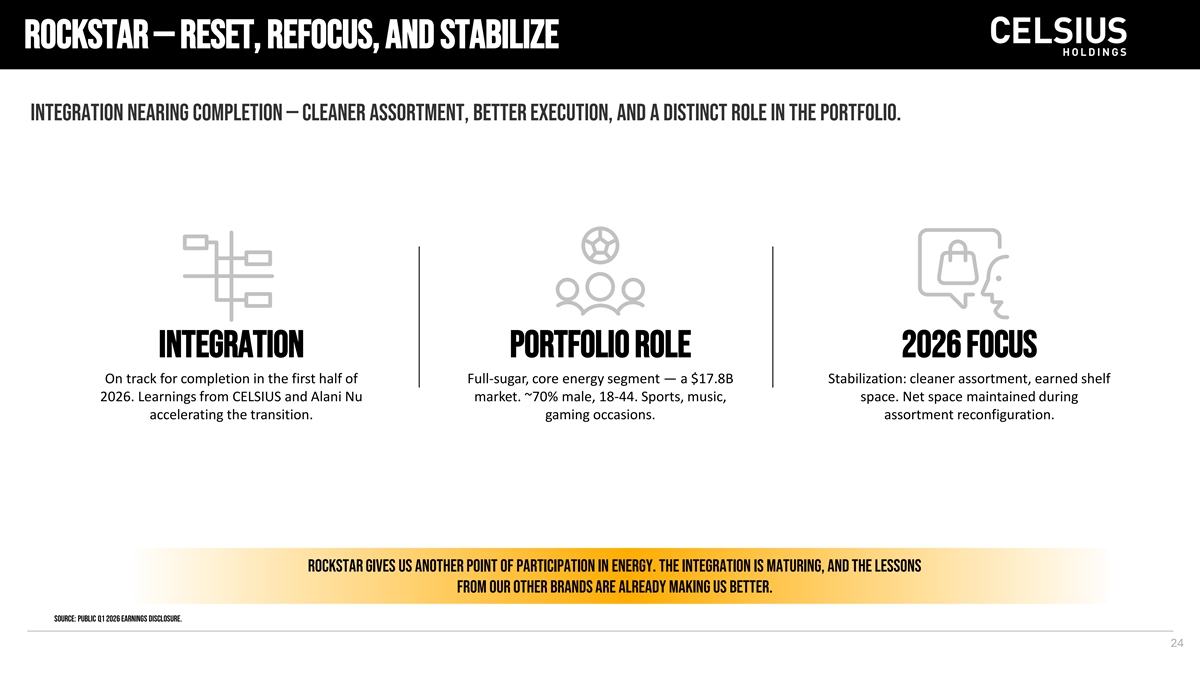
ROCKSTAR — RESET, REFOCUS, AND STABILIZE Integration nearing completion — cleaner assortment, better execution, and a distinct role in the portfolio. INTEGRATION PORTFOLIO ROLE 2026 FOCUS On track for completion in the first half of Full-sugar, core energy segment — a $17.8B Stabilization: cleaner assortment, earned shelf 2026. Learnings from CELSIUS and Alani Nu market. ~70% male, 18-44. Sports, music, space. Net space maintained during accelerating the transition. gaming occasions. assortment reconfiguration. Rockstar gives us another point of participation in energy. The integration is maturing, and the lessons from our other brands are already making us better. Source: Public Q1 2026 earnings disclosure. 24

Appendix 25
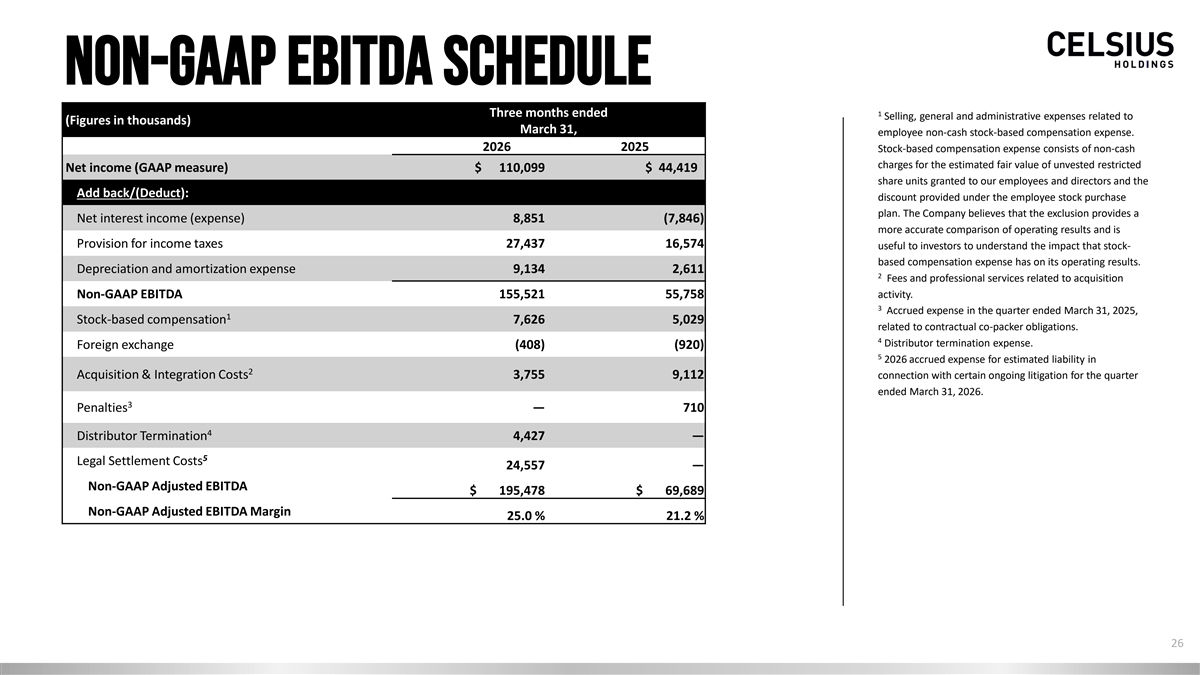
non-gaap ebitda schedule 1 Three months ended Selling, general and administrative expenses related to (Figures in thousands) March 31, employee non-cash stock-based compensation expense. 2026 2025 Stock-based compensation expense consists of non-cash charges for the estimated fair value of unvested restricted Net income (GAAP measure) $ 110,099 $ 44,419 share units granted to our employees and directors and the Add back/(Deduct): discount provided under the employee stock purchase plan. The Company believes that the exclusion provides a Net interest income (expense) 8,851 (7,846) more accurate comparison of operating results and is Provision for income taxes 27,437 16,574 useful to investors to understand the impact that stock- based compensation expense has on its operating results. Depreciation and amortization expense 9,134 2,611 2 Fees and professional services related to acquisition activity. Non-GAAP EBITDA 155,521 55,758 3 Accrued expense in the quarter ended March 31, 2025, 1 Stock-based compensation 7,626 5,029 related to contractual co-packer obligations. 4 Distributor termination expense. Foreign exchange (408) (920) 5 2026 accrued expense for estimated liability in 2 Acquisition & Integration Costs 3,755 9,112 connection with certain ongoing litigation for the quarter ended March 31, 2026. 3 Penalties — 710 4 Distributor Termination 4,427 — 5 Legal Settlement Costs 24,557 — Non-GAAP Adjusted EBITDA $ 195,478 $ 69,689 Non-GAAP Adjusted EBITDA Margin 25.0 % 21.2 % 26
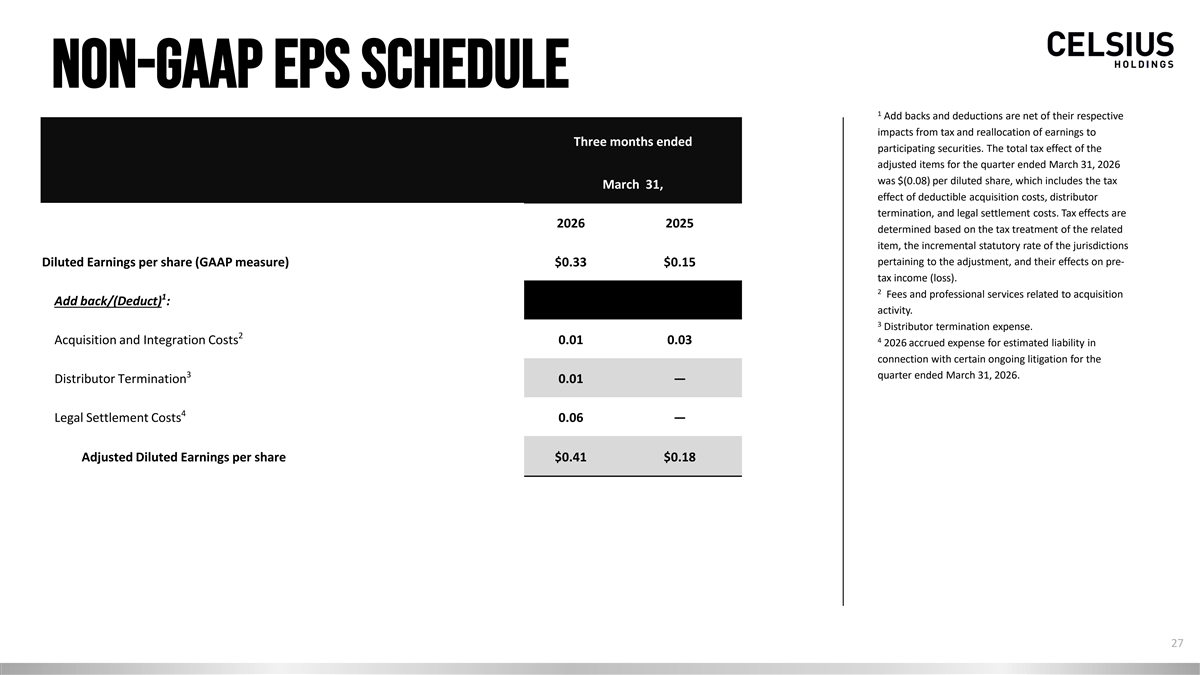
non-gaap eps schedule 1 Add backs and deductions are net of their respective impacts from tax and reallocation of earnings to Three months ended participating securities. The total tax effect of the adjusted items for the quarter ended March 31, 2026 was $(0.08) per diluted share, which includes the tax March 31, effect of deductible acquisition costs, distributor termination, and legal settlement costs. Tax effects are 2026 2025 determined based on the tax treatment of the related item, the incremental statutory rate of the jurisdictions pertaining to the adjustment, and their effects on pre- Diluted Earnings per share (GAAP measure) $0.33 $0.15 tax income (loss). 2 Fees and professional services related to acquisition 1 Add back/(Deduct) : activity. 3 Distributor termination expense. 2 4 Acquisition and Integration Costs 0.01 0.03 2026 accrued expense for estimated liability in connection with certain ongoing litigation for the 3 quarter ended March 31, 2026. Distributor Termination 0.01 — 4 Legal Settlement Costs 0.06 — Adjusted Diluted Earnings per share $0.41 $0.18 27

THANK YOU 28