v3.26.1
Pay vs Performance Disclosure
3 Months Ended 9 Months Ended 12 Months Ended
Dec. 31, 2025
Sep. 30, 2025
Dec. 31, 2025
USD ($)
$ / shares
Dec. 31, 2024
USD ($)
$ / shares
Dec. 31, 2023
USD ($)
$ / shares
Pay vs Performance Disclosure [Table]          
Pay vs Performance [Table Text Block]    
Year (1) 

Summary

Compensation

Total for

PEOs


Compensation

Actually Paid

to PEOs (2)


Summary

Compensation

Table Total

for Non-PEOs


Compensation

Actually Paid

to Non-PEOs (2)


MVIS Total

Stockholder

Return (3)


Peer Group

Total

Stockholder

Return (3)


Net Loss

(in

thousands) (4)


Stock

Price (5)

 
           Average   Average  

Value of Initial Fixed $100

Investment Based On:

   Company Selected Measure 
Year (1) 

Summary

Compensation

Total for

PEOs


Compensation

Actually Paid

to PEOs (2)


Summary

Compensation

Table Total

for Non-PEOs


Compensation

Actually Paid

to Non-PEOs (2)


MVIS Total

Stockholder

Return (3)


Peer Group

Total

Stockholder

Return (3)


Net Loss

(in

thousands) (4)


Stock

Price (5)

 
(a)  (b)   (c)   (d)   (e)   (f)   (g)   (h)   (i) 
2025  $2,486,790   $2,488,497   $2,173,849   $1,569,628   $15.39   $220.10   $(94,981)  $0.83 
2024  $6,524,977   $(30,023)  $1,067,804   $(489,143)  $181.95   $192.74   $(96,915)  $1.31 
2023  $4,726,817   $832,417   $603,388   $350,830   $369.44   $146.11   $(82,842)  $2.66 
   
Company Selected Measure Name     Stock price    
Named Executive Officers, Footnote [Text Block]     For 2025, the PEOs were Mr. DeVos from October through December and Mr. Sharma from January through September; the Non-PEOs were Ms. Markham for the entire year, Mr. Verma for all but the final two weeks of the year, and Mr. Biddiscombe from October through December. For 2024 and 2023, the PEO was Mr. Sharma and the Non-PEOs were Mr. Verma and Ms. Markham for the entire year.    
Peer Group Issuers, Footnote [Text Block]     An investment of $100 is assumed to have been made in our common stock as of December 31, 2020. We have selected the Dow Jones U.S. Electronic & Electrical Equipment Index (DJUSEE) as our peer group. An investment of $100 is assumed to have been made in the DJUSEE as of December 31, 2020    
Summary Compensation Table Total Compensation for PEOs     $ 2,486,790 $ 6,524,977 $ 4,726,817
Compensation Actually Paid to PEOs [1]     $ 2,488,497 (30,023) 832,417
Adjustment To PEO Compensation, Footnote [Text Block]    


Description of Adjustment  2025   2024   2023 
Summary Compensation Table Total Compensation for PEOs  $2,486,790   $6,524,977   $4,726,817 
Subtract grant date fair value of option awards and stock awards granted in the applicable fiscal year  $(743,910)  $(5,983,750)  $(4,245,000)
Adjust for year-end fair value of equity awards granted in the applicable fiscal year that are outstanding and unvested as of the applicable fiscal year end  $745,616   $2,128,750    - 
Adjust for change in fair value at year-end of equity awards granted in prior years that are outstanding and unvested as of the applicable fiscal year  $-   $(3,213,000)  $(414,400)
Adjust for vesting date fair value of equity awards granted and vested in applicable fiscal year  $-   $513,000    729,000 
Adjust for change in fair value of equity awards granted in prior years that vested in the applicable fiscal year  $-   $-   $- 
Compensation Actually Paid to PEOs  $2,488,497   $(30,023)  $832,417 
                
Summary Compensation Table Total Compensation for Non-PEOs  $2,173,849   $1,067,804   $603,388 
Subtract grant date fair value of option awards and stock awards granted in the applicable fiscal year   (3,671,245)  $(657,938)  $- 
Add year-end fair value of equity awards granted in the applicable fiscal year that are outstanding and unvested as of the applicable fiscal year-end  $3,003,338   $783,544   $- 
Adjust for year-over-year change in fair value of equity awards granted in prior years that are outstanding and unvested as of the applicable fiscal year  $199,300   $(1,847,316)  $(225,904)
Adjust for change in fair value of equity awards granted in prior years that vested in the applicable fiscal year  $-   $212,438   $3,346 
Subtract prior year-end fair value of equity award granted in prior years that failed to vest in the applicable fiscal year  $(135,614)  $(47,675)  $- 
Compensation Actually Paid to Non-PEOs  $1,569,628   $(489,143)  $350,830 
   
Summary Compensation Table Total Compensation for Non-PEOs     $ 2,173,849 1,067,804 603,388
Compensation Actually Paid to Non-PEOs [1]     $ 1,569,628 (489,143) 350,830
Compensation Actually Paid vs. Total Shareholder Return    


Compensation Actually Paid vs. Net Income    


Compensation Actually Paid vs. Company Selected Measure    


Total Shareholder Return Vs Peer Group    


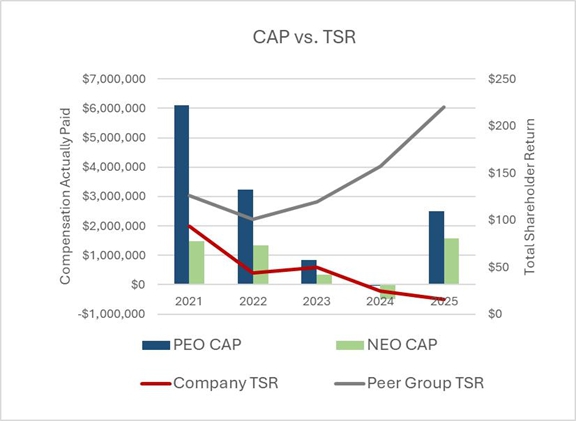
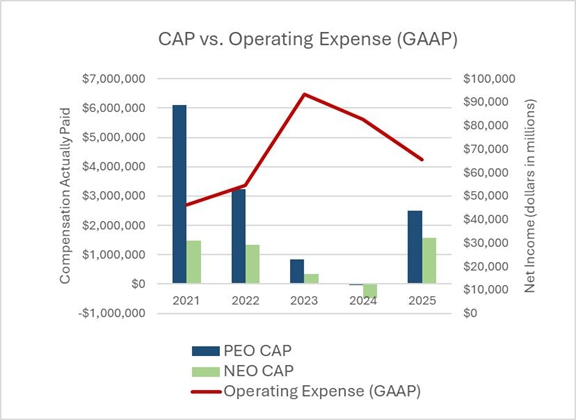
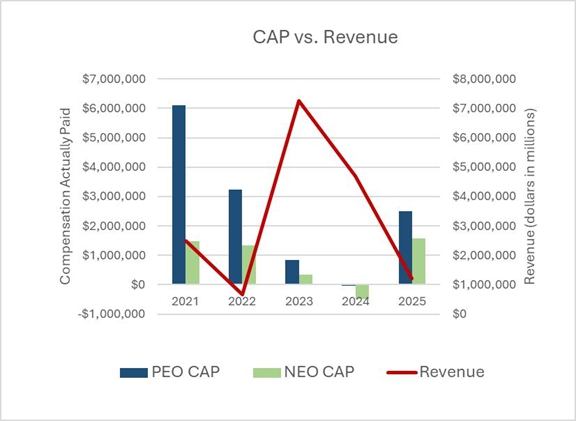
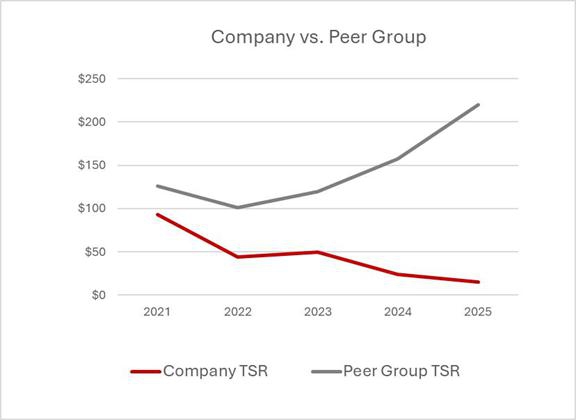
Compensation Actually Paid and Performance Measures. The following graphical comparisons reflect the relationship between our PEO and average non-PEO compensation “actually paid” versus the performance measures in the pay versus performance table from 2021 to 2025:


Tabular List [Table Text Block]    


Performance Metrics


Stock Price Targets   Served as performance objectives in our performance-equity-based PRSU program for executives through December 31, 2025
     
Revenue   A factor in assessing market progress and critical to the company’s long-term sustainability
     
Cash Operating Expenses   A key non-GAAP measure used by our Board and management to evaluate company performance and fiscal discipline
   
Total Shareholder Return Amount [2]     $ 15.39 181.95 369.44
Peer Group Total Shareholder Return Amount [2]     220.10 192.74 146.11
Net Income (Loss) Attributable to Parent [3]     $ (94,981,000) $ (96,915,000) $ (82,842,000)
Company Selected Measure Amount | $ / shares [4]     0.83 1.31 2.66
PEO Name Mr. DeVos Mr. Sharma   Mr. Sharma Mr. Sharma
Additional 402(v) Disclosure [Text Block]     The Summary Compensation Table totals reported for the PEO and the average of the Non-PEOs for each year were subject to the following adjustments per Item 402(v)(2)(iii) of Regulation S-K to calculate “compensation actually paid”: the summary compensation table totals were decreased for amounts reported under the “Option Awards” and “Stock Awards” columns and increased/decreased for the inclusion of Rule 402(v) equity values, which reflect the aggregate of the following components, as applicable (i) the fair value as of the end of the listed fiscal year of unvested equity awards granted in that year; (ii) the change in fair value during the listed fiscal year of equity awards granted in prior years that remained outstanding and unvested at the end of the listed fiscal year; and (iii) the change in fair value during the listed fiscal year through the vesting date of equity awards granted in prior years that vested during the listed fiscal year, less the fair value at the end of the prior year of awards granted prior to the listed fiscal year that failed to meet applicable vesting conditions during the listed fiscal year. Equity values are calculated in accordance with FASB ASC Topic 718, and the valuation assumptions used to calculate fair values did not materially differ from those disclosed at the time of the grant.    
Measure [Axis]: 1          
Pay vs Performance Disclosure [Table]          
Measure Name     Stock Price Targets    
Measure [Axis]: 2          
Pay vs Performance Disclosure [Table]          
Measure Name     Revenue    
Measure [Axis]: 3          
Pay vs Performance Disclosure [Table]          
Measure Name     Cash Operating Expenses    
PEO [Member] | Subtract Grant Date Fair Value of Option Awards and Stock Awards Granted in the Applicable Fiscal Year [Member]          
Pay vs Performance Disclosure [Table]          
Adjustment to Compensation Amount     $ (743,910) $ (5,983,750) $ (4,245,000)
PEO [Member] | Adjust For Year-End Fair Value of Equity Awards Granted in the Applicable Fiscal Year That Are Outstanding and Unvested as of the Applicable Fiscal Year End [Member]          
Pay vs Performance Disclosure [Table]          
Adjustment to Compensation Amount     745,616 2,128,750
PEO [Member] | Adjust for Change in Fair Value at Year-End of Equity Awards Granted in Prior Years that are Outstanding and Unvested as of the Applicable Fiscal Year [Member]          
Pay vs Performance Disclosure [Table]          
Adjustment to Compensation Amount     (3,213,000) (414,400)
PEO [Member] | Adjust for Vesting Date Fair Value of Equity Awards Granted and Vested in Applicable Fiscal Year [Member]          
Pay vs Performance Disclosure [Table]          
Adjustment to Compensation Amount     513,000 729,000
PEO [Member] | Adjust for Change in Fair Value of Equity Awards Granted in Prior Years that Vested in the Applicable Fiscal Year [Member]          
Pay vs Performance Disclosure [Table]          
Adjustment to Compensation Amount    
Non-PEO NEO [Member] | Subtract Grant Date Fair Value of Option Awards and Stock Awards Granted in the Applicable Fiscal Year [Member]          
Pay vs Performance Disclosure [Table]          
Adjustment to Compensation Amount     (3,671,245) (657,938)
Non-PEO NEO [Member] | Adjust For Year-end Fair Value of Equity Awards Granted in Applicable Fiscal Year That are Outstanding and Unvested as of Applicable Fiscal Year End [Member]          
Pay vs Performance Disclosure [Table]          
Adjustment to Compensation Amount     3,003,338 783,544
Non-PEO NEO [Member] | Adjust for Year-over-year Change in Fair Value of Equity Awards Granted in Prior Years that are Outstanding and Unvested as of Applicable Fiscal Year [Member]          
Pay vs Performance Disclosure [Table]          
Adjustment to Compensation Amount     199,300 (1,847,316) (225,904)
Non-PEO NEO [Member] | Adjust for Change in Fair Value of Equity Awards Granted in Prior Years that Vested in Applicable Fiscal Year [Member]          
Pay vs Performance Disclosure [Table]          
Adjustment to Compensation Amount     212,438 3,346
Non-PEO NEO [Member] | Subtract Prior Year-end Fair Value of Equity Award Granted in Prior Years that Failed to Vest in Applicable Fiscal Year [Member]          
Pay vs Performance Disclosure [Table]          
Adjustment to Compensation Amount     $ (135,614) $ (47,675)
[1] The Summary Compensation Table totals reported for the PEO and the average of the Non-PEOs for each year were subject to the following adjustments per Item 402(v)(2)(iii) of Regulation S-K to calculate “compensation actually paid”: the summary compensation table totals were decreased for amounts reported under the “Option Awards” and “Stock Awards” columns and increased/decreased for the inclusion of Rule 402(v) equity values, which reflect the aggregate of the following components, as applicable (i) the fair value as of the end of the listed fiscal year of unvested equity awards granted in that year; (ii) the change in fair value during the listed fiscal year of equity awards granted in prior years that remained outstanding and unvested at the end of the listed fiscal year; and (iii) the change in fair value during the listed fiscal year through the vesting date of equity awards granted in prior years that vested during the listed fiscal year, less the fair value at the end of the prior year of awards granted prior to the listed fiscal year that failed to meet applicable vesting conditions during the listed fiscal year. Equity values are calculated in accordance with FASB ASC Topic 718, and the valuation assumptions used to calculate fair values did not materially differ from those disclosed at the time of the grant.
[2] An investment of $100 is assumed to have been made in our common stock as of December 31, 2020. We have selected the Dow Jones U.S. Electronic & Electrical Equipment Index (DJUSEE) as our peer group. An investment of $100 is assumed to have been made in the DJUSEE as of December 31, 2020.
[3] The dollar amounts reported represent the amount of the net loss reflected in our audited financial statements of the applicable fiscal year.
[4] The stock prices reported here are the closing prices on the last trading day of the relevant fiscal year. Stock price was chosen from the following three most important financial performance measures used to link compensation actually paid to our PEO and other NEOs in 2025 to company performance: