Pay vs Performance Disclosure
Dec. 31, 2025
USD ($)
Dec. 31, 2024
USD ($)
Dec. 31, 2023
USD ($)
Dec. 31, 2022
USD ($)
Dec. 31, 2021
USD ($)
Year |
Summary Compensation Table Total for PEO ($)(1) |
Compensation Actually Paid to PEO ($)(2) |
Average Summary Compensation Table Total for Non-PEO NEOs ($)(3) |
Average Compensation Actually Paid to Non-PEO NEOs ($)(4) |
Value of Initial Fixed $100 Investment Based On: |
Net Income (Loss) ($ in thousands)(7) |
Revenue ($ in thousands)(8) |
|||||||||||||||||||||||||
Total Shareholder Return ($)(5) |
Peer Group Total Shareholder Return ($)(6) |
|||||||||||||||||||||||||||||||
2025 |
60,551,052 | 97,692,067 | 25,477,473 | 68,271,071 | 259.44 | 258.38 | (102,267 | ) | 2,167,937 | |||||||||||||||||||||||
2024 |
2,081,094 | 6,580,724 | 5,976,658 | 15,378,722 | 141.70 | 208.30 | (78,800 | ) | 1,669,626 | |||||||||||||||||||||||
2023 |
20,515,350 | 36,814,134 | 15,432,708 | 34,721,558 | 109.57 | 152.48 | (183,949 | ) | 1,296,745 | |||||||||||||||||||||||
2022 |
599,731 | (123,800,316 | ) | 20,203,347 | (56,851,765 | ) | 59.49 | 96.60 | (193,381 | ) | 975,241 | |||||||||||||||||||||
2021 |
400,000 | 133,649,996 | 2,803,735 | 71,405,207 | 173.05 | 134.53 | (260,309 | ) | 656,426 | |||||||||||||||||||||||
co-founding
our company in 2009) for each corresponding year in the “Total” column of the applicable Summary Compensation Table. For more information with respect to 2023, 2024, and 2025, see the section titled “2025 Summary Compensation Table
.”
S-K.
The peer group used for this purpose is the following published industry index: Standard & Poor 500 Information Technology Index (the “Index”), as used in our stock performance graph included in our 2025 Annual Report.
| (2) | The amounts reported represent the amount of CAP to Mr. Prince for the corresponding fiscal year, as computed in accordance with SEC rules as further described below. These amounts do not reflect the actual amount of compensation earned by or paid to Mr. Prince during the applicable year. In accordance with Item 402(v) of Regulation S-K under the Securities Act, the following adjustments were made to Mr. Prince’s total compensation for each year to determine the CAP: |
Year |
Reported Summary Compensation Table Total for PEO ($) |
Less: Reported Value of Equity Awards ($)(a) |
Add: Equity Award Adjustments ($)(b) |
Compensation Actually Paid to PEO ($) |
||||||||||||
2025 |
60,551,052 | 58,251,101 | 95,392,116 | 97,692,067 | ||||||||||||
2024 |
2,081,094 | — | 4,499,630 | 6,580,724 | ||||||||||||
2023 |
20,515,350 | 19,331,393 | 35,630,177 | 36,814,134 | ||||||||||||
2022 |
599,731 | — | (124,400,047 | ) | (123,800,316 | ) | ||||||||||
2021 |
400,000 | — | 133,249,996 | 133,649,996 | ||||||||||||
| (a) | The grant date fair value of equity awards represents the total of the amounts reported in the “Stock Awards” and “Option Awards” columns in the Summary Compensation Table for the applicable year. For more information about Mr. Prince’s equity awards for 2025, see the section titled “ 2025 Summary Compensation Table .” We have never provided pension benefits to our named executive officers; therefore, no adjustments to the 2025 Summary Compensation Table total for changes in pension values are necessary. |
| (b) | The equity award adjustments for each applicable year include the addition (or subtraction, as applicable) of the following: (i) the year-end fair value of any equity awards granted in the applicable year that are outstanding and unvested as of the end of the year; (ii) the amount of change as of the end of the applicable year (from the end of the prior fiscal year) in fair value of any awards granted in prior years that are outstanding and unvested as of the end of the applicable year; (iii) for awards that are granted and vest in the same applicable year, the fair value as of the vesting date; (iv) for awards granted in prior years that vest in the applicable year, the amount equal to the change as of the vesting date (from the end of the prior fiscal year) in fair value; (v) for awards granted in prior years that are determined to fail to meet the applicable vesting conditions during the applicable year, a deduction for the amount equal to the fair value at the end of the prior fiscal year; and (vi) the dollar value of any dividends or other earnings paid on stock or option awards in the applicable year prior to the vesting date that are not otherwise reflected in the fair value of such award or included in any other component of total compensation for the applicable year. The valuation assumptions used to calculate the fair values were updated as of each measurement date and will differ from those disclosed as of the grant date. The methodology used to develop the valuation assumptions as of each applicable measurement date is consistent with those disclosed at the time of grant. The amounts deducted or added in calculating the equity award adjustments are as follows: |
Year |
Year-End Fair Value of Equity Awards Granted in the Year and that are Outstanding and Unvested ($) |
Year-over-Year Change in Fair Value of Equity Awards Granted in Prior Years that are Outstanding and Unvested ($) |
Fair Value as of Vesting Date of Equity Awards Granted and Vested in the Year ($) |
Year-over-Year Change in Fair Value of Equity Awards Granted in Prior Years that Vested in the Year ($) |
Prior Year-End Fair Value of Equity Awards that Failed to Meet Vesting Conditions in the Year ($) |
Value of Dividends or other Earnings Paid on Equity Awards not Otherwise Reflected in Fair Value or Total Compensation ($) |
Total Equity Award Adjustments ($) |
|||||||||||||||||||||
2025 |
71,342,401 | 8,597,083 | 9,596,095 | 5,856,537 | — | — | 95,392,116 | |||||||||||||||||||||
2024 |
— | 4,223,658 | — | 275,971 | — | — | 4,499,630 | |||||||||||||||||||||
2023 |
20,800,846 | — | 3,538,488 | 11,290,843 | — | — | 35,630,177 | |||||||||||||||||||||
2022 |
— | (64,717,501 | ) | — | (59,682,546 | ) | — | — | (124,400,047 | ) | ||||||||||||||||||
2021 |
— | 97,142,504 | — | 36,107,493 | — | — | 133,249,996 | |||||||||||||||||||||
| (4) | The amounts reported represent the average amount of CAP to the non-PEO NEOs specified in footnote (3), as computed in accordance with SEC rules. These amounts do not reflect the actual average amount of compensation earned by or paid to the non-PEO NEOs during the applicable year. In accordance with Item 402(v) of Regulation S-K under the Securities Act, the following adjustments were made to average total compensation for the non-PEO NEOs for each year to determine the CAP, using the same methodology described above in footnote (2), including with respect to the remeasurement of compensation related to equity awards: |
Year |
Average Reported Summary Compensation Table Total for Non-PEO NEOs ($) |
Less: Average Reported Value of Equity Awards ($) |
Add: Average Equity Award Adjustments ($)(a) |
Average Compensation Actually Paid to Non-PEO NEOs ($) |
||||||||||||
2025 |
25,477,473 | 24,412,786 | 67,206,385 | 68,271,071 | ||||||||||||
2024 |
5,976,658 | 5,062,060 | 14,464,124 | 15,378,722 | ||||||||||||
2023 |
15,432,708 | 14,790,223 | 34,079,072 | 34,721,558 | ||||||||||||
2022 |
20,203,347 | 19,320,714 | (57,734,399 | ) | (56,851,765 | ) | ||||||||||
2021 |
2,803,735 | 2,270,402 | 70,871,874 | 71,405,207 | ||||||||||||
| (a) | The amounts deducted or added in calculating the total average equity award adjustments are as follows: |
Year |
Average Year- End Fair Value of Equity Awards Granted in the Year and that are Outstanding and Unvested ($) |
Average Year- over-Year Change in Fair Value of Equity Awards Granted in Prior Years that are Outstanding and Unvested ($) |
Average Fair Value as of Vesting Date of Equity Awards Granted and Vested in the Year ($) |
Average Year- over-Year Change in Fair Value of Equity Awards Granted in Prior Years that Vested in the Year ($) |
Average Prior Year-End Fair Value of Equity Awards that Failed to Meet Vesting Conditions in the Year ($) |
Average Value of Dividends or other Earnings Paid on Equity Awards not Otherwise Reflected in Fair Value or Total Compensation ($) |
Average Equity Award Adjustments ($) |
|||||||||||||||||||||
2025 |
25,487,331 | 23,073,047 | 8,083,194 | 10,562,814 | — | — | 67,206,385 | |||||||||||||||||||||
2024 |
4,137,999 | 8,148,833 | 1,892,003 | 285,290 | — | — | 14,464,124 | |||||||||||||||||||||
2023 |
14,045,019 | 11,603,751 | 2,314,766 | 6,115,537 | — | — | 34,079,072 | |||||||||||||||||||||
2022 |
6,724,110 | (34,558,762 | ) | — | (29,899,746 | ) | — | — | (57,734,399 | ) | ||||||||||||||||||
2021 |
3,572,548 | 48,739,135 | — | 18,560,191 | — | — | 70,871,874 | |||||||||||||||||||||
For purposes of calculating the CAP to our PEO, compensation related to equity awards was remeasured. For RSUs, the fair values and the change in fair values were determined by the closing price of our common stock at each applicable fiscal
year-end
date or, in the case of vested awards, the stock price on the vesting date. For stock options, a Black-Scholes-Merton option valuation model (“BSM model”) was used as of the applicable year-end
date or, in the case of vested options, the vesting date. Similarly, for unvested performance stock options, a Monte Carlo simulation model in conjunction with the BSM model was used. For unearned PSUs, a Monte Carlo simulation model was used. The BSM model and Monte Carlo Simulation model require assumptions and judgments regarding the variables used in the calculation, including the expected remaining term, expected volatility, expected risk-free interest rate, and the expected dividend yield. The assumptions used varied by measurement date and the range of these assumptions used for each fiscal year end are as follows: Year Ended December 31, | ||||||||||
2025 |
2024 |
2023 |
2022 |
2021 | ||||||
Expected remaining term (in years) |
2.0- 2.5 |
2.0 -2.5 |
1.0 -1.5 |
1.5 | 1.5 -2.5 | |||||
Expected volatility |
49.30 % - 54.34 % |
55.89% - 82.16% |
63.88% - 93.37% |
62.67% - 88.34% |
57.40% - 66.52% | |||||
Expected risk-free interest rate |
3.44% - 4.21% | 4.01% - 4.65% | 3.82% - 5.34% | 0.69% - 4.52% | 0.11% - 0.85% | |||||
Expected dividend yield |
— | — | — | — | — | |||||
Compensation Actually Paid and Total Shareholder Return
The following graph shows the relationships between the amount of CAP to Mr. Prince, the average amount of CAP to the
non-PEO
NEOs, our cumulative TSR, and the cumulative TSR of our peer group over the five years presented in the Pay Versus Performance Table. 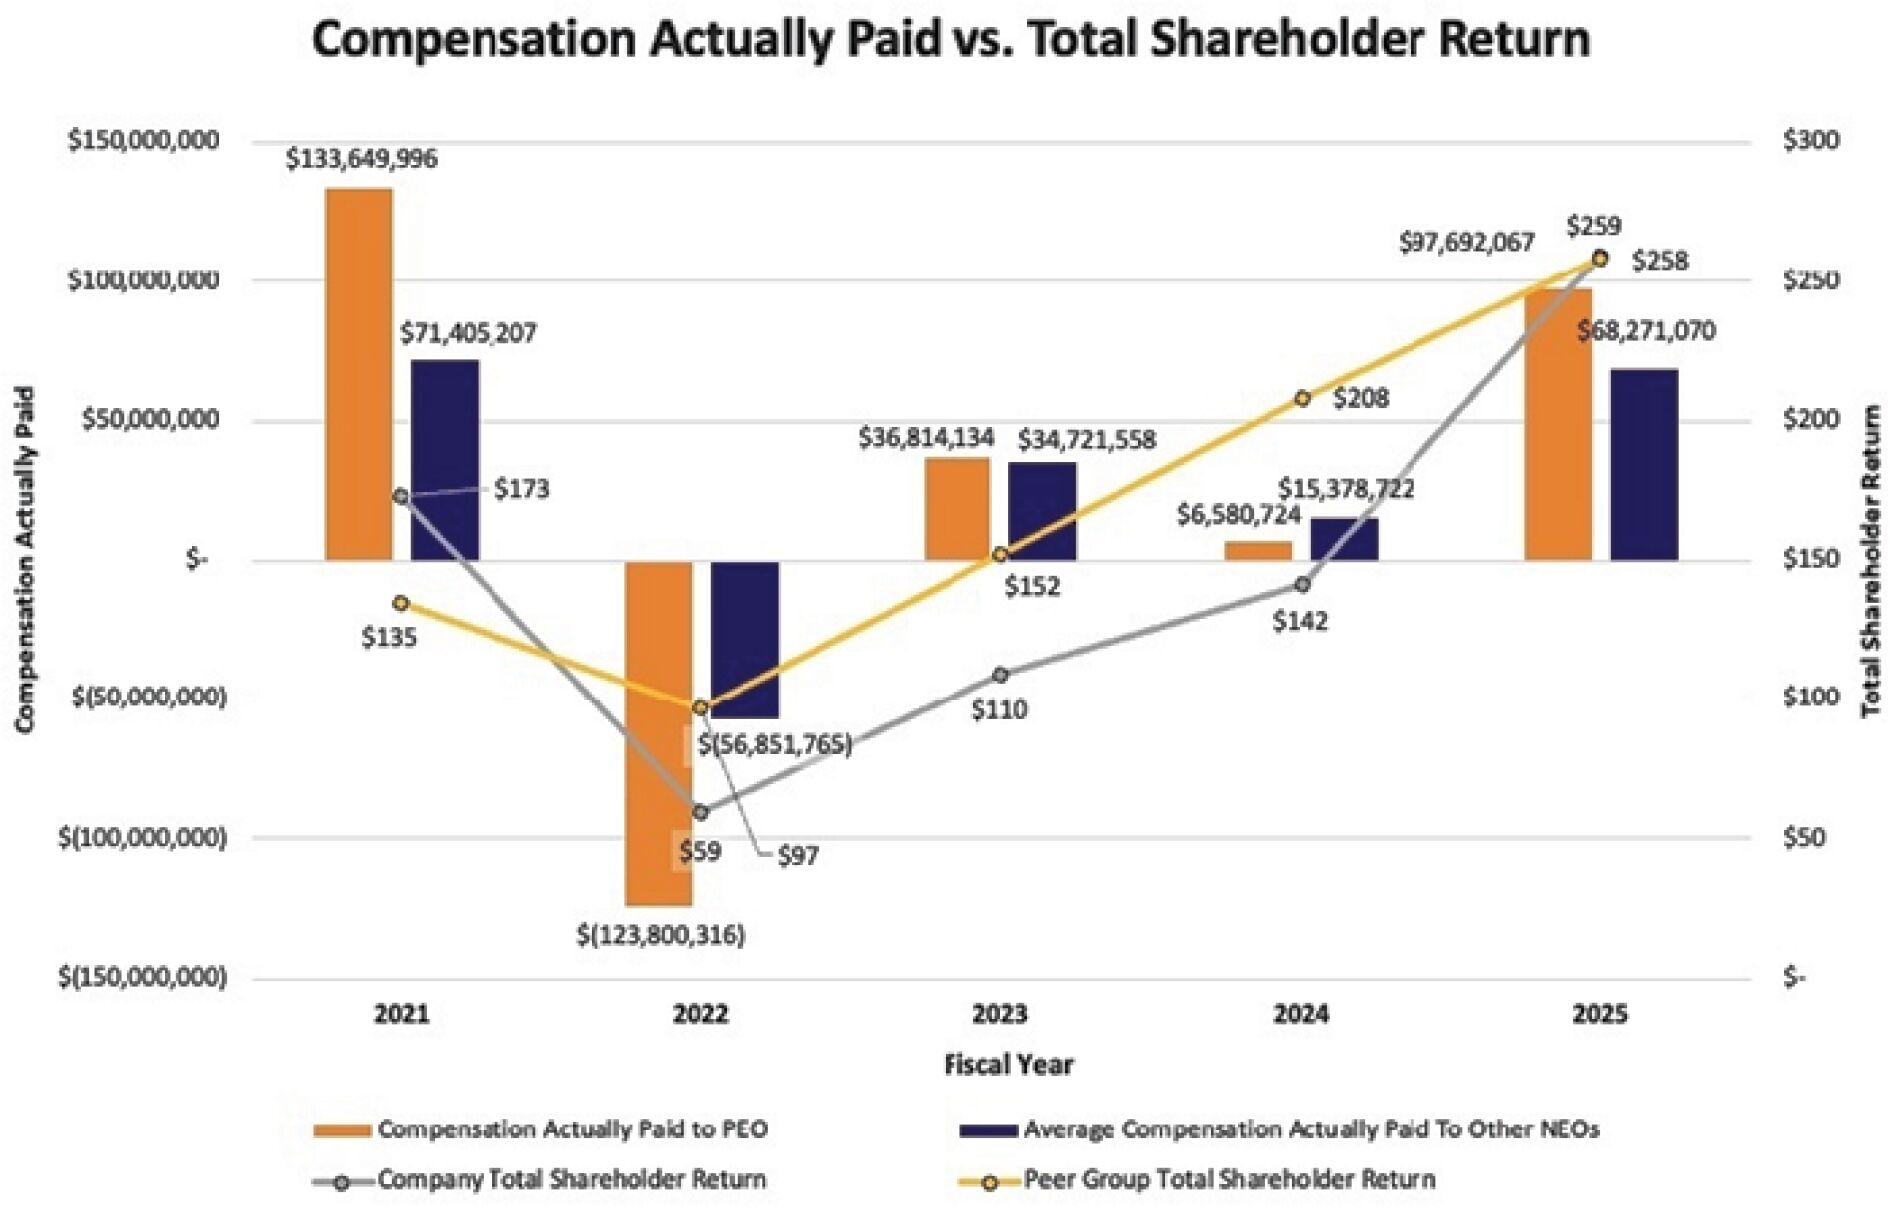
Compensation Actually Paid and Net Income (Loss)
The following graph shows the relationships between the amount of CAP to Mr. Prince, the average amount of CAP to the
non-PEO
NEOs, and our net income (loss) over the five years presented in the Pay Versus Performance Table. 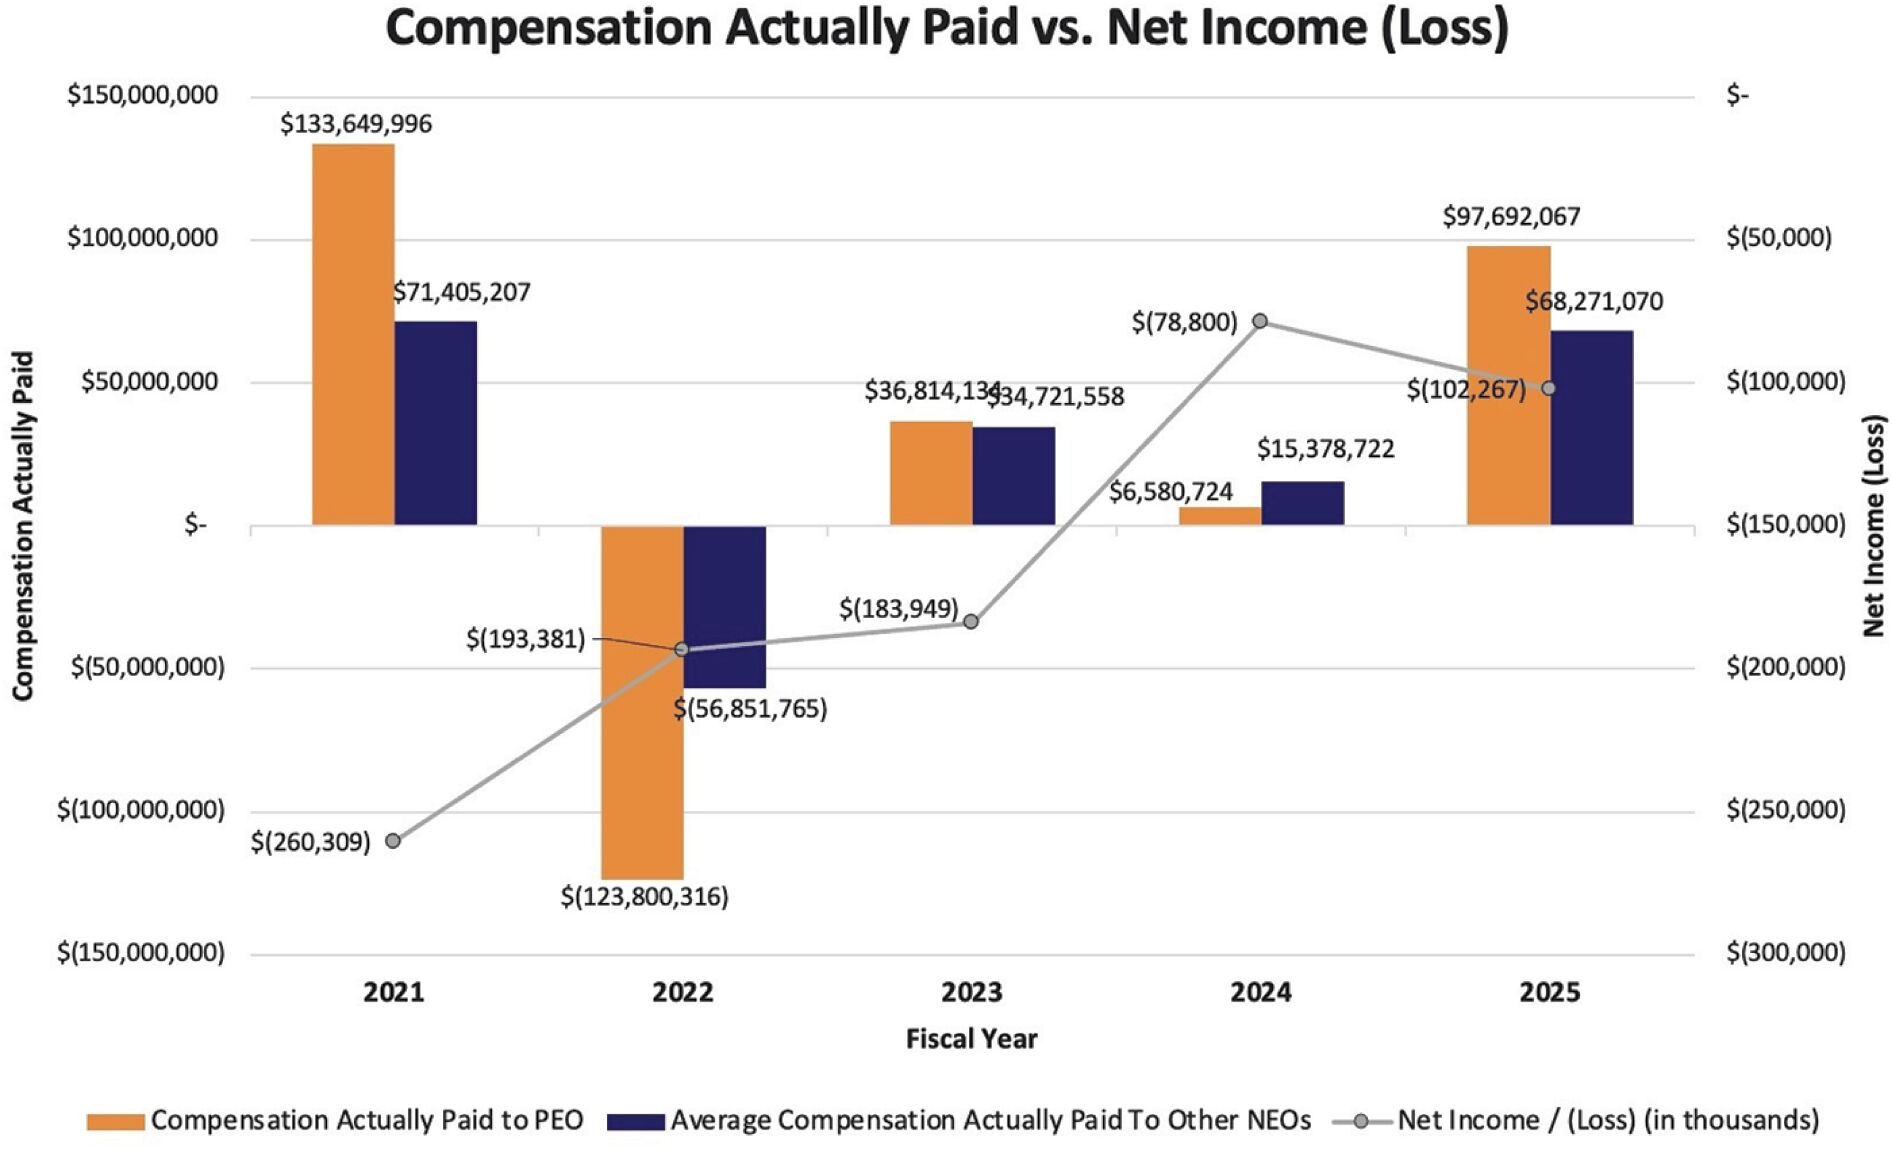
Compensation Actually Paid and Revenue
The following graph shows the relationships between the amount of CAP to Mr. Prince, the average amount of CAP to the
non-PEO
NEOs, and our revenue over the five years presented in the Pay Versus Performance Table. 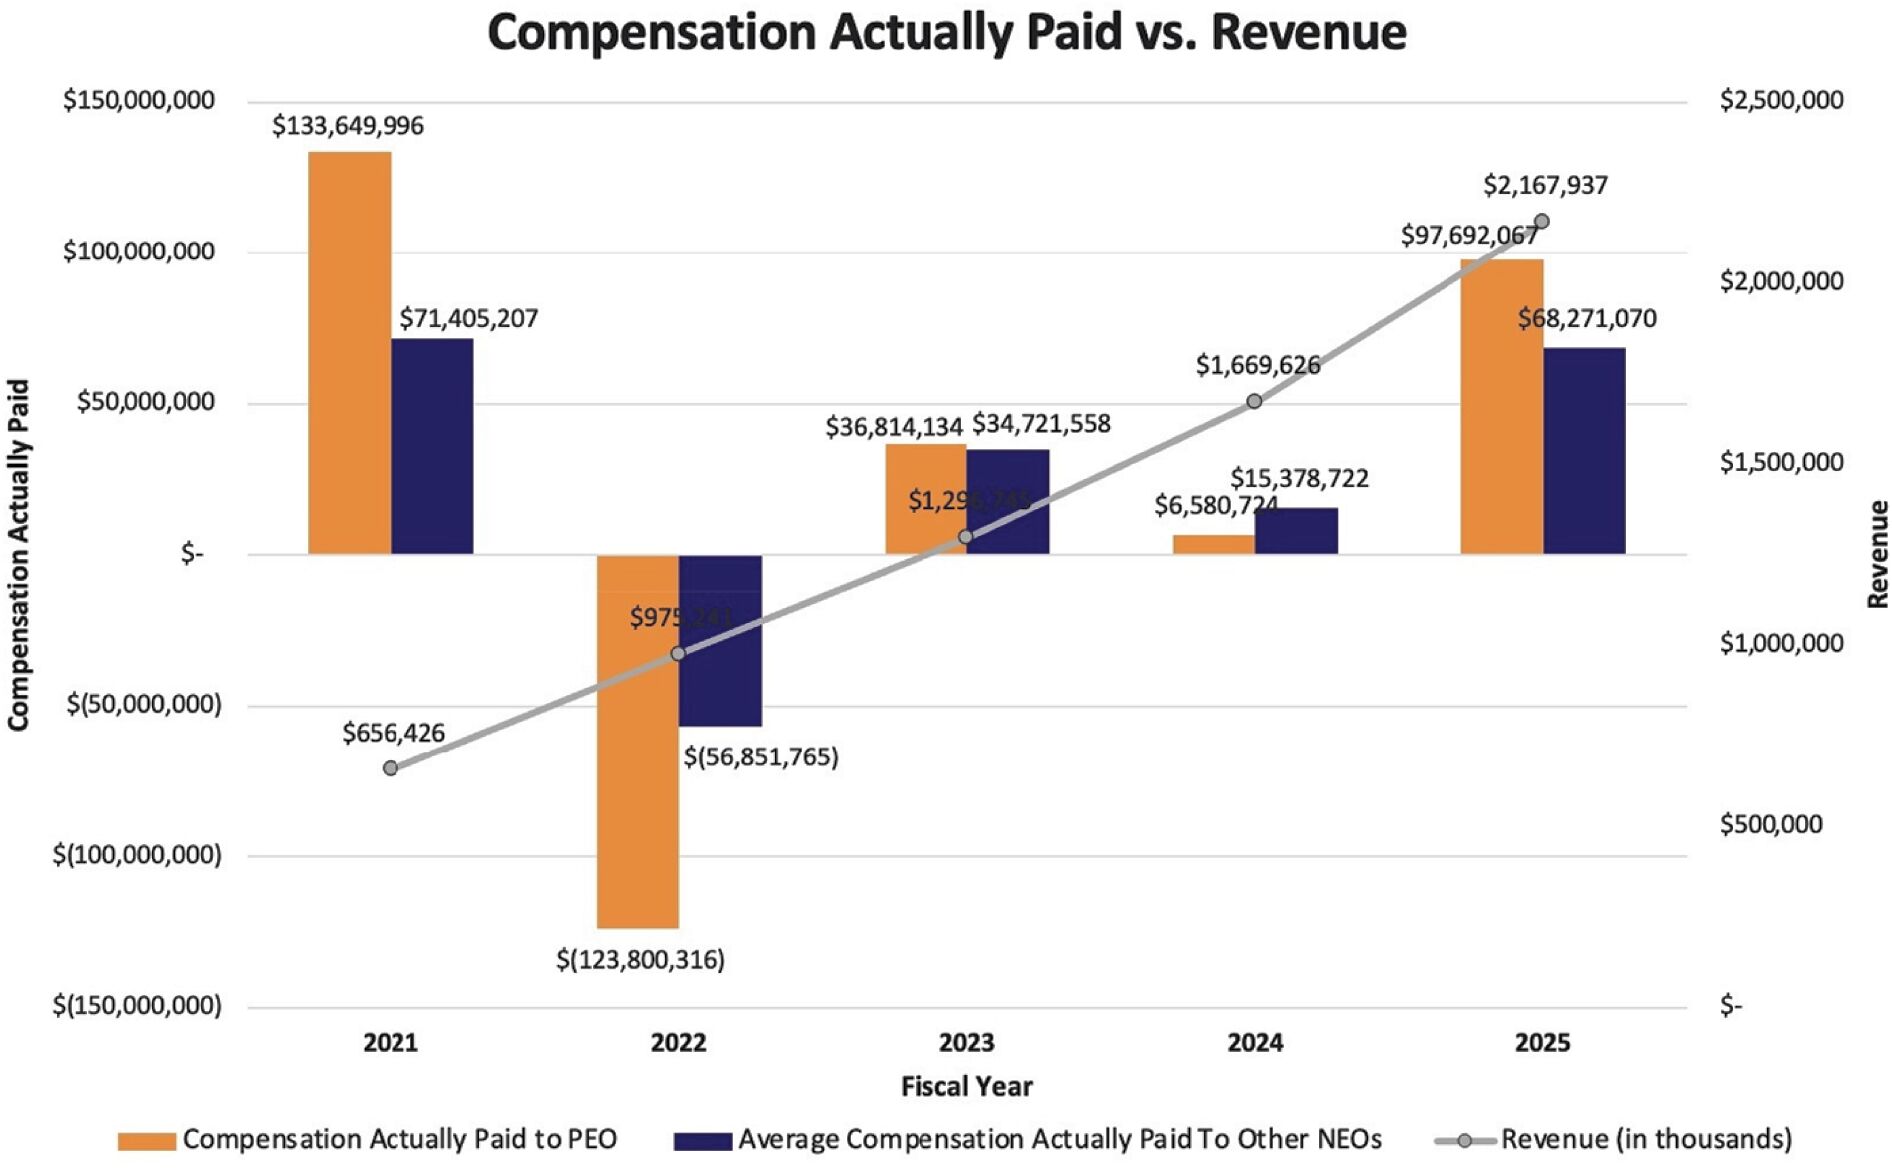
Compensation Actually Paid and Total Shareholder Return
The following graph shows the relationships between the amount of CAP to Mr. Prince, the average amount of CAP to the
non-PEO
NEOs, our cumulative TSR, and the cumulative TSR of our peer group over the five years presented in the Pay Versus Performance Table.
2025 Financial Performance Measures |
| Revenue |
| Gross Margin |
| Stock Price |
Total shareholder return (“TSR”) is the value of $100 at the end of the measurement period assuming an amount invested in our Class A
common
stock as of the beginning of the measurement period and reinvesting all dividends. We have not paid dividends historically. The amounts reported represent our net income (loss), as reflected in our audited financial statements for the applicable year as included in our 2025 Annual Report.
| (8) | The amounts reported represent our revenue, as reflected in our audited financial statements for the applicable year as included in our 2025 Annual Report. While we use several financial performance measures for purposes of our compensation programs, we have determined that revenue is the financial performance measure that, in our assessment, represents the most important performance measure (that is not otherwise required to be disclosed in the table) used by us to link CAP to the named executive officers, for the most recently completed fiscal year, to the our performance. |