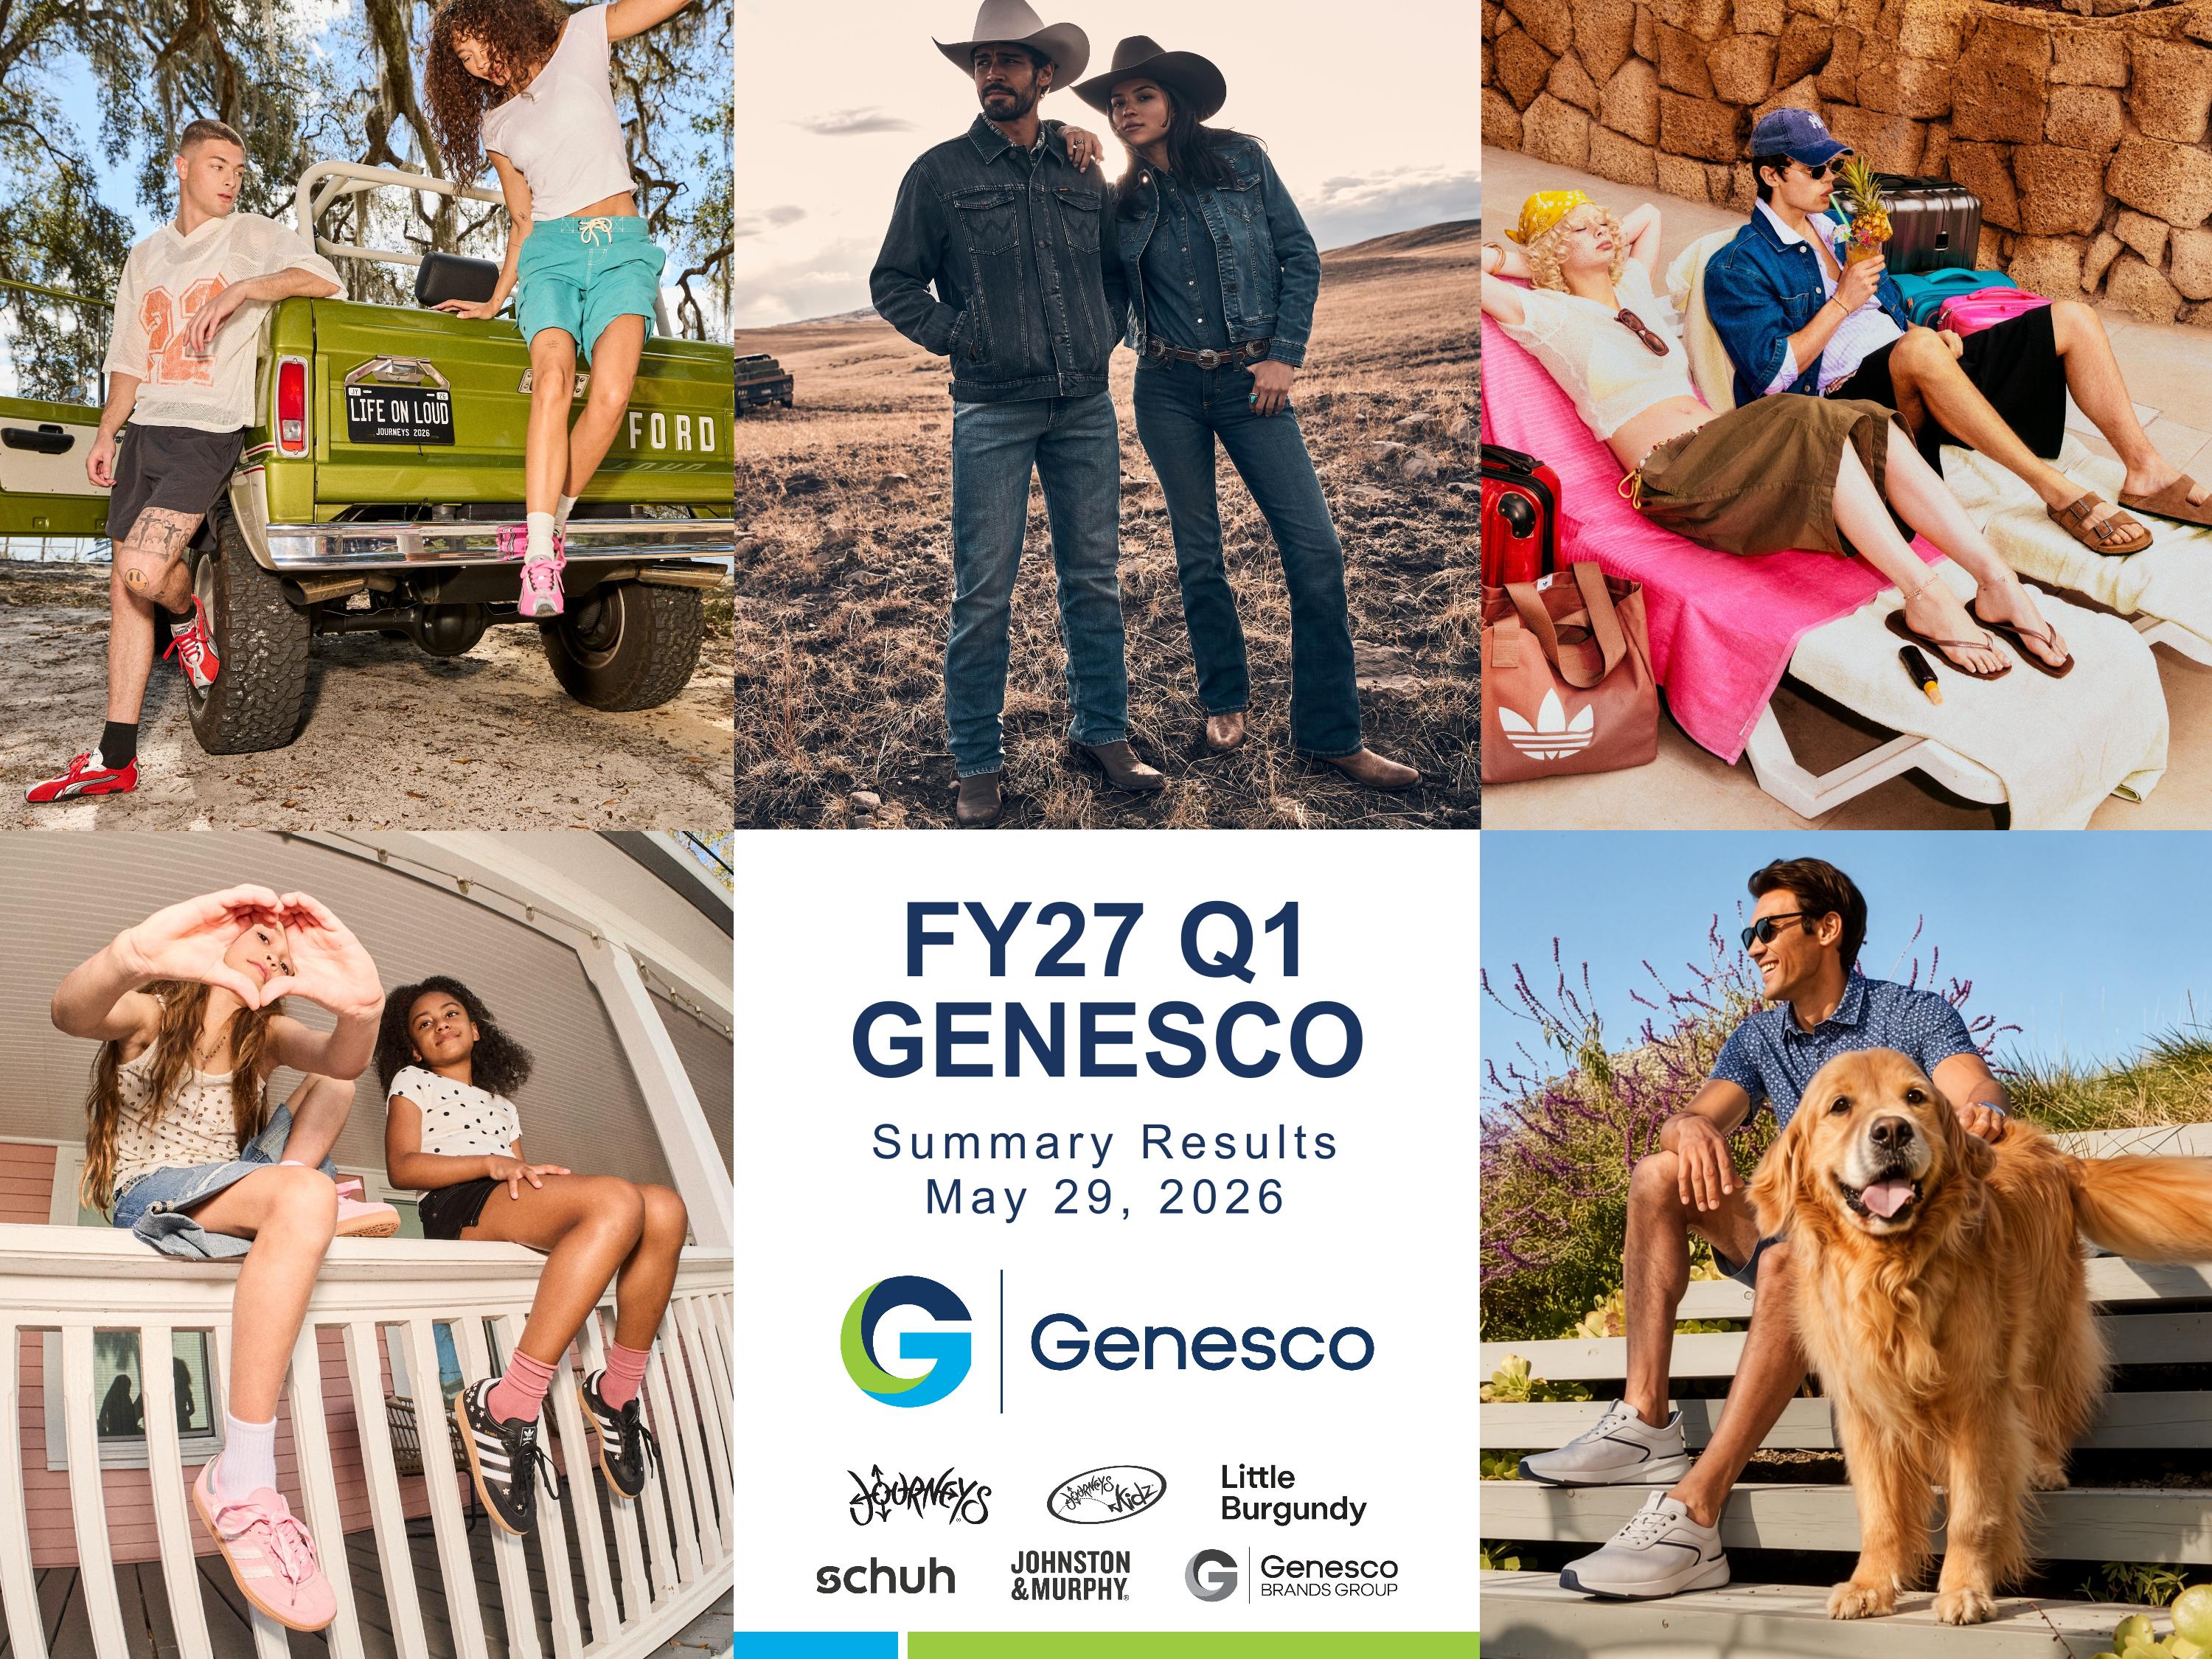
FY27 Q1 GENESCO Summary Results May 29, 2026 Exhibit 99.2
This presentation contains forward-looking statements, including those regarding future sales, earnings, operating income, gross margins, expenses, tariff refunds, capital expenditures, depreciation and amortization, tax rates, store openings and closures, cost reductions, and all other statements not addressing solely historical facts or present conditions. Forward-looking statements are usually identified by or are associated with such words as “intend,” “expect,” “feel,” “should,” “believe,” “anticipate,” “optimistic,” “confident” and similar terminology. Actual results could vary materially from the expectations reflected in these statements. A number of factors could cause differences. These include adjustments to projections reflected in forward-looking statements, including those resulting from weakness in store, e-commerce and shopping mall traffic, the imposition of tariffs (including the timing and amount thereof) on products imported by the Company or its vendors as well as the ability and costs to move production of products in response to tariffs; the amount and timing of any tariff refunds; our ability to pass on price increases to our customers; restrictions on operations imposed by government entities and/or landlords, changes in public safety and health requirements, and limitations on the Company’s ability to adequately staff and operate stores. Differences from expectations could also result from store closures and effects on the business as a result of the level of consumer spending on our merchandise and interest in our brands and in general; the level and timing of promotional activity necessary to maintain inventories at appropriate levels; the Company’s ability to obtain from suppliers products that are in-demand on a timely basis and effectively manage disruptions in product supply or distribution, including disruptions as a result of pandemics or geopolitical events, including shipping disruptions near crucial trade routes; unfavorable trends in fuel costs, foreign exchange rates, foreign labor and material costs, and other factors affecting the cost of products; a disruption in shipping or increase in cost of our imported products, and other factors affecting the cost of products; our dependence on third-party vendors and licensors for the products we sell; store closures and effects on the business as a result of civil disturbances; our ability to renew our license agreements; impacts of the ongoing geopolitical conflicts around the world including, without limitation, the conflict with Iran; and other sources of market weakness in the locations in which we operate; the effectiveness of the Company's omnichannel initiatives; costs associated with shareholder activism; costs associated with changes in minimum wage and overtime requirements; wage pressures; labor shortages; the effects of inflation; the evolving regulatory landscape related to our use of social media; weakness in the consumer economy and retail industry; competition and fashion trends in the Company's markets, including trends with respect to the popularity of casual and dress footwear; any failure to increase sales at our existing stores, given our high fixed expense cost structure, and in our e -commerce businesses; risks related to the potential for terrorist events; changes in buying patterns by significant wholesale customers; changes in consumer preferences; our ability to continue to complete and integrate acquisitions; our ability to expand our business and diversify our product base; impairment of goodwill in connection with acquisitions; payment related risks that could increase our operating cost, expose us to fraud or theft, subject us to potential liability and disrupt our business; and changes in the timing of holidays or in the onset of seasonal weather affecting period-to-period sales comparisons. Additional factors that could cause differences from expectations include the ability to secure allocations to refine product assortments to address consumer demand; the ability to renew leases in existing stores and control or lower occupancy costs, to open or close stores in the number and on the planned schedule, and to conduct required remodeling or refurbishment on schedule and at expected expense levels; the Company’s ability to realize anticipated cost savings, including rent savings and savings in connection with the restructuring of the Company’s information technology functions; the amount and timing of share repurchases; our ability to make our occupancy costs more variable; the Company’s ability to achieve expected digital gains and gain market share; deterioration in the performance of individual businesses or of the Company's market value relative to its book value, resulting in impairments of fixed assets, operating lease right of use assets or intangible assets or other adverse financial consequences and the timing and amount of such impairments or other consequences; unexpected changes to the market for the Company's shares or for the retail sector in general; costs and reputational harm as a result of disruptions in the Company’s business or information technology systems either by security breaches and incidents or by potential problems associated with the implementation of new or upgraded systems or as the result of the restructuring of the Company’s information technology functions; changes in tax laws and tax rates and the Company’s ability to realize any anticipated tax benefits in both the amount and timeframe anticipated; and the cost and outcome of litigation, investigations, environmental matters and other disputes involving the Company. Additional factors are cited in the "Risk Factors," "Legal Proceedings" and "Management's Discussion and Analysis of Financial Condition and Results of Operations" sections of, and elsewhere in, the Company’s SEC filings, copies of which may be obtained from the SEC website, www.sec.gov, or by contacting the investor relations department of Genesco via the Company’s website, www.genesco.com. Many of the factors that will determine the outcome of the subject matter of this release are beyond Genesco's ability to control or predict. Genesco undertakes no obligation to release publicly the results of any revisions to these forward-looking statements that may be made to reflect events or circumstances after the date hereof or to reflect the occurrence of unanticipated events. Forward-looking statements reflect the expectations of the Company at the time they are made. The Company disclaims any obligation to update such statements. Safe Harbor Statement
We report consolidated financial results in accordance with generally accepted accounting principles (“GAAP”). However, to supplement these consolidated financial results our presentation includes certain non-GAAP financial measures such as earnings (loss) and earnings (loss) per share and operating income (loss). This supplemental information should not be considered in isolation as a substitute for related GAAP measures. We believe that disclosure of earnings (loss) and earnings (loss) per share from continuing operations and operating income (loss) adjusted for the items not reflected in the previously announced expectations will be meaningful to investors, especially in light of the impact of such items on the results. Reconciliations of the non-GAAP supplemental information to the comparable GAAP measures can be found in the Appendix. Non-GAAP • Financial Measures
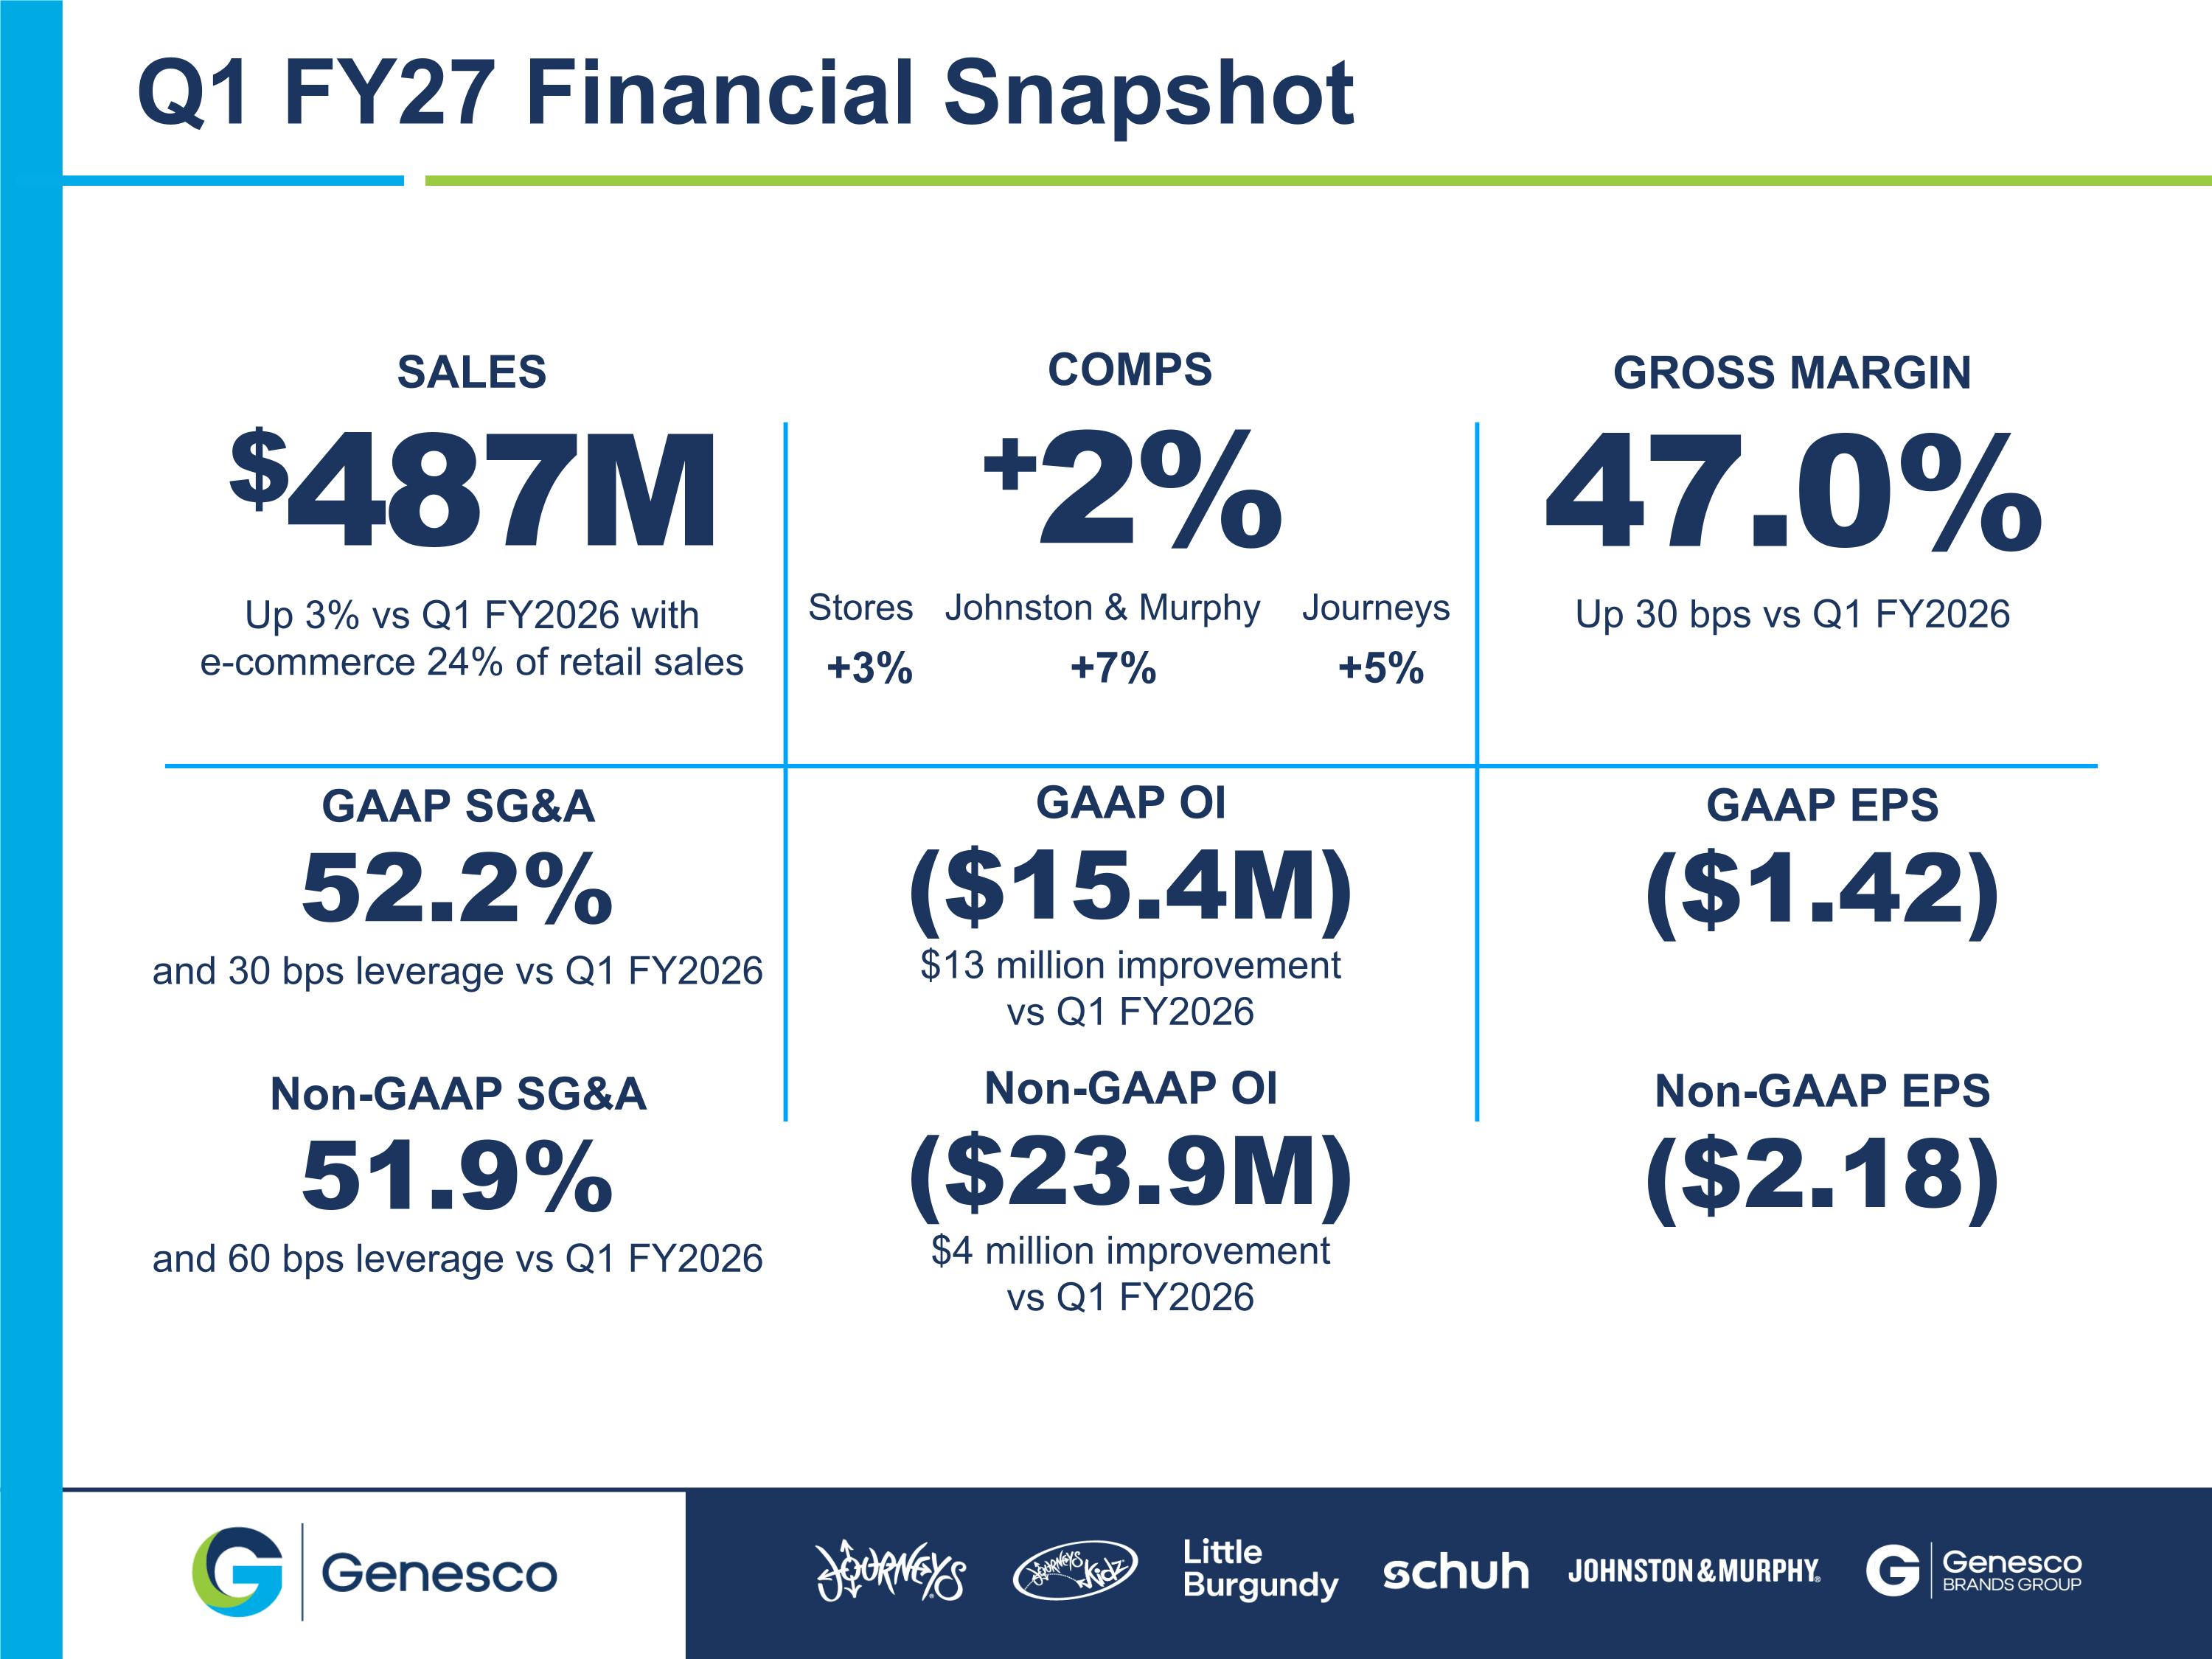
SALES $487M Up 3% vs Q1 FY2026 with e-commerce 24% of retail sales GROSS MARGIN 47.0% Up 30 bps vs Q1 FY2026 GAAP SG&A 52.2% and 30 bps leverage vs Q1 FY2026 Non-GAAP SG&A 51.9% and 60 bps leverage vs Q1 FY2026 COMPS +2% Stores Johnston & Murphy Journeys +3% +7% +5% GAAP OI ($15.4M) $13 million improvement vs Q1 FY2026 Non-GAAP OI ($23.9M) $4 million improvement vs Q1 FY2026 Q1 FY27 Financial Snapshot GAAP EPS ($1.42) Non-GAAP EPS ($2.18)
The first quarter exceeded our expectations with increased sales and gross margin along with meaningful expense leverage for 100 basis points of adjusted operating income improvement Overall comps grew 2%, marking the seventh consecutive quarter of positive comps for the company Stores continued positive growth with comps up 3% Journeys added to comp run with 5% comp growth on top of 8% increase last year Johnston & Murphy delivered 7% comps, a meaningful acceleration Adjusted selling and administrative expenses leveraged 60 basis points primarily due to our ongoing cost savings initiatives; Journeys delivered 190 basis points of expense leverage Company raises full-year EPS outlook and announces cost program Q1 FY27 Highlights
We unite footwear-led brands that inspire consumers with elevated, on-trend style Footwear First Strategy
Footwear is what we know, and our brands are where we win. By combining winning assortments, distinctive brands, and exceptional customer experiences, we attract more customers and create loyalty. Our people are our advantage. We have the teams, the skills, and the drive for success. What We Do
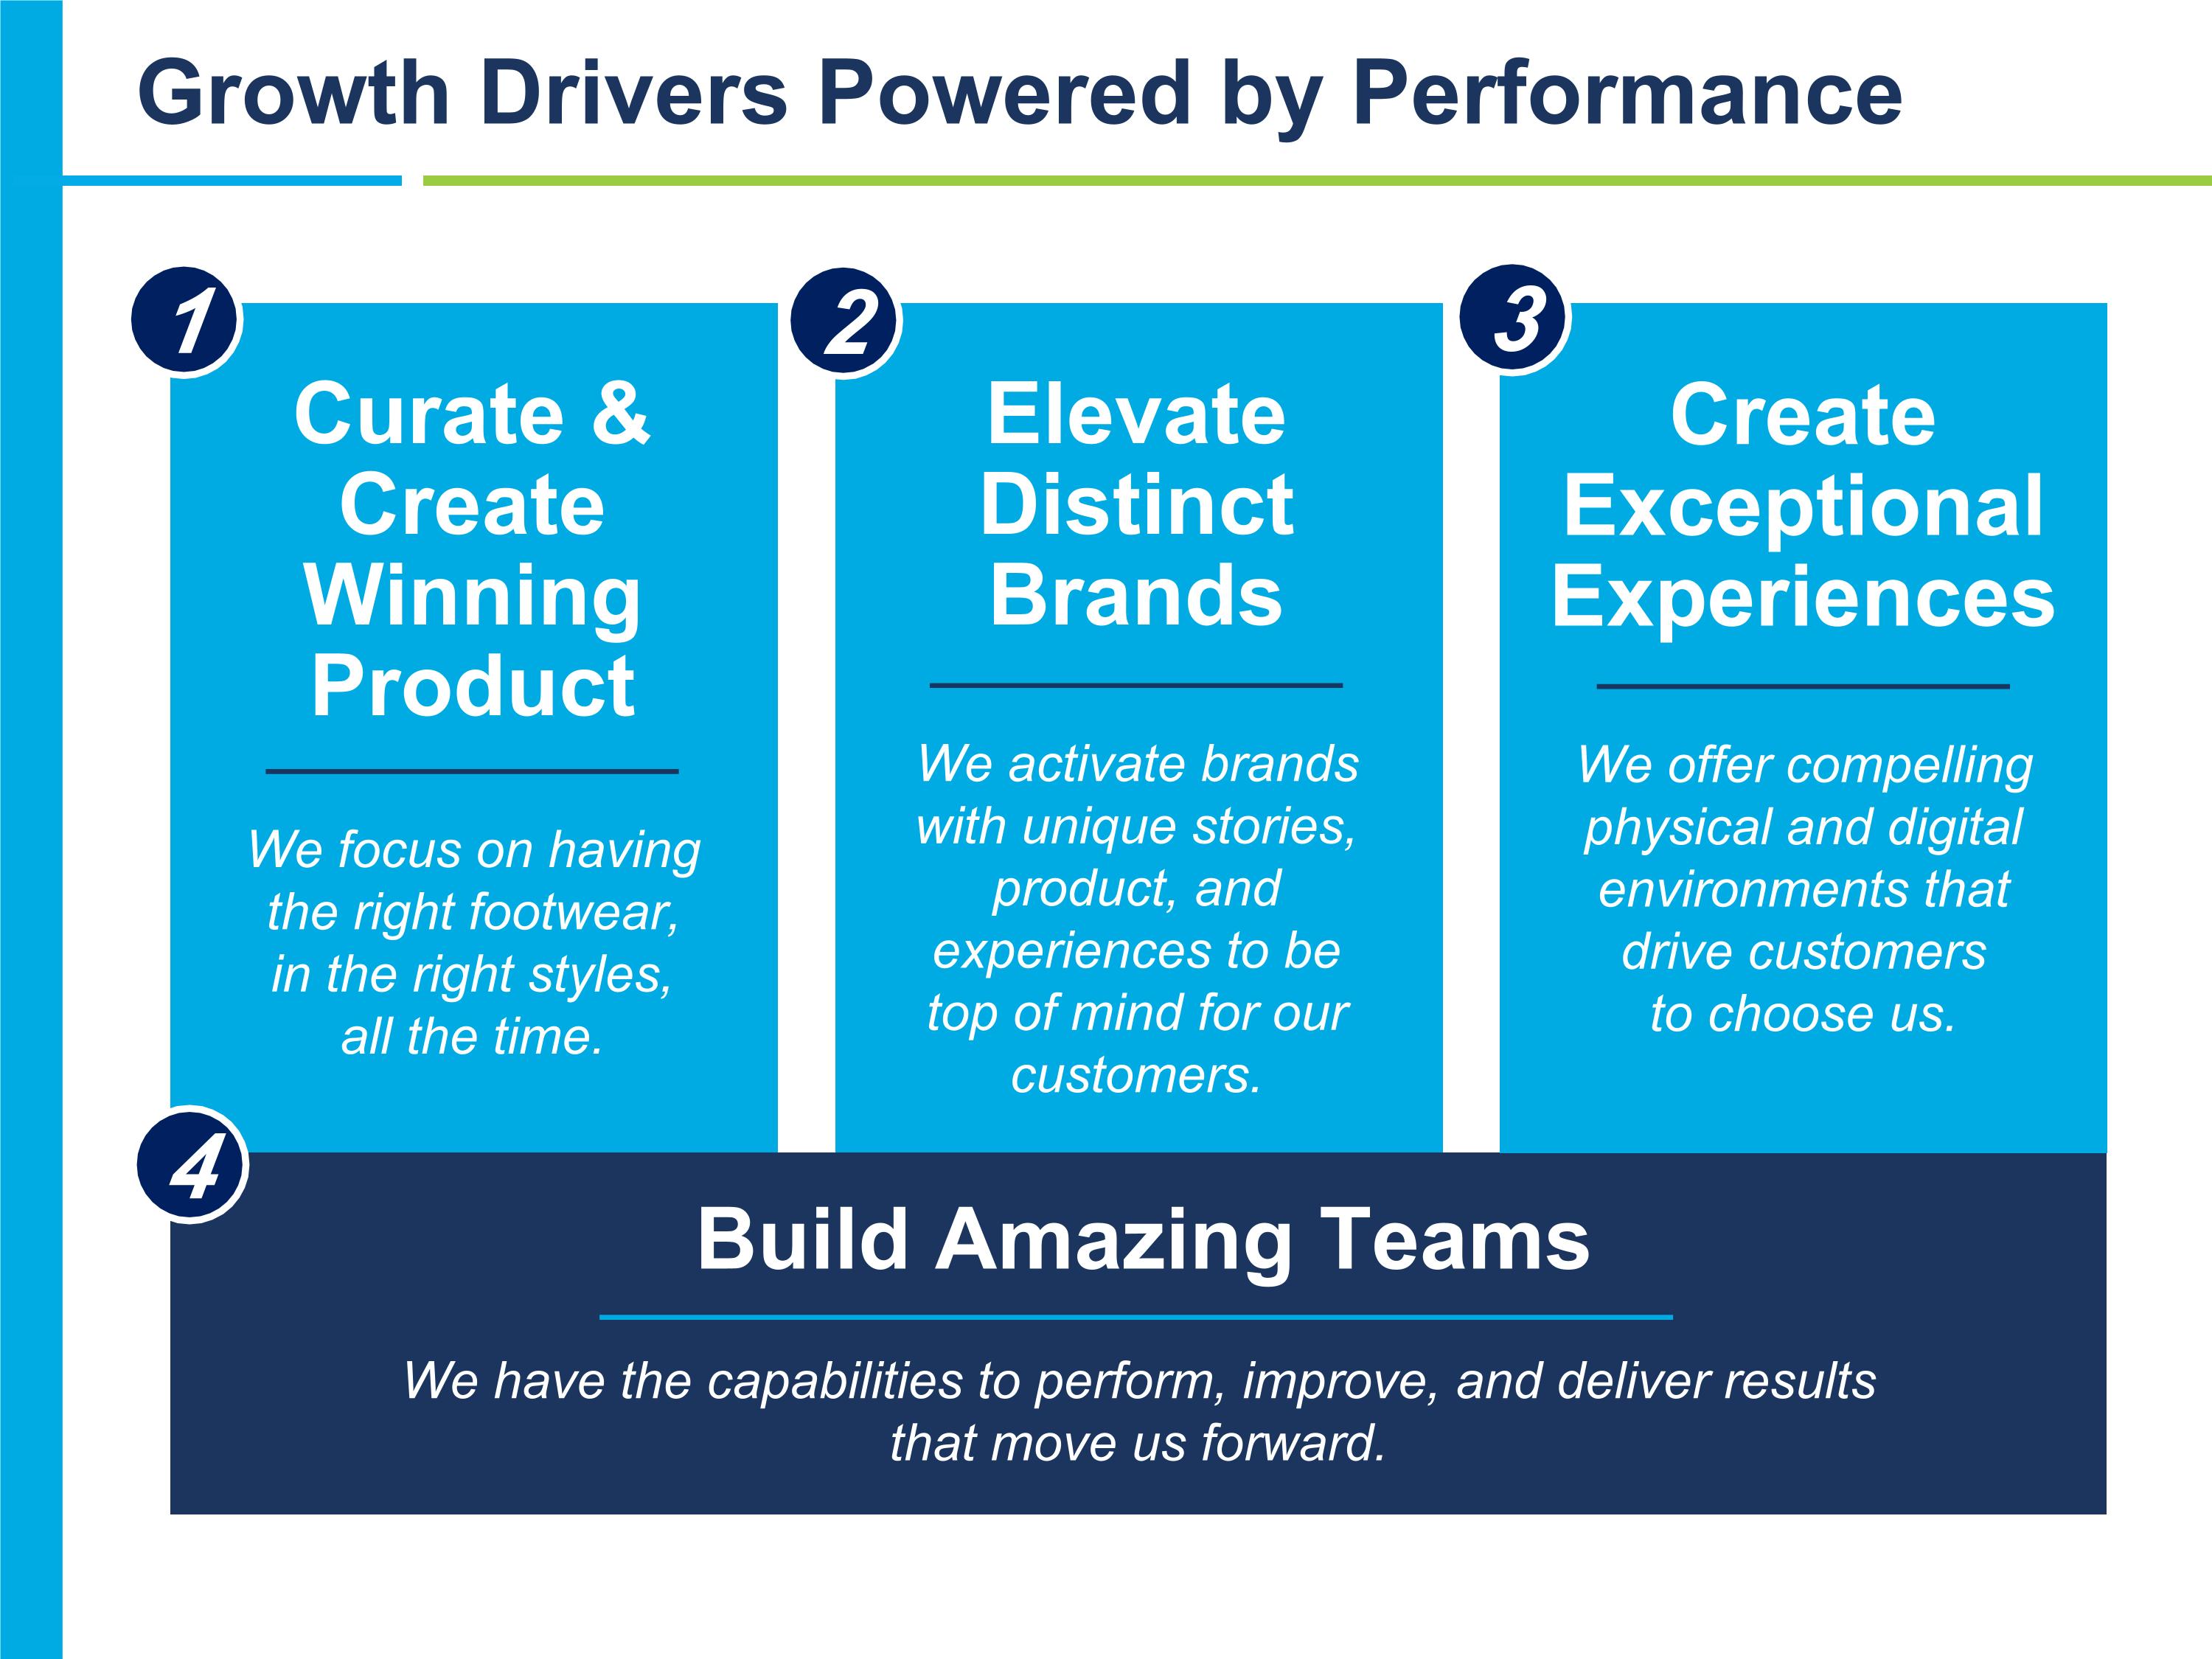
1 Curate & Create Winning Product We focus on having the right footwear, in the right styles, all the time. Elevate Distinct Brands We activate brands with unique stories, product, and experiences to be top of mind for our customers. Create Exceptional Experiences We offer compelling physical and digital environments that drive customers to choose us. Build Amazing Teams We have the capabilities to perform, improve, and deliver results that move us forward. Growth Drivers Powered by Performance 2 3 4
What is Journeys’ Strategic Growth Plan? Multi-Brand, multi-category offering to inspire the journey from one you to the next
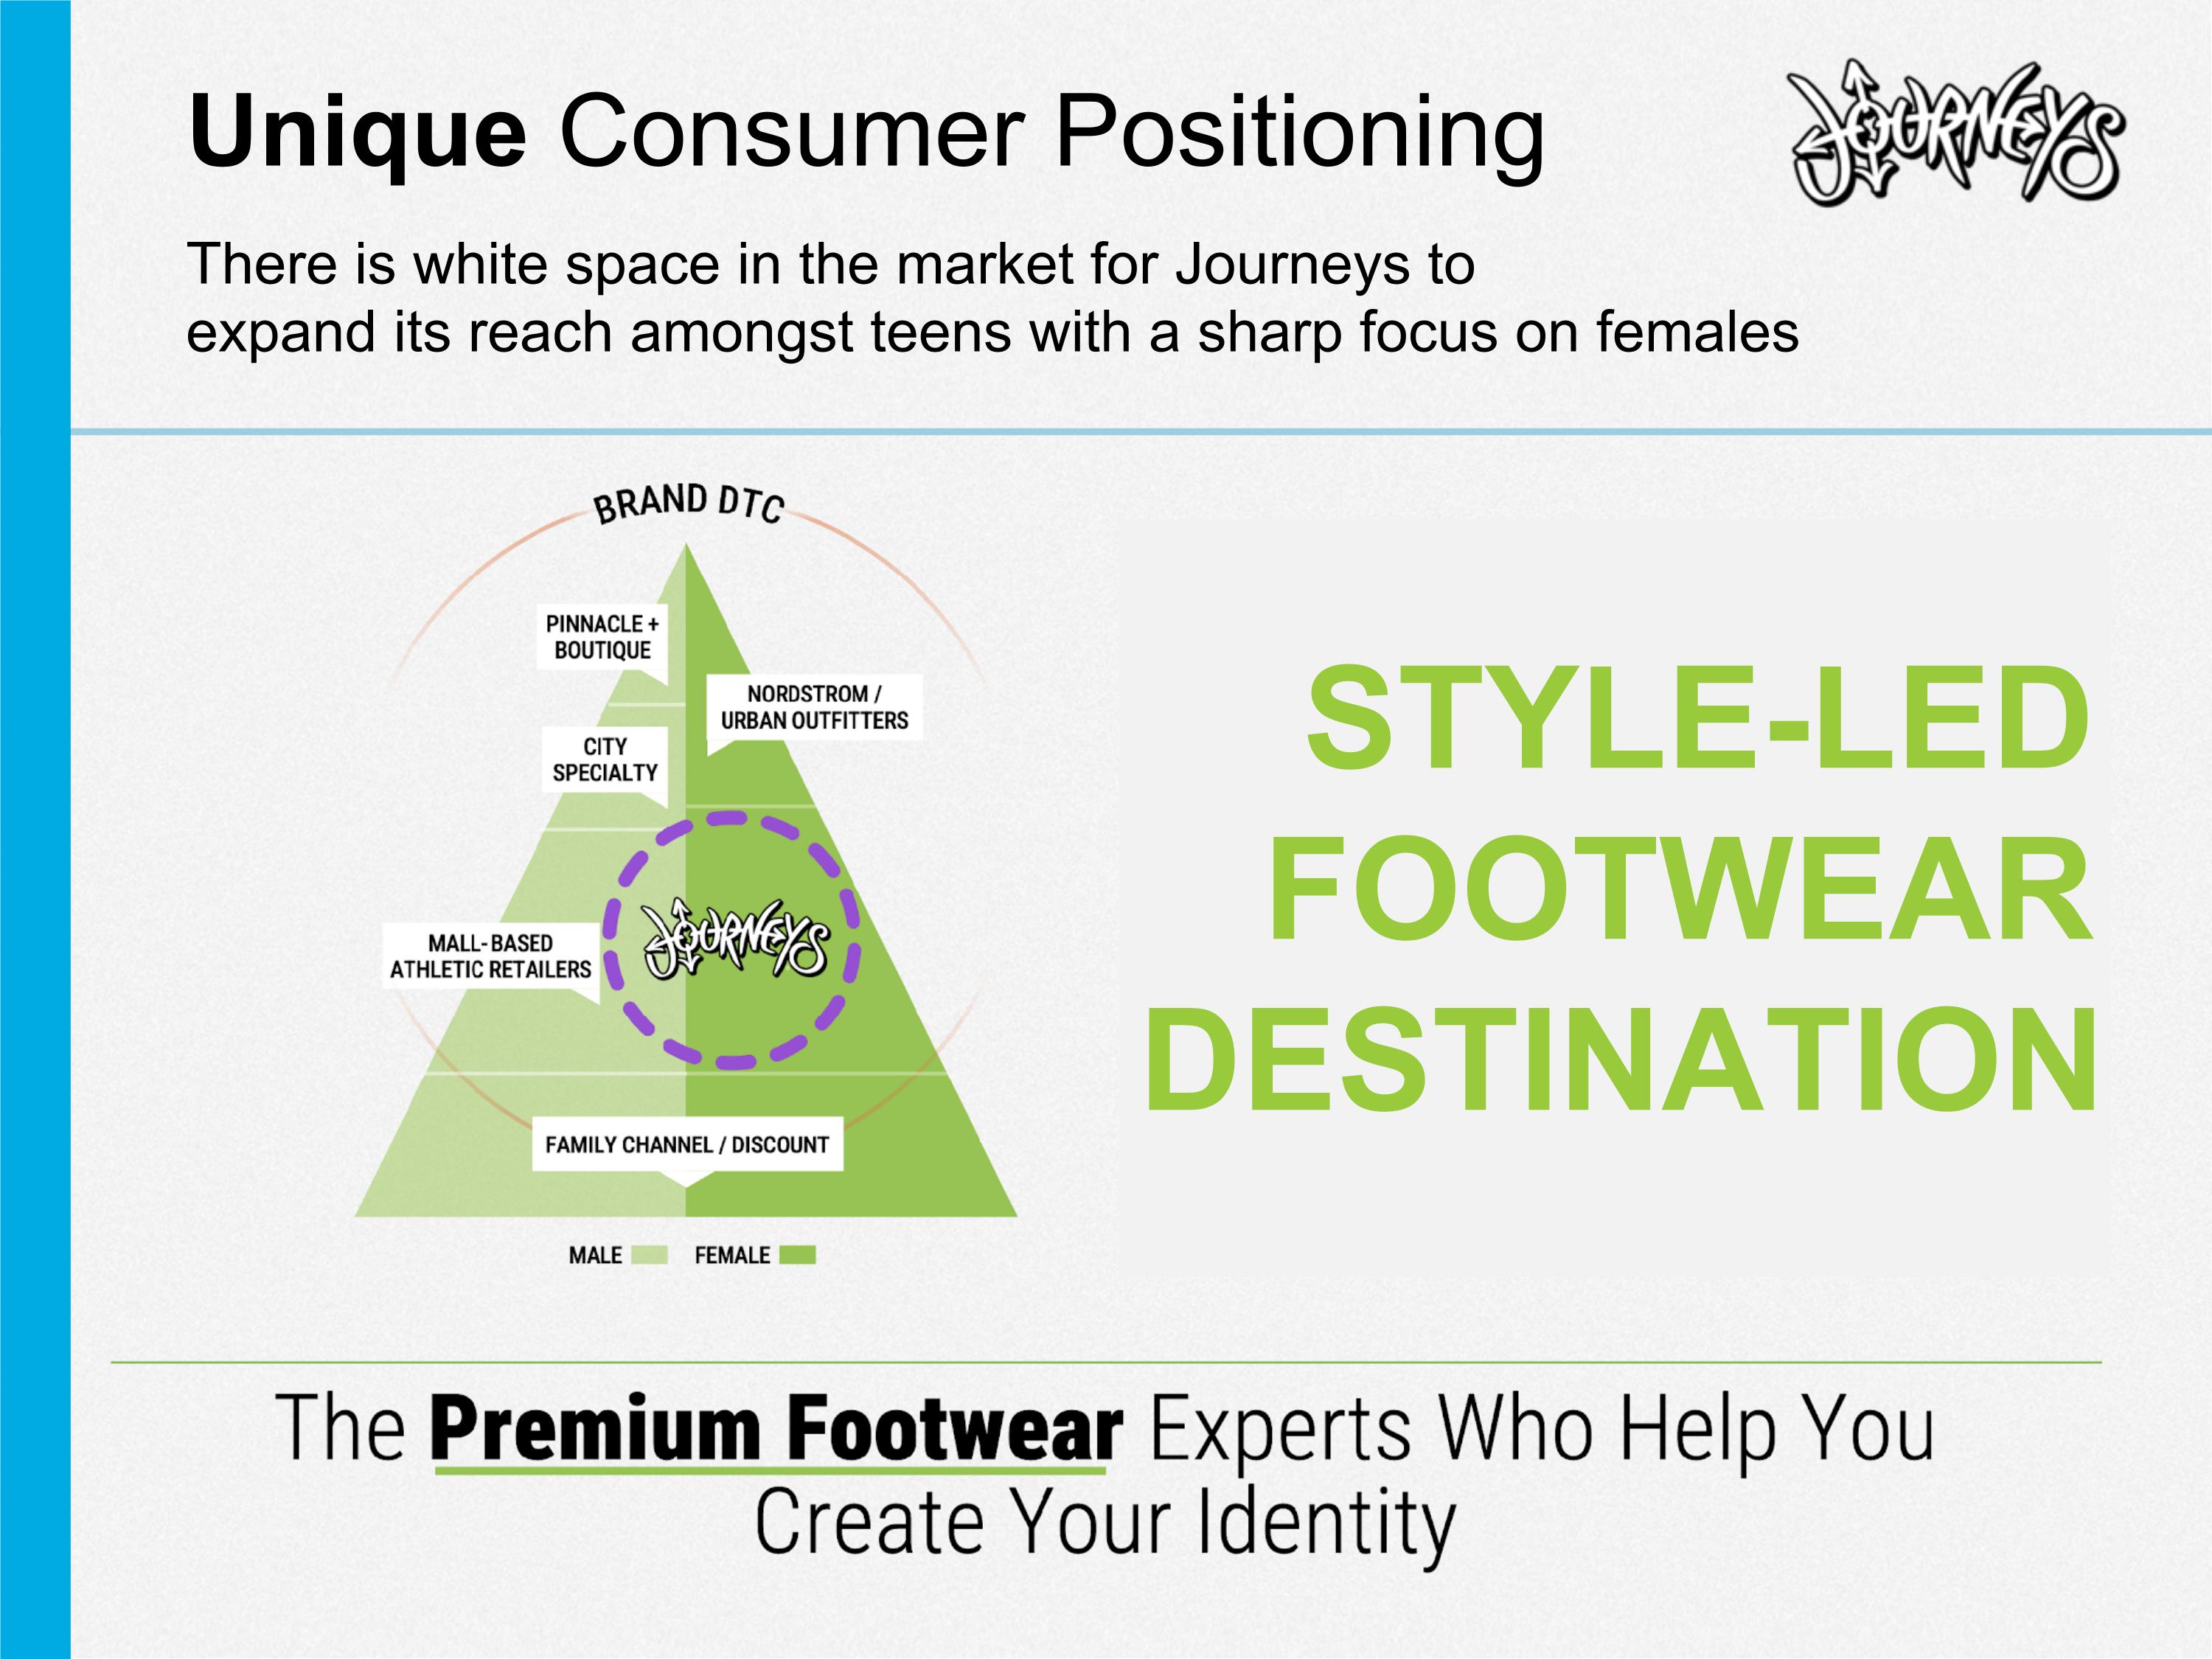
Unique Consumer Positioning There is white space in the market for Journeys to expand its reach amongst teens with a sharp focus on females STYLE-LED FOOTWEAR DESTINATION
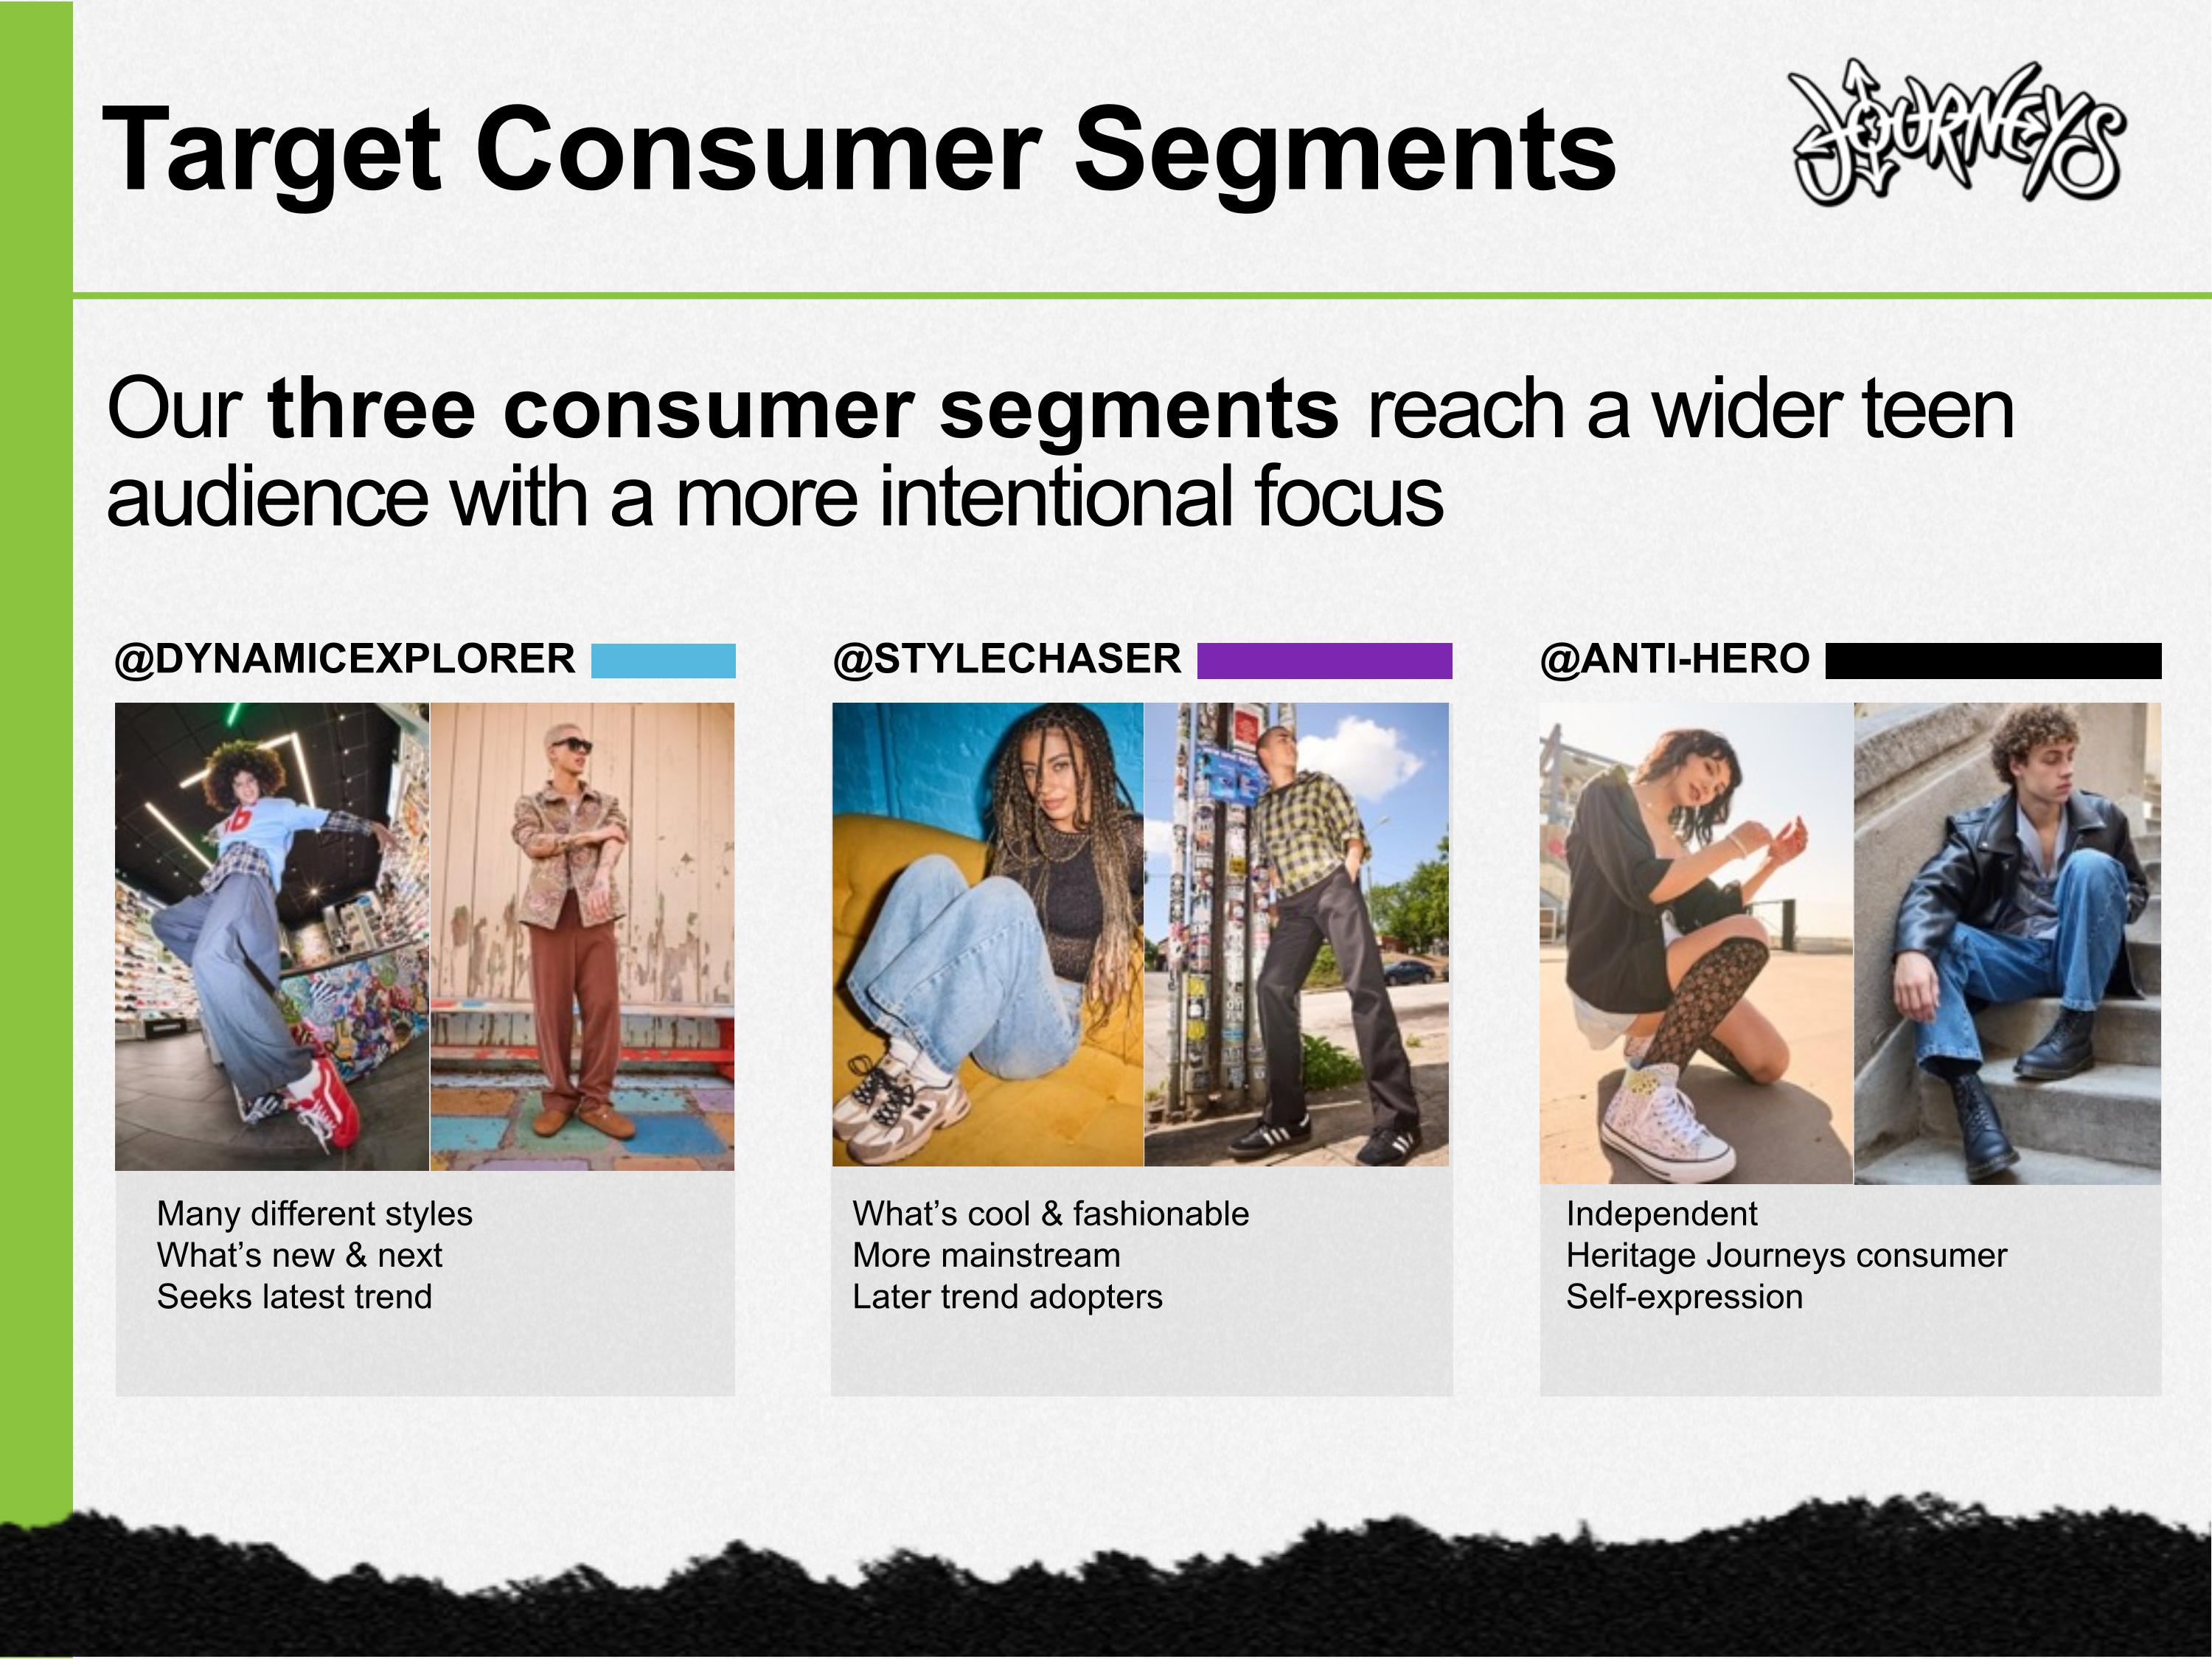
Our three consumer segments reach a wider teen audience with a more intentional focus Target Consumer Segments @STYLECHASER What’s cool & fashionable More mainstream Later trend adopters @ANTI-HERO Independent Heritage Journeys consumer Self-expression @DYNAMICEXPLORER Many different styles What’s new & next Seeks latest trend
STRATEGIES DIVERSIFY OUR FOOTWEAR LEADERSHIP BUILD OUR BRAND RE-IMAGINE OUR STORE FLEET DRIVE DIGITAL EVOLUTION UNLOCK THE POWER OF OUR PEOPLE
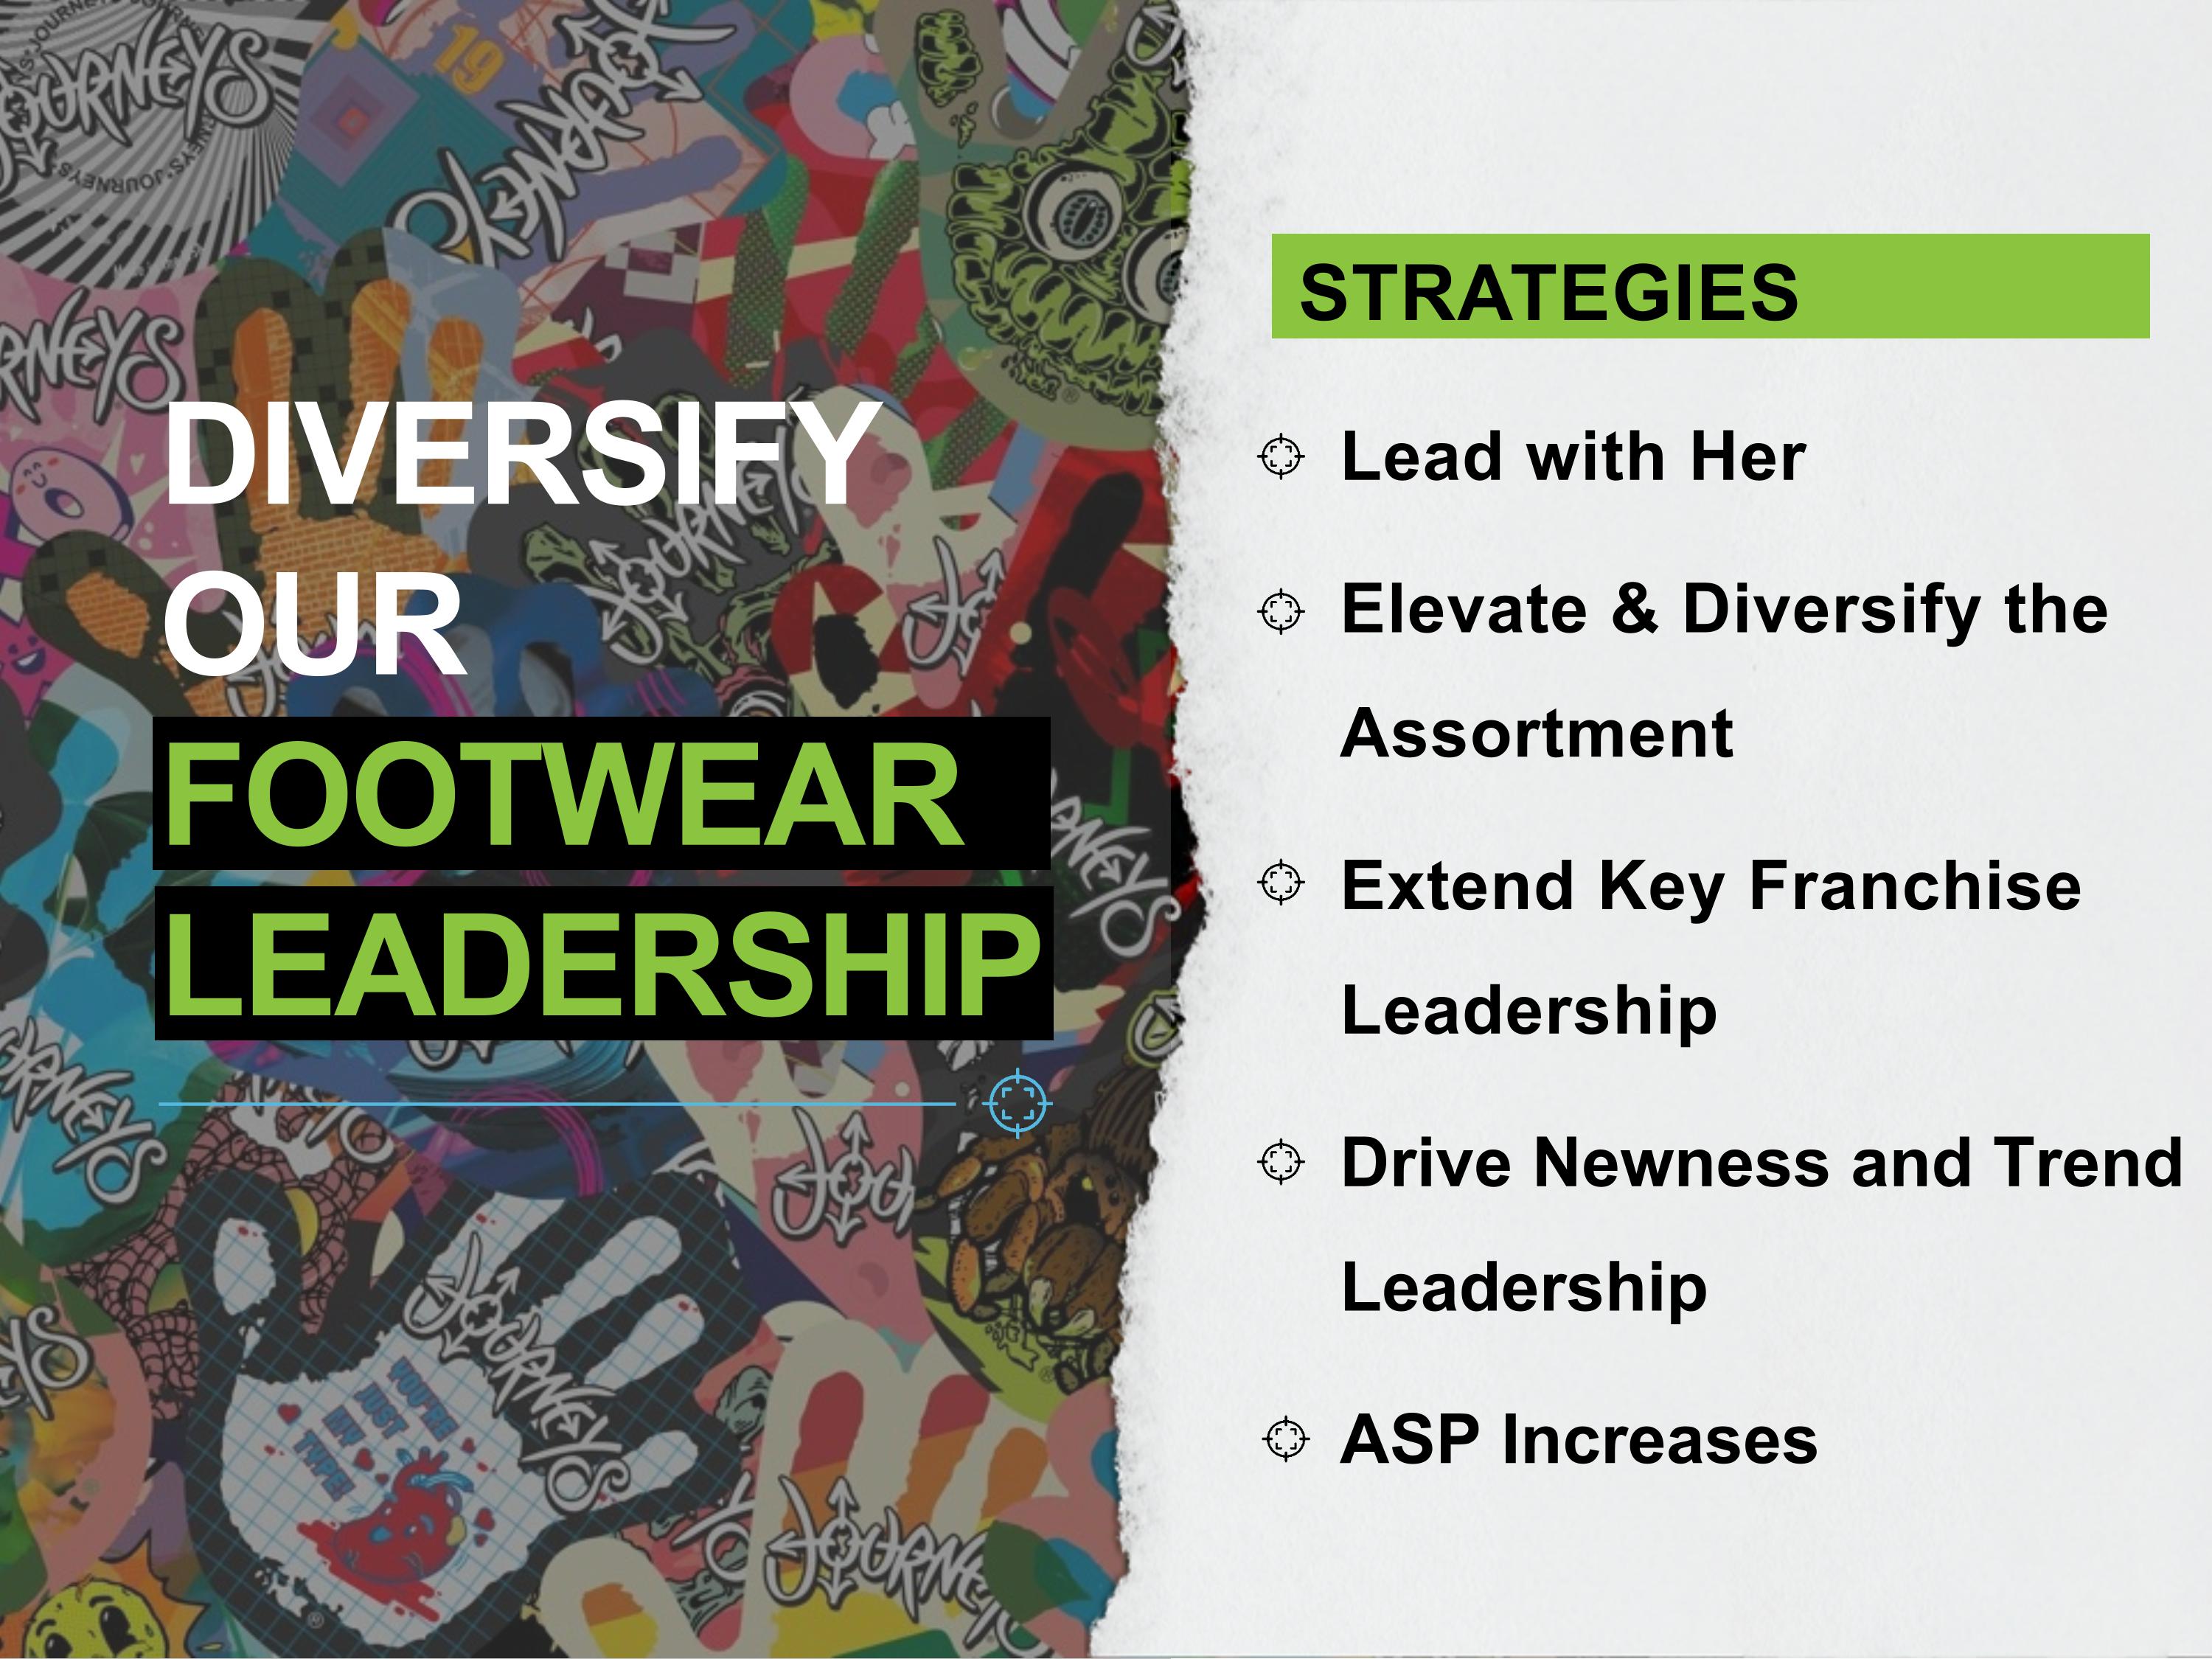
DIVERSIFY OUR FOOTWEAR LEADERSHIP STRATEGIES Lead with Her Elevate & Diversify the Assortment Extend Key Franchise Leadership Drive Newness and Trend Leadership ASP Increases
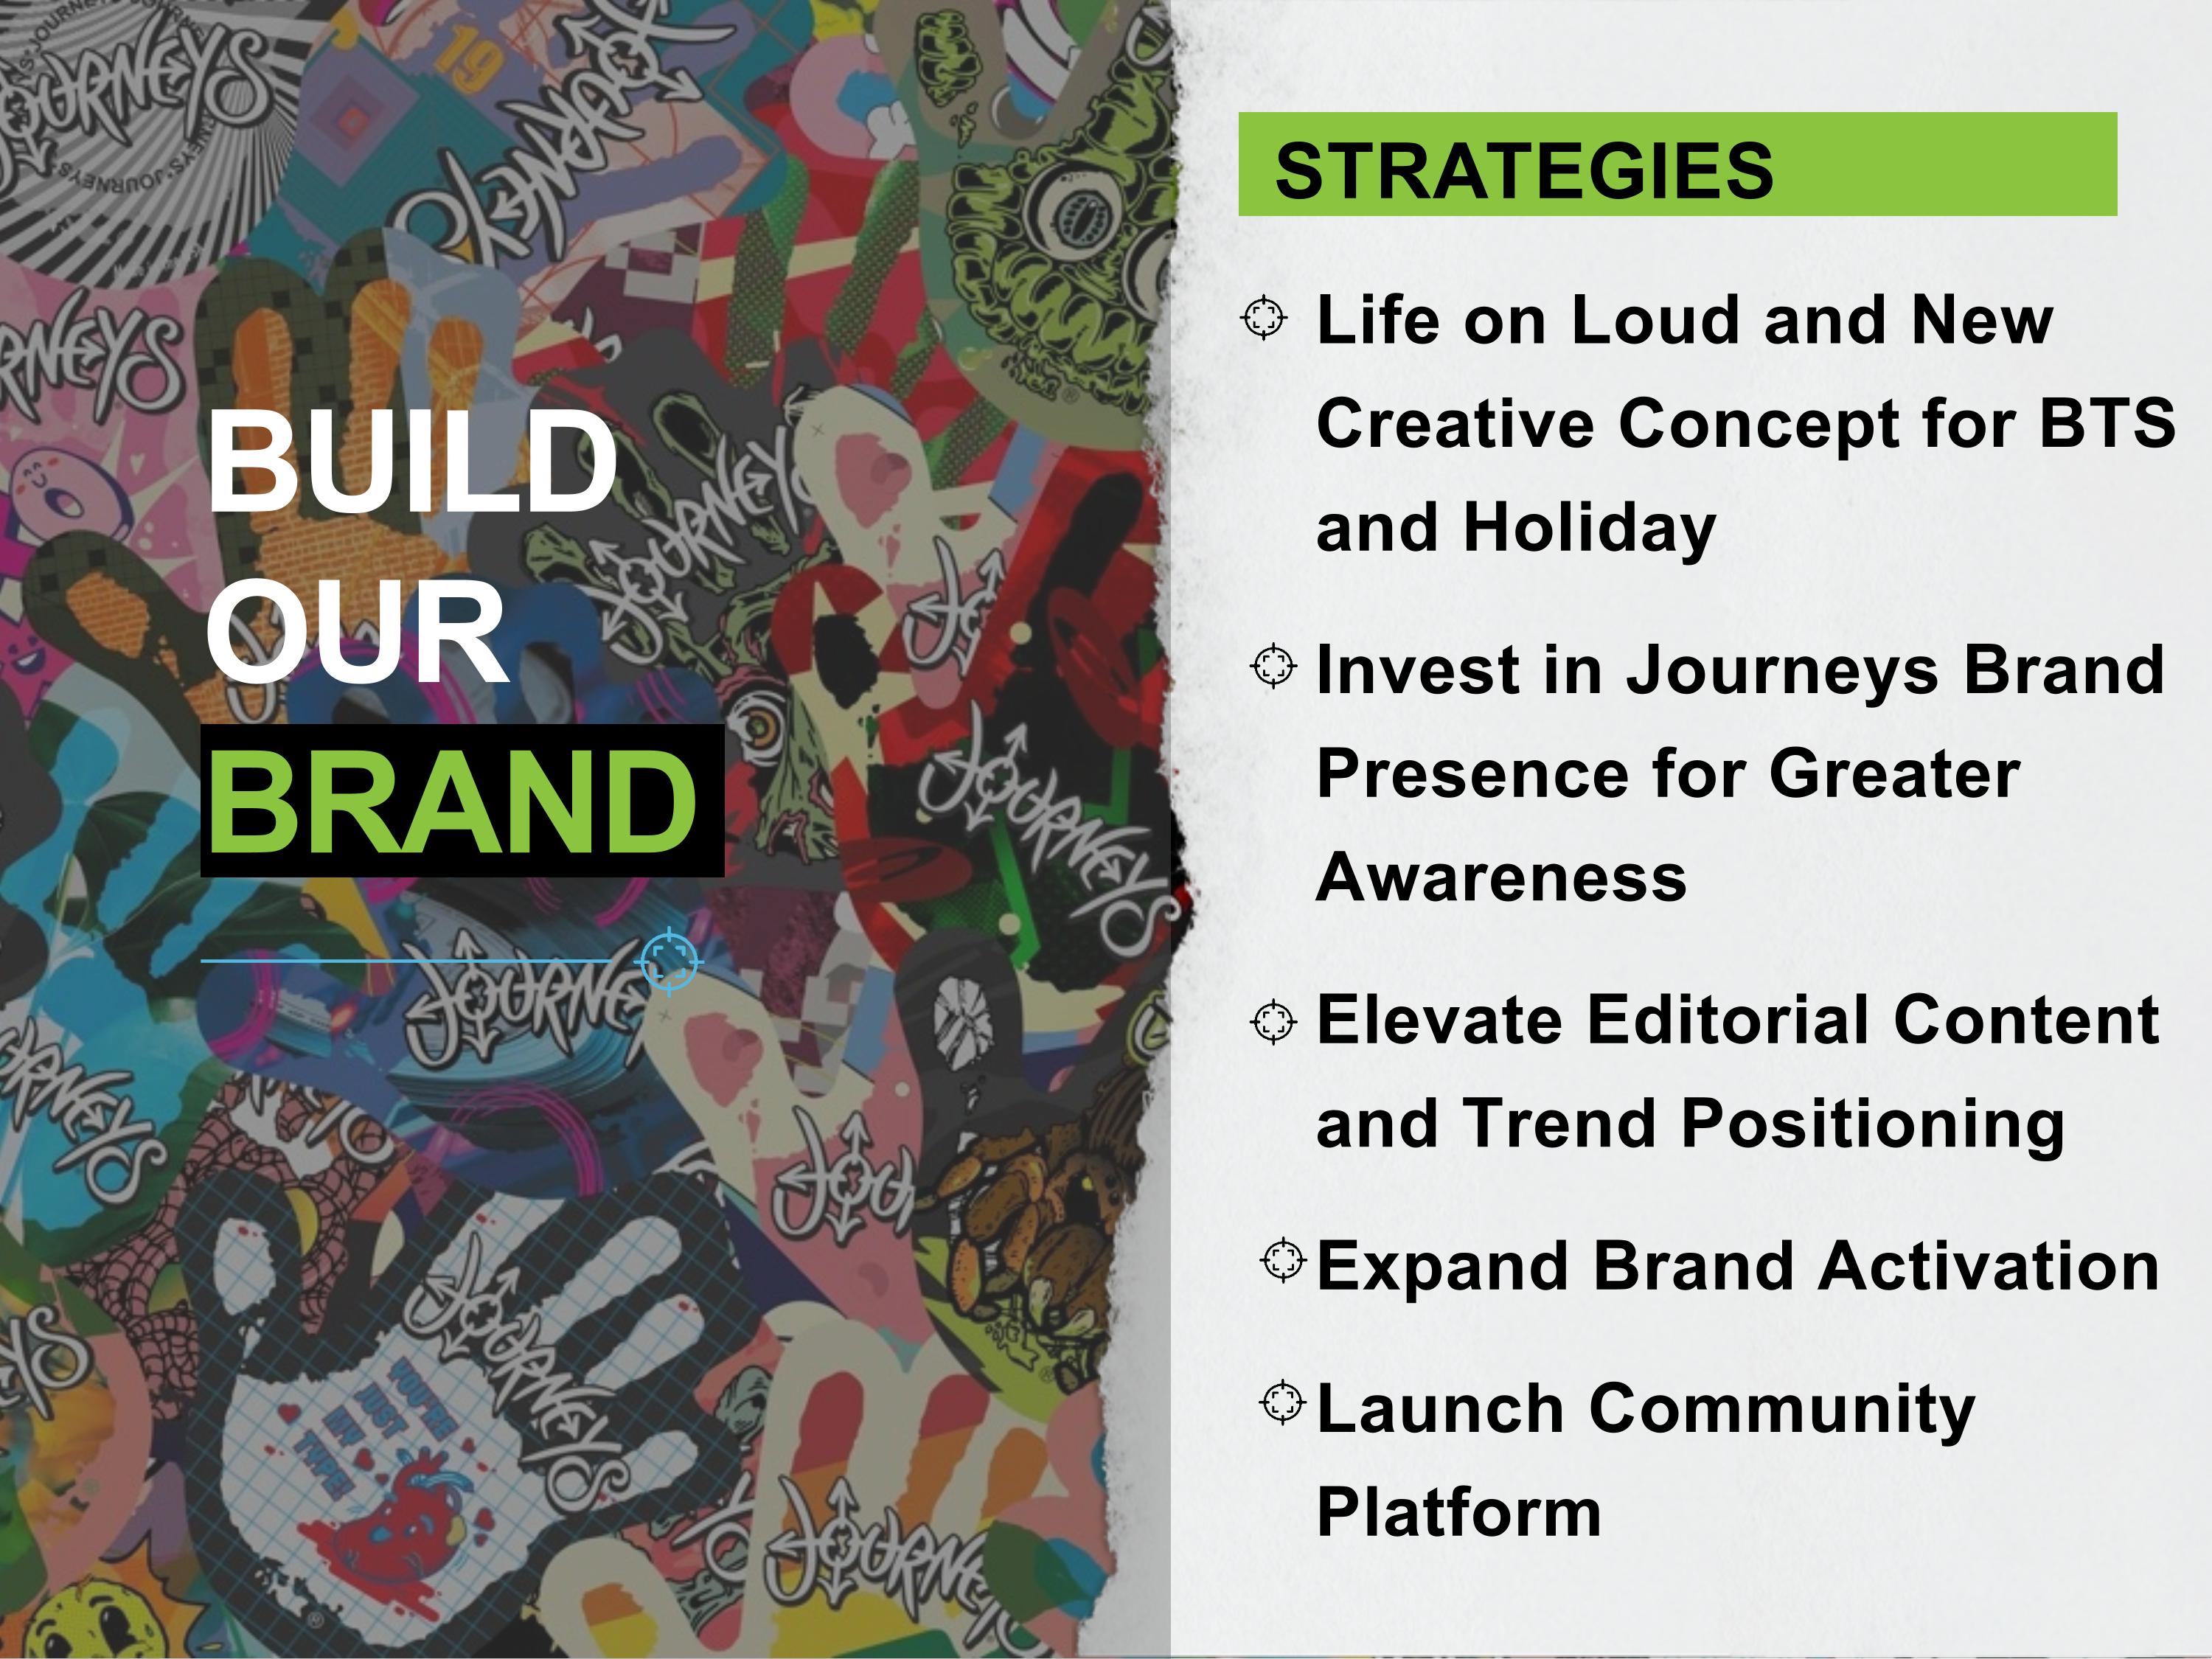
BUILD OUR BRAND STRATEGIES Life on Loud and New Creative Concept for BTS and Holiday Invest in Journeys Brand Presence for Greater Awareness Elevate Editorial Content and Trend Positioning Expand Brand Activation Launch Community Platform
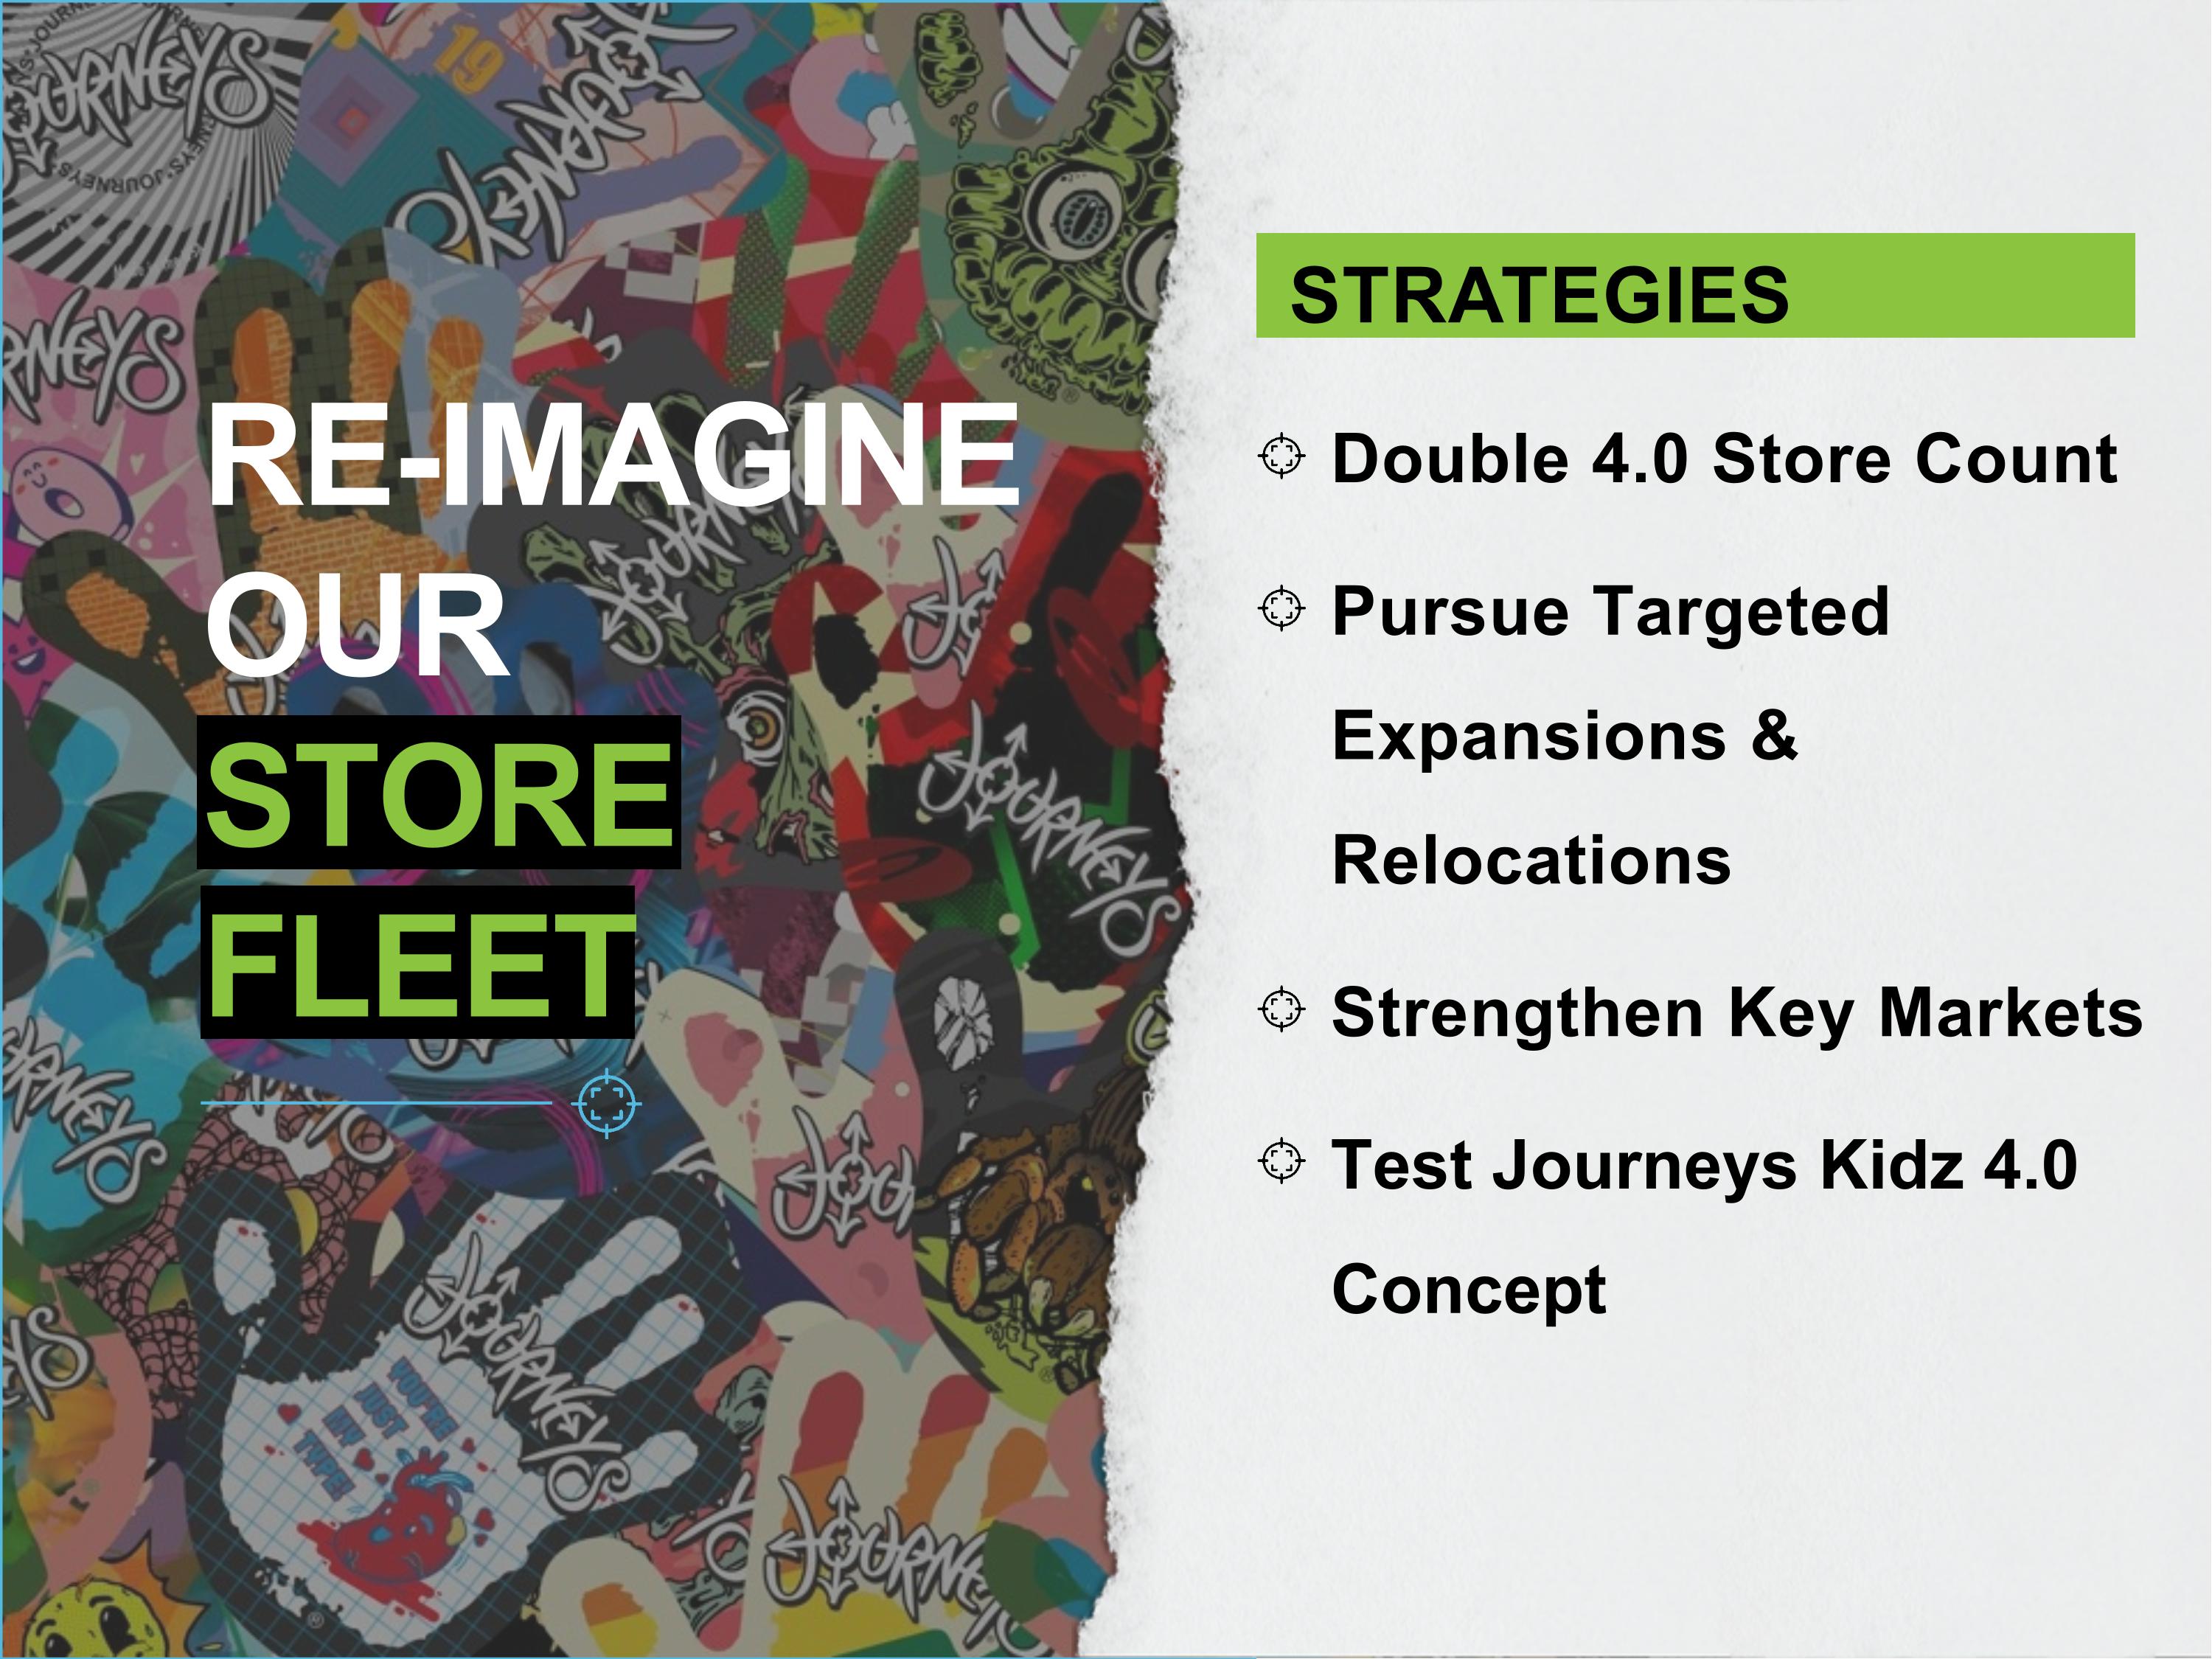
STRATEGIES Double 4.0 Store Count Pursue Targeted Expansions & Relocations Strengthen Key Markets Test Journeys Kidz 4.0 Concept RE-IMAGINE OUR STORE FLEET
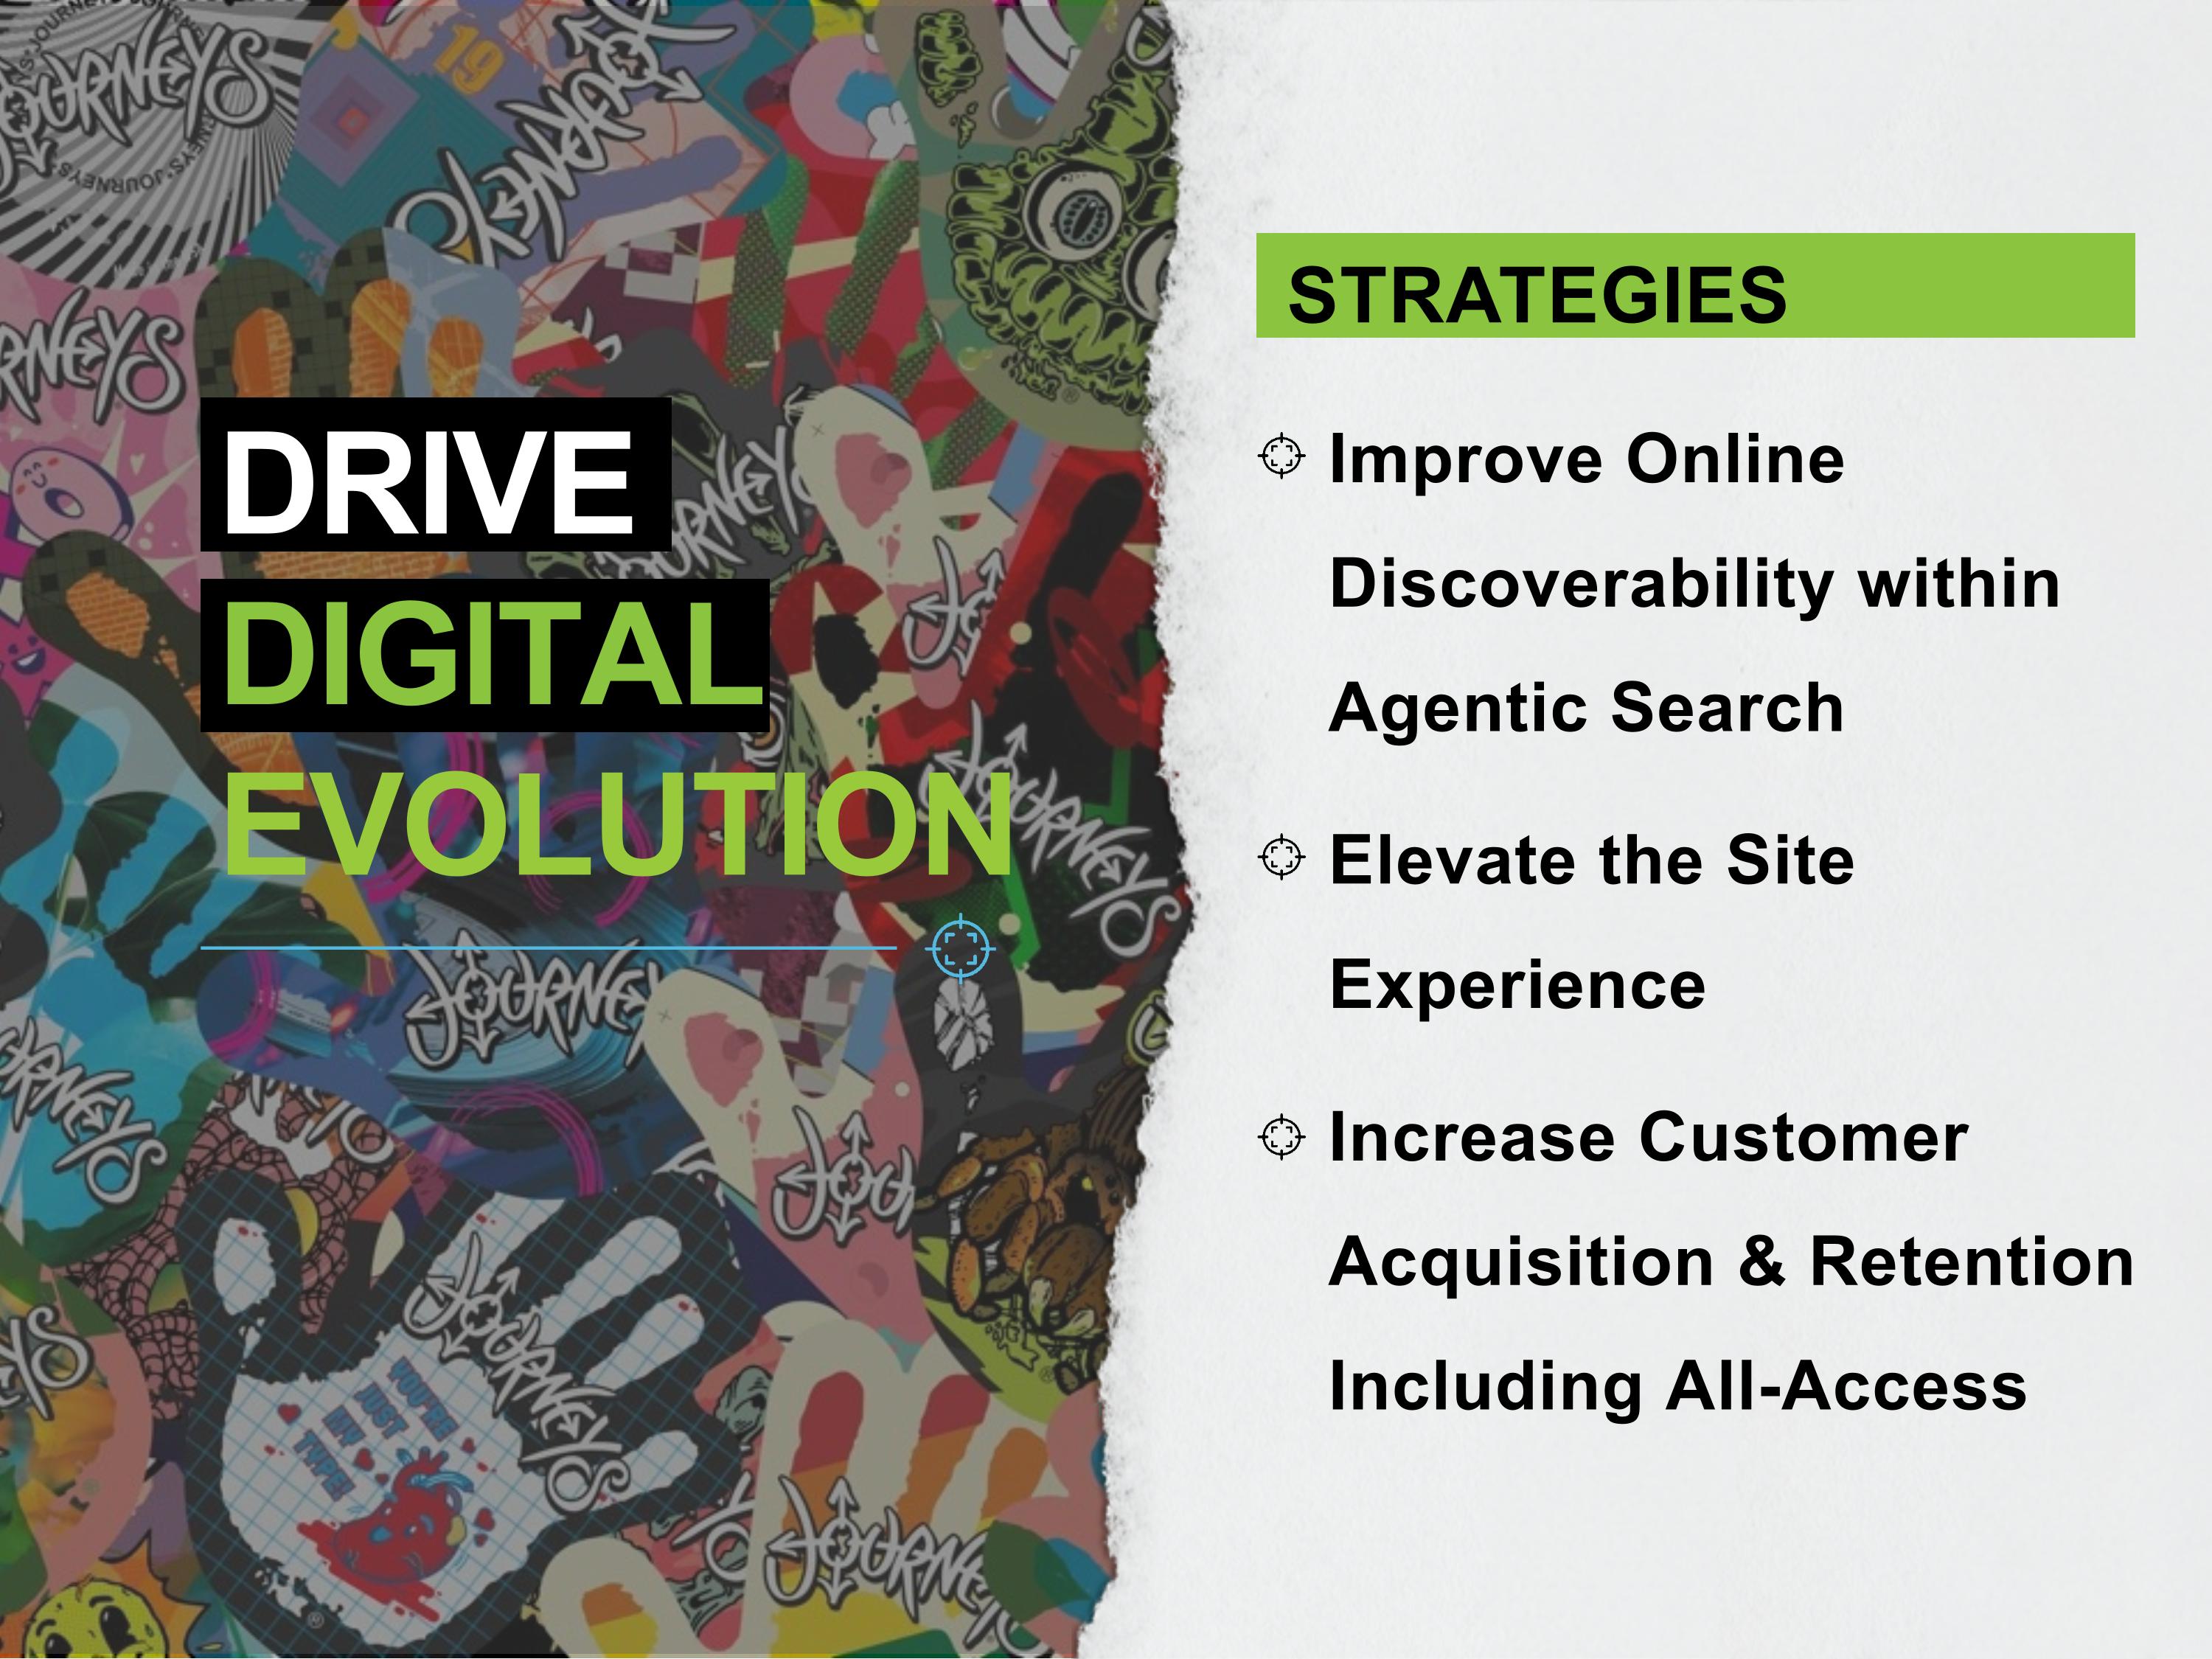
STRATEGIES Improve Online Discoverability within Agentic Search Elevate the Site Experience Increase Customer Acquisition & Retention Including All-Access DRIVE DIGITAL EVOLUTION

FINANCIALS
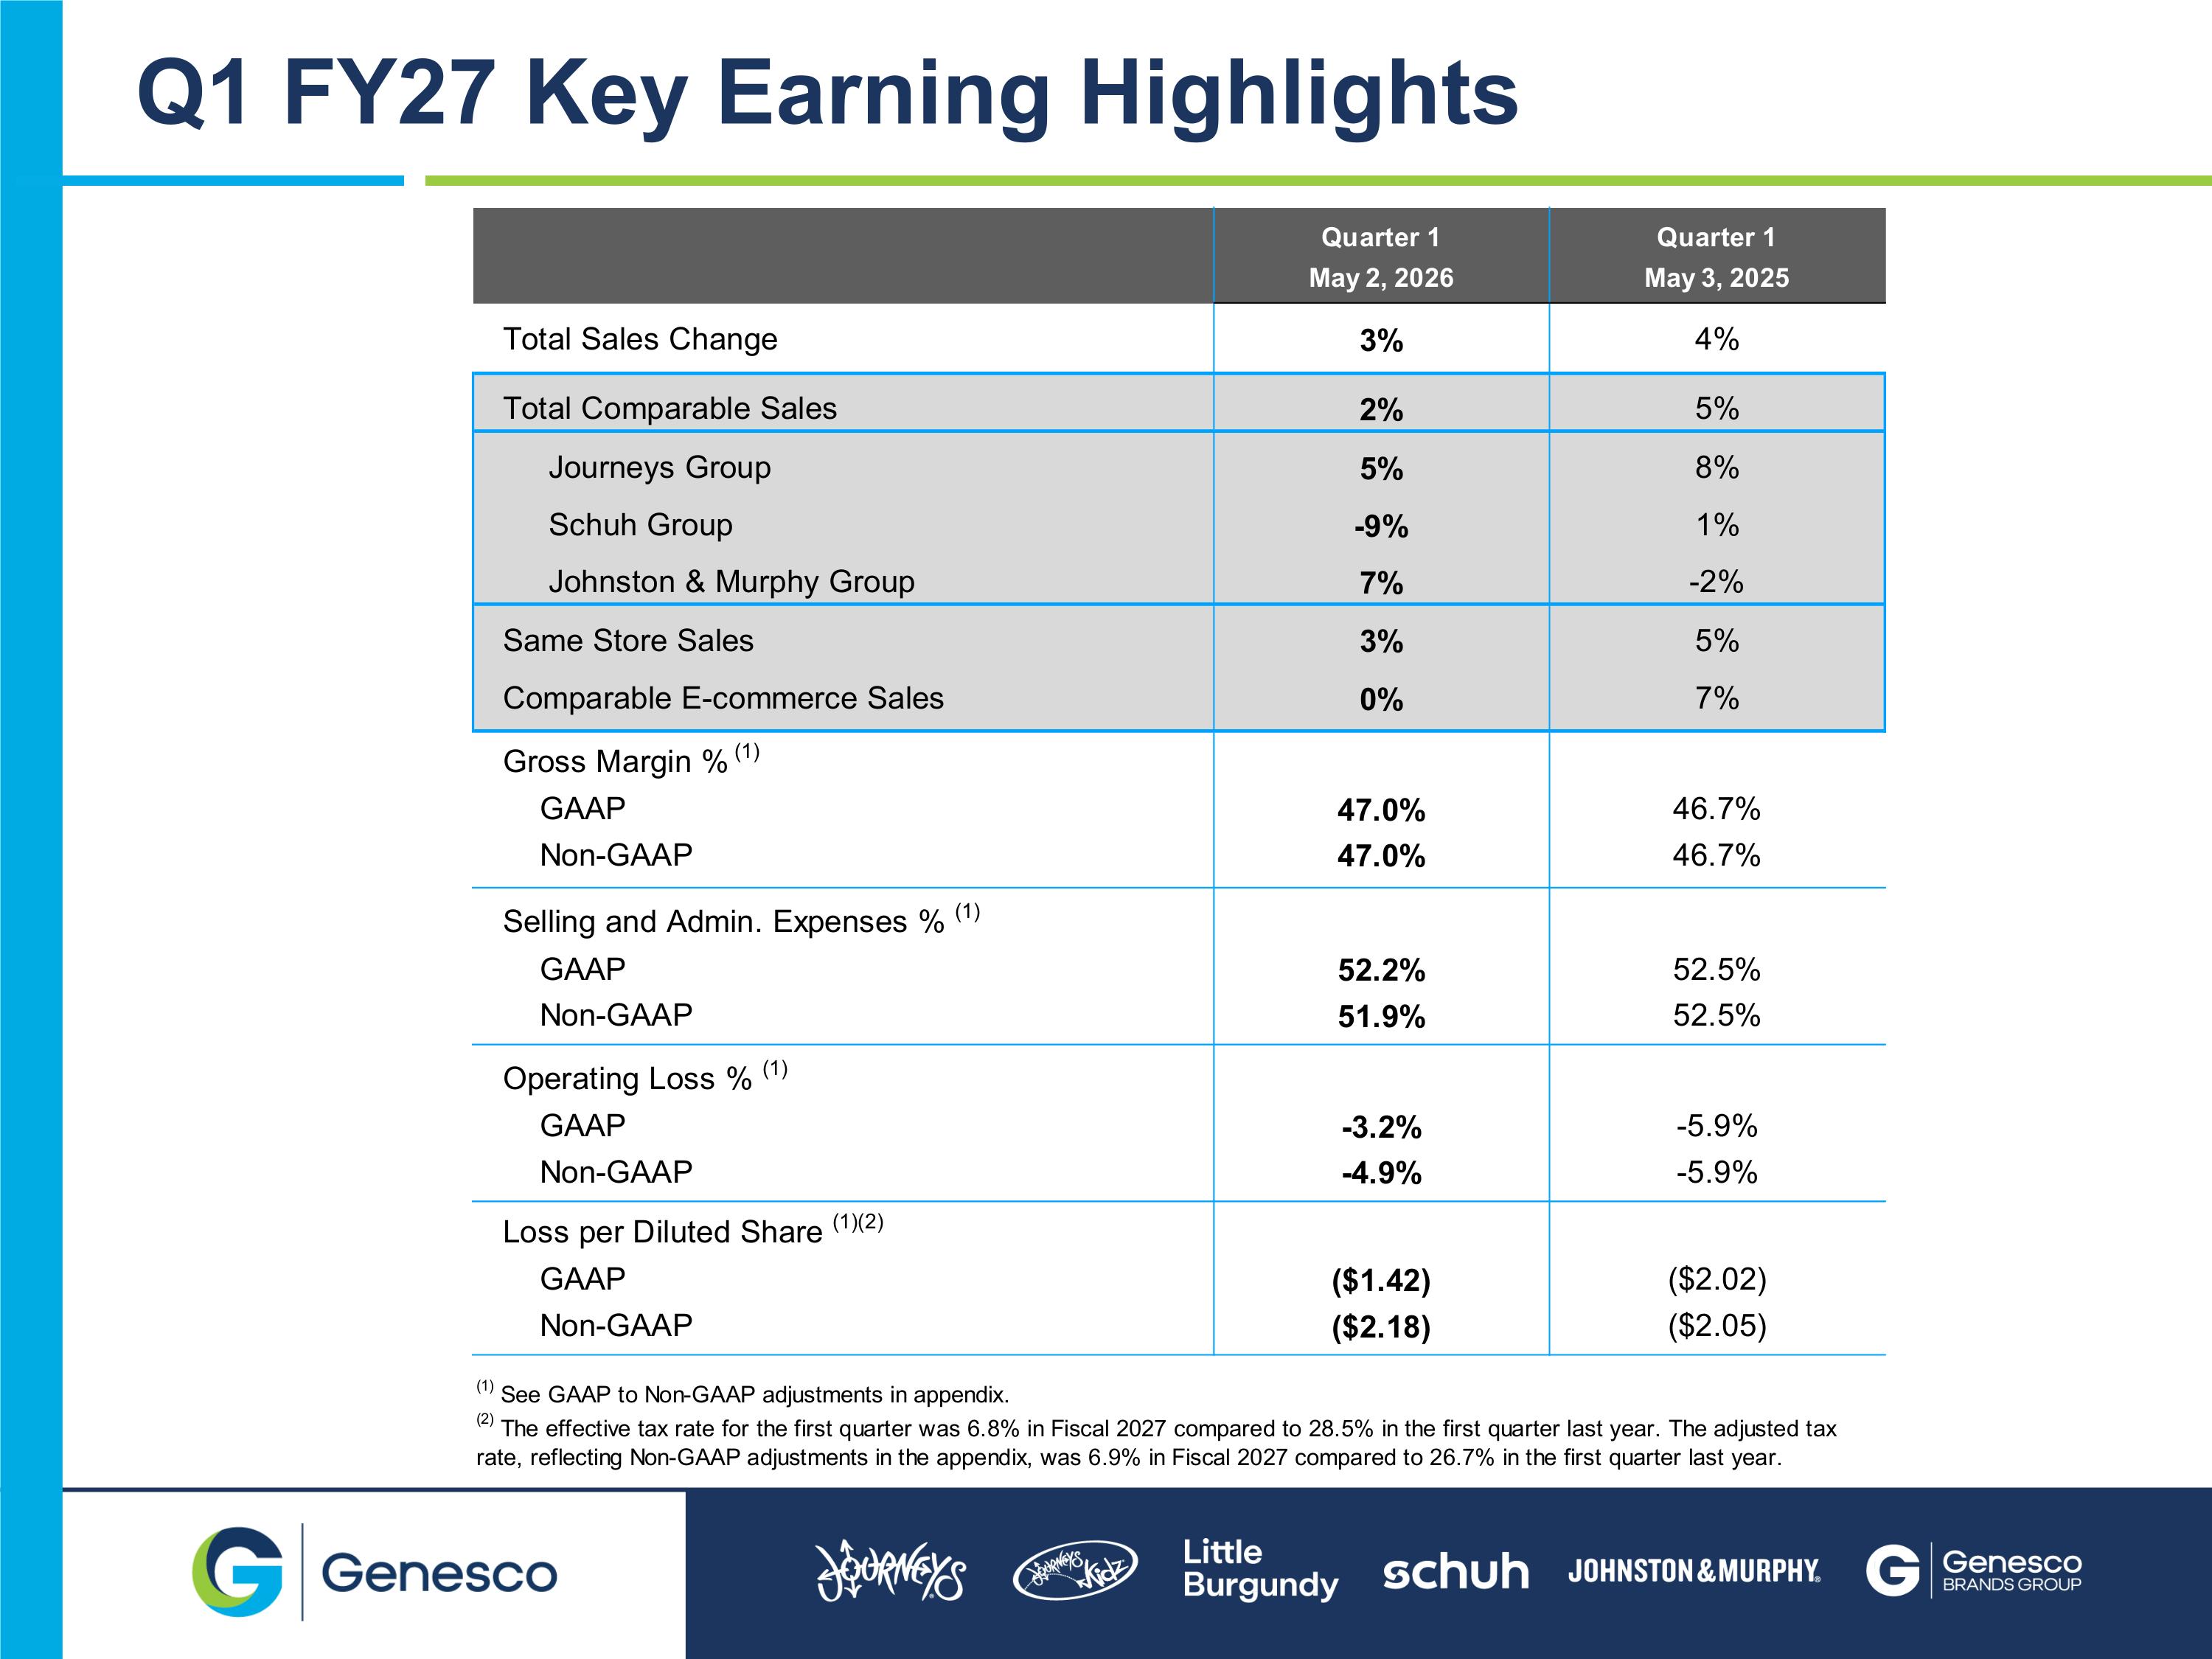
Q1 FY27 Key Earning Highlights
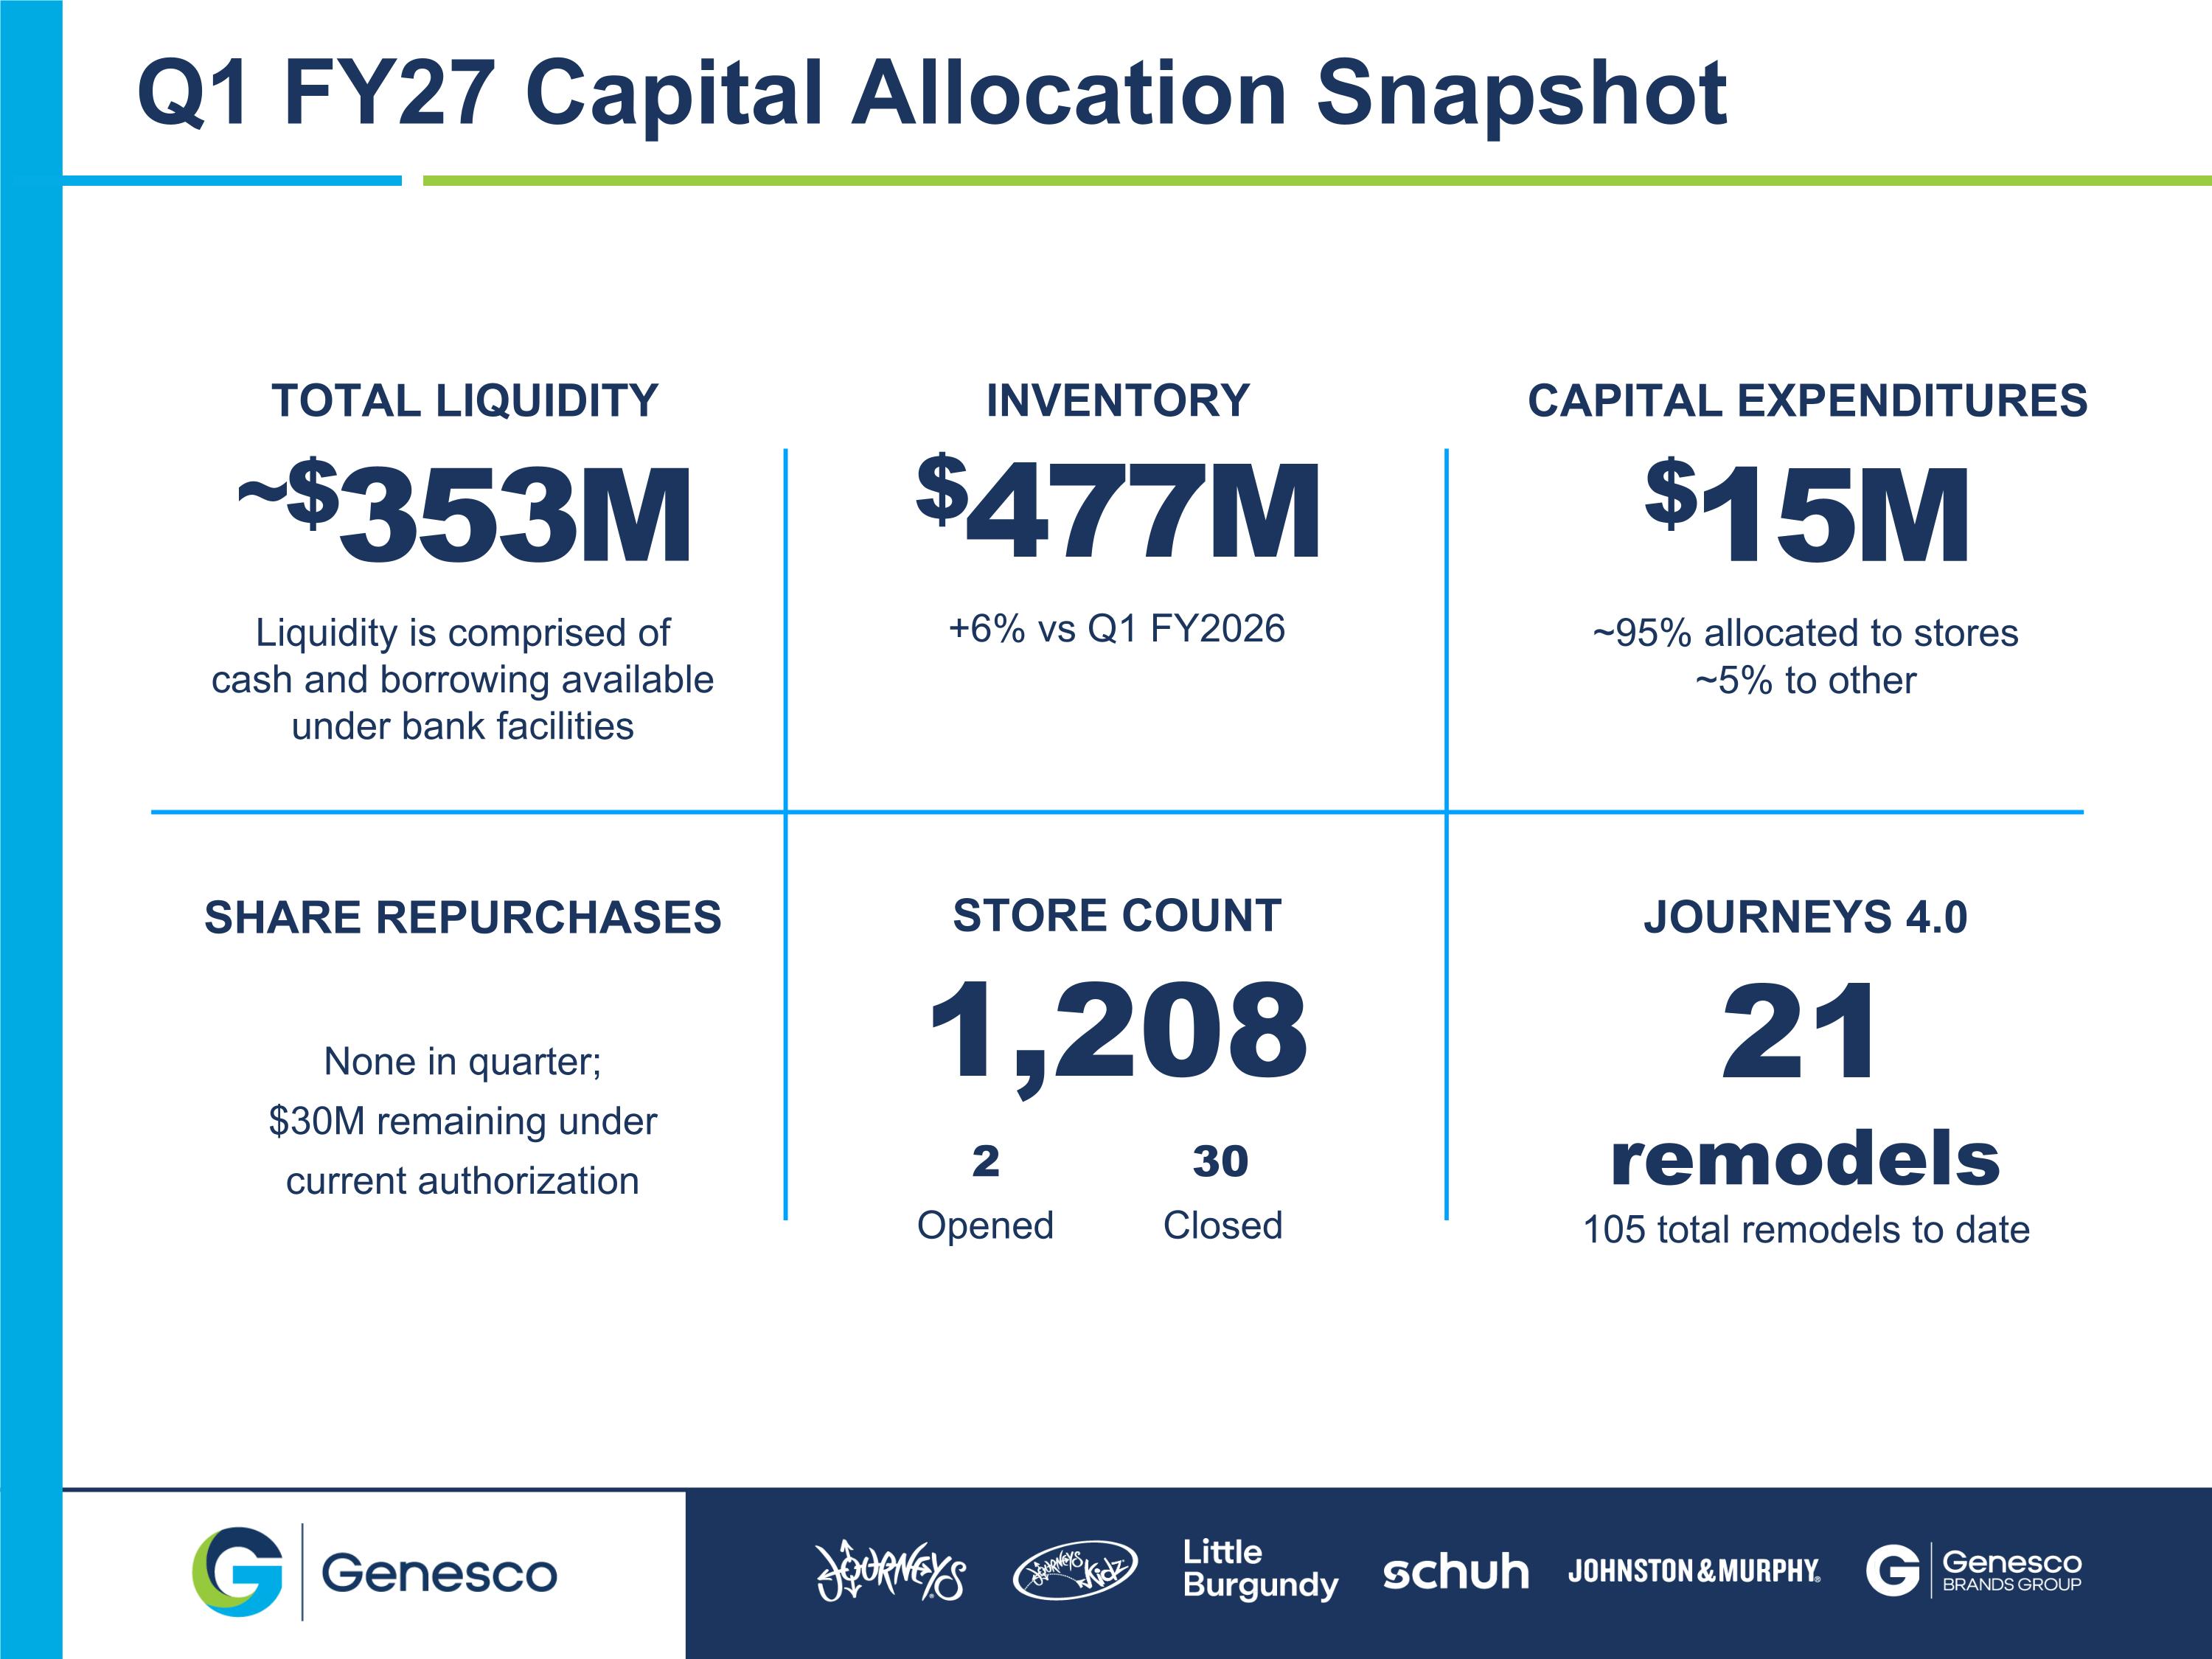
TOTAL LIQUIDITY ~$353M Liquidity is comprised of cash and borrowing available under bank facilities INVENTORY $477M +6% vs Q1 FY2026 CAPITAL EXPENDITURES $15M ~95% allocated to stores ~5% to other STORE COUNT 1,208 2 30 Opened Closed SHARE REPURCHASES None in quarter; $30M remaining under current authorization JOURNEYS 4.0 21 remodels 105 total remodels to date Q1 FY27 Capital Allocation Snapshot
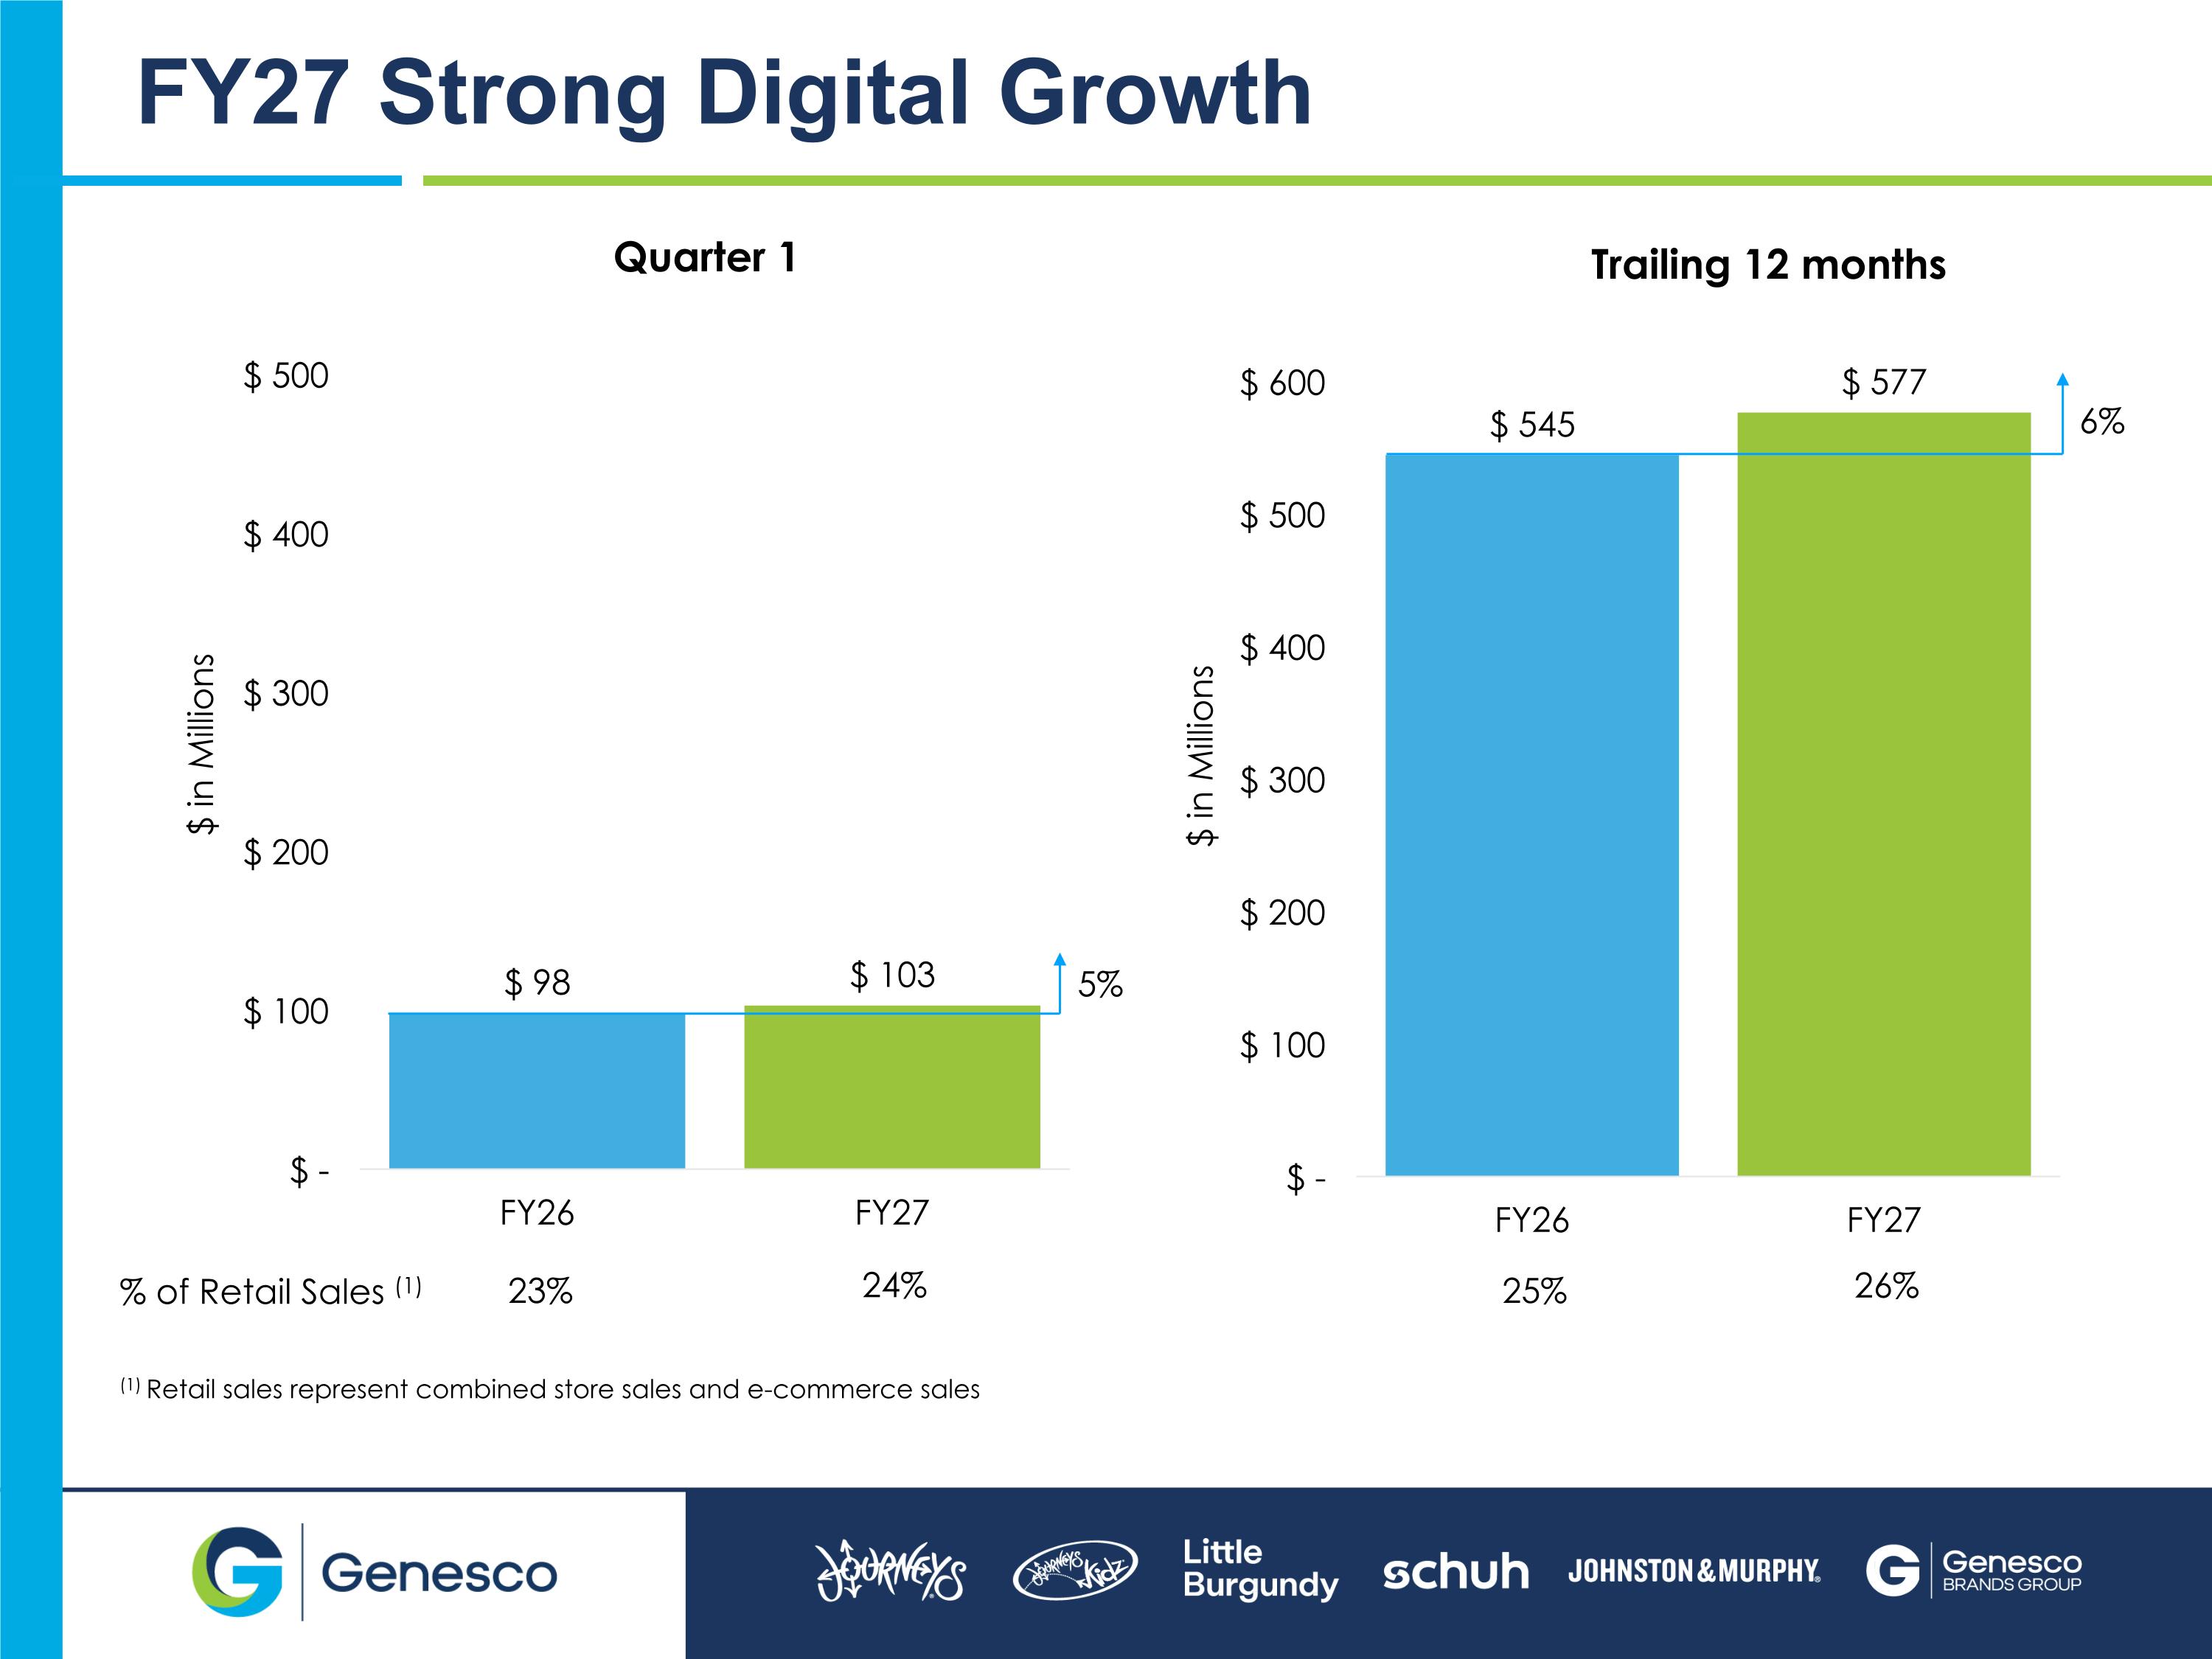
% of Retail Sales (1) 31% 25% 23% 24% 25% 26% 5% 6% (1) Retail sales represent combined store sales and e-commerce sales FY27 Strong Digital Growth
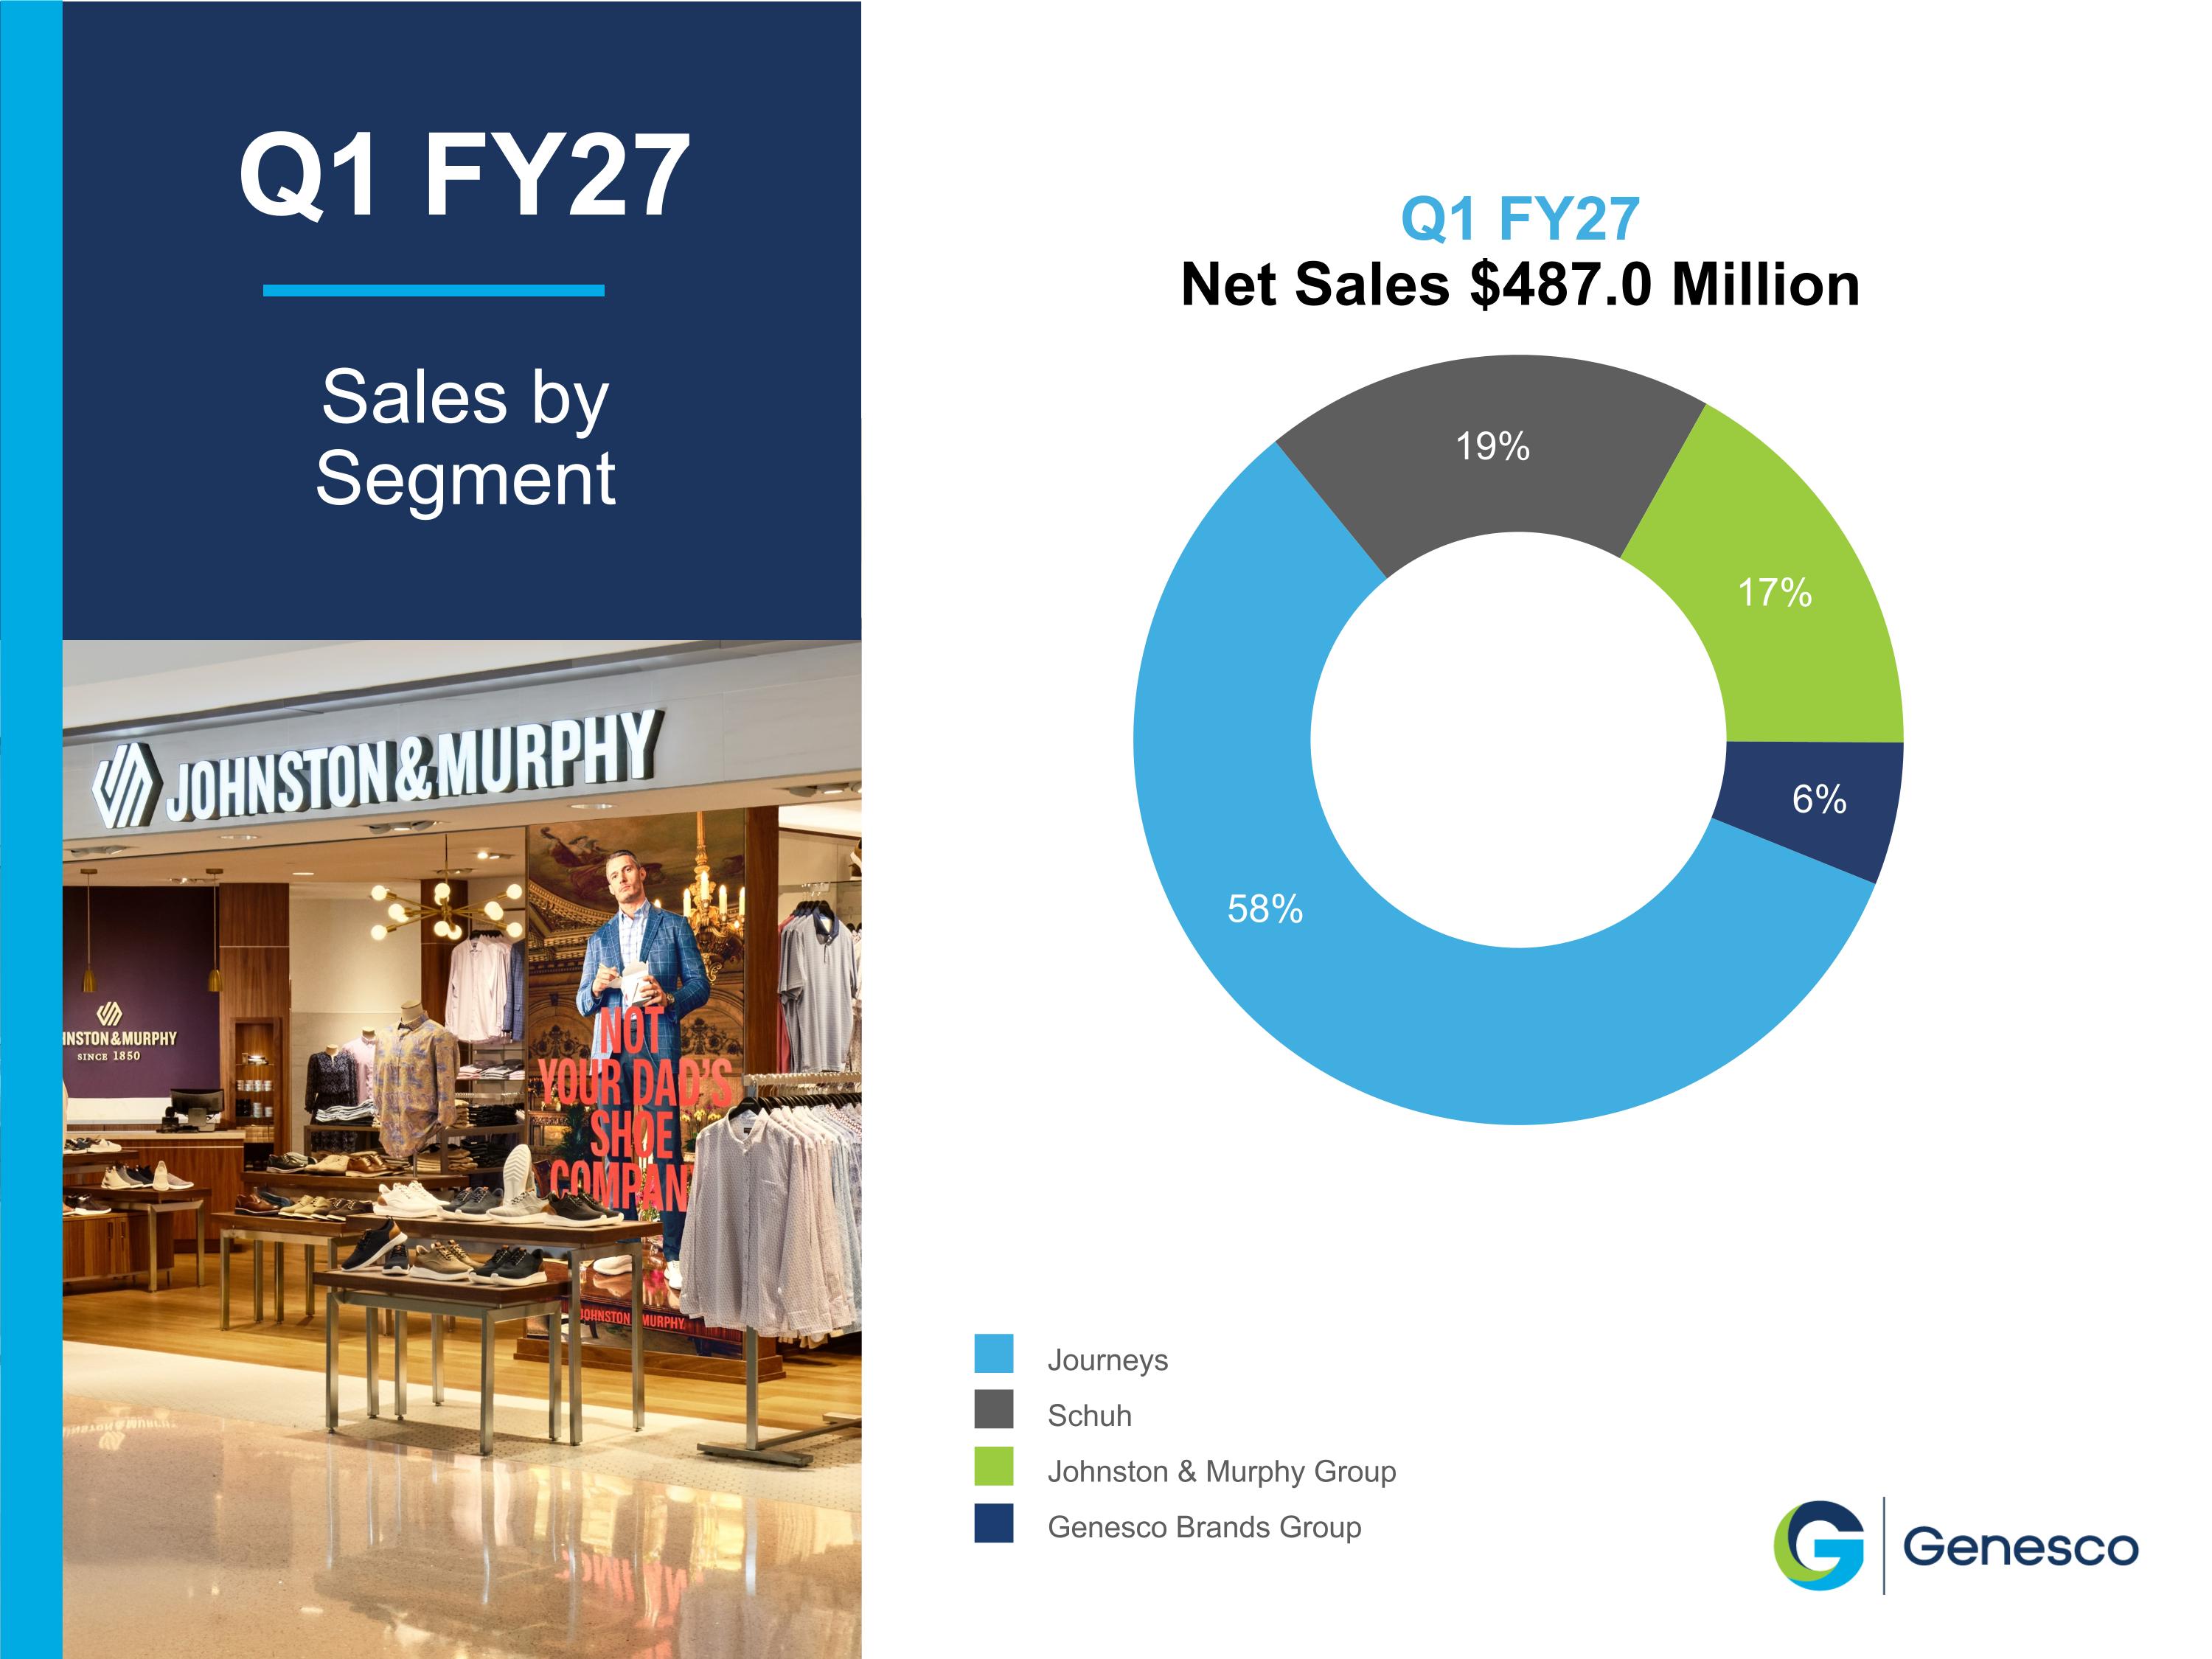
Q1 FY27 Net Sales $487.0 Million Journeys Schuh Johnston & Murphy Group Genesco Brands Group Q1 FY27 Sales by Segment
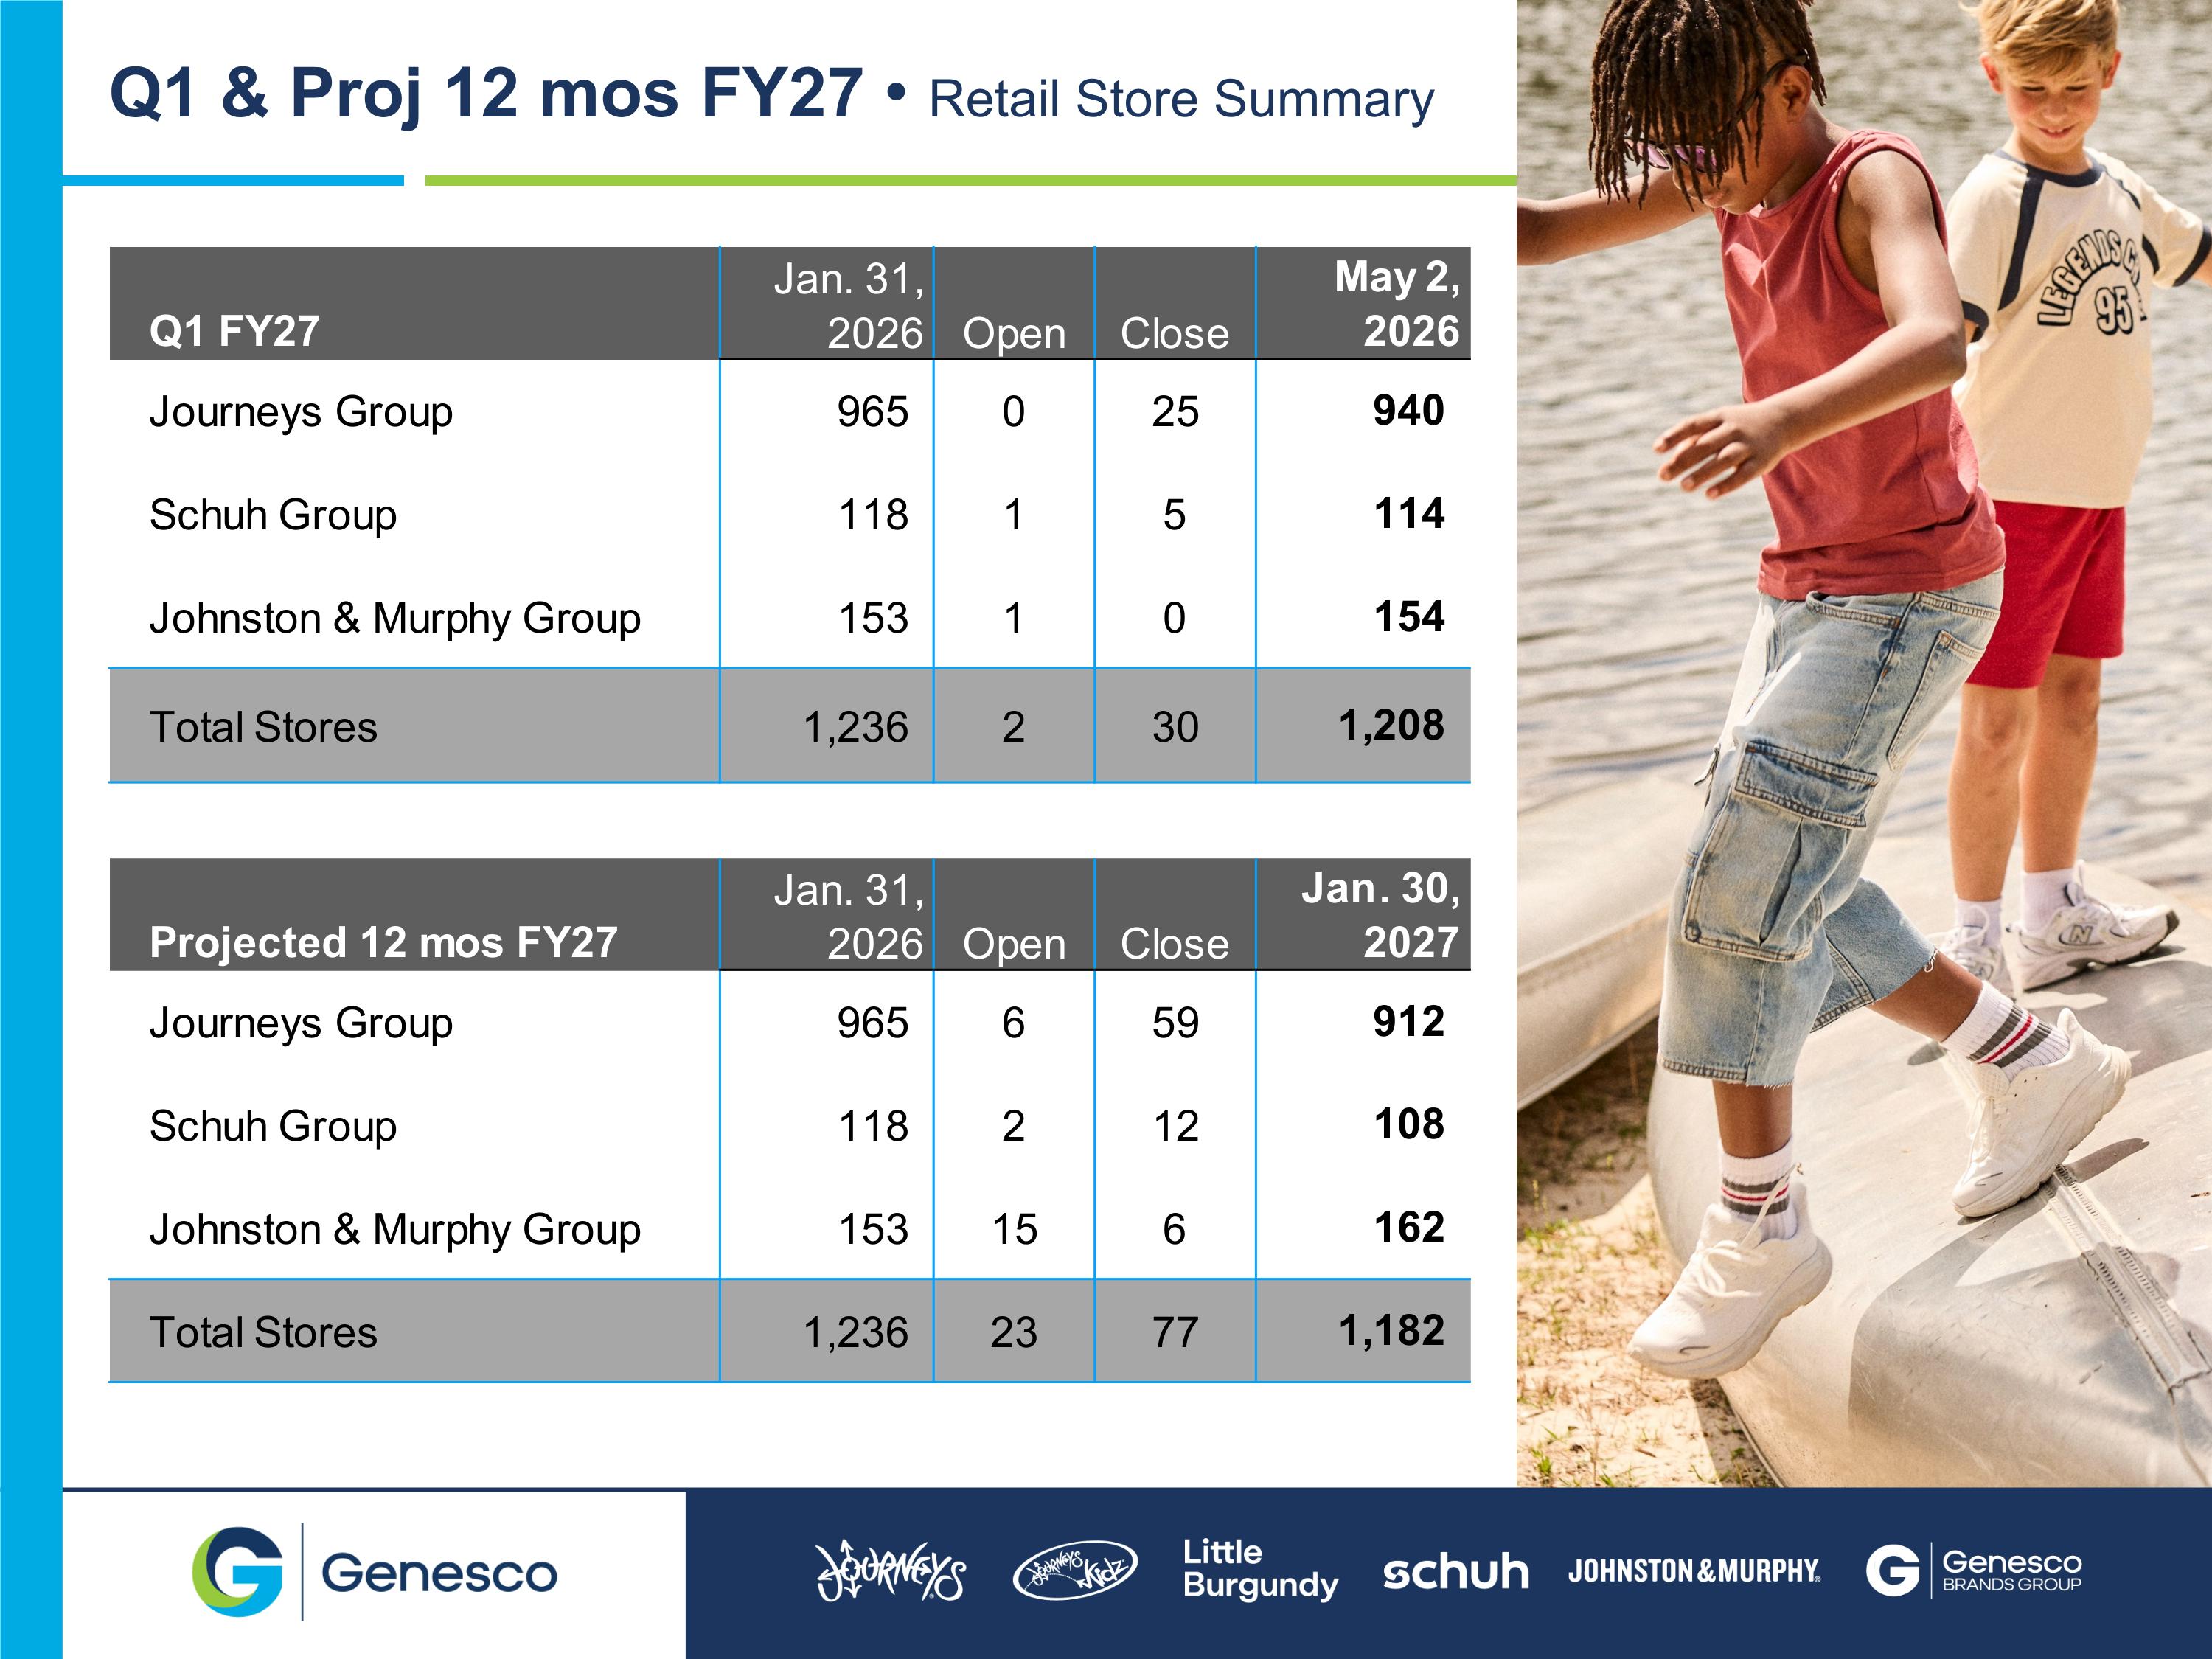
Q1 & Proj 12 mos FY27 • Retail Store Summary
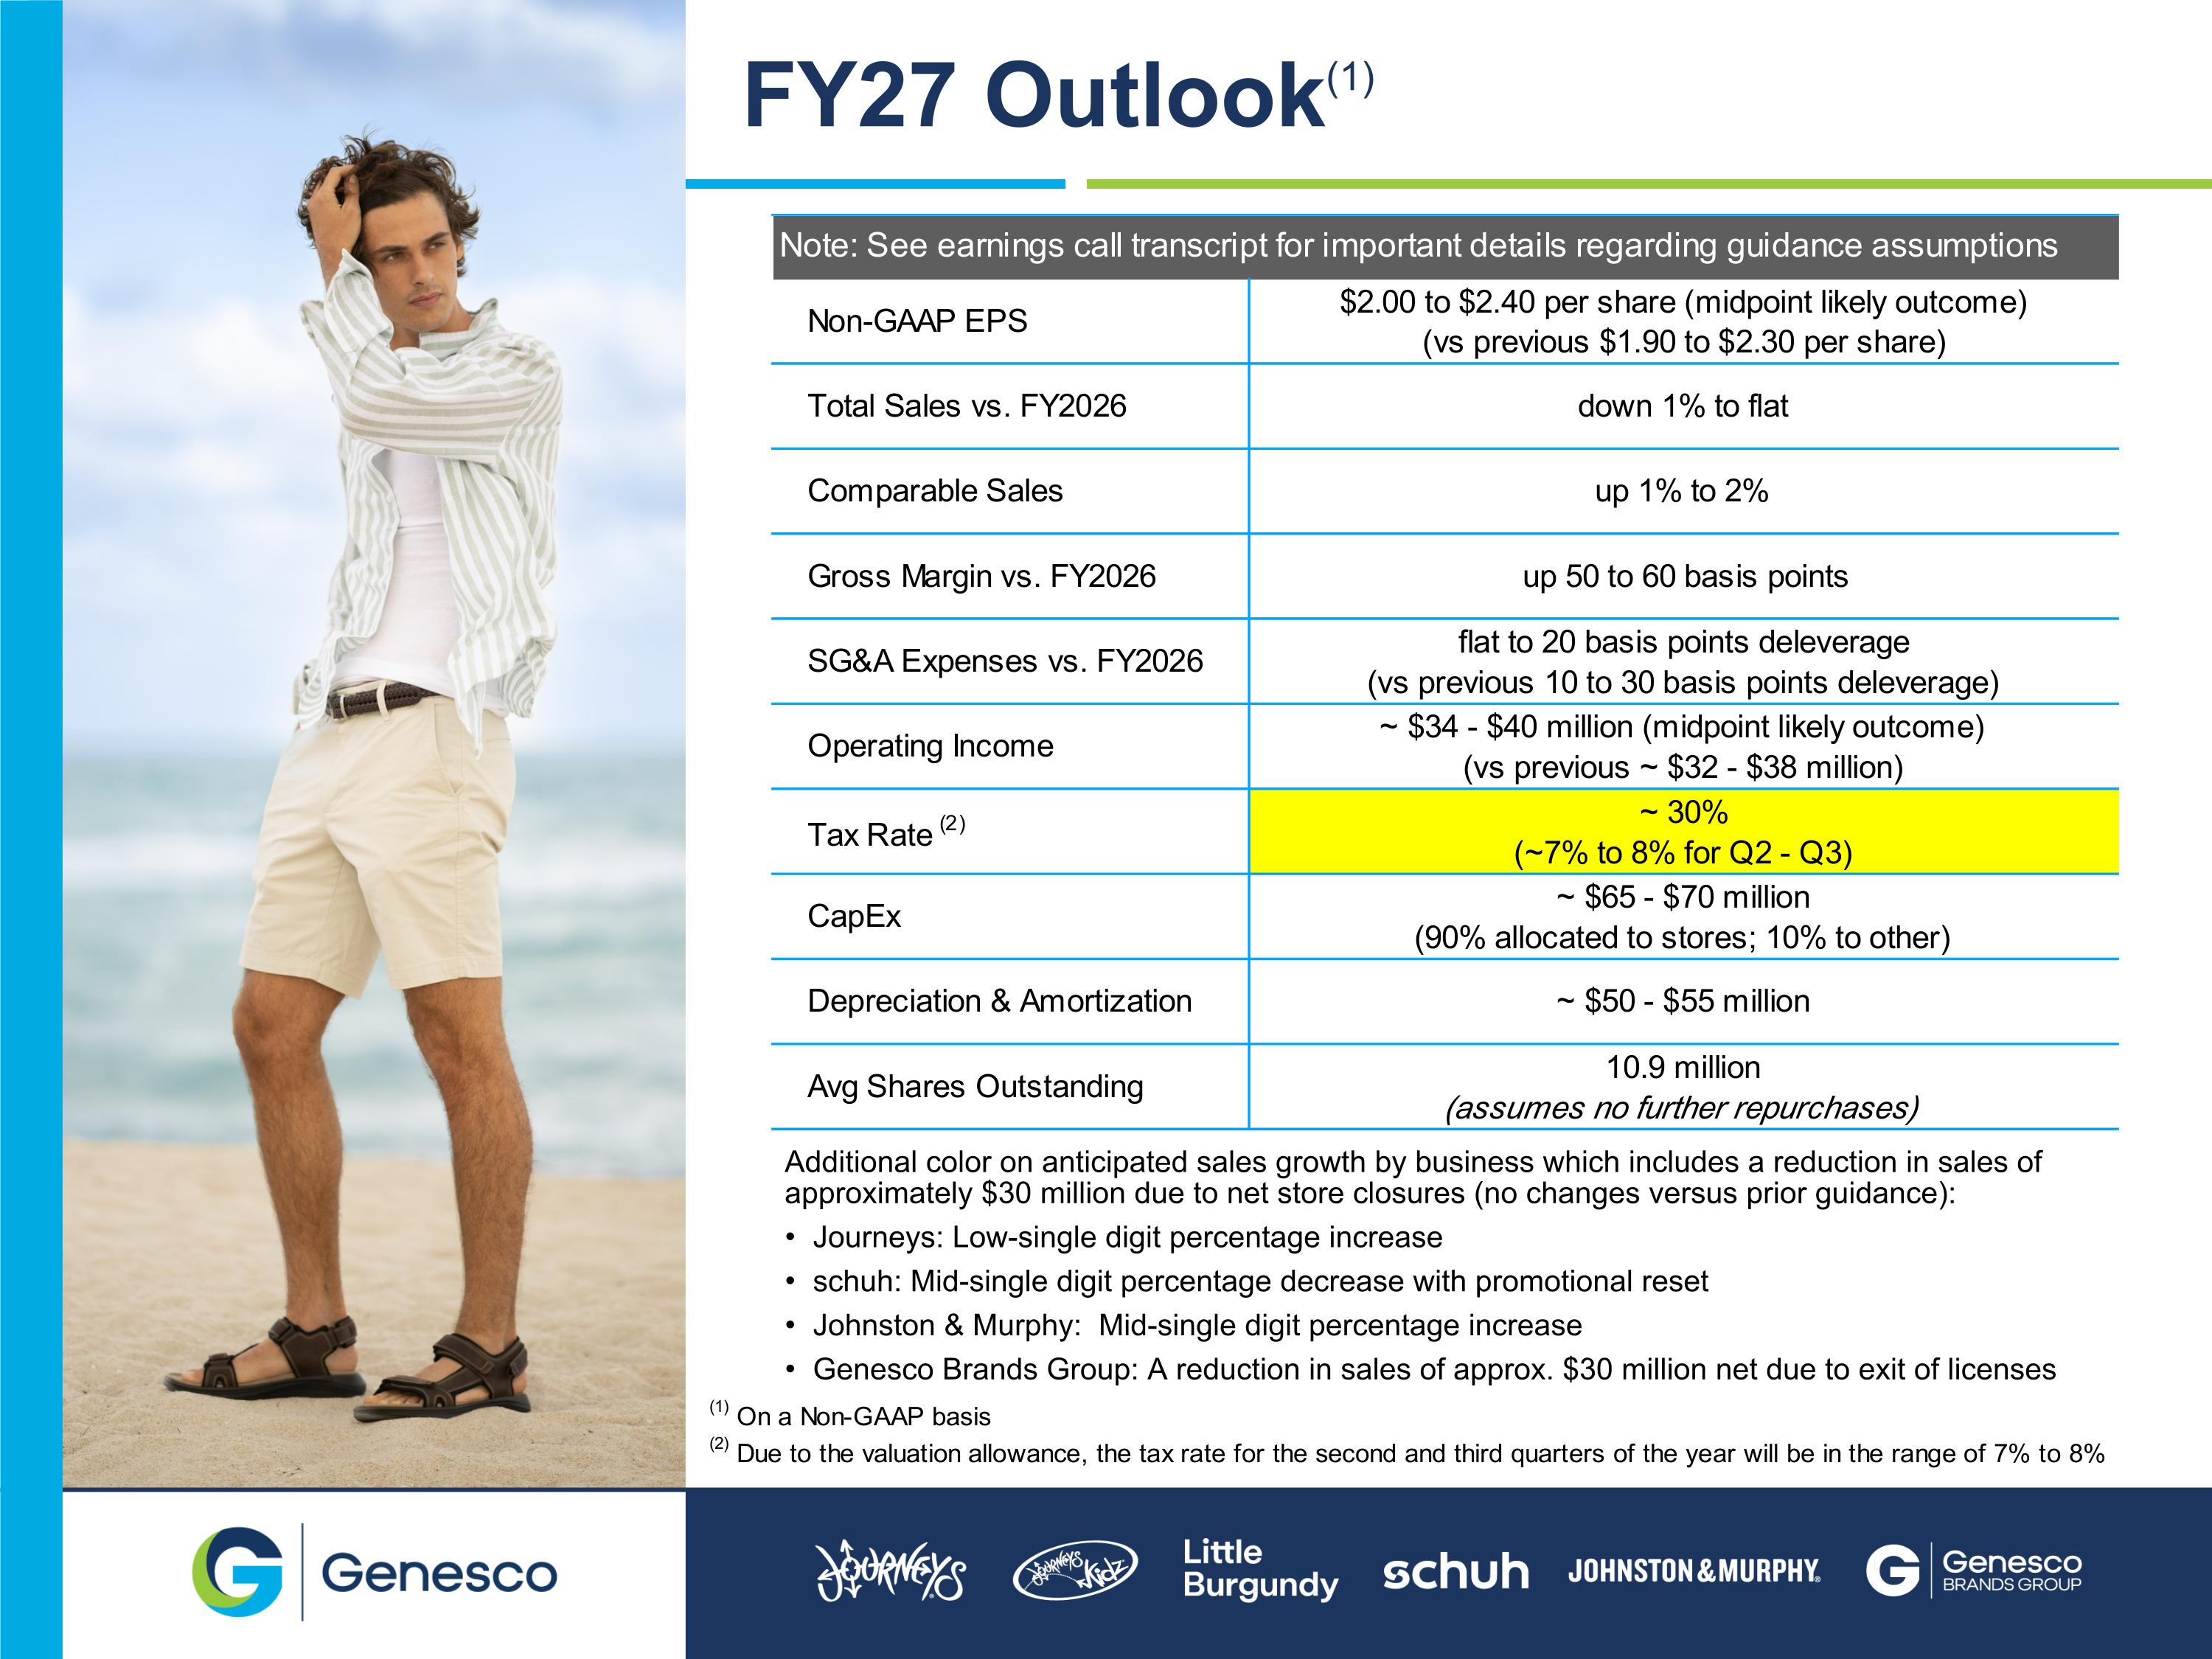
FY27 Outlook(1) Additional color on anticipated sales growth by business which includes a reduction in sales of approximately $30 million due to net store closures (no changes versus prior guidance): Journeys: Low-single digit percentage increase schuh: Mid-single digit percentage decrease with promotional reset Johnston & Murphy: Mid-single digit percentage increase Genesco Brands Group: A reduction in sales of approx. $30 million net due to exit of licenses

APPENDIX
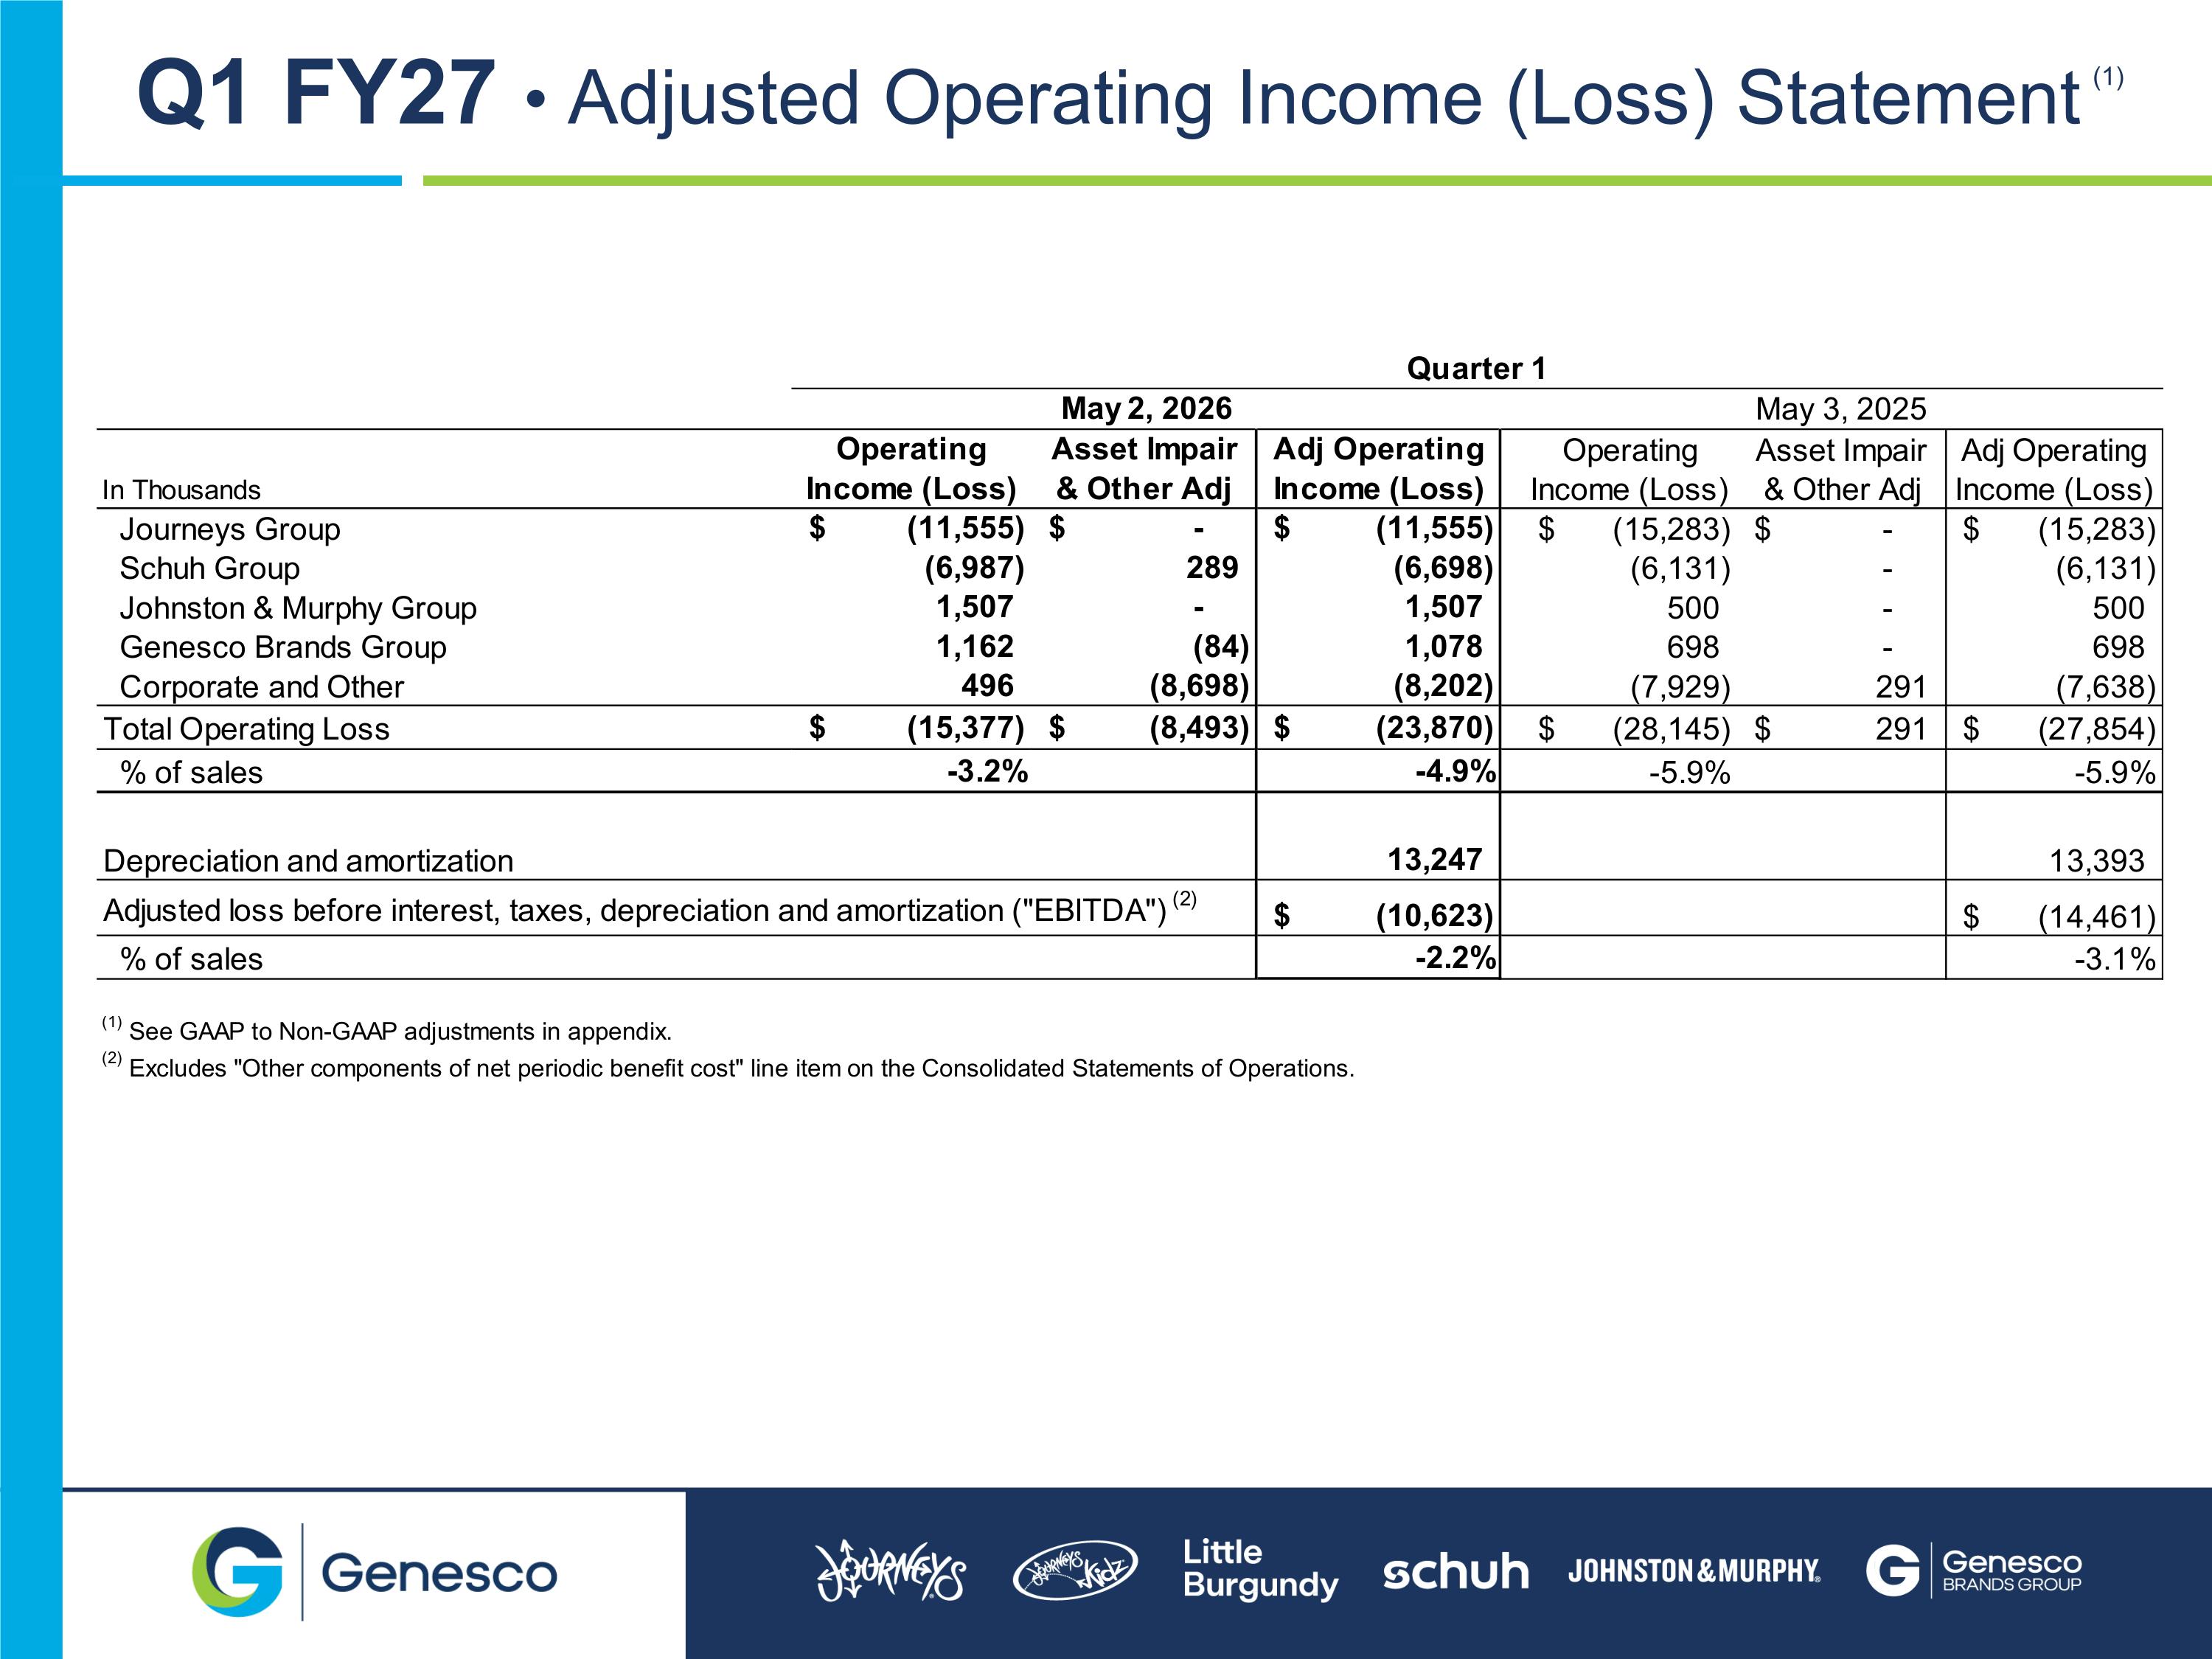
(1) Q1 FY27 • Adjusted Operating Income (Loss) Statement
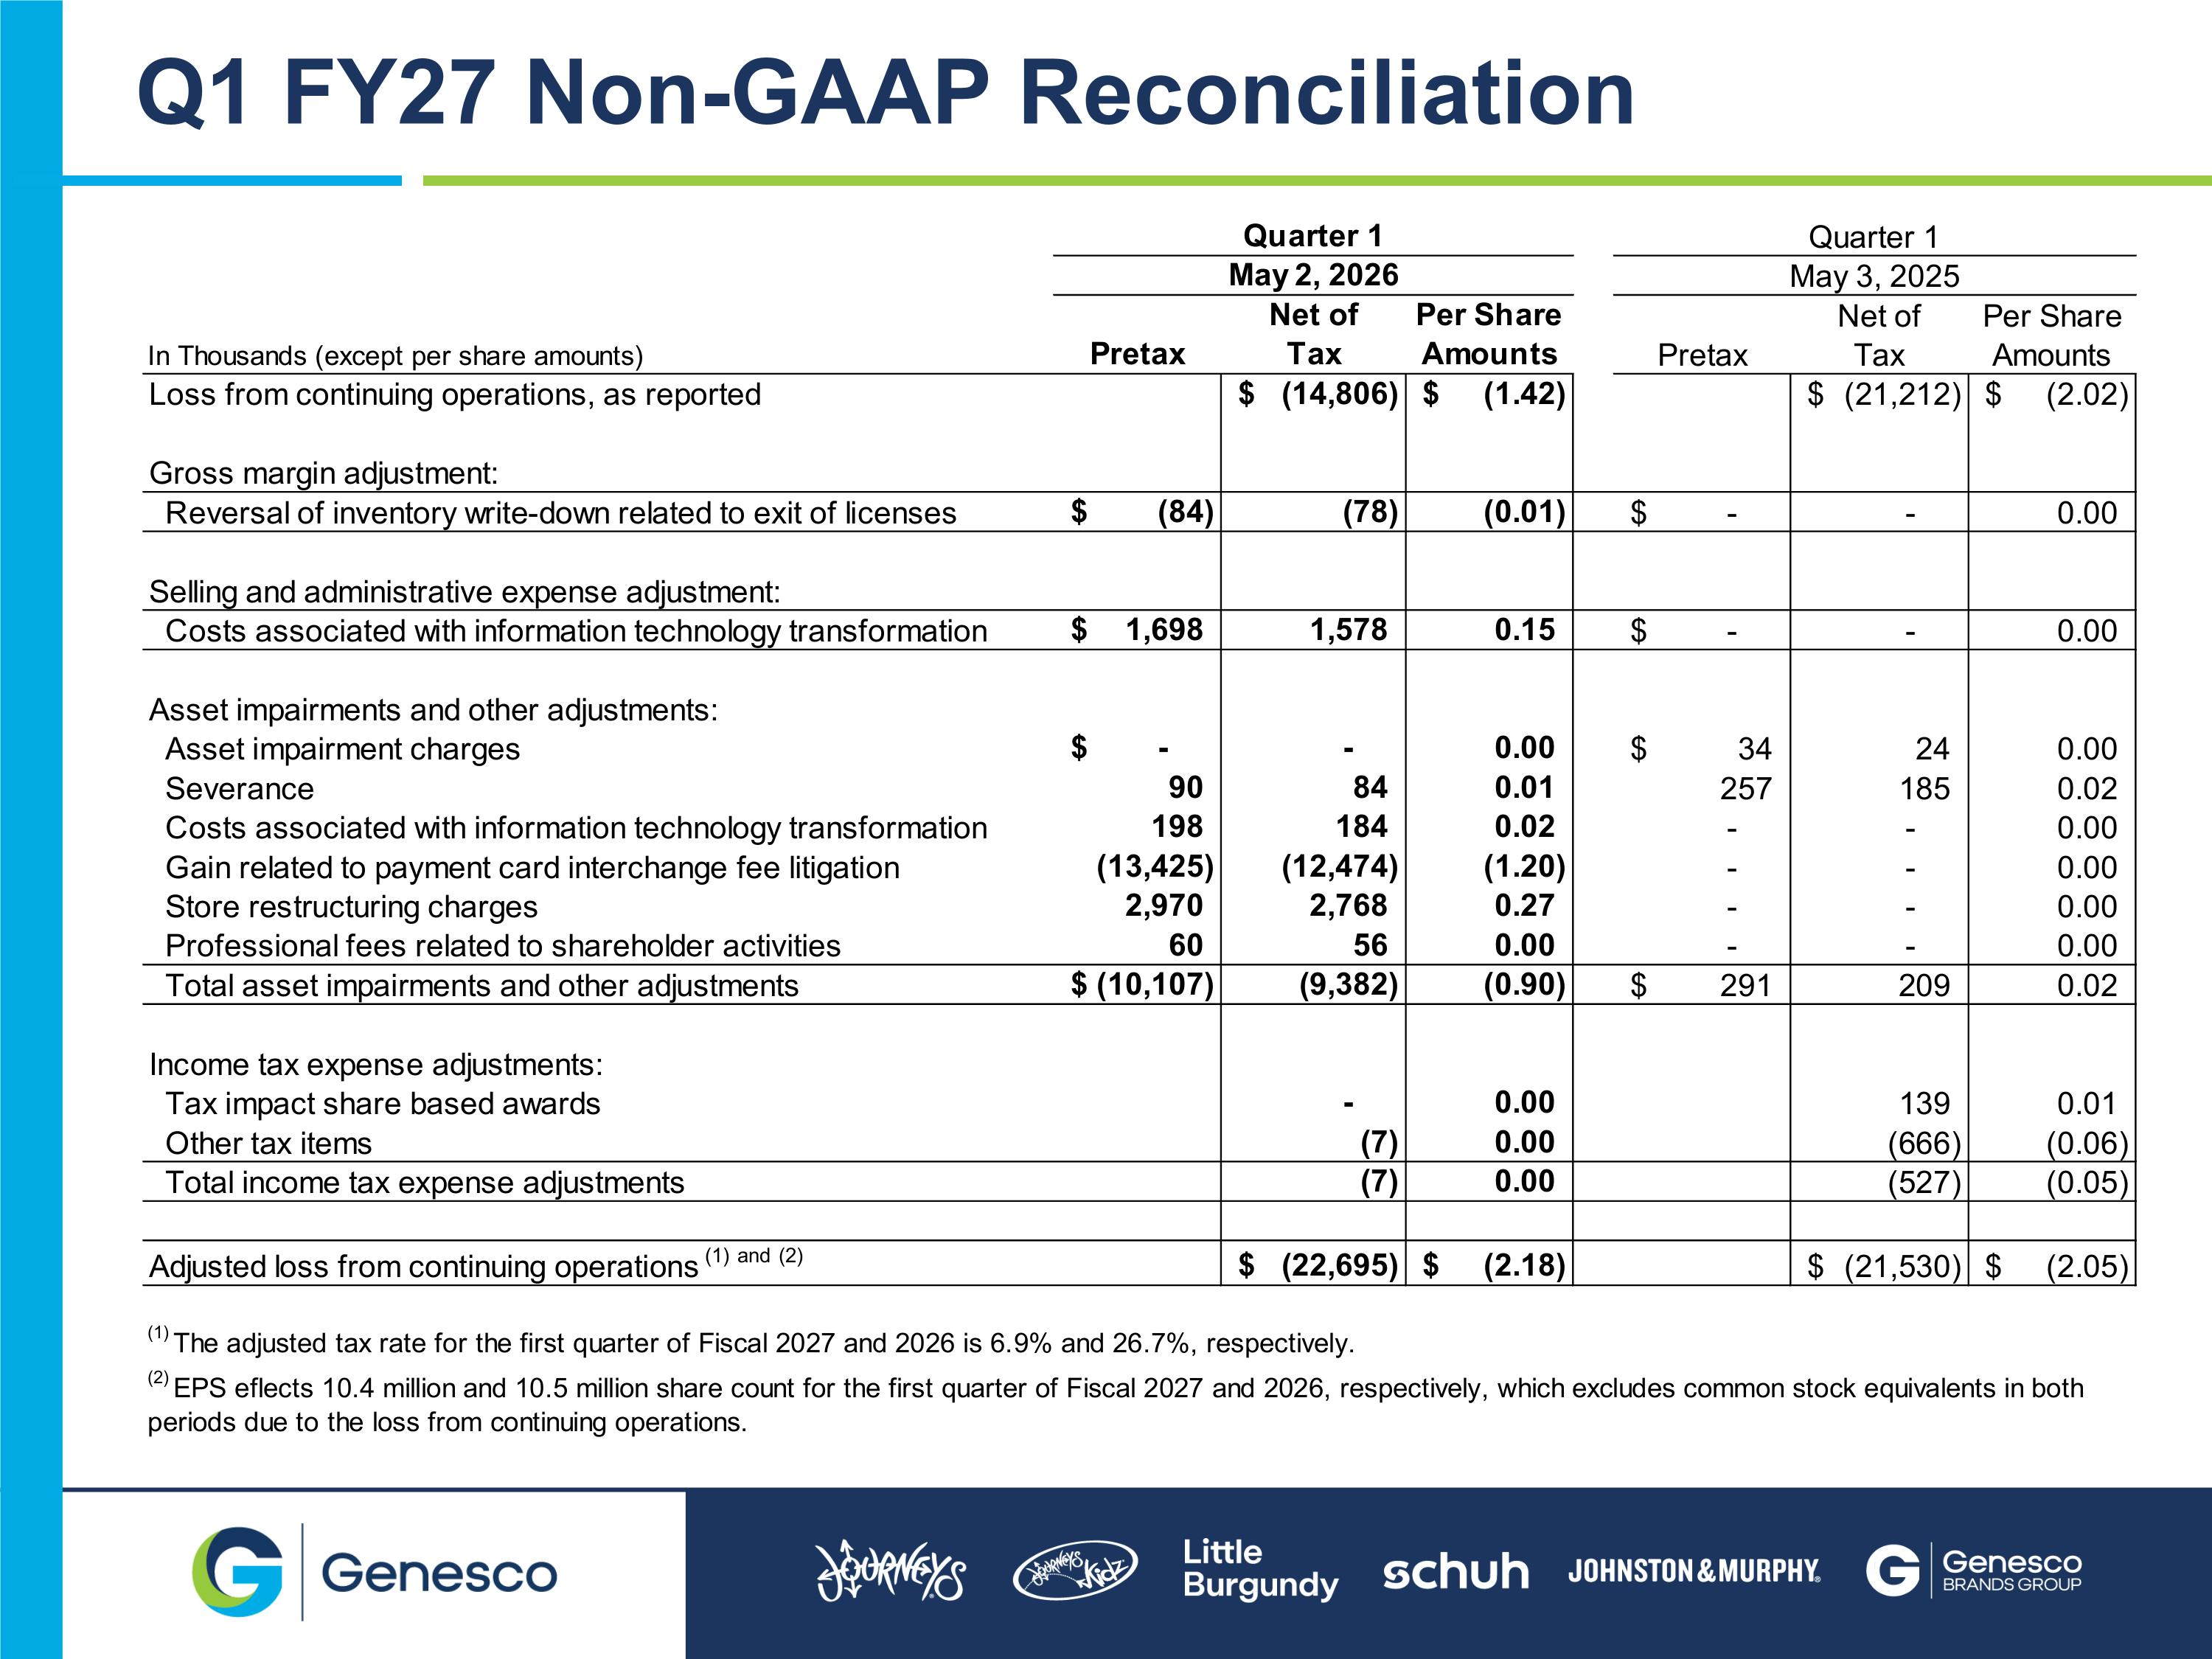
Q1 FY27 Non-GAAP Reconciliation
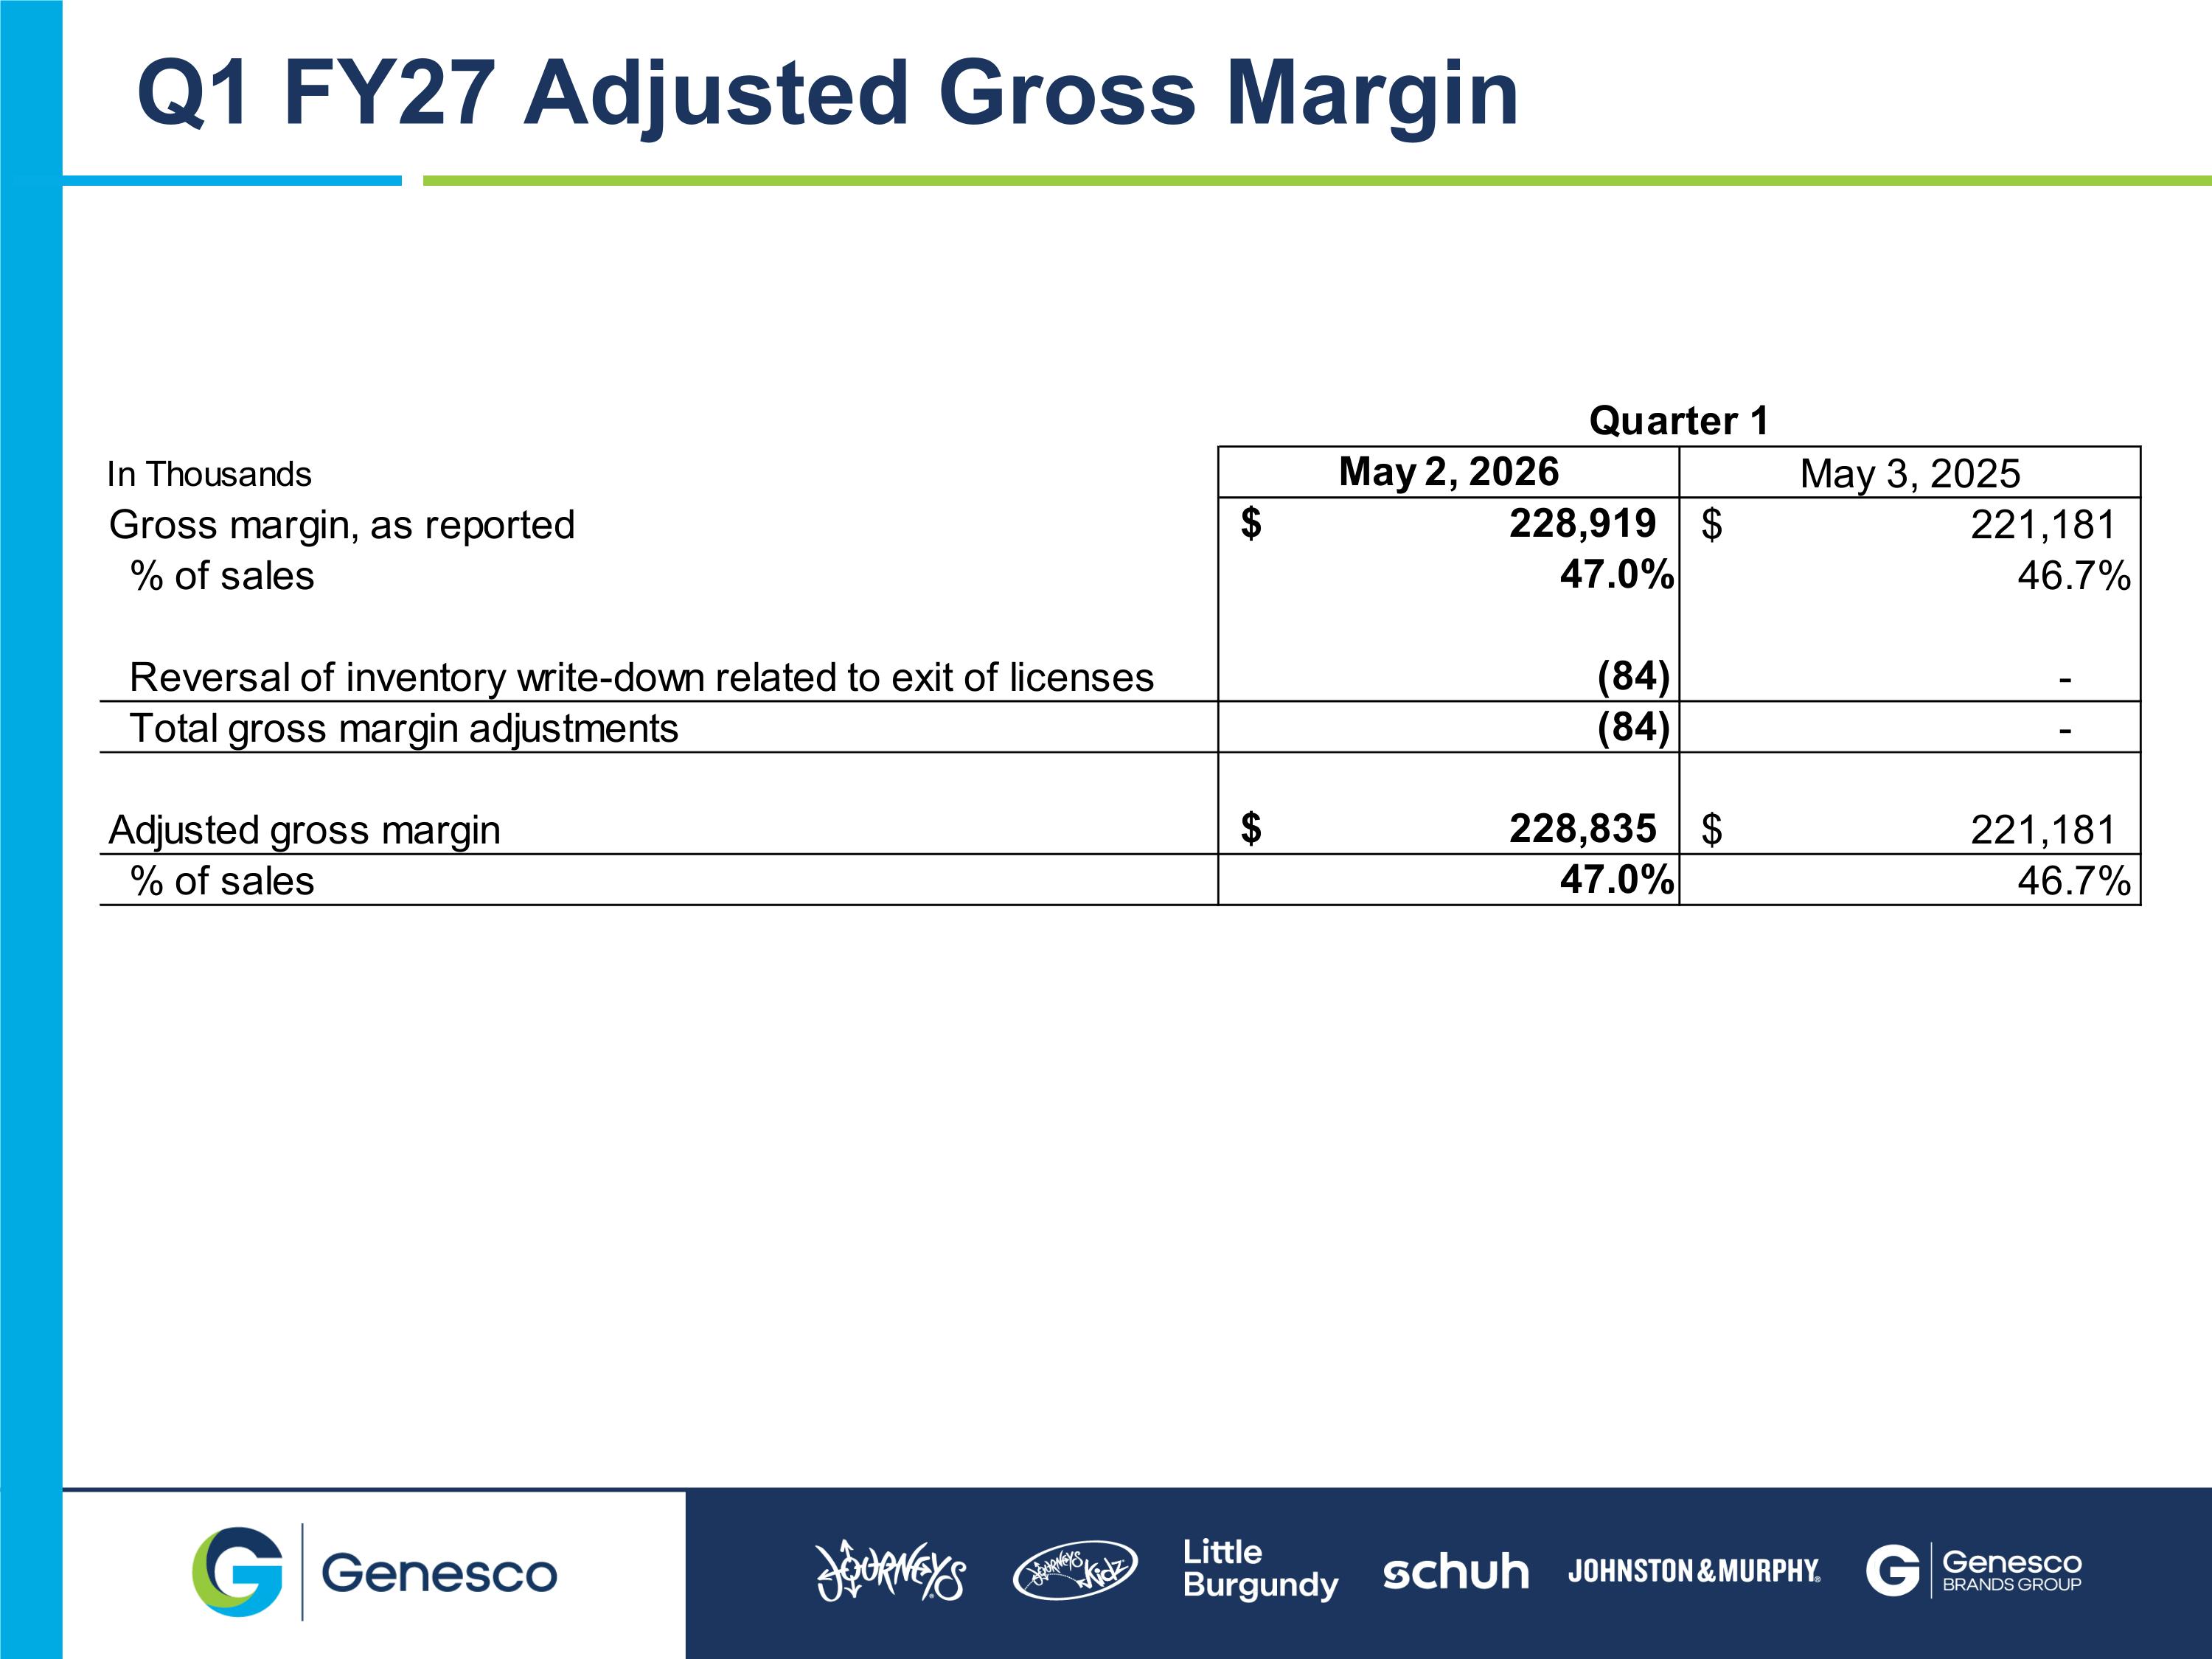
Q1 FY27 Adjusted Gross Margin
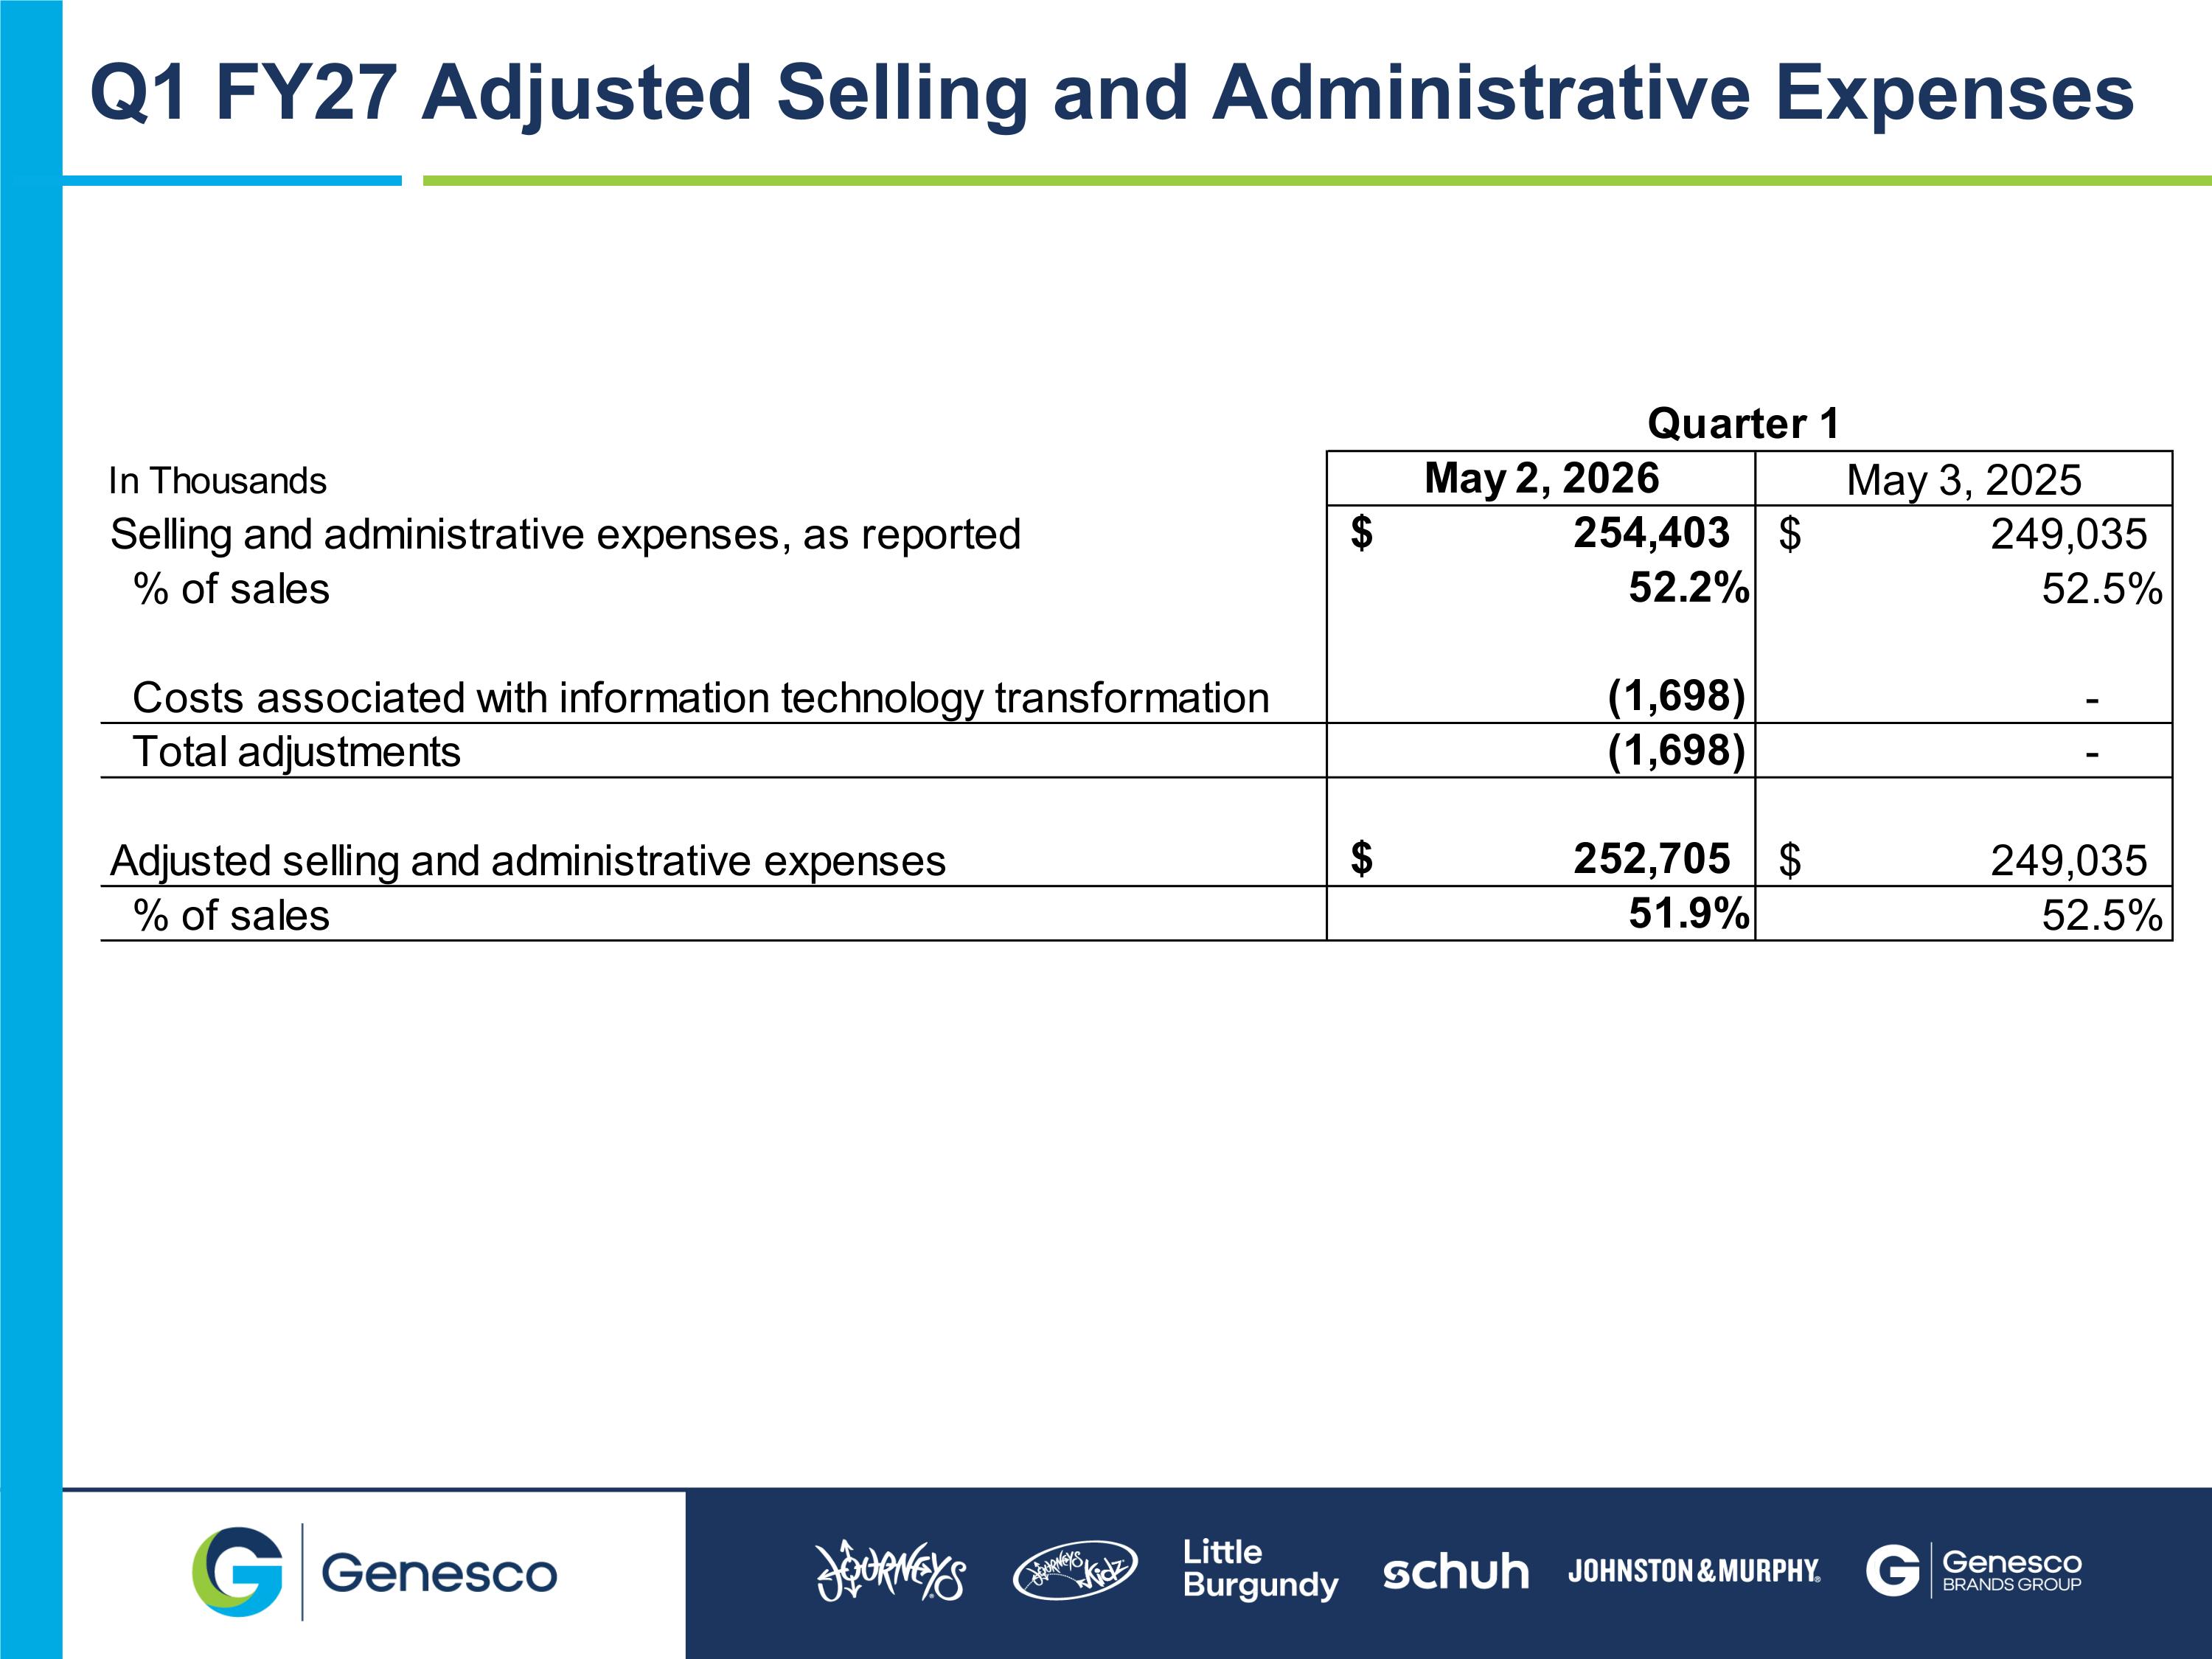
Q1 FY27 Adjusted Selling and Administrative Expenses
FY27 Q1 GENESCO Summary Results May 29, 2026