Pay vs Performance Disclosure - USD ($)
Dec. 31, 2025
Dec. 31, 2024
Dec. 31, 2023
Dec. 31, 2022
Dec. 31, 2021
Pay Versus Performance
As required by Section 953(a) of the Dodd-Frank Act, and Item 402(v) of Regulation
S-K,
we are providing the following information about the relationship between “compensation actually paid” to our named executive officers and certain financial performance metrics of our Company and the FTSE NAREIT All Mortgage Capped Index (the “FNMRC Index”), a published industry index of mortgage REITs, for the same period. The Compensation Committee has not historically evaluated, and does not currently evaluate “compensation actually paid” as calculated pursuant to Item 402(v)(2) of Regulation S-K
as part of its executive compensation determinations; accordingly, the Compensation Committee does not use any financial or non-financial
performance measure specifically to link executive “compensation actually paid” to our Company’s performance. For further information concerning our compensation philosophy, refer to “—Compensation Discussion and Analysis.” The following tables illustrate the compensation actually paid to our Chief Executive Officer (“PEO”) and our current and former Chief Financial Officers
(“non-PEO
NEOs”) for the years ended December 31, 2025, 2024, 2023, 2022 and 2021: | Year |
Summary Compensation Table Total for PEO |
Compensation Actually Paid to PEO (1) |
Average Summary Compensation Table Total for non-PEO NEOs (2) |
Average Compensation Actually Paid to non-PEO NEOs (1)(2) |
Value of Initial Fixed $100 Investment Based On: |
Net Income (4) |
Distributable Earnings (5) |
|||||||||||||||||||||||||
Total Stockholder Return (3) |
FNMRC Index Return (3) |
|||||||||||||||||||||||||||||||
| 2025 |
$ | 1,085,764 | $ | 1,378,103 | $ | 956,539 | $ | 1,006,635 | $ | 155 | $ | 112 | $ | 126,720 | $ | 148,695 | ||||||||||||||||
| 2024 |
$ | 743,724 | $ | 34,857 | $ | 703,783 | $ | 645,286 | $ | 128 | $ | 98 | $ | (119,636 | ) | $ | 61,316 | |||||||||||||||
| 2023 |
$ | 1,099,999 | $ | 1,694,641 | $ | 1,000,261 | $ | 1,028,736 | $ | 152 | $ | 98 | $ | 58,127 | $ | 157,534 | ||||||||||||||||
| 2022 |
$ | 2,200,163 | $ | 1,499,935 | $ | 1,233,608 | $ | 1,051,086 | $ | 123 | $ | 85 | $ | 265,232 | $ | 239,294 | ||||||||||||||||
| 2021 |
$ | 2,200,000 | $ | 3,129,238 | $ | 361,968 | $ | 429,051 | $ | 134 | $ | 117 | $ | 223,515 | $ | 188,679 | ||||||||||||||||
| (1) | Refer to the following table which illustrates the calculation of compensation actually paid for the years ended December 31, 2025, 2024 , 2023, 2022 and 2021: |
PEO |
Non-PEO NEOs(2) |
|||||||||||||||||||||||||||||||||||||||
2025 |
2024 |
2023 |
2022 |
2021 |
2025 |
2024 |
2023 |
2022 |
2021 |
|||||||||||||||||||||||||||||||
| Summary Compensation Table (“SCT”) Total |
1,085,764 | 743,724 | $ | 1,099,999 | $ | 2,200,163 | $ | 2,200,000 | 956,539 | 703,783 | $ | 1,000,261 | $ | 1,233,608 | $ | 361,968 | ||||||||||||||||||||||||
| SCT Stock Awards |
(1,085,764 | ) | (743,724 | ) | (1,099,999 | ) | (2,200,163 | ) | (2,200,000 | ) | (345,464 | ) | (194,595 | ) | (149,992 | ) | (249,999 | ) | — | |||||||||||||||||||||
| Year End Fair Value of Unvested Stock Awards |
1,059,495 | 735,234 | 1,067,272 | 2,085,794 | 2,212,525 | 337,106 | 192,373 | 145,529 | 218,406 | — | ||||||||||||||||||||||||||||||
| Year End Change In Fair Value of Prior Year Unvested Stock Awards |
88,641 | (385,684 | ) | 181,569 | (435,958 | ) | 362,071 | 19,321 | (46,295 | ) | 13,262 | — | 24,891 | |||||||||||||||||||||||||||
| Value of Awards Granted and Vested in the Same Year |
— | — | — | — | — | — | — | — | — | — | ||||||||||||||||||||||||||||||
| Change in Fair Value of Prior Year Stock Awards that Vested During the Year |
125,683 | (464,960 | ) | 186,418 | (404,210 | ) | 299,919 | 16,403 | (28,017 | ) | 730 | — | 24,681 | |||||||||||||||||||||||||||
| Fair Value of Stock Awards Forfeited |
— | — | — | — | — | — | — | — | (164,605 | ) | — | |||||||||||||||||||||||||||||
| Value of Dividends on Unvested Stock Awards |
104,284 | 150,266 | 259,384 | 254,309 | 254,723 | 22,730 | 18,037 | 18,946 | 13,676 | 17,511 | ||||||||||||||||||||||||||||||
| |
|
|
|
|
|
|
|
|
|
|
|
|
|
|
|
|
|
|
|
|||||||||||||||||||||
| Compensation Actually Paid |
1,378,103 |
34,857 |
$ |
1,694,641 |
$ |
1,499,935 |
$ |
3,129,238 |
1,006,635 |
645,286 |
$ |
1,028,736 |
$ |
1,051,086 |
$ |
429,051 |
||||||||||||||||||||||||
| |
|
|
|
|
|
|
|
|
|
|
|
|
|
|
|
|
|
|
|
|||||||||||||||||||||
| (2) | Includes compensation for Jai Agarwal and Ms. Mironova for the applicable period. Anastasia Mironova became our Chief Financial Officer, Treasurer and Secretary effective April 4, 2022, succeeding Jai Agarwal who resigned from these positions effective January 21, 2022. For purposes of determining compensation and compensation actually paid to non-PEO NEOs, we have shown the aggregate compensation for Mr. Agarwal and Ms. Mironova as they were non-PEO NEOs at different times of the year. |
| (3) | Total Stockholder Return and FNMRC Index return represents the return on a $100 investment for the year ended December 31, 2021, the two years ended December 31, 2022, the three years ended December 31, 2023, the four years ended December 31, 2024, and the five years ended December 31, 2025 assuming investment at the closing price on December 31, 2020 and reinvestment of all dividends. |
| (4) | Net Income as determined in accordance with accounting principles generally accepted in the United States (“GAAP”). Amounts in thousands. |
| (5) | Represents Distributable Earnings, a non-GAAP financial measure as defined below. Amounts in thousands. |
non-PEO
NEOs, we have shown the aggregate compensation for Mr. Agarwal and Ms. Mironova as they were non-PEO
NEOs at different times of the year.
| (1) | Refer to the following table which illustrates the calculation of compensation actually paid for the years ended December 31, 2025, 2024 , 2023, 2022 and 2021: |
PEO |
Non-PEO NEOs(2) |
|||||||||||||||||||||||||||||||||||||||
2025 |
2024 |
2023 |
2022 |
2021 |
2025 |
2024 |
2023 |
2022 |
2021 |
|||||||||||||||||||||||||||||||
| Summary Compensation Table (“SCT”) Total |
1,085,764 | 743,724 | $ | 1,099,999 | $ | 2,200,163 | $ | 2,200,000 | 956,539 | 703,783 | $ | 1,000,261 | $ | 1,233,608 | $ | 361,968 | ||||||||||||||||||||||||
| SCT Stock Awards |
(1,085,764 | ) | (743,724 | ) | (1,099,999 | ) | (2,200,163 | ) | (2,200,000 | ) | (345,464 | ) | (194,595 | ) | (149,992 | ) | (249,999 | ) | — | |||||||||||||||||||||
| Year End Fair Value of Unvested Stock Awards |
1,059,495 | 735,234 | 1,067,272 | 2,085,794 | 2,212,525 | 337,106 | 192,373 | 145,529 | 218,406 | — | ||||||||||||||||||||||||||||||
| Year End Change In Fair Value of Prior Year Unvested Stock Awards |
88,641 | (385,684 | ) | 181,569 | (435,958 | ) | 362,071 | 19,321 | (46,295 | ) | 13,262 | — | 24,891 | |||||||||||||||||||||||||||
| Value of Awards Granted and Vested in the Same Year |
— | — | — | — | — | — | — | — | — | — | ||||||||||||||||||||||||||||||
| Change in Fair Value of Prior Year Stock Awards that Vested During the Year |
125,683 | (464,960 | ) | 186,418 | (404,210 | ) | 299,919 | 16,403 | (28,017 | ) | 730 | — | 24,681 | |||||||||||||||||||||||||||
| Fair Value of Stock Awards Forfeited |
— | — | — | — | — | — | — | — | (164,605 | ) | — | |||||||||||||||||||||||||||||
| Value of Dividends on Unvested Stock Awards |
104,284 | 150,266 | 259,384 | 254,309 | 254,723 | 22,730 | 18,037 | 18,946 | 13,676 | 17,511 | ||||||||||||||||||||||||||||||
| |
|
|
|
|
|
|
|
|
|
|
|
|
|
|
|
|
|
|
|
|||||||||||||||||||||
| Compensation Actually Paid |
1,378,103 |
34,857 |
$ |
1,694,641 |
$ |
1,499,935 |
$ |
3,129,238 |
1,006,635 |
645,286 |
$ |
1,028,736 |
$ |
1,051,086 |
$ |
429,051 |
||||||||||||||||||||||||
| |
|
|
|
|
|
|
|
|
|
|
|
|
|
|
|
|
|
|
|
|||||||||||||||||||||
| (1) | Refer to the following table which illustrates the calculation of compensation actually paid for the years ended December 31, 2025, 2024 , 2023, 2022 and 2021: |
PEO |
Non-PEO NEOs(2) |
|||||||||||||||||||||||||||||||||||||||
2025 |
2024 |
2023 |
2022 |
2021 |
2025 |
2024 |
2023 |
2022 |
2021 |
|||||||||||||||||||||||||||||||
| Summary Compensation Table (“SCT”) Total |
1,085,764 | 743,724 | $ | 1,099,999 | $ | 2,200,163 | $ | 2,200,000 | 956,539 | 703,783 | $ | 1,000,261 | $ | 1,233,608 | $ | 361,968 | ||||||||||||||||||||||||
| SCT Stock Awards |
(1,085,764 | ) | (743,724 | ) | (1,099,999 | ) | (2,200,163 | ) | (2,200,000 | ) | (345,464 | ) | (194,595 | ) | (149,992 | ) | (249,999 | ) | — | |||||||||||||||||||||
| Year End Fair Value of Unvested Stock Awards |
1,059,495 | 735,234 | 1,067,272 | 2,085,794 | 2,212,525 | 337,106 | 192,373 | 145,529 | 218,406 | — | ||||||||||||||||||||||||||||||
| Year End Change In Fair Value of Prior Year Unvested Stock Awards |
88,641 | (385,684 | ) | 181,569 | (435,958 | ) | 362,071 | 19,321 | (46,295 | ) | 13,262 | — | 24,891 | |||||||||||||||||||||||||||
| Value of Awards Granted and Vested in the Same Year |
— | — | — | — | — | — | — | — | — | — | ||||||||||||||||||||||||||||||
| Change in Fair Value of Prior Year Stock Awards that Vested During the Year |
125,683 | (464,960 | ) | 186,418 | (404,210 | ) | 299,919 | 16,403 | (28,017 | ) | 730 | — | 24,681 | |||||||||||||||||||||||||||
| Fair Value of Stock Awards Forfeited |
— | — | — | — | — | — | — | — | (164,605 | ) | — | |||||||||||||||||||||||||||||
| Value of Dividends on Unvested Stock Awards |
104,284 | 150,266 | 259,384 | 254,309 | 254,723 | 22,730 | 18,037 | 18,946 | 13,676 | 17,511 | ||||||||||||||||||||||||||||||
| |
|
|
|
|
|
|
|
|
|
|
|
|
|
|
|
|
|
|
|
|||||||||||||||||||||
| Compensation Actually Paid |
1,378,103 |
34,857 |
$ |
1,694,641 |
$ |
1,499,935 |
$ |
3,129,238 |
1,006,635 |
645,286 |
$ |
1,028,736 |
$ |
1,051,086 |
$ |
429,051 |
||||||||||||||||||||||||
| |
|
|
|
|
|
|
|
|
|
|
|
|
|
|
|
|
|
|
|
|||||||||||||||||||||
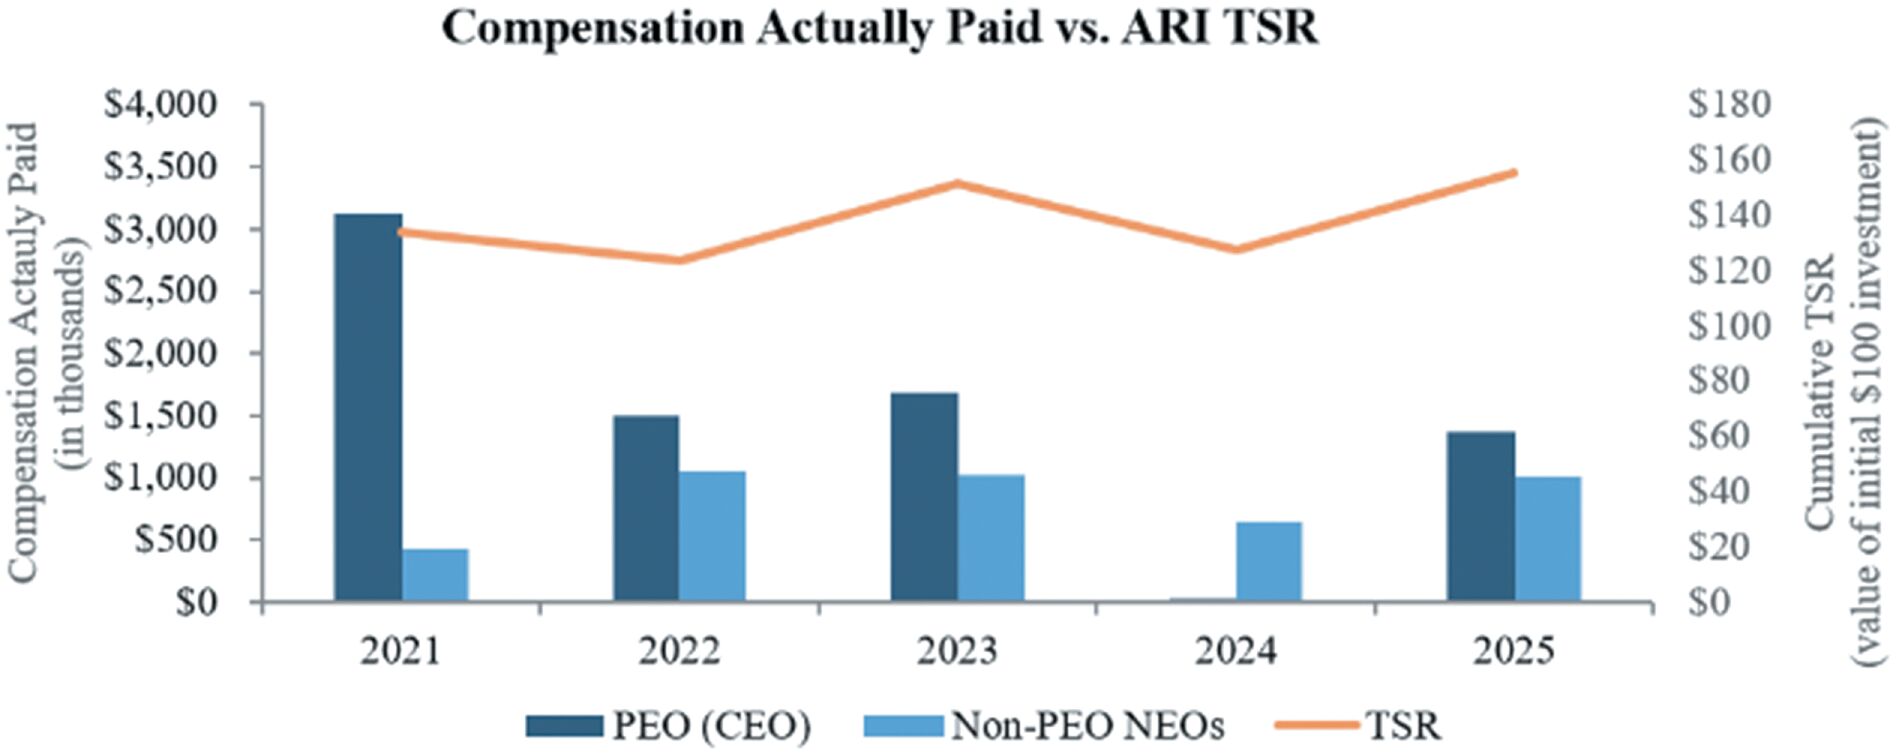
Compensation Actually Paid vs Total Stockholder Return (“TSR”)
: 
Compensation Actually Paid vs Net Income
(in thousands): 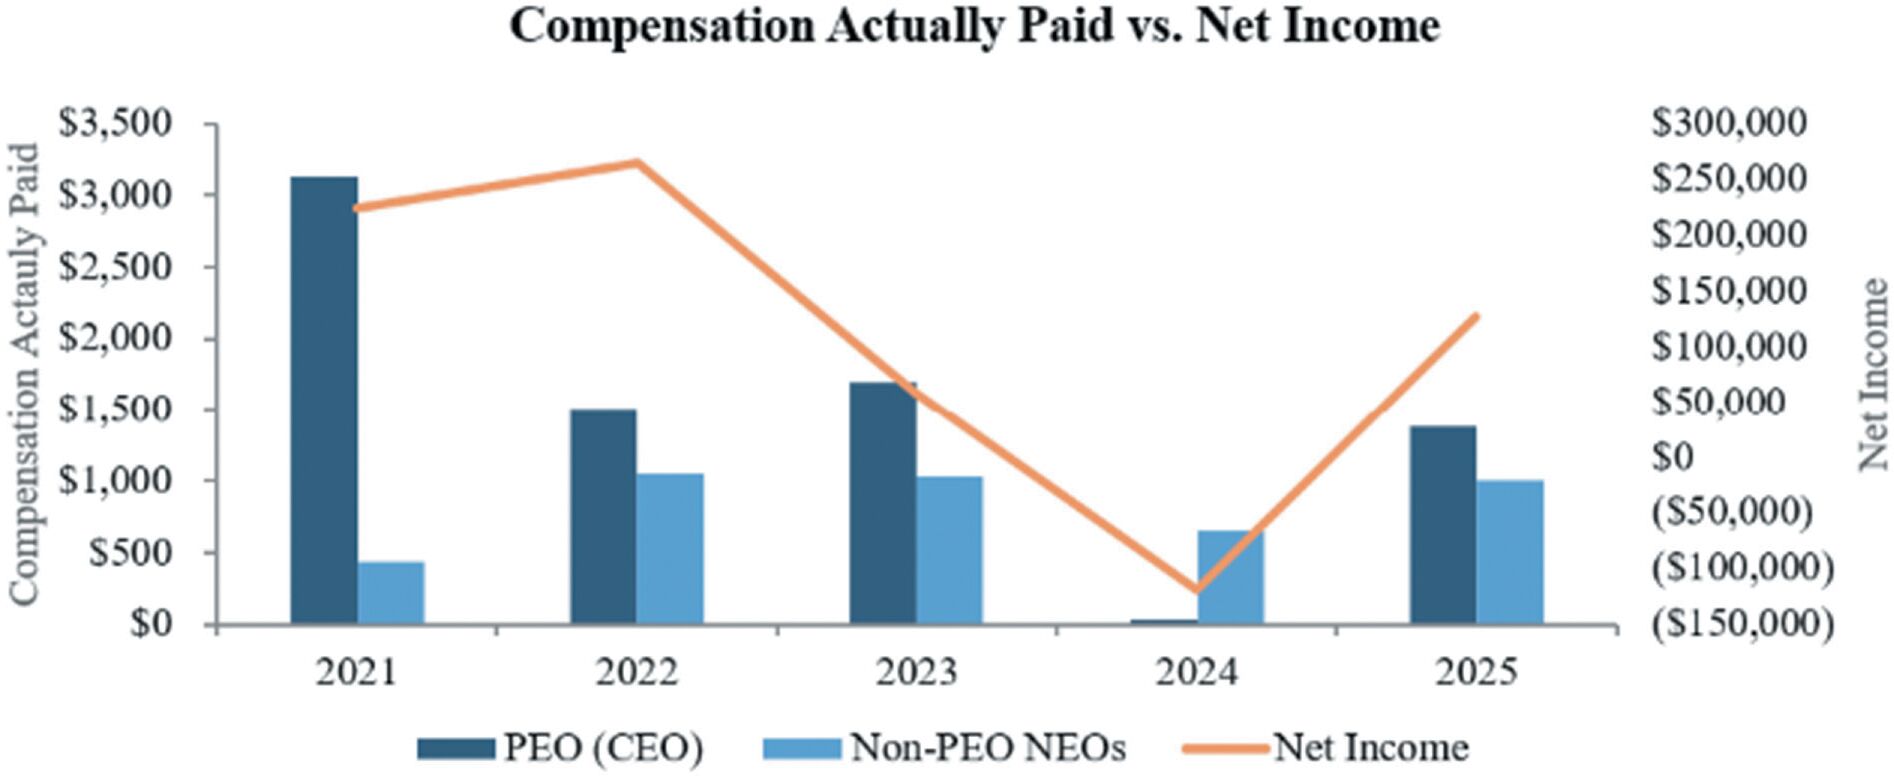
Compensation Actually Paid vs Distributable Earnings
(in thousand
s): 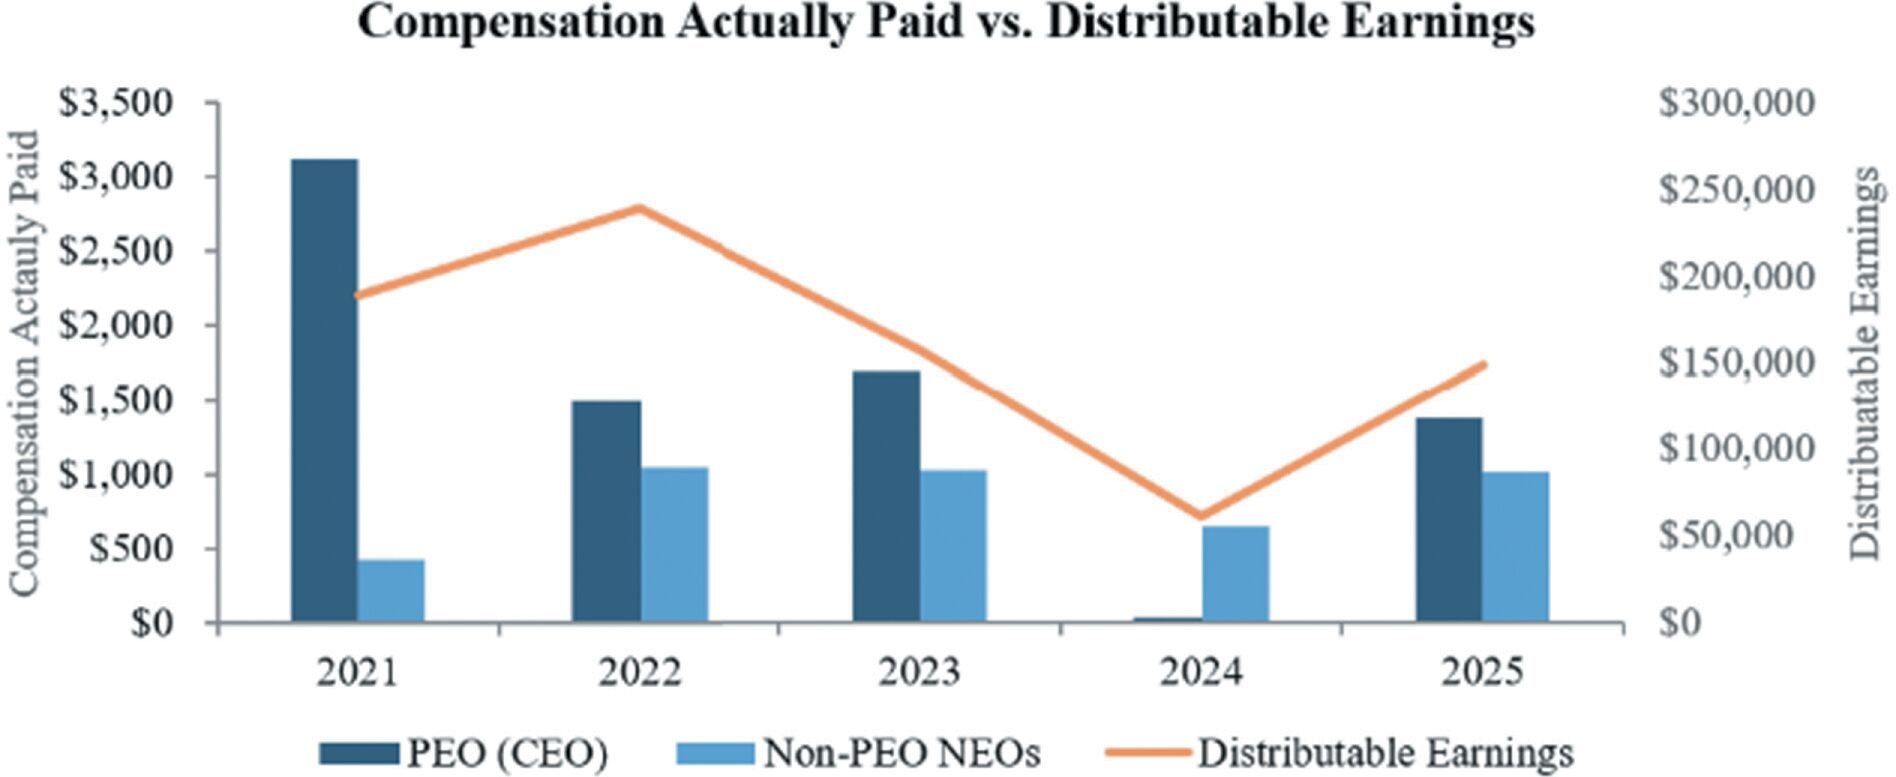
List of Financial Performance Measures
The Compensation Committee considers various financial performance metrics, along with other quantitative, qualitative, and
individual
performance measures when determining the appropriate compensation for our named executive officers. Pursuant to Item 402(v)(6) of Regulation S-K,
the most important measures considered for the year ended December 31, 2025 include: Most Important Financial Performance Measures |
| Distributable Earnings |
| Dividend Coverage Ratio |
| Book Value Per Share |
non-GAAP
financial measure as defined below. Amounts in thousands.