Pay Versus Performance
The information provided below is mandated by the Dodd-Frank Wall Street Reform and Consumer Protection Act and Item 402(v) of Regulation S-K, which requires that we, among other things, report the amount of “compensation actually paid” to our named executive officers. These amounts are calculated in accordance with applicable SEC rules, and do not reflect the actual amount of compensation earned by or paid to our named executive officers during each applicable year.
| Year | Summary | Compensation | SCT | CAP to | SCT | CAP to | Average | Average | Value of | Net Income | |||||||||||||||||||
| 2025 |
|
|
|
| $ | 2,810,918 | $ | 1,857,710 |
|
| $ | 1,199,426 | $ | 766,943 | $ | 36.05 | $ | 16,327 |
| ||||||||||
| 2024 | $ | 1,931,356 | $ | 229,973 |
| 2,085,768 |
| 1,477,303 | 305,390 | 302,602 | $ | 1,183,783 | $ | 1,084,937 | $ | 68.90 | $ | (66,948 | ) | ||||||||||
| 2023 | $ | 1,866,844 | $ | 1,388,914 |
|
|
|
|
|
| $ | 1,156,210 | $ | 928,550 | $ | 59.61 | $ | (82,465 | ) | ||||||||||
____________
(1) These columns reflect the SCT and CAP information with respect to Mr. Floroiu who resigned as Chief Executive Officer of the Company on January 15, 2024.
(2) These columns reflect the SCT and CAP information with respect to Mr. Lo, our current Chief Executive Officer.
(3) These columns reflect the SCT and CAP information with respect to Dr. Michael J. Finney, who has served as Interim Chief Executive Officer from January 16, 2024, until Mr. Lo’s appointment as Chief Executive Officer on March 18, 2024.
(4) As required by applicable SEC rules, CAP was calculated by beginning with the total amount reported in the SCT for the applicable year, (i) subtracting the grant date fair value of stock awards reported in the Stock Awards column of the SCT, (ii) subtracting the grant date fair value of option awards reported in the Option Awards column of the SCT, and (iii) adding the change in fair value of stock and option awards for the applicable year.
(5) Company total shareholder return (“TSR”) represents the cumulative investment return of an initial fixed $100 investment in our common stock during the period commencing on December 31, 2022 and ending on the last day of the covered fiscal year, assuming reinvestment of all dividends. The Company TSR reflected in the table above may not be indicative of future performance.
(6) Reflects net income (loss) for the covered fiscal year, as reported in our Form 10-K for such year.
Fair value amounts were computed in a manner consistent with the fair value methodology used to account for share-based payments in our financial statements under generally accepted accounting principles. The fair value amounts were calculated using our stock price on the last day of each fiscal year or the date of vesting, as applicable. For 2025, we used the following additional assumptions to determine the fair value of stock option awards under the Black-Scholes-Merton option-pricing model: (i) risk-free return rate: 3.53% – 4.53%; (ii) expected option term (in years): 4.20 – 6.56 years; and (iii) expected volatility: 88.94% – 125.69%.
Mr. Floroiu is included as the PEO for 2023. Mr. Floroiu, Dr. Michael Finney and Mr. Lo are included as PEO for 2024. Mr. Lo is included as the PEO for 2025. The non-PEO named executive officers included in the average for each covered fiscal year are: Dr. Tucker and Dr. Cummings.
Following is a reconciliation of the SCT total and the CAP for 2025.
| Fiscal Year | Executives | SCT | Grant | Year End | Change in | Change in | Fair | Fair | Total | CAP | |||||||||||||||||||||
| (A) | (B) | (C) | (D) | (E) | (F) | (G) | (H) | (I) | |||||||||||||||||||||||
| 2025 | PEO: Steven Lo | $ | 2,810,918 | $ | (1,741,113 | ) | $ | 1,069,891 | $ | (251,569 | ) | $ | (86,416 | ) | $ | 56,000 |
| $ | 787,905 | $ | 1,857,710 | ||||||||||
| 2025 | Non-PEO NEO Average | $ | 1,199,426 | $ | (498,779 | ) | $ | 316,317 | $ | (168,250 | ) | $ | (81,772 | ) |
|
|
| $ | 66,296 | $ | 766,943 | ||||||||||
____________
(A) The dollar amounts reported in the Summary Compensation Table for 2025.
(B) The grant date fair value of equity awards represents the total of the amounts reported in the “Stock Awards” and “Option Awards” columns in the Summary Compensation Table for 2025.
(H) The recalculated value of equity awards for 2025 includes the addition (or subtraction, as applicable) of the following:
(C) The year-end fair value of any equity awards granted in the year that are outstanding and unvested as of the end of the year;
(D) the amount of change as of the end of the year (from the end of the prior fiscal year) in fair value of any awards granted in prior years that are outstanding and unvested as of the end of the applicable year;
(E) for awards that vest in the year, the change in the fair value as of the vesting date from the beginning of the year;
(F) for awards that are granted and vest in the year, the change in the fair value as of the vesting date from the beginning of the year; and
(G) for awards that failed to meet vesting conditions in the year, the fair value at the start of the fiscal year.
(1) These columns reflect the SCT and CAP information with respect to Mr. Floroiu who resigned as Chief Executive Officer of the Company on January 15, 2024.
(2) These columns reflect the SCT and CAP information with respect to Mr. Lo, our current Chief Executive Officer.
(3) These columns reflect the SCT and CAP information with respect to Dr. Michael J. Finney, who has served as Interim Chief Executive Officer from January 16, 2024, until Mr. Lo’s appointment as Chief Executive Officer on March 18, 2024.
Required Supplemental Graphs Showing Relationship Between:
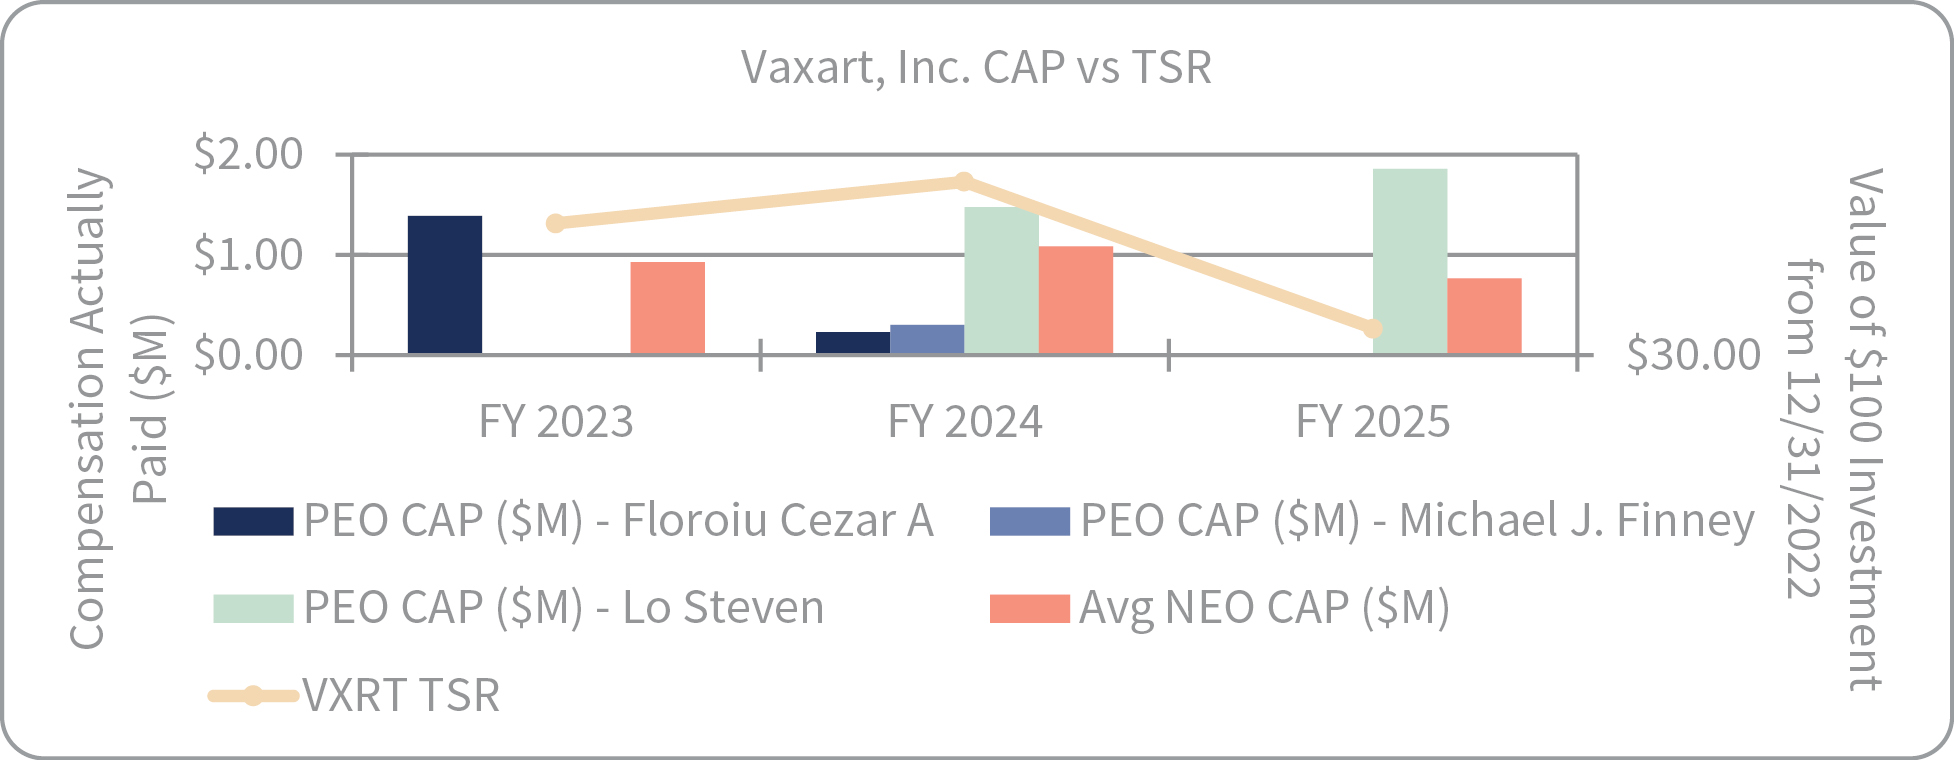
CAP and Company TSR
The graph below illustrates the relationship between the CAP to our PEO and the other NEOs and the Company’s TSR during the period covered by the Pay versus Performance Table.
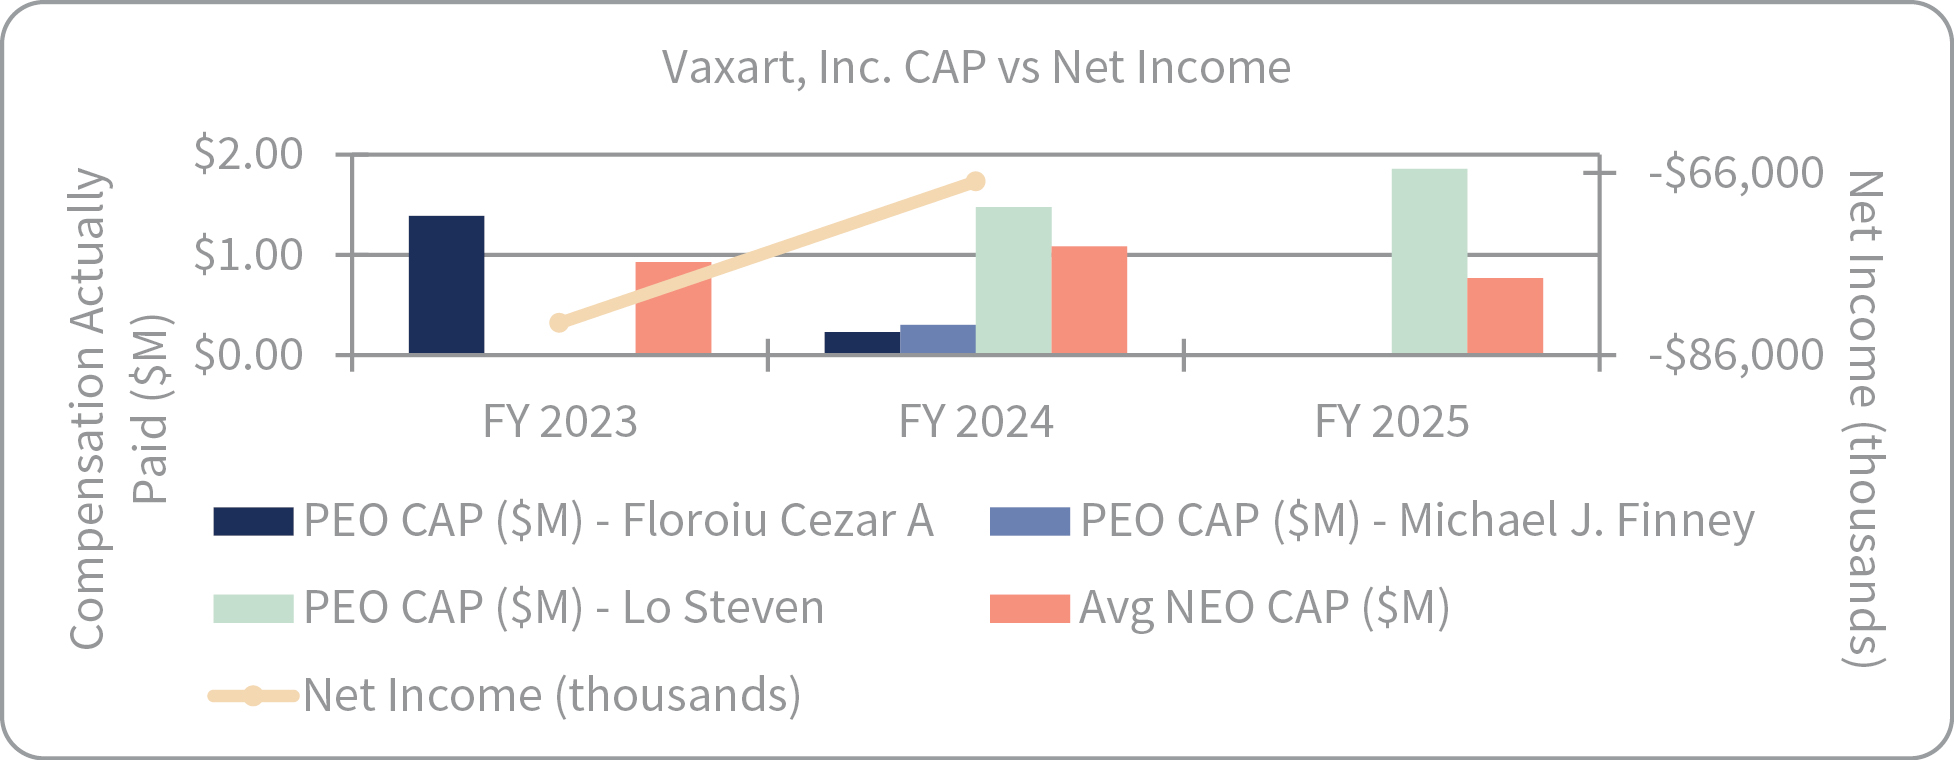
CAP and Net Income
The graph below illustrates the relationship between the CAP to our PEO and the other NEOs and the Company’s net income during the period covered by the Pay versus Performance Table.
| [1] | As required by applicable SEC rules, CAP was calculated by beginning with the total amount reported in the SCT for the applicable year, (i) subtracting the grant date fair value of stock awards reported in the Stock Awards column of the SCT, (ii) subtracting the grant date fair value of option awards reported in the Option Awards column of the SCT, and (iii) adding the change in fair value of stock and option awards for the applicable year. |
| [2] | Company total shareholder return (“TSR”) represents the cumulative investment return of an initial fixed $100 investment in our common stock during the period commencing on December 31, 2022 and ending on the last day of the covered fiscal year, assuming reinvestment of all dividends. The Company TSR reflected in the table above may not be indicative of future performance. |
| [3] | Reflects net income (loss) for the covered fiscal year, as reported in our Form 10-K for such year. |
| [4] | These columns reflect the SCT and CAP information with respect to Mr. Floroiu who resigned as Chief Executive Officer of the Company on January 15, 2024. |
| [5] | These columns reflect the SCT and CAP information with respect to Mr. Lo, our current Chief Executive Officer. |
| [6] | These columns reflect the SCT and CAP information with respect to Dr. Michael J. Finney, who has served as Interim Chief Executive Officer from January 16, 2024, until Mr. Lo’s appointment as Chief Executive Officer on March 18, 2024. |
| [7] | The dollar amounts reported in the Summary Compensation Table for 2025. |
| [8] | The grant date fair value of equity awards represents the total of the amounts reported in the “Stock Awards” and “Option Awards” columns in the Summary Compensation Table for 2025. |
| [9] | The year-end fair value of any equity awards granted in the year that are outstanding and unvested as of the end of the year; |
| [10] | the amount of change as of the end of the year (from the end of the prior fiscal year) in fair value of any awards granted in prior years that are outstanding and unvested as of the end of the applicable year; |
| [11] | for awards that vest in the year, the change in the fair value as of the vesting date from the beginning of the year; |
| [12] | for awards that are granted and vest in the year, the change in the fair value as of the vesting date from the beginning of the year; and |
| [13] | for awards that failed to meet vesting conditions in the year, the fair value at the start of the fiscal year. |
| [14] | The recalculated value of equity awards for 2025 includes the addition (or subtraction, as applicable) of the following: |