Fund’s Past Performance
The performance information shows summary performance information for the Fund in a bar chart and an Average Annual Total Returns table. The information provides some indication of the risks of investing in the Fund by showing changes in its performance from year to year and by showing how the Fund’s average annual returns compare with the returns of a broad-based securities market index.
The Nightview Capital Fund, LP – Series B (formerly known as The Worm Capital Fund, LP – Series B), a privately offered fund which employed the same investment strategy as the Fund and was managed by the Fund’s portfolio managers (the “Predecessor Fund), was reorganized into the Fund on June 21, 2024, subsequent to the transfer of assets by the Predecessor Fund. The Predecessor Fund, which commenced operations on March 1, 2018, had an investment objective and strategies that were, in all material respects, the same as those of the Fund, and was managed in a manner that, in all material respects, complied with the investment guidelines and restrictions of the Fund. However, the privately offered fund was not registered as an investment company under the Investment Company Act of 1940 (the “1940 Act”), and the privately offered fund was not subject to certain investment limitations, diversification requirements, liquidity requirements, and other restrictions imposed by the 1940 Act and the Internal Revenue Code of 1986, as amended, which, if applicable, may have adversely affected its performance.
The Fund’s performance for periods prior to the commencement of operations on June 21, 2024 is that of the Predecessor Fund (Predecessor Fund performance shown is net of a 1.25% annual management fee in addition to expenses such as audit, tax, and administration fees passed through to investors). The performance of the Predecessor Fund has not been restated to reflect the fees, expenses, and fee waivers and/or expense limitations applicable to shares of the Fund. However, if the performance of the Predecessor Fund had been restated to reflect the applicable fees and expenses of the shares of the Fund, the performance would have been slightly higher than the performance shown in the bar chart and Average Annual Total Returns table below because of the passthrough of related fund expenses to investors of the Predecessor Fund. The Fund will have a 1.25% management fee but will not pass through other fund expenses, which will be borne by the Adviser. For periods following the Fund’s commencement of operations on June 21, 2024, the performance shown is the performance of the Fund’s shares and may differ as a result of the different levels of fees and expenses applicable to the Fund’s shares. The Fund’s past performance, before and after taxes, is not necessarily an indication of how the Fund will perform in the future.
Updated information on the Fund’s performance results can be obtained by visiting www.nightviewfund.com or by calling toll-free at (866) 666-7156.
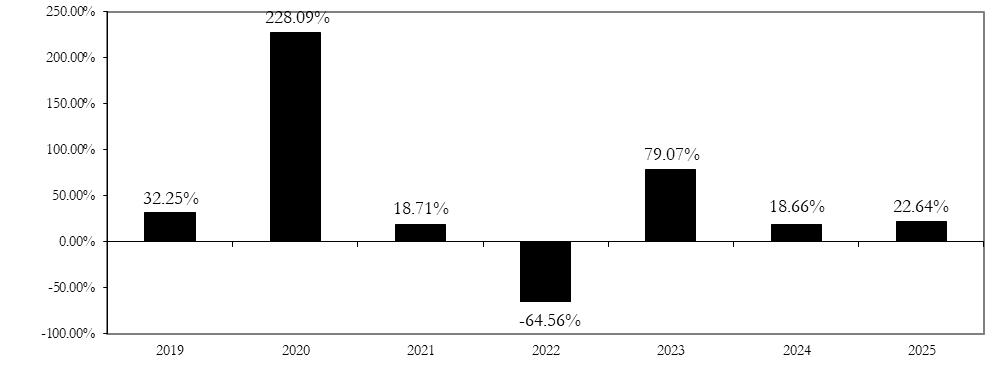
| 1 | The reported Total Return figures for the Predecessor Fund for each of the calendar years referenced in the bar chart above prior to June 21, 2024 may be slightly lower than those reflected in the Predecessor Fund’s audited financial statements because the performance figures in the audited financial statements reflect the fact that the Predecessor Fund’s management fee was either not charged or was charged at a lower rate to certain investors of the Predecessor Fund, including investors who were employees or otherwise affiliated with the Predecessor Fund’s General Partner/Investment Adviser, while the performance results in the bar chart assume that a 1.25% management fee was paid by all investors in addition to passthrough expenses such as audit, tax, and administration fees. |
Best and Worst Quarter Returns (for the period reflected in the bar chart above)
During the periods shown in the bar chart, the Fund’s highest return for a calendar quarter was 54.72% (quarter ending 03/31/2023) and the Fund’s lowest return for a calendar quarter was (45.51)% (quarter ending 12/31/2022).
The Fund’s year-to-date return as of March 31, 2026 is (7.88)%.
The following table shows how average annual total returns of the Fund compared to those of the Fund’s benchmark.
| 1 Year | 5 Years | Since Inception (03/01/2018) | |
| Fund Return Before Taxes1 | 22.64% | 1.86% | 21.36% |
| Return After Taxes on Distribution1, 2 | 22.64% | 1.86% | 21.36% |
| Return After Taxes on Distribution and Sale of Fund Shares2 | 13.40% | 1.43% | 18.22% |
| S&P 500® Total Return Index (reflects no deduction for fees, expenses or taxes)3 |
17.88% | 14.42% | 14.58% |
| 1 | The Fund is the accounting successor to The Nightview Capital Fund, LP - Series B (formerly known as The Worm Capital Fund, LP – Series B), a privately offered fund which employed the same investment strategy as the Fund and was managed by the Fund’s portfolio managers, and for which the Adviser served as the sole adviser (the “Predecessor Fund”). In a transaction consummated on June 21, 2024, the Fund acquired the assets and liabilities of the Predecessor Fund. Accordingly, the performance results shown above in the bar chart and the average annual total returns table for periods prior to June 21, 2024 represent the performance of the Predecessor Fund. The Fund’s performance has not been restated to reflect any differences in expenses paid by the Predecessor Fund and those paid by the Fund. | |
| 2 | After-tax returns are calculated using the highest historical individual federal marginal income tax rates and do not reflect the impact of state and local taxes. Your actual after-tax returns will depend on your tax situation and may differ from those shown. After-tax returns shown are not relevant to investors who hold their shares through tax-deferred arrangements, such as 401(k) plans or individual retirement accounts. In some cases, the return after taxes may exceed the return before taxes due to an assumed tax benefit from any losses on a sale of shares of the Fund at the end of the measurement period. |
| 3 | The S&P 500® Total Return Index is market-cap weighted index of 500 leading US companies covering approximately 80% of available market capitalization and is widely regarded as the best single gauge of large-cap U.S. equities. Total return indices compute the index value based on capital gains plus cash payments such as dividends and interest. |