Shareholder Report
|
12 Months Ended |
|
Mar. 31, 2026
USD ($)
shares
|
|---|
| Shareholder Report [Line Items] |
|
| Document Type |
N-CSR
|
| Amendment Flag |
false
|
| Registrant Name |
NEIMAN FUNDS
|
| Entity Central Index Key |
0001215880
|
| Entity Investment Company Type |
N-1A
|
| Document Period End Date |
Mar. 31, 2026
|
| Shareholder Report Annual or Semi-Annual |
annual shareholder report
|
| Neiman Large Cap Value Fund | No-Load Shares |
|
| Shareholder Report [Line Items] |
|
| Fund Name |
Neiman Large Cap Value Fund
|
| Class Name |
No-Load Shares
|
| Trading Symbol |
NEIMX
|
| Annual or Semi-Annual Statement [Text Block] |
This annual shareholder report contains important information about the Neiman Large Cap Value Fund ("Fund") for the period of April 1, 2025 to March 31, 2026.
|
| Additional Information [Text Block] |
You can find additional information about the Fund at https://www.neimanfunds.com/#Literature. You can also request this information by contacting us at 1-877-385-2720.
|
| Material Fund Change Notice [Text Block] |
This report describes changes to the Fund that occurred during the reporting period.
|
| Additional Information Phone Number |
1-877-385-2720
|
| Additional Information Website |
https://www.neimanfunds.com/#Literature
|
| Expenses [Text Block] |
| No-Load Shares |
$151 |
1.34% |
|
| Expenses Paid, Amount |
$ 151
|
| Expense Ratio, Percent |
1.34%
|
| Factors Affecting Performance [Text Block] |
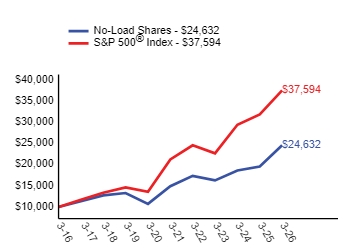
Management attributes the Fund's performance, in comparison to that of its benchmark, to a variety of factors. The Fund's portfolio is actively managed, meaning that stocks are added and/or removed based on management's decision if the stock fits management's value criteria. The difference between the Fund and the benchmark, the S&P 500 Index (the "Index"), is the Index is a passively managed basket of 500 different stocks. Many feel that the Index is a good indicator of the performance of the entire stock market in general. As a part of the Fund's risk mitigation strategy, investors should be aware that during market upswings, the Fund may underperform the benchmark. However, during market downturns the Fund typically outperforms the benchmark. For the period covered in this report, the Fund outperformed the S&P 500 due to the combination of holding quality stocks and being patient during market downswings. The Fund will continue to hold high quality value stocks and the continued use of buying dividend-paying companies with good balance sheets and strong cash flows even when value stocks are out of favor. |
| Performance Past Does Not Indicate Future [Text] |
The Fund's past performance is not a good predictor of the Fund's future performance.
|
| Line Graph [Table Text Block] |
|
| Average Annual Return [Table Text Block] |
|
No-Load Shares |
25.74%
|
10.56%
|
9.43%
|
|
S&P 500® Index |
17.80%
|
12.06%
|
14.16%
|
|
| No Deduction of Taxes [Text Block] |
The graph and table do not reflect the deduction of taxes that a shareholder would pay on fund distributions or redemption of fund shares.
|
| Material Change Date |
Aug. 01, 2025
|
| Net Assets |
$ 52,083,993
|
| Holdings Count | shares |
37
|
| Advisory Fees Paid, Amount |
$ 354,013
|
| Investment Company, Portfolio Turnover |
0.00%
|
| Additional Fund Statistics [Text Block] |
| Net Assets ($) |
$52,083,993 |
| Number of Portfolio Holdings |
37 |
| Portfolio Turnover Rate (%) |
0% |
| Total Advisory Fees Paid (Net Waiver) ($) |
$354,013 |
|
| Holdings [Text Block] |
|
Goldman Sachs Financial Square Government Fund
|
8.72% |
|
Lam Research Corporation
|
5.54% |
|
Costco Wholesale Corporation
|
4.59% |
|
RTX Corporation
|
4.22% |
|
Broadcom Inc.
|
3.86% |
|
Exxon Mobil Corporation
|
3.58% |
|
Apple Inc.
|
3.51% |
|
Johnson & Johnson
|
3.10% |
|
Sempra Energy
|
3.04% |
|
NVIDIA Corporation
|
2.95% |
|
Information Technology
|
30.81% |
|
Consumer Staples
|
12.37% |
|
Financials
|
11.56% |
|
Energy
|
11.29% |
|
Net Cash*
|
9.20% |
|
Industrials
|
8.60% |
|
Health Care
|
7.98% |
|
Utilities
|
3.04% |
|
Materials
|
2.93% |
|
Real Estate Investment Trust
|
2.22% |
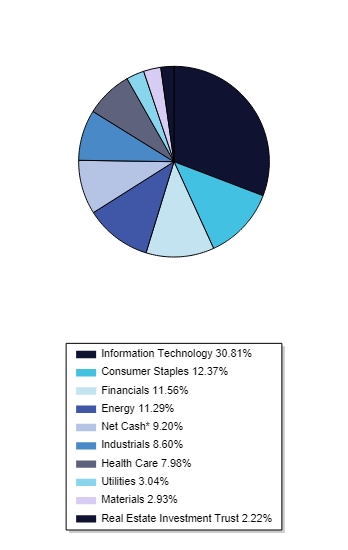 | | * | Net Cash represents cash, cash equivalents and other assets in excess of liabilities. |
|
| Largest Holdings [Text Block] |
|
Goldman Sachs Financial Square Government Fund
|
8.72% |
|
Lam Research Corporation
|
5.54% |
|
Costco Wholesale Corporation
|
4.59% |
|
RTX Corporation
|
4.22% |
|
Broadcom Inc.
|
3.86% |
|
Exxon Mobil Corporation
|
3.58% |
|
Apple Inc.
|
3.51% |
|
Johnson & Johnson
|
3.10% |
|
Sempra Energy
|
3.04% |
|
NVIDIA Corporation
|
2.95% |
|
| Material Fund Change [Text Block] |
Effective August 1, 2025, the Adviser has contractually agreed to waive management fees and reimburse expenses, without recoupment, to the extent necessary to maintain total annual operating expenses of the Fund (excluding brokerage fees and commissions, interest and other borrowing expenses, taxes, indirect expenses (such as expenses of other investment companies in which the Fund invests) and extraordinary expenses) at 1.29% of its average daily net assets for No-Load shares through July 31, 2026. The fee waiver will automatically terminate on July 31, 2026, unless it is renewed by the Adviser. The Adviser may not terminate the fee waiver or expense reimbursement before July 31, 2026. |
| Material Fund Change Expenses [Text Block] |
Effective August 1, 2025, the Adviser has contractually agreed to waive management fees and reimburse expenses, without recoupment, to the extent necessary to maintain total annual operating expenses of the Fund (excluding brokerage fees and commissions, interest and other borrowing expenses, taxes, indirect expenses (such as expenses of other investment companies in which the Fund invests) and extraordinary expenses) at 1.29% of its average daily net assets for No-Load shares through July 31, 2026. The fee waiver will automatically terminate on July 31, 2026, unless it is renewed by the Adviser. The Adviser may not terminate the fee waiver or expense reimbursement before July 31, 2026.
|
| Neiman Large Cap Value Fund | Class A Shares |
|
| Shareholder Report [Line Items] |
|
| Fund Name |
Neiman Large Cap Value Fund
|
| Class Name |
Class A
|
| Trading Symbol |
NEAMX
|
| Annual or Semi-Annual Statement [Text Block] |
This annual shareholder report contains important information about the Neiman Large Cap Value Fund ("Fund") for the period of April 1, 2025 to March 31, 2026.
|
| Additional Information [Text Block] |
You can find additional information about the Fund at https://www.neimanfunds.com/#Literature. You can also request this information by contacting us at 1-877-385-2720.
|
| Material Fund Change Notice [Text Block] |
This report describes changes to the Fund that occurred during the reporting period.
|
| Additional Information Phone Number |
1-877-385-2720
|
| Additional Information Website |
https://www.neimanfunds.com/#Literature
|
| Expenses [Text Block] |
|
| Expenses Paid, Amount |
$ 151
|
| Expense Ratio, Percent |
1.34%
|
| Factors Affecting Performance [Text Block] |
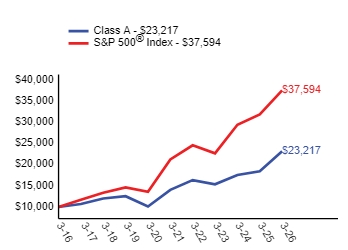
Management attributes the Fund's performance, in comparison to that of its benchmark, to a variety of factors. The Fund's portfolio is actively managed, meaning that stocks are added and/or removed based on management's decision if the stock fits management's value criteria. The difference between the Fund and the benchmark, the S&P 500 Index (the "Index"), is the Index is a passively managed basket of 500 different stocks. Many feel that the Index is a good indicator of the performance of the entire stock market in general. As a part of the Fund's risk mitigation strategy, investors should be aware that during market upswings, the Fund may underperform the benchmark. However, during market downturns the Fund typically outperforms the benchmark. For the period covered in this report, the Fund outperformed the S&P 500 due to the combination of holding quality stocks and being patient during market downswings. The Fund will continue to hold high quality value stocks and the continued use of buying dividend-paying companies with good balance sheets and strong cash flows even when value stocks are out of favor. |
| Performance Past Does Not Indicate Future [Text] |
The Fund's past performance is not a good predictor of the Fund's future performance.
|
| Line Graph [Table Text Block] |
|
| Average Annual Return [Table Text Block] |
|
Class A (with sales charge) |
18.49%
|
9.26%
|
8.79%
|
|
Class A (without sales charge) |
25.74%
|
10.56%
|
9.43%
|
|
S&P 500® Index |
17.80%
|
12.06%
|
14.16%
|
|
| No Deduction of Taxes [Text Block] |
The graph and table do not reflect the deduction of taxes that a shareholder would pay on fund distributions or redemption of fund shares.
|
| Material Change Date |
Aug. 01, 2025
|
| Net Assets |
$ 52,083,993
|
| Holdings Count | shares |
37
|
| Advisory Fees Paid, Amount |
$ 354,013
|
| Investment Company, Portfolio Turnover |
0.00%
|
| Additional Fund Statistics [Text Block] |
| Net Assets ($) |
$52,083,993 |
| Number of Portfolio Holdings |
37 |
| Portfolio Turnover Rate (%) |
0% |
| Total Advisory Fees Paid (Net Waiver) ($) |
$354,013 |
|
| Holdings [Text Block] |
|
Goldman Sachs Financial Square Government Fund
|
8.72% |
|
Lam Research Corporation
|
5.54% |
|
Costco Wholesale Corporation
|
4.59% |
|
RTX Corporation
|
4.22% |
|
Broadcom Inc.
|
3.86% |
|
Exxon Mobil Corporation
|
3.58% |
|
Apple Inc.
|
3.51% |
|
Johnson & Johnson
|
3.10% |
|
Sempra Energy
|
3.04% |
|
NVIDIA Corporation
|
2.95% |
|
Information Technology
|
30.81% |
|
Consumer Staples
|
12.37% |
|
Financials
|
11.56% |
|
Energy
|
11.29% |
|
Net Cash*
|
9.20% |
|
Industrials
|
8.60% |
|
Health Care
|
7.98% |
|
Utilities
|
3.04% |
|
Materials
|
2.93% |
|
Real Estate Investment Trust
|
2.22% |
 | | * | Net Cash represents cash, cash equivalents and other assets in excess of liabilities. |
|
| Largest Holdings [Text Block] |
|
Goldman Sachs Financial Square Government Fund
|
8.72% |
|
Lam Research Corporation
|
5.54% |
|
Costco Wholesale Corporation
|
4.59% |
|
RTX Corporation
|
4.22% |
|
Broadcom Inc.
|
3.86% |
|
Exxon Mobil Corporation
|
3.58% |
|
Apple Inc.
|
3.51% |
|
Johnson & Johnson
|
3.10% |
|
Sempra Energy
|
3.04% |
|
NVIDIA Corporation
|
2.95% |
|
| Material Fund Change [Text Block] |
Effective August 1, 2025, the Adviser has contractually agreed to waive management fees and reimburse expenses, without recoupment, to the extent necessary to maintain total annual operating expenses of the Fund (excluding brokerage fees and commissions, interest and other borrowing expenses, taxes, indirect expenses (such as expenses of other investment companies in which the Fund invests) and extraordinary expenses) at 1.29% of its average daily net assets for Class A shares through July 31, 2026. The fee waiver will automatically terminate on July 31, 2026, unless it is renewed by the Adviser. The Adviser may not terminate the fee waiver or expense reimbursement before July 31, 2026. |
| Material Fund Change Expenses [Text Block] |
Effective August 1, 2025, the Adviser has contractually agreed to waive management fees and reimburse expenses, without recoupment, to the extent necessary to maintain total annual operating expenses of the Fund (excluding brokerage fees and commissions, interest and other borrowing expenses, taxes, indirect expenses (such as expenses of other investment companies in which the Fund invests) and extraordinary expenses) at 1.29% of its average daily net assets for Class A shares through July 31, 2026. The fee waiver will automatically terminate on July 31, 2026, unless it is renewed by the Adviser. The Adviser may not terminate the fee waiver or expense reimbursement before July 31, 2026.
|