PAY VERSUS PERFORMANCE
In accordance with the SEC’s disclosure requirements regarding pay versus performance, this section presents the SEC-defined “Compensation Actually Paid,” or CAP. Also required by the SEC, this section compares CAP to various measures used to gauge our performance. CAP is a supplemental measure to be viewed alongside performance measures as an addition to the philosophy and strategy of compensation-setting discussed elsewhere in this Proxy Statement, not in replacement.
Pay Versus Performance Table
The following table sets forth information concerning the compensation of our named executive officers for each of the fiscal years ended December 31, 2023, 2024 and 2025, and our financial performance for each such fiscal year:
|
|
|
|
|
|
|
|
|
|
|
|
|
|
|
|
|
|
Value of Initial Fixed $100 |
|
|
|
|
||||||||
|
|
|
|
|
|
|
|
|
|
|
|
|
|
|
|
|
|
|
|
|
|
|
|
|
||||||
Year |
|
Summary |
|
Compensation |
|
Average |
|
Average |
|
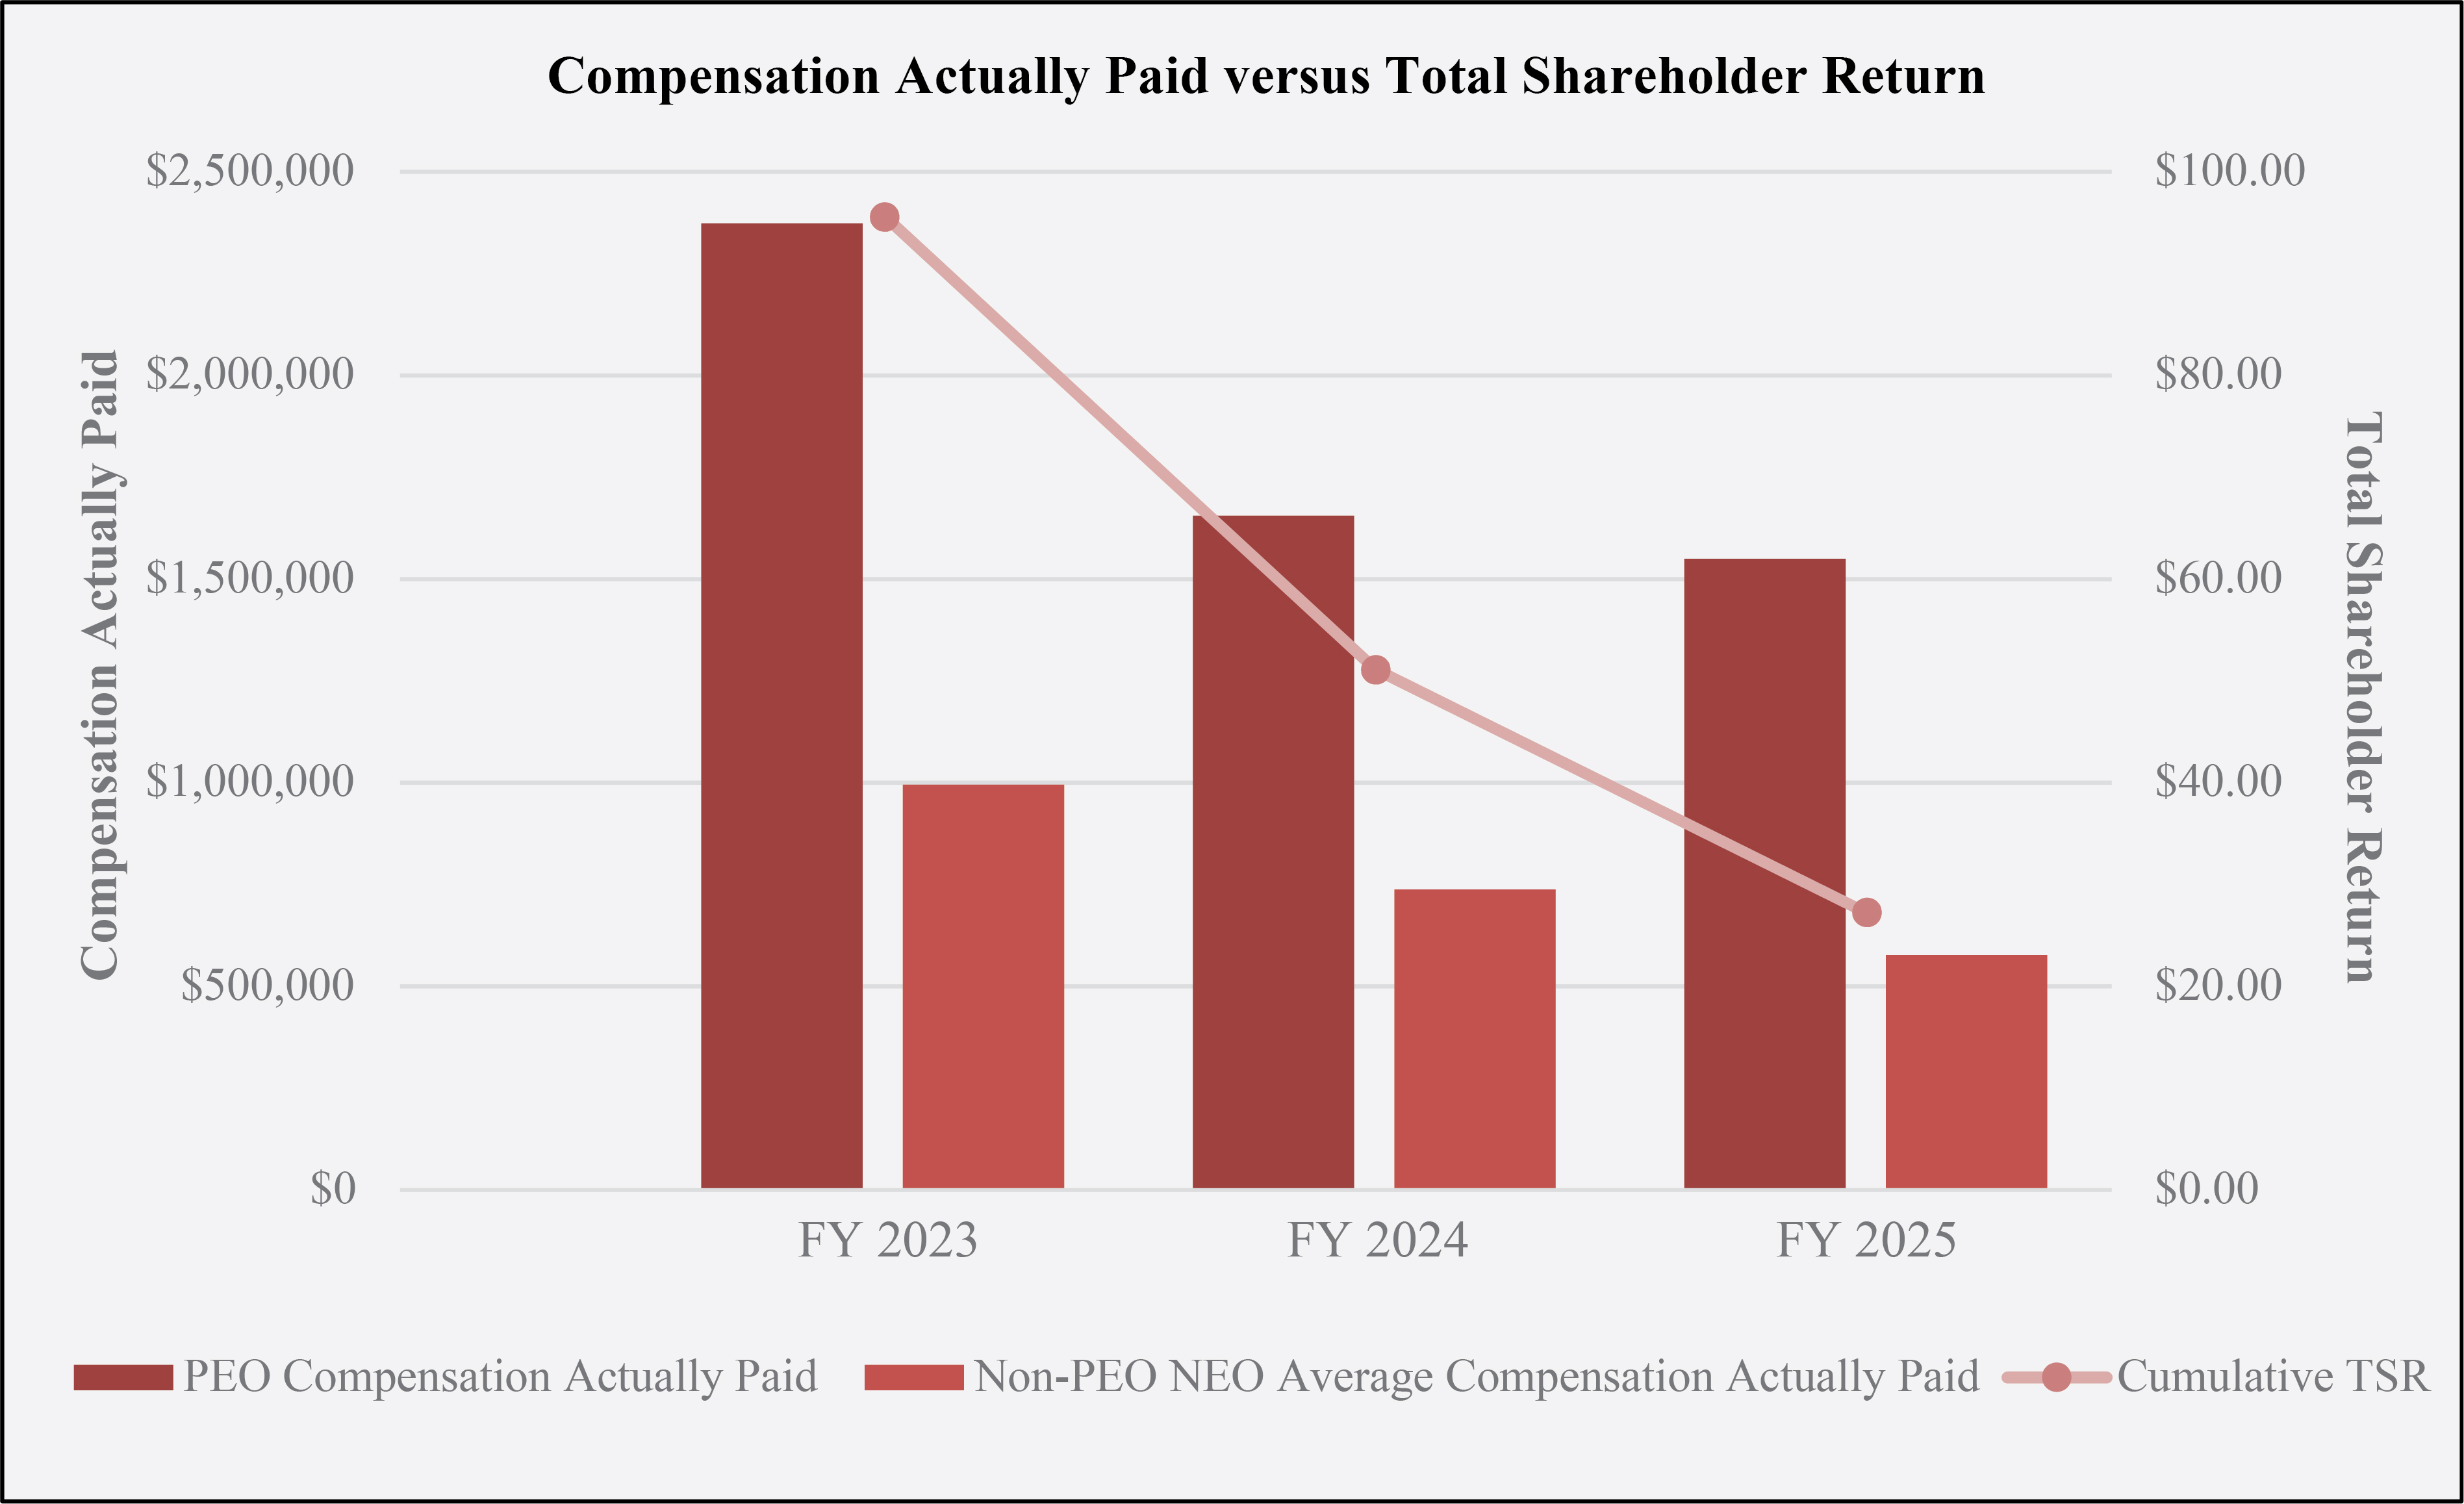
Total Shareholder Return |
|
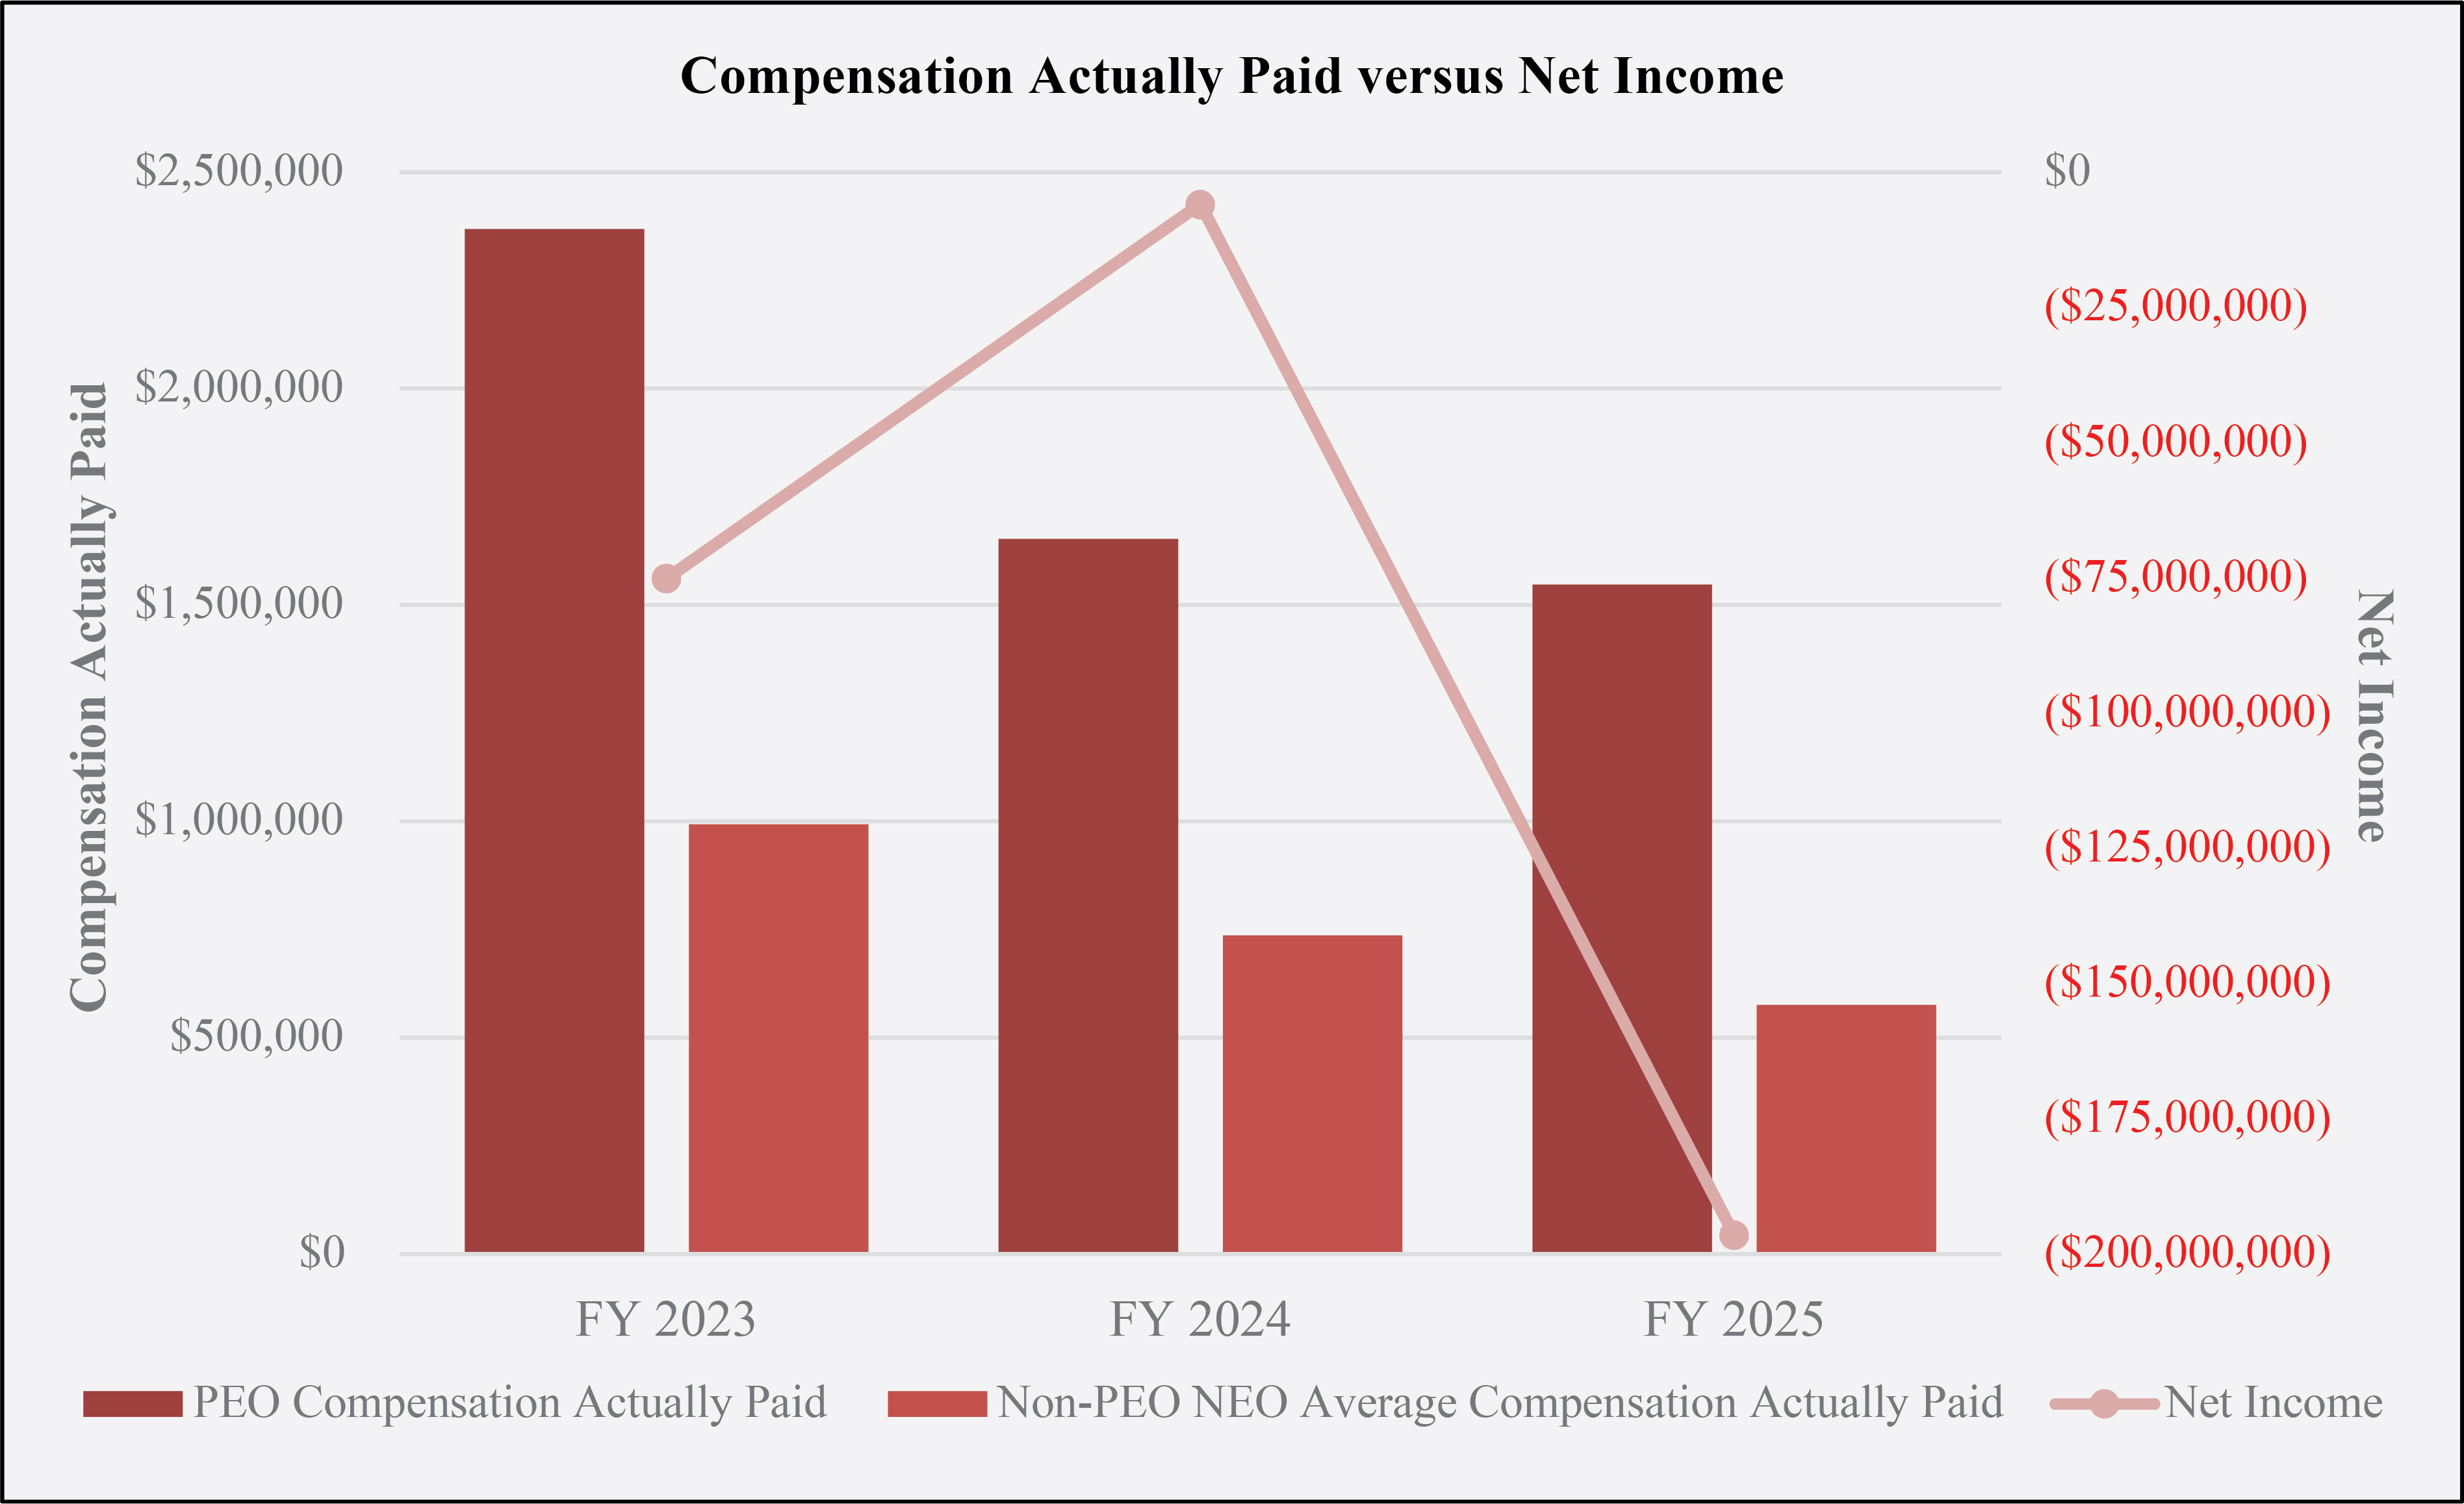
Net Loss |
||||||||||||||||||
2025 |
|
|
1,617,062 |
|
|
|
|
1,546,762 |
|
|
|
|
618,452 |
|
|
|
|
575,393 |
|
|
|
|
27.23 |
|
|
|
|
(196,549,741 |
) |
|
2024 |
|
|
1,550,494 |
|
|
|
|
1,652,294 |
|
|
|
|
677,800 |
|
|
|
|
736,258 |
|
|
|
|
51.14 |
|
|
|
|
(5,887,258 |
) |
|
2023 |
|
|
2,366,595 |
|
|
|
|
2,368,595 |
|
|
|
|
991,378 |
|
|
|
|
992,778 |
|
|
|
|
95.65 |
|
|
|
|
(75,120,138 |
) |
|
Year |
|
PEO |
|
Non-PEO NEOs |
2025 |
|
Caroline Beasley |
|
Bruce Beasley and Brian Beasley |
2024 |
|
Caroline Beasley |
|
Bruce Beasley and Brian Beasley |
2023 |
|
Caroline Beasley |
|
Bruce Beasley and Brian Beasley |
Compensation actually paid to our NEOs represents the “Total” compensation reported in the Summary Compensation Table for the applicable fiscal year, as adjusted as follows:
|
|
2025 |
||||||||||
Adjustments |
|
PEO |
|
Average Non- |
||||||||
Deduction for Amounts Reported under the “Stock Awards” Column in the Summary Compensation Table for Applicable FY |
|
|
$ |
- |
|
|
|
|
$ |
- |
|
|
Increase based on ASC 718 Fair Value of Awards Granted during Applicable FY that Remain Unvested as of Applicable FY End, determined as of Applicable FY End |
|
|
$ |
- |
|
|
|
|
$ |
- |
|
|
Increase based on ASC 718 Fair Value of Awards Granted during Applicable FY that Vested during Applicable FY, determined as of Vesting Date |
|
|
$ |
- |
|
|
|
|
$ |
- |
|
|
Increase/deduction for Awards Granted during Prior FY that were Outstanding and Unvested as of Applicable FY End, determined based on change in ASC 718 Fair Value from Prior FY End to Applicable FY End |
|
|
$ |
(44,000 |
) |
|
|
|
$ |
(26,950 |
) |
|
Increase/deduction for Awards Granted during Prior FY that Vested During Applicable FY, determined based on change in ASC 718 Fair Value from Prior FY End to Vesting Date |
|
|
$ |
(26,300 |
) |
|
|
|
$ |
(16,109 |
) |
|
TOTAL ADJUSTMENTS |
|
|
$ |
(70,300 |
) |
|
|
|
$ |
(43,059 |
) |
|