Pay vs Performance Disclosure - USD ($)
|
12 Months Ended |
Jan. 31, 2026 |
Jan. 31, 2025 |
Jan. 31, 2024 |
Jan. 31, 2023 |
Jan. 31, 2022 |
| Pay vs Performance Disclosure |
|
|
|
|
|
| Pay vs Performance Disclosure, Table |
| | | | | | | | | | | | | | | | | | | | | | | | | | | | | | | | | | | | | | | | | | | | | | | | | | | | | | | | | | | | | | | Fiscal
Year | | Summary Compen- sation Table Total for CEO (Rick Wilmer) ($) | | Compen- sation Actually Paid to CEO (Rick Wilmer) ($)(1) | | Summary Compen- sation Table Total for Former CEO ($) | | Compen- sation Actually Paid to Former CEO ($)(1) | | Average Summary Compen- sation Table Total for Other NEOs ($)(2) | | Average Compen- sation Actually Paid to Other NEOs ($)(1)(2) | | Value of Initial
$100 Investment Based On: | | Net Income ($ Millions) | | | | | | | | | | ChargePoint
TSR
($) | | Peer Group TSR ($)(3) | | Revenue ($ Millions) | | 2026 | | 4,106,013 | | | (1,165,738) | | | — | | | — | | | 1,217,496 | | | 113,969 | | | 0.79 | | | 128.98 | | | (220.2) | | | 411.2 | | | 2025 | | 3,133,340 | | | 813,460 | | | — | | | — | | | 1,419,365 | | | 883,085 | | | 2.53 | | | 148.89 | | | (277.1) | | | 417.1 | | | 2024 | | 3,497,427 | | | (366,144) | | | 602,418 | | | (30,047,981) | | | 1,081,990 | | | (3,297,967) | | | 4.99 | | | 136.57 | | | (457.6) | | | 506.6 | | | 2023 | | — | | | — | | | 16,755,533 | | | 12,734,139 | | | 7,444,668 | | | 6,379,049 | | | 31.90 | | | 89.04 | | | (345.1) | | | 468.1 | | | 2022 | | — | | | — | | | 58,679,085 | | | (43,687,041) | | | 6,277,153 | | | (842,989) | | | 36.39 | | | 112.53 | | | (132.2) | | | 241.0 | | | | | | | | | | | | | | | | | | | | | | |
|
|
|
|
|
| Company Selected Measure Name |
Revenue
|
|
|
|
|
| Named Executive Officers, Footnote |
Pasquale Romano served as our CEO for the entirety of fiscal 2022 and fiscal 2023. In fiscal 2024, Mr. Romano served as our CEO through November 16, 2023, and Rick Wilmer served as our CEO from November 16, 2023 to January 31, 2024. Mr. Wilmer served as our CEO for the entirety of fiscal 2025 and fiscal 2026. The other NEOs in each covered year were as follows:
2026 - Mansi Khetani, Eric Batill, JD Singh, David Vice and Rebecca Chavez 2025 - Mansi Khetani, Rebecca Chavez, JD Singh and David Vice 2024 - Mansi Khetani, Rebecca Chavez, Michael Hughes, Rex Jackson and William Loewenthal 2023 - Rick Wilmer, Rex Jackson, Michael Hughes and Eric Sidle 2022 - Rex Jackson, Michael Hughes, Colleen Jansen, Eric Sidle and Christopher Burghardt
|
|
|
|
|
| Peer Group Issuers, Footnote |
S&P Application Software index, consistent with our stock performance chart in our Annual Report on Form 10-K filed on April 2, 2026.
|
|
|
|
|
| PEO Total Compensation Amount |
$ 4,106,013
|
|
|
$ 16,755,533
|
$ 58,679,085
|
| PEO Actually Paid Compensation Amount |
$ (1,165,738)
|
|
|
12,734,139
|
(43,687,041)
|
| Adjustment To PEO Compensation, Footnote |
SEC rules require certain adjustments be made to the Summary Compensation Table totals to determine “compensation actually paid” as reported in the Pay versus Performance table. “Compensation Actually Paid” does not necessarily reflect cash and/or equity value transferred to the applicable NEO without restriction, but rather is a value calculated under applicable SEC rules. In general, “compensation actually paid” is calculated as Summary Compensation Table total compensation adjusted to include the fair market value of equity awards as of the last day of the applicable fiscal year or, if earlier, the vesting date (rather than the grant date). Our NEOs do not participate in a defined benefit plan so no adjustment for pension benefits is included in the table below. The following table details these adjustments to compensation as reported in the Summary Compensation Table: | | | | | | | | | | | | | | | | | | | | | CEO (Rick Wilmer) ($) | | | | | | 2026 | | | | Summary Compensation Table Total | | 4,106,013 | | | | | Less: | Grant Date Fair Value of Equity Awards | | (3,481,013) | | | | | Plus: | Year End Fair Value of Equity Awards Granted in the Year* | | +322,430 | | | | | Plus: | Fair Value as of Vesting Date of Equity Awards Granted and Vested in the Year* | | +131,052 | | | | | Change in Fair Value of Unvested Equity Awards Granted in Prior Years* | | (1,486,900) | | | | | Change in Fair Value of Equity Awards From Prior Years that Vested in the Covered Year* | | (757,320) | | | | | = | Compensation Actually Paid | | (1,165,738) | | | | | | | | | | | | | Average of Other NEOs ($) | | | | | | 2026 | | | | Summary Compensation Table Total | | 1,217,496 | | | | | Less: | Grant Date Fair Value of Equity Awards | | (837,671) | | | | | Plus: | Year End Fair Value of Equity Awards Granted in the Year* | | +228,922 | | | | | Plus: | Fair Value as of Vesting Date of Equity Awards Granted and Vested in the Year* | | +60,807 | | | | | Minus: | Fair Value as of the Prior Fiscal Year End of Equity Awards Granted in Prior Fiscal Years that Failed to Meet Vesting Conditions in the Fiscal Year | | (127,803) | | | | | Change in Fair Value of Unvested Equity Awards Granted in Prior Years* | | (327,584) | | | | | Change in Fair Value of Equity Awards From Prior Years that Vested in the Covered Year* | | (100,198) | | | | | = | Compensation Actually Paid | | 113,969 | | | |
________________ *All performance-based RSU (PRSU) award valuations included in "compensation actually paid" values were performed using the Monte Carlo probability model in a manner consistent with the process used to determine their grant date fair values (refer to our Annual Report on Form 10-K filed on April 2, 2026 for additional detail).
|
|
|
|
|
| Non-PEO NEO Average Total Compensation Amount |
$ 1,217,496
|
$ 1,419,365
|
$ 1,081,990
|
7,444,668
|
6,277,153
|
| Non-PEO NEO Average Compensation Actually Paid Amount |
$ 113,969
|
883,085
|
(3,297,967)
|
6,379,049
|
(842,989)
|
| Adjustment to Non-PEO NEO Compensation Footnote |
SEC rules require certain adjustments be made to the Summary Compensation Table totals to determine “compensation actually paid” as reported in the Pay versus Performance table. “Compensation Actually Paid” does not necessarily reflect cash and/or equity value transferred to the applicable NEO without restriction, but rather is a value calculated under applicable SEC rules. In general, “compensation actually paid” is calculated as Summary Compensation Table total compensation adjusted to include the fair market value of equity awards as of the last day of the applicable fiscal year or, if earlier, the vesting date (rather than the grant date). Our NEOs do not participate in a defined benefit plan so no adjustment for pension benefits is included in the table below. The following table details these adjustments to compensation as reported in the Summary Compensation Table: | | | | | | | | | | | | | | | | | | | | | CEO (Rick Wilmer) ($) | | | | | | 2026 | | | | Summary Compensation Table Total | | 4,106,013 | | | | | Less: | Grant Date Fair Value of Equity Awards | | (3,481,013) | | | | | Plus: | Year End Fair Value of Equity Awards Granted in the Year* | | +322,430 | | | | | Plus: | Fair Value as of Vesting Date of Equity Awards Granted and Vested in the Year* | | +131,052 | | | | | Change in Fair Value of Unvested Equity Awards Granted in Prior Years* | | (1,486,900) | | | | | Change in Fair Value of Equity Awards From Prior Years that Vested in the Covered Year* | | (757,320) | | | | | = | Compensation Actually Paid | | (1,165,738) | | | | | | | | | | | | | Average of Other NEOs ($) | | | | | | 2026 | | | | Summary Compensation Table Total | | 1,217,496 | | | | | Less: | Grant Date Fair Value of Equity Awards | | (837,671) | | | | | Plus: | Year End Fair Value of Equity Awards Granted in the Year* | | +228,922 | | | | | Plus: | Fair Value as of Vesting Date of Equity Awards Granted and Vested in the Year* | | +60,807 | | | | | Minus: | Fair Value as of the Prior Fiscal Year End of Equity Awards Granted in Prior Fiscal Years that Failed to Meet Vesting Conditions in the Fiscal Year | | (127,803) | | | | | Change in Fair Value of Unvested Equity Awards Granted in Prior Years* | | (327,584) | | | | | Change in Fair Value of Equity Awards From Prior Years that Vested in the Covered Year* | | (100,198) | | | | | = | Compensation Actually Paid | | 113,969 | | | |
________________ *All performance-based RSU (PRSU) award valuations included in "compensation actually paid" values were performed using the Monte Carlo probability model in a manner consistent with the process used to determine their grant date fair values (refer to our Annual Report on Form 10-K filed on April 2, 2026 for additional detail).
|
|
|
|
|
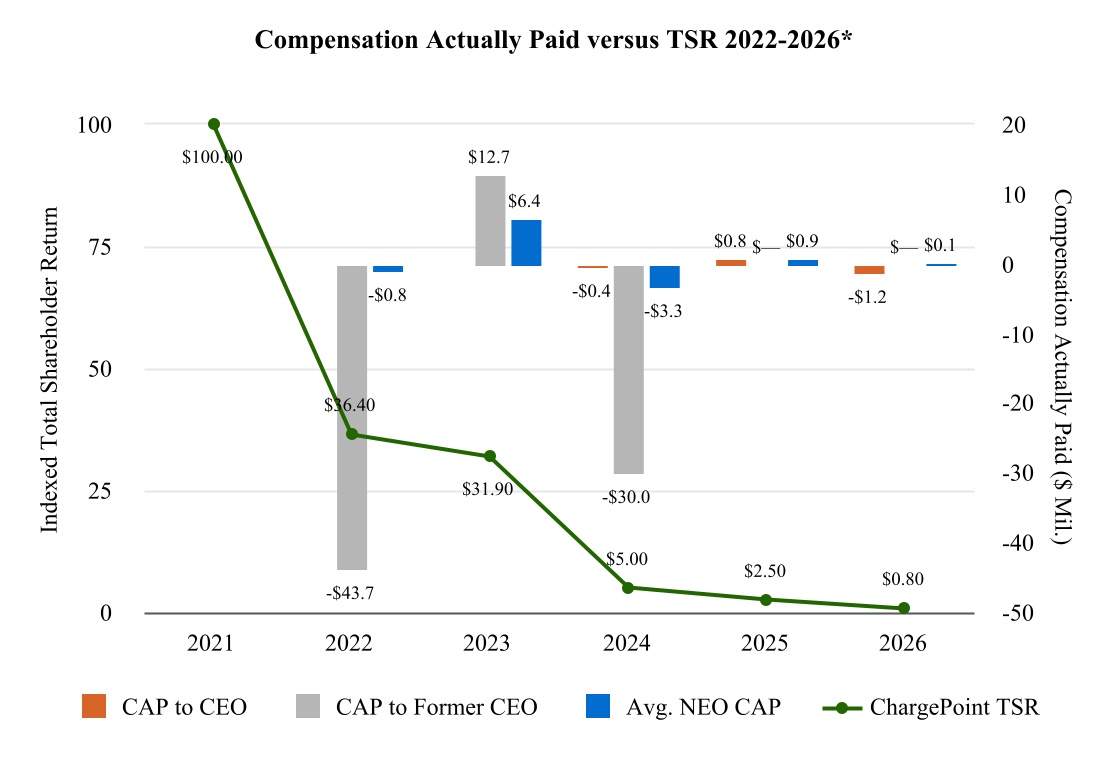
| Compensation Actually Paid vs. Total Shareholder Return |
The relationship between "compensation actually paid" (CAP) and the financial performance elements reflected in the above Pay versus Performance table are described in the below charts: * 2025/2026 Avg. NEO CAP and 2024/2025/2026 CAP to CEO are too small to have visible bar indicators in the chart.
|
|
|
|
|
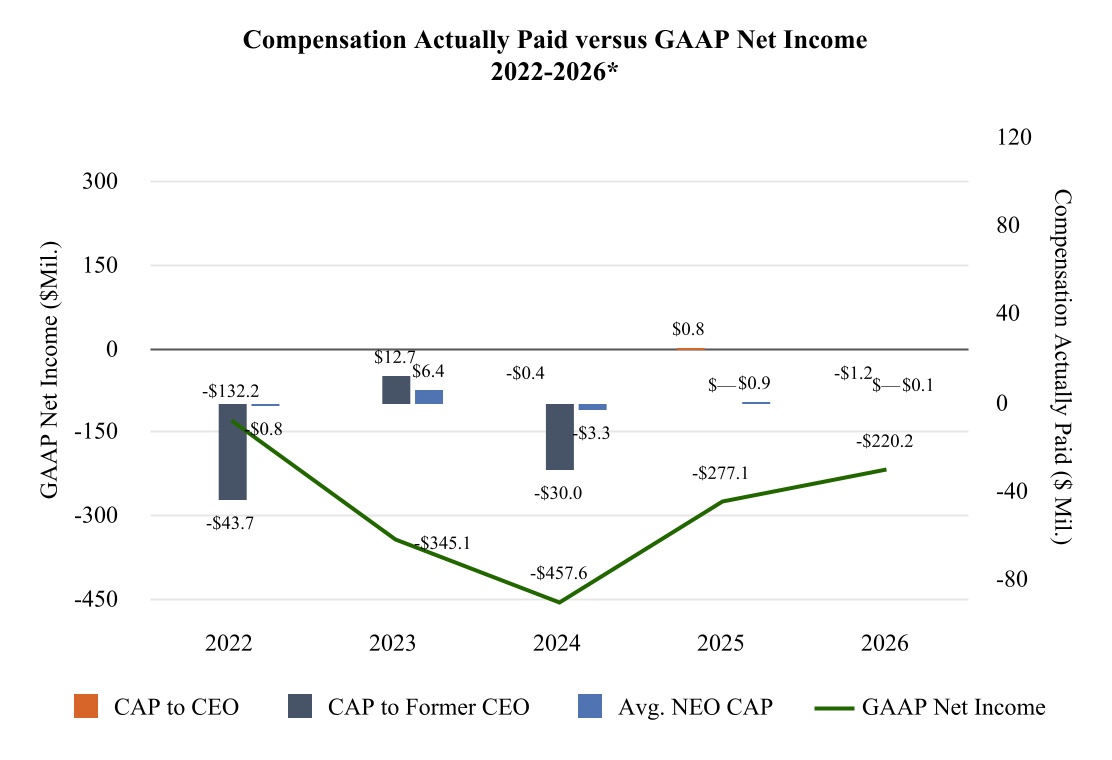
| Compensation Actually Paid vs. Net Income |
* 2025/2026 Avg. NEO CAP and 2024/2025/2026 CAP to CEO is too small to have a visible bar indicator in the chart.
|
|
|
|
|
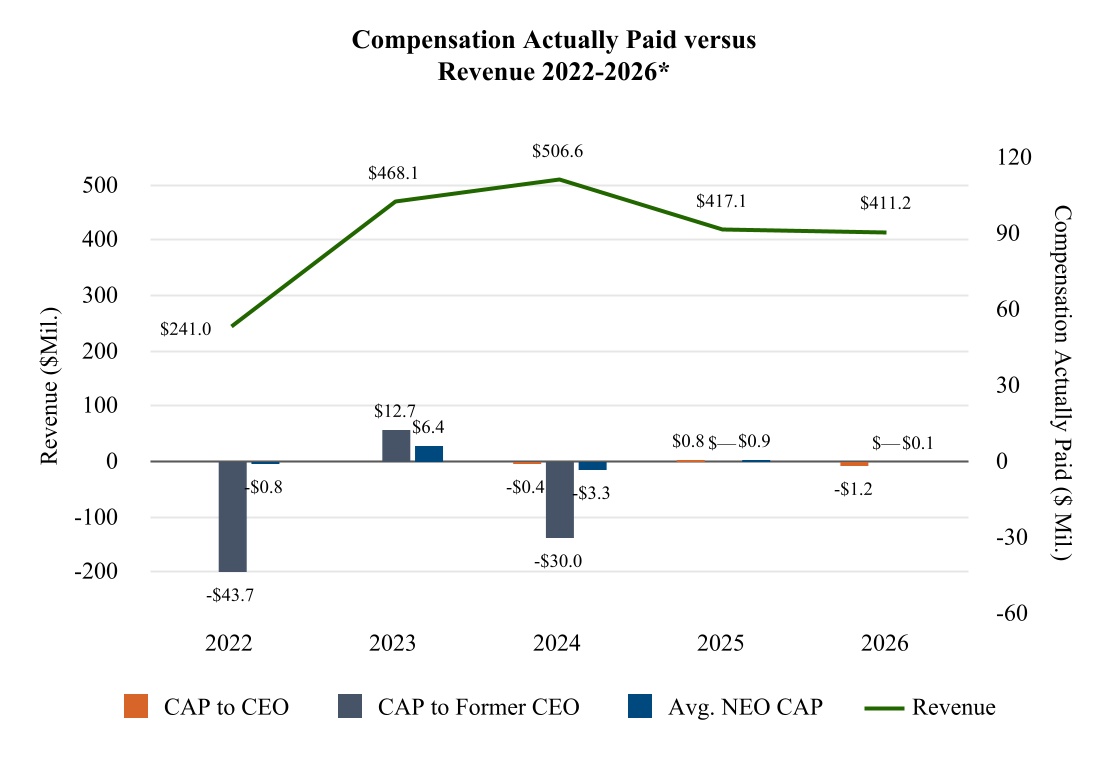
| Compensation Actually Paid vs. Company Selected Measure |
* 2025/2026 Avg. NEO and 2024/2025/2026 CAP to CEO is too small to have a visible bar indicator in the chart.
|
|
|
|
|
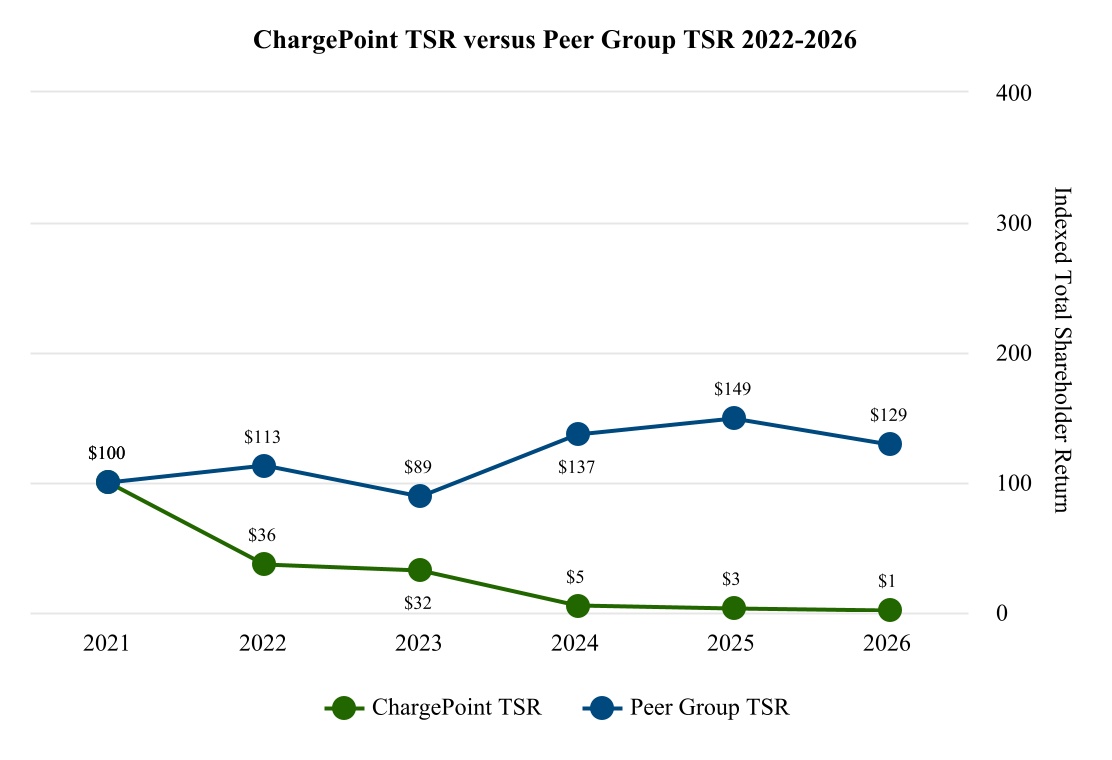
| Total Shareholder Return Vs Peer Group |
|
|
|
|
|
| Tabular List, Table |
The following measures, in our assessment, represent the most important financial performance measures that link "compensation actually paid" to our named executive officers, for fiscal 2026, to ChargePoint’s performance: 1)Revenue 2)Adjusted EBITDA 3)Absolute Stock Price Performance
|
|
|
|
|
| Total Shareholder Return Amount |
$ 0.79
|
2.53
|
4.99
|
31.90
|
36.39
|
| Peer Group Total Shareholder Return Amount |
128.98
|
148.89
|
136.57
|
89.04
|
112.53
|
| Net Income (Loss) |
$ (220,200,000)
|
$ (277,100,000)
|
$ (457,600,000)
|
$ (345,100,000)
|
$ (132,200,000)
|
| Company Selected Measure Amount |
411,200,000
|
417,100,000
|
506,600,000
|
468,100,000
|
241,000,000.0
|
| Measure:: 1 |
|
|
|
|
|
| Pay vs Performance Disclosure |
|
|
|
|
|
| Name |
1)Revenue
|
|
|
|
|
| Measure:: 2 |
|
|
|
|
|
| Pay vs Performance Disclosure |
|
|
|
|
|
| Name |
Adjusted EBITDA
|
|
|
|
|
| Measure:: 3 |
|
|
|
|
|
| Pay vs Performance Disclosure |
|
|
|
|
|
| Name |
Absolute Stock Price Performance
|
|
|
|
|
| Rick Wilmer [Member] |
|
|
|
|
|
| Pay vs Performance Disclosure |
|
|
|
|
|
| PEO Total Compensation Amount |
$ 4,106,013
|
$ 3,133,340
|
$ 3,497,427
|
|
|
| PEO Actually Paid Compensation Amount |
$ (1,165,738)
|
$ 813,460
|
(366,144)
|
|
|
| PEO Name |
Rick Wilmer
|
|
|
|
|
| Former CEO [Member] |
|
|
|
|
|
| Pay vs Performance Disclosure |
|
|
|
|
|
| PEO Total Compensation Amount |
|
|
602,418
|
|
|
| PEO Actually Paid Compensation Amount |
|
|
$ (30,047,981)
|
|
|
| PEO | Aggregate Grant Date Fair Value of Equity Award Amounts Reported in Summary Compensation Table |
|
|
|
|
|
| Pay vs Performance Disclosure |
|
|
|
|
|
| Adjustment to Compensation, Amount |
$ (3,481,013)
|
|
|
|
|
| PEO | Year-end Fair Value of Equity Awards Granted in Covered Year that are Outstanding and Unvested |
|
|
|
|
|
| Pay vs Performance Disclosure |
|
|
|
|
|
| Adjustment to Compensation, Amount |
322,430
|
|
|
|
|
| PEO | Year-over-Year Change in Fair Value of Equity Awards Granted in Prior Years That are Outstanding and Unvested |
|
|
|
|
|
| Pay vs Performance Disclosure |
|
|
|
|
|
| Adjustment to Compensation, Amount |
(1,486,900)
|
|
|
|
|
| PEO | Vesting Date Fair Value of Equity Awards Granted and Vested in Covered Year |
|
|
|
|
|
| Pay vs Performance Disclosure |
|
|
|
|
|
| Adjustment to Compensation, Amount |
131,052
|
|
|
|
|
| PEO | Change in Fair Value as of Vesting Date of Prior Year Equity Awards Vested in Covered Year |
|
|
|
|
|
| Pay vs Performance Disclosure |
|
|
|
|
|
| Adjustment to Compensation, Amount |
(757,320)
|
|
|
|
|
| Non-PEO NEO | Aggregate Grant Date Fair Value of Equity Award Amounts Reported in Summary Compensation Table |
|
|
|
|
|
| Pay vs Performance Disclosure |
|
|
|
|
|
| Adjustment to Compensation, Amount |
(837,671)
|
|
|
|
|
| Non-PEO NEO | Year-end Fair Value of Equity Awards Granted in Covered Year that are Outstanding and Unvested |
|
|
|
|
|
| Pay vs Performance Disclosure |
|
|
|
|
|
| Adjustment to Compensation, Amount |
228,922
|
|
|
|
|
| Non-PEO NEO | Year-over-Year Change in Fair Value of Equity Awards Granted in Prior Years That are Outstanding and Unvested |
|
|
|
|
|
| Pay vs Performance Disclosure |
|
|
|
|
|
| Adjustment to Compensation, Amount |
(327,584)
|
|
|
|
|
| Non-PEO NEO | Vesting Date Fair Value of Equity Awards Granted and Vested in Covered Year |
|
|
|
|
|
| Pay vs Performance Disclosure |
|
|
|
|
|
| Adjustment to Compensation, Amount |
60,807
|
|
|
|
|
| Non-PEO NEO | Change in Fair Value as of Vesting Date of Prior Year Equity Awards Vested in Covered Year |
|
|
|
|
|
| Pay vs Performance Disclosure |
|
|
|
|
|
| Adjustment to Compensation, Amount |
(100,198)
|
|
|
|
|
| Non-PEO NEO | Prior Year End Fair Value of Equity Awards Granted in Any Prior Year that Fail to Meet Applicable Vesting Conditions During Covered Year |
|
|
|
|
|
| Pay vs Performance Disclosure |
|
|
|
|
|
| Adjustment to Compensation, Amount |
$ (127,803)
|
|
|
|
|