Exhibit 99.2

 
All amounts are in Canadian dollars and are based on financial statements presented in compliance with International Accounting Standard 34
Interim Financial Reporting
, unless otherwise noted. Our Q2 2026 Report to Shareholders is available at rbc.com/investorrelations, sedarplus.com and sec.gov and our Q2 2026 Supplementary Financial Information is available at rbc.com/investorrelations.
 
       
Net income
 
$5.5 billion
 
Up 25% YoY
Down 5% QoQ
 
Diluted EPS
1
 
$3.85
 
Up 27% YoY
Down 4% QoQ
 
ROE
1, 2
 
17.2%
 
Up 300 bps
1
YoY
Down 40 bps QoQ
 
Total PCL
1
 
$0.9 billion
 
PCL on loans ratio
1
down 6 bps QoQ
 
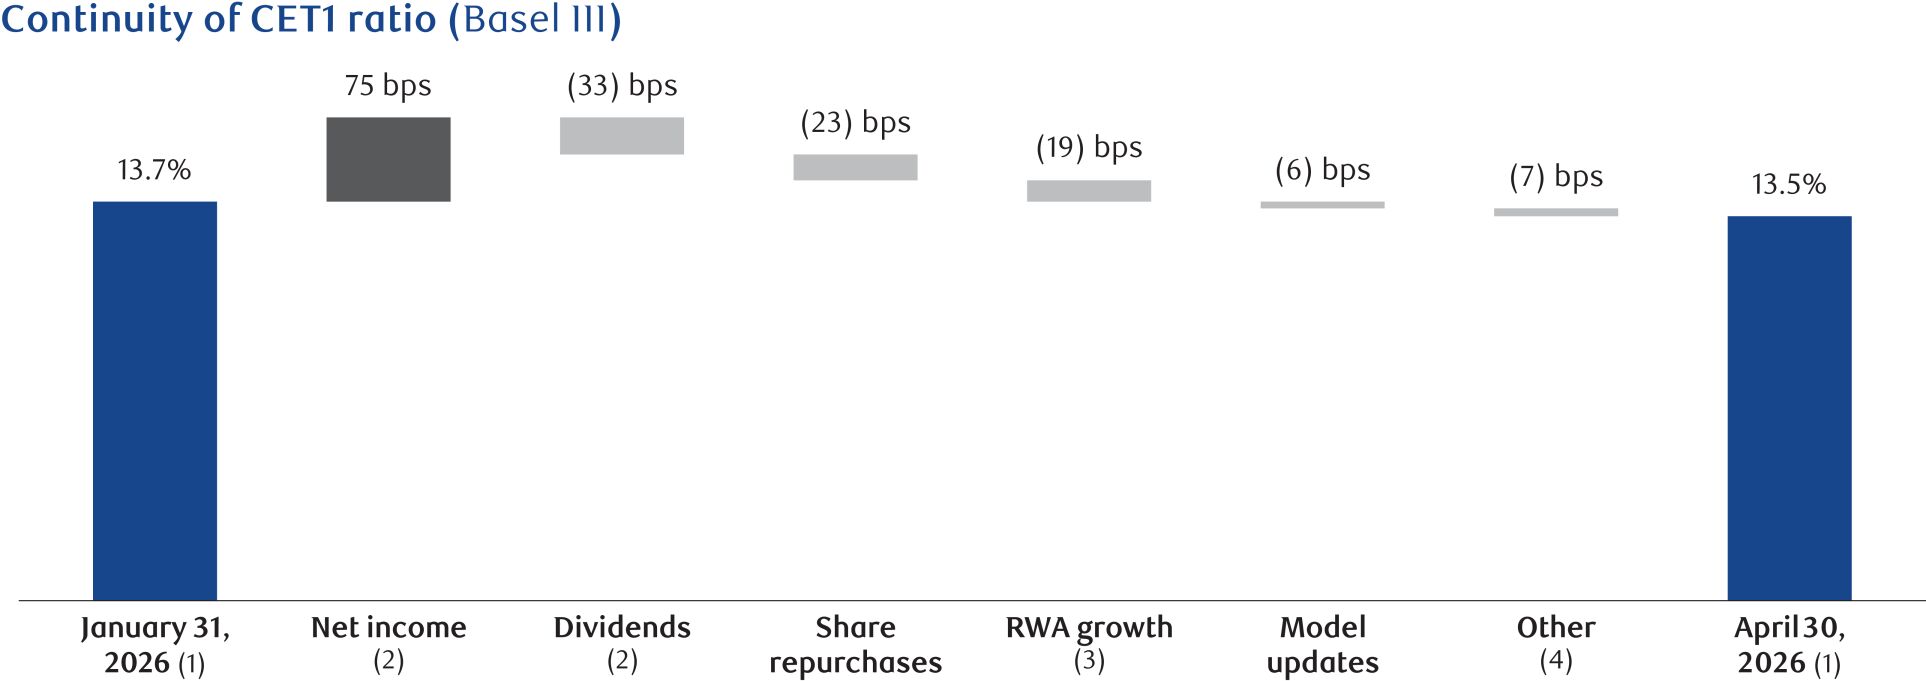
CET1 ratio
1
 
13.5%
 
Above regulatory
requirements
and down 20 bps QoQ
       
Adjusted net
income
3
 
$5.6 billion
 
Up 23% YoY
Down 5% QoQ
 
Adjusted diluted
EPS
3
 
$3.90
 
Up 25% YoY
Down 4% QoQ
 
Adjusted ROE
3
 
17.4%
 
Up 270 bps YoY
Down 40 bps QoQ
 
Total ACL
1
 
$7.8 billion
 
ACL on loans ratio
1
down 1 bp QoQ
 
LCR
1
 
126%
 
Up from
124% last quarter
TORONTO, May
 28, 2026
— Royal Bank of Canada
4
(RY on TSX and NYSE) today reported net income of $5.5 billion for the quarter ended April 30, 2026, up $1,119 million or 25% from the prior year. Diluted EPS was $3.85, up 27% over the same period, reflecting growth across each of our business segments. Adjusted net income
3
and adjusted diluted EPS
3
of $5.6 billion and $3.90 were up 23% and 25%, respectively, from the prior year.
 
 
“In a world that’s constantly changing and becoming more complex, our commitment to delivering trusted advice and helping clients navigate risk continues to produce exceptional outcomes. Our second quarter earnings showcase our consistency in delivering premium profitability and long-term shareholder value, underpinned by solid growth across our diversified businesses and balance sheet strength. Looking ahead, we remain focused on building the bank of the future and evolving with the needs of those we serve.”
 
– Dave McKay, President and Chief Executive Officer of Royal Bank of Canada
Pre-provision,
pre-tax
earnings
5
of $8.0 billion were up $1.1 billion or 15% from last year, mainly due to higher revenue in Capital Markets, driven by strength across Global Markets and Corporate & Investment Banking, and higher fee-based revenue in Wealth Management, reflecting market appreciation and net sales. Higher net interest income in Personal Banking and Commercial Banking, reflecting average volume growth and higher spreads, also contributed to the increase. These factors were partially offset by higher compensation commensurate with increased results.
Our consolidated results reflect a decrease in total PCL of $512 million from a year ago, primarily due to lower provisions in Commercial Banking and Personal Banking. The PCL on loans ratio of 35 bps decreased 23 bps from the prior year. The PCL on impaired loans ratio
1
of 34 bps decreased 1 bp, while the PCL on performing loans ratio
1
of 1 bp decreased 22 bps, as the same quarter last year reflected higher provisions primarily due to the impacts of trade disruptions (including tariffs). Income before income taxes of $7.1 billion was up $1.6 billion or 29% from last year.
Compared to last quarter, net income was down 5% reflecting lower results in Wealth Management, Personal Banking and Commercial Banking, which includes the impact of three fewer days in the current quarter, and in Corporate Support, partly offset by higher results in Capital Markets and Insurance. Adjusted net income
3
was down 5% over the same period.
Pre-provision,
pre-tax
earnings
5
were down $0.5 billion or 6% on lower revenues and flat expenses. The PCL on loans ratio of 35 bps decreased 6 bps from the prior quarter. The PCL on impaired loans ratio was 34 bps, down 6 bps from the prior quarter, primarily due to lower provisions in Capital Markets, and in Personal Banking and Commercial Banking to a lesser extent, while the PCL on performing loans ratio was 1 bp, remaining flat from the prior quarter.
Our capital position remains robust, with a CET1 ratio of 13.5%, supporting solid volume growth and $4.0 billion of capital returned to our shareholders, including $1.7 billion of share buybacks and $2.3 billion of common share dividends.
Today, we declared a quarterly dividend of $1.76 per share reflecting an increase of $0.12 or 7%. We also announced our intention, subject to the approval of the Toronto Stock Exchange and the Office of the Superintendent of Financial Institutions, to commence a normal course issuer bid and to repurchase for cancellation up to 45 million of our common shares, representing approximately 3% of the bank’s outstanding common shares as at May 15, 2026.


Table of Contents
2   
Royal Bank of Canada
  Second Quarter 2026
 
(1)
See the Glossary section of this Q2 2026 Report to Shareholders for composition of these measures.
(2)
Return on equity (ROE). This measure does not have a standardized meaning under generally accepted accounting principles (GAAP). For further information, refer to the Key performance and
non-GAAP
measures section of this Q2 2026 Report to Shareholders.
(3)
These are
non-GAAP
measures or ratios. For further information, including a reconciliation, refer to the Key performance and
non-GAAP
measures section of this Q2 2026 Report to Shareholders.
(4)
When we say “we”, “us”, “our”, “the bank” or “RBC”, we mean Royal Bank of Canada and its subsidiaries, as applicable.
(5)
Pre-provision,
pre-tax
(PPPT) earnings is calculated as income (April 30, 2026 - $5,509 million; January 31, 2026 - $5,785 million; April 30, 2025 - $4,390 million) before income taxes (April 30, 2026 - $1,595 million; January 31, 2026 - $1,622 million; April 30, 2025 - $1,128 million) and PCL (April 30, 2026 - $912 million; January 31, 2026 - $1,090 million; April 30, 2025 - $1,424 million). This is a
non-GAAP
measure. PPPT earnings do not have a standardized meaning under GAAP and may not be comparable to similar measures disclosed by other financial institutions. We use PPPT earnings to assess our ability to generate sustained earnings growth outside of credit losses, which are impacted by the cyclical nature of a credit cycle. We believe that certain
non-GAAP
measures are more reflective of our ongoing operating results and provide readers with a better understanding of management’s perspective on our performance.
 
 
Table of contents
 
1
 
2
 
3
 
3
 
  3   About Royal Bank of Canada
  4   Selected financial and other highlights
  5   Economic, market and regulatory review and outlook
7
 
  7   Overview
  7   Impact of foreign currency translation
  8   Total revenue
  9   Provision for credit losses
  10   Non-interest expense
  10   Income taxes
11
 
  11   How we measure and report our business segments
  11   Key performance and non-GAAP measures
  14   Personal Banking
  15   Commercial Banking
  16   Wealth Management
  17   Insurance
  18   Capital Markets
  19   Corporate Support
20
 
21
 
  21   Condensed balance sheets
  22   Off-balance sheet arrangements
22
 
  22   Credit risk
  26   Market risk
  30   Liquidity and funding risk
38
 
42
 
  42   Summary of accounting policies and estimates
  42   Controls and procedures
42
 
43
 
46
 
47
  (unaudited)
74


Management’s Discussion and Analysis
Management’s Discussion and Analysis (MD&A) is provided to enable a reader to assess our results of operations and financial condition for the three- and six-month periods ended or as at April 30, 2026, compared to the corresponding periods in the prior fiscal year and the three-month period ended January 31, 2026. This MD&A should be read in conjunction with our unaudited Interim Condensed Consolidated Financial Statements for the quarter ended April 30, 2026 (Condensed Financial Statements) and related notes and our 2025 Annual Report. This MD&A is dated May 27, 2026. All amounts are in Canadian dollars, unless otherwise specified, and are based on financial statements presented in accordance with International Financial Reporting Standards (IFRS) as issued by the International Accounting Standards Board (IASB), unless otherwise noted.
Additional information about us, including our 2025 Annual Information Form, is available free of charge on our website at rbc.com/investorrelations, on the Canadian Securities Administrators’ website, SEDAR+, at sedarplus.com and on the EDGAR section of the United States (U.S.) Securities and Exchange Commission’s (SEC) website at sec.gov.
Information contained in or otherwise accessible through the websites mentioned herein does not form part of this report. All references in this report to websites are inactive textual references and are for your information only.

Table of Contents
Royal Bank of Canada
  Second Quarter 2026   3
 
Caution regarding forward-looking statements
From time to time, we make written or oral forward-looking statements within the meaning of certain securities laws, including the “safe harbour” provisions of the U.S. Private Securities Litigation Reform Act of 1995
and any applicable Canadian securities legislation. We may make forward-looking statements in this Q2 2026 Report to Shareholders, in other filings with
Canadian regulators or the U.S. SEC, in other reports to shareholders and in other communications. In addition, our representatives may communicate forward-looking statements orally to
analysts, investors, the media and others. Forward-looking statements in this document include, but are not limited to, statements relating to our financial performance objectives, priorities, vision
and strategic goals, the economic, market, and regulatory review and outlook for Canadian, U.S., United Kingdom (U.K.), Euro area and global economies, the regulatory environment in which we operate and the risk environment including our credit risk, market risk, liquidity and funding risk, and include statements made by our President and Chief Executive Officer. The forward-looking statements contained in this document represent the views of management and are presented for the purpose of assisting the holders of our securities and financial analysts in understanding our financial position and results of operations as at and for the periods ended on the dates presented, as well as our financial performance objectives, vision, strategic goals and priorities and anticipated financial performance, and may not be appropriate for other purposes. Forward-looking statements are typically identified by words such as “believe”, “expect”, “suggest”, “seek”, “foresee”, “forecast”, “schedule”, “anticipate”, “intend”, “estimate”, “goal”, “commit”, “target”, “objective”, “plan”, “outlook”, “timeline” and “project” and similar expressions of future or conditional verbs such as “will”, “may”, “might”, “should”, “could”, “can”, “would” or negative or grammatical variations thereof.
By their very nature, forward-looking statements require us to make assumptions and are subject to inherent risks and uncertainties, both general and specific in nature, which give rise to the possibility that our predictions, forecasts, projections, expectations or conclusions will not prove to be accurate, that our assumptions may not be correct, that our financial performance, environmental & social or other objectives, vision and strategic goals will not be achieved, and that our actual results may differ materially from such predictions, forecasts, projections, expectations or conclusions.
We caution readers not to place undue reliance on our forward-looking statements as a number of risk factors could cause our actual results to differ materially from the expectations expressed in such forward-looking statements. These factors – many of which are beyond our control and the effects of which can be difficult to predict – include, but are not limited to: business and economic conditions in the geographic regions in which we operate, Canadian housing and household indebtedness, information technology, cyber and third-party risks, geopolitical uncertainty (including risks associated with the conflict in the Middle East), environmental and social risk, digital disruption and innovation, privacy and data related risks, regulatory changes, culture and conduct risks, credit, market, liquidity and funding, insurance, operational, compliance, reputation and strategic risks, other risks discussed in the risk sections of our 2025 Annual Report and the Risk management section of this Q2 2026 Report to Shareholders, including legal and regulatory environment risk, the effects of changes in government fiscal, monetary and other policies and tax risk and transparency, risks associated with escalating trade tensions, including protectionist trade policies such as the imposition of tariffs, risks associated with the adoption of emerging technologies, such as cloud computing, artificial intelligence (AI), including generative AI, and robotics, fraud risk and our ability to anticipate and successfully manage risks arising from all of the foregoing factors. Additional factors that could cause actual results to differ materially from the expectations in such forward-looking statements can be found in the risk sections of our 2025 Annual Report and the Risk management section of this Q2 2026 Report to Shareholders, as may be updated by subsequent quarterly reports.
We caution that the foregoing list of risk factors is not exhaustive and other factors could also adversely affect our results. When relying on our forward-looking statements to make decisions with respect to us, investors and others should carefully consider the foregoing factors and other uncertainties and potential events, as well as the inherent uncertainty of forward-looking statements. Material economic assumptions underlying the forward-looking statements contained in this document are set out in the Economic, market and regulatory review and outlook section and for each business segment under the Strategic priorities and Outlook headings in our 2025 Annual Report, as updated by the Economic, market and regulatory review and outlook section of this Q2 2026 Report to Shareholders. Such sections may be updated by subsequent quarterly reports. Any forward-looking statements contained in this document represent the views of management only as of the date hereof, and except as required by law, we do not undertake to update any forward-looking statement, whether written or oral, that may be made from time to time by us or on our behalf.
Overview and outlook
About Royal Bank of Canada
Royal Bank of Canada is a global financial institution with a purpose-driven,
principles-led
approach to delivering leading performance. Our success comes from the 101,000+ employees who leverage their imaginations and insights to bring our vision, values and strategy to life so we can help our clients thrive and communities prosper. As Canada’s biggest bank and one of the largest in the world, based on market capitalization, we have a diversified business model with a focus on innovation and providing exceptional experiences to our more than 19 million clients in Canada, the U.S. and 27 other countries. Learn more at rbc.com.

Table of Contents
4   
Royal Bank of Canada
  Second Quarter 2026
 
Selected financial and other highlights
 
     As at or for the three months ended          As at or for the six months ended  
(Millions of Canadian dollars, except per share, number of and percentage amounts)
 
April 30
2026
   
January 31
2026
   
April 30
2025
        
April 30
2026
   
April 30
2025
 
Total revenue
 
$
17,453
 
  $ 17,960     $ 15,672      
$
35,413
 
  $ 32,411  
Provision for credit losses (PCL)
 
 
912
 
    1,090       1,424      
 
2,002
 
    2,474  
Non-interest
expense
 
 
9,437
 
    9,463       8,730      
 
18,900
 
    17,986  
Income before income taxes
 
 
7,104
 
    7,407       5,518        
 
14,511
 
    11,951  
Net income
 
$
5,509
 
  $ 5,785     $ 4,390        
$
11,294
 
  $ 9,521  
Net income – adjusted
(1), (2)
 
$
5,583
 
  $ 5,861     $ 4,528        
$
11,444
 
  $ 9,782  
Segments – net income
           
Personal Banking
 
$
1,870
 
  $ 1,962     $ 1,602      
$
3,832
 
  $ 3,280  
Commercial Banking
 
 
854
 
    863       597      
 
1,717
 
    1,374  
Wealth Management
 
 
1,185
 
    1,295       929      
 
2,480
 
    1,909  
Insurance
 
 
218
 
    213       211      
 
431
 
    483  
Capital Markets
 
 
1,484
 
    1,478       1,202      
 
2,962
 
    2,634  
Corporate Support
 
 
(102
    (26     (151      
 
(128
    (159
Net income
 
$
5,509
 
  $ 5,785     $ 4,390        
$
11,294
 
  $ 9,521  
Selected information
           
Earnings per share (EPS)  – basic
 
$
3.86
 
  $ 4.03     $ 3.03      
$
7.89
 
  $ 6.57  
              – diluted
 
 
3.85
 
    4.03       3.02      
 
7.87
 
    6.56  
              – basic adjusted
(1), (2)
 
 
3.91
 
    4.09       3.13      
 
8.00
 
    6.76  
              – diluted adjusted
(1), (2)
 
 
3.90
 
    4.08       3.12      
 
7.98
 
    6.75  
Return on common equity (ROE)
(2)
 
 
17.2%
    17.6%     14.2%    
 
17.4%
    15.5%
ROE – adjusted
(1), (2)
 
 
17.4%
    17.8%     14.7%    
 
17.6%
    15.9%
Average common equity
(3)
 
$
128,400
 
  $ 127,350     $ 123,300      
$
127,850
 
  $ 120,900  
Net interest margin (NIM) – on average earning assets, net
(2)
 
 
1.58%
    1.55%     1.64%    
 
1.57%
    1.62%
PCL on loans as a % of average net loans and acceptances
 
 
0.35%
    0.41%     0.58%    
 
0.38%
    0.50%
PCL on performing loans as a % of average net loans and acceptances
 
 
0.01%
    0.01%     0.23%    
 
0.01%
    0.13%
PCL on impaired loans as a % of average net loans and acceptances
 
 
0.34%
    0.40%     0.35%    
 
0.37%
    0.37%
Gross impaired loans (GIL) as a % of loans and acceptances
 
 
0.90%
    0.86%     0.88%    
 
0.90%
    0.88%
Liquidity coverage ratio (LCR)
(2), (4)
 
 
126%
    124%     131%    
 
126%
    131%
Net stable funding ratio (NSFR)
(2), (4)
 
 
111%
    111%     116%      
 
111%
    116%
Capital, Leverage and Total loss absorbing capacity (TLAC) ratios 
(2), (5)
           
Common Equity Tier 1 (CET1) ratio
 
 
13.5%
    13.7%     13.2%    
 
13.5%
    13.2%
Tier 1 capital ratio
 
 
15.0%
    15.2%     14.7%    
 
15.0%
    14.7%
Total capital ratio
 
 
16.9%
    16.8%     16.5%    
 
16.9%
    16.5%
Leverage ratio
 
 
4.3%
    4.4%     4.3%    
 
4.3%
    4.3%
TLAC ratio
 
 
31.4%
    30.9%     31.0%    
 
31.4%
    31.0%
TLAC leverage ratio
 
 
9.0%
    9.0%     9.2%      
 
9.0%
    9.2%
Selected balance sheet and other information
(6)
           
Total assets
 
$
 2,396,080
 
  $  2,342,393     $  2,242,133      
$
 2,396,080
 
  $  2,242,133  
Securities, net of applicable allowance
 
 
612,364
 
    588,966       492,497      
 
612,364
 
    492,497  
Loans, net of allowance for loan losses
 
 
1,077,949
 
    1,054,881       1,007,306      
 
1,077,949
 
    1,007,306  
Derivative assets
 
 
150,745
 
    170,830       188,211      
 
150,745
 
    188,211  
Deposits
 
 
1,581,546
 
    1,542,216       1,446,786      
 
1,581,546
 
    1,446,786  
Common equity
 
 
129,579
 
    128,670       122,084      
 
129,579
 
    122,084  
Total risk-weighted assets (RWA)
(2), (5)
 
 
748,590
 
    734,693       703,920      
 
748,590
 
    703,920  
Assets under management (AUM)
(2)
 
 
1,630,300
 
    1,588,700       1,363,900      
 
1,630,300
 
    1,363,900  
Assets under administration (AUA)
(2), (7)
 
 
5,865,500
 
    5,632,300       5,019,700        
 
5,865,500
 
    5,019,700  
Common share information
           
Shares outstanding (000s) – average basic
 
 
1,393,332
 
    1,398,580       1,411,362      
 
1,396,000
 
    1,412,671  
               – average diluted
 
 
1,396,548
 
    1,401,884       1,413,517      
 
1,399,262
 
    1,415,037  
               – end of period
 
 
1,389,137
 
    1,396,775       1,409,539      
 
1,389,137
 
    1,409,539  
Dividends declared per common share
 
$
1.64
 
  $ 1.64     $ 1.48      
$
3.28
 
  $ 2.96  
Dividend yield
(2)
 
 
2.8%
    3.0%     3.6%    
 
2.9%
    3.6%
Dividend payout ratio
(2)
 
 
42%
 
    41%     49%    
 
41%
    45%
Common share price (RY on TSX)
(8)
 
$
244.31
 
  $ 226.72     $ 165.47      
$
244.31
 
  $ 165.47  
Market capitalization (TSX)
(8)
 
 
339,380
 
    316,677       233,236        
 
339,380
 
    233,236  
Business information
(number of)
           
Employees (full-time equivalent) (FTE)
 
 
97,795
 
    97,469       94,369      
 
97,795
 
    94,369  
Bank branches
 
 
1,253
 
    1,258       1,284      
 
1,253
 
    1,284  
Automated teller machines (ATMs)
 
 
4,114
 
    4,163       4,331        
 
4,114
 
    4,331  
Period average US$ equivalent of C$1.00
(9)
 
 
0.729
 
    0.726       0.704      
 
0.728
 
    0.701  
Period-end
US$ equivalent of C$1.00
 
 
0.736
 
    0.734       0.725        
 
0.736
 
    0.725  
 
(1)   These are
non-GAAP
measures or ratios. For further details, including a reconciliation, refer to the Key performance and
non-GAAP
measures section.
(2)   See Glossary for composition of these measures.
(3)   Average amounts are calculated using methods intended to approximate the average of the daily balances for the period.
(4)   The LCR and NSFR are calculated in accordance with the Office of the Superintendent of Financial Institutions’ (OSFI) Liquidity Adequacy Requirements (LAR) guideline. LCR is the average for the three months ended for each respective period. For further details, refer to the Liquidity and funding risk section.
(5)   Capital ratios and RWA are calculated using OSFI’s Capital Adequacy Requirements (CAR) guideline, the Leverage ratio is calculated using OSFI’s Leverage Requirements (LR) guideline and both the TLAC and TLAC leverage ratios are calculated using OSFI’s TLAC guideline. Both the CAR guideline and LR guideline are based on the Basel III framework. For further details, refer to the Capital management section.
(6)   Represents
period-end
spot balances.
(7)   AUA includes $13 billion and $5 billion (January 31, 2026 – $14 billion and $5 billion; April 30, 2025 – $15 billion and $6 billion) of securitized residential mortgages and credit card loans, respectively.
(8)   Based on TSX closing market price at
period-end.
(9)   Average amounts are calculated using
month-end
spot rates for the period.

Table of Contents
Royal Bank of Canada
  Second Quarter 2026   5
 
Economic, market and regulatory review and outlook – data as at May 27, 2026
The predictions and forecasts in this section are based on information and assumptions from sources we consider reliable. If this information or these assumptions are not accurate, actual economic outcomes may differ materially from the outlook presented in this section.
Economic and market review and outlook
Economic growth is expected to remain positive across most advanced economies, including Canada, the Euro area, the U.K. and the U.S. The outlook remains highly dependent on the evolution of U.S. trade policy as well as the magnitude and duration of energy price increases and supply disruptions due to conflict in the Middle East. The U.S. administration imposed a new 10% baseline tariff on imports from most U.S. international trade partners following the Supreme Court ruling in February 2026 against the portion of U.S. tariffs imposed under the International Emergency Economic Powers Act (IEEPA). Most U.S. imports from Canada, however, remain duty free under an exemption for products compliant with the Canada-United States-Mexico Agreement (CUSMA), which is subject to review this summer. U.S. tariff revenues remain well above levels prior to calendar 2025 but have declined in early 2026 from recent peak levels. Elevated crude oil prices are expected to increase consumer energy costs but will also increase revenues in oil producing regions. We expect the U.S. Federal Reserve (Fed) and the Bank of Canada (BoC) to hold interest rates steady in calendar 2026, as higher energy costs reduce household purchasing power but also add to concerns about rising inflation. We expect the Bank of England (BoE) and the European Central Bank (ECB) to raise interest rates moderately.
Canada
Canadian GDP is expected to have risen 1.7%
1
in the first calendar quarter of 2026 following a contraction of 0.6%
1
in the final calendar quarter of 2025. Slowing population growth due to reduced federal government limits on temporary and permanent resident arrivals is expected to continue to weigh on GDP growth over the rest of calendar 2026. However, we anticipate a further acceleration in
per-capita
GDP growth, supported by stabilizing U.S. international trade policy, the lagged impact of earlier BoC interest rate reductions and rising government deficit spending. Consumer spending is expected to have remained resilient despite rising fuel costs beginning near the end of the first calendar quarter of 2026. U.S. international trade policy remains a source of uncertainty ahead of the mandatory joint review this summer to extend CUSMA beyond its current 2036 expiry. Residential investment likely remained weak given slow resale activities but
non-residential
capital investment is expected to have risen in the first calendar quarter of 2026. The unemployment rate was 6.9% in April 2026, unchanged from a year earlier but below the recent peak of 7.1% in September 2025. It is expected to trend lower to 6.3% by the fourth calendar quarter of 2026. Inflation slowed early in 2026 but rose above the BoC’s 2% target rate in March and April 2026, primarily from elevated oil prices raising consumer energy costs. We expect core inflation to be around the 2% target level and the BoC to hold the overnight rate to 2.25% through the end of calendar 2026.
U.S.
U.S. GDP increased by 2.0%
1
in the first calendar quarter of 2026 following a 0.5%
1
increase in the final calendar quarter of 2025. Consumer spending growth has shown signs of slowing while business investment has continued to increase and government spending recovered in the first calendar quarter of 2026 after falling due to a federal government shutdown in the final calendar quarter of 2025. We expect slow GDP growth over the remainder of the 2026 calendar year. The unemployment rate remains low at 4.3% in April 2026 but is up 0.1% from a year earlier. Job openings have continued to stabilize after declining over prior calendar years and wage growth has continued to slow. Inflation has remained above the Fed’s 2% target and is set to rise in calendar 2026, primarily due to elevated oil prices pushing up consumer energy costs. Weaker economic growth and rising inflation for the remainder of calendar 2026 is expected to result in the Fed holding interest rates steady. We expect the Fed to maintain the target range for the federal funds rate at 3.5% to 3.75% in calendar 2026.
Euro area and the U.K.
Euro area GDP rose 0.1% in the first calendar quarter of 2026 following a 0.2% increase in the final calendar quarter of 2025. GDP growth is expected to accelerate in the remaining quarters of this calendar year, driven in part by higher government spending. Unemployment rates remain low across countries in the Euro area and are expected to remain close to current levels through the rest of calendar 2026. Inflation in the Euro area is being pushed higher by rising energy costs due to the conflict in the Middle East. We expect the ECB to raise the deposit rate by 75 basis points in calendar 2026 from the current 2% rate. U.K. GDP increased by 0.6% in the first calendar quarter of 2026 following a 0.2% increase in the final calendar quarter of 2025. GDP in the U.K. is expected to grow slowly and the unemployment rate is expected to remain elevated for the remainder of calendar 2026. With inflation headwinds building, we anticipate the BoE will raise the bank rate to 4% from the current at 3.75% in the second half of calendar 2026.
Financial markets
Government bond yields have increased across Canada, the United States, the Euro area and the U.K. as increased energy prices push inflation rates higher. Globally, tariff uncertainties and geopolitical risks remain a significant source of volatility in financial markets. Equity markets have been volatile but increased to record highs after falling through March 2026 due to the conflict in the Middle East. Global oil prices have increased sharply, given expectations of supply disruptions due to the ongoing Middle East conflict.
 
1
 
  Annualized rate
 

Table of Contents
6   
Royal Bank of Canada
  Second Quarter 2026
 
Regulatory environment
We continue to monitor and prepare for regulatory developments and changes in a manner that seeks to ensure compliance with new requirements while mitigating adverse business or financial impacts. Such impacts could result from new or amended laws or regulations and the expectations of those who enforce them. A high-level summary of the key regulatory changes that have the potential to increase or decrease our costs and the complexity of our operations is included in the Legal and regulatory environment risk section of our 2025 Annual Report and updates are listed below.
Global uncertainty
In April 2026, the International Monetary Fund (IMF) projected global growth of 3.1%
2
for calendar 2026, down 0.2% from its January forecast. The projected decrease reflects the disruptions from the conflict in the Middle East, partly offset by carryover from recent strong trade data and reduced tariff rates. Significant uncertainty continues to pose risks to the global economic outlook, driven by:
 
Escalating geopolitical tensions, including the protracted conflict in the Middle East leading to heightened inflationary pressures through significantly increased energy prices due to supply constraints as well as other impacts;
 
Growing threats to cybersecurity and global infrastructure as a result of technological advancements;
 
Failure to reach trade agreements, leading to prolonged uncertainty, a shift away from global economic integration and towards a more protectionist posture, as well as negative impacts on productivity and growth prospects, especially for emerging markets and developing economies;
 
Shifting global policy priorities, including ongoing uncertainty around U.S. trade, foreign relations, defense and immigration policies, which could disrupt global alliances and heighten economic, market and other risks;
 
Intensifying political pressures on policy institutions and policymaking could also weaken policy credibility, reduce investor confidence and heighten macroeconomic vulnerabilities;
 
Substantial projected fiscal deficits and high public debt across major economies, which could lead to upward pressure on long-term interest rates, financial market instability and/or deceleration in growth, along with their associated impact on consumer and business confidence;
 
Reevaluation of the productivity growth expectations of technology, specifically
AI-linked
sectors, which could lead to a decline in investment and drive abrupt financial market corrections of these sectors as well as other segments and erode household wealth;
 
An aging demographic in advanced economies, as well as changing immigration policies, which could have an associated long-term impact on labour supply, economic productivity and government fiscal capacity;
 
Ongoing conflicts including those between Russia and Ukraine, and continued tensions between China and Taiwan, together with increased polarization and social unrest; and
 
Extreme weather-related events.
Our diversified business model, as well as our product and geographic diversification, continue to help mitigate the risks posed by global uncertainty.
Liquidity Adequacy Requirements (LAR) Guidelines
On January 29, 2026, OSFI updated the LAR guidelines for the LCR, NSFR and Net Cumulative Cash Flow. The amendments introduce new approaches to measure liquidity risks from products such as structured notes and deposits sourced through unaffiliated third parties and define treatments for instruments with contingent features potentially affecting term maturity profiles. The guidelines became effective May 1, 2026 and the impact was not material.
Canadian Anti-Money Laundering (AML) Initiatives
The Strengthening of Canada’s Immigration System and Borders Act (the “Act”), introduced as Bill
C-12,
received Royal Assent and was enacted on March 26, 2026. The Act strengthens Canada’s anti-money laundering and anti-terrorist financing regime, including increased administrative monetary penalties, stricter compliance requirements and expanded enforcement scope of the Financial Transactions and Reports Analysis Centre of Canada. The impact from the enactment of the Act was not material in Q2 2026.
For a discussion on risk factors resulting from these and other developments which may affect our business and financial results, refer to the risk sections of our 2025 Annual Report. For further details on our framework and activities to manage risks, refer to the Risk management and Capital management sections of this Q2 2026 Report to Shareholders.
 
2
 
  Given the complexity and fluidity of the current economic environment, the IMF has used a reference forecast in lieu of the usual baseline to project global growth.
 

Table of Contents
Royal Bank of Canada
  Second Quarter 2026   7
 
Financial performance
Overview
Q2 2026 vs. Q2 2025
Net income of $5,509 million was up $1,119 million or 25% from a year ago. Diluted EPS of $3.85 was up $0.83 or 27% and ROE of 17.2% was up from 14.2% a year ago. Our CET1 ratio of 13.5% was up 30 bps from a year ago.
Adjusted net income of $5,583 million was up $1,055 million or 23% from a year ago. Adjusted diluted EPS of $3.90 was up $0.78 or 25% and adjusted ROE of 17.4% was up from 14.7% a year ago.
Our earnings reflect higher results across all of our business segments. Lower PCL on performing loans contributed to higher results.
Q2 2026 vs. Q1 2026
Net income of $5,509 million was down $276 million or 5% from last quarter. Diluted EPS of $3.85 was down $0.18 or 4% and ROE of 17.2% was down from 17.6% in the prior quarter. Our CET1 ratio of 13.5% was down 20 bps from last quarter.
Adjusted net income of $5,583 million was down $278 million or 5% from last quarter. Adjusted diluted EPS of $3.90 was down $0.18 or 4% and adjusted ROE of 17.4% was down from 17.8% last quarter.
Our earnings reflect lower earnings in Wealth Management, Personal Banking, Commercial Banking and in Corporate Support, partially offset by higher earnings in Capital Markets and Insurance.
Q2 2026 vs. Q2 2025 (Six months ended)
Net income of $11,294 million was up $1,773 million or 19% from the same period last year. Diluted EPS of $7.87 was up $1.31 or 20% and ROE of 17.4% was up from 15.5% in the prior year.
Adjusted net income of $11,444 million was up $1,662 million or 17% from the same period last year. Adjusted diluted EPS of $7.98 was up $1.23 or 18% and adjusted ROE of 17.6% was up from 15.9% in the prior year.
Our earnings were up from the same period last year, primarily driven by higher results in Wealth Management, Personal Banking, Commercial Banking and Capital Markets, partially offset by lower earnings in Insurance. Our earnings also reflect the impact of foreign exchange translation.
For further details on our business segment results and CET1 ratio, refer to the Business segment results and Capital management sections, respectively.
Adjusted results
Adjusted results exclude specified items and the
after-tax
impact of amortization of acquisition-related intangibles. Adjusted results are
non-GAAP
measures. For further details, including a reconciliation, refer to the Key performance and
non-GAAP
measures section.
Impact of foreign currency translation
The following table reflects the estimated impact of foreign currency translation on key income statement items:
 
     For the three months ended            For the six months ended  
(Millions of Canadian dollars, except per share amounts)
 
Q2 2026 vs.
Q2 2025
   
Q2 2026 vs.
Q1 2026
          
Q2 2026 vs.
Q2 2025
 
Increase (decrease):
       
Total revenue
 
$
(222
 
$
(40
   
$
(446
PCL
 
 
(4


(14
Non-interest
expense
 
 
(120
 
 
(26
   
 
(234
Income taxes
 
 
(13
 
 
(2
   
 
(22
Net income
 
 
(85
 
 
(12
         
 
(176
Impact on EPS
       
Basic
 
$
(0.06
 
$
(0.01
   
$
(0.13
Diluted
 
 
(0.06
 
 
(0.01
         
 
(0.13
The relevant average exchange rates that impact our business are shown in the following table:
 
(Average foreign currency equivalent of C$1.00) (1)    For the three months ended             For the six months ended  
  
April 30
2026
           
January 31
2026
           
April 30
2025
           
April 30
2026
    
April 30
2025
 
U.S. dollar
  
 
0.729
 
       0.726          0.704       
 
0.728
 
     0.701  
British pound
  
 
0.543
 
       0.539          0.544       
 
0.541
 
     0.550  
Euro
  
 
0.623
 
             0.619                0.650             
 
0.621
 
     0.659  
 
  (1)   Average amounts are calculated using
month-end
spot rates for the period.
 

Table of Contents
8   
Royal Bank of Canada
  Second Quarter 2026
 
Total revenue
 
(Millions of Canadian dollars, except percentage amounts)   For the three months ended            For the six months ended  
 
April 30
2026
   
January 31
2026
   
April 30
2025
          
April 30
2026
   
April 30
2025
 
Interest and dividend income
 
$
25,022
 
  $ 26,104     $ 24,970      
$
51,126
 
  $ 51,425  
Interest expense
 
 
16,516
 
    17,519       16,914            
 
34,035
 
    35,421  
Net interest income
 
$
  8,506
 
  $ 8,585     $ 8,056      
$
17,091
 
  $ 16,004  
NIM
 
 
 1.58%
 
    1.55%     1.64%          
 
1.57%
 
    1.62%
Insurance service result
 
$
217
 
  $ 240     $ 224      
$
457
 
  $ 510  
Insurance investment result
 
 
92
 
    59       78      
 
151
 
    160  
Trading revenue
 
 
609
 
    1,180       641      
 
1,789
 
    1,836  
Investment management and custodial fees
 
 
2,915
 
    2,924       2,544      
 
5,839
 
    5,211  
Mutual fund revenue
 
 
1,403
 
    1,414       1,211      
 
2,817
 
    2,447  
Securities brokerage commissions
 
 
550
 
    508       486      
 
1,058
 
    957  
Service charges
 
 
572
 
    593       607      
 
1,165
 
    1,219  
Underwriting and other advisory fees
 
 
878
 
    742       615      
 
1,620
 
    1,289  
Foreign exchange revenue, other than trading
 
 
345
 
    380       338      
 
725
 
    656  
Card service revenue
 
 
305
 
    335       328      
 
640
 
    645  
Credit fees
 
 
450
 
    423       370      
 
873
 
    805  
Net gains on investment securities
 
 
102
 
    76       45      
 
178
 
    100  
Income (loss) from joint ventures and associates
 
 
24
 
    37       16      
 
61
 
    35  
Other
 
 
485
 
    464       113            
 
949
 
    537  
Non-interest
income
 
 
8,947
 
    9,375       7,616            
 
18,322
 
    16,407  
Total revenue
 
$
17,453
 
  $  17,960     $  15,672            
$
 35,413
 
  $  32,411  
Additional trading information
           
Net interest income
(1)
 
$
600
 
  $ 473     $ 614      
$
1,073
 
  $ 978  
Non-interest
income
 
 
609
 
    1,180       641            
 
1,789
 
    1,836  
Total trading revenue
 
$
1,209
 
  $ 1,653     $ 1,255            
$
2,862
 
  $ 2,814  
 
  (1)   Reflects net interest income arising from trading-related positions, including assets and liabilities that are classified or designated at fair value through profit or loss (FVTPL).  
Q2 2026 vs. Q2 2025
Total revenue increased $1,781 million or 11% from a year ago, largely due to higher net interest income, other revenue and investment management and custodial fees. Higher underwriting and other advisory fees and mutual fund revenue also contributed to the increase. The impact of foreign exchange translation decreased revenue by $222 million.
Net interest income increased $450 million or 6%, primarily due to average volume growth and higher spreads in Personal Banking, Wealth Management and Commercial Banking. These factors were partially offset by the impact of foreign exchange translation.
NIM was down 6 bps from a year ago, mainly due to growth in trading assets in Capital Markets.
Investment management and custodial fees increased $371 million or 15%, primarily due to higher fee-based client assets reflecting market appreciation and net sales.
Mutual fund revenue increased $192 million or 16%, primarily due to higher fee-based client assets reflecting market appreciation and net sales.
Underwriting and other advisory fees increased $263 million or 43%, primarily due to higher mergers & acquisitions (M&A) activity across most regions and higher equity and debt origination across all regions.
Other revenue increased $372 million, largely attributable to changes in the fair value of the hedges related to our U.S. share-based compensation plans, which was largely offset in non-interest expense.
Q2 2026 vs. Q1 2026
Total revenue decreased $507 million or 3% from last quarter, primarily due to lower trading revenue, partially offset by higher underwriting and other advisory fees.
Net interest income decreased $79 million or 1%, mainly due to three fewer days in the current quarter.
Trading revenue decreased $571 million or 48%, primarily due to lower equity trading revenue across most regions and lower fixed income trading revenue across all regions.
Underwriting and other advisory fees increased $136 million or 18%, primarily due to higher equity and debt origination across all regions.
Q2 2026 vs. Q2 2025 (Six months ended)
Total revenue increased $3,002 million or 9% from the same period last year, mainly due to higher net interest income and investment management and custodial fees. Higher other revenue, mutual fund revenue and underwriting and other advisory fees also contributed to the increase. The impact of foreign exchange translation decreased revenue by $446 million.
Net interest income increased $1,087 million or 7%, largely due to average volume growth and higher spreads in Personal Banking, Commercial Banking and Wealth Management. Higher fixed income trading revenue across all regions in Capital Markets also contributed to the increase. These factors were partially offset by lower revenue from non-trading portfolios in Capital Markets, which was largely offset in other revenue.
Investment management and custodial fees increased $628 million or 12%, primarily due to higher fee-based client assets reflecting market appreciation and net sales.

Table of Contents
Royal Bank of Canada
  Second Quarter 2026   9
 
Mutual fund revenue increased $370 million or 15%, primarily due to higher fee-based client assets reflecting market appreciation and net sales.
Underwriting and other advisory fees increased $331 million or 26%, primarily due to higher M&A activity and debt and equity origination across most regions.
Other revenue increased $412 million or 77%, primarily attributable to gains from our non-trading portfolios in Capital Markets, which were largely offset in net interest income, and changes in the fair value of the hedges related to our U.S. share-based compensation plans, which was largely offset in non-interest expense.
Provision for credit losses
(1)
 
     For the three months ended            For the six months ended  
(Millions of Canadian dollars, except percentage amounts)
 
April 30
2026
   
January 31
2026
   
April 30
2025
          
April 30
2026
   
April 30
2025
 
Personal Banking
 
$
3
 
  $ 16     $ 246      
$
19
 
  $ 309  
Commercial Banking
 
 
1
 
    13       253      
 
14
 
    283  
Wealth Management
 
 
3
 
    (16     35      
 
(13
    71  
Capital Markets
 
 
11
 
    15       35      
 
26
 
    (26
Corporate Support and other
(2)


          (1          
 
 
    (1
PCL on performing loans
 
 
18
 
    28       568            
 
46
 
    636  
Personal Banking
 
$
488
 
  $ 516     $ 410      
$
1,004
 
  $ 837  
Commercial Banking
 
 
246
 
    273       286      
 
519
 
    594  
Wealth Management
 
 
52
 
    34       51      
 
86
 
    96  
Capital Markets
 
 
113
 
    245       105      
 
358
 
    310  
Corporate Support and other
(2)


PCL on impaired loans
 
 
899
 
    1,068       852            
 
1,967
 
    1,837  
PCL – Loans
 
 
917
 
    1,096       1,420      
 
2,013
 
    2,473  
PCL – Other
(3)
 
 
(5
    (6     4            
 
(11
    1  
Total PCL
 
$
912
 
  $ 1,090     $ 1,424            
$
2,002
 
  $ 2,474  
PCL on loans is comprised of:            
Retail
 
$
(4
  $ 15     $ 300      
$
11
 
  $ 404  
Wholesale
 
 
22
 
    13       268            
 
35
 
    232  
PCL on performing loans
 
 
18
 
    28       568            
 
46
 
    636  
Retail
 
 
500
 
    564       454      
 
1,064
 
    939  
Wholesale
 
 
399
 
    504       398            
 
903
 
    898  
PCL on impaired loans
 
 
899
 
    1,068       852            
 
1,967
 
    1,837  
PCL – Loans
 
$
917
 
  $ 1,096     $ 1,420            
$
2,013
 
  $ 2,473  
PCL on loans as a % of average net loans and acceptances
 
 
0.35%
 
    0.41%     0.58%    
 
0.38%
 
    0.50%
PCL on impaired loans as a % of average net loans and acceptances
 
 
0.34%
 
    0.40%     0.35%          
 
0.37%
 
    0.37%
 
(1)   Information on loans represents loans, acceptances and commitments.
(2)   Includes PCL recorded in Corporate Support and Insurance.
(3)   PCL – Other includes amounts related to debt securities measured at fair value through other comprehensive income (FVOCI) and amortized cost, accounts receivable, and financial and purchased guarantees.
Q2 2026 vs. Q2 2025
Total PCL decreased $512 million or 36% from a year ago, primarily due to lower provisions in Commercial Banking and Personal Banking.
PCL on performing loans decreased $550 million, as the same quarter last year reflected higher provisions primarily due to the impacts of trade disruptions (including tariffs).
PCL on impaired loans increased $47 million or 6%, primarily due to higher provisions in Personal Banking, partially offset by lower provisions in Commercial Banking.
Q2 2026 vs. Q1 2026
Total PCL decreased $178 million or 16% from last quarter, primarily due to lower provisions in Capital Markets, Personal Banking and Commercial Banking, partially offset by higher provisions in Wealth Management.
PCL on performing loans decreased $10 million or 36%, primarily due to changes in credit quality, partially offset by unfavourable changes to our macroeconomic forecast.
PCL on impaired loans decreased $169 million or 16%, primarily due to lower provisions in Capital Markets, Personal Banking and Commercial Banking.
Q2 2026 vs. Q2 2025 (Six months ended)
Total PCL decreased $472 million or 19% from the same period last year, primarily due to lower provisions in Commercial Banking, Personal Banking and Wealth Management, partially offset by higher provisions in Capital Markets.
PCL on performing loans decreased $590 million, as the same period last year reflected higher provisions primarily due to the impacts of trade disruptions (including tariffs).
PCL on impaired loans increased $130 million or 7%, primarily due to higher provisions in Personal Banking and Capital Markets, partially offset by lower provisions in Commercial Banking.

Table of Contents
10   
Royal Bank of Canada
  Second Quarter 2026
 
Non-interest
expense
 
     For the three months ended            For the six months ended  
(Millions of Canadian dollars, except percentage amounts)
 
April 30
2026
   
January 31
2026
   
April 30
2025
          
April 30
2026
   
April 30
2025
 
Salaries
 
$
2,393
 
  $ 2,392     $ 2,366      
$
4,785
 
  $ 4,720  
Variable compensation
 
 
2,696
 
    2,753       2,338      
 
5,449
 
    4,907  
Benefits and retention compensation
 
 
734
 
    801       720      
 
1,535
 
    1,406  
Share-based compensation
 
 
188
 
    343       54            
 
531
 
    432  
Human resources
 
 
6,011
 
    6,289       5,478      
 
12,300
 
    11,465  
Equipment
 
 
733
 
    728       704      
 
1,461
 
    1,385  
Occupancy
 
 
447
 
    420       428      
 
867
 
    857  
Communications
 
 
391
 
    355       378      
 
746
 
    705  
Professional fees
 
 
513
 
    471       538      
 
984
 
    1,040  
Amortization of other intangibles
 
 
387
 
    386       457      
 
773
 
    892  
Other
 
 
955
 
    814       747            
 
1,769
 
    1,642  
Non-interest
expense
 
$
9,437
 
  $   9,463     $   8,730      
$
  18,900
 
  $   17,986  
Efficiency ratio
(1)
 
 
  54.1%
 
    52.7%     55.7%    
 
53.4%
 
    55.5%
Efficiency ratio – adjusted
(1), (2)
 
 
53.5%
 
    52.1%     54.5%          
 
52.8%
 
    54.4%
 
  (1)
See Glossary for composition of these measures.
 
  (2)
This is a
non-GAAP
ratio. For further details, including a reconciliation, refer to the Key performance and
non-GAAP
measures section.
 
Q2 2026 vs. Q2 2025
Non-interest
expense increased $707 million or 8% from a year ago, primarily due to higher variable compensation commensurate with increased revenue and the change in the fair value of our U.S. share-based compensation plans, which was largely offset in non-interest income.
Our efficiency ratio of 54.1% decreased 160 bps. Our adjusted efficiency ratio of 53.5% decreased 100 bps.
Q2 2026 vs. Q1 2026
Non-interest
expense decreased $26 million from last quarter, mainly due to lower staff costs, partially offset by the impact of higher legal provisions.
Our efficiency ratio of 54.1% increased 140 bps. Our adjusted efficiency ratio of 53.5% increased 140 bps.
Q2 2026 vs. Q2 2025 (Six months ended)
Non-interest
expense increased $914 million or 5% from the same period last year, largely due to higher variable compensation commensurate with increased revenue, the change in the fair value of our U.S. share-based compensation plans, which was largely offset in non-interest income, and higher staff costs. These factors were partially offset by the impact of foreign exchange translation.
Our efficiency ratio of 53.4% decreased 210 bps. Our adjusted efficiency ratio of 52.8% decreased 160 bps.
Adjusted efficiency ratio is a
non-GAAP
ratio. For further details, including a reconciliation, refer to the Key performance and
non-GAAP
measures section.
Income taxes
 
     For the three months ended            For the six months ended  
(Millions of Canadian dollars, except percentage amounts)
 
April 30
2026
   
January 31
2026
   
April 30
2025
          
April 30
2026
   
April 30
2025
 
Income taxes
 
$
1,595
 
  $ 1,622     $ 1,128            
$
3,217
 
  $ 2,430  
Income before income taxes
 
 
7,104
 
    7,407       5,518            
 
14,511
 
    11,951  
Effective income tax rate
 
 
  22.5%
 
    21.9%     20.4%          
 
22.2%
 
    20.3%
Adjusted results
(1), (2)
           
Income taxes – adjusted
 
$
1,622
 
  $   1,648     $   1,174      
$
3,270
 
  $ 2,518  
Income before income taxes – adjusted
 
 
7,205
 
    7,509       5,702      
 
14,714
 
      12,300  
Effective income tax rate – adjusted
 
 
  22.5%
 
    21.9%     20.6%          
 
  22.2%
 
    20.5%
 
  (1)
These are
non-GAAP
measures or ratios. For further details, including a reconciliation, refer to the Key performance and
non-GAAP
measures section.
 
  (2)
See Glossary for composition of these measures.
 
Q2 2026 vs. Q2 2025
Income tax expense increased $467 million or 41% from a year ago, primarily due to higher income before income taxes. Adjusted income tax expense increased $448 million or 38%.
The effective income tax rate of 22.5% increased 210 bps, mainly due to the impact of changes in earnings mix. The adjusted effective income tax rate of 22.5% increased 190 bps.
Q2 2026 vs. Q1 2026
Income tax expense decreased $27 million or 2% from last quarter, primarily due to lower income before income taxes, partially offset by the impact of changes in earnings mix. Adjusted income tax expense decreased $26 million or 2%.
The effective income tax rate of 22.5% increased 60 bps, primarily due to the impact of changes in earnings mix.

Table of Contents
Royal Bank of Canada
  Second Quarter 2026   11
 
Q2 2026 vs. Q2 2025 (Six months ended)
Income tax expense increased $787 million or 32% from the same period last year, primarily due to higher income before income taxes. Adjusted income tax expense increased $752 million or 30%.
The effective income tax rate of 22.2% increased 190 bps, primarily due to the impact of changes in earnings mix. The adjusted effective income tax rate of 22.2% increased 170 bps.
Adjusted income tax expense and adjusted effective income tax rate are
non-GAAP
measures or ratios. For further details, including a reconciliation, refer to the Key performance and
non-GAAP
measures section.
Business segment results
How we measure and report our business segments
The key methodologies and assumptions used in our management reporting framework are periodically reviewed by management to ensure they remain valid. They remain unchanged from October 31, 2025, with the exception of Insurance. For Insurance, effective the first quarter of 2026, we revised our methodology for allocating capital to Insurance to more closely align with legal entity capital requirements.
For further details on the key methodologies and assumptions used in our management reporting framework, refer to the How we measure and report our business segments section of our 2025 Annual Report.
Key performance and
non-GAAP
measures
Performance measures
We measure and evaluate the performance of our consolidated operations and each business segment using a number of financial metrics, such as net income and ROE. Certain financial metrics, including ROE, do not have a standardized meaning under generally accepted accounting principles (GAAP) and may not be comparable to similar measures disclosed by other financial institutions.
Return on common equity
We use ROE, at both the consolidated and business segment levels, as a measure of return on total capital invested in our business. Management views the business segment ROE measure as a useful measure for supporting investment and resource allocation decisions because it adjusts for certain items that may affect comparability between business segments and certain competitors.
Our consolidated ROE calculation is based on net income available to common shareholders divided by total average common equity for the period. Business segment ROE calculations are based on net income available to common shareholders divided by average attributed capital for the period. For each segment, with the exception of Insurance, average attributed capital includes the capital and leverage required to underpin various risks and amounts invested in goodwill and intangibles and other regulatory deductions. For Insurance, the allocation of capital is more closely aligned with legal entity capital requirements.
The attribution of capital involves the use of assumptions, judgments and methodologies that are regularly reviewed and revised by management as deemed necessary. Changes to such assumptions, judgments and methodologies can have a material effect on the business segment ROE information that we report. Other companies that disclose information on similar attributions and related return measures may use different assumptions, judgments and methodologies.

Table of Contents
12   
Royal Bank of Canada
  Second Quarter 2026
 
The following table provides a summary of our ROE calculations:
 
     For the three months ended  
   
April 30
2026
       
January 31
2026
       
April 30
2025
 
(Millions of Canadian dollars,
except percentage amounts)
 
Personal
Banking
   
Commercial
Banking
   
Wealth
Management
   
Insurance 
(1)
   
Capital
Markets
   
Corporate
Support
   
Total
         Total          Total  
Net income available to common shareholders
 
$
1,837
 
 
$
834
 
 
$
1,157
 
 
$
215
 
 
$
1,444
 
 
$
(115
 
$
5,372
 
    $ 5,643       $ 4,274  
Total average common equity 
(2), (3)
 
 
29,650


19,600


25,600


3,400


40,000


10,150


128,400
 
         127,350            123,300  
ROE
 
 
  25.4%
 
 
  17.4%
 
 
  18.6%
 
 
  25.9%
 
 
  14.8%
 
 
n.m.
 
 
  17.2%
        17.6%         14.2%
                                                                         
   
For the six months ended
           
   
April 30
2026
       
April 30
2025
           
(Millions of Canadian dollars,
except percentage amounts)
 
Personal
Banking
   
Commercial
Banking
   
Wealth
Management
   
Insurance 
(1)
   
Capital
Markets
   
Corporate
Support
   
Total
        
Total
           
Net income available to common shareholders
 
$
3,766
 
 
$
1,675
 
 
$
2,424
 
 
$
424
 
 
$
2,877
 
 
$
(151
 
$
11,015
 
    $ 9,285      
Total average common equity 
(2), (3)
 
 
29,350


19,650


25,600


3,350


39,750


10,150


127,850
 
         120,900      
ROE
 
 
  25.9%
 
 
  17.2%
 
 
  19.1%
 
 
  25.4%
 
 
  14.6%
 
 
n.m.


  17.4%
        15.5%    
 
(1)   Effective the first quarter of 2026, we updated our methodology for allocating capital to Insurance to more closely align with legal entity capital requirements. For further details, refer to the How we measure and report our business segments section.
(2)   Total average common equity represents rounded figures.
(3)   The amounts for the segments are referred to as attributed capital.
n.m.
not meaningful
Non-GAAP
measures
Non-GAAP
measures and ratios do not have a standardized meaning under GAAP and may not be comparable to similar measures disclosed by other financial institutions.
The following discussion describes the
non-GAAP
measures and ratios we use in evaluating our operating results.
Adjusted results and ratios
We believe that adjusted results are more reflective of our ongoing operating results and provide readers with a better understanding of management’s perspective on performance. Specified items discussed below can lead to variability that could obscure trends in underlying business performance and the amortization of acquisition-related intangibles can differ widely between organizations. Excluding the impact of specified items and amortization of acquisition-related intangibles may enhance comparability of our financial performance and enable readers to better assess trends in the underlying businesses.
Our results for the three and six months ended April 30, 2025 were adjusted for the following specified item:
 
HSBC Bank Canada (HSBC Canada) transaction and integration costs.
Adjusted ratios, including adjusted EPS (basic and diluted), adjusted ROE and adjusted efficiency ratio, which are derived from adjusted results, are useful to readers because they may enhance comparability in assessing profitability on a
per-share
basis, how efficiently profits are generated from average common equity and how efficiently costs are managed relative to revenues. Adjusted results and ratios can also help inform and support strategic choices and capital allocation decisions.

Table of Contents
Royal Bank of Canada
  Second Quarter 2026   13
 
Consolidated results, reported and adjusted
The following table provides a reconciliation of our reported results to our adjusted results and illustrates the calculation of adjusted measures presented. The adjusted results and ratios presented below are
non-GAAP
measures or ratios.
 
     As at or for the three months ended            As at or for the six months ended  
(Millions of Canadian dollars,
except per share, number of and percentage amounts)
 
April 30
2026
   
January 31
2026
   
April 30
2025
          
April 30
2026
   
April 30
2025
 
Total revenue
 
$
17,453
 
  $ 17,960     $ 15,672      
$
  35,413
 
  $ 32,411  
PCL
 
 
912
 
    1,090       1,424      
 
2,002
 
    2,474  
Non-interest
expense
 
 
9,437
 
    9,463       8,730      
 
18,900
 
    17,986  
Income before income taxes
 
 
7,104
 
    7,407       5,518      
 
14,511
 
    11,951  
Income taxes
 
 
1,595
 
    1,622       1,128      
 
3,217
 
    2,430  
Net income
 
$
5,509
 
  $ 5,785     $ 4,390      
$
11,294
 
  $ 9,521  
Net income available to common shareholders
 
$
5,372
 
  $ 5,643     $ 4,274            
$
11,015
 
  $ 9,285  
Average number of common shares (thousands)
 
 
 1,393,332
 
    1,398,580       1,411,362      
 
 1,396,000
 
    1,412,671  
Basic earnings per share (in dollars)
 
$
3.86
 
  $ 4.03     $ 3.03            
$
7.89
 
  $ 6.57  
Average number of diluted common shares (thousands)
 
 
1,396,548
 
     1,401,884        1,413,517      
 
1,399,262
 
     1,415,037  
Diluted earnings per share (in dollars)
 
$
3.85
 
  $ 4.03     $ 3.02            
$
7.87
 
  $ 6.56  
ROE
 
 
17.2%
    17.6%     14.2%    
 
17.4%
    15.5%
Effective income tax rate
 
 
  22.5%
    21.9%     20.4%          
 
22.2%
    20.3%
Total adjusting items impacting net income
(before-tax)
 
$
101
 
  $ 102     $ 184      
$
203
 
  $ 349  
Specified item: HSBC Canada transaction and integration costs 
(1)


          31      
 
 
    43  
Amortization of acquisition-related intangibles
(2)
 
 
101
 
    102       153            
 
203
 
    306  
Total income taxes for adjusting items impacting net income
 
$
27
 
  $ 26     $ 46      
$
53
 
  $ 88  
Specified item: HSBC Canada transaction and integration costs 
(1)


          7      
 
 
    13  
Amortization of acquisition-related intangibles
(2)
 
 
27
 
    26       39            
 
53
 
    75  
Adjusted results
           
Income before income taxes – adjusted
 
$
7,205
 
  $ 7,509     $ 5,702      
$
14,714
 
  $ 12,300  
Income taxes – adjusted
 
 
1,622
 
    1,648       1,174      
 
3,270
 
    2,518  
Net income – adjusted
 
 
5,583
 
    5,861       4,528      
 
11,444
 
    9,782  
Net income available to common shareholders – adjusted 
(3)
 
 
5,446
 
    5,719       4,412            
 
11,165
 
    9,546  
Average number of common shares (thousands)
 
 
1,393,332
 
    1,398,580       1,411,362      
 
1,396,000
 
    1,412,671  
Basic earnings per share (in dollars) – adjusted
 
$
3.91
 
  $ 4.09     $ 3.13            
$
8.00
 
  $ 6.76  
Average number of diluted common shares (thousands)
 
 
1,396,548
 
    1,401,884       1,413,517      
 
1,399,262
 
    1,415,037  
Diluted earnings per share (in dollars) – adjusted
 
$
3.90
 
  $ 4.08     $ 3.12            
$
7.98
 
  $ 6.75  
ROE – adjusted
 
 
17.4%
    17.8%     14.7%    
 
17.6%
    15.9%
Effective income tax rate – adjusted
 
 
22.5%
    21.9%     20.6%          
 
22.2%
    20.5%
           
Adjusted efficiency ratio
                                               
Total revenue
 
$
17,453
 
  $ 17,960     $ 15,672      
$
35,413
 
  $ 32,411  
Non-interest
expense
 
 
9,437
 
    9,463       8,730      
$
18,900
 
  $ 17,986  
Less specified item: HSBC Canada transaction and integration costs
(before-tax)
(1)


          31      
 
 
    43  
Less: Amortization of acquisition-related intangibles
(before-tax) 
(2)
 
 
101
 
    102       153      
 
203
 
    306  
Non-interest
expense – adjusted
(3)
 
$
9,336
 
  $ 9,361     $ 8,546      
$
18,697
 
  $ 17,637  
Efficiency ratio
 
 
54.1%
    52.7%     55.7%    
 
53.4%
    55.5%
Efficiency ratio – adjusted
 
 
53.5%
    52.1%     54.5%          
 
52.8%
    54.4%
 
(1)   These amounts have been recognized in Corporate Support.
(2)   Represents the impact of amortization of acquisition-related intangibles (excluding amortization of software), and any goodwill impairment.
(3)   See Glossary for composition of these measures.

Table of Contents
14   
Royal Bank of Canada
  Second Quarter 2026
 
Personal Banking
 
     As at or for the three months ended            As at or for the six months ended  
(Millions of Canadian dollars, except percentage amounts)
 
April 30
2026
   
January 31
2026
   
April 30
2025
          
April 30
2026
   
April 30
2025
 
Net interest income
 
$
3,715
 
  $ 3,831     $ 3,519      
$
7,546
 
  $ 7,024  
Non-interest
income
 
 
1,334
 
    1,407       1,286      
 
2,741
 
    2,592  
Total revenue
 
 
5,049
 
    5,238       4,805      
 
10,287
 
    9,616  
PCL on performing assets
 
 
6
 
    16       246      
 
22
 
    309  
PCL on impaired assets
 
 
486
 
    515       408      
 
1,001
 
    833  
PCL
 
 
492
 
    531       654      
 
1,023
 
    1,142  
Non-interest
expense
 
 
1,987
 
    2,020       1,952      
 
4,007
 
    3,967  
Income before income taxes
 
 
2,570
 
    2,687       2,199      
 
5,257
 
    4,507  
Net income
 
$
1,870
 
  $ 1,962     $ 1,602            
$
 3,832
 
  $ 3,280  
Revenue by business
           
Personal Banking – Canada
 
$
4,736
 
  $ 4,923     $ 4,483      
$
9,659
 
  $ 8,982  
Caribbean & U.S. Banking
 
 
313
 
    315       322            
 
628
 
    634  
Selected balance sheet and other information
           
ROE
 
 
25.4%
    26.3%     23.1%    
 
25.9%
    23.4%
NIM
 
 
2.71%
    2.72%     2.66%    
 
2.71%
    2.62%
Efficiency ratio
 
 
39.4%
    38.6%     40.6%    
 
39.0%
    41.3%
Operating leverage
(1)
 
 
3.3%
    8.7%     6.2%    
 
6.0%
    4.4%
Average total earning assets, net
 
$
562,700
 
  $  559,500     $  541,800      
$
561,100
 
  $  540,900  
Average loans and acceptances, net
 
 
550,800
 
    548,500       531,500      
 
549,600
 
    530,800  
Average deposits
 
 
437,400
 
    436,800       440,400      
 
437,100
 
    438,700  
AUA
(2)
 
 
302,500
 
    293,100       257,500      
 
302,500
 
    257,500  
Average AUA
 
 
297,200
 
    290,100       260,700      
 
293,600
 
    261,200  
PCL on impaired loans as a % of average net loans and acceptances
 
 
0.36%
    0.37%     0.32%    
 
0.36%
    0.32%
Other selected information – Personal Banking – Canada
                                               
Net income
 
$
1,774
 
  $ 1,868     $ 1,503      
$
3,642
 
  $ 3,086  
NIM
 
 
2.65%
    2.66%     2.59%    
 
2.65%
    2.55%
Efficiency ratio
 
 
37.8%
    37.1%     39.3%    
 
37.4%
    39.9%
Operating leverage
 
 
4.1%
    9.1%     5.6%          
 
6.6%
    3.9%
 
(1)   See Glossary for composition of this measure.
(2)   AUA represents
period-end
spot balances and includes securitized residential mortgages and credit card loans as at April 30, 2026 of $13 billion and $5 billion, respectively (January 31, 2026 – $14 billion and $5 billion; April 30, 2025 – $15 billion and $6 billion).
Financial performance
Q2 2026 vs. Q2 2025
Net income increased $268 million or 17% from a year ago, primarily driven by higher net interest income and lower PCL.
Total revenue increased $244 million or 5%.
Personal Banking – Canada revenue increased $253 million or 6%, largely due to higher net interest income reflecting average volume growth of 2% and higher spreads, which included an unfavourable impact from lower accretion of fair value adjustments related to the acquisition of HSBC Canada (HSBC Canada transaction). Higher fee-based client assets reflecting market appreciation and net sales also contributed to the increase.
Caribbean & U.S. Banking revenue decreased $9 million or 3%.
NIM was up 5 bps, mainly due to favourable changes in product mix and the sustained impact of a higher interest rate environment, partially offset by an unfavourable impact from lower accretion of fair value adjustments related to the HSBC Canada transaction.
PCL decreased $162 million or 25%, as the same quarter last year reflected higher provisions on performing loans primarily due to the impacts of trade disruptions (including tariffs). This was partially offset by higher provisions on impaired loans, primarily in our Canadian portfolios.
Non-interest
expense increased $35 million or 2%, largely due to higher operating costs, partially offset by lower staff-related costs, including the prior year impact of targeted amendments to our defined benefit pensions and severance.
Q2 2026 vs. Q1 2026
Net income decreased $92 million or 5% from last quarter, mainly driven by lower net interest income reflecting three fewer days in the current quarter.
NIM was down 1 bp, including an unfavourable impact from lower accretion of fair value adjustments related to the HSBC Canada transaction.

Table of Contents
Royal Bank of Canada
  Second Quarter 2026   15
 
Q2 2026 vs. Q2 2025 (Six months ended)
Net income increased $552 million or 17% from the same period last year, largely driven by higher net interest income, higher non-interest income and lower PCL.
Total revenue increased $671 million or 7%, largely due to higher net interest income reflecting average volume growth of 2% and higher spreads, which included an unfavourable impact from lower accretion of fair value adjustments related to the HSBC Canada transaction. Higher fee-based client assets reflecting market appreciation and net sales also contributed to the increase.
PCL decreased $119 million or 10%, as the same period last year reflected higher provisions on performing loans primarily due to the impacts of trade disruptions (including tariffs). This was partially offset by higher provisions on impaired loans, primarily in our Canadian portfolios.
Non-interest expense increased $40 million or 1%, reflecting prudent expense management.
Commercial Banking
 
     As at or for the three months ended            As at or for the six months ended  
(Millions of Canadian dollars, except percentage amounts)
 
April 30
2026
   
January 31
2026
   
April 30
2025
          
April 30
2026
   
April 30
2025
 
Net interest income
 
$
1,844
 
  $ 1,895     $ 1,734      
$
3,739
 
  $ 3,530  
Non-interest
income
 
 
315
 
    312       328      
 
627
 
    659  
Total revenue
 
 
2,159
 
    2,207       2,062      
 
4,366
 
    4,189  
PCL on performing assets
 
 
1
 
    13       253      
 
14
 
    284  
PCL on impaired assets
 
 
246
 
    273       286      
 
519
 
    594  
PCL
 
 
247
 
    286       539      
 
533
 
    878  
Non-interest
expense
 
 
730
 
    725       698      
 
1,455
 
    1,408  
Income before income taxes
 
 
1,182
 
    1,196       825      
 
2,378
 
    1,903  
Net income
 
$
854
 
  $ 863     $ 597            
$
1,717
 
  $ 1,374  
Selected balance sheet and other information
           
ROE
 
 
17.4%
    16.9%     12.1%    
 
17.2%
    13.8%
NIM
 
 
 3.93%
    3.93%     3.82%    
 
 3.93%
    3.86%
Efficiency ratio
 
 
33.8%
    32.9%     33.9%    
 
33.3%
    33.6%
Operating leverage
 
 
0.1%
    1.7%     1.2%    
 
0.9%
    1.0%
Average total earning assets, net
 
$
 192,400
 
  $  191,300     $  186,000      
$
 191,900
 
  $  184,600  
Average loans and acceptances, net
 
 
192,300
 
    191,300       186,000      
 
191,800
 
    184,600  
Average deposits
 
 
318,900
 
    318,800       310,700      
 
318,800
 
    307,800  
PCL on impaired loans as a % of average net loans and acceptances
 
 
0.53%
    0.57%     0.63%          
 
0.55%
    0.65%
Financial performance
Q2 2026 vs. Q2 2025
Net income increased $257 million or 43% from a year ago, primarily driven by lower PCL. Higher net interest income also contributed to the increase.
Total revenue increased $97 million or 5%, primarily due to higher net interest income reflecting average volume growth of 3% in both loans and deposits, and higher spreads.
PCL decreased $292 million or 54%, as the same quarter last year reflected higher provisions on performing loans primarily due to the impacts of trade disruptions (including tariffs). Lower provisions on impaired loans also contributed to the decrease.
Non-interest
expense increased $32 million or 5%, primarily due to higher operating costs.
Q2 2026 vs. Q1 2026
Net income decreased $9 million or 1% from last quarter, primarily driven by lower net interest income reflecting three fewer days in the current quarter. This was partially offset by lower PCL, largely due to lower provisions on impaired loans.
Q2 2026 vs. Q2 2025 (Six months ended)
Net income increased $343 million or 25% from the same period last year, primarily driven by lower PCL. Higher net interest income also contributed to the increase.
Total revenue increased $177 million or 4%, primarily due to higher net interest income reflecting average volume growth of 4% in both loans and deposits, and higher spreads.
PCL decreased $345 million or 39%, as the same period last year reflected higher provisions on performing loans primarily due to the impacts of trade disruptions (including tariffs). Lower provisions on impaired loans also contributed to the decrease.
Non-interest
expense increased $47 million or 3%, mainly due to higher staff-related costs, operating costs and professional fees, net of realized synergies related to the HSBC Canada transaction.

Table of Contents
16   
Royal Bank of Canada
  Second Quarter 2026
 
Wealth Management
 
     As at or for the three months ended            As at or for the six months ended  
(Millions of Canadian dollars,
except number of, percentage amounts and as otherwise noted)
 
April 30
2026
   
January 31
2026
   
April 30
2025
          
April 30
2026
   
April 30
2025
 
Net interest income
 
$
1,429
 
  $ 1,454     $ 1,301      
$
2,883
 
  $ 2,695  
Non-interest
income
 
 
4,525
 
    4,630       4,096      
 
9,155
 
    8,270  
Total revenue
 
 
5,954
 
    6,084       5,397      
 
12,038
 
    10,965  
PCL on performing assets
 
 
3
 
    (16     35      
 
(13
    71  
PCL on impaired assets
 
 
52
 
    34       51      
 
86
 
    96  
PCL
 
 
55
 
    18       86      
 
73
 
    167  
Non-interest
expense
 
 
4,379
 
    4,384       4,098      
 
8,763
 
    8,302  
Income before income taxes
 
 
1,520
 
    1,682       1,213      
 
3,202
 
    2,496  
Net income
 
$
1,185
 
  $ 1,295     $ 929            
$
2,480
 
  $ 1,909  
Revenue by business
           
Canadian Wealth Management
 
$
1,922
 
  $ 1,916     $ 1,685      
$
3,838
 
  $ 3,378  
U.S. Wealth Management (including City National Bank (City National))
 
 
2,593
 
    2,656       2,450      
 
5,249
 
    4,916  
U.S. Wealth Management (including City National) (US$ millions)
 
 
1,891
 
    1,929       1,725      
 
3,820
 
    3,447  
Global Asset Management
 
 
881
 
    964       740      
 
1,845
 
    1,607  
International Wealth Management
 
 
353
 
    358       329      
 
711
 
    673  
Investor Services
 
 
205
 
    190       193            
 
395
 
    391  
Selected balance sheet and other information
           
ROE
 
 
18.6%
    19.6%     14.6%    
 
19.1%
    14.9%
NIM
 
 
3.37%
    3.38%     3.28%    
 
3.38%
    3.31%
Pre-tax
margin
(1)
 
 
 25.5%
    27.6%     22.5%    
 
26.6%
    22.8%
Number of advisors
(2)
 
 
6,276
 
    6,301       6,191      
 
6,276
 
    6,191  
Average total earning assets, net
 
$
173,800
 
  $ 170,700     $ 162,800      
$
172,200
 
  $ 164,200  
Average loans and acceptances, net
 
 
132,100
 
    129,800       123,400      
 
130,900
 
    122,700  
Average deposits
 
 
178,400
 
    177,100       170,200      
 
177,700
 
    177,100  
AUA
(3)
 
 
5,537,800
 
     5,314,400        4,737,300      
 
5,537,800
 
     4,737,300  
AUM
(3)
 
 
1,620,600
 
    1,578,900       1,354,800      
 
1,620,600
 
    1,354,800  
Average AUA
 
 
 5,504,700
 
    5,335,600       4,862,100      
 
 5,418,700
 
    4,819,400  
Average AUM
 
 
1,604,500
 
    1,569,700       1,391,700      
 
1,586,900
 
    1,376,400  
PCL on impaired loans as a % of average net loans and acceptances
 
 
0.16%
    0.10%     0.16%          
 
 0.13%
    0.16%
 
Estimated impact of U.S. dollar, British pound and Euro translation

on key income statement items

(Millions of Canadian dollars, except percentage amounts)
 
For the three
months ended
         
For the six
months ended
 
 
Q2 2026 vs.
Q2 2025
   
Q2 2026 vs.
Q1 2026
          
Q2 2026 vs.
Q2 2025
 
Increase (decrease):
       
Total revenue
 
$
(98
 
$
(17
   
$
(197
PCL
 
 
(1


(2
Non-interest
expense
 
 
(77
 
 
(13
   
 
(149
Net income
 
 
(16
 
 
(4
         
 
(37
Percentage change in average U.S. dollar equivalent of C$1.00
 
 
4%


–%


4%
 
Percentage change in average British pound equivalent of C$1.00
 
 
–%


1%


(2)%
 
Percentage change in average Euro equivalent of C$1.00
 
 
(4)%


1%


(6)%
 
 
(1)  
Pre-tax
margin is defined as income before income taxes divided by total revenue.
(2)   Represents client-facing advisors across all of our Wealth Management businesses.
(3)   Represents
period-end
spot balances.
Financial performance
Q2 2026 vs. Q2 2025
Net income increased $256 million or 28% from a year ago, mainly due to higher fee-based client assets reflecting market appreciation and net sales, which also drove higher variable compensation. Higher net interest income reflecting average volume growth in loans and deposits and higher spreads also contributed to the increase.
Total revenue increased $557 million or 10%.
Canadian Wealth Management revenue increased $237 million or 14%, primarily due to higher fee-based client assets reflecting market appreciation and net sales. Higher net interest income reflecting average volume growth in deposits, as well as higher transactional revenue driven by client activity also contributed to the increase.
U.S. Wealth Management (including City National) revenue increased $143 million or 6%. The impact of foreign exchange translation decreased revenue by $97 million. In U.S. dollars, revenue increased $166 million or 10%, primarily due to higher fee-based client assets reflecting market appreciation and net sales, as well as higher net interest income reflecting higher spreads and average volume growth in loans.
Global Asset Management revenue increased $141 million or 19%, primarily due to higher fee-based client assets reflecting market appreciation and net sales.
International Wealth Management revenue increased $24 million or 7%, primarily due to higher fee-based client assets reflecting market appreciation, as well as higher transactional revenue.
Investor Services revenue increased $12 million or 6%, primarily due to higher fee revenue, higher transactional revenue, as well as higher net interest income. These factors were partially offset by the end of the transitional services arrangement relating to the sale of RBC Investor Services
®
operations to CACEIS.

Table of Contents
Royal Bank of Canada
  Second Quarter 2026   17
 
PCL decreased $31 million or 36%, as the same quarter last year reflected higher provisions on performing loans in U.S. Wealth Management (including City National) driven by unfavourable changes to our scenario weights reflecting the impacts of trade disruptions (including tariffs).
Non-interest
expense increased $281 million or 7%, primarily due to higher variable compensation commensurate with increased revenue.
Q2 2026 vs. Q1 2026
Net income decreased $110 million or 8% from last quarter, mainly due to changes in the fair value of seed capital investments, seasonally lower performance fees, and higher PCL mainly reflecting provisions taken on performing loans as compared to releases of provisions last quarter, and higher provisions on impaired loans. These factors were partially offset by lower staff costs.
Q2 2026 vs. Q2 2025 (Six months ended)
Net income increased $571 million or 30% from the same period last year, mainly due to higher fee-based client assets reflecting market appreciation and net sales, which also drove higher variable compensation. Higher net interest income also contributed to the increase.
Total revenue increased $1,073 million or 10%, primarily due to higher fee-based client assets reflecting market appreciation and net sales, as well as higher net interest income reflecting average volume growth in loans and higher spreads. These factors were partially offset by the impact of foreign exchange translation.
PCL decreased $94 million or 56%, primarily due to releases of provisions on performing loans in the current period in U.S. Wealth Management (including City National), largely reflecting favourable changes to our macroeconomic forecast, as compared to provisions taken in the same period last year, mainly driven by unfavourable changes to our scenario weights reflecting the impacts of trade disruptions (including tariffs).
Non-interest expense increased $461 million or 6%, largely due to higher variable compensation commensurate with increased revenue, as well as higher staff costs. These factors were partially offset by the impact of foreign exchange translation.
Insurance
 
     As at or for the three months ended            As at or for the six months ended  
(Millions of Canadian dollars, except percentage amounts)
 
April 30
2026
   
January 31
2026
   
April 30
2025
          
April 30
2026
   
April 30
2025
 
Non-interest
income
           
Insurance service result
 
$
217
 
  $ 240     $ 224      
$
457
 
  $ 510  
Insurance investment result
 
 
92
 
    59       78      
 
151
 
    160  
Other income
 
 
36
 
    39       36      
 
75
 
    74  
Total revenue
 
 
345
 
    338       338      
 
683
 
    744  
Non-interest
expense
 
 
75
 
    78       80      
 
153
 
    167  
Income before income taxes
 
 
270
 
    260       258      
 
530
 
    577  
Net income
 
$
218
 
  $ 213     $ 211            
$
431
 
  $ 483  
Selected balances and other information
           
ROE
(1)
 
 
  25.9%
      24.9%       42.0%    
 
  25.4%
      46.1%
Premiums and deposits
(2), (3)
 
$
1,589
 
  $ 1,683     $ 1,360      
$
3,272
 
  $ 3,782  
Contractual service margin (CSM)
(4)
 
 
1,759
 
    1,773       1,950            
 
1,759
 
    1,950  
 
(1)   Effective the first quarter of 2026, we revised our methodology for allocating capital to Insurance to more closely align with legal entity capital requirements. For further details, refer to the How we measure and report our business segments section.
(2)   Premiums and deposits include premiums on risk-based individual and group insurance and annuity products as well as segregated fund deposits, consistent with insurance industry practices.
(3)   Comparative amounts for the three months and six months ended April 30, 2025 have been revised from those previously presented.
(4)   Represents the CSM of insurance contract assets and liabilities net of reinsurance contract held assets and liabilities. For insurance contracts, the CSM represents the unearned profit (net inflows) for providing insurance coverage. For reinsurance contracts held, the CSM represents the net cost or net gain of purchasing reinsurance. The CSM is not applicable to contracts measured using the premium allocation approach.
Financial performance
Q2 2026 vs. Q2 2025
Net income increased $7 million or 3% from a year ago, primarily due to higher insurance investment result reflecting lower capital funding costs. This was partially offset by lower insurance service result, as the favourable impact of reinsurance contract recaptures was more than offset by the impact of claims experience.
Total revenue increased $7 million or 2%, primarily due to higher insurance investment result, partially offset by lower insurance service result, as noted above.
Non-interest
expense decreased $5 million or 6%, primarily due to severance costs in the prior year.
Q2 2026 vs. Q1 2026
Net income increased $5 million or 2% from last quarter, primarily due to higher insurance investment result driven by favourable investment-related experience. This was partially offset by lower insurance service result, as the favourable impact of reinsurance contract recaptures was more than offset by the impact of claims experience.
Q2 2026 vs. Q2 2025 (Six months ended)
Net income decreased $52 million or 11% from the same period last year, primarily due to lower insurance service result driven by the impact of reinsurance contract recaptures in the prior period.
Total revenue decreased $61 million or 8%, primarily due to lower insurance service result, as noted above.
Non-interest
expense decreased $14 million or 8%, primarily due to severance costs in the prior period.

Table of Contents
18   
Royal Bank of Canada
  Second Quarter 2026
 
Capital Markets
 
     As at or for the three months ended            As at or for the six months ended  
(Millions of Canadian dollars, except percentage amounts)
 
April 30
2026
   
January 31
2026
   
April 30
2025
          
April 30
2026
   
April 30
2025
 
Net interest income
(1)
 
$
1,315
 
  $ 1,218     $ 1,275      
$
2,533
 
  $ 2,193  
Non-interest
income
(1)
 
 
2,628
 
    2,800       2,026      
 
5,428
 
    4,864  
Total revenue
(1)
 
 
3,943
 
    4,018       3,301      
 
7,961
 
    7,057  
PCL on performing assets
 
 
5
 
    16       40      
 
21
 
    (23
PCL on impaired assets
 
 
112
 
    240       106      
 
352
 
    311  
PCL
 
 
117
 
    256       146      
 
373
 
    288  
Non-interest
expense
 
 
2,097
 
    2,119       1,885      
 
4,216
 
    3,926  
Income before income taxes
 
 
1,729
 
    1,643       1,270      
 
3,372
 
    2,843  
Net income
 
$
1,484
 
  $ 1,478     $ 1,202            
$
2,962
 
  $ 2,634  
Revenue by business
           
Corporate & Investment Banking
 
$
1,861
 
  $ 1,722     $ 1,589      
$
3,583
 
  $ 3,304  
Global Markets
 
 
2,052
 
    2,224       1,769      
 
4,276
 
    3,848  
Other
 
 
30
 
    72       (57          
 
102
 
    (95
Selected balance sheet and other information
           
ROE
 
 
14.8%
 
    14.4%     12.5%    
 
14.6%
 
    13.7%
Average total assets
 
$
 1,453,900
 
  $  1,462,000     $  1,295,000      
$
 1,458,000
 
  $  1,311,100  
Average trading securities
 
 
242,300
 
    253,500       199,800      
 
248,000
 
    205,800  
Average loans and acceptances, net
 
 
188,300
 
    175,500       160,900      
 
181,800
 
    160,300  
Average deposits
 
 
463,200
 
    454,400       374,100      
 
458,700
 
    367,100  
PCL on impaired loans as a % of average net loans and acceptances
 
 
0.25%
 
    0.56%     0.27%          
 
0.40%
    0.39%
 
Estimated impact of U.S. dollar, British pound and Euro translation

on key income statement items
(Millions of Canadian dollars, except percentage amounts)
 
For the three
months ended
         
For the six
months ended
 
 
Q2 2026 vs.
Q2 2025
   
Q2 2026 vs.
Q1 2026
          
Q2 2026 vs.
Q2 2025
 
Increase (decrease):
       
Total revenue
 
$
(102
 
$
(17
   
$
(197
PCL
 
 
(3


(12
Non-interest
expense
 
 
(38
 
 
(9
   
 
(70
Net income
 
 
(51
 
 
(7
         
 
(99
Percentage change in average U.S. dollar equivalent of C$1.00
 
 
4%


–%


4%
 
Percentage change in average British pound equivalent of C$1.00
 
 
–%


1%


(2)%
 
Percentage change in average Euro equivalent of C$1.00
 
 
(4)%


1%


(6)%
 
 
(1)   The taxable equivalent basis (teb) adjustment for the three months ended April 30, 2026 was $20 million (January 31, 2026 – $25 million; April 30, 2025 – $9 million) and for the six months ended April 30, 2026 was $45 million (April 30, 2025 – $35 million). For further discussion, refer to the How we measure and report our business segments section of our 2025 Annual Report.
Financial performance
Q2 2026 vs. Q2 2025
Net income increased $282 million or 23% from a year ago, primarily driven by higher revenue in Global Markets and Corporate & Investment Banking. These factors were partially offset by higher taxes reflecting changes in earnings mix and higher compensation on increased results.
Total revenue increased $642 million or 19%.
Corporate & Investment Banking revenue increased $272 million or 17%, primarily due to higher M&A activity across most regions and higher debt and equity origination across all regions.
Global Markets revenue increased $283 million or 16%, mainly due to higher equity trading revenue in Canada and Europe and gains from the disposition of certain investment securities. Higher commissions revenue in cash equities due to increased client activity, higher revenue from funding and liquidity activities and higher equity and debt origination across most regions also contributed to the increase. These factors were partially offset by the impact of foreign exchange translation.
Other revenue increased $87 million, mainly reflecting lower residual funding and capital costs.
PCL decreased $29 million or 20%, as the same quarter last year reflected higher provisions on performing loans primarily due to the impacts of trade disruptions (including tariffs).
Non-interest
expense increased $212 million or 11%, largely driven by higher compensation on increased results.
Q2 2026 vs. Q1 2026
Net income remained relatively flat. Lower PCL, primarily reflecting lower provisions on impaired loans in a few sectors, including the consumer discretionary and financial services sectors, and higher equity and debt origination across all regions were offset by lower fixed income trading revenue across all regions.

Table of Contents
Royal Bank of Canada
  Second Quarter 2026   19
 
Q2 2026 vs. Q2 2025 (Six months ended)
Net income increased $328 million or 12% from the same period last year, primarily driven by higher revenue in Global Markets, Corporate & Investment Banking and Other. These factors were partially offset by higher compensation on increased results, higher taxes reflecting changes in earnings mix, the impact of foreign exchange translation and higher PCL.
Total revenue increased $904 million or 13%, mainly due to higher equity trading revenue, M&A activity and debt and equity origination across most regions. Lower residual funding and capital costs, gains from the disposition of certain investment securities and higher lending revenue across most regions also contributed to the increase. These factors were partially offset by the impact of foreign exchange translation and lower loan syndication revenue, including loan underwriting markdowns in the U.S.
PCL increased $85 million or 30%, mainly due to provisions taken on performing loans in the current period, primarily driven by portfolio growth and unfavourable changes in credit quality, as compared to releases of provisions in the same period last year. Higher provisions on impaired loans in a few sectors, including the consumer discretionary and financial services sectors, partially offset by lower provisions in the other services sector, also contributed to the increase.
Non-interest
expense increased $290 million or 7%, largely driven by higher compensation on increased results.
Corporate Support
 
     For the three months ended            For the six months ended  
(Millions of Canadian dollars)
 
April 30
2026
   
January 31
2026
   
April 30
2025
          
April 30
2026
   
April 30
2025
 
Net interest income (loss)
(1)
 
$
203
 
  $ 187     $ 227      
$
390
 
  $ 562  
Non-interest
income (loss)
(1), (2)
 
 
(200
    (112     (458    
 
(312
    (722
Total revenue
(1), (2)
 
 
3
 
    75       (231    
 
78
 
    (160
PCL
 
 
1
 
    (1     (1    
 
 
    (1
Non-interest
expense
(2)
 
 
169
 
    137       17      
 
306
 
    216  
Income (loss) before income taxes
(1)
 
 
(167
    (61     (247    
 
(228
    (375
Income taxes (recoveries)
(1)
 
 
(65
    (35     (96    
 
(100
    (216
Net income (loss)
 
$
(102
  $ (26   $ (151          
$
(128
  $ (159
 
(1)   Teb adjusted.
(2)   Revenue for the three months ended April 30, 2026 included gains of $79 million (January 31, 2026 and April 30, 2025 – gains of $90 million and losses of $140 million, respectively) on economic hedges of our U.S. Wealth Management (including City National) share-based compensation plans, and
non-interest
expense included $74 million (January 31, 2026 and April 30, 2025 – $86 million and $(112) million, respectively) of share-based compensation expense driven by changes in the fair value of liabilities relating to our U.S. Wealth Management (including City National) share-based compensation plans. Revenue for the six months ended April 30, 2026 included gains of $169 million (April 30, 2025 – losses of $28 million) on economic hedges of our U.S. Wealth Management (including City National) share-based compensation plans, and
non-interest
expense included $160 million (April 30, 2025 – $(4) million) of share-based compensation expense driven by changes in the fair value of liabilities relating to our U.S. Wealth Management (including City National) share-based compensation plans.
Due to the nature of activities and consolidation adjustments reported in this segment, we believe that a comparative period analysis is not relevant.
Total revenue and Income taxes (recoveries) in Corporate Support include the deduction of the teb adjustment of $20 million for the three months ended April 30, 2026, compared to $25 million in the prior quarter and $9 million in the same quarter last year, which is primarily related to
gross-up
of income from the U.S. tax credit business in Capital Markets.
The following identifies the material items, other than the teb impacts noted previously, affecting the reported results in each period.
Q2 2026
Net loss was $102 million, primarily due to legal provisions and residual unallocated costs.
Q1 2026
Net loss was $26 million, primarily due to residual unallocated costs, partially offset by asset/liability management activities.
Q2 2025
Net loss was $151 million, primarily due to residual unallocated items, including severance.
Q2 2026 (Six months ended)
Net loss was $128 million, primarily due to residual unallocated costs and legal provisions. These factors were partially offset by asset/liability management activities.
Q2 2025 (Six months ended)
Net loss was $159 million, primarily due to residual unallocated items, including severance.

Table of Contents
20   
Royal Bank of Canada
  Second Quarter 2026
 
Quarterly results and trend analysis
Our quarterly results are impacted by a number of trends and recurring factors, which include seasonality of certain businesses, general economic and market conditions, and fluctuations in the Canadian dollar relative to other currencies. The following table summarizes our results for the last eight quarters (the period):
Quarterly results
 
    
2026
           2025            2024  
(Millions of Canadian dollars,
except per share and percentage amounts)
 
Q2
           Q1            Q4     Q3     Q2            Q1            Q4     Q3  
Personal Banking
 
$
5,049
 
    $ 5,238       $ 5,178     $ 5,060     $ 4,805       $ 4,811       $ 4,658     $ 4,490  
Commercial Banking
 
 
2,159
 
      2,207         2,221       2,152       2,062         2,127         2,077       2,036  
Wealth Management
 
 
5,954
 
      6,084         5,900       5,513       5,397         5,568         5,186       4,964  
Insurance
 
 
345
 
      338         209       368       338         406         278       285  
Capital Markets
(1)
 
 
3,943
 
      4,018         3,611       3,758       3,301         3,756         2,903       3,004  
Corporate Support
(1)
 
 
3
 
            75               90       134       (231             71               (28     (148
Total revenue
 
 
 17,453
 
       17,960          17,209        16,985        15,672          16,739          15,074        14,631  
PCL
 
 
912
 
      1,090         1,007       881       1,424         1,050         840       659  
Non-interest
expense
 
 
9,437
 
            9,463               9,374       9,232       8,730               9,256               9,019       8,599  
Income before income taxes
 
 
7,104
 
      7,407         6,828       6,872       5,518         6,433         5,215       5,373  
Income taxes
 
 
1,595
 
            1,622               1,394       1,458       1,128               1,302               993       887  
Net income
 
$
5,509
 
          $ 5,785             $ 5,434     $ 5,414     $ 4,390             $ 5,131             $ 4,222     $ 4,486  
EPS  – basic
 
$
3.86
 
    $ 4.03       $ 3.77     $ 3.76     $ 3.03       $ 3.54       $ 2.92     $ 3.09  
    – diluted
 
 
3.85
 
            4.03               3.76       3.75       3.02               3.54               2.91       3.09  
Effective income tax rate
 
 
22.5%
      21.9%       20.4%     21.2%     20.4%       20.2%       19.0%     16.5%
Period average US$ equivalent of C$1.00
 
$
0.729
 
          $ 0.726             $ 0.720     $ 0.728     $ 0.704             $ 0.699             $ 0.733     $ 0.730  
 
(1)   Teb adjusted. For further discussion, refer to the How we measure and report our business segments section of our 2025 Annual Report.
Seasonality
Seasonal factors may impact our results in certain quarters. The first quarter has historically been stronger for our Capital Markets businesses. The second quarter has fewer days than the other quarters, which generally results in a decrease in net interest income and certain expense items. The third and fourth quarters include the summer months, which generally results in lower client activity and may negatively impact the results of our Capital Markets trading business.
Trend analysis
Earnings over the period have been impacted by the factors noted below.
Personal Banking revenue has benefitted from volume growth in loans and deposits over the period. NIM has been favourably impacted by changes in product mix and the sustained impact of a higher interest rate environment.
Commercial Banking revenue has benefitted from volume growth in loans and deposits over the period. Net interest income has been positively impacted by changes in product mix as well as the sustained impact of a higher interest rate environment.
Wealth Management revenue has generally benefitted from growth in
fee-based
client assets, which is influenced by market conditions.
Insurance revenue primarily reflects investment related and insurance experience. New business gains are deferred through CSM and new business losses are reflected through insurance service result.
Capital Markets revenue is influenced, to a large extent, by market conditions that impact client activity. Investment banking fee pools saw increasing activity through most of 2024. However, fee pool growth started to slow in the first half of 2025 amidst macroeconomic uncertainty and market volatility, before showing signs of recovery in the second half of 2025 and remained robust through the first half of 2026. Sales & trading activity has carried strong momentum since the second half of 2024 as elevated market volatility and constructive market conditions drove strong client activity.
PCL comprises provisions taken on performing assets and provisions taken on impaired assets. PCL on performing assets fluctuated over the period as it is impacted by changes in credit quality, macroeconomic conditions, which drive our forecasts and influence our scenario weights, and exposures. Provisions on performing assets over the period have generally been reflective of unfavourable changes in credit quality. Throughout the period, we have generally seen improvements to our macroeconomic forecast, with the exception of the second quarter of 2025 where we saw unfavourable changes, driven by the impacts of trade disruptions (including tariffs), and the current quarter. PCL on impaired assets has generally trended upwards over the period.
Non-interest
expense has been impacted by fluctuations in variable compensation over the period, commensurate with fluctuations in revenue and earnings. Changes in the fair value of our U.S. share-based compensation plans, which are largely offset in revenue, have also contributed to fluctuations over the period and are impacted by market conditions. While we continue to focus on efficiency management activities, expenses over the period also reflect investments in staff and technology. Expenses also included HSBC Canada transaction and integration costs before the third quarter of 2025.

Table of Contents
Royal Bank of Canada
  Second Quarter 2026   21
 
Our effective income tax rate has been impacted by varying levels of tax adjustments and changes in earnings mix. Beginning in the first quarter of 2025, our effective income tax rate reflects the impact of Pillar Two legislation, which became effective for us beginning November 1, 2024.
Financial condition
Condensed balance sheets
 
     As at  
(Millions of Canadian dollars)
 
April 30
2026
   
October 31
2025
 
Assets
   
Cash and deposits with banks
(1)
 
$
93,493
 
  $ 87,388  
Securities, net of applicable allowance
(2)
 
 
612,364
 
    561,788  
Assets purchased under reverse repurchase agreements and securities borrowed
 
 
316,375
 
    309,683  
Loans
   
Retail
 
 
663,356
 
    652,344  
Wholesale
 
 
422,114
 
    397,171  
Allowance for loan losses
 
 
(7,521
    (7,093
Other – Derivatives
 
 
150,745
 
    177,206  
     – Other
 
 
145,154
 
    146,519  
Total assets
 
$
 2,396,080
 
  $  2,325,006  
Liabilities
   
Deposits
 
$
1,581,546
 
  $ 1,515,616  
Other – Obligations related to assets sold under repurchase agreements and securities loaned
 
 
312,954
 
    289,516  
     – Derivatives
 
 
156,627
 
    183,953  
     – Other
 
 
190,682
 
    182,809  
Subordinated debentures
 
 
13,498
 
    13,961  
Total liabilities
 
 
2,255,307
 
    2,185,855  
Equity attributable to shareholders
 
 
140,717
 
    139,092  
Non-controlling
interests
 
 
56
 
    59  
Total equity
 
 
140,773
 
    139,151  
Total liabilities and equity
 
$
2,396,080
 
  $ 2,325,006  
 
(1)   Cash and deposits with banks comprise Cash and due from banks and Interest-bearing deposits with banks.
(2)   Securities comprise trading and investment securities.
Q2 2026 vs. Q4 2025
Total assets increased $71 billion or 3% from October 31, 2025, net of a $79 billion decrease from foreign exchange translation.
Cash and deposits with banks increased $6 billion or 7%, mainly due to higher deposits with central banks reflecting liquidity and cash management activities.
Securities, net of applicable allowance, increased $51 billion or 9%, primarily due to higher government debt securities reflecting liquidity and cash management activities, partially offset by the impact of foreign exchange translation.
Assets purchased under reverse repurchase agreements (reverse repos) and securities borrowed increased $7 billion or 2%, primarily due to increased client financing activity, partially offset by the impact of foreign exchange translation.
Loans (net of Allowance for loan losses) increased $36 billion or 3%, primarily due to volume growth in wholesale loans and residential mortgages, partially offset by the impact of foreign exchange translation.
Derivative assets decreased $26 billion or 15% net of foreign exchange translation, primarily attributable to lower fair values on foreign exchange and equity contracts, partially offset by higher fair values on other derivative contracts.
Other assets remained relatively flat.
Total liabilities increased $69 billion or 3%, net of a $79 billion decrease from foreign exchange translation.
Deposits increased $66 billion or 4%, mainly due to higher business and government and bank term deposits driven by liquidity and cash management activities and higher demand deposits due to client activity, partially offset by the impact of foreign exchange translation.
Obligations related to repurchase agreements (repos) and securities loaned increased $23 billion or 8%, mainly due to client financing activity, partially offset by the impact of foreign exchange translation.
Derivative liabilities decreased $27 billion or 15% net of foreign exchange translation, primarily attributable to lower fair values on foreign exchange and equity contracts, partially offset by higher fair values on interest rate and other derivative contracts.
Other liabilities increased $8 billion or 4%, mainly due to higher obligations related to securities sold short driven by client activity.
Subordinated debentures remained relatively flat.
Total equity increased $2 billion or 1%, mainly reflecting earnings, net of dividends, share repurchases and redemptions of limited recourse capital notes.

Table of Contents
22   
Royal Bank of Canada
  Second Quarter 2026
 
Off-balance
sheet arrangements
In the normal course of business, we engage in a variety of financial transactions that, for accounting purposes, are not recorded on our Consolidated Balance Sheets.
Off-balance
sheet transactions are generally undertaken for risk, capital and funding management purposes which benefit us and our clients. These include transactions with structured entities and may also include the purchase or issuance of guarantees. These transactions give rise to, among other risks, varying degrees of market, credit, liquidity and funding risks, which are discussed in the Risk management section of this Q2 2026 Report to Shareholders.
Our significant
off-balance
sheet transactions include those described on pages 62 to 64 of our 2025 Annual Report.
Risk management
Credit risk
Credit risk is the risk of loss associated with an obligor’s inability or unwillingness to fulfill its contractual obligations on a timely basis and may arise directly from the risk of default of a primary obligor (e.g., issuer, debtor, counterparty, borrower or policyholder), indirectly from a secondary obligor (e.g., guarantor or reinsurer), through
off-balance
sheet exposures, contingent credit risk, associated credit risk and/or transactional risk. Credit risk includes counterparty credit risk arising from both trading and
non-trading
activities.
Our Enterprise Credit Risk Management Framework (ECRMF) and supporting credit policies are designed to clearly define roles and responsibilities, acceptable practices, limits and key controls. There have been no material changes to our ECRMF as described in our 2025 Annual Report.

Table of Contents
Royal Bank of Canada
  Second Quarter 2026   23
 
Residential mortgages and home equity lines of credit (insured vs. uninsured)
(1)
Residential mortgages and home equity lines of credit are secured by residential properties. The following table presents a breakdown by geographic region.
 
    
As at April 30, 2026
 
(Millions of Canadian dollars,
except percentage amounts)
 
Residential mortgages
       
Home equity
lines of credit 
(2)
 
 
Insured
(3)
        
Uninsured
        
Total
        
Total
 
Region
(4)
                 
Canada
                 
Atlantic provinces
 
$
9,144


41
   
$
13,345


59
   
$
22,489
 
   
$
1,759
 
Quebec
 
 
11,189


23


36,965


77


48,154


3,603
 
Ontario
 
 
30,753


13


202,592


87


233,345


18,517
 
Alberta
 
 
17,643


39


27,403


61


45,046


4,612
 
Saskatchewan and Manitoba
 
 
8,098


37


13,590


63


21,688


1,738
 
B.C. and territories
 
 
11,850


13


78,812


87


90,662


8,434
 
Total Canada
(5)
 
 
88,677


19


372,707


81


461,384


38,663
 
U.S.


36,179


100


36,179


2,217
 
Other International


3,316


100


3,316


1,435
 
Total International


39,495


100


39,495


3,652
 
Total
 
$
88,677


18
     
$
412,202


82
     
$
500,879
 
     
$
42,315
 
                 
     As at January 31, 2026  
(Millions of Canadian dollars,
except percentage amounts)
  Residential mortgages         Home equity
lines of credit (2)
 
  Insured (3)          Uninsured          Total          Total  
Region
(4)
                 
Canada
                 
Atlantic provinces
  $ 9,188       41     $ 13,130       59     $ 22,318       $ 1,747  
Quebec
    11,326       24         36,319       76         47,645         3,515  
Ontario
    30,784       13         200,965       87         231,749         18,369  
Alberta
    17,677       40         26,852       60         44,529         4,588  
Saskatchewan and Manitoba
    8,181       39         12,866       61         21,047         1,706  
B.C. and territories
    12,041       13           78,267       87           90,308           8,314  
Total Canada
(5)
    89,197       19         368,399       81         457,596         38,239  
U.S.
                  35,615       100         35,615         2,154  
Other International
                    3,318       100           3,318           1,374  
Total International
                    38,933       100           38,933           3,528  
Total
  $  89,197       18       $  407,332       82       $  496,529         $  41,767  
 
  (1)
Disclosure is provided in accordance with the requirements of OSFI’s Guideline
B-20
(Residential Mortgage Underwriting Practices and Procedures).
 
  (2)
Includes $42,299 million and $16 million of uninsured and insured home equity lines of credit, respectively (January 31, 2026 – $41,751 million and $16 million, respectively), reported within the personal loan category. The amounts in U.S. and Other International include term loans collateralized by residential properties.
 
  (3)
Insured residential mortgages are mortgages whereby our exposure to default is mitigated by insurance through the Canadian Mortgage and Housing Corporation or other private mortgage default insurers.
 
  (4)
Region is based upon the address of the property mortgaged. The Atlantic provinces comprise Newfoundland and Labrador, Prince Edward Island, Nova Scotia and New Brunswick; B.C. and territories comprise British Columbia, Nunavut, Northwest Territories and Yukon.
 
  (5)
Total consolidated residential mortgages in Canada of $461 billion (January 31, 2026 – $458 billion) includes $12 billion (January 31, 2026 – $12 billion) of mortgages with commercial clients in Commercial Banking, of which $9 billion (January 31, 2026 – $9 billion) are insured, and $18 billion (January 31, 2026 – $18 billion) of residential mortgages in Capital Markets, of which $18 billion (January 31, 2026 – $18 billion) are held for securitization purposes. All of the residential mortgages held for securitization purposes are insured (January 31, 2026 – all insured).
 
Residential mortgages portfolio by amortization period
(1)
The following table provides a summary of the percentage of residential mortgages that fall within the remaining amortization periods based upon current customer payment amounts, which incorporate payments larger than the minimum contractual amount and/or higher frequency of payments.
 
      As at  
    
April 30
2026
     
January 31
2026
     
Canada
 
U.S. and other
International
  
Total
       Canada   U.S. and other
International
  Total
Amortization period
               
25 years
  
 
74
 
 
43
  
 
72
      75     40     72
> 25 years
30 years
  
 
26


57


28
 
        25       60       28  
Total
  
 
100
 
 
100
  
 
100
        100     100     100
 
  (1)
Disclosure is provided in accordance with the requirements of OSFI’s Guideline
B-20
(Residential Mortgage Underwriting Practices and Procedures).


Table of Contents
24   
Royal Bank of Canada
  Second Quarter 2026
 
Average
loan-to-value
(LTV) ratios
(1)
The following table provides a summary of our average LTV ratios for newly originated and acquired uninsured residential mortgages and RBC Homeline Plan
®
products by geographic region, as well as the respective LTV ratios for our total Personal Banking – Canada residential mortgage portfolio outstanding.
 
     For the three months ended            For the six months ended  
   
April 30
2026
       
January 31
2026
         
April 30
2026
 
   
Uninsured
         Uninsured          
Uninsured
 
    
Residential
mortgages 
(2)
   
RBC Homeline
Plan products 
(3)
         Residential
mortgages (2)
    RBC Homeline
Plan products (3)
          
Residential
mortgages 
(2)
   
RBC Homeline
Plan products 
(3)
 
Average of newly originated and acquired for the period, by region 
(4)
               
Atlantic provinces
 
 
70
 
 
70
      70     70    
 
70
 
 
70
Quebec
 
 
70


71
 
      69       70      
 
70


70
 
Ontario
 
 
72


67
 
      71       67      
 
71


67
 
Alberta
 
 
70


70
 
      70       70      
 
70


70
 
Saskatchewan and Manitoba
 
 
72


73
 
      72       73      
 
72


73
 
B.C. and territories
 
 
66


65
 
      67       64      
 
66


64
 
U.S.
 
 
68


n.m.
 
      70       n.m.    
 
69


n.m.
 
Other International
 
 
70


n.m.
 
        72       n.m.          
 
71


n.m.
 
Average of newly originated and acquired for the period
(5), (6)
 
 
70
 
 
68
        70     67          
 
70
 
 
67
Total Personal Banking – Canada residential mortgages portfolio
(7)
 
 
62
 
 
52
        61     51          
 
62
 
 
52
 
  (1)
Disclosure is provided in accordance with the requirements of OSFI’s Guideline
B-20
(Residential Mortgage Underwriting Practices and Procedures).
 
  (2)
Residential mortgages exclude residential mortgages within the RBC Homeline Plan products.
 
  (3)
RBC Homeline Plan products comprise both residential mortgages and home equity lines of credit.
 
  (4)
Region is based upon the address of the property mortgaged. The Atlantic provinces comprise Newfoundland and Labrador, Prince Edward Island, Nova Scotia and New Brunswick; B.C. and territories comprise of British Columbia, Nunavut, Northwest Territories and Yukon.
 
  (5)
The average LTV ratios for newly originated and acquired uninsured residential mortgages and RBC Homeline Plan products are calculated on a weighted basis by mortgage amounts at origination.
 
  (6)
For newly originated mortgages and RBC Homeline Plan products, LTV is calculated based on the total facility amount for the residential mortgage and RBC Homeline Plan product divided by the value of the related residential property.
 
  (7)
Weighted by mortgage balances and adjusted for property values based on the Teranet-National Bank
House Price Index
.
 
  n.m.
not meaningful
 
Net International wholesale exposure by region, asset type and client type
(1), (2)
The following table provides a breakdown of our credit risk exposure by region, asset type and client type.
 
     As at  
   
April 30
2026
       
January 31
2026
 
   
Asset type
       
Client type
                     
(Millions of Canadian dollars)  
Loans
Outstanding
   
Securities 
(3)
   
Repo-style
transactions
   
Derivatives
        
Financials
   
Sovereign
   
Corporate
        
Total
         Total  
Europe (excluding U.K.)
 
$
21,583
 
 
$
37,914
 
 
$
8,849
 
 
$
2,907
 
   
$
32,609
 
 
$
21,072
 
 
$
17,572
 
   
$
71,253
 
    $ 56,437  
U.K.
 
 
15,379


42,388


9,541


1,907


24,780


29,471


14,964


69,215
 
      66,195  
Caribbean
 
 
6,748


10,708


3,750


1,529


10,071


4,870


7,794


22,735
 
      22,000  
Asia-Pacific
 
 
9,750


54,777


5,574


1,671


21,294


44,937


5,541


71,772
 
      55,590  
Other
(4)
 
 
3,232


1,620


4,437


107


2,659


3,334


3,403


9,396
 
        8,553  
Net International exposure
(5)
 
$
 56,692
 
 
$
 147,407
 
 
$
 32,151
 
 
$
 8,121
 
     
$
 91,413
 
 
$
 103,684
 
 
$
 49,274
 
     
$
 244,371
 
      $  208,775  
 
(1)
Geographic profile is based on country of risk, which reflects our assessment of the geographic risk associated with a given exposure. Typically, this is the residence of the borrower.
(2)
Exposures are calculated on a fair value basis and net of collateral, which includes $484 billion against repo-style transactions (January 31, 2026 – $470 billion) and $20 billion against derivatives (January 31, 2026 – $24 billion).
(3)
Securities include $34 billion of trading securities (January 31, 2026 – $28 billion), $60 billion of deposits (January 31, 2026 – $38 billion) and $53 billion of investment securities (January 31, 2026 – $48 billion).
(4)
Includes exposures in the Middle East, Africa and Latin America.
(5)
Excludes $8,290 million (January 31, 2026 – $6,883 million) of exposures to supranational agencies.

Table of Contents
Royal Bank of Canada
  Second Quarter 2026   25
 
Credit quality performance
The following credit quality performance tables and analysis provide information on loans, which represents loans, acceptances and commitments, and other financial assets:
Gross impaired loans
 
     As at and for the three months ended  
(Millions of Canadian dollars, except percentage amounts)
 
April 30
2026
   
January 31
2026
   
October 31
2025
 
Personal Banking
 
$
2,427
 
  $ 2,385     $ 2,091  
Commercial Banking
 
 
3,486
 
    3,450       3,362  
Wealth Management
 
 
923
 
    699       609  
Capital Markets
 
 
2,954
 
    2,633       2,620  
Total GIL
 
$
9,790
 
  $ 9,167     $ 8,682  
Impaired loans, beginning balance
 
$
9,167
 
  $ 8,682     $ 8,751  
Classified as impaired during the period (new impaired)
(1)
 
 
1,888
 
    2,348       1,962  
Net repayments
(1)
 
 
(403
    (578     (249
Amounts written off
 
 
(861
    (753     (1,216
Other
(2)
 
 
(1
    (532     (566
Impaired loans, balance at end of period
 
$
  9,790
 
  $    9,167     $    8,682  
GIL as a % of related loans and acceptances
     
Total GIL as a % of related loans and acceptances
 
 
0.90%
    0.86%     0.83%
Personal Banking
 
 
0.43%
    0.43%     0.38%
Personal Banking – Canada
 
 
0.40%
    0.40%     0.34%
Commercial Banking
 
 
1.78%
    1.78%     1.74%
Wealth Management
 
 
0.69%
    0.54%     0.47%
Capital Markets
 
 
1.52%
    1.46%     1.52%
 
(1)
Certain GIL movements for Personal Banking – Canada and Commercial Banking are generally allocated to new impaired, as Net repayments and certain Other movements are not reasonably determinable.
(2)
Includes return to performing status during the period, recoveries of loans and advances previously written off, sold, amounts related to foreclosed properties held as investment properties and interests in joint ventures for certain
co-lending
arrangements, foreign exchange translation and other movements.
Q2 2026 vs. Q1 2026
Total GIL increased $623 million or 7% from last quarter, primarily due to higher impaired loans in Capital Markets and Wealth Management.
GIL in Personal Banking increased $42 million or 2%, primarily due to higher impaired loans in our Canadian residential mortgages portfolio, partially offset by lower impaired loans in Caribbean Banking and our Canadian personal portfolios.
GIL in Commercial Banking increased $36 million or 1%, primarily due to higher impaired loans in our small business portfolio.
GIL in Wealth Management increased $224 million or 32%, primarily due to higher impaired loans in U.S. Wealth Management (including City National), largely in our retail portfolios, and in the utilities and other services sectors.
GIL in Capital Markets increased $321 million or 12%, primarily due to higher impaired loans in a few sectors, including the real estate and related, forest products and consumer discretionary sectors.
Allowance for credit losses (ACL)
 
     As at  
(Millions of Canadian dollars)
 
April 30
2026
   
January 31
2026
   
October 31
2025
 
Personal Banking
 
$
3,788
 
  $ 3,794     $ 3,739  
Commercial Banking
 
 
2,461
 
    2,436       2,300  
Wealth Management
 
 
522
 
    482       496  
Capital Markets
 
 
1,032
 
    1,039       923  
Corporate Support and other
 
 
1
 
    1       1  
ACL on loans
 
 
7,804
 
    7,752       7,459  
ACL on other financial assets
(1)
 
 
15
 
    15       11  
Total ACL
 
$
   7,819
 
  $    7,767     $    7,470  
ACL on loans is comprised of:
     
Retail
 
$
3,463
 
  $ 3,466     $ 3,454  
Wholesale
 
 
2,024
 
    2,005       2,019  
ACL on performing loans
 
$
5,487
 
  $ 5,471     $ 5,473  
ACL on impaired loans
 
 
2,317
 
    2,281       1,986  
 
(1)
ACL on other financial assets mainly represents allowances on debt securities measured at FVOCI and amortized cost, accounts receivable and financial guarantees.

Table of Contents
26   
Royal Bank of Canada
  Second Quarter 2026
 
Q2 2026 vs. Q1 2026
Total ACL increased $52 million or 1% from last quarter, largely due to higher ACL on impaired loans, primarily in Wealth Management and Commercial Banking, partially offset by Capital Markets. ACL on performing loans increased $16 million, largely due to unfavourable changes to our macroeconomic forecast, partially offset by changes in credit quality.
For further details, refer to Note 5 of our Condensed Financial Statements.
Market risk
Market risk is defined to be the impact of market factors and prices upon our financial condition. This includes potential financial gains or losses due to changes in market-determined variables such as interest rates, credit spreads, equity prices, commodity prices, foreign exchange rates and implied volatilities. There have been no material changes to our Market Risk Management Framework from the framework described in our 2025 Annual Report. Using that framework, we continuously seek to ensure that our market risk exposure is consistent with risk appetite constraints set by the Board of Directors.
Market risk controls include limits on probabilistic measures of potential loss in trading positions, such as
Value-at-Risk
(VaR) and stress testing. Market risk controls are also in place to manage Interest Rate Risk in the Banking Book (IRRBB). To monitor and control IRRBB, we assess two primary metrics, Net Interest Income (NII) risk and Economic Value of Equity (EVE) risk, under a range of market shocks, scenarios and time horizons. There has been no material change to the VaR or IRRBB measurement methodology, controls or limits from those described in our 2025 Annual Report. For further details on our approach to the management of market risk, refer to the Market risk section of our 2025 Annual Report.
Market risk measures – FVTPL positions
VaR and Trading VaR
The following table presents our Market risk VaR and Trading VaR figures:
 
    
April 30, 2026
         January 31, 2026          April 30, 2025  
         
For the three
months ended
              For the three
months ended
              For the three
months ended
 
(Millions of Canadian dollars)  
As at
   
Average
   
High
   
Low
         As at     Average          As at     Average  
Equity
 
$
12
 
 
$
16
 
 
$
21
 
 
$
10
 
    $     12     $ 16       $     25     $     15  
Foreign exchange
 
 
8


5


8


3
 
      7       5         3       3  
Commodities
 
 
8


8


12


6
 
      10       11         5       7  
Interest rate
(1)
 
 
21


23


30


19
 
      25       27         22       19  
Credit specific
(2)
 
 
6


5


8


5
 
      5       6         8       7  
Diversification
(3)
 
 
(37
 
 
(34
 
 
n.m.
 
 
n.m.
        (39     (37         (29     (27
Trading VaR
 
$
18
 
 
$
23
 
 
$
31
 
 
$
14
 
      $ 20     $ 28         $ 34     $ 24  
Total VaR
 
$
34
 
 
$
44
 
 
$
57
 
 
$
32
 
      $ 26     $ 42         $ 51     $ 33  
                                                           
   
April 30, 2026
        April 30, 2025            
         
For the six
months ended
              For the six
months ended
                 
(Millions of Canadian dollars)  
As at
   
Average
   
High
   
Low
        As at     Average                  
Equity
 
$
12
 
 
$
16
 
 
$
25
 
 
$
10
 
    $ 25     $ 15        
Foreign exchange
 
 
8


5


9


2
 
      3       4        
Commodities
 
 
8


10


15


6
 
      5       7        
Interest rate
(1)
 
 
21


25


32


19
 
      22       21        
Credit specific
(2)
 
 
6


5


8


5
 
      8       8        
Diversification
(3)
 
 
(37
 
 
(36
 
 
n.m.
 
 
n.m.
      (29     (31      
Trading VaR
 
$
18
 
 
$
25
 
 
$
34
 
 
$
14
 
      $ 34     $ 24        
Total VaR
 
$
34
 
 
$
43
 
 
$
57
 
 
$
26
 
      $ 51     $ 32        
 
(1)
General credit spread risk and funding spread risk associated with uncollateralized derivatives are included under interest rate VaR.
(2)
Credit specific risk captures issuer-specific credit spread volatility.
(3)
Trading VaR is less than the sum of the individual risk factor VaR results due to risk factor diversification.
n.m.
not meaningful
Q2 2026 vs. Q2 2025
Average Trading VaR of $23 million remained relatively stable from a year ago.
Average total VaR of $44 million increased $11 million, primarily driven by exposure changes in our non-trading equity portfolios.
Q2 2026 vs. Q1 2026
Average Trading VaR of $23 million decreased $5 million from last quarter, primarily driven by exposure changes in our fixed income and commodities portfolios.
Average total VaR of $44 million remained relatively stable from last quarter.

Table of Contents
Royal Bank of Canada
  Second Quarter 2026   27
 
Q2 2026 vs. Q2 2025 (Six months ended)
Average Trading VaR of $25 million remained relatively stable from the same period last year.
Average total VaR of $43 million increased $11 million, primarily driven by exposure changes in our non-trading equity portfolios.
The following chart displays a bar graph of our daily trading profit and loss and a line graph of our daily market risk VaR. We incurred no net trading losses in the three months and six months ended April 30, 2026.


(1)
Trading revenue (teb) in the chart above excludes the impact of loan underwriting commitments.
Market risk measures for assets and liabilities of RBC Insurance
®
We offer a range of insurance products to clients and hold investments to meet future obligations to policyholders. The investments which support actuarial liabilities are predominantly fixed income assets measured at FVTPL. Consequently, changes in the fair values of these assets are largely offset by changes in the discount rates used in the measurement of insurance and reinsurance contract assets and liabilities, and the impacts of both are reflected in Insurance investment result in the Consolidated Statements of Income. As at April 30, 2026, we held assets in support of $22 billion of insurance contract liabilities net of insurance contract assets and reinsurance contracts held balances (January 31, 2026 – $22 billion).
Market risk measures – IRRBB sensitivities
The following table shows the potential
before-tax
impact of an immediate and sustained 100 bps increase or decrease in interest rates on projected EVE and
12-month
NII, assuming no subsequent hedging. Interest rate risk measures are based on current
on-
and
off-balance
sheet positions which can change over time in response to business activity and management actions.
 
    
April 30
2026
        
January 31
2026
        
April 30
2025
 
   
EVE risk
       
NII risk
(1)
                                 
(Millions of Canadian dollars)  
Canadian
dollar
impact 
(2)
   
U.S. dollar
and other
impact
(2)
   
Total
        
Canadian
dollar
impact (2)
   
U.S. dollar
and other
impact
(2)
   
Total
         EVE risk     NII risk (1)          EVE risk     NII risk (1)  
Before-tax
impact of:
                         
100 bps increase in rates
 
$
 (2,238
 
$
 (473
 
$
 (2,711
   
$
 86
 
 
$
 101
 
 
$
 187
 
    $ (2,641   $    215       $ (2,436   $    387  
100 bps decrease in rates
 
 
2,057


(14
 
 
2,043


(184
 
 
(197
 
 
(381
          1,982       (397            1,891       (521
 
(1)
Represents the
12-month
NII exposure to an instantaneous and sustained shift in interest rates.
(2)
Effective the third quarter of 2025, EVE and NII risk for currencies other than the Canadian and U.S. dollar are presented within the U.S. dollar and other impact category. Previously, the impact of other currencies was presented in the Canadian dollar impact category.
As at April 30, 2026, an immediate and sustained
-100
bps shock would have had a negative impact to our NII of $381 million, down from $397 million last quarter. An immediate and sustained +100 bps shock as at April 30, 2026 would have had a negative impact to the bank’s EVE of $2,711 million, up from $2,641 million last quarter. Quarter-over-quarter EVE and NII sensitivities remained relatively stable. During the second quarter of 2026, NII and EVE risks remained within approved limits.

Table of Contents
28   
Royal Bank of Canada
  Second Quarter 2026
 
Linkage of market risk to selected balance sheet items
The following tables provide the linkages between selected balance sheet items with positions included in our trading market risk and
non-trading
market risk disclosures, which illustrates how we manage market risk for our assets and liabilities through different risk measures:
 
    
As at April 30, 2026
         
Market risk measure
     
(Millions of Canadian dollars)  
Balance
sheet amount
   
Traded risk 
(1)
   
Non-traded
risk
(2)
   
Non-traded
risk
primary risk sensitivity
Assets subject to market risk
       
Cash and due from banks
 
$
59,347
 
 
$
 
 
$
59,347
 
 
Interest rate
Interest-bearing deposits with banks
 
 
34,146


34,146
 
 
Interest rate
Securities
       
Trading
 
 
236,601


205,224


31,377
 
 
Interest rate, credit spread
Investment, net of applicable allowance
 
 
375,763


375,763
 
 
Interest rate, credit spread, equity
Assets purchased under reverse repurchase agreements and securities borrowed
 
 
316,375


263,421


52,954
 
 
Interest rate
Loans
       
Retail
 
 
663,356


3


663,353
 
 
Interest rate
Wholesale
 
 
422,114


5,780


416,334
 
 
Interest rate
Allowance for loan losses
 
 
(7,521


(7,521
 
Interest rate
Other
       
Derivatives
 
 
150,745


145,701


5,044
 
 
Interest rate, foreign exchange
Other assets
 
 
136,870


64,121


72,749
 
 
Interest rate
Assets not subject to market risk
(3)
 
 
8,284
 
                   
Total assets
 
$
2,396,080
 
 
$
684,250
 
 
$
1,703,546
 
   
Liabilities subject to market risk
       
Deposits
 
$
1,581,546
 
 
$
73,047
 
 
$
1,508,499
 
 
Interest rate
Other
       
Obligations related to securities sold short
 
 
57,472


57,091


381
 
 
Interest rate, equity
Obligations related to assets sold under repurchase agreements and securities loaned
 
 
312,954


280,031


32,923
 
 
Interest rate
Derivatives
 
 
156,627


153,183


3,444
 
 
Interest rate, foreign exchange
Other liabilities
 
 
108,916


50,583


58,333
 
 
Interest rate
Subordinated debentures
 
 
13,498


13,498
 
 
Interest rate
Liabilities not subject to market risk
(4)
 
 
24,294
 
                   
Total liabilities
 
$
 2,255,307
 
 
$
613,935
 
 
$
 1,617,078
 
   
Total equity
 
 
140,773
 
     
Total liabilities and equity
 
$
2,396,080


(1)
Traded risk includes positions that are classified or designated as FVTPL and positions whose revaluation gains and losses are reported in revenue within our trading portfolios. Market risk measures of VaR and stress tests are used as risk controls for traded risk.
(2)
Non-traded
risk includes positions used in the management of IRRBB and other
non-trading
portfolios. Other
non-trading
portfolios include positions from RBC Insurance and investment securities, net of applicable allowance, not included in IRRBB.
(3)
Assets not subject to market risk primarily include insurance-related assets.
(4)
Liabilities not subject to market risk primarily include insurance contract liabilities.

Table of Contents
Royal Bank of Canada
  Second Quarter 2026   29
 
     As at January 31, 2026
          Market risk measure      
(Millions of Canadian dollars)   Balance
sheet amount
    Traded risk (1)    
Non-traded

risk (2)
   
Non-traded
risk
primary risk sensitivity
Assets subject to market risk
       
Cash and due from banks
  $ 46,226     $     $ 46,226     Interest rate
Interest-bearing deposits with banks
    53,073             53,073     Interest rate
Securities
       
Trading
    229,840       198,098       31,742     Interest rate, credit spread
Investment, net of applicable allowance
    359,126             359,126     Interest rate, credit spread, equity
Assets purchased under reverse repurchase agreements and securities borrowed
    279,800       229,322       50,478     Interest rate
Loans
       
Retail
    655,434       14       655,420     Interest rate
Wholesale
    406,848       5,220       401,628     Interest rate
Allowance for loan losses
    (7,401           (7,401   Interest rate
Other
       
Derivatives
    170,830       165,880       4,950     Interest rate, foreign exchange
Other assets
    140,478       67,133       73,345     Interest rate
Assets not subject to market risk
(3)
    8,139                      
Total assets
  $  2,342,393     $  665,667     $  1,668,587      
Liabilities subject to market risk
       
Deposits
  $ 1,542,216     $ 74,176     $ 1,468,040     Interest rate
Other
       
Obligations related to securities sold short
    47,809       47,134       675     Interest rate, equity
Obligations related to assets sold under repurchase agreements and securities loaned
    288,016       253,515       34,501     Interest rate
Derivatives
    170,731       168,184       2,547     Interest rate, foreign exchange
Other liabilities
    117,460       56,804       60,656     Interest rate
Subordinated debentures
    11,875             11,875     Interest rate
Liabilities not subject to market risk
(4)
    24,428                      
Total liabilities
  $ 2,202,535     $ 599,813     $ 1,578,294      
Total equity
    139,858        
Total liabilities and equity
  $ 2,342,393        
 
(1)
Traded risk includes positions that are classified or designated as FVTPL and positions whose revaluation gains and losses are reported in revenue within our trading portfolios. Market risk measures of VaR and stress tests are used as risk controls for traded risk.
(2)
Non-traded
risk includes positions used in the management of IRRBB and other
non-trading
portfolios. Other
non-trading
portfolios include positions from RBC Insurance and investment securities, net of applicable allowance, not included in IRRBB.
(3)
Assets not subject to market risk primarily include insurance-related assets.
(4)
Liabilities not subject to market risk primarily include insurance contract liabilities.

Table of Contents
30   
Royal Bank of Canada
  Second Quarter 2026
 
Liquidity and funding risk
Liquidity and funding risk (liquidity risk) is the risk that we may be unable to generate sufficient cash or its equivalents in a timely and cost-effective manner to meet our commitments. Liquidity risk arises from mismatches in the timing and value of
on-balance
sheet and
off-balance
sheet cash flows.
Our liquidity risk management activities are conducted in accordance with internal frameworks and policies, including the Enterprise Risk Management Framework (ERMF), the Enterprise Risk Appetite Framework (ERAF), the Enterprise Liquidity Risk Management Framework (LRMF), the Enterprise Liquidity Risk Policy and the Enterprise Pledging Policy. Collectively, our frameworks and policies establish liquidity and funding management requirements that are appropriate for the execution of our strategy and ensuring liquidity risk remains within our risk appetite. There have been no material changes to our internal frameworks and policies from those described in our 2025 Annual Report.
Liquid assets
Available liquid assets include unencumbered cash and securities from
on-
and
off-balance
sheet sources and other liquid assets that can be used as collateral to access funding in a timely manner. In the normal course of business, we may encumber a portion of cash and securities holdings as collateral in support of trading activities and participation in clearing and payment systems. Although unused wholesale funding capacity and access to central bank lending facilities are considered additional potential sources of liquidity, they are excluded in the determination of available liquid assets.
 
    
As at April 30, 2026
 
(Millions of Canadian dollars)  
Bank-owned
liquid assets
   
Securities
received
as collateral
from securities
financing
and derivative
transactions
          
Total liquid
assets
   
Encumbered
liquid assets
   
Unencumbered
liquid assets
 
Cash and deposits with banks
 
$
93,493
 
 
$
 
   
$
93,493
 
 
$
2,777
 
 
$
90,716
 
Securities issued or guaranteed by sovereigns, central banks or multilateral development banks
(1)
 
 
483,189


376,038


859,227


481,371


377,856
 
Other securities
 
 
157,121


201,187


358,308


235,550


122,758
 
Other liquid assets
(2)
 
 
50,570


50,570


40,411


10,159
 
Total liquid assets
 
$
784,373
 
 
$
577,225
 
         
$
1,361,598
 
 
$
760,109
 
 
$
601,489


As at January 31, 2026
 
(Millions of Canadian dollars)  
Bank-owned

liquid assets
    Securities
received
as collateral
from securities
financing
and derivative
transactions
           Total liquid
assets
    Encumbered
liquid assets
    Unencumbered
liquid assets
 
Cash and deposits with banks
  $ 99,299     $       $ 99,299     $ 2,995     $ 96,304  
Securities issued or guaranteed by sovereigns, central banks or multilateral development banks
(1)
    437,696       346,687         784,383       448,779       335,604  
Other securities
    178,370       183,087         361,457       209,706       151,751  
Other liquid assets
(2)
    55,813                     55,813       44,989       10,824  
Total liquid assets
  $ 771,178     $ 529,774             $ 1,300,952     $ 706,469     $ 594,483  
 
 
     As at                           
(Millions of Canadian dollars)
 
April 30
2026
   
January 31
2026
                         
Royal Bank of Canada
 
$
281,217
 
  $ 285,939          
Foreign branches
 
 
92,988
 
    80,597          
Subsidiaries
 
 
227,284
 
    227,947          
Total unencumbered liquid assets
 
$
601,489
 
  $ 594,483          
 
(1)
Includes marketable securities issued by provincial governments and U.S. government-sponsored entities working under U.S. Federal government’s conservatorship (e.g., Federal National Mortgage Association and Federal Home Loan Mortgage Corporation).
(2)
Encumbered liquid assets amount includes cash collateral and margin deposit amounts pledged related to
over-the-counter
(OTC) and exchange-traded derivative transactions.
Unencumbered liquid assets include marketable securities that consider multiple factors including time to convert to cash, concentration and product types to ensure we possess an appropriate mix of assets to support liquidity requirements, including in times of stress. Changes in liquid assets are typically affected by routine flows of retail and commercial client banking activities, and business strategies and activities in Capital Markets and Corporate Treasury.
Q2 2026 vs. Q1 2026
Total unencumbered liquid assets increased $7 billion or 1% from last quarter, primarily due to an increase in securities, partially offset by a decrease in cash and deposits with banks.

Table of Contents
Royal Bank of Canada
  Second Quarter 2026   31
 
Asset encumbrance
The following table provides a summary of our
on-
and
off-balance
sheet assets, distinguishing between those that are encumbered, and those available for sale or use as collateral in secured funding transactions. Encumbered assets are composed of assets pledged as collateral and those assets that are otherwise deemed restricted due to legal, operational, or other purposes, and are not considered as available liquidity to counteract a liquidity stress event.
 
    
As at April 30, 2026
 
   
Total assets
         
Encumbered
         
Unencumbered
 
(Millions of Canadian dollars)  
Bank-owned

assets
   
Securities
received
as collateral
from securities
financing
and derivative
transactions
   
Total
          
Pledged
as collateral
   
Other 
(1)
          
Available
as collateral 
(2)
   
Other
(3)
 
Cash and deposits with banks
 
$
93,493
 
 
$
 
 
$
93,493
 
   
$
 
 
$
2,777
 
   
$
90,716
 
 
$
 
Securities
(4)
 
 
627,834


653,105


1,280,939


765,767


35,661


474,527


4,984
 
Loans, net of allowance for loan losses
                 
Mortgage securities
 
 
50,859


50,859


25,285


25,574


Mortgage loans
 
 
449,116


449,116


70,518


41,830


336,768
 
Other loans
 
 
577,974


577,974


5,081


27,000


545,893
 
Derivatives
 
 
150,745


150,745


150,745
 
Others
(5)
 
 
145,154


145,154


40,411


10,159


94,584
 
Total
 
$
 2,095,175
 
 
$
 653,105
 
 
$
 2,748,280
 
         
$
 907,062
 
 
$
 38,438
 
         
$
 669,806
 
 
$
 1,132,974
 
                                                       
     As at January 31, 2026  
    Total assets           Encumbered           Unencumbered  
(Millions of Canadian dollars)   Bank-owned
assets
    Securities
received
as collateral
from securities
financing
and derivative
transactions
    Total            Pledged
as collateral
    Other (1)            Available
as collateral (2)
    Other (3)  
Cash and deposits with banks
  $ 99,299     $     $ 99,299       $     $ 2,995       $ 96,304     $  
Securities
(4)
    601,113       599,881       1,200,994         703,854       33,543         459,348       4,249  
Loans, net of allowance for loan losses
                 
Mortgage securities
    53,008             53,008         25,638               27,370        
Mortgage loans
    442,676             442,676         70,484               37,260       334,932  
Other loans
    559,197             559,197         5,089               26,443       527,665  
Derivatives
    170,830             170,830                             170,830  
Others
(5)
    148,617             148,617               44,989                     10,824       92,804  
Total
  $  2,074,740     $  599,881     $  2,674,621             $  850,054     $  36,538             $  657,549     $  1,130,480  
 
(1)
Includes assets restricted from use to generate secured funding due to legal or other constraints.
(2)
Represents assets that are immediately available for use as collateral, including National Housing Act Mortgage-Backed Securities (NHA MBS), our unencumbered mortgage loans that qualify as eligible collateral at Federal Home Loan Banks (FHLB), as well as loans that qualify as eligible collateral and are lodged at the Federal Reserve System’s discount window.
(3)
Other unencumbered assets are not subject to any restrictions on their use to secure funding or as collateral but would not be considered immediately available.
(4)
Includes bank-owned liquid assets and securities received as collateral from
off-balance
sheet securities financing, derivative transactions and margin lending. Includes $36 billion (January 31, 2026 – $34 billion) of collateral received through reverse repurchase transactions that cannot be rehypothecated in its current legal form.
(5)
The Pledged as collateral amount includes cash collateral and margin deposit amounts pledged related to OTC and exchange-traded derivative transactions.
Q2 2026 vs. Q1 2026
Total unencumbered assets available as collateral increased $12 billion or 2% from last quarter, largely due to an increase in securities and loans, partially offset by a decrease in cash and deposits with banks.
Funding
Funding strategy
Maintaining a diversified funding base is a key strategy for managing our liquidity risk profile.
Our funding strategy seeks an appropriate balance of funding sources, including a diverse pool of personal, commercial and wealth management deposits, capital and funding, including secured and unsecured wholesale funding.
Wholesale funding activities are well-diversified by geography, investor segment, instrument, currency, structure and maturity. We maintain an ongoing presence in different funding markets, which allows us to continuously monitor market developments and trends, identify opportunities and risks, and execute when timely and appropriate.
We continuously evaluate opportunities to expand into new markets and investor segments since diversification expands our wholesale funding flexibility, minimizes funding concentration and dependency and generally reduces financing costs.
We regularly assess our funding concentration and have implemented limits on certain funding sources to support diversification of our funding base.

Table of Contents
32   
Royal Bank of Canada
  Second Quarter 2026
 
Deposit and funding profile
As at April 30, 2026, relationship-based deposits, which are the primary source of funding for retail and commercial lending, were $1,016 billion or 52% of our total funding (January 31, 2026 – $1,001 billion or 53%).
Funding for highly liquid assets consists primarily of short-term wholesale funding that reflects the monetization period of those assets. Long-term wholesale funding is used mostly to fund less liquid wholesale assets and to support liquid asset buffers.
Senior long-term debt issued by the bank on or after September 23, 2018, that has an original term greater than 400 days and is marketable, subject to certain exceptions, is subject to the Canadian Bank Recapitalization
(Bail-in)
regime. Under the
Bail-in
regime, in circumstances when the Superintendent of Financial Institutions has determined that a bank may no longer be viable, the Governor in Council may, upon a recommendation of the Minister of Finance that he or she is of the opinion that it is in the public interest to do so, grant an order directing the Canada Deposit Insurance Corporation (CDIC) to convert all or a portion of certain shares and liabilities of that bank into common shares. As at April 30, 2026, the notional value of issued and outstanding long-term senior unsecured debt subject to conversion under the
Bail-in
regime was $136 billion (January 31, 2026 – $129 billion). As at April 30, 2026, the notional value of issued and outstanding long-term
non-bail-inable
senior unsecured debt was $74 billion (January 31, 2026 – $75 billion).
For further details on our wholesale funding, refer to the Composition of wholesale funding tables below.
Long-term debt issuance
We operate long-term debt issuance registered programs. Each long-term debt program allows issuances in multiple currencies. The following table summarizes our registered programs and their authorized limits by geography:
Programs by geography
 
Canada
 
U.S.
  
Europe
Canadian Shelf Program – $30 billion
 
U.S. Shelf Program – US$75 billion
  
European Debt Issuance Program – US$75 billion
        
Global Covered Bond Program –
75 billion
We also raise long-term funding using other issuance formats globally and through asset securitizations.
As presented in the following charts, our current long-term debt profile is well-diversified by both currency and product.


(1)   Includes unsecured and secured long-term funding and subordinated debentures with an original term to maturity greater than 1 year
 
(1)   Includes unsecured and secured long-term funding and subordinated debentures with an original term to maturity greater than 1 year
 
(2)   Mortgage-backed securities and Canada Mortgage Bonds

Table of Contents
Royal Bank of Canada
  Second Quarter 2026   33
 
The following table shows the composition of wholesale funding based on remaining term to maturity:
Composition of wholesale funding
(1)
 
    
As at April 30, 2026
 
(Millions of Canadian dollars)  
Less than
1 month
   
1 to 3
months
   
3 to 6
months
   
6 to 12
months
   
Less than 1
year sub-total
   
1 year to
2 years
   
2 years and
greater
   
Total
 
Deposits from banks
(2)
 
$
2,008
 
 
$
419
 
 
$
696
 
 
$
3,311
 
 
$
6,434
 
 
$
 
 
$
 
 
$
6,434
 
Certificates of deposit and commercial paper 
(3)
 
 
16,833


18,147


32,695


63,241


130,916


46


130,962
 
Asset-backed commercial paper
(4)
 
 
5,160


5,507


6,910


2,277


19,854


19,854
 
Senior unsecured medium-term notes
(5)
 
 
6,421


9,376


7,320


27,053


50,170


24,239


67,969


142,378
 
Senior unsecured structured notes
(6)
 
 
2,719


1,423


2,585


4,161


10,888


4,098


13,221


28,207
 
Mortgage securitization


542


660


846


2,048


2,684


12,062


16,794
 
Covered bonds/asset-backed securities
(7)


5,134


7,865


14,793


27,792


10,184


21,580


59,556
 
Subordinated liabilities


13,540


13,540
 
Other
(8)
 
 
8


2,068


51


156


2,283


235


23,904


26,422
 
Total
 
$
 33,149
 
 
$
 42,616
 
 
$
 58,782
 
 
$
 115,838
 
 
$
 250,385
 
 
$
 41,486
 
 
$
 152,276
 
 
$
 444,147
 
Of which:
               
– Secured
 
$
5,160
 
 
$
13,221
 
 
$
15,435
 
 
$
17,916
 
 
$
51,732
 
 
$
12,868
 
 
$
39,276
 
 
$
103,876
 
– Unsecured
 
 
27,989


29,395


43,347


97,922


198,653


28,618


113,000


340,271
 
               
(Millions of Canadian dollars)   As at January 31, 2026  
  Less than
1 month
   
1 to 3
months
   
3 to 6
months
   
6 to 12
months
   
Less than 1
year
sub-total
   
1 year to
2 years
   
2 years and
greater
    Total  
Deposits from banks
(2)
  $ 4,314     $ 177     $ 396     $ 1,043     $ 5,930     $     $     $ 5,930  
Certificates of deposit and commercial paper 
(3)
    11,911       27,356       33,477       53,519       126,263                   126,263  
Asset-backed commercial paper
(4)
    4,500       6,645       6,173       1,704       19,022                   19,022  
Senior unsecured medium-term notes
(5)
    1,493       6,738       17,139       22,443       47,813       29,973       57,407       135,193  
Senior unsecured structured notes
(6)
    3,269       4,351       1,842       4,928       14,390       1,982       13,329       29,701  
Mortgage securitization
          200       542       1,374       2,116       2,125       12,120       16,361  
Covered bonds/asset-backed securities
(7)
          3,227       5,150       15,773       24,150       13,679       18,519       56,348  
Subordinated liabilities
                                        11,871       11,871  
Other
(8)
    102       3,104       4,259       116       7,581       240       23,112       30,933  
Total
  $  25,589     $  51,798     $  68,978     $  100,900     $  247,265     $  47,999     $  136,358     $  431,622  
Of which:
               
– Secured
  $ 4,572     $ 13,136     $ 16,086     $ 18,851     $ 52,645     $ 15,804     $ 35,751     $ 104,200  
– Unsecured
    21,017       38,662       52,892       82,049       194,620       32,195       100,607       327,422  
 
(1)
Excludes repos.
(2)
Excludes deposits associated with services we provide to banks (e.g., custody, cash management).
(3)
Includes bearer deposit notes (unsecured).
(4)
Only includes consolidated liabilities, including our collateralized commercial paper program.
(5)
Includes deposit notes and floating rate notes (unsecured).
(6)
Includes notes where the payout is tied to movements in interest rate, foreign exchange, commodities and equities.
(7)
Includes covered bonds collateralized with residential mortgages and securities backed by credit card receivables.
(8)
Includes tender option bonds (secured) of $5,634 million (January 31, 2026 – $5,112 million), other long-term structured deposits (unsecured) of $18,499 million (January 31, 2026 – $18,259 million), FHLB advances (secured) of $2,038 million (January 31, 2026 – $7,357 million) and wholesale guaranteed interest certificates of $251 million (January 31, 2026 – $205 million).
Credit ratings
Our ability to access unsecured funding markets and to engage in certain collateralized business activities on a cost-effective basis are largely dependent on maintaining competitive credit ratings. Credit ratings and outlooks provided by rating agencies reflect their views and methodologies. Ratings are subject to change, based on a number of factors including, but not limited to, our financial strength, competitive position, liquidity and other factors not completely within our control.
The following table presents our major credit ratings:
Credit ratings
(1)
 
    
As at May 27, 2026
 
    
Short-term

debt
   
Issuer rating 
(2)
   
Senior
long-term debt 
(3)
   
Outlook
 
Moody’s
(4)
 
 
P-1


Aa1


A1


stable
 
Standard & Poor’s
(5)
 
 
A-1+


AA-


A


stable
 
Fitch Ratings
(6)
 
 
F1+


AA+


AA-


stable
 
DBRS
(7)
 
 
R-1 (high)


AA (high)


AA


stable
 
 
  (1)
Credit ratings are not recommendations to purchase, sell or hold a financial obligation in as much as they do not comment on market price or suitability for a particular investor. Ratings are determined by the rating agencies based on criteria established from time to time by them and are subject to revision or withdrawal at any time by the rating organization. Our rating classes may differ from the rating category nomenclatures used by the rating agencies.
 
  (2)
Credit ratings applicable to long-term non-bail-inable senior unsecured debt.
 
  (3)
Includes senior long-term debt which is subject to conversion under the
Bail-in
regime.
 
  (4)
On May 6, 2026, Moody’s affirmed our ratings with a stable outlook.
 
  (5)
On December 10, 2025, Standard & Poor’s performed an annual review of our ratings. There were no changes to our ratings.
 
  (6)
On May 12, 2026, Fitch Ratings upgraded our issuer rating to AA+ from AA following the publication on May 8, 2026 of Fitch Ratings’ updated bank rating criteria. Subsequent to this rating action, Fitch Ratings affirmed our ratings with a stable outlook on May 21, 2026.
 
  (7)
On May 8, 2026, DBRS affirmed our ratings with a stable outlook.
 

Table of Contents
34   
Royal Bank of Canada
  Second Quarter 2026
 
Additional contractual obligations for rating downgrades
We are required to deliver collateral to certain counterparties in the event of a downgrade from our current credit rating. The following table shows the additional collateral obligations required to be posted to OTC derivative counterparties and other counterparties at the reporting date in the event of a
one-,
two-
or three-notch downgrade. These additional collateral obligations are incremental requirements for each successive downgrade and do not represent the cumulative impact of multiple downgrades. The amounts reported change periodically due to several factors, including the transfer of trading activity to centrally cleared financial market infrastructures and exchanges, the expiration of transactions with downgrade triggers, the imposition of internal limitations on new agreements to exclude downgrade triggers, as well as normal course
mark-to-market.
There is no outstanding senior debt issued in the market that contains rating triggers that would lead to early prepayment of principal.
 
      As at  
   
April 30
2026
       
January 31
2026
 
(Millions of Canadian dollars)  
One-notch
downgrade
   
Two-notch
downgrade
   
Three-notch
downgrade
        
One-notch
downgrade
   
Two-notch
downgrade
   
Three-notch
downgrade
 
Additional contractual obligations for rating downgrades
 
$
331
 
 
$
153
 
 
$
710
 
      $ 339     $ 128     $ 717  


Table of Contents
Royal Bank of Canada
  Second Quarter 2026   35
 
Liquidity Coverage Ratio (LCR)
The LCR is a Basel III metric that measures the sufficiency of high-quality liquid assets (HQLA) available to meet liquidity needs over a
30-day
acute stress scenario. The Basel Committee on Banking Supervision (BCBS) and OSFI regulatory minimum coverage requirement for LCR is 100%.
The LCR is calculated using the standard OSFI-prescribed reporting template and disclosed as the average of daily LCR positions during the quarter.
Liquidity coverage ratio common disclosure template
(1)
 
     For the three months ended  
   
April 30
2026
 
(Millions of Canadian dollars, except percentage amounts)  
Total unweighted
value (average) 
(2)
   
Total weighted
value (average)
 
High-quality liquid assets
   
Total high-quality liquid assets (HQLA)
         
$
469,804
 
Cash outflows
   
Retail deposits and deposits from small business customers, of which:
 
$
421,538
 
 
$
 40,154
 
Stable deposits
(3)
 
 
149,885


4,497
 
Less stable deposits
 
 
271,653


35,657
 
Unsecured wholesale funding, of which:
 
 
545,344


264,722
 
Operational deposits (all counterparties) and deposits in networks of cooperative banks
(4)
 
 
189,673


44,726
 
Non-operational
deposits
 
 
333,390


197,715
 
Unsecured debt
 
 
22,281


22,281
 
Secured wholesale funding
   
 
63,646
 
Additional requirements, of which:
 
 
460,794


99,842
 
Outflows related to derivative exposures and other collateral requirements
 
 
96,034


29,657
 
Outflows related to loss of funding on debt products
 
 
11,834


11,834
 
Credit and liquidity facilities
 
 
352,926


58,351
 
Other contractual funding obligations
(5)
 
 
27,685


27,685
 
Other contingent funding obligations
(6)
 
 
991,073


17,547
 
Total cash outflows
         
$
513,596
 
Cash inflows
   
Secured lending (e.g., reverse repos)
 
$
 441,582
 
 
$
87,578
 
Inflows from fully performing exposures
 
 
27,837


12,665
 
Other cash inflows
 
 
39,816


39,816
 
Total cash inflows
         
$
140,059
 
         
Total
adjusted value
 
Total HQLA
   
$
 469,804
 
Total net cash outflows
         
 
373,537
 
Liquidity coverage ratio
         
 
126%
                 
   
January 31
2026
 
(Millions of Canadian dollars, except percentage amounts)          Total
adjusted value
 
Total HQLA
    $  468,324  
Total net cash outflows
            377,577  
Liquidity coverage ratio
            124%
 
(1)
The LCR is calculated in accordance with OSFI’s LAR guideline, which, in turn, reflects liquidity-related requirements issued by the BCBS. The LCR for the quarter ended April 30, 2026 is calculated as an average of 62 daily positions.
(2)
With the exception of other contingent funding obligations, unweighted inflow and outflow amounts are items maturing or callable in 30 days or less. Other contingent funding obligations also include debt securities with remaining maturity greater than 30 days.
(3)
As defined by the BCBS, stable deposits from retail and small business customers are deposits that are insured and are either held in transactional accounts or the bank has an established relationship with the client making the withdrawal unlikely.
(4)
Operational deposits from customers other than retail and small and
medium-sized
enterprises, are deposits which clients need to keep with the bank in order to facilitate their access and ability to use payment and settlement systems primarily for clearing, custody and cash management activities.
(5)
Other contractual funding obligations primarily include outflows from unsettled securities trades and outflows from obligations related to securities sold short.
(6)
Other contingent funding obligations include outflows related to other
off-balance
sheet facilities that carry low LCR runoff factors (0% – 5%).
We manage our LCR position within a target range that reflects our liquidity risk tolerance, business mix, asset composition and funding capabilities. The range is subject to periodic review, considering changes to internal requirements and external developments.
HQLA eligibility is defined by OSFI eligibility criteria and subject to OSFI-prescribed haircuts. We maintain HQLA in major currencies with dependable market depth and breadth. Our treasury management practices are designed to ensure that the levels of HQLA are actively managed to meet target LCR objectives. Our HQLA include cash, placements with central banks and highly rated securities issued or guaranteed by sovereign issuers and supranational and
non-financial
entities.

Table of Contents
36   
Royal Bank of Canada
  Second Quarter 2026
 
The LCR captures cash flows from
on-
and
off-balance
sheet activities that are either expected or could potentially occur within 30 days in an acute stress scenario. Net cash outflows for demand and term deposits are calculated using the prescribed withdrawal factors, differentiated by client type (wholesale, retail and small- and
medium-sized
enterprises). Cash outflows also arise from business activities that create contingent funding and collateral requirements, such as repo funding, derivatives, short sales of securities and the extension of credit and liquidity commitments to clients. These are offset by inflows from performing loans, securities lending activities and other
non-HQLA
assets.
The LCR does not reflect any market funding capacity that we believe would be available in a stress situation and all maturing wholesale debt is assigned 100% outflow in the LCR calculation.
Q2 2026 vs. Q1 2026
The average LCR for the quarter ended April 30, 2026 was 126%, which translates into a surplus of approximately $96 billion, compared to 124% and a surplus of approximately $91 billion in the prior quarter. Average LCR increased from the prior quarter, primarily due to changes in securities mix, partially offset by loan growth.
Net Stable Funding Ratio (NSFR)
NSFR is a Basel III metric that measures the sufficiency of available stable funding relative to the amount of required stable funding. The BCBS and OSFI LAR regulatory minimum coverage level for NSFR is 100%.
Available stable funding (ASF) is defined as the portion of capital and liabilities expected to be reliable over the time horizon considered by the NSFR. Required stable funding (RSF) is a function of the liquidity characteristics and residual maturities of various bank assets and
off-balance
sheet exposures.
OSFI requires Canadian Domestic Systemically Important Banks
(D-SIBs)
to disclose the NSFR using the standard Basel disclosure template. Amounts presented in this disclosure template are determined in accordance with the requirements of OSFI’s LAR guideline and are not necessarily aligned with the classification requirements prescribed under IFRS.

Table of Contents
Royal Bank of Canada
  Second Quarter 2026   37
 
Net Stable Funding Ratio common disclosure template
(1)
 
    
As at April 30, 2026
 
   
Unweighted value by residual maturity
(2)
   
Weighted
value
 
(Millions of Canadian dollars, except percentage amounts)  
No maturity
   
< 6 months
   
6 months to
< 1 year
   
 1 year
 
Available Stable Funding (ASF) Item
         
Capital:
 
$
 141,918
 
 
$
 
 
$
 
 
$
13,833
 
 
$
155,751
 
Regulatory Capital
 
 
141,918


13,833


155,751
 
Other Capital Instruments


Retail deposits and deposits from small business customers:
 
 
358,381


123,189


58,308


72,104


558,663
 
Stable deposits
(3)
 
 
108,816


51,243


27,337


30,698


208,725
 
Less stable deposits
 
 
249,565


71,946


30,971


41,406


349,938
 
Wholesale funding:
 
 
388,474


522,016


133,038


159,634


444,695
 
Operational deposits
(4)
 
 
197,510


98,755
 
Other wholesale funding
 
 
190,964


522,016


133,038


159,634


345,940
 
Liabilities with matching interdependent assets
(5)


2,179


1,342


21,807


Other liabilities:
 
 
61,567


310,915


22,283
 
NSFR derivative liabilities
   
 
36,875
 
 
All other liabilities and equity not included in the above categories
 
 
61,567


251,452


607


21,981


22,283
 
Total ASF
                                 
$
 1,181,392
 
Required Stable Funding (RSF) Item
         
Total NSFR high-quality liquid assets (HQLA)
         
$
45,853
 
Deposits held at other financial institutions for operational purposes


2,775


1,387
 
Performing loans and securities:
 
 
310,126


321,951


140,203


591,055


859,403
 
Performing loans to financial institutions secured by Level 1 HQLA
 
 
144


97,754


15,164


12,813
 
Performing loans to financial institutions secured by
non-Level
1 HQLA and unsecured performing loans to financial institutions
 
 
11,526


108,610


34,875


37,137


78,838
 
Performing loans to
non-financial
corporate clients, loans to retail and small business customers, and loans to sovereigns, central banks and PSEs, of which:
 
 
209,390


62,731


37,983


192,555


388,951
 
With a risk weight of less than or equal to 35% under the Basel II standardized approach for credit risk


17,176


11,164
 
Performing residential mortgages, of which:
 
 
41,430


48,038


51,281


333,174


311,704
 
With a risk weight of less than or equal to 35% under the Basel II standardized approach for credit risk
 
 
36,485


47,986


51,246


320,914


297,036
 
Securities that are not in default and do not qualify as HQLA, including exchange-traded equities
 
 
47,636


4,818


900


28,189


67,097
 
Assets with matching interdependent liabilities
(5)


2,179


1,342


21,807


Other assets:
 
 
10,157


424,276


122,532
 
Physical traded commodities, including gold
 
 
10,157


8,634
 
Assets posted as initial margin for derivative contracts and contributions to default funds of CCPs
   
 
 31,762


26,998
 
NSFR derivative assets
   
 
 38,912


2,037
 
NSFR derivative liabilities before deduction of variation margin posted
   
 
 84,107


4,205
 
All other assets not included in the above categories


190,937


70


78,488


80,658
 
Off-balance
sheet items
         
 
1,001,653


37,351
 
Total RSF
                                 
$
1,066,526
 
Net Stable Funding Ratio (%)
                                 
 
111%
         
     As at January 31, 2026         
(Millions of Canadian dollars, except percentage amounts)                              
Weighted
value
 
Total ASF
                                  $  1,158,475  
Total RSF
                                    1,045,826  
Net Stable Funding Ratio (%)
                                    111%
 
(1)
The NSFR is calculated in accordance with OSFI’s LAR guideline, which, in turn, reflects liquidity-related requirements issued by the BCBS.
(2)
Totals for the following rows encompass the residual maturity categories of less than 6 months, 6 months to less than 1 year, and greater than or equal to 1 year in accordance with the requirements of the common disclosure template prescribed by OSFI: Other liabilities, NSFR derivative liabilities, Other assets, Assets posted as initial margin for derivative contracts and contributions to default funds of central counterparties (CCPs), NSFR derivative assets, NSFR derivative liabilities before deduction of variation margin posted and
Off-balance
sheet items.
(3)
As defined by the BCBS, stable deposits from retail and small business customers are deposits that are insured and are either held in transactional accounts or the bank has an established relationship with the client making the withdrawal unlikely.
(4)
Operational deposits from customers other than retail and small- and
medium-sized
enterprises, are deposits which clients need to keep with the bank in order to facilitate their access and ability to use payment and settlement systems primarily for clearing, custody and cash management activities.
(5)
Interdependent assets and liabilities represent NHA MBS liabilities, including liabilities arising from transactions involving the Canada Mortgage Bond program and their corresponding encumbered mortgages.

Table of Contents
38   
Royal Bank of Canada
  Second Quarter 2026
 
Available stable funding is comprised primarily of a diversified pool of personal and commercial deposits, capital and long-term wholesale liabilities. Required stable funding is driven mainly by the bank’s mortgage and loan portfolio, secured loans to financial institutions and to a lesser extent by other less liquid assets. The NSFR does not reflect any unused market funding capacity that we believe would be available.
Volume and composition of available stable funding is actively managed to optimize our structural funding position and meet NSFR objectives. Our NSFR is managed in accordance with our comprehensive LRMF.
Q2 2026 vs. Q1 2026
The NSFR as at April 30, 2026 was 111%, which translates into a surplus of approximately $115 billion, compared to 111% and a surplus of approximately $113 billion in the prior quarter. NSFR remained flat compared to last quarter as growth in deposits and funding was offset by loan growth.
Capital management
We continue to manage our capital in accordance with our Capital Management Framework as described in our 2025 Annual Report. In addition, we continue to monitor for new regulatory capital developments, including OSFI guidance, in order to comply with these requirements as disclosed in the Capital management section in our 2025 Annual Report, and as updated below.
OSFI expects Canadian banks to meet the Basel III targets for CET1, Tier 1 and Total capital ratios as per CAR guidelines. Under Basel III, banks select from two main approaches, the Standardized Approach (SA) or the Internal Ratings Based (IRB) Approach, to calculate their minimum regulatory capital required to support credit, market and operational risks. We apply the IRB approach to credit risk to determine minimum regulatory capital requirements for the majority of our portfolios. Certain credit risk portfolios are subject to the SA, primarily in Wealth Management including our City National wholesale portfolio, our Caribbean Banking operations and certain
non-mortgage
retail portfolios. For consolidated regulatory reporting of market risk capital and operational risk capital, we use the revised SA based on OSFI requirements.
The Financial Stability Board (FSB) has
re-designated
us as a Global Systemically Important Bank
(G-SIB).
This designation requires us to maintain a higher loss absorbency requirement (common equity as a percentage of RWA) of 1% consistent with the
D-SIB
requirement. In addition to the Basel III targets, OSFI established a Domestic Stability Buffer (DSB) applicable to all Canadian
D-SIBs
to further ensure the financial stability of the Canadian financial system. The current OSFI requirement for the DSB is set at 3.5% of total RWA as reaffirmed by OSFI on December 18, 2025.
Under OSFI’s Total Loss Absorbing Capacity (TLAC) guideline,
D-SIBs
are required to maintain a risk-based TLAC ratio which builds on the risk-based capital ratios described in the CAR guideline, and a TLAC leverage ratio which builds on the leverage ratio described in OSFI’s LR guideline. The TLAC requirement is intended to address the sufficiency of a
D-SIB’s
loss absorbing capacity in supporting its recapitalization in the event of its failure. TLAC is defined as the aggregate of Tier 1 capital, Tier 2 capital and external TLAC instruments, which allow conversion in whole or in part into common shares under the CDIC Act and meet all of the eligibility criteria under the TLAC guideline.
Our methodology for allocating capital to our business segments is based on the Basel III regulatory capital requirements, with the exception of Insurance. Our attributed capital methodology incorporates leverage requirements to allocate capital to our business segments. Effective the first quarter of 2026, we revised our methodology for allocating capital to Insurance to more closely align with legal entity capital requirements.
For further details, refer to the Capital management section of our 2025 Annual Report.
The following table provides a summary of OSFI’s current regulatory target ratios under Basel III and Pillar 2 requirements. We are in compliance with all current capital, leverage and TLAC requirements imposed by OSFI:
 
Basel III
capital,
leverage and TLAC
ratios
 
OSFI regulatory target requirements for large banks under Basel III
   
Domestic
Stability
Buffer 
(3)
   
Minimum including
Capital Buffers,
D-SIB/G-SIB
surcharge and
Domestic Stability
Buffer as at
April 30, 2026
(4)
   
RBC
capital,
leverage
and TLAC
ratios as at
April 30,
2026
 
 
Minimum
   
Capital
Buffers
   
Minimum
including
Capital
Buffers
   
D-SIB/G-SIB
surcharge
 
(1)
   
Minimum including
Capital Buffers
and
D-SIB/G-SIB

surcharge
(1), (2)
 
                 
CET1     4.5%       2.6%       7.1%       1.0%       8.1%       3.5%       11.6%       13.5%  
Tier 1 capital     6.0%       2.6%       8.6%       1.0%       9.6%       3.5%       13.1%       15.0%  
Total capital     8.0%       2.6%       10.6%       1.0%       11.6%       3.5%       15.1%       16.9%  
Leverage ratio     3.0%       n.a.       3.0%       0.5%       3.5%       n.a.       3.5%       4.3%  
TLAC ratio     21.6%       n.a.       21.6%       n.a.       21.6%       3.5%       25.1%       31.4%  
TLAC leverage ratio     7.25%       n.a.       7.25%       n.a.       7.25%       n.a.       7.25%       9.0%  
 
(1)
A capital surcharge, equal to the higher of our
D-SIB
surcharge and the BCBS’s
G-SIB
surcharge, is applicable to risk-weighted capital. For leverage ratio, only 50% of our
D-SIB
surcharge for capital is the required surcharge.
(2)
The capital buffers include the capital conservation buffer of 2.5% and the countercyclical capital buffer (CCyB) as prescribed by OSFI. The CCyB, calculated in accordance with OSFI’s CAR guidelines, was 0.07% as at April 30, 2026 (January 31, 2026 – 0.07%; October 31, 2025 – 0.06%).
(3)
The DSB can range from 0% to 4% of total RWA and is currently set at 3.5%.
(4)
Minimum target requirements reflect CCyB requirements as at April 30, 2026 which are subject to change based on exposures held at the reporting date.
n.a.
not applicable

Table of Contents
Royal Bank of Canada
  Second Quarter 2026   39
 
The following table provides details on our regulatory capital, TLAC available, RWA, and on ratios for capital, leverage and TLAC. Our capital position remains strong and our capital, leverage and TLAC ratios remain well above OSFI regulatory targets.
 
     As at  
(Millions of Canadian dollars, except percentage amounts)
 
April 30
2026
   
January 31
2026
   
October 31
2025
 
Capital
(1)
     
CET1 capital
 
$
101,313
 
  $ 100,415     $ 98,748  
Tier 1 capital
 
 
112,453
 
    111,549       110,393  
Total capital
 
 
126,286
 
    123,732       122,399  
RWA used in calculation of capital ratios
(1)
     
Credit risk
 
$
606,835
 
  $ 593,247     $ 590,306  
Market risk
 
 
37,511
 
    40,498       41,506  
Operational risk
 
 
104,244
 
    100,948       98,413  
Total RWA
 
$
748,590
 
  $ 734,693     $ 730,225  
Capital ratios and Leverage ratio
(1)
     
CET1 ratio
 
 
13.5%
    13.7%     13.5%
Tier 1 capital ratio
 
 
15.0%
    15.2%     15.1%
Total capital ratio
 
 
16.9%
    16.8%     16.8%
Leverage ratio
 
 
4.3%
    4.4%     4.4%
Leverage ratio exposure
 
$
 2,608,763
 
  $  2,516,801     $  2,491,090  
TLAC available and ratios
(2)
     
TLAC available
 
$
235,104
 
  $ 227,152     $ 230,385  
TLAC ratio
 
 
31.4%
    30.9%     31.5%
TLAC leverage ratio
 
 
9.0%
    9.0%     9.2%
 
  (1)   Capital, RWA and capital ratios are calculated using OSFI’s CAR guideline and the Leverage ratio is calculated using OSFI’s LR guideline. Both the CAR guideline and LR guideline are based on the Basel III framework.  
  (2)   TLAC available and TLAC ratios are calculated using OSFI’s TLAC guideline. The TLAC standard is applied at the resolution entity level which for us is deemed to be Royal Bank of Canada and its subsidiaries. A resolution entity and its subsidiaries are collectively called a resolution group. The TLAC ratio and TLAC leverage ratio are calculated using TLAC available as a percentage of total RWA and leverage exposure, respectively.  
Q2 2026 vs. Q1 2026


  (1)
Represents rounded figures.
  (2)
Represents net internal capital generation of $3.1 billion or 42 bps consisting of net income available to shareholders less common and preferred share dividends and distributions on other equity instruments.
  (3)
Excludes the impact of items in Other.
  (4)
Includes fair value OCI adjustments (3 bps), net credit migration (2 bps), the impact of foreign exchange translation and other movements.
Our CET1 ratio of 13.5% was down 20 bps from last quarter, as net internal capital generation was more than offset by share repurchases, business-driven RWA growth, the net impact of model updates and other items.
Total RWA increased by $14 billion, primarily due to business growth and the net impact of model updates. Business growth reflects higher corporate and retail lending, as well as operational risk from higher revenues, partially offset by a reduction in market risk. Model updates primarily reflect retail parameter changes mainly impacting our personal lending and credit card portfolios. In our CET1 ratio, the impact of foreign exchange translation on RWA is largely mitigated with economic hedges.
Our Tier 1 capital ratio of 15.0% was down 20 bps, mainly reflecting the factors noted under the CET1 ratio.
Our Total capital ratio of 16.9% was up 10 bps, mainly reflecting a favourable impact from the issuance of subordinated debentures, partially offset by the factors noted above under the Tier 1 capital ratio.
Our Leverage ratio of 4.3% was down 10 bps, as net internal capital generation was more than offset by business-driven growth in leverage exposures and share repurchases.
Total leverage exposures increased by $92 billion, mainly due to business growth in repo-style transactions, securities and loans.

Table of Contents
40   
Royal Bank of Canada
  Second Quarter 2026
 
Our TLAC ratio of 31.4% was up 50 bps, reflecting a favourable impact from a net increase in eligible external TLAC instruments, partially offset by the net impact of the factors noted above under the Total capital ratio.
Our TLAC leverage ratio of 9.0% was flat, reflecting a favourable impact from a net increase in eligible external TLAC instruments and the issuance of subordinated debentures. These factors were offset by the net impact of the factors noted above under the Leverage ratio.
External TLAC instruments include long-term debt subject to conversion under the
Bail-in
regime. For further details, refer to Deposit and funding profile in the Liquidity and funding risk section.
Selected capital management activity
The following table provides our selected capital management activity:
 
    
For the three months ended
April 30, 2026
   
For the six months ended
April 30, 2026
 
(Millions of Canadian dollars, except number of shares)  
Transaction date
   
Number of
shares 
(000s)
   
Amount
   
Number of
shares 
(000s)
   
Amount
 
Tier 1 capital
         
Common shares activity
         
Issued in connection with share-based compensation plans 
(1)
   
 
248
 
 
$
    26


652
 
 
$
70
 
Purchased for cancellation
(2)
   
 
(7,386
 
 
(110
 
 
(11,611
 
 
(173
Redemption of preferred shares Series BF
(2), (3)
 
 
November 24, 2025


(12,000
 
 
(300
Redemption of preferred shares Series BH
(2), (3)
 
 
December 8, 2025


(6,000
 
 
(150
Redemption of preferred shares Series BI
(2), (3)
 
 
December 8, 2025


(6,000
 
 
(150
Redemption of LRCN Series 2
(2), (3), (4)
 
 
January 24, 2026


(1,250
 
 
(1,250
Issuance of LRCN Series 8
(2), (3), (4)
 
 
January 30, 2026


1,000


  1,361
 
Tier 2 capital
         
Maturity of January 27, 2026 subordinated debentures
(2), (3)
 
 
January 27, 2026
 
   
$
 
   
$
(2,035
Issuance of May 5, 2036 subordinated debentures
(2), (3)
 
 
April 29, 2026


1,750


1,750
 
 
(1)
Amounts include cash received for stock options exercised during the period and fair value adjustments to stock options.
(2)
For further details, refer to Note 10 of our Condensed Financial Statements.
(3)
Non-Viability
Contingent Capital (NVCC) instruments.
(4)
For each limited recourse capital notes (LRCN) series, the number of shares represents the number of notes issued.
On June 10, 2025, we announced a normal course issuer bid (NCIB) to purchase up to 35 million of our common shares, commencing on June 12, 2025 and continuing until June 11, 2026, or such earlier date as we complete the repurchase of all shares permitted under the bid. Since the inception of this NCIB, the total number of common shares repurchased and cancelled was approximately 18,782 thousand, at a cost of approximately $4,031 million.
For the three months ended April 30, 2026, the total number of common shares repurchased and cancelled under our NCIB program was approximately 7,386 thousand. The total cost of the shares repurchased was $1,673 million.
For the six months ended April 30, 2026, the total number of common shares repurchased and cancelled under our NCIB program was approximately 11,611 thousand. The total cost of the shares repurchased was $2,633 million.
We determine the amount and timing of purchases under the NCIB, subject to prior consultation with OSFI. Purchases may be made through the TSX, the NYSE and other designated exchanges and alternative Canadian trading systems. The price paid for repurchased shares is the prevailing market price at the time of acquisition.
On November 24, 2025, we redeemed all 12 million of our issued and outstanding
Non-Cumulative
5-Year
Rate Reset First Preferred Shares Series BF at a price of $25 per share.
On December 8, 2025, we redeemed all 6 million of our issued and outstanding
Non-Cumulative
Fixed Rate First Preferred Shares Series BH and all 6 million of our issued and outstanding
Non-Cumulative
Fixed Rate First Preferred Shares Series BI at a price of $25 per share.
On January 24, 2026, we redeemed all 1.25 million of our issued and outstanding
Non-Cumulative
5-Year
Fixed Rate Reset First Preferred Shares Series BR (Series BR) at a price of $1,000 per share. As a result of the redemption of Series BR, we automatically redeemed all $1,250 million of our outstanding NVCC 4.00% LRCN Series 2 on the same date for 100% of their principal amount plus accrued interest to, but excluding, the redemption date.
On January 27, 2026, all US$1,500 million of our outstanding NVCC 4.65% subordinated debentures matured. The principal amount plus accrued interest were paid to noteholders on the maturity date.
On January 30, 2026, we issued US$1,000 million of LRCN Series 8 at a price of US$1,000 per note. The LRCN Series 8 bear interest at a fixed rate of 6.50% per annum until May 24, 2033. Thereafter, the interest rate on the LRCN Series 8 will reset every five years at a rate per annum equal to the prevailing
5-Year
U.S. Treasury Rate plus 2.45% until their maturity on May 24, 2086.
On April 29, 2026, we issued $1,750 million of NVCC subordinated debentures. The notes bear interest at a fixed rate of 4.14% per annum until May 5, 2031, and at the Daily Compounded Canadian Overnight Repo Rate Average plus 1.23% thereafter until their maturity on May 5, 2036.

Table of Contents
Royal Bank of Canada
  Second Quarter 2026   41
 
Selected share data
(1)
 
    
As at April 30, 2026
 
(Millions of Canadian dollars, except number of shares and as otherwise noted)  
Number of
shares 
(000s)
   
Amount
   
Dividends
declared per
share
 
Common shares issued
 
 
1,389,676
 
 
$
 20,760
 
 
$
1.64
 
Treasury shares – common shares
(2)
 
 
(539
 
 
(121
       
Common shares outstanding
 
 
1,389,137
 
 
$
20,639
 
       
Stock options and awards
     
Outstanding
 
 
7,570
 
   
Exercisable
 
 
3,885
 
               
First preferred shares issued
     
Non-cumulative
Series BO
(3), (4)
 
 
14,000


350


0.37
 
Non-cumulative
Series BT
(3), (4), (5)
 
 
750


750


 4.20%
Non-cumulative
Series BU
(3), (4), (5)
 
 
750


750


7.41%
Non-cumulative
Series BW
(3), (4), (5)
 
 
600


600


6.70%
Other equity instruments issued
     
LRCN Series 3
(3), (4), (6), (7)
 
 
1,000


1,000


3.65%
LRCN Series 4
(3), (4), (6), (7)
 
 
1,000


1,370


7.50%
LRCN Series 5
(3), (4), (6), (7)
 
 
1,000


1,396


6.35%
LRCN Series 6
(3), (4), (6), (7)
 
 
1,250


1,708


6.75%
LRCN Series 7
(3), (4), (6), (7)
 
 
1,350


1,869


6.50%
LRCN Series 8
(3), (4), (6), (7)
 
 
1,000


1,361


6.50%
Preferred shares and other equity instruments issued
 
 
22,700


11,154
 
 
Treasury instruments – preferred shares and other equity instruments
(2)
 
 
(6
 
 
(16
       
Preferred shares and other equity instruments outstanding
 
 
22,694
 
 
$
11,138
 
       
Dividends on common shares
   
$
2,279
 
 
Dividends on preferred shares and distributions on other equity instruments
(8)
         
 
135


  (1)
For further details about our capital management activity, refer to Note 10 of our Condensed Financial Statements.
 
  (2)
Positive amounts represent a short position and negative amounts represent a long position.
 
  (3)
Dividend rate will reset every five years.
 
  (4)
NVCC instruments.
 
  (5)
The dividends declared per share represent the per annum dividend rate applicable to the shares issued as at the reporting date.
 
  (6)
For each LRCN series, the number of shares represent the number of notes issued and the dividends declared per share represent the annual interest rate percentage applicable to the notes issued as at the reporting date.
 
  (7)
In connection with the issuance of LRCN Series 3, 4, 5, 6, 7 and 8, we issued a certain number of
Non-Cumulative
5-Year
Fixed Rate Reset First Preferred Shares, Series BS, BV, BX, BY, BZ and CA, respectively, to a consolidated trust to be held as trust assets. For further details, refer to Note 10 of our Condensed Financial Statements and Note 19 of our audited 2025 Annual Consolidated Financial Statements.
 
  (8)
Excludes distributions to
non-controlling
interests.
 
As at May 22, 2026, the number of outstanding common shares was 1,389,777,287, including the treasury shares net short position of 76,535, and the number of stock options and awards was 7,545,676.
NVCC provisions require the conversion of the capital instrument into a variable number of common shares in the event that OSFI deems a bank to be
non-viable
or a federal or provincial government in Canada publicly announces that a bank has accepted or agreed to accept a capital injection. If a NVCC trigger event were to occur, our NVCC capital instruments as at April 30, 2026, which were the preferred shares Series BO, BT, BU, BW, the LRCN Series 3, 4, 5, 6, 7, 8 and the subordinated debentures due on January 28, 2033, November 3, 2031, May 3, 2032, February 1, 2033, April 3, 2034, August 8, 2034, February 4, 2035, July 3, 2035, July 17, 2035 and May 5, 2036 would be converted into common shares pursuant to an automatic conversion formula with a conversion price based on the greater of: (i) a contractual floor price of $5.00 (subject to adjustment in certain circumstances), and (ii) the current market price of our common shares at the time of the trigger event
(10-day
volume weighted average). Based on a floor price of $5.00 and including an estimate for accrued dividends and interest, these NVCC capital instruments would convert into a maximum of approximately 6.3 billion common shares, in aggregate, which would represent a dilution impact of 81.9% based on the number of common shares outstanding as at April 30, 2026.

Table of Contents
42   
Royal Bank of Canada
  Second Quarter 2026
 
Accounting and control matters
Summary of accounting policies and estimates
Our Condensed Financial Statements are presented in compliance with International Accounting Standard 34
Interim Financial Reporting
. Our material accounting policies are described in Note 2 of our audited 2025 Annual Consolidated Financial Statements.
Future changes in accounting policies and disclosures
Future changes in accounting policies and disclosures that are not yet effective for us are described in Note 2 of our audited 2025 Annual Consolidated Financial Statements.
Controls and procedures
Disclosure controls and procedures
As of April 30, 2026, management evaluated, under the supervision of and with the participation of the President and Chief Executive Officer and the Chief Financial Officer, the effectiveness of our disclosure controls and procedures as defined under rules adopted by the Canadian securities regulatory authorities and the U.S. SEC. Based on that evaluation, the President and Chief Executive Officer and the Chief Financial Officer concluded that our disclosure controls and procedures were effective as of April 30, 2026.
Internal control over financial reporting
No changes were made in our internal control over financial reporting during the quarter ended April 30, 2026 that have materially affected, or are reasonably likely to materially affect, our internal control over financial reporting.
Related party transactions
In the ordinary course of business, we provide normal banking services and operational services, and enter into other transactions with associated and other related corporations, including our joint venture entities, on terms similar to those offered to
non-related
parties. We grant loans to directors, officers and other employees at rates normally accorded to preferred clients. In addition, we offer deferred share and other plans to
non-employee
directors, executives and certain other key employees. For further information, refer to Notes 12 and 25 of our audited 2025 Annual Consolidated Financial Statements.

Table of Contents
Royal Bank of Canada
  Second Quarter 2026   43
 
Glossary
 
Adjusted results
For further details, including a reconciliation, refer to the Key performance and
non-GAAP
measures section.
 
Adjusted effective income tax rate
– calculated as effective income tax rate excluding the impact of specified items and amortization of acquisition-related intangibles.
 
Adjusted income before income taxes
– calculated as income before income taxes excluding the impact of specified items and amortization of acquisition-related intangibles.
 
Adjusted income taxes
– calculated as income taxes excluding the impact of specified items and amortization of acquisition-related intangibles.
 
Adjusted net income
– calculated as net income excluding the impact of specified items and amortization of acquisition-related intangibles.
 
Adjusted net income available to common shareholders
– calculated as net income available to common shareholders excluding the impact of specified items and amortization of acquisition-related intangibles.
 
Adjusted
non-interest
expense
– calculated as
non-interest
expense excluding the impact of specified items and amortization of acquisition-related intangibles.
Acceptances
A bill of exchange or negotiable instrument drawn by the borrower for payment at maturity and accepted by a bank. The acceptance constitutes a guarantee of payment by the bank and can be traded in the money market. The bank earns a “stamping fee” for providing this guarantee.
Allowance for credit losses (ACL)
The amount deemed adequate by management to absorb expected credit losses as at the balance sheet date. The allowance is established for all financial assets subject to impairment assessment, including certain loans, debt securities, financial guarantees, and undrawn loan commitments. The allowance is changed by the amount of provision for credit losses recorded, which is charged to income, and decreased by the amount of write-offs net of recoveries in the period.
ACL on loans ratio
ACL on loans ratio is calculated as ACL on loans as a percentage of total loans and acceptances.
Asset-backed securities (ABS)
Securities created through the securitization of a pool of assets, for example auto loans or credit card loans.
Assets under administration (AUA)
Assets administered by us, which are beneficially owned by clients, unless otherwise noted. Services provided in respect of assets under administration are of an administrative nature, including safekeeping, collecting investment income, settling purchase and sale transactions, and record keeping.
Assets under management (AUM)
Assets managed by us, which are beneficially owned by clients, unless otherwise noted. Services provided in respect of assets under management include the selection of investments and the provision of investment advice. We have assets under management that are also administered by us and included in assets under administration.
Attributed capital
Attributed capital to our business segments is based on the Basel III regulatory capital and leverage requirements other than for our Insurance segment for which the allocation of capital is more closely aligned with legal entity capital requirements.
Auction rate securities (ARS)
Debt securities whose interest rates are regularly reset through an auction process.
Average earning assets, net
Average earning assets include interest-bearing deposits with other banks, securities, net of applicable allowance, assets purchased under reverse repurchase agreements and securities borrowed, loans, net of allowance, cash collateral and margin deposits. Insurance assets, and all other assets not specified are excluded. The averages are based on the daily balances for the period.
Basis point (bp)
One
one-hundredth
of a percentage point (.01%).
Collateral
Assets pledged as security for a loan or other obligation. Collateral can take many forms, such as cash, highly rated securities, property, inventory, equipment and receivables.
Collateralized debt obligation (CDO)
Securities with multiple tranches that are issued by structured entities and collateralized by debt obligations including bonds and loans. Each tranche offers a varying degree of risk and return so as to meet investor demand.
Commitments to extend credit
Unutilized amount of credit facilities available to clients either in the form of loans, acceptances and other
on-balance
sheet financing, or through
off-balance
sheet products such as guarantees and letters of credit.
Common Equity Tier 1 (CET1) capital
A regulatory Basel III capital measure comprised mainly of common shareholders’ equity less regulatory deductions and adjustments for goodwill and intangibles, defined benefit pension fund assets, shortfall in allowances and other specified items. The CET1 capital is calculated in accordance with OSFI’s CAR guideline. For more details, refer to the Capital management section.
Common Equity Tier 1 capital ratio
A risk-based capital measure calculated as CET1 capital divided by risk-weighted assets. The CET1 ratio is calculated in accordance with OSFI’s CAR guideline.
Contractual service margin (CSM)
For insurance contracts, the CSM represents the unearned profit (net inflows) for providing insurance coverage. For reinsurance contracts held, the CSM represents the net cost or net gain of purchasing reinsurance.
Covered bonds
Full recourse
on-balance
sheet obligations issued by banks and credit institutions that are fully collateralized by assets over which investors enjoy a priority claim in the event of an issuer’s insolvency.
Credit default swaps (CDS)
A derivative contract that provides the purchaser with a
one-time
payment should the referenced entity/entities default (or a similar triggering event occur).
Derivative
A contract with the following characteristics: (a) its value changes in response to the change in an underlying (e.g., price of a financial instrument, index or financial rate); (b) it requires no initial net investment or an initial net investment that is smaller than for contracts with similar responses to changes in market factors; and (c) it is settled at a future date. Examples of derivatives include swaps, options, forward rate agreements and futures.
Dividend payout ratio
Common dividends as a percentage of net income available to common shareholders.
Dividend yield
Dividends per common share divided by the average of the high and low share price in the relevant period.
Earnings per share (EPS), basic
Calculated as net income available to common shareholders divided by the average number of shares outstanding. Adjusted EPS, basic is calculated in the same manner, using adjusted net income available to common shareholders.
Earnings per share (EPS), diluted
Calculated as net income available to common shareholders divided by the average number of shares outstanding adjusted for the dilutive effects of stock options and other convertible securities. Adjusted EPS, diluted is calculated in the same manner, using adjusted net income available to common shareholders.
Efficiency ratio
Non-interest
expense as a percentage of total revenue. Adjusted efficiency ratio is calculated in the same manner, using adjusted
non-interest
expense and total revenue.
Expected credit losses
The difference between the contractual cash flows due to us in accordance with the relevant contractual terms and the cash flows that we expect to receive, discounted to the balance sheet date.
Fair value
Fair value of a financial instrument is the price that would be received to sell an asset or paid to transfer a liability in an orderly transaction between market participants at the measurement date.
Funding valuation adjustment
Funding valuation adjustments are calculated to incorporate cost and benefit of funding in the valuation of uncollateralized and under-collateralized OTC derivatives. Future expected cash flows of these derivatives are discounted to reflect the cost and benefit of funding the derivatives by using a funding curve, implied volatilities and correlations as inputs.
Guarantees and standby letters of credit
These primarily represent irrevocable assurances that a bank will make payments in the event that its client cannot meet its financial obligations to third parties. Certain other guarantees, such as bid and performance bonds, represent
non-financial
undertakings.

Table of Contents
44   
Royal Bank of Canada
  Second Quarter 2026
 
Hedge
A risk management technique used to mitigate exposure from market, interest rate or foreign currency exchange risk arising from normal banking operations. The elimination or reduction of such exposure is accomplished by establishing offsetting positions. For example, assets denominated in foreign currencies can be offset with liabilities in the same currencies or through the use of foreign exchange hedging instruments such as futures, options or foreign exchange contracts.
Hedge funds
A type of investment fund, marketed to accredited high net worth investors, that is subject to limited regulation and restrictions on its investments compared to retail mutual funds, and that often utilize aggressive strategies such as selling short, leverage, program trading, swaps, arbitrage and derivatives.
High-quality liquid assets (HQLA)
HQLA are cash or assets that can be converted into cash quickly through sales (or by being pledged as collateral) with no significant loss of value.
Impaired loans
Loans are classified as impaired when there has been a deterioration of credit quality to the extent that management no longer has reasonable assurance of timely collection of the full amount of principal and interest in accordance with the contractual terms of the loan agreement. Credit card balances are not classified as impaired as they are directly written off after payments are 180 days past due.
Insurance contracts
Contracts under which we accept significant insurance risk from a policyholder by agreeing to compensate the policyholder if a specified uncertain future event adversely affects the policyholder. Insurance contracts also include reinsurance contracts issued by us to compensate another company for claims arising from underlying insurance contracts issued by that other company.
Insurance investment result
Calculated as Net investment income from the Insurance segment, Insurance finance income (expense) from insurance contracts and Reinsurance finance income (expense) from reinsurance contracts held. Net investment income primarily comprises interest and dividend income and net gains (losses) on financial instruments and derivatives relating to the Insurance segment. Insurance and reinsurance finance income (expense) represents the net effect of and changes in the time value of money and financial risks on insurance contracts and reinsurance contracts held, respectively.
Insurance service result
Calculated as Insurance revenue less Insurance service expense from insurance contracts and Net income (expense) from reinsurance contracts held. Insurance revenue represents the revenue recognized in the period as we provide insurance services for the groups of insurance contracts. Insurance service expense represents the costs incurred in providing insurance services in the period, which includes incurred claims and other directly attributable expenses, allocation of acquisition costs, changes relating to past or current services and changes in loss components of onerous groups of contracts. Net income (expense) from reinsurance contracts held represents the amounts recovered from the reinsurers less the allocation of premiums paid on reinsurance contracts held.
International Financial Reporting Standards (IFRS)
IFRS are principles-based standards, interpretations and the framework adopted by the International Accounting Standards Board.
Leverage ratio
A Basel III regulatory measure, the ratio divides Tier 1 capital by the leverage exposure measure. The leverage ratio is a
non-risk-based
measure and is calculated in accordance with OSFI’s LR guideline.
Leverage ratio exposure
The leverage ratio exposure is calculated in accordance with OSFI’s LR guideline and is defined as the sum of total assets plus
off-balance
sheet items after certain adjustments.
Liquidity Coverage Ratio (LCR)
The LCR is a Basel III standard that aims to ensure that an institution has an adequate stock of unencumbered HQLA that consists of cash or assets that can be converted into cash at little or no loss of value in private markets, to meet its liquidity needs for a 30 calendar day liquidity stress scenario. The LCR is calculated in accordance with OSFI’s LAR guideline.
Loan-to-value
(LTV) ratio
Calculated based on the total facility amount for the residential mortgage and RBC Homeline Plan product divided by the value of the related residential property.
Master netting agreement
An agreement between us and a counterparty designed to reduce the credit risk of multiple derivative transactions through the creation of a legal right of offset of exposure in the event of a default.
Net interest income
The difference between what is earned on assets such as loans and securities and what is paid on liabilities such as deposits and subordinated debentures.
Net interest margin (NIM) on average earning assets, net
Calculated as net interest income divided by average earning assets, net.
Net Stable Funding Ratio (NSFR)
The NSFR is a Basel III standard that requires institutions to maintain a stable funding profile defined as available amount of stable funding (ASF) in relation to the composition of their assets and
off-balance
sheet activities defined as required amount of stable funding (RSF). The ratio should be at least equal to 100% on an ongoing basis. The NSFR is calculated in accordance with OSFI’s LAR guideline.
Normal course issuer bid (NCIB)
A program for the repurchase of our own shares for cancellation through a stock exchange that is subject to the various rules of the relevant stock exchange and securities commission.
Notional amount
The contract amount used as a reference point to calculate payments for derivatives.
Off-balance
sheet financial instruments
A variety of arrangements offered to clients, which include credit derivatives, written put options, backstop liquidity facilities, stable value products, financial standby letters of credit, performance guarantees, credit enhancements, mortgage loans sold with recourse, commitments to extend credit, securities lending, documentary and commercial letters of credit, sponsor member guarantees, securities lending indemnifications and indemnifications.
Office of the Superintendent of Financial Institutions Canada (OSFI)
The primary regulator of federally chartered financial institutions and federally administered pension plans in Canada. OSFI’s mission is to safeguard policyholders, depositors and pension plan members from undue loss.
Operating leverage
The difference between our revenue growth rate and
non-interest
expense growth rate.
Options
A contract or a provision of a contract that gives one party (the option holder) the right, but not the obligation, to perform a specified transaction with another party (the option issuer or option writer) according to specified terms.
Provision for credit losses (PCL)
The amount charged to income necessary to bring the allowance for credit losses to a level determined appropriate by management. This includes provisions on performing and impaired financial assets.
PCL on loans ratio
PCL on loans ratio is calculated using PCL on loans as a percentage of average net loans and acceptances.
PCL on impaired loans ratio
PCL on impaired loans ratio is calculated as PCL on impaired loans as a percentage of average net loans and acceptances.
PCL on performing loans ratio
PCL on performing loans ratio is calculated as PCL on performing loans as a percentage of average net loans and acceptances.
RBC Homeline Plan products
This is comprised of residential mortgages and secured personal loans whereby the borrower pledges real estate as collateral.
Reinsurance contracts held
Contracts under which we transfer significant insurance risk to a reinsurer that compensates us for claims relating to underlying insurance contracts issued by us and are accounted for separately from the underlying insurance contracts to which they relate.
Repurchase agreements
These involve the sale of securities for cash and the simultaneous repurchase of the securities for value at a later date. These transactions normally do not constitute economic sales and therefore are treated as collateralized financing transactions.
Return on common equity (ROE)
Net income available to common shareholders, expressed as a percentage of average common equity. ROE is based on actual balances of average common equity before rounding. Adjusted ROE is calculated in the same manner, using adjusted net income available to common shareholders.

Table of Contents
Royal Bank of Canada
  Second Quarter 2026   45
 
Reverse repurchase agreements
These involve the purchase of securities for cash and the simultaneous sale of the securities for value at a later date. These transactions normally do not constitute economic sales and therefore are treated as collateralized financing transactions.
Risk-weighted assets (RWA)
Assets adjusted by a regulatory risk-weight factor to reflect the riskiness of
on-
and
off-balance
sheet exposures. Certain assets are not risk-weighted, but deducted from capital. The calculation is defined by OSFI’s CAR guideline. For more details, refer to the Capital management section.
Securities lending
Transactions in which the owner of securities agrees to lend it under the terms of a prearranged contract to a borrower for a fee. Collateral for the loan consists of either high quality securities or cash and collateral value must be at least equal to the market value of the loaned securities. Borrowers pay a negotiated fee for loans collateralized by securities, whereas for cash collateral lenders pay borrowers interest at a negotiated rate and reinvest the cash collateral to earn a return. An intermediary such as a bank often acts as agent lender for the owner of the security in return for a share of the revenue earned by the owner from lending securities. Most often, agent lenders indemnify the owner against the risk of the borrower’s failure to redeliver the loaned securities – counterparty credit risk if a borrower defaults and market risk if the value of the
non-cash
collateral declines. The agent lender does not indemnify against the investment risk of
re-investing
cash collateral which is borne by the owner.
Securities sold short
A transaction in which the seller sells securities and then borrows the securities in order to deliver them to the purchaser upon settlement. At a later date, the seller buys identical securities in the market to replace the borrowed securities.
Securitization
The process by which various financial assets are packaged into newly issued securities backed by these assets.
Standardized Approach (SA) for credit risk
Risk weights prescribed by OSFI are used to calculate RWA for the credit risk exposures. Credit assessments by OSFI-recognized external credit rating agencies of Standard & Poor’s Financial Services LLP; Moody’s Investor Service, Inc.; Fitch Ratings, Inc.; Kroll Bond Rating Agency, Inc. (KBRA‡); and DBRS Limited are used to risk-weight our Sovereign, Corporate and Bank exposures based on the CAR guideline issued by OSFI.
Structured entities
A structured entity is an entity in which voting or similar rights are not the dominant factor in deciding who controls the entity, such as when the activities that significantly affect the entity’s returns are directed by means of contractual arrangements. Structured entities often have restricted activities, narrow and well-defined objectives, insufficient equity to finance their activities, and financing in the form of multiple contractually-linked instruments.
Taxable equivalent basis (teb)
Income from certain specified tax advantaged sources (U.S. tax credit business as well as eligible Canadian taxable corporate dividends received on or before December 31, 2023) is increased to a level that would make it comparable to income from taxable sources. There is an offsetting adjustment in the tax provision, thereby generating the same
after-tax
net income.
Tier 1 capital and Tier 1 capital ratio
Tier 1 capital comprises predominantly of CET1 capital, with additional Tier 1 items such as preferred shares, limited recourse capital notes and
non-controlling
interests in subsidiaries Tier 1 instruments. The Tier 1 capital ratio is calculated in accordance with OSFI’s CAR guideline by dividing Tier 1 capital by risk-weighted assets.
Tier 2 capital
Tier 2 capital consists mainly of subordinated debentures that meet certain criteria, certain loan loss allowances and
non-controlling
interests in subsidiaries’ Tier 2 instruments.
Total loss absorbing capacity (TLAC)
The aggregate of Tier 1 capital, Tier 2 capital and external TLAC instruments which allow conversion in whole or in part into common shares under the Canada Deposit Insurance Corporation Act and meet all of the eligibility criteria under OSFI’s TLAC guideline.
TLAC ratio
The risk-based TLAC ratio is defined as TLAC divided by total risk-weighted assets. The TLAC ratio is calculated in accordance with OSFI’s TLAC guideline.
TLAC leverage ratio
The TLAC leverage ratio is defined as TLAC divided by the leverage ratio exposure. The TLAC leverage ratio is calculated in accordance with OSFI’s TLAC guideline.
Total capital and total capital ratio
Total capital is defined as the total of Tier 1 and Tier 2 capital. The total capital ratio is calculated in accordance with OSFI’s CAR guideline by dividing total capital by risk-weighted assets.
Tranche
A security class created whereby the risks and returns associated with a pool of assets are packaged into several classes of securities offering different risk and return profiles from those of the underlying asset pool. Tranches are typically rated by ratings agencies, and reflect both the credit quality of underlying collateral as well as the level of protection based on the tranches’ relative subordination.
Unattributed capital
Unattributed capital represents common equity in excess of common equity attributed to our business segments and is reported in the Corporate Support segment.
Value-at-Risk
(VaR)
A generally accepted risk-measurement concept that uses statistical models based on historical information to estimate within a given level of confidence the maximum loss in market value we would experience in our financial portfolio from an adverse
one-day
movement in market rates and prices.

Table of Contents
46   
Royal Bank of Canada
  Second Quarter 2026
 
Enhanced Disclosure Task Force recommendations index
We aim to present transparent, high-quality risk disclosures by providing disclosures in our 2025 Annual Report, Q2 2026 Report to Shareholders (RTS), Supplementary Financial Information package (SFI) and Pillar 3 Report, in accordance with recommendations from the FSB’s Enhanced Disclosure Task Force (EDTF). Information within the SFI and Pillar 3 Report is not and should not be considered incorporated by reference into our Q2 2026 Report to Shareholders.
The following index summarizes our disclosure by EDTF recommendation:
 
            
Location of disclosure
Type of Risk
 
Recommendation
 
Disclosure
  
RTS
page
 
Annual
Report page
  
SFI
page
General
  1  
Table of contents for EDTF risk disclosure
   46   136    1
  2  
Define risk terminology and measures
    
65-69, 133-135
  
  3  
Top and emerging risks
    
69-72
  
  4  
New regulatory ratios
   38-40  
110-116
  
Risk governance, risk management and business model
  5  
Risk management organization
    
65-69
  
  6  
Risk culture
    
65-69
  
  7  
Risk in the context of our business activities
     120   
  8  
Stress testing
       68, 83   
Capital adequacy and risk-weighted assets (RWA)
  9  
Minimum Basel III capital ratios and Domestic systemically important bank surcharge
   38  
110-116
  
  10  
Composition of capital and reconciliation of the accounting balance sheet to the regulatory balance sheet
        *
  11  
Flow statement of the movements in regulatory capital
        19
  12  
Capital strategic planning
    
110-116
  
  13  
RWA by business segments
        20
  14  
Analysis of capital requirement, and related measurement model information
    
72-76
   *
  15  
RWA credit risk and related risk measurements
        *
  16  
Movement of RWA by risk type
        20
    17  
Basel back-testing
       67,
72-74
   31
Liquidity
  18  
Quantitative and qualitative analysis of our liquidity reserve
   30  
90-91, 96-97
  
Funding
  19  
Encumbered and unencumbered assets by balance sheet category, and contractual obligations for rating downgrades
   31, 34   92, 95   
  20  
Maturity analysis of consolidated total assets, liabilities and
off-balance
sheet commitments analyzed by remaining contractual maturity at the balance sheet date
    
99-100
  
  21  
Sources of funding and funding strategy
   31-33  
92-94
  
Market risk
  22  
Relationship between the market risk measures for trading and
non-trading
portfolios and the balance sheet
   28-29  
87-88
  
  23  
Decomposition of market risk factors
   26-27  
83-88
  
  24  
Market risk validation and back-testing
     83   
  25  
Primary risk management techniques beyond reported risk measures and parameters
      
83-86
  
Credit risk
  26  
Bank’s credit risk profile
   22-26  
72-82, 180-187
  
21-31,*
   
Quantitative summary of aggregate credit risk exposures that reconciles to the balance sheet
   62-67  
127-132
   *
  27  
Policies for identifying impaired loans
    
74-76, 122, 153-155
  
  28  
Reconciliation of the opening and closing balances of impaired loans and impairment allowances during the year
        23, 28
  29  
Quantification of gross notional exposure for
over-the-counter
derivatives or exchange-traded derivatives
     77    32
  30  
Credit risk mitigation, including collateral held for all sources of credit risk
      
75-76
   *
Other
  31  
Other risk types
    
102-110
  
  32  
Publicly known risk events
      
107-108, 230-231
  
 
*   These disclosure requirements are satisfied or partially satisfied by disclosures provided in our Pillar 3 Report for the quarter ended April 30, 2026 and for the year ended October 31, 2025.

Table of Contents
Royal Bank of Canada
  Second Quarter 2026   47
 
Interim Condensed Consolidated Financial Statements
(unaudited)
Interim Condensed Consolidated Balance Sheets
(unaudited)
 
      As at   
(Millions of Canadian dollars)
  
April 30
2026
    
October 31
2025
 
Assets
     
Cash and due from banks
  
$
59,347
 
   $ 37,024  
Interest-bearing deposits with banks
  
 
34,146
 
     50,364  
Securities
     
Trading
  
 
236,601
 
     219,067  
Investment, net of applicable allowance
(Note 4)
  
 
375,763
 
     342,721  
    
 
612,364
 
     561,788  
Assets purchased under reverse repurchase agreements and securities borrowed
  
 
316,375
 
     309,683  
Loans
(Note 5)
     
Retail
  
 
663,356
 
     652,344  
Wholesale
  
 
422,114
 
     397,171  
  
 
1,085,470
 
     1,049,515  
Allowance for loan losses
(Note 5)
  
 
(7,521
)
     (7,093
    
 
1,077,949
 
     1,042,422  
Other
     
Derivatives
  
 
150,745
 
     177,206  
Premises and equipment
  
 
6,778
 
     6,819  
Goodwill
  
 
19,237
 
     19,405  
Other intangibles
  
 
7,298
 
     7,402  
Other assets
  
 
111,841
 
     112,893  
    
 
295,899
 
     323,725  
Total assets
  
$
2,396,080
 
   $ 2,325,006  
Liabilities and equity
     
Deposits
(Note 6)
     
Personal
  
$
532,736
 
   $ 529,740  
Business and government
  
 
984,990
 
     946,314  
Bank
  
 
63,820
 
     39,562  
    
 
1,581,546
 
     1,515,616  
Other
     
Obligations related to securities sold short
  
 
57,472
 
     49,891  
Obligations related to assets sold under repurchase agreements and securities loaned
  
 
312,954
 
     289,516  
Derivatives
  
 
156,627
 
     183,953  
Insurance contract liabilities
  
 
24,359
 
     24,327  
Other liabilities
  
 
108,851
 
     108,591  
    
 
660,263
 
     656,278  
Subordinated debentures
(Note 10)
  
 
13,498
 
     13,961  
Total liabilities
  
 
2,255,307
 
     2,185,855  
Equity attributable to shareholders
     
Preferred shares and other equity instruments
(Note 10)
  
 
11,138
 
     11,675  
Common shares
(Note 10)
  
 
20,639
 
     20,753  
Retained earnings
  
 
101,243
 
     96,938  
Other components of equity
  
 
7,697
 
     9,726  
  
 
140,717
 
     139,092  
Non-controlling interests
  
 
56
 
     59  
Total equity
  
 
140,773
 
     139,151  
Total liabilities and equity
  
$
2,396,080
 
   $ 2,325,006  
The accompanying notes are an integral part of these Interim Condensed Consolidated Financial Statements.

Table of Contents
48   
Royal Bank of Canada
  Second Quarter 2026
 
Interim Condensed Consolidated Statements of Income
(unaudited)


For the three months ended


For the six months ended
(Millions of Canadian dollars, except per share amounts)
 
April 30
2026
 
April 30
2025


April 30
2026
 
April 30
2025
Interest and dividend income
(Note 3)
                   
Loans
   
$
13,620
    $ 13,484        
$
27,530
    $ 27,814
Securities
   
 
5,273
      4,845        
 
10,647
      9,677
Assets purchased under reverse repurchase agreements and securities borrowed
   
 
5,205
      5,312        
 
11,038
      11,236
Deposits and other
   
 
924
      1,329              
 
1,911
      2,698
     
 
25,022
      24,970              
 
51,126
      51,425
Interest expense
(Note 3)
                   
Deposits and other
   
 
10,195
      10,716        
 
20,806
      22,532
Other liabilities
   
 
6,208
      6,042        
 
12,967
      12,568
Subordinated debentures
   
 
113
   
 
  156        


262
      321
     
 
16,516
      16,914              
 
34,035
      35,421
Net interest income
   
 
8,506
      8,056              
 
17,091
      16,004
Non-interest
income
                   
Insurance service result
(Note 7)
   
 
217
      224        
 
457
      510
Insurance investment result
(Note 7)
   
 
92
      78        
 
151
      160
Trading revenue
   
 
609
      641        
 
1,789
      1,836
Investment management and custodial fees
   
 
2,915
      2,544        
 
5,839
      5,211
Mutual fund revenue
   
 
1,403
      1,211        
 
2,817
      2,447
Securities brokerage commissions
   
 
550
      486        
 
1,058
      957
Service charges
   
 
572
      607        
 
1,165
      1,219
Underwriting and other advisory fees
   
 
878
      615        
 
1,620
      1,289
Foreign exchange revenue, other than trading
   
 
345
      338        
 
725
      656
Card service revenue
   
 
305
      328        
 
640
      645
Credit fees
   
 
450
      370        
 
873
      805
Net gains on investment securities
   
 
102
      45        
 
178
      100
Income (loss) from joint ventures and associates
   
 
24
      16        
 
61
      35
Other
   
 
485
      113              
 
949
      537
     
 
8,947
      7,616              
 
18,322
      16,407
Total revenue
   
 
17,453
      15,672              
 
35,413
      32,411
Provision for credit losses
(Notes 4 and 5)
   
 
912
      1,424              
 
2,002
      2,474
Non-interest
expense
                   
Human resources
(Note 8)
   
 
6,011
      5,478        
 
12,300
      11,465
Equipment
   
 
733
      704        
 
1,461
      1,385
Occupancy
   
 
447
      428        
 
867
      857
Communications
   
 
391
      378        
 
746
      705
Professional fees
   
 
513
      538        
 
984
      1,040
Amortization of other intangibles
   
 
387
      457        
 
773
      892
Other
   
 
955
      747              
 
1,769
      1,642
     
 
9,437
      8,730              
 
18,900
      17,986
Income before income taxes
   
 
7,104
      5,518        
 
14,511
      11,951
Income taxes
(Note 9)
   
 
1,595
      1,128              
 
3,217
      2,430
Net income
   
$
 
5,509
    $
 
4,390              
$
11,294
    $ 9,521
Net income attributable to:
                   
Shareholders
   
$
5,507
    $ 4,386        
$
11,291
    $ 9,515
Non-controlling
interests
   
 
2
      4              
 
3
      6
     
$
5,509
    $ 4,390              
$
11,294
    $ 9,521
Basic earnings per share
(in dollars)
(Note 11)
   
$
3.86
    $ 3.03        
$
7.89
    $ 6.57
Diluted earnings per share
(in dollars)
(Note 11)
   
 
3.85
      3.02        
 
7.87
      6.56
Dividends per common share
(in dollars)
   
 
1.64
      1.48              
 
3.28
      2.96
The accompanying notes are an integral part of these Interim Condensed Consolidated Financial Statements.

Table of Contents
Royal Bank of Canada
  Second Quarter 2026   49
 
Interim Condensed Consolidated Statements of Comprehensive Income
(unaudited)


For the three months ended


For the six months ended
 
(Millions of Canadian dollars)
 
April 30
2026
 
 
April 30
2025


April 30
2026
 
 
April 30
2025
 
Net income
 
$
5,509
 
  $ 4,390            
$
11,294
 
  $ 9,521  
Other comprehensive income (loss), net of taxes
         
Items that will be reclassified subsequently to income:
         
Net change in unrealized gains (losses) on debt securities and loans at fair value through
other comprehensive income
         
Net unrealized gains (losses) on debt securities and loans at fair value through other
comprehensive income
 
 
(175
)
    (214    
 
200
 
    (30
Provision for credit losses recognized in income
 
 
1


2
 
    (2
Reclassification of net losses (gains) on debt securities and loans at fair value through other
comprehensive income to income
 
 
(75
)
    (30          
 
(142
)
    (91
   
 
(249
)
    (244          
 
60
 
    (123
Foreign currency translation adjustments
         
Unrealized foreign currency translation gains (losses)
 
 
(292
)
    (4,261    
 
(2,594
)
    (627
Net foreign currency translation gains (losses) from hedging activities
 
 
127
 
    1,978      
 
1,174
 
    307  
Reclassification of losses (gains) on foreign currency translation to income


    (13          
 
(7
)
    (13
   
 
(165
)
    (2,296          
 
(1,427
)
    (333
Net change in cash flow hedges
         
Net gains (losses) on derivatives designated as cash flow hedges
 
 
(394
)
    (98    
 
(481
)
    570  
Reclassification of losses (gains) on derivatives designated as cash flow hedges to income
 
 
(64
)
    (177          
 
(183
)
    (336
   
 
(458
)
    (275          
 
(664
)
    234  
Items that will not be reclassified subsequently to income:
         
Remeasurement gains (losses) on employee benefit plans
(Note 8)
 
 
86
 
    11      
 
252
 
    49  
Net gains (losses) from fair value changes due to credit risk on financial liabilities designated at fair
value through profit or loss
 
 
346
 
    471      
 
143
    (37
Net gains (losses) on equity securities designated at fair value through other comprehensive income
 
 
18
 
    24            
 
42
 
    38  
   
 
450
 
    506            
 
437
    50  
Total other comprehensive income (loss), net of taxes
 
 
(422
)
    (2,309 )


(1,594
)
 
 
    (172
Total comprehensive income (loss)
 
$
5,087
 
  $ 2,081            
$
9,700
 
  $ 9,349  
Total comprehensive income attributable to:
         
Shareholders
 
$
5,085
 
  $ 2,082      
$
9,699
 
  $ 9,343  
Non-controlling interests
 
 
2
 
    (1          
 
1
    6  
   
$
5,087
 
  $ 2,081            
$
9,700
 
  $ 9,349  
The income tax effect on the Interim Condensed Consolidated Statements of Comprehensive Income is shown in the table below.


For the three months ended


For the six months ended
 
(Millions of Canadian dollars)
 
April 30
2026
 
 
April 30
2025


April 30
2026
 
 
April 30
2025
 
Income taxes on other comprehensive income
         
Net unrealized gains (losses) on debt securities and loans at fair value through other comprehensive
income
 
$
(11
)
  $ (28    
$
36
 
  $ 93  
Provision for credit losses recognized in income


Reclassification of net losses (gains) on debt securities and loans at fair value through other
comprehensive income to income
 
 
(11
)
    (10    
 
(26
)
    (28
Unrealized foreign currency translation gains (losses)
 
 
(2
)
    (26    
 
(22
)
    (7
Net foreign currency translation gains (losses) from hedging activities
 
 
49
 
    733      
 
436
 
    113  
Reclassification of losses (gains) on foreign currency translation to income


Net gains (losses) on derivatives designated as cash flow hedges
 
 
(145
)
    (48    
 
(173
)
    216  
Reclassification of losses (gains) on derivatives designated as cash flow hedges to income
 
 
(25
)
    (68    
 
(70
)
    (128
Remeasurement gains (losses) on employee benefit plans
 
 
33
 
    5      
 
97
 
    19  
Net gains (losses) from fair value changes due to credit risk on financial liabilities designated at fair
value through profit or loss
 
 
133
 
    180      
 
59
    (14
Net gains (losses) on equity securities designated at fair value through other comprehensive income
 
 
7
 
    10            
 
17
 
    14  
Total income tax expenses (recoveries)
 
$
28
 
  $ 748            
$
354
 
  $ 278  
The accompanying notes are an integral part of these Interim Condensed Consolidated Financial Statements.

Table of Contents
50   
Royal Bank of Canada
  Second Quarter 2026
 
Interim Condensed Consolidated Statements of Changes in Equity
(unaudited)
 
    
For the three months ended April 30, 2026
 
                                 
Other components of equity
                   
(Millions of Canadian dollars)  
Preferred
shares and
other equity
instruments
   
Common
shares
   
Treasury –
preferred
shares and
other equity
instruments
   
Treasury –
common
shares
   
Retained
earnings
   
FVOCI
securities
and loans
   
Foreign
currency
translation
   
Cash flow
hedges
   
Total other
components
of equity
   
Equity
attributable to
shareholders
   
Non-controlling
interests
   
Total
equity
 
Balance at beginning of
period
 
$
11,154
 
 
$
20,844
 
 
$
(23
)
 
 
$
(8
)
 
 
$
99,265
 
 
$
     44
 
 
$
6,353
 
 
$
2,172
 
 
$
8,569
 
 
$
139,801
 
 
$
57
 
 
$
139,858
 
Changes in equity
                       
Issues of share capital and
other equity instruments


26


5


31


31
 
Common shares purchased
for cancellation


(110
)


(1,563
)


(1,673
)


(1,673
)
Redemption of preferred
shares and other equity
instruments


Sales of treasury shares
and
 
other equity
instruments


1,268


  1,943


3,211


3,211
 
Purchases of treasury
shares
 
and other equity
instruments


(1,261
)


(2,056
)


(3,317
)


(3,317
)
Share-based compensation
awards


3


3


3
 
Dividends on common
shares


(2,279
)


(2,279
)


(2,279
)
Dividends on preferred
shares
 
and distributions
on
 
other equity
instruments


(135
)


(135
)
 
 
(3
)
 
 
(138
)
Other


(10
)


(10
)


(10
)
Net income


5,507


5,507


2


5,509
 
Total other comprehensive
income (loss), net of
taxes


450


(249
)
 
 
(165
)
 
 
(458
)
 
 
(872
)
 
 
(422
)


(422
)
Balance at end of period
 
$
11,154
 
 
$
20,760
 
 
$
(16
)
 
$
(121
)
 
$
101,243
 
 
$
(205
)
 
$
   
6,188
 
 
$
  
1,714
 
 
$
   
7,697
 
 
$
   
140,717
 
 
$
    
56
 
 
$
140,773
 
                       
     For the three months ended April 30, 2025  
                                  Other components of equity                    
(Millions of Canadian dollars)   Preferred
shares and
other equity
instruments
    Common
shares
    Treasury –
preferred
shares and
other equity
instruments
   
Treasury –
common
shares
    Retained
earnings
   
FVOCI
securities
and loans
    Foreign
currency
translation
    Cash flow
hedges
   
Total other
components
of equity
    Equity
attributable to
shareholders
   
Non-controlling
interests
    Total
equity
 
Balance at beginning of
period
  $ 10,416     $ 21,006     $ (12 )   $ (83 )   $ 90,754     $ (776 )   $ 9,086     $ 2,776     $ 11,086     $ 133,167     $ 96     $ 133,263  
Changes in equity
                       
Issues of share capital and
other equity instruments
          14                                                 14             14  
Common shares purchased
for cancellation
          (45 )                 (443 )                             (488 )           (488 )
Redemption of preferred
shares and other equity
instruments
                                                                       
Sales of treasury shares
and
 
other equity instruments
                721       1,313                                     2,034             2,034  
Purchases of treasury
shares
 
and other equity
instruments
                (762 )     (1,385 )                                   (2,147 )           (2,147 )
Share-based compensation
awards
                            6                               6             6  
Dividends on common
shares
                            (2,087 )                             (2,087 )           (2,087 )
Dividends on preferred shares
 
and distributions on
 
other equity
instruments
                            (112 )                             (112 )     (12 )     (124 )
Other
                            (22 )                             (22 )           (22 )
Net income
                            4,386                               4,386       4       4,390  
Total other comprehensive
income (loss), net of
taxes
                            506       (244 )
 
    (2,291 )
 
    (275 )
 
    (2,810 )
 
    (2,304 )
 
    (5 )
 
    (2,309 )
Balance at end of period
  $ 10,416     $ 20,975     $ (53 )
 
  $ (155 )
 
  $ 92,988     $ (1,020 )
 
  $ 6,795     $ 2,501     $ 8,276     $ 132,447     $ 83     $ 132,530  

Table of Contents
Royal Bank of Canada
  Second Quarter 2026   51
 
    
For the six months ended April 30, 2026
 
                                 
Other components of equity
                   
(Millions of Canadian dollars)  
Preferred
shares and
other equity
instruments
   
Common
shares
   
Treasury –
preferred
shares and
other equity
instruments
   
Treasury –
common
shares
   
Retained
earnings
   
FVOCI
securities
and loans
   
Foreign
currency
translation
   
Cash
flow
hedges
   
Total other
components
of equity
   
Equity
attributable to
shareholders
   
Non-controlling
interests
   
Total
equity
 
Balance at beginning of
period
 
$
  11,643
 
 
$
20,863
 
 
$
32
 
 
$
(110
)
 
$
96,938
 
 
$
(265
)
 
$
7,613
 
 
$
2,378
 
 
$
9,726
 
 
$
139,092
 
 
$
59
 
 
$
139,151
 
Changes in equity
                       
Issues of share capital and
other equity instruments
 
 
1,361


70


(5
)


1,426


1,426
 
Common shares purchased for cancellation


(173
)


(2,460
)


(2,633
)


(2,633
)
Redemption of preferred
shares and other equity
instruments
 
 
(1,850


(1,850


(1,850
Sales of treasury shares
and
 
other equity
instruments


2,080


  3,947


6,027


6,027
 
Purchases of treasury
shares
 
and other equity
instruments


(2,128
)
 
 
(3,958
)


(6,086
)


(6,086
)
Share-based

compensation
 
awards


(69
)


(69
)


(69
)
Dividends on common
shares


(4,571
)


(4,571
)


(4,571
)
Dividends on preferred
shares and distributions
on
 
other equity
instruments


(276
)


(276
)
 
 
(4
)
 
 
(280
)
Other


(42
)


(42
)


(42
)
Net income


11,291


11,291


3


11,294
 
Total other comprehensive income (loss), net of taxes


437


    60


(1,425
)
 
 
(664
)


(2,029
)
 
 
(1,592
)
 
 
(2
)
 
 
(1,594
)
Balance at end of period
 
$
11,154
 
 
$
20,760
 
 
$
(16
)
 
$
(121
)
 
$
101,243
 
 
$
(205
)
 
$
    6,188
 
 
$
1,714
 
 
$
    7,697
 
 
$
   140,717
 
 
$
56
 
 
$
   140,773
 
                       
     For the six months ended April 30, 2025  
                                  Other components of equity                    
(Millions of Canadian dollars)   Preferred
shares and
other equity
instruments
    Common
shares
    Treasury –
preferred
shares and
other equity
instruments
   
Treasury –
common
shares
    Retained
earnings
   
FVOCI
securities
and loans
   
Foreign
currency
translation
 
 
Cash

flow

hedges
 
 
Total other
components
of equity
    Equity
attributable to
shareholders
   
Non-controlling
interests
    Total
equity
 
Balance at beginning of
period
  $ 9,020     $ 21,013     $ 11     $ (61   $ 88,608     $ (897   $ 7,128     $ 2,267     $ 8,498     $ 127,089     $ 103     $ 127,192  
Changes in equity
                       
Issues of share capital and
other equity instruments
    1,396       36                   (10                             1,422             1,422  
Common shares
purchased for
cancellation
          (74                 (752                             (826           (826
Redemption of preferred
shares and other equity
instruments
                                                                       
Sales of treasury shares
and
 
other equity
instruments
                1,231       2,907                                     4,138             4,138  
Purchases of treasury
shares
 
and other equity
instruments
                (1,295     (3,001                                   (4,296           (4,296
Share-based
compensation
 
awards
                            19                               19             19  
Dividends on common shares
                            (4,179                             (4,179           (4,179
Dividends on preferred shares and distributions on other equity instruments
                            (230                             (230     (26     (256
Other
                            (33                             (33           (33
Net income
                            9,515                               9,515       6       9,521  
Total other comprehensive
income (loss), net of taxes
                            50       (123     (333     234       (222     (172           (172
Balance at end of period
  $ 10,416     $ 20,975     $ (53 )
 
 
  $ (155   $ 92,988     $ (1,020   $ 6,795     $ 2,501     $ 8,276     $ 132,447     $ 83     $ 132,530  
The accompanying notes are an integral part of these Interim Condensed Consolidated Financial Statements.

Table of Contents
52   
Royal Bank of Canada
  Second Quarter 2026

Interim Condensed Consolidated State
m
ents of Cash
Flows
(unaudited)
 
      For the three months ended             For the six months ended  
(Millions of Canadian dollars)
  
April 30
2026
    
April 30
2025
           
April 30
2026
    
April 30
2025
 
Cash flows from operating activities
             
Net income
  
$
5,509
 
   $ 4,390       
$
11,294
 
   $ 9,521  
Adjustments for non-cash items and others
             
Provision for credit losses
  
 
912
 
     1,424       
 
2,002
 
     2,474  
Depreciation
  
 
332
 
     321       
 
654
 
     644  
Deferred income taxes
  
 
(211
)
 
     (260     
 
(3
)
     (232
Amortization and impairment of other intangibles
  
 
390
 
     459       
 
778
 
     910  
(Income) loss from joint ventures and associates
  
 
(24
)
     (16     
 
(61
)
     (35
Losses (gains) on investment securities
  
 
(102
)
     (45     
 
(183
)
     (100
Adjustments for net changes in operating assets and liabilities
             
Insurance contract liabilities
  
 
(140
     (70     
 
32
 
     1,176  
Net change in accrued interest receivable and payable
  
 
1,125
 
     323       
 
222
 
     (656
Current income taxes
  
 
292
     736       
 
3,041
 
     146  
Derivative assets
  
 
20,085
 
     (34,525     
 
26,461
 
     (37,599
Derivative liabilities
  
 
(14,104
     32,754       
 
(27,326
)
     30,581  
Trading securities
  
 
(6,761
     279       
 
(17,534
)
     (5,837
Loans
  
 
(23,188
     (2,452     
 
(35,955
)
     (28,235
Assets purchased under reverse repurchase agreements and securities borrowed
  
 
(36,575
     (21,476     
 
(6,692
)
     48,876  
Obligations related to assets sold under repurchase agreements and securities loaned
  
 
24,938
 
     6,734       
 
23,438
 
     (23,995
Obligations related to securities sold short
  
 
9,663
 
     1,363       
 
7,581
 
     11,537  
Deposits
  
 
39,330
 
     4,846       
 
65,930
 
     37,255  
Brokers and dealers receivable and payable
  
 
1,608
 
     717       
 
2,917
 
     (89
Other
  
 
(1,802
)
     14,349             
 
2,579
 
     (5,337
Net cash from (used in) operating activities
  
 
21,277
 
     9,851             
 
59,175
 
     41,005  
Cash flows from investing activities
             
Change in interest-bearing deposits with banks
  
 
18,927
 
     (18,046     
 
16,218
 
     50  
Proceeds from sales and maturities of investment securities
  
 
87,326
 
     53,100       
 
152,105
 
     110,118  
Purchases of investment securities
  
 
(105,404
)
     (66,482     
 
(193,609
)
     (157,025
Net acquisitions of premises and equipment and other intangibles
  
 
(459
)
     (483     
 
(1,056
)
     (1,164
Cash used in acquisitions, net of cash acquired
  
 
(11
                 
 
(11
)
 
      
Net cash from (used in) investing activities
  
 
379
     (31,911 )           
 
(26,353
)
     (48,021
Cash flows from financing activities
             
Issuance of subordinated debentures
  
 
1,750


1,750
 
     1,500  
Repayment of subordinated debentures


(2,035
)
     (1,500
Issue of common shares, net of issuance costs
  
 
25
 
     13       
 
66
 
     34  
Common shares purchased for cancellation
  
 
(1,673
)
     (488     
 
(2,633
)
     (826
Issue of preferred shares and other equity instruments, net of issuance costs


1,351
 
     1,386  
Redemption of preferred shares and other equity instruments


(1,850
)
      
Sales of treasury shares and other equity instruments
  
 
3,211
 
     2,034       
 
5,946
 
     4,138  
Purchases of treasury shares and other equity instruments
  
 
(3,317
)
     (2,147     
 
(6,086
)
     (4,296
Dividends paid on shares and distributions paid on other equity instruments
  
 
(2,433
)
     (2,210     
 
(4,730
)
     (4,311
Dividends/distributions paid to non-controlling interests
  
 
(1
)
     (14     
 
(14
)
     (14
Change in short-term borrowings of subsidiaries
  
 
(5,319
)
     2,068       
 
(766
)
     2,068  
Repayment of lease liabilities
  
 
(165
)
     (171           
 
(202
)
     (325
Net cash from (used in) financing activities
  
 
(7,922
)
     (915 )           
 
(9,203
)
     (2,146
Effect of exchange rate changes on cash and due from banks
  
 
(613
)
     396             
 
(1,296
)
     1,060  
Net change in cash and due from banks
  
 
13,121
     (22,579     
 
22,323
     (8,102
Cash and due from banks at beginning of period
(1)
  
 
46,226
 
     71,200             
 
37,024
 
     56,723  
Cash and due from banks at end of period
(1)
  
$
59,347
 
   $ 48,621             
$
59,347
 
   $ 48,621  
Cash flows from operating activities include:
             
Amount of interest paid
  
$
  15,373
 
   $   16,367       
$
  32,870
 
   $   35,844  
Amount of interest received
  
 
24,680
 
     24,269       
 
49,639
 
     50,316  
Amount of dividends received
  
 
965
 
     987       
 
1,948
 
     2,050  
Amount of income taxes paid (refunded)
  
 
1,517
     1,468             
 
897
     2,710  
 
(1)   We are required to maintain balances due to regulatory requirements or contractual restrictions from central banks, other regulatory authorities and other counterparties. The total balances were $3 billion as at April 30, 2026 (January 31, 2026 – $3 billion; October 31, 2025 – $3 billion; April 30, 2025 – $2 billion; January 31, 2025 – $2 billion; October 31, 2024 – $2 billion).
The accompanying notes are an integral part of these Interim Condensed Consolidated Financial Statements.

Table of Contents
Royal Bank of Canada
  Second Quarter 2026   53
 
Notes to the Interim Condensed Consolidated Financial Statements
(unaudited)
 
Note 1
 
General information
Our unaudited Interim Condensed Consolidated Financial Statements (Condensed Financial Statements) are presented in compliance with International Accounting Standard 34
Interim Financial Reporting
. The Condensed Financial Statements do not include all the information and disclosures required in the annual financial statements and should be read in conjunction with our audited 2025 Annual Consolidated Financial Statements and the accompanying notes included on pages 144 to 241 in our 2025 Annual Report. Unless otherwise stated, monetary amounts are stated in Canadian dollars. Tabular information is stated in millions of dollars, except as noted. On May 27, 2026, the Board of Directors authorized the Condensed Financial Statements for issue.
 
Note 2
 
Summary of material accounting policies, estimates and judgments
The Condensed Financial Statements have been prepared using the same accounting policies and methods used in the preparation of our audited 2025 Annual Consolidated Financial Statements. Our material accounting policies and future changes in accounting policies and disclosures that are not yet effective for us are described in Note 2 of our audited 2025 Annual Consolidated Financial Statements.
 
Note 3
 
Fair value of financial instruments
Carrying value and fair value of financial instruments
The following tables provide a comparison of the carrying values and fair values for financial instruments classified or designated as fair value through profit or loss (FVTPL) and fair value through other comprehensive income (FVOCI), and financial instruments measured at amortized cost. Embedded derivatives are presented on a combined basis with the host contracts in the Interim Condensed Consolidated Balance Sheets. Refer to Note 2 and Note 3 of our audited 2025 Annual Consolidated Financial Statements for a description of the valuation techniques and inputs used
in
the fair value measurement of our financial instruments. There have been no significant changes to our determination of fair value during the quarter.
 
    
As at April 30, 2026
 
   
Carrying value and fair value
       
Carrying value
       
Fair value
             
(Millions of Canadian dollars)  
Financial
instruments
classified as
FVTPL
   
Financial
instruments
designated as
FVTPL
   
Financial
instruments
classified as
FVOCI
   
Financial
instruments
designated as
FVOCI
        
Financial
instruments
measured at
amortized cost
        
Financial
instruments
measured at
amortized cost
   
Total carrying
amount
   
Total fair value
 
Financial assets
                   
Interest-bearing deposits with banks
 
$
 
 
$
27,425
 
 
$
 
 
$
 
     
$
6,721
 
     
$
6,721
 
 
$
34,146
 
 
$
34,146
 
Securities
                   
Trading
 
 
230,723


5,878


236,601


236,601
 
Investment, net of applicable allowance


274,401


1,526


99,836


97,293


375,763


373,220


230,723


5,878


274,401


1,526


99,836


97,293


612,364


609,821
 
Assets purchased under reverse repurchase agreements and securities borrowed
 
 
249,359


67,016


67,016


316,375


316,375
 
Loans, net of applicable allowance
                   
Retail
 
 
1,153


433


657,712


658,863


659,298


660,449
 
Wholesale
 
 
10,922


696


407,033


406,439


418,651


418,057


12,075


1,129


1,064,745


1,065,302


1,077,949


1,078,506
 
Other
                   
Derivatives
 
 
150,745


150,745


150,745
 
Other assets
(1)
 
 
21,588


57,470


57,470


79,058


79,058
 
Financial liabilities
                   
Deposits
                   
Personal
 
$
1,100
 
 
$
40,512
 
       
$
491,124
 
   
$
491,927
 
 
$
532,736
 
 
$
533,539
 
Business and government
(2)
 
 
504


169,751


814,735


815,727


984,990


985,982
 
Bank
(3)


4,174


59,646


59,631


63,820


63,805


1,604


214,437


1,365,505


1,367,285


1,581,546


1,583,326
 
Other
                 
 
Obligations related to securities sold short
 
 
57,472


57,472


57,472
 
Obligations related to assets sold under repurchase agreements and securities loaned


270,356


42,598


42,598


312,954


312,954
 
Derivatives
 
 
156,627


156,627


156,627
 
Other liabilities
(4)


19,142


61,499


61,495


80,641


80,637
 
Subordinated debentures


213


13,285


13,378


13,498


13,591


Table of Contents
54   
Royal Bank of Canada
  Second Quarter
2026
 
     As at October 31, 2025  
    Carrying value and fair value         Carrying value         Fair value              
(Millions of Canadian dollars)   Financial
instruments
classified as
FVTPL
    Financial
instruments
designated as
FVTPL
    Financial
instruments
classified as
FVOCI
    Financial
instruments
designated as
FVOCI
         Financial
instruments
measured at
amortized cost
         Financial
instruments
measured at
amortized cost
    Total carrying
amount
    Total fair value  
Financial assets
                   
Interest-bearing deposits with banks
  $     $ 40,455     $     $         $ 9,909         $ 9,909     $ 50,364     $ 50,364  
Securities
                   
Trading
    212,878       6,189                                   219,067       219,067  
Investment, net of applicable allowance
                240,299       1,496           100,926           98,728       342,721       340,523  
      212,878       6,189       240,299       1,496           100,926           98,728       561,788       559,590  
Assets purchased under reverse repurchase agreements and securities borrowed
    226,213                             83,470           83,470       309,683       309,683  
Loans, net of applicable allowance
                   
Retail
    1,128             442               646,832         648,413       648,402       649,983  
Wholesale
    9,724             690                 383,606           382,551       394,020       392,965  
      10,852             1,132                 1,030,438           1,030,964       1,042,422       1,042,948  
Other
                   
Derivatives
    177,206                                         177,206       177,206  
Other assets
(1)
    14,382                             58,487           58,487       72,869       72,869  
Financial liabilities
                   
Deposits
                   
Personal
  $ 942     $ 41,302           $ 487,496       $ 488,644     $ 529,740     $ 530,888  
Business and government
(2)
    313       168,690             777,311         779,130       946,314       948,133  
Bank
(3)
          2,908                           36,654           36,657       39,562       39,565  
      1,255       212,900                           1,301,461           1,304,431       1,515,616       1,518,586  
Other
                   
Obligations related to securities sold short
    49,891                                 49,891       49,891  
Obligations related to assets sold under repurchase agreements and securities loaned
          242,916             46,600         46,600       289,516       289,516  
Derivatives
    183,953                                 183,953       183,953  
Other liabilities
(4)
          21,688             58,287         58,293       79,975       79,981  
Subordinated debentures
          232                           13,729           13,887       13,961       14,119  
 
(1)
Includes financial instruments recognized in Other assets.
(2)
Business and government deposits include deposits from regulated deposit-taking institutions other than banks.
(3)
Bank deposits refer to deposits from regulated banks and central banks.
(4)
Includes financial instruments recognized in Other liabilities.

Table of Contents
Royal Bank of Canada
  Second Quarter 2026   55
 
Fair value of assets and liabilities measured at fair value on a recurring basis and classified using the fair value hierarchy


  As at


April 30, 2026


October 31, 2025


Fair value measurements using
 
 
Netting
adjustments


Fair value measurements using
 
 
Netting
adjustments


(Millions of Canadian dollars)
 
Level 1
 
 
Level 2
 
 
Level 3
 
 
Fair value


Level 1
 
 
Level 2
 
 
Level 3
 
 
Fair value
 
Financial assets
                     
Interest-bearing deposits with banks
 
$
 
 
$
27,425
 
 
$
 
 
$


$
27,425
 
      $     $ 40,455     $     $       $ 40,455  
Securities
                     
Trading
                     
Debt issued or guaranteed by:
                     
Canadian government
                     
Federal
 
 
19,004


2,300


21,304
 
      17,707       2,864               20,571  
Provincial and municipal


24,664


24,664
 
            16,891               16,891  
U.S. federal, state, municipal and agencies
(1)
 
 
7,437


39,750


47,187
 
      435       40,322               40,757  
Other OECD government
(2)
 
 
12,932


8,736


21,668
 
      7,152       7,265               14,417  
Mortgage-backed securities


78


78
 
            74               74  
Asset-backed securities


1,646


1,646
 
            1,295               1,295  
Corporate debt and other debt


30,533


17


30,550
 
            25,957       32         25,989  
Equities
 
 
82,603


3,892


3,009


89,504
 
        93,397       2,813       2,863               99,073  
   
 
121,976


111,599


3,026


236,601
 
        118,691       97,481       2,895               219,067  
Investment
                     
Debt issued or guaranteed by:
                     
Canadian government
                     
Federal
 
 
36,058


13,029


49,087
 
      30,110       9,756               39,866  
Provincial and municipal


12,504


12,504
 
            11,318               11,318  
U.S. federal, state, municipal and agencies
(1)
 
 
191


146,228


146,419
 
      196       130,495               130,691  
Other OECD government
(2)
 
 
8,044


15,685


23,729
 
      1,600       10,333               11,933  
Mortgage-backed securities


2,623


29


2,652
 
            2,645       29         2,674  
Asset-backed securities


9,579


9,579
 
            10,139               10,139  
Corporate debt and other debt


30,308


123


30,431
 
            33,544       134         33,678  
Equities
 
 
599


338


589


1,526
 
        547       367       582               1,496  
   
 
44,892


230,294


741


275,927
 
        32,453       208,597       745               241,795  
Assets purchased under reverse repurchase agreements and securities borrowed


249,359


249,359
 
            226,213               226,213  
Loans


11,369


1,835


13,204
 
            10,710       1,274         11,984  
Other
                     
Derivatives
                     
Interest rate contracts


26,855


245


27,100
 
            25,871       293         26,164  
Foreign exchange contracts


70,182


36


70,218
 
            100,604       102         100,706  
Credit derivatives


391


1


392
 
            350       2         352  
Other contracts
 
 
9,020


46,224


151


55,395
 
      11,478       41,543       110         53,131  
Valuation adjustments


(948
)


(74
)


(1,022
)
              (1,035 )
 
 
    (45 )
 
 
            (1,080
Total gross derivatives
 
 
9,020


142,704


359


152,083
 
      11,478       167,333       462         179,273  
Netting adjustments
                         
 
(1,338)
 
 
(1,338
)
 
 
                                (2,067)       (2,067
Total derivatives
         
 
150,745
 
              177,206  
Other assets
 
 
6,539


15,047


2


21,588
 
        6,108       8,270       4               14,382  
   
$
182,427
 
 
$
787,797
 
 
$
5,963
 
 
$
(1,338)
 
$
974,849
 
      $ 168,730     $ 759,059     $ 5,380     $ (2,067)     $ 931,102  
Financial liabilities
                     
Deposits
                     
Personal
 
$
 
 
$
41,424
 
 
$
188
 
 
$


$
41,612
 
    $     $ 41,943     $ 301     $       $ 42,244  
Business and government


170,255


170,255
 
            169,003               169,003  
Bank


4,174


4,174
 
            2,908               2,908  
Other
                     
Obligations related to securities sold short
 
 
15,799


41,673


57,472
 
      18,678       31,213               49,891  
Obligations related to assets sold under repurchase agreements
and securities loaned


270,356


270,356
 
            242,916               242,916  
Derivatives
                     
Interest rate contracts


23,175


894


24,069
 
            20,679       901         21,580  
Foreign exchange contracts


63,860


78


63,938
 
            95,045       46         95,091  
Credit derivatives


352


352
 
            262               262  
Other contracts
 
 
9,669


59,633


424


69,726
 
      12,657       56,287       366         69,310  
Valuation adjustments


(118
)


(2
)
         
 
(120
)
 
              (257 )
 
 
    34               (223
Total gross derivatives
 
 
9,669


146,902


1,394


157,965
 
      12,657       172,016       1,347         186,020  
Netting adjustments
                         
 
(1,338)
 
 
(1,338
)
 
 
                                (2,067)       (2,067
Total derivatives
         
 
156,627
 
              183,953  
Other liabilities


19,142


19,142
 
            21,688               21,688  
Subordinated debentures


213


213
 
              232                     232  
   
$
25,468
 
 
$
694,139
 
 
$
1,582
 
 
$
(1,338)
 
$
719,851
 
      $ 31,335     $ 681,919     $ 1,648     $ (2,067)     $ 712,835  
 
(1)
United States (U.S.).
(2)
Organisation for Economic Co-operation and Development (OECD).

Table of Contents
56   
Royal Bank of Canada
  Second Quarter 2026
 
Fair value measurements using significant unobservable inputs (Level 3 Instruments)
A financial instrument is classified as Level 3 in the fair value hierarchy if one or more of its unobservable inputs may significantly affect
the
measurement of its fair value. In preparing the financial statements, appropriate levels for these unobservable input parameters are chosen so that they are consistent with prevailing market evidence or management judgment. Due to the unobservable nature of the prices or rates, there may be uncertainty about the valuation of these Level 3 financial instruments.
During the three months ended April 30, 2026, there were no significant changes made to the valuation techniques and ranges and weighted averages of unobservable inputs used in the determination of fair value of Level 3 financial instruments. As at April 30, 2026, the impacts of adjusting one or more of the unobservable inputs by reasonably possible alternative assumptions did not change significantly from the impacts disclosed in our audited 2025 Annual Consolidated Financial Statements.
Changes in fair value measurement for instruments measured on a recurring basis and categorized in Level 3


For the three months ended April 30, 2026
 
(Millions of Canadian dollars)
 
Fair value
at beginning
of period
 
 
Gains (losses)
included
in earnings
 
 
Gains (losses)
included in
OCI 
(1)
 
 
Purchases
(issuances)
 
 
Settlement
(sales) and
other
(2)
 
 
Transfers
into
Level 3
 
 
Transfers
out of
Level 3
 
 
Fair value
at end of
period
 
 
Gains
(losses) included
in earnings for
positions still held
 
Assets
                 
Securities
                 
Trading
                 
Corporate debt and other debt
 
$
30
 
 
$
 
 
$
 
 
$
1
 
 
$
(1
 
$
 
 
$
(13
 
$
17
 
 
$
 
Equities
 
 
2,830


(39
)
 
 
(4
)
 
 
217


(23
)
 
 
28


3,009


(7
)
   
 
2,860


(39
)
 
 
(4
)
 
 
218


(24
)
 
 
28


(13
 
 
3,026


(7
)
Investment
                 
Mortgage-backed securities
 
 
30


(1
)


29


Corporate debt and other debt
 
 
127


1


(1
)


(4
)


123


Equities
 
 
578


10


2


(1
)


589


1


735


1


8


2


(5
)


741


1
 
Loans
 
 
1,357


(28
)
 
 
(4
)
 
 
425


(1
)
 
 
86


1,835


(25
)
Other
                 
Net derivative balances
(3)
                 
Interest rate contracts
 
 
(657
)
 
 
18


10


3


1


(24
 
 
(649
)
 
 
6
 
Foreign exchange contracts
 
 
(44
)
 
 
(10
)
 
 
(1
)
 
 
(16
)


10


19


(42
)
 
 
(8
)
Credit derivatives
 
 
1


1


Other contracts
 
 
(234
)
 
 
(39
)
 
 
1


(3
)
 
 
2


(35
)
 
 
35


(273
)
 
 
(26
)
Valuation adjustments
 
 
(43
)


(18
)
 
 
(11
)


(72
)


Other assets
 
 
3


(1
)


2


$
3,978
 
 
$
(97
)
 
$
 
 
$
618
 
 
$
(37
)
 
$
90
 
$
17
 
 
$
4,569
 
 
$
(59
)
Liabilities
                 
Deposits
 
$
(189
)
 
$
(9
)
 
$
 
 
$
(72
)
 
$
52
 
 
$
(110
)
 
$
140
 
 
$
(188
)
 
$
 
 
$
(189
)
 
$
(9
)
 
$
 
 
$
(72
)
 
$
52
 
 
$
(110
)
 
$
140
 
 
$
(188
)
 
$


Table of Contents
Royal Bank of Canada
  Second Quarter 2026   57


For the three months ended April 30, 2025
 
(Millions of Canadian dollars)
 
Fair value
at beginning
of period
 
 
Gains (losses)
included
in earnings
 
 
Gains (losses)
included in
OCI (1)
 
 
Purchases
(issuances)
 
 
Settlement
(sales) and
other (2)
 
 
Transfers
into
Level 3
 
 
Transfers
out of
Level 3
 
 
Fair value
at end of
period
 
 
Gains
(losses) included
in earnings for
positions still held
 
Assets
                 
Securities
                 
Trading
                 
Corporate debt and other debt
  $     $     $     $     $     $ 32     $     $ 32     $  
Equities
    2,643       (6     (73     127       (36                 2,655       (6
      2,643       (6     (73     127       (36     32             2,687       (6
Investment
                 
Mortgage-backed securities
    32             (1                             31       n.s.
Corporate debt and other debt
    142             (4           (4                 134       n.s.
Equities
    523             15       32                         570       n.s.
      697             10       32       (4                 735       n.s.
Loans
    1,876       98       (23     51       (795                 1,207       20  
Other
                 
Net derivative balances
(3)
                 
Interest rate contracts
    (535     (47     2       28       2       7       21       (522     (46
Foreign exchange contracts
    (66     3       3             (1           8       (53     2  
Credit derivatives
                                                     
Other contracts
    (455     101       16             3       (49     (8     (392     125  
Valuation adjustments
    8                   16       1                   25        
Other assets
    7                         (2                 5        
    $ 4,175     $ 149     $ (65   $ 254     $ (832   $ (10   $ 21     $ 3,692     $ 95  
Liabilities
                 
Deposits
  $ (634   $ 8     $ 7     $ (169   $ 26     $ (44   $ 264     $ (542   $ 9  
    $ (634   $ 8     $ 7     $ (169   $ 26     $ (44   $ 264     $ (542   $ 9  
                 
    
For the six months ended April 30, 2026
 
(Millions of Canadian dollars)  
Fair value
at beginning
of period
   
Gains (losses)
included
in earnings
   
Gains (losses)
included in
OCI
(1)
   
Purchases
(issuances)
   
Settlement
(sales) and
other 
(2)
   
Transfers
into
Level 3
   
Transfers
out of
Level 3
   
Fair value
at end of
period
   
Gains
(losses) included
in earnings for
positions still held
 
Assets
                 
Securities
                 
Trading
                 
Corporate debt and other debt
 
$
32
 
 
$
(1
 
$
(1
 
$
1
 
 
$
(1
)
 
$
 
 
$
(13
)
 
$
17
 
 
$
 
Equities
 
 
2,863


(46
)
 
 
(49
)
 
 
331


(118
)
 
 
28


3,009


27


2,895


(47
)
 
 
(50
)
 
 
332


(119
)
 
 
28


(13
)
 
 
3,026


27
 
Investment
                 
Mortgage-backed securities
 
 
29


29


Corporate debt and other debt
 
 
134


2


(5
)


(8
)


123


1
 
Equities
 
 
582


8


2


(3
)


589


745


2


3


2


(11
)


741


1
 
Loans
 
 
1,274


(78
)
 
 
(6
)
 
 
548


(2
)
 
 
106


(7
)
 
 
1,835


(101
)
Other
                 
Net derivative balances
(3)
                 
Interest rate contracts
 
 
(608
)
 
 
(33
)


13


3


(24
)
 
 
(649
)
 
 
(38
)
Foreign exchange contracts
 
 
56


(125
)


(49
)
 
 
47


10


19


(42
)
 
 
1
 
Credit derivatives
 
 
2


(1


1


Other contracts
 
 
(256
)
 
 
(5
)
 
 
6


(16
)
 
 
8


(109
)
 
 
99


(273
)
 
 
16
 
Valuation adjustments
 
 
(79
)


(29
)
 
 
36


(72
)


Other assets
 
 
4


(2
)


2


$
4,033
 
 
$
(287
)
 
$
(47
)
 
 
$
801
 
 
$
(40
)
 
$
35
 
 
$
74
 
 
$
4,569
 
 
$
(94
)
Liabilities
                 
Deposits
 
$
(301
)
 
$
(15
)
 
$
3
 
 
$
(113
)
 
 
$
57
 
 
$
(217
)
 
$
398
 
 
$
(188
)
 
$
 
 
$
(301
)
 
 
$
(15
)


$
3
 
 
$
(113
)
 
 
$
57
 
 
$
(217
)
 
$
398
 
 
$
(188
)
 
 
$


Table of Contents
58   
Royal Bank of Canada
  Second Quarter 2026
 

     For the six months ended April 30, 2025  
(Millions of Canadian dollars)   Fair value
at beginning
of period
    Gains (losses)
included
in earnings
    Gains (losses)
included in
OCI (1)
    Purchases
(issuances)
    Settlement
(sales) and
other (2)
    Transfers
into
Level 3
    Transfers
out of
Level 3
    Fair
value

at end of
period
    Gains
(losses) included
in earnings for
positions still held
 
Assets
                 
Securities
                 
Trading
                 
Corporate debt and other debt
  $     $     $     $     $     $ 32     $     $ 32     $  
Equities
    2,544       (70     (14     334       (140     1             2,655       (48
      2,544       (70     (14     334       (140     33             2,687       (48
Investment
                 
Mortgage-backed securities
    31                                           31       n.s.
Corporate debt and other debt
    143             2             (11                 134       n.s.
Equities
    506             35       32       (3                 570       n.s.
      680             37       32       (14                 735       n.s.
Loans
    1,781       95             141       (814     7       (3     1,207       19  
Other
                 
Net derivative balances
(3)
                 
Interest rate contracts
    (493     (35     2       (39     5       9       29       (522     (34
Foreign exchange contracts
    (51     (11     3       1       (1           6       (53     (23
Credit derivatives
                                                     
Other contracts
    (303     80       3       (12     7       (274     107       (392     109  
Valuation adjustments
    18                   6       1                   25        
Other assets
    7                         (2                 5        
    $ 4,183     $ 59     $ 31     $ 463     $ (958   $ (225   $ 139     $ 3,692     $ 23  
Liabilities
                 
Deposits
  $ (478   $ 9     $ 1     $ (401   $ 88     $ (210   $ 449     $ (542   $ 46  
    $ (478   $ 9     $ 1     $ (401   $ 88     $ (210   $ 449     $ (542   $ 46  
 
(1)
These amounts include the foreign currency translation gains or losses arising on consolidation of foreign subsidiaries relating to the Level 3 instruments, where applicable. The unrealized gains on Investment securities recognized in OCI were
$13
million for the three months ended April 30, 2026 (April 30, 2025 – gains of
$16 million) and gains of $16 million for the six months ended April 30, 2026 (April 30, 2025 – gains of $31 million), excluding the translation gains or losses arising on consolidation.
(2)
Other includes amortization of premiums or discounts recognized in net income.
(3)
Net derivatives as at April 30, 2026 included derivative assets of $359 million (April 30, 2025 – $395 million) and derivative liabilities of $1,394 million (April 30, 2025 – $1,337 million).
n.s.
not significant
Transfers between fair value hierarchy levels for instruments carried at fair value on a recurring basis
Transfers between Level 1 and Level 2, and transfers into and out of Level 3 are assumed to occur at the end of the period. For an asset or a liability that transfers into Level 3 during the period, the entire change in fair value for the period is excluded from the Gains (losses) included in earnings for positions still held column of the above reconciliation, whereas for transfers out of Level 3 during the period, the entire change in fair value for the period is included in the same column of the above reconciliation.
Transfers between Level 1 and 2 are dependent on whether fair value is obtained on the basis of quoted market prices in active markets (Level 1).
During the three months ended April 30, 2026, transfers out of Level 1 to Level 2 included Trading U.S. federal, state, municipal and agencies debt of $483 million and Investment U.S. federal, state, municipal and agencies debt of
 $303
million. During the three months ended April 30, 2025, transfers out of Level 1 to Level 2 included Trading U.S. federal, state, municipal and agencies debt of
 $938 million.
During the three months ended April 30, 2026 and April 30, 2025, there were no significant transfers out of Level 2 to Level 1.
During the six months ended April 30, 2026, transfers out of Level 1 to Level 2 included Trading U.S. federal, state, municipal and agencies debt of $483
million and Investment U.S. federal, state, municipal and agencies debt of $439 million. During the six months ended April 30, 2025, transfers out of Level 1 to Level 2 included Trading U.S. federal, state, municipal and agencies debt of
 $938 million.
During the six months ended April 30, 2026 and April 30, 2025, there were no significant transfers out of Level 2 to Level 1.
Transfers between Level 2 and Level 3 are primarily due to either a change in the market observability for an input, or a change in an unobservable input’s significance to a financial instrument’s fair value.
During the three months ended April 30, 2026 and April 30, 2025, there were no significant transfers out of Level 2 to Level 3.
During the three months ended April 30, 2026 and April 30, 2025, transfers out of Level 3 to Level 2 included Deposits due to changes in the significance of unobservable inputs.
During the six months ended April 30, 2026, transfers out of Level 2 to Level 3 included Deposits due to changes in the significance of unobservable inputs. During the six months ended April 30, 2025, transfers out of Level 2 to Level 3 included Other contracts and Deposits due
to
changes in the significance of unobservable inputs.

Table of Contents
Royal Bank of Canada
  Second Quarter 2026   59

During the six months ended April 30, 2026, transfers out of Level 3 to Level 2 included Deposits due to changes in the significance of unobservable inputs. During the six months ended April 30, 2025, transfers out of Level 3 to Level 2 included Deposits and Other contracts due to changes in the significance of unobservable inputs and changes in the market observability of inputs.
Net interest income from financial instruments
Interest and dividend income arising from financial assets and financial liabilities and the associated costs of funding are reported in Net interest income.


For the three months ended


For the six months ended
 
(Millions of Canadian dollars)
 
April 30
2026
 
 
April 30
2025


April 30
2026
 
 
April 30
2025
 
Interest and dividend income
(1), (2)


Financial instruments measured at fair value through profit or loss
 
$
7,143
 
  $ 7,332


$
14,923
 
  $ 15,254  
Financial instruments measured at fair value through other comprehensive income
 
 
2,263
 
    2,106


4,574
 
    4,155  
Financial instruments measured at amortized cost
 
 
15,616
 
    15,532


31,629
 
    32,016  
   
 
25,022
 
    24,970


51,126
 
    51,425  
Interest expense
(1)


Financial instruments measured at fair value through profit or loss
 
$
7,231
 
  $ 7,317


$
15,104
 
  $ 15,362  
Financial instruments measured at amortized cost
 
 
9,285
 
    9,597


18,931
 
    20,059  
   
 
16,516
 
    16,914


34,035
 
    35,421  
Net interest income
 
$
8,506
 
  $ 8,056


$
17,091
 
  $ 16,004  
 
(1)   Excludes interest and dividend income for the three months ended April 30, 2026 of $296 million (April 30, 2025 – $292 million) and for the six months ended April 30, 2026 of $684 million (April 30, 2025 – $657 million) and interest expense for the three months ended April 30, 2026 of $37
million
(
April 30, 2025 – $75 million) and for the six months ended April 30, 2026 of $76 million (April 30, 2025 – $118 million) presented in Insurance investment result in the Interim Condensed Consolidated Statements of Income.
(2)   Includes dividend income for the three months ended April 30, 2026 of $835
million
(April 30, 2025 – $1,003 million) and for the six months ended April 30, 2026 of $1,810 million (April 30, 2025 – $1,999 million)
 
presented in Interest and dividend income in the Interim Condensed Consolidated Statements of Income.
 
Note 4
 
Securities
Unrealized gains and losses on securities at FVOCI
(1), (2)
 
     As at    
   
April 30, 2026
        October 31, 2025  
(Millions of Canadian dollars)  
Cost/
Amortized
cost
   
Gross
unrealized
gains
   
Gross
unrealized
losses
   
Fair value
         Cost/
Amortized
cost
    Gross
unrealized
gains
    Gross
unrealized
losses
    Fair value  
Debt issued or guaranteed by:
                 
Canadian government
                 
Federal
 
$
49,070
 
 
$
82
 
 
$
(65
)
 
$
49,087
 
    $ 39,827     $ 46     $ (7   $ 39,866  
Provincial and municipal
 
 
12,549


45


(90
)
 
 
12,504
 
      11,368       39       (89     11,318  
U.S. federal, state, municipal and agencies
 
 
146,888


708


(1,177
)
 
 
146,419
 
      131,385       622       (1,316     130,691  
Other OECD government
 
 
23,757


20


(48
)
 
 
23,729
 
      11,975       14       (56     11,933  
Mortgage-backed securities
 
 
2,650


7


(5
)
 
 
2,652
 
      2,674       7       (7     2,674  
Asset-backed securities
 
 
9,582


4


(7
)
 
 
9,579
 
      10,126       15       (2     10,139  
Corporate debt and other debt
 
 
30,355


116


(40
)
 
 
30,431
 
      33,602       122       (46     33,678  
Equities
 
 
805


726


(5
)
 
 
1,526
 
        832       669       (5     1,496  
   
$
275,656
 
 
$
1,708
 
 
$
 
 
(1,437
)
 
$
275,927
 
      $ 241,789     $ 1,534     $ (1,528
)
  $ 241,795  
 
(1)
Excludes $
99,836
million
of held-to-collect securities as at April 30, 2026 that are carried at amortized cost, net of allowance for credit losses (October 31, 2025 – $100,926 million).
(2)
Gross unrealized gains and losses includes $(38)
million
of allowance for credit losses on debt securities at FVOCI as at April 30, 2026 (October 31, 2025 – $(40) million) recognized in income and Other components of equity.
Allowance for credit losses on investment securities
The following tables reconcile the opening and closing allowance for debt securities at FVOCI and amortized cost by stage. Reconciling items include the following:
 
Transfers between stages, which are presumed to occur before any corresponding remeasurement of the allowance.
 
Purchases, which reflect the allowance related to assets newly recognized during the period, including those assets that were derecognized following a modification of terms.
 
Sales and maturities, which reflect the allowance related to assets derecognized during the period without a credit loss being incurred, including those assets that were derecognized following a modification of terms.
 
Changes in risk, parameters and exposures, which comprise the impact of changes in model inputs or assumptions, including changes in forward-looking macroeconomic conditions; partial repayments; changes in the measurement following a transfer between stages; and unwinding of the time value discount due to the passage of time.

Table of Contents
60   
Royal Bank of Canada
  Second Quarter 2026

Allowance for credit
losses
– Securities at FVOCI
(1)


For the three months ended


April 30, 2026


April 30, 2025


Performing


Impaired


Performing


Impaired


(Millions of Canadian dollars)
 
Stage 1
 
 
Stage 2


Stage 3 
(2)
 
 
Total


Stage 1
 
 
Stage 2


Stage 3 (2)
 
 
Total
 
Balance at beginning of period
 
$
5
 
 
$
 
   
$
(43
 
$
(38
    $ 4     $       $ (42   $ (38
Provision for credit losses
                     
Transfers to stage 1


Transfers to stage 2


Transfers to stage 3


Purchases
 
 
2


2
 
      2                     2  
Sales and maturities
 
 
(1
)


(1
)
      (1                   (1
Changes in risk, parameters and exposures


(2
)
 
 
(2
)
      (1             (2     (3
Exchange rate and other
 
 
(1
)


2


1
 
            1                     4       5  
Balance at end of period
 
$
5
 
 
$
 
         
$
(43
 
$
(38
          $ 5     $             $ (40   $ (35
 
     For the six months ended  
   
April 30, 2026
          April 30, 2025  
   
Performing
         
Impaired
                Performing           Impaired        
(Millions of Canadian
dollars
)
 
Stage 1
   
Stage 2
          
Stage 3 
(2)
   
Total
           Stage 1     Stage 2            Stage 3 (2)     Total  
Balance at beginning of period
 
$
5
 
 
$
 
   
$
(45
 
$
(40
    $ 6     $       $ (41   $ (35
Provision for credit losses
                     
Transfers to stage 1


Transfers to stage 2


Transfers to stage 3


Purchases
 
 
4


4
 
      4                     4  
Sales and maturities
 
 
(2


(2
      (2                   (2
Changes in risk, parameters and exposures
 
 
(1


(3
 
 
(4
      (4             (4     (8
Exchange rate and other
 
 
(1


5


4
 
            1                     5       6  
Balance at end of period
 
$
5
 
 
$
 
         
$
(43
 
$
(38
          $ 5     $             $ (40   $ (35
 
(1)
 
Expected credit losses on debt securities at FVOCI are not separately recognized on the Interim Condensed Consolidated Balance Sheets as the related securities are recorded at fair value. The cumulative amount
of
credit losses recognized in income is presented in Other components of equity.
(2)
 
Reflects changes in the allowance for purchased credit-impaired securities.

Table of Contents
Royal Bank of Canada
  Second Quarter 2026   61

Allowance for credit losses – Securities at
amortized
cost


For the three months ended


April 30, 2026


April 30, 2025


Performing


Impaired


Performing


Impaired


(Millions of Canadian dollars)
 
Stage 1
 
 
Stage 2


Stage 3
 
 
Total


Stage 1
 
 
Stage 2


Stage 3
 
 
Total
 
Balance at beginning of period
 
$
8
 
 
$
6
 
   
$
 
 
$
14
 
    $ 6     $ 8       $     $ 14  
Provision for credit losses
                     
Transfers to stage 1


Transfers to stage 2


Transfers to stage 3


Purchases
 
 
5


5
 
      1                     1  
Sales and maturities


Changes in risk, parameters and exposures
 
 
(2
)


(2
)
            (1             (1
Exchange rate and other


            (1     1                      
Balance at end of period
 
$
11
 
 
$
6
 
         
$
 
 
$
17
 
          $        6     $    8             $    –     $       14  


For the six months ended


April 30, 2026


April 30, 2025


Performing


Impaired


Performing


Impaired


(Millions of Canadian dollars)
 
Stage 1
 
 
Stage 2


Stage 3
 
 
Total


Stage 1
 
 
Stage 2


Stage 3
 
 
Total
 
Balance at beginning of period
 
$
8
 
 
$
6
 
   
$
 
 
$
14
 
    $ 6     $ 8       $     $ 14  
Provision for credit losses
                     
Transfers to stage 1


Transfers to stage 2


Transfers to stage 3


Purchases
 
 
6


6
 
      2                     2  
Sales and maturities


Changes in risk, parameters and exposures
 
 
(2
)
 
 
(1
)


(3
)
      (1     (1             (2
Exchange rate and other
 
 
(1
)
 
 
1


            (1     1                      
Balance at end of period
 
$
      11
 
 
$
    6
 
         
$
    –
 
 
$
       17
 
          $        6     $    8             $    –     $       14  
Credit risk exposure by internal risk rating
The following table presents the fair value of debt securities at FVOCI and gross carrying amount of securities at amortized cost. Risk ratings are based on internal ratings used in the measurement of expected credit losses as at the reporting date, as outlined in the internal ratings maps in the Credit risk section of our 2025 Annual Report.


As at   


April 30, 2026


October 31, 2025


Performing


Impaired


Performing


Impaired


(Millions of Canadian dollars)
 
Stage 1
 
 
Stage 2


Stage 3 
(1)
 
 
Total


Stage 1
 
 
Stage 2


Stage 3 (1)
 
 
Total
 
Investment securities


Securities at FVOCI


Investment grade
 
$
273,465
 
 
$
 
   
$
 
 
$
273,465
 
    $ 239,375     $       $     $ 239,375  
Non-investment grade
 
 
809


4


813
 
      786       4               790  
Impaired


123


123
 
                                134       134  
 
 
274,274


4


123


274,401
 
      240,161       4         134       240,299  
Items not subject to impairment
(2)


1,526
 
                                            1,496  


$
275,927
 
                                          $ 241,795  
Securities at amortized cost
                             
Investment grade
 
$
98,550
 
 
$
 
   
$
 
 
$
98,550
 
    $ 99,673     $       $     $ 99,673  
Non-investment grade
 
 
1,180


123


1,303
 
            1,098       169                     1,267  
 
 
99,730


123


99,853
 
      100,771       169               100,940  
Allowance for credit losses
 
 
11


6


17
 
            8       6                     14  
   
$
99,719
 
 
$
117
 
         
$
 
 
$
99,836
 
          $ 100,763     $ 163             $     $ 100,926  
 
(1)
Reflects $123 million of purchased credit-impaired securities (October 31, 2025 – $134 million).
(2)
Investment securities at FVOCI not subject to impairment represent equity securities designated as FVOCI.

Table of Contents
62   
Royal Bank of Canada
  Second Quarter 2026

Note 5
 
Loans and allowance for credit losses
Allowance for credit losses


For the three months ended


April 30, 2026


April 30, 2025
 
(Millions of Canadian dollars)
 
Balance at
beginning
of period
 
 
Provision
for credit
losses
 
 
Net
write-offs
 
 
Exchange
rate and
other
 
 
Balance at
end of
period


Balance at
beginning
of period
 
 
Provision
for credit
losses
 
 
Net
write-offs
 
 
Exchange
rate and
other
 
 
Balance at
end of
period
 
Retail


Residential mortgages
 
$
845
 
 
$
82
 
 
$
(3
)
 
$
(20
)
 
$
904


$
636
 
 
$
121
 
 
$
(2
 
$
(25
 
$
730
 
Personal
 
 
1,659


162


(207
)
 
 
(7
)
 
 
1,607


1,534


288


(178
 
 
(11
 
 
1,633
 
Credit cards
 
 
1,348


253


(250
)


1,351


1,264


257


(199
 
 
(2
 
 
1,320
 
Small business
 
 
362


(1
)
 
 
(25
)
 
 
(7
)
 
 
329


289


88


(28
 
 
(6
 
 
343
 
Wholesale
 
 
3,538


421


(246
)
 
 
(100
)
 
 
3,613


3,210


666


(270
 
 
(151
 
 
3,455


$
7,752
 
 
$
917
 
 
$
(731)
 
 
$
(134)
 
 
$
7,804


$
6,933
 
 
$
1,420
 
 
$
 (677
 
$
(195
 
$
7,481
 
Presented as:


Allowance for loan losses
 
$
7,401


$
7,521


$
6,600


$
7,125
 
Other liabilities – Provisions
 
 
350


282


328


353
 
Other components of equity
 
 
1


1


5


3


For the six months ended


April 30, 2026


April 30, 2025
 
(Millions of Canadian dollars)
 
Balance at
beginning
of period
 
 
Provision
for credit
losses
 
 
Net
write-offs
 
 
Exchange
rate and
other
 
 
Balance at
end of
period


Balance at
beginning
of period
 
 
Provision
for credit
losses
 
 
Net
write-offs
 
 
Exchange
rate and
other
 
 
Balance at
end of
period
 
Retail


Residential mortgages
 
$
794
 
 
$
159
 
 
$
(6
)
 
$
(43
)
 
$
904


$
572
 
 
$
194
 
 
$
(4
 
$
(32
 
$
730
 
Personal
 
 
1,639


391


(408
)
 
 
(15
)
 
 
1,607


1,482


535


(367
 
 
(17
 
 
1,633
 
Credit cards
 
 
1,356


483


(486
)
 
 
(2
)
 
 
1,351


1,233


480


(392
 
 
(1
 
 
1,320
 
Small business
 
 
351


42


(52
)
 
 
(12
)
 
 
329


272


134


(52
 
 
(11
 
 
343
 
Wholesale
 
 
3,319


938


(413
)
 
 
(231
)
 
 
3,613


2,793


1,130


(349
 
 
(119
 
 
3,455


$
7,459
 
 
$
2,013
 
 
$
 (1,365)
 
 
$
 (303)
 
 
$
7,804


$
6,352
 
 
$
2,473
 
 
$
 (1,164
 
$
 (180
 
$
7,481
 
Presented as:


Allowance for loan losses
 
$
7,093


$
7,521


$
6,037


$
7,125
 
Other liabilities – Provisions
 
 
365


282


311


353
 
Other components of equity
 
 
1


1


4


3
 
The following table reconciles the opening and closing allowance for each major product of loans and commitments as determined by our modelled, scenario-weighted allowance and the application of expert credit judgment as applicable. Reconciling items include the following:
 
Model changes, as applicable, which generally comprise the impact of significant changes to the quantitative models used to estimate expected credit losses and any staging impacts that may arise.
 
Transfers between stages, which are presumed to occur before any corresponding remeasurements of the allowance.
 
Originations, which reflect the allowance related to assets newly recognized during the period, including those assets that were derecognized following a modification of terms.
 
Maturities, which reflect the allowance related to assets derecognized during the period without a credit loss being incurred, including those assets that were derecognized following a modification of terms.
 
Changes in risk, parameters and exposures, which comprise the impact of changes in model inputs or assumptions, including changes in forward-looking macroeconomic conditions; partial repayments and additional draws on existing facilities; changes in the measurement following a transfer between stages; and unwinding of the time value discount due to the passage of time in Stage 1 and Stage 2.

Table of Contents
Royal Bank of Canada
  Second Quarter 2026   63
 
Allowance for credit losses – Retail and wholesale loans


For the three months ended


April 30, 2026


April 30, 2025


Performing


Impaired


Performing


Impaired


(Millions of Canadian dollars)
 
Stage 1
 
 
Stage 2


Stage 3
 
 
Total


Stage 1
 
 
Stage 2


Stage 3
 
 
Total
 
Residential mortgages
                     
Balance at beginning of period
 
$
272
 
 
$
215
 
   
$
358
 
 
$
845
 
    $ 218     $ 158       $ 260     $ 636  
Provision for credit losses
                     
Model changes
 
 
(88

)
 
 
131


43


Transfers to stage 1
 
 
110


(107
)
   
 
(3
)


      34       (34              
Transfers to stage 2
 
 
(10
)
 
 
10


      (14     18         (4      
Transfers to stage 3
 
 
(1
)
 
 
(21
)
   
 
22


      (1     (10       11        
Originations
 
 
14


14
 
      24                     24  
Maturities
 
 
(7
)
 
 
(18
)


(25
)
      (5     (8             (13
Changes in risk, parameters and exposures
 
 
(76
)
 
 
99


27


50
 
      4       89         17       110  
Write-offs


(6
)
 
 
(6
)
                    (5     (5
Recoveries


3


3
 
                    3       3  
Exchange rate and other
 
 
1


(1
)
     
 
(20
)
 
 
(20
)
        (1     (4         (20     (25
Balance at end of period
 
$
215
 
 
$
308
 
     
$
381
 
 
$
904
 
      $ 259     $ 209         $ 262     $ 730  
Personal
                     
Balance at beginning of period
 
$
283
 
 
$
1,134
 
   
$
242
 
 
$
1,659
 
    $ 305     $ 1,009       $ 220     $ 1,534  
Provision for credit losses
                     
Model changes
 
 
84


(138

)


(54

)
                               
Transfers to stage 1
 
 
156


(156
)


      141       (140       (1      
Transfers to stage 2
 
 
(22
)
 
 
22


      (32     32                
Transfers to stage 3
 
 
(1
)
 
 
(35
)
   
 
36


      (1     (40       41        
Originations
 
 
55


55
 
      25                     25  
Maturities
 
 
(8
)
 
 
(57
)


(65
)
      (13     (53             (66
Changes in risk, parameters and exposures
 
 
(208
)
 
 
267


167


226
 
      (122     304         147       329  
Write-offs


(250
)
 
 
(250
)
                    (215     (215
Recoveries


43


43
 
                    37       37  
Exchange rate and other
 
 
1


(1
)
     
 
(7
)
 
 
(7
)
        1       (2         (10     (11
Balance at end of period
 
$
340
 
 
$
1,036
 
     
$
231
 
 
$
1,607
 
      $ 304     $ 1,110         $ 219     $ 1,633  
Credit cards
                     
Balance at beginning of period
 
$
210
 
 
$
1,138
 
   
$


$
1,348
 
    $ 206     $ 1,058       $     $ 1,264  
Provision for credit losses
                     
Transfers to stage 1
 
 
143


(143
)


      179       (179              
Transfers to stage 2
 
 
(26
)
 
 
26


      (28     28                
Transfers to stage 3
 
 
(1

)
 
 
(148
)
   
 
149


            (146       146        
Originations
 
 
4


4
 
      3                     3  
Maturities
 
 
(1
)
 
 
(12
)


(13
)
      (1     (15             (16
Changes in risk, parameters and exposures
 
 
(60
)
 
 
221


101


262
 
      (155     373         52       270  
Write-offs


(301
)
 
 
(301
)
                    (246     (246
Recoveries


51


51
 
                    47       47  
Exchange rate and other


        (2     (1         1       (2
Balance at end of period
 
$
269
 
 
$
1,082
 
     
$


$
1,351
 
      $ 202     $ 1,118         $     $ 1,320  
Small business
                     
Balance at beginning of period
 
$
101
 
 
$
113
 
   
$
148
 
 
$
362
 
    $ 80     $ 87       $ 122     $ 289  
Provision for credit losses


Transfers to stage 1
 
 
20


(20
)


      10       (10              
Transfers to stage 2
 
 
(8
)
 
 
8


      (7     7                
Transfers to stage 3
 
 
(1

)
 
 
(6
)
   
 
7


      (1     (3       4        
Originations
 
 
11


11
 
      11                     11  
Maturities
 
 
(8
)
 
 
(11
)


(19
)
      (4     (6             (10
Changes in risk, parameters and exposures
 
 
(18
)
 
 
31


(6
)
 
 
7
 
      7       39         41       87  
Write-offs


(31
)
 
 
(31
)
                    (31     (31
Recoveries


6


6
 
                    3       3  
Exchange rate and other


1


(8
)
 
 
(7
)
        2                 (8     (6
Balance at end of period
 
$
97
 
 
$
116
 
     
$
116
 
 
$
329
 
      $ 98     $ 114         $ 131     $ 343  
Wholesale
                     
Balance at beginning of period
 
$
890
 
 
$
1,115
 
   
$
1,533
 
 
$
3,538
 
    $ 835     $ 992       $ 1,383     $ 3,210  
Provision for credit losses
                     
Transfers to stage 1
 
 
51


(51
)


      44       (43       (1      
Transfers to stage 2
 
 
(31
)
 
 
31


      (43     43                
Transfers to stage 3
 
 
(4
)
 
 
(45
)
   
 
49


      (4     (71       75        
Originations
 
 
139


139
 
      188                     188  
Maturities
 
 
(104
)
 
 
(173
)


(277
)
      (117     (97             (214
Changes in risk, parameters and exposures
 
 
(79
)
 
 
288


350


559
 
      59       309         324       692  
Write-offs


(273
)
 
 
(273
)
                    (289     (289
Recoveries


27


27
 
                    19       19  
Exchange rate and other
 
 
(2
)
 
 
(1
)
     
 
(97
)
 
 
(100
)
        (16     (29         (106     (151
Balance at end of period
 
$


860
 
 
$
 
 
1,164
 
     
$
 
 
1,589
 
 
$
3,613
 
      $   946     $ 1,104         $ 1,405     $ 3,455  

Table of Contents
64   
Royal Bank of Canada
  Second Quarter 2026


For the six months ended


April 30, 2026


April 30, 2025


Performing


Impaired


Performing


Impaired


(Millions of Canadian dollars)
 
Stage 1
 
 
Stage 2


Stage 3
 
 
Total


Stage 1
 
 
Stage 2


Stage 3
 
 
Total
 
Residential mortgages


Balance at beginning of period
 
$
276
 
 
$
204
 
   
$
314
 
 
$
794
 
    $ 215     $ 126       $ 231     $ 572  
Provision for credit losses
                     
Model changes
 
 
(88
)
 
 
131


43
 
                               
Transfers to stage 1
 
 
154


(149
)
   
 
(5
)


      59       (59              
Transfers to stage 2
 
 
(22
)
 
 
23


(1
)


      (18     24         (6      
Transfers to stage 3
 
 
(4
)
 
 
(34
)
   
 
38


      (2     (24       26        
Originations
 
 
41


41
 
      47                     47  
Maturities
 
 
(15
)
 
 
(27
)


(42
)
      (10     (14             (24
Changes in risk, parameters and exposures
 
 
(127
)
 
 
162


82


117
 
      (33     158         46       171  
Write-offs


(12
)
 
 
(12
)
                    (9     (9
Recoveries


6


6
 
                    5       5  
Exchange rate and other


(2
)
     
 
(41
)
 
 
(43
)
        1       (2         (31     (32
Balance at end of period
 
$
215
 
 
$
308
 
     
$
381
 
 
$
904
 
      $ 259     $ 209         $ 262     $ 730  
Personal
                     
Balance at beginning of period
 
$
291
 
 
$
1,115
 
   
$
233
 
 
$
1,639
 
    $ 305     $ 966       $ 211     $ 1,482  
Provision for credit losses
                     
Model changes
 
 
84


(138
)


(54
)
                               
Transfers to stage 1
 
 
308


(308
)


      285       (284       (1      
Transfers to stage 2
 
 
(43
)
 
 
43


      (53     56         (3      
Transfers to stage 3
 
 
(2
)
 
 
(76
)
   
 
78


      (2     (79       81        
Originations
 
 
79


79
 
      53                     53  
Maturities
 
 
(20
)
 
 
(122
)
   
 
(1
)
 
 
(143
)
      (26     (106             (132
Changes in risk, parameters and exposures
 
 
(357
)
 
 
524


342


509
 
      (258     558         314       614  
Write-offs


(493
)
 
 
(493
)
                    (438     (438
Recoveries


85


85
 
                    71       71  
Exchange rate and other


(2
)
     
 
(13
)
 
 
(15
)
              (1         (16     (17
Balance at end of period
 
$
340
 
 
$
1,036
 
     
$
231
 
 
$
1,607
 
      $ 304     $ 1,110         $ 219     $ 1,633  
Credit cards
                     
Balance at beginning of period
 
$
217
 
 
$
1,139
 
   
$
 
 
$
1,356
 
    $ 207     $ 1,026       $     $ 1,233  
Provision for credit losses
                     
Transfers to stage 1
 
 
312


(312
)


      334       (334              
Transfers to stage 2
 
 
(53
)
 
 
53


      (56     56                
Transfers to stage 3
 
 
(1
)
 
 
(312
)
   
 
313


      (1     (283       284        
Originations
 
 
6


6
 
      5                     5  
Maturities
 
 
(2
)
 
 
(26
)


(28
)
      (2     (27             (29
Changes in risk, parameters and exposures
 
 
(209
)
 
 
541


173


505
 
      (283     680         107       504  
Write-offs


(584
)
 
 
(584
)
                    (480     (480
Recoveries


98


98
 
                    88       88  
Exchange rate and other
 
 
(1
)
 
 
(1
)


(2
)
        (2               1       (1
Balance at end of period
 
$
269
 
 
$
1,082
 
     
$
 
 
$
1,351
 
      $ 202     $ 1,118         $     $ 1,320  
Small business
                     
Balance at beginning of period
 
$
95
 
 
$
117
 
   
$
139
 
 
$
351
 
    $ 80     $ 86       $ 106     $ 272  
Provision for credit losses
                     
Transfers to stage 1
 
 
35


(35
)


      23       (23              
Transfers to stage 2
 
 
(13
)
 
 
13


      (11     11                
Transfers to stage 3
 
 
(1
)
 
 
(11
)
   
 
12


      (1     (6       7        
Originations
 
 
22


22
 
      20                     20  
Maturities
 
 
(13
)
 
 
(30
)


(43
)
      (10     (11             (21
Changes in risk, parameters and exposures
 
 
(30
)
 
 
60


33


63
 
      (6     57         84       135  
Write-offs


(65
)
 
 
(65
)
                    (60     (60
Recoveries


13


13
 
                    8       8  
Exchange rate and other
 
 
2


2


(16
)
 
 
(12
)
        3                 (14     (11
Balance at end of period
 
$
97
 
 
$
116
 
     
$
116
 
 
$
329
 
      $ 98     $ 114         $ 131     $ 343  
Wholesale
                     
Balance at beginning of period
 
$
896
 
 
$
1,123
 
   
$
1,300
 
 
$
3,319
 
    $ 787     $ 1,038       $ 968     $ 2,793  
Provision for credit losses
                     
Transfers to stage 1
 
 
120


(120
)


      99       (98       (1      
Transfers to stage 2
 
 
(53
)
 
 
53


      (64     73         (9      
Transfers to stage 3
 
 
(6
)
 
 
(125
)
   
 
131


      (6     (206       212        
Originations
 
 
298


298
 
      424                     424  
Maturities
 
 
(225
)
 
 
(290
)


(515
)
      (303     (197             (500
Changes in risk, parameters and exposures
 
 
(157
)
 
 
540


772


1,155
 
      11       499         696       1,206  
Write-offs


(460
)
 
 
(460
)
                    (380     (380
Recoveries


47


47
 
                    31       31  
Exchange rate and other
 
 
(13
)
 
 
(17
)
     
 
(201
)
 
 
(231
)
        (2     (5         (112     (119
Balance at end of period
 
$


860
 
 
$
 
 
1,164


$
 
 
1,589
 
 
$
3,613
 
      $   946     $ 1,104         $ 1,405     $ 3,455  

Table of Contents
Royal Bank of Canada
  Second Quarter 2026   65

Key inputs and assumptions
The following provides an update on the key inputs and assumptions used in the measurement of expected credit losses. For further details, refer to Note 2 and Note 5 of our audited 2025 Annual Consolidated Financial Statements.
Our base scenario reflects a stabilizing U.S. trade policy and the impacts of higher energy prices resulting from the conflict in the Middle East. Economic growth in both Canada and the U.S. is expected to remain positive, with gradually declining unemployment rates through calendar 2026 in Canada and rising unemployment rates, peaking in calendar Q3 2026, followed by a return to equilibrium in calendar Q4 2026 in the U.S. Central bank policy rates in Canada and the U.S. are expected to remain unchanged through calendar 2026, followed by rate increases in Canada and rate cuts in the U.S. starting in calendar Q1 2027.
Our downside scenarios include two additional and more severe downside scenarios designed for trade disruptions and the real estate sector. Our downside scenarios reflect the possibility of moderate and escalating macroeconomic shocks beginning in calendar Q3 2026 relative to our base scenario. In these scenarios, conditions are expected to deteriorate from calendar Q2 2026 levels for up to 18 months, followed by a recovery for the remainder of the period. These scenarios assume monetary policy responses that return the economy to a
long-run,
sustainable growth rate within the forecast period.
Our upside scenario reflects slightly stronger economic growth than the base scenario, without prompting a further offsetting monetary policy response as compared to our base scenario, followed by a return to a
long-run
sustainable growth rate within the forecast period.
The following provides additional detail about our calendar quarter forecasts for certain key macroeconomic variables used in the models to estimate the allowance for credit losses:
 
 
Unemployment rates
– In our base forecast, we expect the Canadian unemployment rate to
decline to
6.5% in calendar Q
2
2026 then
continue to
decline over the short term, before returning to its long run equilibrium towards the latter end of the horizon. The U.S. unemployment rate is expected to peak at 4.5% in calendar Q
3
2026, then return to its long run equilibrium level in calendar Q4 2026.


Gross Domestic Product (GDP)
– In our base forecast, we expect both Canadian and U.S. GDP to continuously grow in calendar Q
2
2026 and thereafter. GDP in calendar Q4 2026 is expected to be 1.6% above Q4 2025 levels in
 
b
oth
Canada and the U.S.


Table of Contents
66   
Royal Bank of Canada
  Second Quarter 2026

 
Canadian housing price index
– In our base forecast, we expect housing prices to increase by 0.2% over the next 12 months from calendar Q
2
2026, with a compound annual growth rate of 4.3% for the following 2 to 5 years. The range of annual housing price growth (contraction) in our alternative real estate downside and upside scenarios is (28.0)% to 10.9% over the next 12 months and 4.2% to 9.6% for the following 2 to 5 years. As at October 31, 2025, our base forecast included housing price growth of 0.3% from calendar Q4 2025 for the next 12 months and housing price growth of 3.4% for the following 2 to 5 years.
Credit risk exposure by internal risk rating
The following table presents the gross carrying amount of loans measured at amortized cost, and the full contractual amount of undrawn loan commitments subject to the impairment requirements of IFRS 9
Financial Instruments
. Risk ratings are based on internal ratings used in the measurement of expected credit losses as at the reporting date, as outlined in the internal ratings maps for Wholesale and Retail facilities in the Credit risk section of our 2025 Annual Report.


As at       


April 30, 2026


October 31, 2025
 
(Millions of Canadian dollars)
 
Stage 1
 
 
Stage 2
 
 
Stage 3 
(1)
 
 
Total


Stage 1
 
 
Stage 2
 
 
Stage 3 (1)
 
 
Total
 
Retail
(2)
                 
Loans outstanding – Residential mortgages
                 
Low risk
 
$
405,054
 
 
$
948
 
 
$
 
 
$
406,002
 
    $ 386,060     $ 16,495     $     $ 402,555  
Medium risk
 
 
18,517


5,139


23,656
 
      20,622       2,571             23,193  
High risk
 
 
2,842


8,570


11,412
 
      2,131       6,532             8,663  
Not rated
(
3
)
 
 
54,729


1,796


56,525
 
      54,253       1,940             56,193  
Impaired


2,131


2,131
 
                    1,681       1,681  
   
 
481,142


16,453


2,131


499,726
 
        463,066       27,538       1,681       492,285  
Items not subject to impairment
(
4
)
                         
 
1,153
 
                                1,128  
Total
                         
$
500,879
 
                              $ 493,413  
Loans outstanding – Personal
                 
Low risk
 
$
70,192
 
 
$
1,485
 
 
$
   –
 
 
$
71,677
 
    $ 87,536     $ 2,712     $     $ 90,248  
Medium risk
 
 
3,799


1,654


5,453
 
      4,035       3,768             7,803  
High risk
 
 
707


2,510


3,217
 
      601       2,583             3,184  
Not rated
(
3
)
 
 
32,630


4,307


36,937
 
      12,493       1,180             13,673  
Impaired


436


436
 
                    437       437  
Total
 
$
107,328
 
 
$
9,956
 
 
$
436
 
 
$
117,720
 
      $ 104,665     $ 10,243     $ 437     $ 115,345  
Loans outstanding – Credit cards
                 
Low risk
 
$
19,633
 
 
$
813
 
 
$
 
 
$
20,446
 
    $ 18,279     $ 161     $     $ 18,440  
Medium risk
 
 
1,479


1,897


3,376
 
      2,123       2,291             4,414  
High risk
 
 
87


2,774


2,861
 
      70       2,423             2,493  
Not rated
(
3
)
 
 
780


239


1,019
 
        1,133       309             1,442  
Total
 
$
21,979
 
 
$
5,723
 
 
$
 
 
$
27,702
 
      $ 21,605     $ 5,184     $     $ 26,789  
Loans outstanding – Small business
                 
Low risk
 
$
11,169
 
 
$
548
 
 
$
 
 
$
11,717
 
    $ 10,628     $ 595     $     $ 11,223  
Medium risk
 
 
2,454


734


3,188
 
      2,550       924             3,474  
High risk
 
 
247


1,413


1,660
 
      259       1,422             1,681  
Not rated
(
3
)
 
 
10


10
 
      8                   8  
Impaired


480


480
 
                    411       411  
Total
 
$
13,880
 
 
$
2,695
 
 
$
480
 
 
$
17,055
 
      $ 13,445     $ 2,941     $ 411     $ 16,797  
Undrawn loan commitments – Retail
                 
Low risk
 
$
307,529
 
 
$
139
 
 
$
 
 
$
307,668
 
    $ 293,300     $ 3,700     $     $ 297,000  
Medium risk
 
 
14,009


226


14,235
 
      12,451       427             12,878  
High risk
 
 
1,175


1,785


2,960
 
      805       758             1,563  
Not rated
(
3
)
 
 
9,123


244


9,367
 
        13,964       274             14,238  
Total
 
$
331,836
 
 
$
2,394
 
 
$
 
 
$
334,230
 
      $ 320,520     $ 5,159     $     $ 325,679  
Wholesale – Loans outstanding
                 
Investment grade
 
$
148,514
 
 
$
2,026
 
 
$
 
 
$
150,540
 
    $ 130,322     $ 2,117     $     $ 132,439  
Non-investment grade
 
 
212,057


26,199


238,256
 
      207,239       26,399             233,638  
Not rated
(
3
)
 
 
15,076


577


15,653
 
      14,714       503             15,217  
Impaired


6,743


6,743
 
                    6,153       6,153  
   
 
375,647


28,802


6,743


411,192
 
        352,275       29,019       6,153       387,447  
Items not subject to impairment
(
4
)
                         
 
10,922
 
                                9,724  
Total
                         
$
422,114
 
                              $ 397,171  
Undrawn loan commitments – Wholesale
                 
Investment grade
 
$
388,395
 
 
$
1,440
 
 
$
 
 
$
389,835
 
    $ 393,167     $ 1,593     $     $ 394,760  
Non-investment grade
 
 
178,968


14,256


193,224
 
      182,223       16,158             198,381  
Not rated
(
3
)
 
 
1,651


19


1,670
 
        1,407       21             1,428  
Total
 
$
569,014
 
 
$
15,715
 
 
$
 
 
$
584,729
 
      $ 576,797     $ 17,772     $  –     $ 594,569  
 
(1)
Includes $197 million of purchased or originated credit-impaired loans (October 31, 2025
 – 
$195 million).
(2)
During the second quarter of 2026, we applied changes to our Retail risk rating models, which were applied prospectively and reflected in the April 30, 2026 credit risk exposures. Certain Personal portfolios no longer use internal risk ratings in the measurement of expected credit losses and therefore were presented in Not rated.
(3)
In certain cases where an internal risk rating is not assigned, we use other approved credit risk assessment or rating methodologies, policies and tools to manage our credit
risk
.
(4)
Items not subject to impairment are loans held at FVTPL.

Table of Contents
Royal Bank of Canada
  Second Quarter 2026   67

Loans past due but not impaired
(1), (2)
 
       As at  
   
April 30, 2026
        October 31, 2025  
(Millions of Canadian dollars)  
30 to 89 days
   
90 days
and greater
   
Total
         30 to 89 days     90 days
and greater
    Total  
Retail
 
$
2,479
 
 
$
358
 
 
$
2,837
 
    $ 2,634     $ 323     $ 2,957  
Wholesale
 
 
858


858
 
        1,143       7       1,150  
   
$
3,337
 
 
$
358
 
 
$
3,695
 
      $ 3,777     $ 330     $ 4,107  
 
(1)   Excludes loans less than 30 days past due as they are not generally representative of the borrowers’ ability to meet their payment obligations.
(2)   Amounts presented may include loans past due as a result of administrative processes, such as mortgage loans on which payments are restrained pending payout due to sale or refinancing. Past due loans arising from administrative processes are not representative of the borrowers’ ability to meet their payment obligations.
 
Note 6
 
Deposits
 
       As at  
   
April 30, 2026
        October 31, 2025  
(Millions of Canadian dollars)  
Demand
(1)
   
Notice
(2)
   
Term
(3)
   
Total
         Demand (1)     Notice (2)     Term (3)     Total  
Personal
 
$
232,628
 
 
$
61,467
 
 
$
238,641
 
 
$
532,736
 
    $ 228,282     $ 56,988     $ 244,470     $ 529,740  
Business and government
 
 
421,394


19,010


544,586


984,990
 
      431,239       20,274       494,801       946,314  
Bank
 
 
13,415


50,405


63,820
 
        13,488             26,074       39,562  
   
$
667,437
 
 
$
80,477
 
 
$
833,632
 
 
$
1,581,546
 
      $ 673,009     $ 77,262     $ 765,345     $ 1,515,616  
Non-interest-bearing
(4)
                 
Canada
 
$
164,246
 
 
$
10,339
 
 
$
373
 
 
$
174,958
 
    $ 158,771     $ 9,469     $ 292     $ 168,532  
United States
 
 
36,634


36,634
 
      38,009                   38,009  
Europe
(5)
 
 
2


2
 
      5                   5  
Other International
 
 
8,565


8,565
 
      8,133                   8,133  
Interest-bearing
(4)
                 
Canada
 
 
401,050


18,385


587,709


1,007,144
 
      392,120       16,417       591,636       1,000,173  
United States
 
 
44,310


50,998


97,780


193,088
 
      63,745       50,497       73,147       187,389  
Europe
(5)
 
 
6,454


684


115,169


122,307
 
      6,354       742       76,972       84,068  
Other International
 
 
6,176


71


32,601


38,848
 
        5,872       137       23,298       29,307  
   
$
667,437
 
 
$
80,477
 
 
$
833,632
 
 
$
1,581,546
 
      $ 673,009     $ 77,262     $ 765,345     $ 1,515,616  
 
(1)
Demand deposits are deposits for which we do not have the right to require notice of withdrawal, which include both savings and chequing accounts.
(2)
Notice deposits are deposits for which we can legally require notice of withdrawal. These deposits are primarily savings accounts.
(3)
Term deposits are deposits payable on a fixed date, and include term deposits, guaranteed investment certificates and similar instruments.
(4)
The geographical splits of the deposits are based on the point of origin of the deposits and where the revenue is recognized. As at April 30, 2026, deposits denominated in U.S. dollars, British pounds, Euro and other foreign currencies were $590
 billion,
$57
 billion,
$89
billion and
$43
 billion,
respectively (October 31, 2025 – $570 billion, $42 billion, $76 billion and $36 billion, respectively).
(5)
Europe includes the United Kingdom and the Channel Islands.
Contractual maturities of term deposits
(1)
 
     As at   
(Millions of Canadian dollars)
 
April 30
2026
   
October 31
2025
 
Within 1 year:
   
less than 3 months
 
$
238,545
 
  $ 203,075  
3 to 6 months
 
 
117,451
 
    118,734  
6 to 12 months
 
 
206,021
 
    172,583  
1 to 2 years
 
 
80,419
 
    87,550  
2 to 3 years
 
 
53,714
 
    58,170  
3 to 4 years
 
 
30,227
 
    33,158  
4 to 5 years
 
 
32,605
 
    24,047  
Over 5 years
 
 
74,650
 
    68,028  
   
$
833,632
 
  $ 765,345  
 
(1)   The aggregate amount of term deposits in denominations of one hundred thousand dollars or more is $779
 billion (
October 31, 2025 – $704 billion).

Table of Contents
68   
Royal Bank of Canada
  Second Quarter 2026

Note 7
 
Insurance and reinsurance
Insurance service and insurance investment results
The following table provides the composition of Insurance service result and Insurance investment result for insurance contracts issued and reinsurance contracts held.
 
     For the three months ended          For the six months ended  
(Millions of Canadian dollars)
 
April 30
2026
   
April 30
2025
        
April 30
2026
   
April 30
2025
 
Insurance service result
         
Insurance revenue
 
$
1,386
 
 
$
1,331
 
   
$
2,740
    $ 2,739  
Insurance service expense
 
 
(1,130
)
 
 
(1,092
)
   
 
(2,235
)
    (2,216
Net income (expense) from reinsurance contracts held
 
 
(39
)
 
 
(15
)
     
 
(48
)
    (13
   
$
217
 
 
$
224
 
     
$
457
 
  $ 510  
Insurance investment result
         
Net investment income
 
$
34
 
 
$
255
 
   
$
182
 
  $ 625  
Insurance finance income (expense)
 
 
56


(206
)
   
 
(39
)
    (506
Reinsurance finance income (expense)
 
 
2


29


8
 
    41  
   
$
92
 
 
$
78
 
     
$
151
    $ 160  
Insurance service and insurance investment results
 
$
309
 
 
$
302
 
   
$
608
    $ 670  
                           
Note 8
 
Employee benefits – Pension and other post-employment benefits
We sponsor a number of programs that provide pension and post-employment benefits to eligible employees. The following tables present the composition of our pension and other post-employment benefit expense and remeasurements recorded in OCI related to our material pension and other post-employment benefit plans worldwide:
Pension and other post-employment benefit expense
 
     For the three months ended  
         Pension plans             
Other post-employment benefit plans
 
(Millions of Canadian dollars)
 
April 30
2026
   
April 30
2025
        
April 30
2026
   
April 30
2025
 
Current service costs
 
$
50
 
  $ 52      
$
9
 
  $ 8  
Past service costs


    49        


Net interest expense (income)
 
 
(45
)
    (41 )    
 
19
 
    20  
Remeasurements of other long-term benefits


(2
)
    3  
Administrative expense
 
 
6
 
    5        


Defined benefit pension expense
 
 
11
 
    65      
 
26
 
    31  
Defined contribution pension expense
 
 
141
 
    131        


$
152
 
  $ 196        
$
26
 
  $ 31  
 
     For the six months ended  
         Pension plans             
Other post-employment benefit plans
 
(Millions of Canadian dollars)
 
April 30
2026
   
April 30
2025
        
April 30
2026
   
April 30
2025
 
Current service costs
 
$
100
 
  $ 104      
$
18
 
  $ 16  
Past service costs


    49      


Net interest expense (income)
 
 
(89
)
    (81 )    
 
39
 
    39  
Remeasurements of other long-term benefits


(5
)
    5  
Administrative expense
 
 
11
 
    11        


Defined benefit pension expense
 
 
22
 
    83      
 
52
 
    60  
Defined contribution pension expense
 
 
324
 
    288        


$
346
 
  $ 371        
$
52
 
  $ 60  

Table of Contents
Royal Bank of Canada
  Second Quarter 2026   69

Pension and other post-employment benefit remeasurements
(1)
 
    
For
the three months ended
 
      Defined benefit pension plans          
Other post-employment benefit plans
 
(Millions of Canadian dollars)
 
April 30
2026
   
April 30
2025
        
April 30
2026
   
April 30
2025
 
Actuarial (gains) losses:
         
Changes in financial assumptions
(2)
 
$
(345
)
  $ (526 )    
$
(31
)
  $ (48
Experience adjustments
 
 
1
 
    (1 )    
 
(3
)
    (2
Return on plan assets (excluding interest based on discount rate)
 
 
259
 
    561        


$
(85
)
  $ 34        
$
(34
)
  $ (50
 
     For the six months ended  
      Defined benefit pension plans          
Other post-employment benefit plans
 
(Millions of Canadian dollars)
 
April 30
2026
   
April 30
2025
        
April 30
2026
   
April 30
2025
 
Actuarial (gains) losses:
         
Changes in financial assumptions
(2)
 
$
(660
)
  $ (183 )    
$
(47
)
  $ (14
Experience adjustments
 
 
(1
)
    (1 )    
 
(4
)
    (2
Return on plan assets (excluding interest based on discount rate)
 
 
363
 
    132        


$
(298
)
  $ (52 )      
$
(51
)
  $ (16
 
(1)
Market-based assumptions, including Changes in financial assumptions and Return on plan assets, are reviewed on a quarterly basis. All other assumptions are updated during our annual review of plan assumptions.
(2)
Changes in financial assumptions in our defined benefit pension plans primarily relate to changes in discount rates.
 
Note 9
 
Income taxes
Tax examinations and assessments
During the second quarter of 2026, we received proposal letters (the Proposals) from the Canada Revenue Agency (CRA) in respect of the 2021 taxation year, which suggested that Royal Bank of Canada owes additional taxes of approximately
$444
million as the CRA denied the deductibility of certain dividends. This amount represents the maximum additional taxes owing for that year. The Proposals are consistent with the previously received reassessments as described in Note 21 of our audited 2025 Annual Consolidated Financial Statements. It is possible that the CRA will reassess us for significant additional income taxes for subsequent years on the same basis. In all cases, we are confident that our tax filing position was appropriate and intend to defend ourselves vigorously.
Note 10
 
Significant capital and funding transactions
Preferred shares and other equity instruments
On November 24, 2025, we redeemed all 12 million of our issued and outstanding Non-Cumulative 5-Year Rate Reset First Preferred Shares Series BF at a redemption price of $25.00 per share.
On December 8, 2025, we redeemed all 6 million of our issued and outstanding Non-Cumulative Fixed Rate First Preferred Shares Series BH and all 6 million of our issued and outstanding Non-Cumulative Fixed Rate First Preferred Shares Series BI at a redemption price of $25.00 per share.
On January 24, 2026, we redeemed all 1.25 million of our issued and outstanding Non-Cumulative 5-Year Fixed Rate Reset First Preferred Shares Series BR (Series BR) at a redemption price of $1,000.00 per share. As a result of the redemption of Series BR, we automatically redeemed all $1,250 million of our outstanding Limited Recourse Capital Notes (LRCN) Series 2 on the same date for 100% of their principal amount plus accrued interest to, but excluding, the redemption date.
On January 30, 2026, we issued US$1,000 million of LRCN Series 8 with recourse limited to assets (Trust Assets) held by a third-party trustee in a consolidated trust (Limited Recourse Trust). The Trust Assets consist of US$1,000 million of our Non-Cumulative 5-Year Fixed Rate Reset First Preferred Shares Series CA (Series CA), issued concurrently with LRCN Series 8 at a price of US$1,000 per Series CA preferred share.
The price per LRCN Series 8 note is US$1,000 and will bear interest paid quarterly at a fixed rate of 6.50% per annum until May 24, 2033 and thereafter at a rate per annum, reset every fifth year, equal to the prevailing 5-Year U.S. Treasury Rate plus 2.45% until maturity on May 24, 2086.
In the event of
(i) non-payment
of interest on any interest payment date,
(ii) non-payment
of the redemption price in case of a redemption of LRCN Series 8, (iii)
non-payment
of principal at the maturity of LRCN Series 8, or (iv) an event of default on the notes, noteholders will have recourse only to the Trust Assets and each noteholder will be entitled to receive its pro rata share of the Trust Assets. In such an event, the delivery of the Trust Assets will represent the full and complete extinguishment of our obligations under LRCN Series 8.
LRCN Series 8 are redeemable on or prior to maturity to the extent we redeem Series CA preferred shares on certain redemption dates as set out in the terms of Series CA preferred shares and subject to the consent and approval of OSFI.

Table of Contents
70   
Royal Bank of Canada
  Second Quarter 2026

The terms of Series CA preferred shares and LRCN Series 8 include
Non-Viability
Contingent Capital (NVCC) provisions necessary for them to qualify as Tier 1 regulatory capital under Basel III. NVCC provisions require the conversion of the instrument into a variable number of common shares in the event that OSFI deems the Bank
non-viable
or a federal or provincial government in Canada publicly announces that the Bank has accepted or agreed to accept a capital injection. In such an event, LRCN Series 8 will be automatically redeemed and the redemption price will be satisfied by the delivery of the Trust Assets, which will consist of common shares pursuant to an automatic conversion of Series CA preferred shares. The terms of Series CA preferred shares include an automatic conversion formula with a conversion price based on the greater of: (i) a floor price
 
of $5.00 (subject to adjustment in certain circumstances), and (ii) the current market price of our common shares based on the volume weighted average trading price of our common shares on the Toronto Stock Exchange. The number of common shares issued in respect of each Series CA preferred share will be determined by dividing the share value of Series CA preferred shares (including declared and unpaid dividends) by the conversion price. The number of common shares delivered to each noteholder will be based on such noteholder’s pro rata interest in the Trust Assets.
LRCN Series 8 are compound instruments with both equity and liability features as payments of interest and principal in cash are made at our discretion. The
non-payment
of interest and principal in cash does not constitute an event of default and will trigger delivery of Series CA preferred shares. The liability component of the notes has a nominal value and, as a result, the full proceeds received have been presented as equity.
Subordinated debentures
On January 27, 2026, all US$1,500 million of our outstanding NVCC 4.65% subordinated debentures matured. The principal amount plus accrued interest were paid to noteholders on the maturity
date.
On April 29, 2026, we issued $1,750 million of NVCC subordinated debentures. The notes bear interest at a fixed rate of
4.14% per annum until May 5, 2031, and at the Daily Compounded Canadian Overnight Repo Rate Average plus 1.23% thereafter until their maturity on May 5, 2036.
Common shares issued
(1)
 
     For the three months ended  
   
April 30, 2026
        April 30, 2025  
(Millions of Canadian dollars, except number of shares)  
Number of
shares
(thousands)
   
Amount
         Number of
shares
(thousands)
    Amount  
Issued in connection with share-based compensation plans
(2)
 
 
248
 
 
$
    26
 
      158     $    14  
Purchased for cancellation
(3)
 
 
(7,386
)
 
 
(110
)
        (3,013     (45
   
 
(7,138
)
 
 
$
(84
)
        (2,855   $ (31
 
     For the six months ended  
   
April 30, 2026
        April 30, 2025  
(Millions of Canadian dollars, except number of shares)  
Number of
shares
(thousands)
   
Amount
         Number of
shares
(thousands)
    Amount  
Issued in connection with share-based compensation plans
(2)
 
 
652
 
 
$
70
 
      374     $    36  
Purchased for cancellation
(3)
 
 
(11,611
)
 
 
  (173
)
        (4,955     (74
   
 
(10,959
)
 
 
$
(103
)
        (4,581   $ (38
 
(1)   The requirements of our dividend reinvestment plan (DRIP) are satisfied through either open market share purchases or shares issued from treasury. During the three and six months ended April 30, 2026 and April 30, 2025, the requirements of our DRIP were satisfied through open market share purchases.
(2)
Amounts include cash received for stock options exercised during the period and the fair value adjustment to stock options.
(3)  
During the three months ended April 30, 2026, under the normal course issuer bid (NCIB) we purchased for cancellation common shares at a total fair value of $1,673 million (average cost of $226.50 per share), with a book value of $110 million (book value of $14.93 per share). During the six months ended April 30, 2026, under the NCIB we purchased for cancellation common shares at a total fair value of $2,633 million (average cost of $226.79 per share), with a book value of $173 million (book value of $14.92 per share). During the three months ended April 30, 2025, under the NCIB we purchased for cancellation common shares at a total fair value of $488 million (average cost of $162.10 per share), with a book value of $45 million (book value of $14.87 per share). During the six months ended April 30, 2025, under the NCIB we purchased for cancellation common shares at a total fair value of $826 million (average cost of $166.76 per share), with a book value of $74 million (book value of $14.86 per share).

Table of Contents
Royal Bank of Canada
  Second Quarter 2026   71

Note 11
 
Earnings per share


For the three months ended


For the six months ended
 
(Millions of Canadian dollars, except share and per share amounts)
 
April 30
2026
 
 
April 30
2025


April 30
2026
 
 
April 30
2025
 
Basic earnings per share


Net income
 
$
 
 
5,509
 
  $ 4,390      
$
11,294
 
  $ 9,521  
Dividends on preferred shares and distributions on other equity instruments
 
 
(135
)
    (112    
 
(276
)
    (230
Net income attributable to
non-controlling
interests
 
 
(2
)
    (4      
 
(3
)
    (6
Net income available to common shareholders
 
$
5,372
 
  $ 4,274        
$
11,015
 
  $ 9,285  
Weighted average number of common shares (in thousands)
 
 
1,393,332
 
    1,411,362      
 
1,396,000
 
    1,412,671  
Basic earnings per share (in dollars)
 
$
3.86
 
  $ 3.03        
$
 
7.89
 
  $ 6.57  
Diluted earnings per share
         
Net income available to common shareholders
 
$
5,372
 
  $ 4,274        
$
    11,015
 
  $ 9,285  
Weighted average number of common shares (in thousands)
 
 
1,393,332
 
    1,411,362      
 
1,396,000
 
    1,412,671  
Stock options
(1)
 
 
3,216
 
    2,155        
 
3,262
 
    2,366  
Average number of diluted common shares (in thousands)
 
 
1,396,548
 
    1,413,517      
 
1,399,262
 
    1,415,037  
Diluted earnings per share (in dollars)
 
$
3.85
 
  $ 3.02        
$
7.87
 
  $ 6.56  
 
(1)   The dilutive effect of stock options was calculated using the treasury stock method. When the exercise price of options outstanding is greater than the average market price of our common shares, the options are excluded from the calculation of diluted earnings per share. For the three months ended April 30, 2026, no outstanding options were excluded from the calculation of diluted earnings per share. For the three months ended April 30, 2025, an average of 917,151 outstanding options with an average exercise price of $177.97 were excluded from the calculation of diluted earnings per share. For the six months ended April 30, 2026, an average of 583,179 outstanding options with an average exercise price of $230.00 were excluded from the calculation of diluted earnings per share. For the six months ended April 30, 2025, an average of 684,687 outstanding options with an average exercise price of $177.97 were excluded from the calculation of diluted earnings per share.
 
Note 12
 
Legal and regulatory matters
We are a large global institution that is subject to many different complex legal and regulatory requirements that continue to evolve. We are and have been subject to a variety of legal proceedings, including civil claims and lawsuits, regulatory examinations, investigations, audits and requests for information by various governmental regulatory agencies and law enforcement authorities in various jurisdictions. Some of these matters may involve novel legal theories and interpretations and may be advanced under criminal as well as civil statutes, and some proceedings could result in the imposition of civil, regulatory enforcement or criminal penalties. We review the status of all proceedings on an ongoing basis and will exercise judgment in resolving them in such manner as we believe to be in our best interest. In many proceedings, it is inherently difficult to determine whether any loss is probable or
to
reliably estimate the amount of any loss. This is an area of significant judgment and uncertainty and the extent of our financial and other exposure to these proceedings after taking into account current provisions could be material to our results of operations in any particular period though we do not believe that the ultimate resolution of any such matter will have a material effect on our consolidated financial condition.
Our significant legal proceedings and regulatory matters are described in Note 24 of our audited 2025 Annual Consolidated Financial Statements and as updated below. Based on the facts currently known, except as may otherwise be noted, it is not possible at this time for us to predict the ultimate outcome of these proceedings or the timing of their resolution.
Royal Bank of Canada Trust Company (Bahamas) Limited proceedings
On February 4, 2026, the French Supreme Court upheld the aspects of the conviction (the Conviction) rendered on March 5, 2024 by the French Court of Appeal that impact Royal Bank of Canada Trust Company (Bahamas) Limited (RBC Bahamas), including RBC Bahamas’ joint and several liability, together with another
par
ty previously convicted of complicity in this matter (whose appeal was also dismissed by the French Supreme Court in its February 4, 2026 decision), for the allegedly unpaid inheritance taxes owing by certain persons (whose appeals were also dismissed in the same decision of the French Supreme Court), plus penalties and interest. Such aggregate amount will be determined in separate proceedings before the French tax courts, to which RBC Bahamas is not a party. As a result of the French Supreme Court’s decision, the Conviction became final and enforceable against RBC Bahamas.
Following the decision of the French Supreme Court, Royal Bank of Canada continues to rely on the previously disclosed exemption granted by the U.S. Department of Labor that allows Royal Bank of Canada and its current and future affiliates to continue to qualify for the Qualified Professional Asset Manager exemption under the Employee Retirement Income Security Act through March 4, 2030, notwithstanding the Conviction.

Table of Contents
72   
Royal Bank of Canada
  Second Quarter 2026

Note 13
 
Results by business segment
Composition of business segments
For management purposes, based on the products and services offered, we are organized into
five
business segments: Personal Banking, Commercial Banking, Wealth Management, Insurance and Capital Markets.
 
    
For the three months ended April 30, 2026
 
(Millions of Canadian dollars)  
Personal
Banking
   
Commercial
Banking
   
Wealth
Management
   
Insurance
   
Capital
Markets 
(1)
   
Corporate
Support 
(1)
   
Total
 
Net interest income
(2)
 
$
3,715
 
 
$
1,844
 
 
$
1,429
 
 
$


$
1,315
 
 
$
203
 
 
$
8,506
 
Non-interest income
 
 
1,334


315


4,525


345


2,628


(200
)
 
 
8,947
 
Total revenue
 
 
5,049


2,159


5,954


345


3,943


3


17,453
 
Provision for credit losses
 
 
492


247


55


117


1


912
 
Non-interest expense
 
 
1,987


730


4,379


75


2,097


169


9,437
 
Income (loss) before income taxes
 
 
2,570


1,182


1,520


270


1,729


(167
)
 
 
7,104
 
Income taxes (recoveries)
 
 
700


328


335


52


245


(65
)
 
 
1,595
 
Net income
 
$
1,870
 
 
$
854
 
 
$
1,185
 
 
$
218
 
 
$
1,484
 
 
$
(102
)
 
$
5,509
 
Non-interest expense includes:
             
Depreciation and amortization
 
$
271
 
 
$
26
 
 
$
264
 
 
$
9
 
 
$
147
 
 
$
2
 
 
$
719
 
             
     For the three months ended April 30, 2025  
(Millions of Canadian dollars)  
Personal
Banking
   
Commercial
Banking
   
Wealth
Management
    Insurance    
Capital
Markets (1)
   
Corporate
Support (1)
    Total  
Net interest income
(2)
  $ 3,519     $ 1,734     $ 1,301     $     $ 1,275     $ 227     $ 8,056  
Non-interest income
    1,286       328       4,096       338       2,026       (458     7,616  
Total revenue
    4,805       2,062       5,397       338       3,301       (231     15,672  
Provision for credit losses
    654       539       86             146       (1     1,424  
Non-interest expense
    1,952       698       4,098       80       1,885       17       8,730  
Income (loss) before income taxes
    2,199       825       1,213       258       1,270       (247     5,518  
Income taxes (recoveries)
    597       228       284       47       68       (96     1,128  
Net income
  $ 1,602     $ 597     $ 929     $ 211     $ 1,202     $ (151   $ 4,390  
Non-interest expense includes:
             
Depreciation and amortization
  $ 271     $ 27     $ 318     $ 24     $ 137     $ 1     $ 778  
 
    
For the six months ended April 30, 2026
 
(Millions of Canadian dollars)  
Personal
Banking
   
Commercial
Banking
   
Wealth
Management
   
Insurance
   
Capital
Markets 
(1)
   
Corporate
Support 
(1)
   
Total
 
Net interest income
(2)
 
$
7,546
 
 
$
3,739
 
 
$
2,883
 
 
$
 
 
$
2,533
 
 
$
390
 
 
$
17,091
 
Non-interest income
 
 
2,741


627


9,155


683


5,428


(312
)
 
 
18,322
 
Total revenue
 
 
10,287


4,366


12,038


683


7,961


78


35,413
 
Provision for credit losses
 
 
1,023


533


73


373


2,002
 
Non-interest expense
 
 
4,007


1,455


8,763


153


4,216


306


18,900
 
Income (loss) before income taxes
 
 
5,257


2,378


3,202


530


3,372


(228
)
 
 
14,511
 
Income taxes (recoveries)
 
 
1,425


661


722


99


410


(100
)
 
 
3,217
 
Net income
 
$
3,832
 
 
$
1,717
 
 
$
2,480
 
 
$
431
 
 
$
2,962
 
 
$
(128
)
 
$
11,294
 
Non-interest expense includes:
             
Depreciation and amortization
 
$
542
 
 
$
52
 
 
$
519
 
 
$
21
 
 
$
290
 
 
$
3
 
 
$
1,427
 
             
     For the six months ended April 30, 2025  
(Millions of Canadian dollars)  
Personal
Banking
   
Commercial
Banking
   
Wealth
Management
    Insurance    
Capital
Markets (1)
   
Corporate
Support (1)
    Total  
Net interest income
(2)
  $ 7,024     $ 3,530     $ 2,695     $     $ 2,193     $ 562     $ 16,004  
Non-interest income
    2,592       659       8,270       744       4,864       (722     16,407  
Total revenue
    9,616       4,189       10,965       744       7,057       (160     32,411  
Provision for credit losses
    1,142       878       167             288       (1     2,474  
Non-interest expense
    3,967       1,408       8,302       167       3,926       216       17,986  
Income (loss) before income taxes
    4,507       1,903       2,496       577       2,843       (375     11,951  
Income taxes (recoveries)
    1,227       529       587       94       209       (216     2,430  
Net income
  $ 3,280     $ 1,374     $ 1,909     $ 483     $ 2,634     $ (159   $ 9,521  
Non-interest expense includes:
             
Depreciation and amortization
  $ 545     $ 53     $ 635     $ 22     $ 281     $ —      $ 1,536  
 
(1)
 
Taxable equivalent basis.
(2)   Interest revenue is reported net of Interest expense as we rely primarily on Net interest income as a performance measure.

Table of Contents
Royal Bank of Canada
  Second Quarter 2026   73

Total assets and total liabilities by business segment


As at April 30, 2026
 
(Millions of Canadian dollars)
 
Personal
Banking
 
 
Commercial
Banking
 
 
Wealth
Management
 
 
Insurance
 
 
Capital
Markets
 
 
Corporate
Support
 
 
Total
 
Total assets
 
$
583,830
 
 
$
198,930
 
 
$
195,249
 
 
$
32,734
 
 
$
1,281,230
 
 
$
104,107
 
 
$
2,396,080
 
Total liabilities
 
 
583,822


198,928


193,699


32,562


1,280,592


(34,296
)
 
 
2,255,307
 
                                           
     As at October 31, 2025  
(Millions of Canadian dollars)  
Personal
Banking
   
Commercial
Banking
   
Wealth
Management
    Insurance    
Capital
Markets
   
Corporate
Support
    Total  
Total assets
  $ 574,456     $ 196,254     $ 196,129     $ 32,405     $ 1,223,853     $ 101,909     $ 2,325,006  
Total liabilities
    574,462       196,252       194,689       32,234       1,223,212       (34,994     2,185,855  
                                           
 
Note 14
 
Capital management
Regulatory capital and capital ratios
OSFI formally establishes risk-based capital and leverage minimums and Total Loss Absorbing Capacity (TLAC) ratios for deposit-taking institutions in Canada. During the six months ended April 30, 2026, we complied with all applicable capital, leverage and TLAC requirements, including the Domestic Stability Buffer, imposed by OSFI.
 
     As at  
(Millions of Canadian dollars, except percentage amounts)
 
April 30
2026
   
October 31
2025
 
Capital
(1)
   
Common Equity Tier 1 (CET1) capital
 
$
101,313
 
  $ 98,748  
Tier 1 capital
 
 
112,453
 
    110,393  
Total capital
 
 
126,286
 
    122,399  
Risk-weighted assets (RWA) used in calculation of capital ratios
(1)
   
Credit risk
 
$
606,835
 
  $ 590,306  
Market risk
 
 
37,511
 
    41,506  
Operational risk
 
 
104,244
 
    98,413  
Total RWA
 
$
748,590
 
  $ 730,225  
Capital ratios and Leverage ratio
(1)
   
CET1 ratio
 
 
13.5%
      13.5%  
Tier 1 capital ratio
 
 
15.0%
      15.1%  
Total capital ratio
 
 
16.9%
      16.8%  
Leverage ratio
 
 
4.3%
      4.4%  
Leverage ratio exposure
 
$
2,608,763
 
  $ 2,491,090  
TLAC available and ratios
(2)
   
TLAC available
 
$
   235,104
 
  $ 230,385  
TLAC ratio
 
 
31.4%
      31.5%
TLAC leverage ratio
 
 
9.0%
      9.2%
 
(1)   Capital, RWA and capital ratios are calculated using OSFI’s Capital Adequacy Requirements (CAR) guideline and the Leverage ratio is calculated using OSFI’s Leverage Requirements (LR) guideline. Both the CAR guideline and LR guideline are based on the Basel III framework.
(2)   TLAC available and TLAC ratios are calculated using OSFI’s TLAC guideline. The TLAC standard is applied at the resolution entity level which for us is deemed to be Royal Bank of Canada and its subsidiaries. A resolution entity and its subsidiaries are collectively called a resolution group. The TLAC ratio and TLAC leverage ratio are calculated using TLAC available as a percentage of total RWA and leverage exposure, respectively.