Loans and allowance for credit losses
Apr. 30, 2026
Note 5 |
Loans and allowance for credit losses |
Allowance for credit losses
For the three months ended |
||||||||||||||||||||||||||||||||||||||||||
April 30, 2026 |
April 30, 2025 |
|||||||||||||||||||||||||||||||||||||||||
(Millions of Canadian dollars) |
Balance at beginning of period |
Provision for credit losses |
Net write-offs |
Exchange rate and other |
Balance at end of period |
Balance at beginning of period |
Provision for credit losses |
Net write-offs |
Exchange rate and other |
Balance at end of period |
||||||||||||||||||||||||||||||||
Retail |
||||||||||||||||||||||||||||||||||||||||||
Residential mortgages |
$ |
845 |
$ |
82 |
$ |
(3 |
) |
$ |
(20 |
) |
$ |
904 |
$ |
636 |
$ |
121 |
$ |
(2 |
) |
$ |
(25 |
) |
$ |
730 |
||||||||||||||||||
Personal |
1,659 |
162 |
(207 |
) |
(7 |
) |
1,607 |
1,534 |
288 |
(178 |
) |
(11 |
) |
1,633 |
||||||||||||||||||||||||||||
Credit cards |
1,348 |
253 |
(250 |
) |
– |
1,351 |
1,264 |
257 |
(199 |
) |
(2 |
) |
1,320 |
|||||||||||||||||||||||||||||
Small business |
362 |
(1 |
) |
(25 |
) |
(7 |
) |
329 |
289 |
88 |
(28 |
) |
(6 |
) |
343 |
|||||||||||||||||||||||||||
Wholesale |
3,538 |
421 |
(246 |
) |
(100 |
) |
3,613 |
3,210 |
666 |
(270 |
) |
(151 |
) |
3,455 |
||||||||||||||||||||||||||||
$ |
7,752 |
$ |
917 |
$ |
(731) |
$ |
(134) |
$ |
7,804 |
$ |
6,933 |
$ |
1,420 |
$ |
(677 |
) |
$ |
(195 |
) |
$ |
7,481 |
|||||||||||||||||||||
Presented as: |
||||||||||||||||||||||||||||||||||||||||||
Allowance for loan losses |
$ |
7,401 |
$ |
7,521 |
$ |
6,600 |
$ |
7,125 |
||||||||||||||||||||||||||||||||||
Other liabilities – Provisions |
350 |
282 |
328 |
353 |
||||||||||||||||||||||||||||||||||||||
Other components of equity |
1 |
1 |
5 |
3 |
||||||||||||||||||||||||||||||||||||||
For the six months ended |
||||||||||||||||||||||||||||||||||||||||||
April 30, 2026 |
April 30, 2025 |
|||||||||||||||||||||||||||||||||||||||||
(Millions of Canadian dollars) |
Balance at beginning of period |
Provision for credit losses |
Net write-offs |
Exchange rate and other |
Balance at end of period |
Balance at beginning of period |
Provision for credit losses |
Net write-offs |
Exchange rate and other |
Balance at end of period |
||||||||||||||||||||||||||||||||
Retail |
||||||||||||||||||||||||||||||||||||||||||
Residential mortgages |
$ |
794 |
$ |
159 |
$ |
(6 |
) |
$ |
(43 |
) |
$ |
904 |
$ |
572 |
$ |
194 |
$ |
(4 |
) |
$ |
(32 |
) |
$ |
730 |
||||||||||||||||||
Personal |
1,639 |
391 |
(408 |
) |
(15 |
) |
1,607 |
1,482 |
535 |
(367 |
) |
(17 |
) |
1,633 |
||||||||||||||||||||||||||||
Credit cards |
1,356 |
483 |
(486 |
) |
(2 |
) |
1,351 |
1,233 |
480 |
(392 |
) |
(1 |
) |
1,320 |
||||||||||||||||||||||||||||
Small business |
351 |
42 |
(52 |
) |
(12 |
) |
329 |
272 |
134 |
(52 |
) |
(11 |
) |
343 |
||||||||||||||||||||||||||||
Wholesale |
3,319 |
938 |
(413 |
) |
(231 |
) |
3,613 |
2,793 |
1,130 |
(349 |
) |
(119 |
) |
3,455 |
||||||||||||||||||||||||||||
$ |
7,459 |
$ |
2,013 |
$ |
(1,365) |
$ |
(303) |
$ |
7,804 |
$ |
6,352 |
$ |
2,473 |
$ |
(1,164 |
) |
$ |
(180 |
) |
$ |
7,481 |
|||||||||||||||||||||
Presented as: |
||||||||||||||||||||||||||||||||||||||||||
Allowance for loan losses |
$ |
7,093 |
$ |
7,521 |
$ |
6,037 |
$ |
7,125 |
||||||||||||||||||||||||||||||||||
Other liabilities – Provisions |
365 |
282 |
311 |
353 |
||||||||||||||||||||||||||||||||||||||
Other components of equity |
1 |
1 |
4 |
3 |
||||||||||||||||||||||||||||||||||||||
The following table reconciles the opening and closing allowance for each major product of loans and commitments as determined by our modelled, scenario-weighted allowance and the application of expert credit judgment as applicable. Reconciling items include the following:
| • | Model changes, as applicable, which generally comprise the impact of significant changes to the quantitative models used to estimate expected credit losses and any staging impacts that may arise. |
| • | Transfers between stages, which are presumed to occur before any corresponding remeasurements of the allowance. |
| • | Originations, which reflect the allowance related to assets newly recognized during the period, including those assets that were derecognized following a modification of terms. |
| • | Maturities, which reflect the allowance related to assets derecognized during the period without a credit loss being incurred, including those assets that were derecognized following a modification of terms. |
| • | Changes in risk, parameters and exposures, which comprise the impact of changes in model inputs or assumptions, including changes in forward-looking macroeconomic conditions; partial repayments and additional draws on existing facilities; changes in the measurement following a transfer between stages; and unwinding of the time value discount due to the passage of time in Stage 1 and Stage 2. |
Allowance for credit losses – Retail and wholesale loans
For the three months ended |
||||||||||||||||||||||||||||||||||||||
April 30, 2026 |
April 30, 2025 |
|||||||||||||||||||||||||||||||||||||
Performing |
Impaired |
Performing |
Impaired |
|||||||||||||||||||||||||||||||||||
(Millions of Canadian dollars) |
Stage 1 |
Stage 2 |
Stage 3 |
Total |
Stage 1 |
Stage 2 |
Stage 3 |
Total |
||||||||||||||||||||||||||||||
Residential mortgages |
||||||||||||||||||||||||||||||||||||||
Balance at beginning of period |
$ |
272 |
$ |
215 |
$ |
358 |
$ |
845 |
$ | 218 | $ | 158 | $ | 260 | $ | 636 | ||||||||||||||||||||||
Provision for credit losses |
||||||||||||||||||||||||||||||||||||||
Model changes |
(88 |
) |
131 |
– |
43 |
– | – | – | – | |||||||||||||||||||||||||||||
Transfers to stage 1 |
110 |
(107 |
) |
(3 |
) |
– |
34 | (34 | ) | – | – | |||||||||||||||||||||||||||
Transfers to stage 2 |
(10 |
) |
10 |
– |
– |
(14 | ) | 18 | (4 | ) | – | |||||||||||||||||||||||||||
Transfers to stage 3 |
(1 |
) |
(21 |
) |
22 |
– |
(1 | ) | (10 | ) | 11 | – | ||||||||||||||||||||||||||
Originations |
14 |
– |
– |
14 |
24 | – | – | 24 | ||||||||||||||||||||||||||||||
Maturities |
(7 |
) |
(18 |
) |
– |
(25 |
) |
(5 | ) | (8 | ) | – | (13 | ) | ||||||||||||||||||||||||
Changes in risk, parameters and exposures |
(76 |
) |
99 |
27 |
50 |
4 | 89 | 17 | 110 | |||||||||||||||||||||||||||||
Write-offs |
– |
– |
(6 |
) |
(6 |
) |
– | – | (5 | ) | (5 | ) | ||||||||||||||||||||||||||
Recoveries |
– |
– |
3 |
3 |
– | – | 3 | 3 | ||||||||||||||||||||||||||||||
Exchange rate and other |
1 |
(1 |
) |
(20 |
) |
(20 |
) |
(1 | ) | (4 | ) | (20 | ) | (25 | ) | |||||||||||||||||||||||
Balance at end of period |
$ |
215 |
$ |
308 |
$ |
381 |
$ |
904 |
$ | 259 | $ | 209 | $ | 262 | $ | 730 | ||||||||||||||||||||||
Personal |
||||||||||||||||||||||||||||||||||||||
Balance at beginning of period |
$ |
283 |
$ |
1,134 |
$ |
242 |
$ |
1,659 |
$ | 305 | $ | 1,009 | $ | 220 | $ | 1,534 | ||||||||||||||||||||||
Provision for credit losses |
||||||||||||||||||||||||||||||||||||||
Model changes |
84 |
(138 |
) |
– |
(54 |
) |
– | – | – | – | ||||||||||||||||||||||||||||
Transfers to stage 1 |
156 |
(156 |
) |
– |
– |
141 | (140 | ) | (1 | ) | – | |||||||||||||||||||||||||||
Transfers to stage 2 |
(22 |
) |
22 |
– |
– |
(32 | ) | 32 | – | – | ||||||||||||||||||||||||||||
Transfers to stage 3 |
(1 |
) |
(35 |
) |
36 |
– |
(1 | ) | (40 | ) | 41 | – | ||||||||||||||||||||||||||
Originations |
55 |
– |
– |
55 |
25 | – | – | 25 | ||||||||||||||||||||||||||||||
Maturities |
(8 |
) |
(57 |
) |
– |
(65 |
) |
(13 | ) | (53 | ) | – | (66 | ) | ||||||||||||||||||||||||
Changes in risk, parameters and exposures |
(208 |
) |
267 |
167 |
226 |
(122 | ) | 304 | 147 | 329 | ||||||||||||||||||||||||||||
Write-offs |
– |
– |
(250 |
) |
(250 |
) |
– | – | (215 | ) | (215 | ) | ||||||||||||||||||||||||||
Recoveries |
– |
– |
43 |
43 |
– | – | 37 | 37 | ||||||||||||||||||||||||||||||
Exchange rate and other |
1 |
(1 |
) |
(7 |
) |
(7 |
) |
1 | (2 | ) | (10 | ) | (11 | ) | ||||||||||||||||||||||||
Balance at end of period |
$ |
340 |
$ |
1,036 |
$ |
231 |
$ |
1,607 |
$ | 304 | $ | 1,110 | $ | 219 | $ | 1,633 | ||||||||||||||||||||||
Credit cards |
||||||||||||||||||||||||||||||||||||||
Balance at beginning of period |
$ |
210 |
$ |
1,138 |
$ |
– |
$ |
1,348 |
$ | 206 | $ | 1,058 | $ | – | $ | 1,264 | ||||||||||||||||||||||
Provision for credit losses |
||||||||||||||||||||||||||||||||||||||
Transfers to stage 1 |
143 |
(143 |
) |
– |
– |
179 | (179 | ) | – | – | ||||||||||||||||||||||||||||
Transfers to stage 2 |
(26 |
) |
26 |
– |
– |
(28 | ) | 28 | – | – | ||||||||||||||||||||||||||||
Transfers to stage 3 |
(1 |
) |
(148 |
) |
149 |
– |
– | (146 | ) | 146 | – | |||||||||||||||||||||||||||
Originations |
4 |
– |
– |
4 |
3 | – | – | 3 | ||||||||||||||||||||||||||||||
Maturities |
(1 |
) |
(12 |
) |
– |
(13 |
) |
(1 | ) | (15 | ) | – | (16 | ) | ||||||||||||||||||||||||
Changes in risk, parameters and exposures |
(60 |
) |
221 |
101 |
262 |
(155 | ) | 373 | 52 | 270 | ||||||||||||||||||||||||||||
Write-offs |
– |
– |
(301 |
) |
(301 |
) |
– | – | (246 | ) | (246 | ) | ||||||||||||||||||||||||||
Recoveries |
– |
– |
51 |
51 |
– | – | 47 | 47 | ||||||||||||||||||||||||||||||
Exchange rate and other |
– |
– |
– |
– |
(2 | ) | (1 | ) | 1 | (2 | ) | |||||||||||||||||||||||||||
Balance at end of period |
$ |
269 |
$ |
1,082 |
$ |
– |
$ |
1,351 |
$ | 202 | $ | 1,118 | $ | – | $ | 1,320 | ||||||||||||||||||||||
Small business |
||||||||||||||||||||||||||||||||||||||
Balance at beginning of period |
$ |
101 |
$ |
113 |
$ |
148 |
$ |
362 |
$ | 80 | $ | 87 | $ | 122 | $ | 289 | ||||||||||||||||||||||
Provision for credit losses |
||||||||||||||||||||||||||||||||||||||
Transfers to stage 1 |
20 |
(20 |
) |
– |
– |
10 | (10 | ) | – | – | ||||||||||||||||||||||||||||
Transfers to stage 2 |
(8 |
) |
8 |
– |
– |
(7 | ) | 7 | – | – | ||||||||||||||||||||||||||||
Transfers to stage 3 |
(1 |
) |
(6 |
) |
7 |
– |
(1 | ) | (3 | ) | 4 | – | ||||||||||||||||||||||||||
Originations |
11 |
– |
– |
11 |
11 | – | – | 11 | ||||||||||||||||||||||||||||||
Maturities |
(8 |
) |
(11 |
) |
– |
(19 |
) |
(4 | ) | (6 | ) | – | (10 | ) | ||||||||||||||||||||||||
Changes in risk, parameters and exposures |
(18 |
) |
31 |
(6 |
) |
7 |
7 | 39 | 41 | 87 | ||||||||||||||||||||||||||||
Write-offs |
– |
– |
(31 |
) |
(31 |
) |
– | – | (31 | ) | (31 | ) | ||||||||||||||||||||||||||
Recoveries |
– |
– |
6 |
6 |
– | – | 3 | 3 | ||||||||||||||||||||||||||||||
Exchange rate and other |
– |
1 |
(8 |
) |
(7 |
) |
2 | – | (8 | ) | (6 | ) | ||||||||||||||||||||||||||
Balance at end of period |
$ |
97 |
$ |
116 |
$ |
116 |
$ |
329 |
$ | 98 | $ | 114 | $ | 131 | $ | 343 | ||||||||||||||||||||||
Wholesale |
||||||||||||||||||||||||||||||||||||||
Balance at beginning of period |
$ |
890 |
$ |
1,115 |
$ |
1,533 |
$ |
3,538 |
$ | 835 | $ | 992 | $ | 1,383 | $ | 3,210 | ||||||||||||||||||||||
Provision for credit losses |
||||||||||||||||||||||||||||||||||||||
Transfers to stage 1 |
51 |
(51 |
) |
– |
– |
44 | (43 | ) | (1 | ) | – | |||||||||||||||||||||||||||
Transfers to stage 2 |
(31 |
) |
31 |
– |
– |
(43 | ) | 43 | – | – | ||||||||||||||||||||||||||||
Transfers to stage 3 |
(4 |
) |
(45 |
) |
49 |
– |
(4 | ) | (71 | ) | 75 | – | ||||||||||||||||||||||||||
Originations |
139 |
– |
– |
139 |
188 | – | – | 188 | ||||||||||||||||||||||||||||||
Maturities |
(104 |
) |
(173 |
) |
– |
(277 |
) |
(117 | ) | (97 | ) | – | (214 | ) | ||||||||||||||||||||||||
Changes in risk, parameters and exposures |
(79 |
) |
288 |
350 |
559 |
59 | 309 | 324 | 692 | |||||||||||||||||||||||||||||
Write-offs |
– |
– |
(273 |
) |
(273 |
) |
– | – | (289 | ) | (289 | ) | ||||||||||||||||||||||||||
Recoveries |
– |
– |
27 |
27 |
– | – | 19 | 19 | ||||||||||||||||||||||||||||||
Exchange rate and other |
(2 |
) |
(1 |
) |
(97 |
) |
(100 |
) |
(16 | ) | (29 | ) | (106 | ) | (151 | ) | ||||||||||||||||||||||
Balance at end of period |
$ |
860 |
$ |
1,164 |
$ |
1,589 |
$ |
3,613 |
$ | 946 | $ | 1,104 | $ | 1,405 | $ | 3,455 | ||||||||||||||||||||||
For the six months ended |
||||||||||||||||||||||||||||||||||||||
April 30, 2026 |
April 30, 2025 |
|||||||||||||||||||||||||||||||||||||
Performing |
Impaired |
Performing |
Impaired |
|||||||||||||||||||||||||||||||||||
(Millions of Canadian dollars) |
Stage 1 |
Stage 2 |
Stage 3 |
Total |
Stage 1 |
Stage 2 |
Stage 3 |
Total |
||||||||||||||||||||||||||||||
Residential mortgages |
||||||||||||||||||||||||||||||||||||||
Balance at beginning of period |
$ |
276 |
$ |
204 |
$ |
314 |
$ |
794 |
$ | 215 | $ | 126 | $ | 231 | $ | 572 | ||||||||||||||||||||||
Provision for credit losses |
||||||||||||||||||||||||||||||||||||||
Model changes |
(88 |
) |
131 |
– |
43 |
– | – | – | – | |||||||||||||||||||||||||||||
Transfers to stage 1 |
154 |
(149 |
) |
(5 |
) |
– |
59 | (59 | ) | – | – | |||||||||||||||||||||||||||
Transfers to stage 2 |
(22 |
) |
23 |
(1 |
) |
– |
(18 | ) | 24 | (6 | ) | – | ||||||||||||||||||||||||||
Transfers to stage 3 |
(4 |
) |
(34 |
) |
38 |
– |
(2 | ) | (24 | ) | 26 | – | ||||||||||||||||||||||||||
Originations |
41 |
– |
– |
41 |
47 | – | – | 47 | ||||||||||||||||||||||||||||||
Maturities |
(15 |
) |
(27 |
) |
– |
(42 |
) |
(10 | ) | (14 | ) | – | (24 | ) | ||||||||||||||||||||||||
Changes in risk, parameters and exposures |
(127 |
) |
162 |
82 |
117 |
(33 | ) | 158 | 46 | 171 | ||||||||||||||||||||||||||||
Write-offs |
– |
– |
(12 |
) |
(12 |
) |
– | – | (9 | ) | (9 | ) | ||||||||||||||||||||||||||
Recoveries |
– |
– |
6 |
6 |
– | – | 5 | 5 | ||||||||||||||||||||||||||||||
Exchange rate and other |
– |
(2 |
) |
(41 |
) |
(43 |
) |
1 | (2 | ) | (31 | ) | (32 | ) | ||||||||||||||||||||||||
Balance at end of period |
$ |
215 |
$ |
308 |
$ |
381 |
$ |
904 |
$ | 259 | $ | 209 | $ | 262 | $ | 730 | ||||||||||||||||||||||
Personal |
||||||||||||||||||||||||||||||||||||||
Balance at beginning of period |
$ |
291 |
$ |
1,115 |
$ |
233 |
$ |
1,639 |
$ | 305 | $ | 966 | $ | 211 | $ | 1,482 | ||||||||||||||||||||||
Provision for credit losses |
||||||||||||||||||||||||||||||||||||||
Model changes |
84 |
(138 |
) |
– |
(54 |
) |
– | – | – | – | ||||||||||||||||||||||||||||
Transfers to stage 1 |
308 |
(308 |
) |
– |
– |
285 | (284 | ) | (1 | ) | – | |||||||||||||||||||||||||||
Transfers to stage 2 |
(43 |
) |
43 |
– |
– |
(53 | ) | 56 | (3 | ) | – | |||||||||||||||||||||||||||
Transfers to stage 3 |
(2 |
) |
(76 |
) |
78 |
– |
(2 | ) | (79 | ) | 81 | – | ||||||||||||||||||||||||||
Originations |
79 |
– |
– |
79 |
53 | – | – | 53 | ||||||||||||||||||||||||||||||
Maturities |
(20 |
) |
(122 |
) |
(1 |
) |
(143 |
) |
(26 | ) | (106 | ) | – | (132 | ) | |||||||||||||||||||||||
Changes in risk, parameters and exposures |
(357 |
) |
524 |
342 |
509 |
(258 | ) | 558 | 314 | 614 | ||||||||||||||||||||||||||||
Write-offs |
– |
– |
(493 |
) |
(493 |
) |
– | – | (438 | ) | (438 | ) | ||||||||||||||||||||||||||
Recoveries |
– |
– |
85 |
85 |
– | – | 71 | 71 | ||||||||||||||||||||||||||||||
Exchange rate and other |
– |
(2 |
) |
(13 |
) |
(15 |
) |
– | (1 | ) | (16 | ) | (17 | ) | ||||||||||||||||||||||||
Balance at end of period |
$ |
340 |
$ |
1,036 |
$ |
231 |
$ |
1,607 |
$ | 304 | $ | 1,110 | $ | 219 | $ | 1,633 | ||||||||||||||||||||||
Credit cards |
||||||||||||||||||||||||||||||||||||||
Balance at beginning of period |
$ |
217 |
$ |
1,139 |
$ |
– |
$ |
1,356 |
$ | 207 | $ | 1,026 | $ | – | $ | 1,233 | ||||||||||||||||||||||
Provision for credit losses |
||||||||||||||||||||||||||||||||||||||
Transfers to stage 1 |
312 |
(312 |
) |
– |
– |
334 | (334 | ) | – | – | ||||||||||||||||||||||||||||
Transfers to stage 2 |
(53 |
) |
53 |
– |
– |
(56 | ) | 56 | – | – | ||||||||||||||||||||||||||||
Transfers to stage 3 |
(1 |
) |
(312 |
) |
313 |
– |
(1 | ) | (283 | ) | 284 | – | ||||||||||||||||||||||||||
Originations |
6 |
– |
– |
6 |
5 | – | – | 5 | ||||||||||||||||||||||||||||||
Maturities |
(2 |
) |
(26 |
) |
– |
(28 |
) |
(2 | ) | (27 | ) | – | (29 | ) | ||||||||||||||||||||||||
Changes in risk, parameters and exposures |
(209 |
) |
541 |
173 |
505 |
(283 | ) | 680 | 107 | 504 | ||||||||||||||||||||||||||||
Write-offs |
– |
– |
(584 |
) |
(584 |
) |
– | – | (480 | ) | (480 | ) | ||||||||||||||||||||||||||
Recoveries |
– |
– |
98 |
98 |
– | – | 88 | 88 | ||||||||||||||||||||||||||||||
Exchange rate and other |
(1 |
) |
(1 |
) |
– |
(2 |
) |
(2 | ) | – | 1 | (1 | ) | |||||||||||||||||||||||||
Balance at end of period |
$ |
269 |
$ |
1,082 |
$ |
– |
$ |
1,351 |
$ | 202 | $ | 1,118 | $ | – | $ | 1,320 | ||||||||||||||||||||||
Small business |
||||||||||||||||||||||||||||||||||||||
Balance at beginning of period |
$ |
95 |
$ |
117 |
$ |
139 |
$ |
351 |
$ | 80 | $ | 86 | $ | 106 | $ | 272 | ||||||||||||||||||||||
Provision for credit losses |
||||||||||||||||||||||||||||||||||||||
Transfers to stage 1 |
35 |
(35 |
) |
– |
– |
23 | (23 | ) | – | – | ||||||||||||||||||||||||||||
Transfers to stage 2 |
(13 |
) |
13 |
– |
– |
(11 | ) | 11 | – | – | ||||||||||||||||||||||||||||
Transfers to stage 3 |
(1 |
) |
(11 |
) |
12 |
– |
(1 | ) | (6 | ) | 7 | – | ||||||||||||||||||||||||||
Originations |
22 |
– |
– |
22 |
20 | – | – | 20 | ||||||||||||||||||||||||||||||
Maturities |
(13 |
) |
(30 |
) |
– |
(43 |
) |
(10 | ) | (11 | ) | – | (21 | ) | ||||||||||||||||||||||||
Changes in risk, parameters and exposures |
(30 |
) |
60 |
33 |
63 |
(6 | ) | 57 | 84 | 135 | ||||||||||||||||||||||||||||
Write-offs |
– |
– |
(65 |
) |
(65 |
) |
– | – | (60 | ) | (60 | ) | ||||||||||||||||||||||||||
Recoveries |
– |
– |
13 |
13 |
– | – | 8 | 8 | ||||||||||||||||||||||||||||||
Exchange rate and other |
2 |
2 |
(16 |
) |
(12 |
) |
3 | – | (14 | ) | (11 | ) | ||||||||||||||||||||||||||
Balance at end of period |
$ |
97 |
$ |
116 |
$ |
116 |
$ |
329 |
$ | 98 | $ | 114 | $ | 131 | $ | 343 | ||||||||||||||||||||||
Wholesale |
||||||||||||||||||||||||||||||||||||||
Balance at beginning of period |
$ |
896 |
$ |
1,123 |
$ |
1,300 |
$ |
3,319 |
$ | 787 | $ | 1,038 | $ | 968 | $ | 2,793 | ||||||||||||||||||||||
Provision for credit losses |
||||||||||||||||||||||||||||||||||||||
Transfers to stage 1 |
120 |
(120 |
) |
– |
– |
99 | (98 | ) | (1 | ) | – | |||||||||||||||||||||||||||
Transfers to stage 2 |
(53 |
) |
53 |
– |
– |
(64 | ) | 73 | (9 | ) | – | |||||||||||||||||||||||||||
Transfers to stage 3 |
(6 |
) |
(125 |
) |
131 |
– |
(6 | ) | (206 | ) | 212 | – | ||||||||||||||||||||||||||
Originations |
298 |
– |
– |
298 |
424 | – | – | 424 | ||||||||||||||||||||||||||||||
Maturities |
(225 |
) |
(290 |
) |
– |
(515 |
) |
(303 | ) | (197 | ) | – | (500 | ) | ||||||||||||||||||||||||
Changes in risk, parameters and exposures |
(157 |
) |
540 |
772 |
1,155 |
11 | 499 | 696 | 1,206 | |||||||||||||||||||||||||||||
Write-offs |
– |
– |
(460 |
) |
(460 |
) |
– | – | (380 | ) | (380 | ) | ||||||||||||||||||||||||||
Recoveries |
– |
– |
47 |
47 |
– | – | 31 | 31 | ||||||||||||||||||||||||||||||
Exchange rate and other |
(13 |
) |
(17 |
) |
(201 |
) |
(231 |
) |
(2 | ) | (5 | ) | (112 | ) | (119 | ) | ||||||||||||||||||||||
Balance at end of period |
$ |
860 |
$ |
1,164 |
$ |
1,589 |
$ |
3,613 |
$ | 946 | $ | 1,104 | $ | 1,405 | $ | 3,455 | ||||||||||||||||||||||
Key inputs and assumptions
The following provides an update on the key inputs and assumptions used in the measurement of expected credit losses. For further details, refer to Note 2 and Note 5 of our audited 2025 Annual Consolidated Financial Statements.
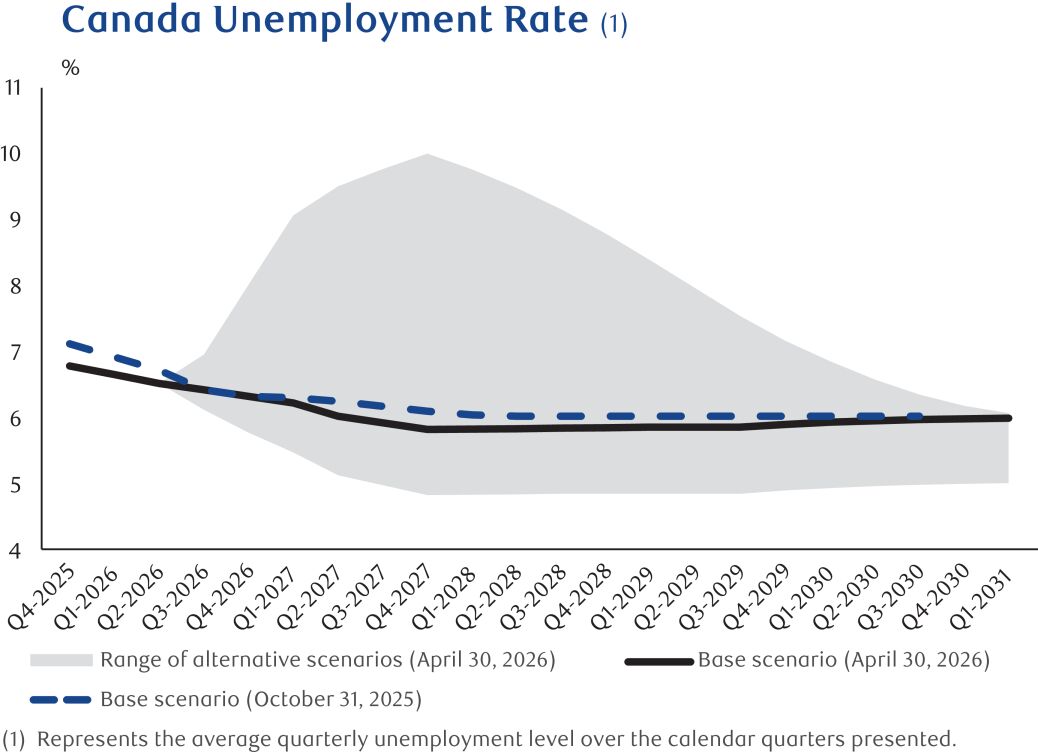
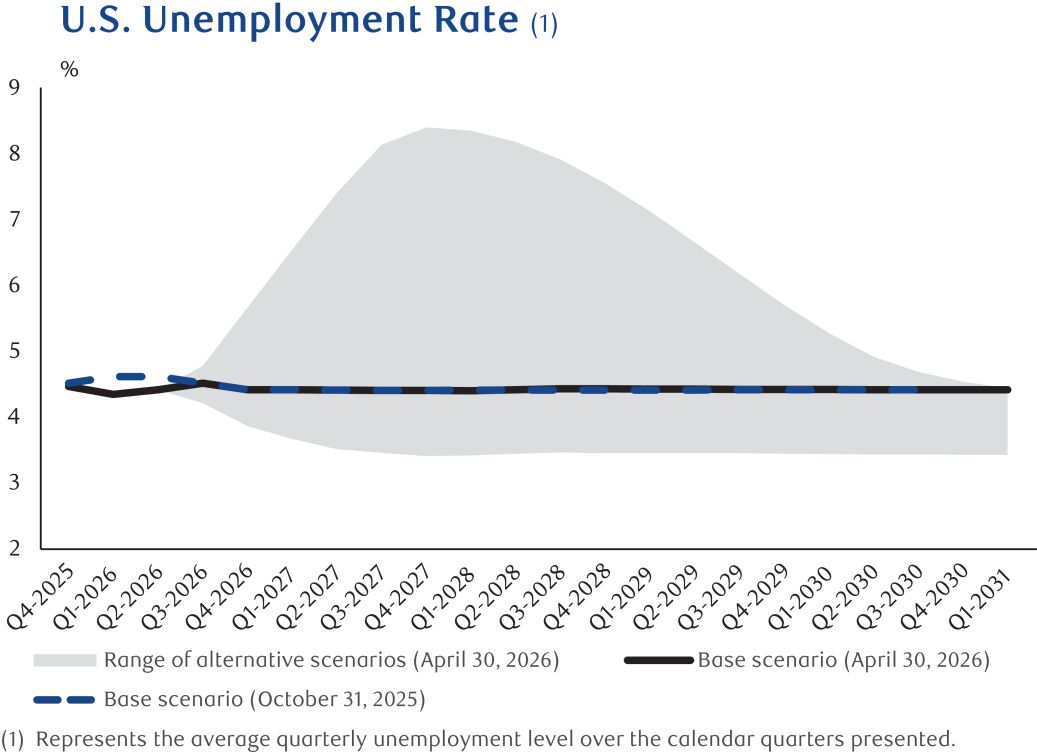
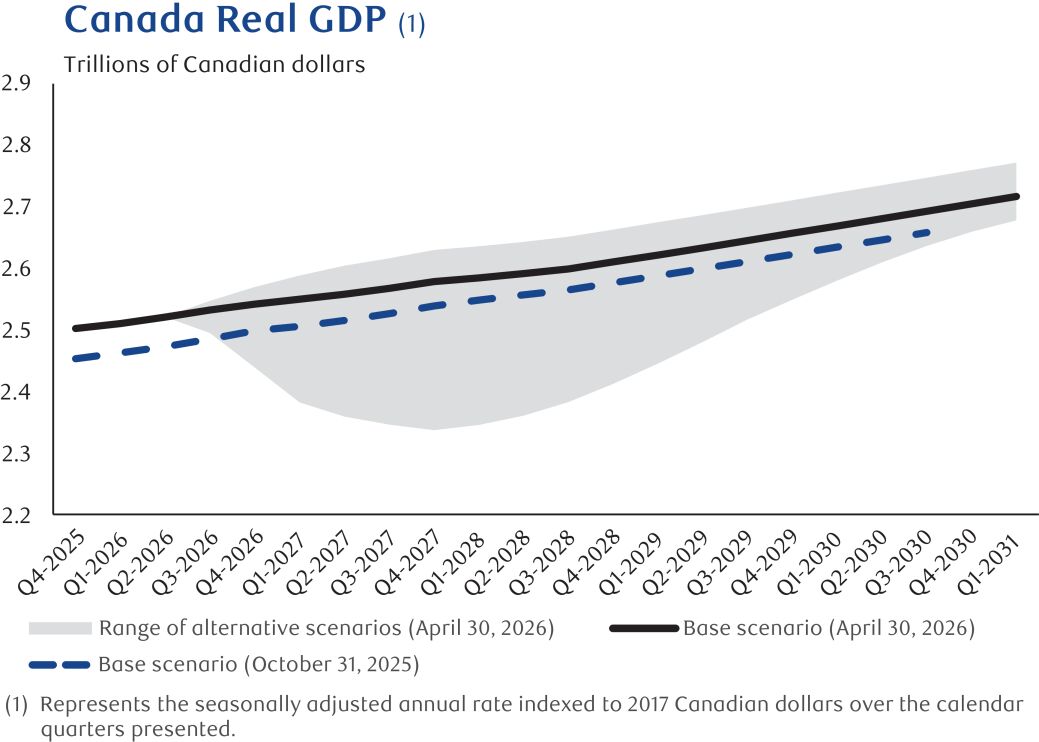
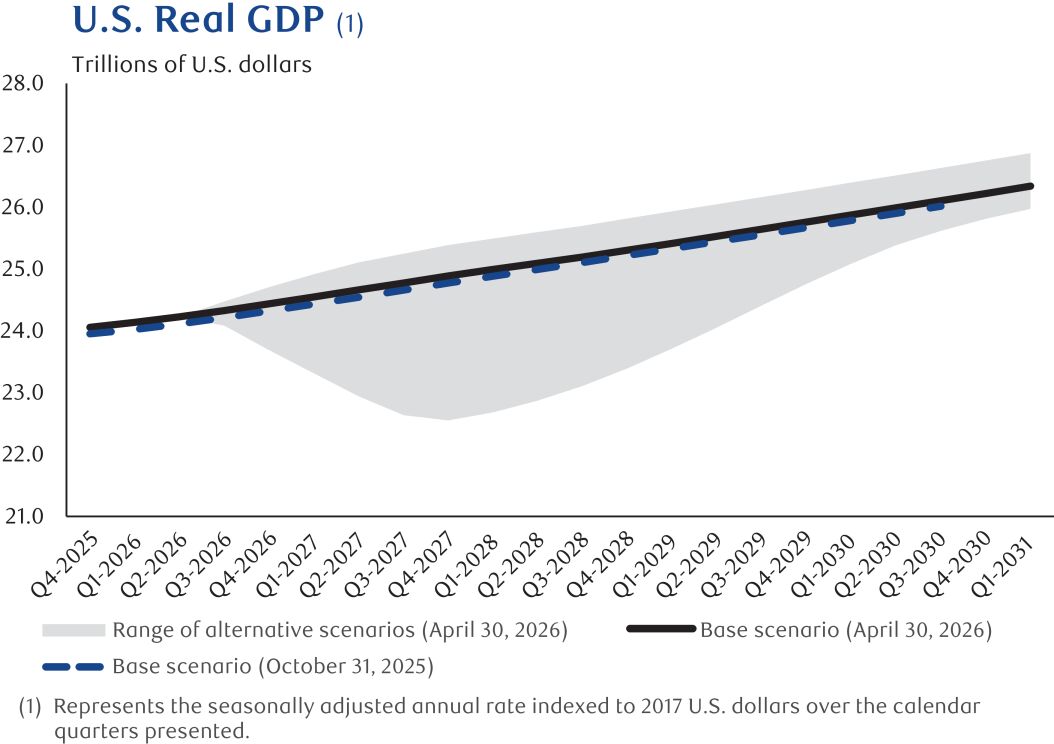
Our base scenario reflects a stabilizing U.S. trade policy and the impacts of higher energy prices resulting from the conflict in the Middle East. Economic growth in both Canada and the U.S. is expected to remain positive, with gradually declining unemployment rates through calendar 2026 in Canada and rising unemployment rates, peaking in calendar Q3 2026, followed by a return to equilibrium in calendar Q4 2026 in the U.S. Central bank policy rates in Canada and the U.S. are expected to remain unchanged through calendar 2026, followed by rate increases in Canada and rate cuts in the U.S. starting in calendar Q1 2027.
Our downside scenarios include two additional and more severe downside scenarios designed for trade disruptions and the real estate sector. Our downside scenarios reflect the possibility of moderate and escalating macroeconomic shocks beginning in calendar Q3 2026 relative to our base scenario. In these scenarios, conditions are expected to deteriorate from calendar Q2 2026 levels for up to 18 months, followed by a recovery for the remainder of the period. These scenarios assume monetary policy responses that return the economy to a
long-run,
sustainable growth rate within the forecast period. Our upside scenario reflects slightly stronger economic growth than the base scenario, without prompting a further offsetting monetary policy response as compared to our base scenario, followed by a return to a
long-run
sustainable growth rate within the forecast period. The following provides additional detail about our calendar quarter forecasts for certain key macroeconomic variables used in the models to estimate the allowance for credit losses:
| • | Unemployment rates decline to 6.5% in calendar Q2 2026 then continue to decline over the short term, before returning to its long run equilibrium towards the latter end of the horizon. The U.S. unemployment rate is expected to peak at 4.5% in calendar Q3 2026, then return to its long run equilibrium level in calendar Q4 2026. |
 |
 |
| • | Gross Domestic Product (GDP) 2 2026 and thereafter. GDP in calendar Q4 2026 is expected to be 1.6% above Q4 2025 levels inb oth |
 |
 |
| • | Canadian housing price index 2 2026, with a compound annual growth rate of 4.3% for the following 2 to 5 years. The range of annual housing price growth (contraction) in our alternative real estate downside and upside scenarios is (28.0)% to 10.9% over the next 12 months and 4.2% to 9.6% for the following 2 to 5 years. As at October 31, 2025, our base forecast included housing price growth of 0.3% from calendar Q4 2025 for the next 12 months and housing price growth of 3.4% for the following 2 to 5 years. |
Credit risk exposure by internal risk rating
The following table presents the gross carrying amount of loans measured at amortized cost, and the full contractual amount of undrawn loan commitments subject to the impairment requirements of IFRS 9 . Risk ratings are based on internal ratings used in the measurement of expected credit losses as at the reporting date, as outlined in the internal ratings maps for Wholesale and Retail facilities in the Credit risk section of our 2025 Annual Report.
Financial Instruments
As at |
||||||||||||||||||||||||||||||||||
April 30, 2026 |
October 31, 2025 |
|||||||||||||||||||||||||||||||||
(Millions of Canadian dollars) |
Stage 1 |
Stage 2 |
Stage 3 |
Total |
Stage 1 |
Stage 2 |
Stage 3 (1) |
Total |
||||||||||||||||||||||||||
| Retail (2) |
||||||||||||||||||||||||||||||||||
| Loans outstanding – Residential mortgages |
||||||||||||||||||||||||||||||||||
| Low risk |
$ |
405,054 |
$ |
948 |
$ |
– |
$ |
406,002 |
$ | 386,060 | $ | 16,495 | $ | – | $ | 402,555 | ||||||||||||||||||
| Medium risk |
18,517 |
5,139 |
– |
23,656 |
20,622 | 2,571 | – | 23,193 | ||||||||||||||||||||||||||
| High risk |
2,842 |
8,570 |
– |
11,412 |
2,131 | 6,532 | – | 8,663 | ||||||||||||||||||||||||||
| Not rated ( 3 ) |
54,729 |
1,796 |
– |
56,525 |
54,253 | 1,940 | – | 56,193 | ||||||||||||||||||||||||||
| Impaired |
– |
– |
2,131 |
2,131 |
– | – | 1,681 | 1,681 | ||||||||||||||||||||||||||
481,142 |
16,453 |
2,131 |
499,726 |
463,066 | 27,538 | 1,681 | 492,285 | |||||||||||||||||||||||||||
| Items not subject to impairment ( 4 ) |
1,153 |
1,128 | ||||||||||||||||||||||||||||||||
| Total |
$ |
500,879 |
$ | 493,413 | ||||||||||||||||||||||||||||||
| Loans outstanding – Personal |
||||||||||||||||||||||||||||||||||
| Low risk |
$ |
70,192 |
$ |
1,485 |
$ |
– | $ |
71,677 |
$ | 87,536 | $ | 2,712 | $ | – | $ | 90,248 | ||||||||||||||||||
| Medium risk |
3,799 |
1,654 |
– |
5,453 |
4,035 | 3,768 | – | 7,803 | ||||||||||||||||||||||||||
| High risk |
707 |
2,510 |
– |
3,217 |
601 | 2,583 | – | 3,184 | ||||||||||||||||||||||||||
| Not rated ( 3 ) |
32,630 |
4,307 |
– |
36,937 |
12,493 | 1,180 | – | 13,673 | ||||||||||||||||||||||||||
| Impaired |
– |
– |
436 |
436 |
– | – | 437 | 437 | ||||||||||||||||||||||||||
| Total |
$ |
107,328 |
$ |
9,956 |
$ |
436 |
$ |
117,720 |
$ | 104,665 | $ | 10,243 | $ | 437 | $ | 115,345 | ||||||||||||||||||
| Loans outstanding – Credit cards |
||||||||||||||||||||||||||||||||||
| Low risk |
$ |
19,633 |
$ |
813 |
$ |
– |
$ |
20,446 |
$ | 18,279 | $ | 161 | $ | – | $ | 18,440 | ||||||||||||||||||
| Medium risk |
1,479 |
1,897 |
– |
3,376 |
2,123 | 2,291 | – | 4,414 | ||||||||||||||||||||||||||
| High risk |
87 |
2,774 |
– |
2,861 |
70 | 2,423 | – | 2,493 | ||||||||||||||||||||||||||
| Not rated ( 3 ) |
780 |
239 |
– |
1,019 |
1,133 | 309 | – | 1,442 | ||||||||||||||||||||||||||
| Total |
$ |
21,979 |
$ |
5,723 |
$ |
– |
$ |
27,702 |
$ | 21,605 | $ | 5,184 | $ | – | $ | 26,789 | ||||||||||||||||||
| Loans outstanding – Small business |
||||||||||||||||||||||||||||||||||
| Low risk |
$ |
11,169 |
$ |
548 |
$ |
– |
$ |
11,717 |
$ | 10,628 | $ | 595 | $ | – | $ | 11,223 | ||||||||||||||||||
| Medium risk |
2,454 |
734 |
– |
3,188 |
2,550 | 924 | – | 3,474 | ||||||||||||||||||||||||||
| High risk |
247 |
1,413 |
– |
1,660 |
259 | 1,422 | – | 1,681 | ||||||||||||||||||||||||||
| Not rated ( 3 ) |
10 |
– |
– |
10 |
8 | – | – | 8 | ||||||||||||||||||||||||||
| Impaired |
– |
– |
480 |
480 |
– | – | 411 | 411 | ||||||||||||||||||||||||||
| Total |
$ |
13,880 |
$ |
2,695 |
$ |
480 |
$ |
17,055 |
$ | 13,445 | $ | 2,941 | $ | 411 | $ | 16,797 | ||||||||||||||||||
| Undrawn loan commitments – Retail |
||||||||||||||||||||||||||||||||||
| Low risk |
$ |
307,529 |
$ |
139 |
$ |
– |
$ |
307,668 |
$ | 293,300 | $ | 3,700 | $ | – | $ | 297,000 | ||||||||||||||||||
| Medium risk |
14,009 |
226 |
– |
14,235 |
12,451 | 427 | – | 12,878 | ||||||||||||||||||||||||||
| High risk |
1,175 |
1,785 |
– |
2,960 |
805 | 758 | – | 1,563 | ||||||||||||||||||||||||||
| Not rated ( 3 ) |
9,123 |
244 |
– |
9,367 |
13,964 | 274 | – | 14,238 | ||||||||||||||||||||||||||
| Total |
$ |
331,836 |
$ |
2,394 |
$ |
– |
$ |
334,230 |
$ | 320,520 | $ | 5,159 | $ | – | $ | 325,679 | ||||||||||||||||||
| Wholesale – Loans outstanding |
||||||||||||||||||||||||||||||||||
| Investment grade |
$ |
148,514 |
$ |
2,026 |
$ |
– |
$ |
150,540 |
$ | 130,322 | $ | 2,117 | $ | – | $ | 132,439 | ||||||||||||||||||
| Non-investment grade |
212,057 |
26,199 |
– |
238,256 |
207,239 | 26,399 | – | 233,638 | ||||||||||||||||||||||||||
| Not rated ( 3 ) |
15,076 |
577 |
– |
15,653 |
14,714 | 503 | – | 15,217 | ||||||||||||||||||||||||||
| Impaired |
– |
– |
6,743 |
6,743 |
– | – | 6,153 | 6,153 | ||||||||||||||||||||||||||
375,647 |
28,802 |
6,743 |
411,192 |
352,275 | 29,019 | 6,153 | 387,447 | |||||||||||||||||||||||||||
| Items not subject to impairment ( 4 ) |
10,922 |
9,724 | ||||||||||||||||||||||||||||||||
| Total |
$ |
422,114 |
$ | 397,171 | ||||||||||||||||||||||||||||||
| Undrawn loan commitments – Wholesale |
||||||||||||||||||||||||||||||||||
| Investment grade |
$ |
388,395 |
$ |
1,440 |
$ |
– |
$ |
389,835 |
$ | 393,167 | $ | 1,593 | $ | – | $ | 394,760 | ||||||||||||||||||
| Non-investment grade |
178,968 |
14,256 |
– |
193,224 |
182,223 | 16,158 | – | 198,381 | ||||||||||||||||||||||||||
| Not rated ( 3 ) |
1,651 |
19 |
– |
1,670 |
1,407 | 21 | – | 1,428 | ||||||||||||||||||||||||||
| Total |
$ |
569,014 |
$ |
15,715 |
$ |
– |
$ |
584,729 |
$ | 576,797 | $ | 17,772 | $ | – | $ | 594,569 | ||||||||||||||||||
| (1) | Includes $197 million of purchased or originated credit-impaired loans (October 31, 2025 – $195 million). |
(2) |
During the second quarter of 2026, we applied changes to our Retail risk rating models, which were applied prospectively and reflected in the April 30, 2026 credit risk exposures. Certain Personal portfolios no longer use internal risk ratings in the measurement of expected credit losses and therefore were presented in Not rated. |
(3) |
In certain cases where an internal risk rating is not assigned, we use other approved credit risk assessment or rating methodologies, policies and tools to manage our credit risk . |
(4) |
Items not subject to impairment are loans held at FVTPL. |
Loans past due but not impaired
(1), (2)
| As at | ||||||||||||||||||||||||||
April 30, 2026 |
October 31, 2025 | |||||||||||||||||||||||||
| (Millions of Canadian dollars) | 30 to 89 days |
90 days and greater |
Total |
30 to 89 days | 90 days and greater |
Total | ||||||||||||||||||||
Retail |
$ |
2,479 |
$ |
358 |
$ |
2,837 |
$ | 2,634 | $ | 323 | $ | 2,957 | ||||||||||||||
Wholesale |
858 |
– |
858 |
1,143 | 7 | 1,150 | ||||||||||||||||||||
$ |
3,337 |
$ |
358 |
$ |
3,695 |
$ | 3,777 | $ | 330 | $ | 4,107 | |||||||||||||||
| (1) | Excludes loans less than 30 days past due as they are not generally representative of the borrowers’ ability to meet their payment obligations. |
| (2) | Amounts presented may include loans past due as a result of administrative processes, such as mortgage loans on which payments are restrained pending payout due to sale or refinancing. Past due loans arising from administrative processes are not representative of the borrowers’ ability to meet their payment obligations. |