Supplemental Information Third Quarter FY 2026 Exhibit 99.2
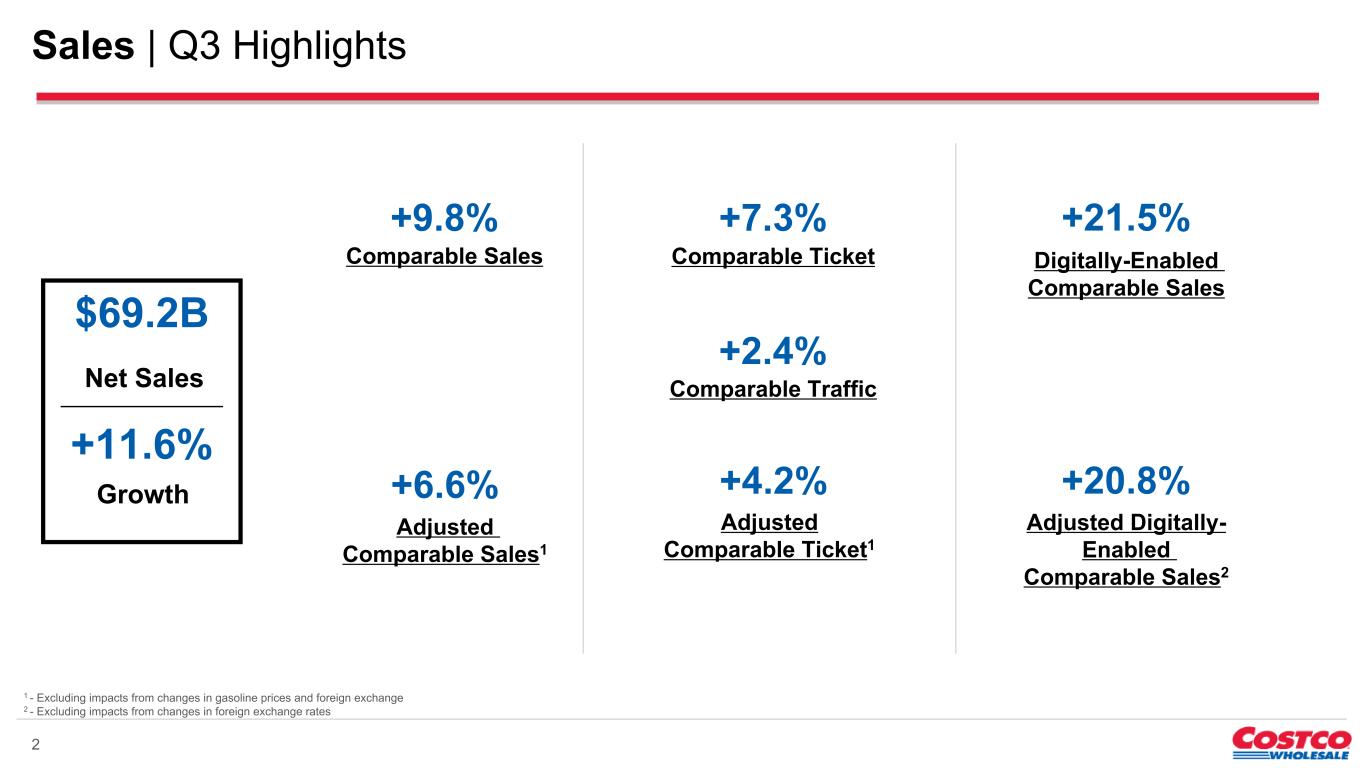
$69.2B 2 +11.6% Comparable Sales +9.8% Adjusted Comparable Sales1 +6.6% Comparable Traffic +2.4% Comparable Ticket +7.3% Adjusted Comparable Ticket1 +4.2% Digitally-Enabled Comparable Sales +21.5% Adjusted Digitally- Enabled Comparable Sales2 +20.8% Net Sales Growth Sales | Q3 Highlights 1 - Excluding impacts from changes in gasoline prices and foreign exchange 2 - Excluding impacts from changes in foreign exchange rates
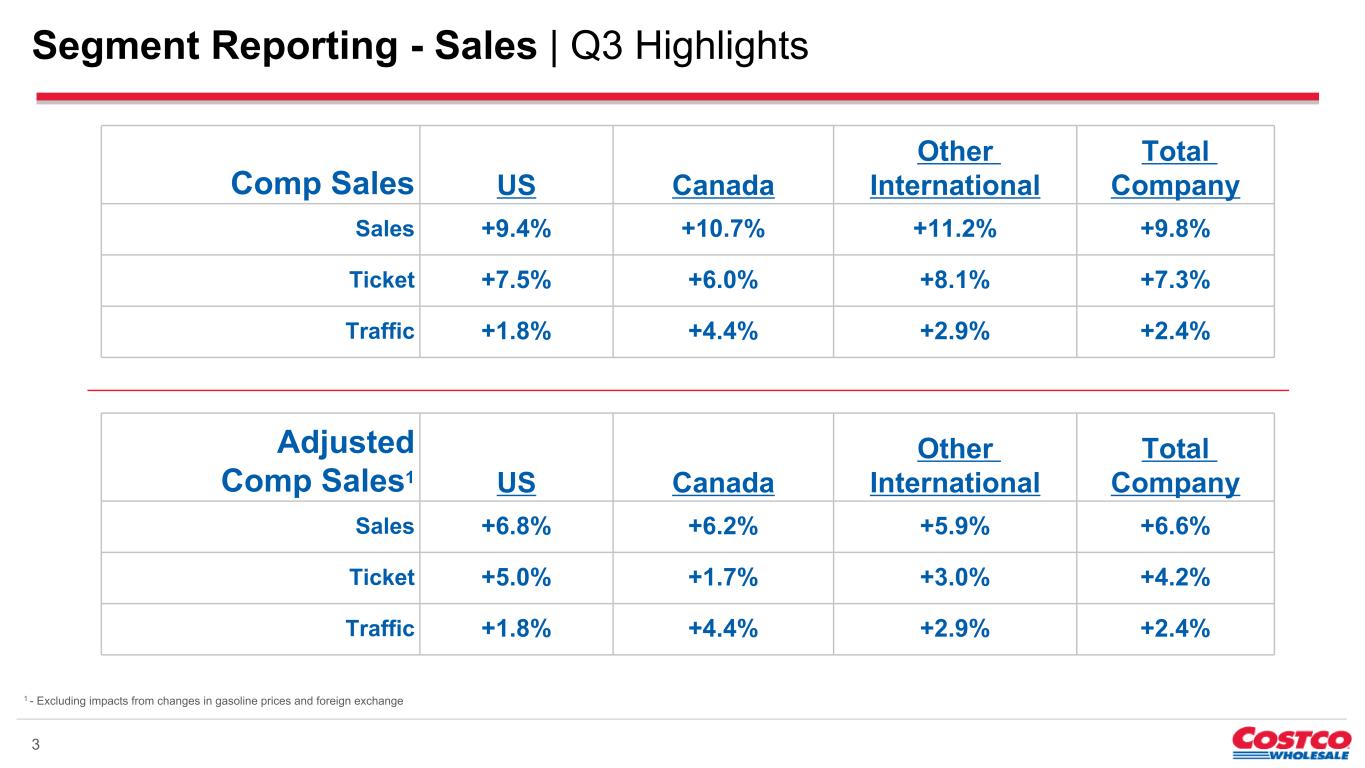
Segment Reporting - Sales | Q3 Highlights 3 Comp Sales US Canada Other International Total Company Sales +9.4% +10.7% +11.2% +9.8% Ticket +7.5% +6.0% +8.1% +7.3% Traffic +1.8% +4.4% +2.9% +2.4% 1 - Excluding impacts from changes in gasoline prices and foreign exchange Adjusted Comp Sales1 US Canada Other International Total Company Sales +6.8% +6.2% +5.9% +6.6% Ticket +5.0% +1.7% +3.0% +4.2% Traffic +1.8% +4.4% +2.9% +2.4%
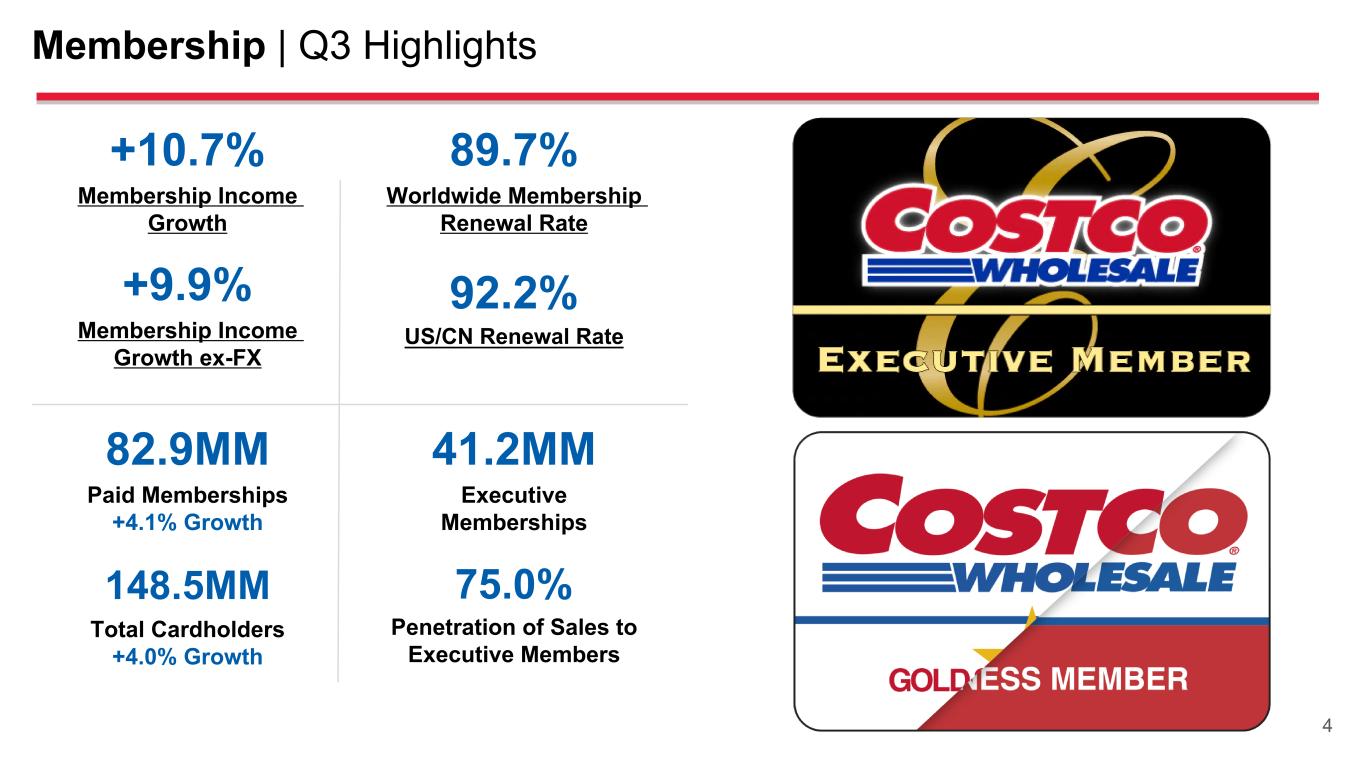
4 89.7% Worldwide Membership Renewal Rate 148.5MM Total Cardholders +4.0% Growth 41.2MM Executive Memberships Membership | Q3 Highlights +9.9% Membership Income Growth ex-FX +10.7% Membership Income Growth 92.2% US/CN Renewal Rate 82.9MM Paid Memberships +4.1% Growth 75.0% Penetration of Sales to Executive Members
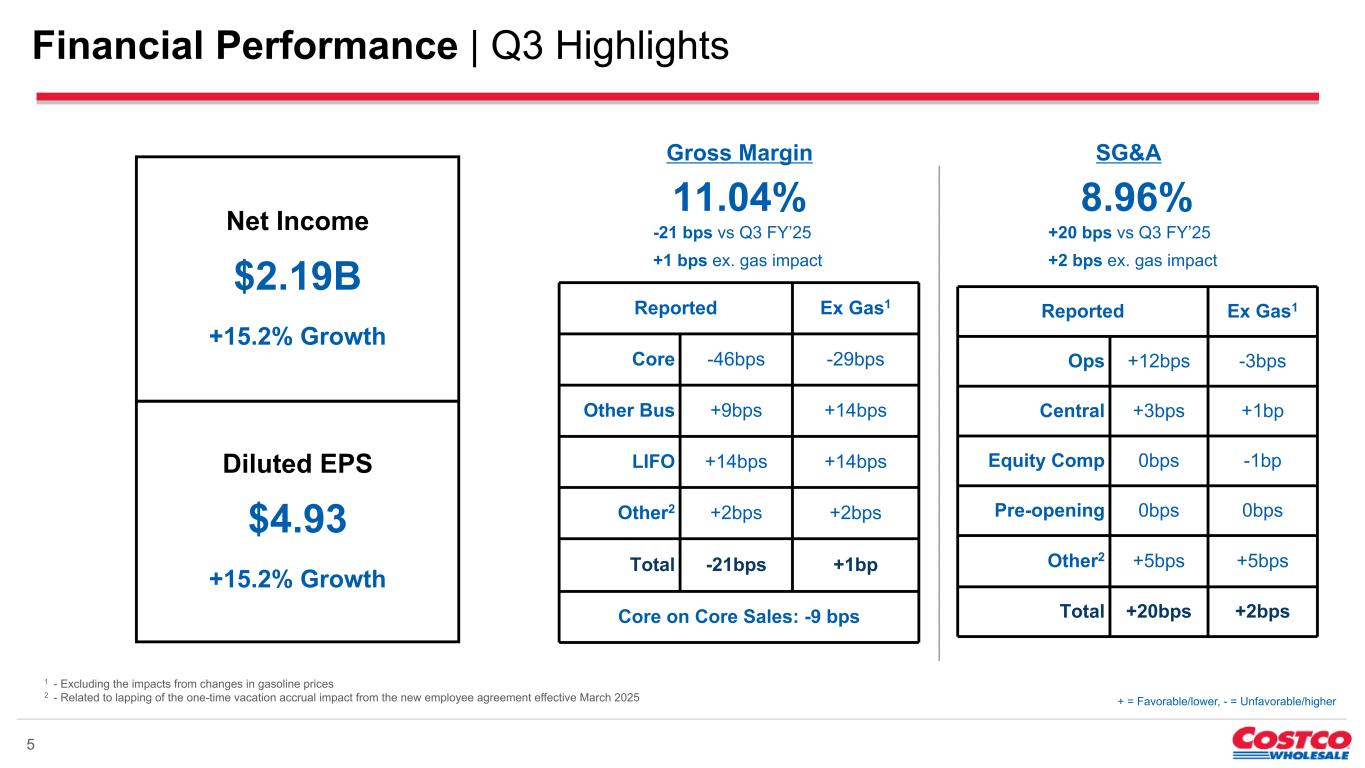
Financial Performance | Q3 Highlights 5 Gross Margin 11.04% -21 bps vs Q3 FY’25 +1 bps ex. gas impact Reported Ex Gas1 Core -46bps -29bps Other Bus +9bps +14bps LIFO +14bps +14bps Other2 +2bps +2bps Total -21bps +1bp Core on Core Sales: -9 bps Reported Ex Gas1 Ops +12bps -3bps Central +3bps +1bp Equity Comp 0bps -1bp Pre-opening 0bps 0bps Other2 +5bps +5bps Total +20bps +2bps SG&A 8.96% +20 bps vs Q3 FY’25 +2 bps ex. gas impact 1 - Excluding the impacts from changes in gasoline prices 2 - Related to lapping of the one-time vacation accrual impact from the new employee agreement effective March 2025 + = Favorable/lower, - = Unfavorable/higher Net Income $2.19B +15.2% Growth Diluted EPS $4.93 +15.2% Growth
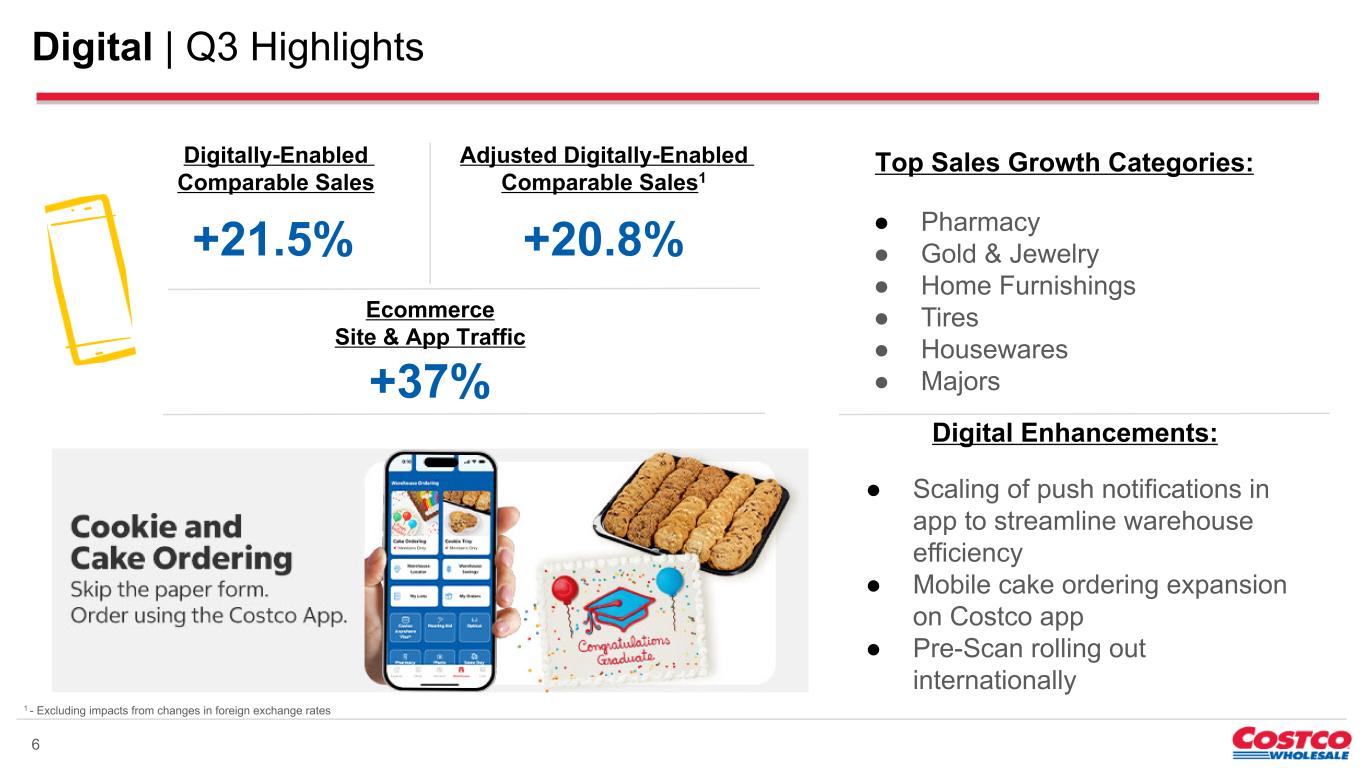
Digital | Q3 Highlights Top Sales Growth Categories: ● Pharmacy ● Gold & Jewelry ● Home Furnishings ● Tires ● Housewares ● Majors 6 Digitally-Enabled Comparable Sales +21.5% Adjusted Digitally-Enabled Comparable Sales1 +20.8% Digital Enhancements: ● Scaling of push notifications in app to streamline warehouse efficiency ● Mobile cake ordering expansion on Costco app ● Pre-Scan rolling out internationally Ecommerce Site & App Traffic +37% 1 - Excluding impacts from changes in foreign exchange rates
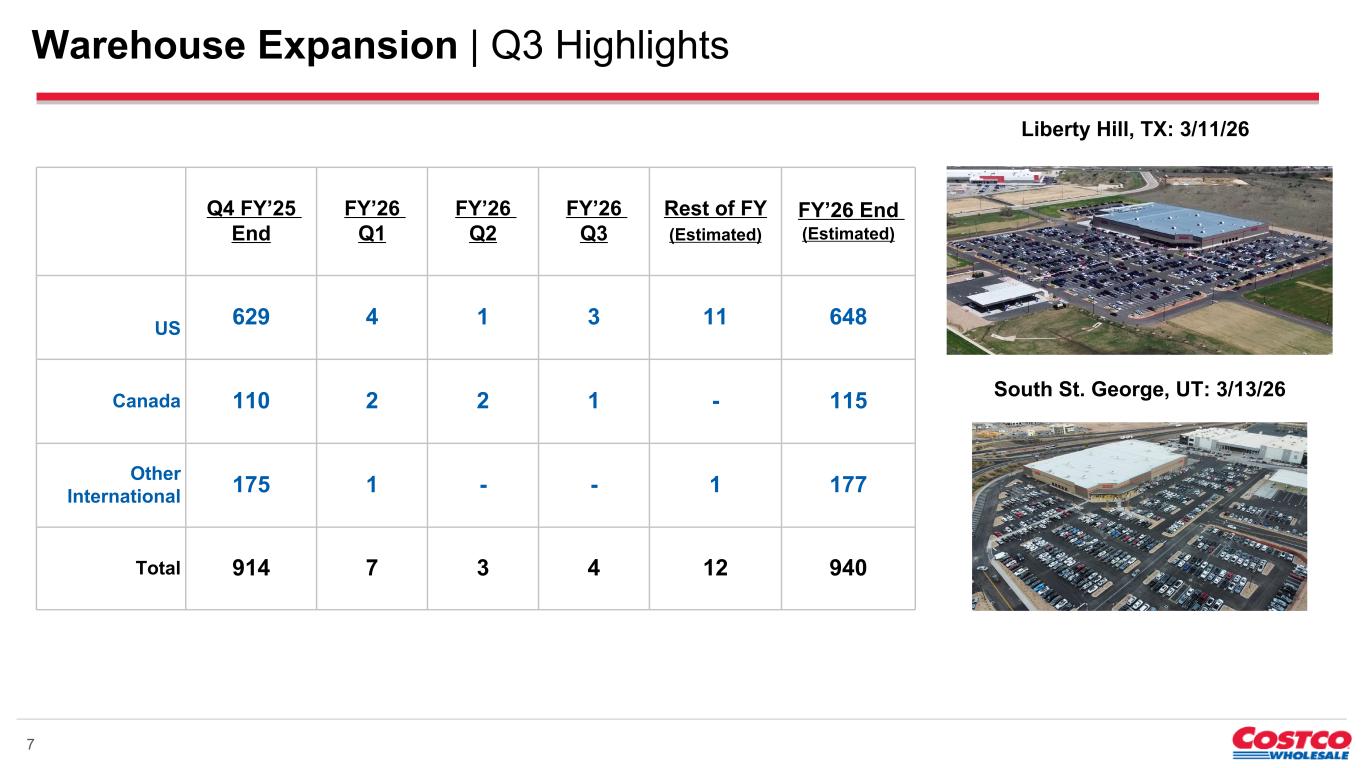
Warehouse Expansion | Q3 Highlights 7 Q4 FY’25 End FY’26 Q1 FY’26 Q2 FY’26 Q3 Rest of FY (Estimated) FY’26 End (Estimated) US 629 4 1 3 11 648 Canada 110 2 2 1 - 115 Other International 175 1 - - 1 177 Total 914 7 3 4 12 940 Liberty Hill, TX: 3/11/26 South St. George, UT: 3/13/26
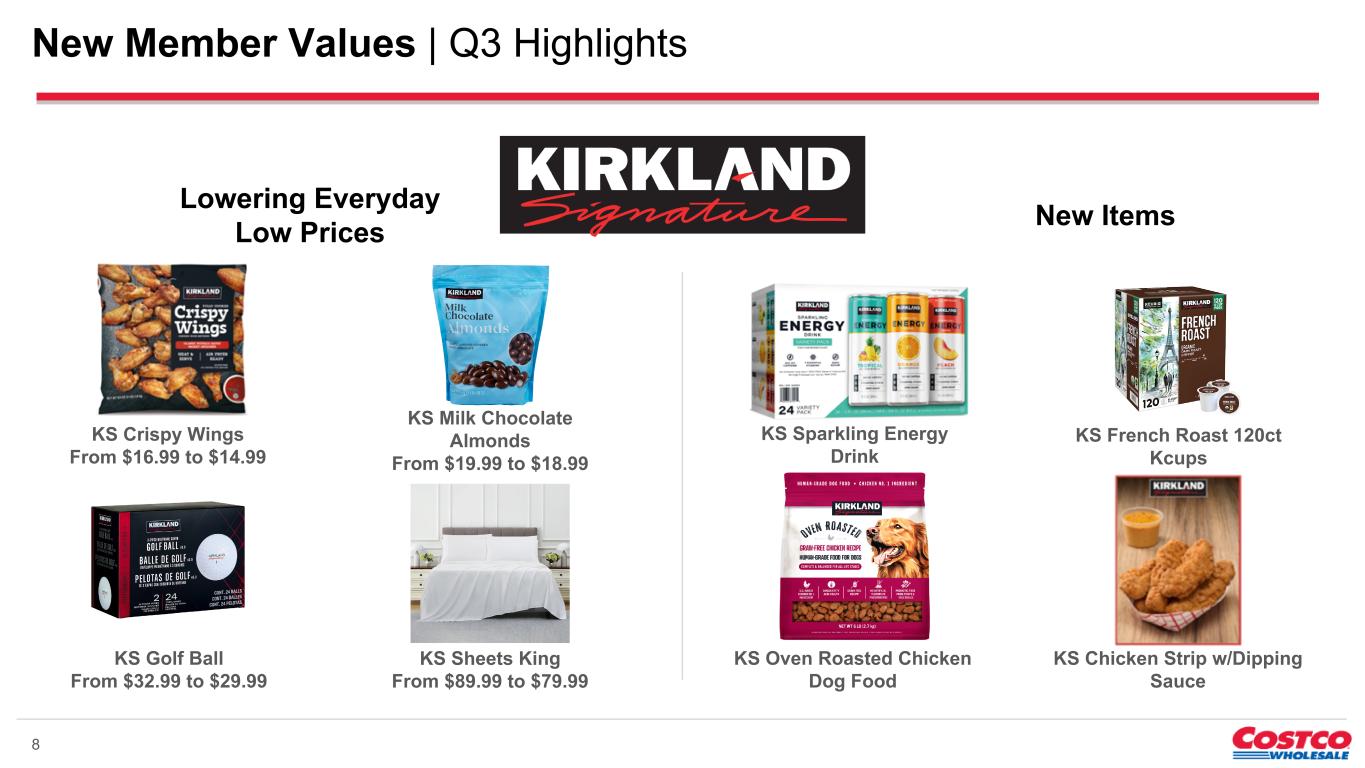
New Member Values | Q3 Highlights 8 Lowering Everyday Low Prices KS Crispy Wings From $16.99 to $14.99 KS Milk Chocolate Almonds From $19.99 to $18.99 KS Golf Ball From $32.99 to $29.99 KS Sheets King From $89.99 to $79.99 New Items KS Chicken Strip w/Dipping Sauce KS French Roast 120ct Kcups KS Oven Roasted Chicken Dog Food KS Sparkling Energy Drink
Safe Harbor | Q3 Highlights 9 Certain statements contained in this document constitute forward-looking statements within the meaning of the Private Securities Litigation Reform Act of 1995. For these purposes, forward-looking statements are statements that address activities, events, conditions or developments that the Company expects or anticipates may occur in the future. In some cases forward-looking statements can be identified because they contain words such as “anticipate,” “believe,” “continue,” “could,” “estimate,” “expect,” “intend,” “likely,” “may,” “might,” “plan,” “potential,” “predict,” “project,” “seek,” “should,” “target,” “will,” “would,” or similar expressions and the negatives of those terms. Such forward-looking statements involve risks and uncertainties that may cause actual events, results or performance to differ materially from those indicated by such statements. These risks and uncertainties include, but are not limited to, domestic and international economic conditions, including exchange rates, inflation or deflation, the effects of competition and regulation, uncertainties in the financial markets, consumer and small business spending patterns and debt levels, breaches of security or privacy of member or business information, conditions affecting the acquisition, development, ownership or use of real estate, capital spending, actions of vendors, rising costs associated with employees (generally including health-care costs and wages), workforce interruptions, energy and certain commodities, geopolitical conditions (including tariffs and global conflicts), the ability to maintain effective internal control over financial reporting, regulatory and other impacts related to environmental and social matters, public-health related factors, and other risks identified from time to time in the Company’s public statements and reports filed with the Securities and Exchange Commission. Forward-looking statements speak only as of the date they are made, and the Company does not undertake to update these statements, except as required by law. Comparable sales and comparable sales excluding impacts from changes in gasoline prices and foreign exchange are intended as supplemental information and are not a substitute for net sales presented in accordance with U.S. GAAP.