
TD BANK GROUP • SECOND QUARTER 2026 • REPORT TO SHAREHOLDERS
Page 1
TD Bank Group Reports Second Quarter 2026 Results
Report to Shareholders
Three and six months ended April 30, 2026
The financial information in this document is reported in Canadian dollars and is based on the Bank’s unaudited Interim Consolidated Financial Statements
prepared in accordance with International Financial Reporting Standards (IFRS) as issued by the International Accounting Standards Board (IASB), unless
otherwise noted. Certain comparative amounts have been revised to conform with the presentation adopted in the current period.
Reported results conform with generally accepted accounting principles (GAAP), in accordance with IFRS. Adjusted results are non-GAAP financial measures.
For additional information about the Bank’s use of non-GAAP financial measures, refer to “Non-GAAP and Other Financial Measures” in the “How We Performed”,
or “How Our Businesses Performed” sections of this document.
SECOND QUARTER FINANCIAL HIGHLIGHTS, compared with the second quarter last year:
●
Reported diluted earnings per share were $2.43, compared with $6.27.
●
Adjusted diluted earnings per share were $2.38, compared with $1.97.
●
Reported net income was $4,251 million, compared with $11,129 million.
●
Adjusted net income was $4,168 million, compared with $3,626 million.
YEAR-TO-DATE FINANCIAL HIGHLIGHTS, six months ended April 30, 2026, compared with the corresponding period last year:
●
Reported diluted earnings per share were $4.77, compared with $7.81.
●
Adjusted diluted earnings per share were $4.82, compared with $3.99.
●
Reported net income was $8,294 million, compared with $13,922 million.
●
Adjusted net income was $8,384 million, compared with $7,249 million.
SECOND QUARTER ADJUSTMENTS (ITEMS OF NOTE)
The second quarter reported earnings figures included the following items of note:
●
Amortization of acquired intangibles of $33 million ($25 million after tax or 1 cent per share), compared with $43 million ($35 million after tax or
2 cents per share) in the second quarter last year.
●
Impact from the terminated First Horizon Corporation (FHN) acquisition-related capital hedging strategy of $43 million ($33 million after tax or
2 cents per share), compared with $47 million ($35 million after tax or 2 cents per share) in the second quarter last year.
●
Income tax adjustment on gain on sale of The Charles Schwab Corporation (Schwab) shares of ($288) million (($288) million after tax or (17) cents
per share).
●
Change in partnership share in the U.S. strategic cards portfolio of $197 million ($147 million after tax or 9 cents per share).
TORONTO
, May 28, 2026 – TD Bank Group (“TD” or the “Bank”) today announced its financial results for the second quarter ended April 30, 2026. Reported
earnings and earnings per share were $4.3 billion and $2.43, compared with $11.1 billion and $6.27, respectively, in the second quarter last year. Adjusted
earnings and earnings per share were $4.2 billion and $2.38, up 15% and 21%, respectively, year-over-year.
"This was another strong quarter for TD. We drove record Q2 earnings in Canadian Personal and Commercial Banking, all-time high earnings in Wealth
Management and Insurance and Wholesale Banking, and we accelerated momentum in U.S. Banking. We demonstrated disciplined execution as we grew return
on equity and delivered our fourth consecutive quarter of positive operating leverage, on an adjusted basis. We also continue to make consistent progress on our
AML remediation and enhancements, which remain our top priority," said Raymond Chun, Group President and CEO, TD Bank Group. "Our bank has momentum,
and we are making important investments in talent, innovation, AI and client experience, as we fundamentally restructure our cost base to drive performance and
continue winning."
Canadian Personal and Commercial Banking delivered record Q2 revenue and earnings
Canadian Personal and Commercial Banking net income was $1,925 million, up 15% year-over-year, primarily reflecting higher revenue and lower provisions for
credit losses (PCL). Revenue grew 5% year-over-year driven by loan and deposit volume growth and higher margins.
Canadian Personal Banking drove continued momentum in deepening client relationships, achieving record penetration rates for consumer and small business
credit cards. The business also generated $9 billion in closed referrals to Wealth, with double-digit growth year-over-year, driven by strong frontline engagement
and execution. Canadian Business Banking maintained its momentum this quarter as continued progress on distribution expansion contributed to strong loan
growth and earnings. TD Auto Finance was once again awarded #1 for Dealer Satisfaction among both Non-Prime and Prime Credit Non-Captive Automotive
Financing Lenders in the JD Power 2026 Canada Dealer Financing Satisfaction Study
U.S. Banking sustained business momentum
U.S. Banking reported net income was $813 million (US$595 million), an increase of $771 million (US$560 million) year-over-year. On an adjusted basis, net
income was $960 million (US$702 million), up 8% (12% in U.S. dollars) year-over-year. The segment delivered a return on equity of 8.2% on a reported basis and
9.6% on an adjusted basis, up 770 basis points and 130 basis points year-over-year respectively, as the business continued to manage capital with discipline.
U.S. Banking performance was supported by growth across core lending portfolios, including double-digit growth year-over-year in middle market commercial
lending and TD’s proprietary credit card balances. In Wealth, record mass affluent sales drove double-digit asset growth year-over-year.
Wealth Management and Insurance delivered record earnings and assets
Wealth Management and Insurance net income was $837 million, up 18% year-over-year, driven by record assets, higher insurance earned premiums, and
deposit volume growth.
1
TD Auto Finance received the highest score in the retail non-captive non-prime segment and the retail non-captive prime segment in the JD Power 2024-2026 Canada Dealer Financing Satisfaction
Studies, which measure Canadian auto dealers’ satisfaction with their auto finance providers. Visit jdpower.com/awards for more details.
2
Core loan growth is defined as growth in average loan volumes excluding the impact of the loan portfolios identified for sale or run-off under the U.S. balance sheet restructuring program.
TD BANK GROUP • SECOND QUARTER 2026 • REPORT TO SHAREHOLDERS
Page 2
Wealth Management launched the fully redesigned TD Easy Trade™ app, delivering a streamlined, mobile-first experience that supports the next generation of
self-directed investors, offering market-leading capabilities. TD Insurance launched a client-facing generative AI powered Virtual Assistant, becoming the first
Canadian home and auto insurer to deploy this capability and making it simpler for clients to connect with TD Insurance.
Wholesale Banking delivered record earnings
Wholesale Banking net income was $612 million, up 46% year-over-year on a reported basis and 38% year-over-year on an adjusted basis, reflecting higher
revenues and lower PCL, partially offset by higher non-interest expenses. Revenue for the quarter was $2,393 million, up 12% year-over-year, driven by strong
execution across Global Markets and Corporate and Investment Banking including strength in Equities, Capital Markets, and Lending businesses.
Wholesale Banking performance reflects the depth and diversification of the platform combined with high levels of client activity and constructive market
conditions. Return on equity for the quarter was 14.5%, a significant improvement year-over-year, driven by strong revenue growth, moderating expense growth,
and disciplined capital management.
Capital
TD’s Common Equity Tier 1 Capital ratio was 14.3%.
Conclusion
“Our ongoing share buy-back and the dividend increase announced today reflect our confidence in TD’s growth and earnings power,” added Chun. “As we deepen
relationships, run our bank simpler and faster, and execute with discipline, we are creating value for shareholders, supporting our clients, and opening new
opportunities for growth. I want to thank our colleagues for delivering once again this quarter for TD and the more than 28 million clients we serve."
The foregoing contains forward-looking statements. Please refer to the “Caution Regarding Forward-Looking Statements” on page 4.
TD BANK GROUP • SECOND QUARTER 2026 • REPORT TO SHAREHOLDERS
Page 3
ENHANCED DISCLOSURE TASK FORCE
The Enhanced Disclosure Task Force (EDTF) was established by the Financial Stability Board (FSB) in 2012 to identify fundamental disclosure principles,
recommendations and leading practices to enhance risk disclosures of banks. The index below includes the recommendations (as published by the EDTF) and
lists the location of the related EDTF disclosures presented in the second quarter 2026 Report to Shareholders (RTS), Supplemental Financial Information (SFI),
or Supplemental Regulatory Disclosures (SRD). Information on TD’s website, SFI, and SRD is not and should not be considered incorporated herein by reference
into the second quarter 2026 RTS, Management’s Discussion and Analysis, or the Interim Consolidated Financial Statements. Certain disclosure references have
been made to the Bank’s 2025 Annual Report.
Type of
Risk
Topic
EDTF Disclosure
Page
RTS
Second
Quarter
2026
SFI
Second
Quarter
2026
SRD
Second
Quarter
2026
Annual Report
2025
General
1
Present all related risk information together in any particular report.
Refer to below for location of disclosures
2
The bank’s risk terminology and risk measures and present key parameter
values used.
92-99, 103, 108,
110, 112,
123-126
3
Describe and discuss top and emerging risks.
82-91
4
Outline plans to meet each new key regulatory ratio once applicable rules
are finalized.
31
78, 120
Risk
Governance
and Risk
Management
and
Business
Model
5
Summarize the bank’s risk management organization, processes, and key
functions.
93-97
6
Description of the bank’s risk culture and procedures applied to support the
culture.
92-93
7
Description of key risks that arise from the bank’s business models and
activities.
77, 92, 98-127
8
Description of stress testing within the bank’s risk governance and capital
frameworks.
75, 97-98, 106,
123
Capital
Adequacy
and Risk
Weighted
Assets
9
Pillar 1 capital requirements and the impact for global systemically important
banks.
29-31,78
1-3, 6
72-74, 79, 235
10
Composition of capital and reconciliation of accounting balance sheet to the
regulatory balance sheet.
1-3, 5
72
11
Flow statement of the movements in regulatory capital.
4
12
Discussion of capital planning within a more general discussion of
management’s strategic planning.
73-76, 123
13
Analysis of how risk-weighted asset (RWA) relate to business activities and
related risks.
9-15
76-77
14
Analysis of capital requirements for each method used for calculating RWA.
13
100-101, 103,
105-106
15
Tabulate credit risk in the banking book for Basel asset classes and major
portfolios.
36-53, 59-65
16
Flow statement reconciling the movements of RWA by risk type.
18-19
17
Discussion of Basel III back-testing requirements.
80
102, 106,
110-111
Liquidity
18
The bank’s management of liquidity needs and liquidity reserves.
37-38, 40-41
112-114, 116 -117
Funding
19
Encumbered and unencumbered assets in a table by balance sheet
category.
39
115, 229
20
Tabulate consolidated total assets, liabilities and off-balance sheet
commitments by remaining contractual maturity at the balance sheet date.
120-122
21
Discussion of the bank’s funding sources and the bank’s funding strategy.
39-40, 42-44
118-120
Market Risk
22
Linkage of market risk measures for trading and non-trading portfolio and
balance sheet.
34
104
23
Breakdown of significant trading and non-trading market risk factors.
34, 36
104, 106-108
24
Significant market risk measurement model limitations and validation
procedures.
35
105-108, 110-111
25
Primary risk management techniques beyond reported risk measures and
parameters.
35
105-108
Credit Risk
26
Provide information that facilitates users’ understanding of the bank’s credit
risk profile, including any significant credit risk concentrations.
26-29, 61-70
23-38
1-5, 13, 18,
20-70, 72-80
59-71, 99-103,
184-191, 201,
203-204, 233-234
27
Description of the bank’s policies for identifying impaired loans.
69
68, 160-161,
167-168, 191
28
Reconciliation of the opening and closing balances of impaired loans in the
period and the allowance for loan losses.
27, 64-65, 67-68
27, 31
66, 187-189
29
Analysis of the bank’s counterparty credit risks that arise from derivative
transactions.
54-55, 66-70
101, 171-172,
195-197,
201, 203-204
30
Discussion of credit risk mitigation, including collateral held for all sources of
credit risk.
102, 164,
171-172
Other Risks
31
Description of ‘other risk’ types based on management’s classifications and
discuss how each one is identified, governed, measured, and managed.
108-112, 123-127
32
Discuss publicly known risk events related to other risks.
75-76
90-91, 227-229
TD BANK GROUP • SECOND QUARTER 2026 • REPORT TO SHAREHOLDERS
Page 4
TABLE OF CONTENTS
MANAGEMENT’S DISCUSSION AND ANALYSIS
4
Caution Regarding Forward-Looking Statements
45
Accounting Policies and Estimates
5
Financial Highlights
45
Changes in Internal Control over Financial Reporting
6
Update on the Remediation of the U.S. Bank Secrecy Act/Anti-Money
46
Glossary
Laundering Program and Enterprise AML Program
8
How We Performed
INTERIM CONSOLIDATED FINANCIAL STATEMENTS
11
Financial Results Overview
49
Interim Consolidated Balance Sheet
15
How Our Businesses Performed
50
Interim Consolidated Statement of Income
24
Quarterly Results
51
Interim Consolidated Statement of Comprehensive Income
25
Balance Sheet Review
52
Interim Consolidated Statement of Changes in Equity
26
Credit Portfolio Quality
53
Interim Consolidated Statement of Cash Flows
29
Capital Position
54
Notes to Interim Consolidated Financial Statements
32
Risk Factors and Management
32
Managing Risk
45
Securitization and Off-Balance Sheet Arrangements
79
SHAREHOLDER AND INVESTOR INFORMATION
MANAGEMENT’S DISCUSSION AND ANALYSIS OF OPERATING PERFORMANCE
This Management’s Discussion and Analysis (MD&A) is presented to enable readers to assess material changes in the financial condition and operating results of
TD Bank Group (“TD” or the “Bank”) for the three and six months ended April 30, 2026, compared with the corresponding periods shown. This MD&A should be
read in conjunction with the Bank’s unaudited Interim Consolidated Financial Statements included in this Report to Shareholders and with the 2025 Annual
Consolidated Financial Statements and 2025 MD&A. This MD&A is dated May 27, 2026. Unless otherwise indicated, all amounts are expressed in Canadian
dollars and have been primarily derived from the Bank’s 2025 Annual Consolidated Financial Statements or Interim Consolidated Financial Statements, prepared
in accordance with IFRS as issued by the IASB. Note that certain comparative amounts have been revised to conform with the presentation adopted in the current
period. Additional information relating to the Bank, including the Bank’s 2025 Annual Information Form, is available on the Bank’s website at http://www.td.com as
well as on SEDAR+ at http://www.sedarplus.ca and on the SEC’s website at http://www.sec.gov (EDGAR filers section).
Caution Regarding Forward-Looking Statements
From time to time, the Bank (as defined in this document) makes written and/or oral forward-looking statements, including in this document, in other filings with Canadian regulators or the United States (U.S.) Securities
and Exchange Commission (SEC), and in other communications. In addition, representatives of the Bank may make forward-looking statements orally to analysts, investors, the media, and others. All such statements are
made pursuant to the “safe harbour” provisions of, and are intended to be forward-looking statements under, applicable Canadian and U.S. securities legislation, including the U.S. Private Securities Litigation Reform Act of
1995. Forward-looking statements include, but are not limited to, statements made in this document, the Management’s Discussion and Analysis (2025 MD&A) in the Bank’s 2025 Annual Report under the heading
“Economic Summary and Outlook”, under the headings “Key Priorities for 2026” and “Operating Environment and Outlook” for the Canadian Personal and Commercial Banking, U.S. Banking, Wealth Management and
Insurance, and Wholesale Banking segments, and under the heading “2025 Accomplishments and Focus for 2026” for the Corporate segment, and in other statements regarding the Bank’s objectives and priorities for 2026
and beyond and strategies to achieve them, the regulatory environment in which the Bank operates, and the Bank’s anticipated financial performance. Forward-looking statements are typically identified by words such as
“will”, “would”, “should”, “believe”, “expect”, “anticipate”, “intend”, “estimate”, “forecast”, “outlook”, “plan”, “goal”, “target”, “possible”, “potential”, “predict”, “project”, “may”, and “could” and similar expressions or variations
thereof, or the negative thereof, but these terms are not the exclusive means of identifying such statements. By their very nature, these forward-looking statements require the Bank to make assumptions and are subject to
inherent risks and uncertainties, general and specific. Especially in light of the uncertainty related to the physical, financial, economic, political, and regulatory environments, such risks and uncertainties – many of which are
beyond the Bank’s control and the effects of which can be difficult to predict – may cause actual results to differ materially from the expectations expressed in the forward-looking statements.
Risk factors that could cause, individually or in the aggregate, such differences include: strategic, credit, market (including equity, commodity, foreign exchange, interest rate, and credit spreads), operational (including
technology, cyber security, process, systems, data, third-party, fraud, infrastructure, insider and conduct), model, insurance, liquidity, capital adequacy, compliance and legal, financial crime, reputational, environmental and
social, and other risks. Examples of such risk factors include general business and economic conditions in the regions in which the Bank operates; geopolitical risk (including policy, trade and tax-related risks and the
potential impact of any new or elevated tariffs or any retaliatory tariffs); inflation, interest rates and recession uncertainty; regulatory oversight and compliance risk; risks associated with the Bank’s ability to satisfy the terms
of the global resolution of the investigations into the Bank’s U.S. Bank Secrecy Act (BSA)/anti-money laundering (AML) program; the impact of the global resolution of the investigations into the Bank’s U.S. BSA/AML
program on the Bank’s businesses, operations, financial condition, and reputation; the ability of the Bank to execute on long-term strategies, shorter-term key strategic priorities, including the successful completion of
acquisitions and dispositions and integration of acquisitions, the ability of the Bank to achieve its financial or strategic objectives with respect to its investments, business retention plans, and other strategic plans; the
business relationship with The Charles Schwab Corporation through the insured deposit account agreement exposes the Bank to certain risks; technology and cyber security risk (including cyber-attacks, data security
breaches or technology failures) on the Bank’s technologies, systems and networks, those of the Bank’s customers (including their own devices), and third parties providing services to the Bank; data risk; model risk; fraud
activity; insider risk; conduct risk; the failure of third parties to comply with their obligations to the Bank or its affiliates, including relating to the care and control of information, and other risks arising from the Bank’s use of
third-parties; the impact of new and changes to, or application of, current laws, rules and regulations, including consumer protection laws and regulations, tax laws, capital guidelines and liquidity regulatory guidance;
increased competition from incumbents and new entrants (including Fintechs and big technology competitors); shifts in consumer attitudes and disruptive technology; environmental and social risk (including climate-related
risk); exposure related to litigation and regulatory matters; ability of the Bank to attract, develop, and retain key talent; changes in foreign exchange rates, interest rates, credit spreads and equity prices; downgrade,
suspension or withdrawal of ratings assigned by any rating agency, the value and market price of the Bank’s common shares and other securities may be impacted by market conditions and other factors; the
interconnectivity of financial institutions including existing and potential international debt crises; increased funding costs and market volatility due to market illiquidity and competition for funding; critical accounting estimates
and changes to accounting standards, policies, and methods used by the Bank; and the occurrence of natural and unnatural catastrophic events and claims resulting from such events.
The Bank cautions that the preceding list is not exhaustive of all possible risk factors and other factors could also adversely affect the Bank’s results. For more detailed information, please refer to the “Risk Factors and
Management” section of the 2025 MD&A, as may be updated in subsequently filed quarterly reports to shareholders and news releases (as applicable) related to any events or transactions discussed under the headings
“Significant Events”, “Significant and Subsequent Events” or “Update on U.S. Bank Secrecy Act (BSA)/Anti-Money Laundering (AML) Program Remediation and Enterprise AML Program Improvement Activities“ in the
relevant MD&A, which applicable releases may be found on www.td.com. All such factors, as well as other uncertainties and potential events, and the inherent uncertainty of forward-looking statements, should be
considered carefully when making decisions with respect to the Bank. The Bank cautions readers not to place undue reliance on the Bank’s forward-looking statements. Material economic assumptions underlying the
forward-looking statements contained in this document are set out in the 2025 MD&A under the headings “Economic Summary and Outlook” and “Significant Events”, under the headings “Key Priorities for 2026” and
“Operating Environment and Outlook” for the Canadian Personal and Commercial Banking, U.S. Banking, Wealth Management and Insurance, and Wholesale Banking segments, and under the heading “2025
Accomplishments and Focus for 2026” for the Corporate segment, each as may be updated in subsequently filed quarterly reports to shareholders and news releases (as applicable). Any forward-looking statements
contained in this document represent the views of management only as of the date hereof and are presented for the purpose of assisting the Bank’s shareholders and analysts in understanding the Bank’s financial position,
objectives and priorities and anticipated financial performance as at and for the periods ended on the dates presented, and may not be appropriate for other purposes. The Bank does not undertake to update any forward-
looking statements, whether written or oral, that may be made from time to time by or on its behalf, except as required under applicable securities legislation.
This document was reviewed by the Bank’s Audit Committee and was approved by the Bank’s Board of Directors, on the Audit Committee’s recommendation, prior to its release.
TD BANK GROUP • SECOND QUARTER 2026 • REPORT TO SHAREHOLDERS
Page 5
TABLE 1: FINANCIAL HIGHLIGHTS
(millions of Canadian dollars, except as noted)
For the three months ended
For the six months ended
April 30
January 31
April 30
April 30
April 30
2026
2026
2025
2026
2025
Results of operations
Total revenue – reported
$
15,797
$
16,585
$
22,937
$
32,382
$
36,986
Total revenue – adjusted
1
16,037
16,629
15,138
32,666
30,168
Provision for (recovery of) credit losses
1,001
1,039
1,341
2,040
2,553
Insurance service expenses (ISE)
1,398
1,622
1,417
3,020
2,924
Non-interest expenses – reported
8,372
8,753
8,139
17,125
16,209
Non-interest expenses – adjusted
1
8,339
8,563
7,908
16,902
15,891
Net income – reported
4,251
4,043
11,129
8,294
13,922
Net income – adjusted
1
4,168
4,216
3,626
8,384
7,249
Financial position
(billions of Canadian dollars)
Total loans net of allowance for loan losses
$
964.3
$
958.5
$
936.4
$
964.3
$
936.4
Total assets
2,085.1
2,099.3
2,064.3
2,085.1
2,064.3
Total deposits
1,243.4
1,245.1
1,267.7
1,243.4
1,267.7
Total equity
124.3
125.6
126.1
124.3
126.1
Total risk-weighted assets
2
641.4
635.2
624.6
641.4
624.6
Financial ratios
Return on common equity (ROE) – reported
3
14.7
%
13.6
%
39.1
%
14.1
%
24.8
%
Return on common equity – adjusted
1
14.4
14.2
12.3
14.3
12.7
Return on tangible common equity (ROTCE)
1,3
17.7
16.3
48.0
17.0
31.3
Return on tangible common equity – adjusted
1
17.2
16.9
15.0
17.1
15.9
Efficiency ratio – reported
3
53.0
52.8
35.5
52.9
43.8
Efficiency ratio – adjusted, net of ISE
1,3,4
57.0
57.1
57.6
57.0
58.3
Provision for (recovery of) credit losses as a % of net
average loans
0.43
0.43
0.58
0.43
0.54
Common share information – reported
(Canadian dollars)
Per share earnings
Basic
$
2.44
$
2.35
$
6.28
$
4.78
$
7.81
Diluted
2.43
2.34
6.27
4.77
7.81
Dividends per share
1.08
1.08
1.05
2.16
2.10
Book value per share
3
68.22
68.20
66.75
68.22
66.75
Closing share price (TSX)
5
146.33
127.26
88.09
146.33
88.09
Shares outstanding (millions)
Average basic
1,660.7
1,680.3
1,740.5
1,670.6
1,745.3
Average diluted
1,665.5
1,684.7
1,741.7
1,675.4
1,746.3
End of period
1,652.1
1,671.2
1,722.5
1,652.1
1,722.5
Market capitalization (billions of Canadian dollars)
$
241.7
$
212.7
$
151.7
$
241.7
$
151.7
Dividend yield
3
3.2
%
3.5
%
5.0
%
3.4
%
5.2
%
Dividend payout ratio
3
44.1
45.9
16.6
45.0
26.8
Price-earnings ratio
3
17.3
10.3
9.1
17.3
9.1
Total shareholder return (1 year)
3
72.2
60.0
13.6
72.2
13.6
Common share information – adjusted
(Canadian dollars)
1
Per share earnings
Basic
$
2.39
$
2.45
$
1.97
$
4.84
$
3.99
Diluted
2.38
2.44
1.97
4.82
3.99
Dividend payout ratio
45.0
%
44.0
%
53.0
%
44.5
%
52.4
%
Price-earnings ratio
15.9
14.5
11.4
15.9
11.4
Capital ratios
2
Common Equity Tier 1 (CET1) Capital ratio
14.3
%
14.5
%
14.9
%
14.3
%
14.9
%
Tier 1 Capital ratio
16.0
16.3
16.6
16.0
16.6
Total Capital ratio
17.8
18.1
18.5
17.8
18.5
Leverage ratio
4.5
4.5
4.7
4.5
4.7
Total Loss Absorbing Capacity (TLAC) ratio
31.1
31.1
31.0
31.1
31.0
TLAC Leverage ratio
8.8
8.6
8.7
8.8
8.7
1
accordance with IFRS as the “reported” results. The Bank also utilizes non-GAAP financial measures such as “adjusted” results and non-GAAP ratios to assess each of its businesses
and to measure overall Bank performance. To arrive at adjusted results, the Bank adjusts reported results for “items of note”. Refer to “How We Performed” or “How Our Businesses
Performed” sections of this document for further explanation, a list of the items of note, and a reconciliation of adjusted to reported results. Non-GAAP financial measures and ratios used
in this document are not defined terms under IFRS and, therefore, may not be comparable to similar terms used by other issuers.
2
(CAR), Leverage Requirements (LR), and Total Loss Absorbing Capacity (TLAC) guidelines. Refer to the “Capital Position” section of this document for further details.
3
4
Q2 2026: $14,639 million, Q1 2026: $15,007 million, Q2 2025: $13,721 million, 2026 YTD: $29,646 million, 2025 YTD: $27,244 million.
5
TD BANK GROUP • SECOND QUARTER 2026 • REPORT TO SHAREHOLDERS
Page 6
UPDATE ON THE REMEDIATION OF THE U.S. BANK SECRECY ACT/ANTI-MONEY LAUNDERING PROGRAM AND
ENTERPRISE AML PROGRAM
As previously disclosed, on October 10, 2024, the Bank announced that, following active cooperation and engagement with authorities and regulators, it reached a
resolution (the “Global Resolution”) of previously disclosed investigations related to its U.S. BSA/AML program. The Bank and certain of its U.S. subsidiaries
consented to orders with the Office of the Comptroller of the Currency (“OCC”), the Federal Reserve Board (“FRB”), and the Financial Crimes Enforcement
Network (“FinCEN”) and entered into plea agreements with the Department of Justice (“DOJ”), Criminal Division, Money Laundering and Asset Recovery Section
and the United States Attorney’s Office for the District of New Jersey. The full terms of the consent orders and plea agreements are available on the Bank’s issuer
profile on SEDAR+ at www.sedarplus.com.
The Bank is focused on meeting the terms of the consent orders and plea agreements, including meeting the requirements to remediate the Bank’s U.S. BSA/AML
program. In addition, the Bank is also undertaking remediation of the Bank’s enterprise-wide AML/Anti-Terrorist Financing and Sanctions Programs (“Enterprise
AML Program”).
For additional information on the risks associated with the remediation of the Bank’s U.S. BSA/AML program and the Bank’s Enterprise AML Program, see the
“Risk Factors That May Affect Future Results – Remediation of the Bank’s U.S. BSA/AML Program and Enterprise AML Program” section of the 2025 MD&A.
Update on the Remediation of the U.S. AML Program
The Bank remains focused on remediating its U.S. BSA/AML program to meet the requirements of the Global Resolution. The Bank continues to work on its
management remediation actions (the term “management remediation actions” is not a regulatory definition and is considered by the Bank to consist of the root
cause assessments, data preparation, design, documentation, frameworks, policies, standards, training, processes, systems, testing and implementation of
controls, as well as the hiring of resources) with significant work and important milestones remaining in calendar 2026 and calendar 2027 including the Suspicious
Activity Report lookback per the OCC consent order which management expects to complete in calendar 2027. For fiscal 2026, the Bank continues to expect U.S.
BSA/AML remediation and related governance and control investments to be largely in line with the previous guidance of approximately US$500 million pre-tax.
All management remediation actions will be subject to demonstrated sustainability and validation by the Bank’s internal audit function (with such activities currently
planned for calendar 2026 and calendar 2027), as well as the review by the appointed monitor, and, ultimately, the review and approval of the Bank’s U.S. banking
regulators and the DOJ. Following such independent reviews, testing, and validation, there could be additional management remediation actions that would take
place after calendar 2027 in which case the overall remediation timeline may be extended. In addition, as the Bank undertakes the lookback reviews, the Bank
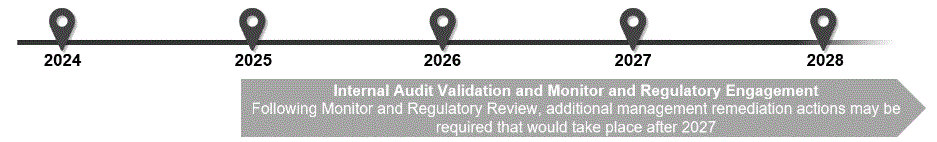
may be required to further expand the scope of the review, either in terms of the subjects being addressed and/or the time period reviewed. The following graph
illustrates the Bank’s expected remediation plan and progress on a calendar year basis, based on its work to date:
The Bank’s remediation timeline is based on the Bank’s current plans, as well as assumptions related to the duration of remediation activities, including the
completion of lookback reviews. The Bank’s ability to meet its planned remediation milestones assumes that the Bank will be able to successfully execute against
its U.S. BSA/AML remediation program plan, which is subject to inherent risks and uncertainties including the Bank’s ability to attract and retain key employees,
the ability of third parties to deliver on their contractual obligations, the successful development and implementation of required technology solutions, and data
availability to complete the required lookback reviews. Furthermore, the execution of the U.S. BSA/AML remediation plan, including these planned milestones, will
not be entirely within the Bank’s control because of various factors such as (i) the requirement to obtain regulatory approval or non-objection before proceeding
with various steps, and (ii) the requirement for the various deliverables to be acceptable to the regulators and/or the monitor. As of the date hereof, the Bank
believes that it and its applicable U.S. subsidiaries have taken such actions as are required of them to date under the terms of the consent orders and plea
agreements and is not aware of them being in breach of the same. For information about the Bank’s AML governance framework, see the “Managing Risk” section
of the Bank’s 2025 Annual Report.
While substantial work remains, the Bank is making progress on remediating and strengthening its U.S. BSA/AML program as previously disclosed including
continued improvements through:
1)
2)
provide more accurate, timely and consistent risk assessments across U.S. Banking’s client population;
3)
effectiveness, completion metrics, and workforce readiness;
4)
identify, detect and manage Money Service Businesses going forward; and
5)
Going forward, the Bank’s focus will be on continuing to remediate and strengthen its U.S. BSA/AML program, including:
1)
2)
3)
advanced detection capabilities;
4)
3
U.S. BSA/AML remediation plan which could change as a result of additional findings that are identified as work progresses, (ii) actual third party monitor and lookback review costs
which could vary from initial estimates and are not entirely within the control of the Bank, as well as (iii) the Bank’s ability to successfully execute against the U.S. BSA/AML remediation
program in accordance with the U.S. Banking segment’s fiscal 2026 and medium-term plan
.
TD BANK GROUP • SECOND QUARTER 2026 • REPORT TO SHAREHOLDERS
Page 7
5)
6)
Strengthening of the Bank’s Enterprise AML Program
The Bank continues to undertake remediation of the Enterprise AML Program, including a range of management remediation and enhancement actions (the term
“management remediation and enhancement actions” is not a regulatory definition and is considered by the Bank to consist of root cause assessments, data
preparation, design, documentation, frameworks, policies, standards, training, processes, systems, testing, and execution of controls, as well as the hiring of
resources). While the Bank has made progress on this remediation work, it is a multi-year endeavour and the remediation work remains ongoing. The timing of
completion of the remediation work will not be entirely within the Bank’s control, and is subject to regulatory feedback, internal review, challenge and validation. As
previously disclosed, following the end of the first quarter of fiscal 2025, the Financial Transactions and Reports Analysis Centre of Canada (FINTRAC)
commenced a review of certain remediation steps that the Bank has taken to date to address the FINTRAC violations. This review is ongoing, and subject to the
outcome, may result in additional regulatory actions.
The remediation and enhancement of the Enterprise AML Program is exposed to similar risks as noted in respect of the remediation of the Bank’s U.S. BSA/AML
Program (see also “Remediation of the U.S. BSA/AML Program” above). In particular, as the Bank continues its remediation and improvement activities of the
Enterprise AML Program, it expects an increase in identification of reportable transactions and/or events, which will add to the operational backlog in the Bank’s
FCRM investigations processing that the Bank currently faces, but is working towards remediating, across the Bank. In addition, on an ongoing basis, the Bank will
continue to review and assess whether issues identified in one jurisdiction have an impact in other jurisdictions. Furthermore, the Bank’s regulators or law
enforcement agencies may identify other issues with the Bank’s Enterprise AML Program, which may result in additional regulatory actions. These issues identified
through the Bank’s own review or by the Bank’s regulators or law enforcement agencies may broaden the scope of the remediation and improvements required for
the Enterprise AML Program.
While substantial work remains, the Bank is making progress on remediating and strengthening the Enterprise AML Program as previously disclosed, including:
1) advanced transaction monitoring capabilities, including enhanced scenario coverage;
2) strengthened governance and first-line engagement in managing financial crime risks via dedicated governance forums; and
3) updated FCRM training standards to strengthen and align requirements globally.
Going forward, the Bank’s focus will be on continuing to remediate and strengthen its Enterprise AML Program, including:
1)
2)
3)
TD BANK GROUP • SECOND QUARTER 2026 • REPORT TO SHAREHOLDERS
Page 8
HOW WE PERFORMED
CORPORATE OVERVIEW
The Toronto-Dominion Bank and its subsidiaries are collectively known as TD Bank Group (“TD” or the “Bank”). TD is the sixth largest bank in North America by
assets and serves 28.1 million clients in four key businesses operating in a number of locations in financial centres around the globe: Canadian Personal and
Commercial Banking, including TD Canada Trust and TD Auto Finance Canada; U.S. Banking, including TD Auto Finance U.S., and TD Wealth (U.S.); Wealth
Management and Insurance, including TD Wealth (Canada), TD Direct Investing, and TD Insurance; and Wholesale Banking, including TD Securities and TD
Cowen. TD also ranks among North America’s leading digital banks, with more than 13 million active mobile users in Canada and the U.S. TD had $2.1 trillion in
assets on April 30, 2026. The Toronto-Dominion Bank trades under the symbol “TD” on the Toronto Stock Exchange and New York Stock Exchange.
HOW THE BANK REPORTS
The Bank prepares its Interim Consolidated Financial Statements in accordance with IFRS, the current GAAP, and refers to results prepared in accordance with
IFRS as “reported” results.
Non-GAAP and Other Financial Measures
In addition to reported results, the Bank also presents certain financial measures, including non-GAAP financial measures that are historical, non-GAAP ratios,
supplementary financial measures and capital management measures, to assess its results. Non-GAAP financial measures, such as “adjusted” results, are utilized
to assess the Bank’s businesses and to measure the Bank’s overall performance.
To
arrive at adjusted results, the Bank adjusts for “items of note” from reported
results. Items of note are items which management does not believe are indicative of underlying business performance and are disclosed in Table 3. Non-GAAP
ratios include a non-GAAP financial measure as one or more of its components. Examples of non-GAAP ratios include adjusted net interest margin, adjusted basic
and diluted earnings per share (EPS), adjusted dividend payout ratio, adjusted efficiency ratio, net of ISE, and adjusted effective income tax rate. The Bank
believes that non-GAAP financial measures and non-GAAP ratios provide the reader with a better understanding of how management views the Bank’s
performance. Non-GAAP financial measures and non-GAAP ratios used in this document are not defined terms under IFRS and, therefore, may not be
comparable to similar terms used by other issuers. Supplementary financial measures depict the Bank’s financial performance and position, and capital
management measures depict the Bank’s capital position, and both are explained in this document where they first appear.
Investment in The Charles Schwab Corporation (“Schwab”) and Insured Deposit Account (IDA) Agreement
On February 12, 2025, the Bank sold its entire remaining equity investment in Schwab through a registered offering and share repurchase by Schwab. The Bank
discontinued recording its share of earnings available to common shareholders from its investment in Schwab following the sale.
Prior to the sale, the Bank accounted for its investment in Schwab using the equity method. The U.S. Banking segment reflected the Bank’s share of net income
from its investment in Schwab. The Corporate segment net income (loss) included amounts for amortization of acquired intangibles, the acquisition and integration
charges related to the Schwab transaction, and the Bank’s share of restructuring and other charges incurred by Schwab. The Bank’s share of Schwab’s earnings
available to common shareholders was reported with a one-month lag. For further details, refer to Note 12 of the Bank’s 2025 Annual Consolidated Financial
Statements.
Subsequent to the sale of the Bank’s entire remaining equity investment in Schwab, the Bank continues to have a business relationship with Schwab through the
insured deposit account agreement (“Schwab IDA Agreement”).
On May 4, 2023, the Bank and Schwab entered into an amended Schwab IDA Agreement, with an initial expiration of July 1, 2034. Pursuant to the Schwab IDA
Agreement, the Bank makes sweep deposit accounts available to clients of Schwab. Schwab designates a portion of the deposits with the Bank as fixed-rate
obligation amounts. Remaining deposits are designated as floating-rate obligations. The IDA deposit floor is set at US$60 billion.
Refer to Note 26 of the Bank’s 2025 Annual Consolidated Financial Statements for further details on the Schwab IDA Agreement.
The following table provides the operating results on a reported basis for the Bank.
TABLE 2: OPERATING RESULTS – Reported
(millions of Canadian dollars)
For the three months ended
For the six months ended
April 30
January 31
April 30
April 30
April 30
2026
2026
2025
2026
2025
Net interest income
$
8,861
$
8,789
$
8,125
$
17,650
$
15,991
Non-interest income
6,936
7,796
14,812
14,732
20,995
Total revenue
15,797
16,585
22,937
32,382
36,986
Provision for (recovery of) credit losses
1,001
1,039
1,341
2,040
2,553
Insurance service expenses
1,398
1,622
1,417
3,020
2,924
Non-interest expenses
8,372
8,753
8,139
17,125
16,209
Income before income taxes and share of net income from
investment in Schwab
5,026
5,171
12,040
10,197
15,300
Provision for (recovery of) income taxes
775
1,128
985
1,903
1,683
Share of net income from investment in Schwab
–
–
74
–
305
Net income – reported
4,251
4,043
11,129
8,294
13,922
Preferred dividends and distributions on other equity instruments
202
101
200
303
286
Net income available to common shareholders
$
4,049
$
3,942
$
10,929
$
7,991
$
13,636
TD BANK GROUP • SECOND QUARTER 2026 • REPORT TO SHAREHOLDERS
Page 9
The following table provides a reconciliation between the Bank’s adjusted and reported results. For further details refer to the “How We Performed” or “How Our
Businesses Performed” sections of this document.
TABLE 3: NON-GAAP FINANCIAL MEASURES – Reconciliation of Adjusted to Reported Net Income
(millions of Canadian dollars)
For the three months ended
For the six months ended
April 30
January 31
April 30
April 30
April 30
2026
2026
2025
2026
2025
Operating results – adjusted
Net interest income
1,2
$
8,904
$
8,833
$
8,208
$
17,737
$
16,128
Non-interest income
3
7,133
7,796
6,930
14,929
14,040
Total revenue
16,037
16,629
15,138
32,666
30,168
Provision for (recovery of) credit losses
1,001
1,039
1,341
2,040
2,553
Insurance service expenses
1,398
1,622
1,417
3,020
2,924
Non-interest expenses
4
8,339
8,563
7,908
16,902
15,891
Income before income taxes and share of net income from
investment in Schwab
5,299
5,405
4,472
10,704
8,800
Provision for (recovery of) income taxes
5
1,131
1,189
929
2,320
1891
Share of net income from investment in Schwab
6
–
–
83
–
340
Net income – adjusted
4,168
4,216
3,626
8,384
7,249
Preferred dividends and distributions on other equity instruments
202
101
200
303
286
Net income available to common shareholders – adjusted
3,966
4,115
3,426
8,081
6,963
Pre-tax adjustments for items of note
Amortization of acquired intangibles
7
(33)
(34)
(43)
(67)
(104)
Restructuring charges
4
–
(200)
(163)
(200)
(163)
Acquisition and integration-related charges
4
–
–
(34)
–
(86)
Impact from the terminated FHN acquisition-related capital hedging strategy
1
(43)
(44)
(47)
(87)
(101)
Gain on sale of Schwab shares
3
–
–
8,975
–
8,975
Balance sheet restructuring
2,3
–
–
(1,129)
–
(2,056)
Federal Deposit Insurance Corporation (FDIC) special assessment
4
–
44
–
44
–
Change in partnership share in the U.S. strategic cards portfolio
3
(197)
–
–
(197)
–
Less: Impact of income taxes
Amortization of acquired intangibles
(8)
(8)
(8)
(16)
(17)
Restructuring charges
–
(52)
(41)
(52)
(41)
Acquisition and integration-related charges
–
–
(8)
–
(19)
Impact from the terminated FHN acquisition-related capital hedging strategy
(10)
(12)
(12)
(22)
(25)
Gain on sale of Schwab shares
5
(288)
–
407
(288)
407
Balance sheet restructuring
–
–
(282)
–
(513)
FDIC special assessment
–
11
–
11
–
Change in partnership share in the U.S. strategic cards portfolio
(50)
–
–
(50)
–
Total adjustments for items of note
83
(173)
7,503
(90)
6,673
Net income available to common shareholders – reported
$
4,049
$
3,942
$
10,929
$
7,991
$
13,636
1
2026 YTD: ($87) million, Q2 2025: ($47) million, 2025 YTD: ($101) million, reported in the Corporate segment.
2
i.
3
i.
ii.
iii.
reported in the U.S. Banking segment.
4
i.
ii.
iii.
iv.
5
filing of the Bank’s tax return. Refer to “Income Taxes” in the “Financial Results Overview” section of this document for further details.
6
i.
7
of net income from investment in Schwab, reported in the Corporate segment. Refer to footnotes 4 and 6 for amounts.
TD BANK GROUP • SECOND QUARTER 2026 • REPORT TO SHAREHOLDERS
Page 10
TABLE 4: RECONCILIATION OF REPORTED TO ADJUSTED EARNINGS PER SHARE
1
(Canadian dollars)
For the three months ended
For the six months ended
April 30
January 31
April 30
April 30
April 30
2026
2026
2025
2026
2025
Basic earnings per share – reported
$
2.44
$
2.35
$
6.28
$
4.78
$
7.81
Adjustments for items of note
(0.05)
0.10
(4.31)
0.06
(3.82)
Basic earnings per share – adjusted
$
2.39
$
2.45
$
1.97
$
4.84
$
3.99
Diluted earnings per share – reported
$
2.43
$
2.34
$
6.27
$
4.77
$
7.81
Adjustments for items of note
(0.05)
0.10
(4.30)
0.05
(3.82)
Diluted earnings per share – adjusted
$
2.38
$
2.44
$
1.97
$
4.82
$
3.99
1
rounding.
TABLE 5: AMORTIZATION OF INTANGIBLES, NET OF INCOME TAXES
(millions of Canadian dollars)
For the three months ended
For the six months ended
April 30
January 31
April 30
April 30
April 30
2026
2026
2025
2026
2025
Schwab
1
$
–
$
–
$
9
$
–
$
35
Wholesale Banking related intangibles
20
20
20
40
41
Other
5
6
6
11
11
Included as items of note
25
26
35
51
87
Software and asset servicing rights
135
135
124
270
243
Amortization of intangibles, net of income taxes
$
160
$
161
$
159
$
321
$
330
1
Return on Common Equity
The consolidated Bank ROE is calculated as reported net income available to common shareholders as a percentage of average common equity. The
consolidated Bank adjusted ROE is calculated as adjusted net income available to common shareholders as a percentage of average common equity. Adjusted
ROE is a non-GAAP financial ratio and can be utilized in assessing the Bank’s use of equity.
ROE for the business segments is calculated as the segment net income as a percentage of average allocated capital. The Bank’s methodology for allocating
capital to its business segments is largely aligned with the common equity capital requirements under Basel III. Capital allocated to the business segments was
based on 11.5% CET1 Capital.
TABLE 6: RETURN ON COMMON EQUITY
(millions of Canadian dollars, except as noted)
For the three months ended
For the six months ended
April 30
January 31
April 30
April 30
April 30
2026
2026
2025
2026
2025
Average common equity
$
113,288
$
115,250
$
114,585
$
114,310
$
110,708
Net income available to common shareholders – reported
4,049
3,942
10,929
7,991
13,636
Items of note, net of income taxes
(83)
173
(7,503)
90
(6,673)
Net income available to common shareholders – adjusted
$
3,966
$
4,115
$
3,426
$
8,081
$
6,963
Return on common equity – reported
14.7
%
13.6
%
39.1
%
14.1
%
24.8
%
Return on common equity – adjusted
14.4
14.2
12.3
14.3
12.7
Return on Tangible Common Equity
Tangible common equity (TCE) is calculated as common shareholders’ equity less goodwill, imputed goodwill and intangibles on the investments in Schwab and
other acquired intangible assets, net of related deferred tax liabilities. ROTCE is calculated as reported net income available to common shareholders after
adjusting for the after-tax amortization of acquired intangibles, which are treated as an item of note, as a percentage of average TCE. Adjusted ROTCE is
calculated using reported net income available to common shareholders, adjusted for all items of note, as a percentage of average TCE. TCE, ROTCE, and
adjusted ROTCE can be utilized in assessing the Bank’s use of equity. TCE is a non-GAAP financial measure, and ROTCE and adjusted ROTCE are non-GAAP
ratios.
TABLE 7: RETURN ON TANGIBLE COMMON EQUITY
(millions of Canadian dollars, except as noted)
For the three months ended
For the six months ended
April 30
January 31
April 30
April 30
April 30
2026
2026
2025
2026
2025
Average common equity
$
113,288
$
115,250
$
114,585
$
114,310
$
110,708
Average goodwill
18,584
18,751
19,302
18,696
19,207
Average imputed goodwill and intangibles on
investments in Schwab
–
–
1,304
–
2,924
Average other acquired intangibles
1
303
339
450
322
456
Average related deferred tax liabilities
(240)
(246)
(236)
(243)
(236)
Average tangible common equity
94,641
96,405
93,765
95,535
88,357
Net income attributable to common
shareholders – reported
4,049
3,942
10,929
7,991
13,636
Amortization of acquired intangibles, net of income taxes
25
26
35
51
87
Net income attributable to common shareholders
adjusted for amortization of acquired intangibles,
net of income taxes
4,074
3,968
10,964
8,042
13,723
Other items of note, net of income taxes
(108)
147
(7,538)
39
(6,760)
Net income available to common shareholders – adjusted
$
3,966
$
4,115
$
3,426
$
8,081
$
6,963
Return on tangible common equity
17.7
%
16.3
%
48.0
%
17.0
%
31.3
%
Return on tangible common equity – adjusted
17.2
16.9
15.0
17.1
15.9
1
TD BANK GROUP • SECOND QUARTER 2026 • REPORT TO SHAREHOLDERS
Page 11
IMPACT OF FOREIGN EXCHANGE RATE ON U.S. BANKING SEGMENT TRANSLATED EARNINGS
The following table reflects the estimated impact of foreign currency translation on key U.S. Banking segment income statement items. The impact is calculated as
the difference in translated earnings using the average U.S. to Canadian dollars exchange rates in the periods noted.
TABLE 8: IMPACT OF FOREIGN EXCHANGE RATE ON U.S. BANKING TRANSLATED
EARNINGS
(millions of Canadian dollars, except as noted)
For the three months ended
For the six months ended
April 30, 2026 vs.
April 30, 2026 vs.
April 30, 2025
April 30, 2025
Increase (Decrease)
Increase (Decrease)
U.S. Banking
Total revenue – reported
$
(141)
$
(236)
Total revenue – adjusted
1
(148)
(243)
Non-interest expenses – reported
(92)
(150)
Non interest expenses – adjusted
1
(92)
(151)
U.S. Banking net income excluding Schwab – reported, after tax
(30)
(55)
U.S. Banking net income excluding Schwab – adjusted, after tax
1
(36)
(59)
U.S. Banking net income – reported, after tax
(30)
(55)
U.S. Banking net income – adjusted, after tax
1
(36)
(59)
Earnings (loss) per share
(Canadian dollars)
Basic – reported
$
(0.02)
$
(0.03)
Basic – adjusted
1
(0.02)
(0.04)
Diluted – reported
(0.02)
(0.03)
Diluted – adjusted
1
(0.02)
(0.04)
Average foreign exchange rate (equivalent of CAD $1.00)
For the three months ended
For the six months ended
April 30
April 30
April 30
April 30
2026
2025
2026
2025
U.S. dollar
$
0.730
$
0.703
$
0.725
$
0.704
1
document.
FINANCIAL RESULTS OVERVIEW
Performance Summary
Outlined below is an overview of the Bank’s performance for the second quarter of 2026. Shareholder performance indicators help guide and benchmark the
Bank’s accomplishments. For the purposes of this analysis, the Bank utilizes adjusted earnings, which excludes items of note from the reported results that are
prepared in accordance with IFRS. Reported and adjusted results and items of note are explained in “Non-GAAP and Other Financial Measures” in the “How We
Performed” section of this document.
●
●
●
average of 64.0%.
Net Income
Quarterly comparison – Q2 2026 vs. Q2 2025
Reported net income for the quarter was $4,251 million, a decrease of $6,878 million, or 62%, compared with the second quarter last year, primarily reflecting the
gain on the Schwab sale transaction in the prior year and higher non-interest expenses, partially offset by higher revenues and lower PCL. On an adjusted basis,
net income for the quarter was $4,168 million, an increase of $542 million, or 15%, compared with the second quarter last year.
By segment, the decrease in reported net income reflects decreases in the Corporate segment of $8,151 million, partially offset by increases in U.S. Banking of
$693 million, in Canadian Personal and Commercial Banking of $257 million, in Wholesale Banking of $193 million, and in Wealth Management and Insurance of
$130 million.
Quarterly comparison – Q2 2026 vs. Q1 2026
Reported net income for the quarter increased $208 million, or 5%, compared with the prior quarter, primarily reflecting the current quarter impact of a tax benefit
related to the prior year's Schwab sale, lower insurance service expenses and restructuring charges in the prior quarter, partially offset by decreased revenues
including the receivable adjustment in the U.S. strategic cards portfolio. Adjusted net income for the quarter decreased by $48 million, or 1%, compared with the
prior quarter.
By segment, the increase in reported net income reflects increases in the Corporate segment of $423 million, in Wealth Management and Insurance of
$80 million, in Wholesale Banking of $51 million, partially offset by decreases in U.S. Banking of $227 million and in Canadian Personal and Commercial Banking
of $119 million.
Year-to-date comparison – Q2 2026 vs. Q2 2025
Reported net income of $8,294 million, decreased $5,628 million, or 40% compared with the same period last year. The decrease primarily reflects the gain on the
Schwab sale transaction in the prior year and higher non-interest expenses, partially offset by higher revenues. Adjusted net income was $8,384 million, an
increase of $1,135 million, or 16%.
By segment, the decrease in reported net income reflects decreases in the Corporate segment of $8,151 million, partially offset by increases in U.S. Banking of
$1,391 million, in Canadian Personal and Commercial Banking of $470 million, in Wholesale Banking of $455 million, and in Wealth Management and Insurance of
$207 million.
Net Interest Income
Quarterly comparison – Q2 2026 vs. Q2 2025
4
Canadian peers include Bank of Montreal, Canadian Imperial Bank of Commerce, Royal Bank of Canada, and The Bank of Nova Scotia.
TD BANK GROUP • SECOND QUARTER 2026 • REPORT TO SHAREHOLDERS
Page 12
Reported net interest income for the quarter was $8,861 million, an increase of $736 million, or 9%, compared with the second quarter last year, primarily reflecting
volume growth and higher margins in Canadian Personal and Commercial Banking, higher net interest income in Wholesale Banking, and higher product margins
and the adjustment related to certain deferred product acquisition costs (the "deferred cost adjustment") in the second quarter last year in U.S. Banking. On an
adjusted basis, net interest income was $8,904 million, an increase of $696 million, or 8%.
By segment, the increase in reported net interest income reflects increases in Canadian Personal and Commercial Banking of $266 million, in Wholesale
Banking of $231 million, in U.S. Banking of $158 million, in Wealth Management and Insurance of $61 million, and in the Corporate segment of $20 million.
Quarterly comparison – Q2 2026 vs. Q1 2026
Reported net interest income for the quarter increased $72 million, or 1%, compared with the prior quarter, primarily reflecting higher net interest income in
Wholesale Banking, partially offset by decreased revenues in Canadian Personal and Commercial Banking and U.S. Banking reflecting fewer days in the second
quarter, and the impact of foreign exchange translation. On an adjusted basis, net interest income increased $71 million, or 1%.
By segment, the increase in reported net interest income reflects increases in Wholesale Banking of $351 million, in Wealth Management and Insurance of
$17 million, partially offset by a decrease in Canadian Personal and Commercial Banking of $105 million, in U.S. Banking of $100 million, and in the Corporate
segment of $91 million.
Year-to-date comparison – Q2 2026 vs. Q2 2025
Reported net interest income was $17,650 million, an increase of $1,659 million, or 10%, compared with the same period last year, primarily reflecting volume
growth and higher loan margins in Canadian Personal and Commercial Banking, higher revenue from treasury and balance sheet activities in the Corporate
segment, higher net interest income in Wholesale Banking, and higher product margins and the impact of U.S. balance sheet restructuring activities in U.S.
Banking. On an adjusted basis, net interest income was $17,737 million, an increase of $1,609 million, or 10%.
By segment, the increase in reported net interest income reflects increases in Canadian Personal and Commercial Banking of $525 million, in U.S. Banking of
$390 million, in the Corporate segment of $383 million, in Wholesale Banking of $263 million, and in Wealth Management and Insurance of $98 million.
Non-Interest Income
Quarterly comparison – Q2 2026 vs. Q2 2025
Reported non-interest income for the quarter was $6,936 million, a decrease of $7,876 million, or 53%, compared with the second quarter last year, primarily
reflecting the gain on the Schwab sale transaction in the prior year in the Corporate segment, partially offset by higher non-interest income in U.S. Banking
reflecting the impact of U.S. balance sheet restructuring activities in the second quarter last year, and higher fee-based revenues from asset growth and higher
insurance earned premiums in Wealth Management and Insurance. On an adjusted basis, non-interest income was $7,133 million, an increase of $203 million, or
3%.
By segment, the decrease in reported non-interest income reflects a decrease in the Corporate segment of $8,994 million, partially offset by increases in U.S.
Banking of $872 million, in Wealth Management and Insurance of $214 million, and in Wholesale Banking of $33 million.
Quarterly comparison – Q2 2026 vs. Q1 2026
Reported non-interest income for the quarter decreased by $860 million, or 11%, compared with the prior quarter, primarily reflecting lower non-interest income in
Wholesale Banking, the receivable adjustment in the U.S. strategic cards portfolio in U.S. Banking, and the impact of fewer days in the second quarter in Wealth
Management and Insurance. On an adjusted basis, non-interest income decreased $663 million, or 9%.
By segment, the decrease in reported non-interest income reflects decreases in Wholesale Banking of $428 million, in U.S. Banking of $201 million, in Wealth
Management and Insurance of $145 million, in Canadian Personal and Commercial Banking of $60 million, and in the Corporate segment of $26 million.
Year-to-date comparison – Q2 2026 vs. Q2 2025
Reported non-interest income was $14,732 million, a decrease of $6,263 million, or 30%, compared with the same period last year, primarily reflecting the gain on
the Schwab sale transaction in the prior year in the Corporate segment, partially offset by higher non-interest income in U.S. Banking reflecting the impact of U.S.
balance sheet restructuring activities in the prior year, higher fee based revenue, insurance earned premiums, transaction revenue in Wealth Management and
Insurance, and higher non-interest income in Wholesale Banking. Adjusted non-interest income was $14,929 million, an increase of $889 million, or 6%.
By segment, the decrease in reported non-interest income reflects a decrease in the Corporate segment of $9,010 million, partially offset by increases in U.S.
Banking of $1,779 million, in Wealth Management and Insurance of $485 million, in Wholesale Banking of $471 million, and in Canadian Personal and Commercial
Banking of $12 million.
Provision for Credit Losses
Quarterly comparison – Q2 2026 vs. Q2 2025
PCL for the quarter was $1,001 million, a decrease of $340 million compared with the second quarter last year. PCL – impaired was $973 million, an increase of
$27 million, or 3%, largely reflecting credit migration in the Canadian and U.S. consumer and Wholesale lending portfolios, partially offset by lower provisions in the
Canadian commercial lending portfolio. PCL – performing was a build of $28 million, a decrease of $367 million compared with the second quarter last year. The
current quarter performing provisions reflect an update to the macroeconomic outlook, and credit migration, partially offset by migration of performing reserves to
impaired in Wholesale Banking. Total PCL for the quarter as an annualized percentage of credit volume was 0.43%.
By segment, PCL was lower by $124 million in Canadian Personal and Commercial Banking, by $100 million in U.S. Banking, by $71 million in the Corporate
segment, and by $45 million in Wholesale Banking.
TD BANK GROUP • SECOND QUARTER 2026 • REPORT TO SHAREHOLDERS
Page 13
Quarterly comparison – Q2 2026 vs. Q1 2026
PCL for the quarter was $1,001 million, a decrease of $38 million compared with the prior quarter. PCL – impaired was $973 million, a decrease of $191 million, or
16%, largely driven by lower credit migration in Wholesale Banking and U.S Banking. PCL – performing was a build of $28 million, compared with a recovery of
$125 million in the prior quarter. The current quarter performing provisions reflect an update to the macroeconomic outlook, and credit migration, partially offset by
migration of performing reserves to impaired in Wholesale Banking. Total PCL for the quarter as an annualized percentage of credit volume was 0.43%.
By segment, PCL was higher by $62 million in Canadian Personal and Commercial Banking, by $47 million in U.S Banking, and lower by $94 million in
Wholesale Banking, and by $53 million in the Corporate segment.
Looking forward, while results may vary by quarter, and are subject to changes to economic conditions, we continue to expect fiscal 2026 PCLs to fall within a
range of 40 to 50 basis points
Year-to-date comparison – Q2 2026 vs. Q2 2025
PCL was $2,040 million, a decrease of $513 million compared with the same period last year. PCL – impaired was $2,137 million, a decrease of $25 million, largely
driven by lower provisions in the U.S. and Canadian commercial and U.S. consumer lending portfolios, partially offset by credit migration in the Canadian
consumer lending portfolios, and a small number of impairments in Wholesale Banking. PCL – performing was a recovery of $97 million, compared with a build of
$391 million in the same period last year. The current year performing recovery largely reflects migration from performing to impaired and an update to the
macroeconomic outlook, partially offset by credit migration in the Canadian consumer lending portfolios. Total PCL as an annualized percentage of credit volume
was 0.43%.
By segment, PCL was lower by $209 million in Canadian Personal and Commercial Banking, by $256 million in U.S. Banking, by $103 million in the Corporate
segment, and higher by $55 million in Wholesale Banking.
TABLE 9: PROVISION FOR CREDIT LOSSES
1
(millions of Canadian dollars)
For the three months ended
For the six months ended
April 30
January 31
April 30
April 30
April 30
2026
2026
2025
2026
2025
Provision for (recovery of) credit losses – Stage 3 (impaired)
Canadian Personal and Commercial Banking
$
465
$
424
$
428
$
889
$
887
U.S. Banking
332
394
309
726
838
Wholesale Banking
80
216
61
296
94
Corporate
2
96
130
148
226
343
Total provision for (recovery of) credit losses – Stage 3
973
1,164
946
2,137
2,162
Provision for (recovery of) credit losses – Stage 1
and Stage 2 (performing)
Canadian Personal and Commercial Banking
33
12
194
45
256
U.S. Banking
10
(99)
133
(89)
55
Wholesale Banking
(2)
(44)
62
(46)
101
Corporate
2
(13)
6
6
(7)
(21)
Total provision for (recovery of) credit losses – Stage 1
and Stage 2
28
(125)
395
(97)
391
Total provision for (recovery of) credit losses
$
1,001
$
1,039
$
1,341
$
2,040
$
2,553
1
2
Insurance Service Expenses
Quarterly comparison – Q2 2026 vs. Q2 2025
Insurance service expenses for the quarter were $1,398 million, relatively flat compared with the second quarter last year.
Quarterly comparison – Q2 2026 vs. Q1 2026
Insurance service expenses decreased $224 million, or 14%, compared with the prior quarter, mainly driven by lower claims frequency as well as reserve releases
related to prior years.
Year-to-date comparison – Q2 2026 vs. Q2 2025
Insurance service expenses were $3,020 million, an increase of $96 million, or 3%, compared with the same period last year, primarily due to business growth and
increased claims severity, partially offset by lower losses from catastrophe claims.
Non-Interest Expenses and Efficiency Ratio
Quarterly comparison – Q2 2026 vs. Q2 2025
Reported non-interest expenses were $8,372 million, an increase of $233 million, or 3%, compared with the second quarter last year, primarily reflecting higher
governance and control investments, including costs for U.S. BSA/AML remediation, and higher spend supporting business growth initiatives including employee-
related expenses, partially offset by restructuring charges in the second quarter last year. On an adjusted basis, non-interest expenses were $8,339 million, an
increase of $431 million, or 5%. The Bank continues to expect fiscal 2026 adjusted expense growth, assuming fiscal 2025 levels of variable compensation, foreign
exchange translation, and U.S. strategic cards portfolio impact, to be at the previously communicated 3% to 4% range, reflecting investments supporting business
growth and investments in governance and control, net of expected productivity and restructuring savings
5
The Bank’s estimated PCL range is based on forward-looking assumptions that have inherent risks and uncertainties. Results may vary depending on actual economic or credit conditions and
performance, such as the level of unemployment, interest rates, economic growth or contraction, and borrower or industry specific credit factors and conditions, inclusive of policy and trade uncertainty.
The Bank’s PCL estimate is subject to risks and uncertainties including those set out in the “Risk Factors That May Affect Future Results” section of this document.
6
The Bank’s expectations regarding expense growth are based on the Bank’s assumptions regarding certain factors, including governance and control investments, timing of business investments,
employee-related expenses, foreign exchange impact, gross-up of the retailer program partners’ share of PCL for the Bank’s U.S. strategic cards portfolio (“SCP Impact”), and productivity and
restructuring savings. In particular in estimating its expense growth expectations, the Bank has assumed that the following three factors on the Bank’s fiscal 2026 adjusted expenses will be the same as
the Bank’s fiscal 2025 adjusted expenses: (i) variable compensation in Wholesale Banking and Wealth Management, (ii) foreign exchange translation, and (iii) SCP Impact. For reference, in the second
quarter of 2026, variable compensation, foreign exchange translation, and the SCP impact, in the aggregate, accounted for approximately 2% of the year-over-year 5% increase in adjusted non-interest
expenses. The Bank’s assumptions are subject to inherent uncertainties and may vary based on factors both within and outside the Bank’s control, including the accuracy of the Bank’s employee
compensation and benefit expense forecasts, impact of business performance on variable compensation, inflation, the pace of productivity initiatives across the organization, and unexpected expenses
such as legal matters. Refer to the “Risk Factors That May Affect Future Results” section of this document for additional information about risks and uncertainties that may impact the Bank’s estimates.
TD BANK GROUP • SECOND QUARTER 2026 • REPORT TO SHAREHOLDERS
Page 14
By segment, the increase in reported non-interest expenses reflects increases in U.S. Banking of $138 million, in Wealth Management and Insurance of
$118 million, in Wholesale Banking of $48 million, and in Canadian Personal and Commercial Banking of $36 million, partially offset by a decrease in the
Corporate segment of $107 million.
The Bank’s reported efficiency ratio was 53.0%, compared to 35.5% in the second quarter last year. The Bank’s adjusted efficiency ratio, net of ISE was 57.0%,
compared with 57.6% in the second quarter last year.
Quarterly comparison – Q2 2026 vs. Q1 2026
Reported non-interest expenses decreased $381 million, or 4%, compared with the prior quarter, primarily reflecting restructuring charges in the prior quarter and
lower employee-related expenses. Adjusted non-interest expenses decreased $224 million, or 3% compared with the prior quarter.
By segment, the decrease in reported non-interest expenses reflects decreases in the Corporate segment of $267 million, in Canadian Personal and
Commercial Banking of $59 million, in Wholesale Banking of $54 million, and in Wealth Management and Insurance of $9 million, partially offset by increases in
U.S. Banking of $8 million.
The Bank’s reported efficiency ratio was 53.0%, compared with 52.8% in the prior quarter. The Bank’s adjusted efficiency ratio, net of ISE was 57.0%, compared
with 57.1% in the prior quarter.
Year-to-date comparison – Q2 2026 vs. Q2 2025
Reported non-interest expenses of $17,125 million increased $916 million, or 6%, compared with the same period last year, primarily reflecting higher investments
in governance and controls, including costs for U.S. BSA/AML remediation, and higher spend supporting business growth initiatives including employee-related
expenses. On an adjusted basis, non-interest expenses were $16,902 million, an increase of $1,011 million, or 6%.
By segment, the increase in reported non-interest expenses reflects increases in the Corporate segment of $314 million, in U.S. Banking of $226 million, in
Wealth Management and Insurance of $203 million, in Canadian Personal and Commercial Banking of $97 million, and in Wholesale Banking of $76 million.
The Bank’s reported efficiency ratio was 52.9%, compared with 43.8% in the same period last year. The Bank’s adjusted efficiency ratio, net of ISE was 57.0%,
compared with 58.3% in the same period last year.
Income Taxes
The Bank’s effective income tax rate on a reported basis was 15.4% for the current quarter, compared with 8.2% in the second quarter last year and 21.8% in the
prior quarter. The year-over-year increase primarily reflects the tax impact on the disposition of Schwab shares in the prior year. The quarter-over-quarter
decrease primarily reflects the current quarter adjustment to the Bank's estimate of taxes owed on the gain from its disposition of Schwab shares in the prior year.
To allow for an after-tax calculation of adjusted income, the adjusted provision for income taxes is calculated by adjusting the taxes for each item of note using
the statutory income tax rate of the applicable legal entity. The adjusted effective income tax rate is calculated as the adjusted provision for income taxes as a
percentage of adjusted net income before taxes. The Bank’s adjusted effective income tax rate was 21.3% for the current quarter, compared with 20.8% in the
second quarter last year and 22.0% in the prior quarter. The year-over-year increase primarily reflects the impact of higher adjusted pre-tax income, partially offset
by changes in earnings mix. The quarter-over-quarter decrease primarily reflects changes in earnings mix.
TABLE 10: INCOME TAXES – Reconciliation of Reported to Adjusted Provision for Income Taxes
(millions of Canadian dollars, except as noted)
For the three months ended
For the six months ended
April 30
January 31
April 30
April 30
April 30
2026
2026
2025
2026
2025
Income taxes at Canadian statutory income tax rate
$
1,397
27.8
%
$
1,438
27.8
%
$
3,347
27.8
%
$
2,835
27.8
%
$
4,253
27.8
%
Increase (decrease) resulting from:
Rate differentials on international operations
1
(591)
(11.8)
(276)
(5.3)
(2,303)
(19.1)
(867)
(8.5)
(2,502)
(16.4)
Other
(31)
(0.6)
(34)
(0.7)
(59)
(0.5)
(65)
(0.6)
(68)
(0.4)
Provision for income taxes and effective
income tax rate – reported
$
775
15.4
%
$
1,128
21.8
%
$
985
8.2
%
$
1,903
18.7
%
$
1,683
11.0
%
Total adjustments for items of note
356
61
(56)
417
208
Provision for income taxes and effective
income tax rate – adjusted
$
1,131
21.3
%
$
1,189
22.0
%
$
929
20.8
%
$
2,320
21.7
%
$
1,891
21.5
%
1
Income Tax Adjustment on the Gain on Sale of Schwab Shares
In the current quarter, the Bank revised its estimate of taxes owed on the gain from its disposition of Schwab shares in the prior year. The revision reflects the
Bank's most recent tax filings and includes previously inestimable information. The revision reduced the Bank's provision for income taxes by $288 million and was
reflected as an item of note in the Corporate segment results.
TD BANK GROUP • SECOND QUARTER 2026 • REPORT TO SHAREHOLDERS
Page 15
ECONOMIC SUMMARY AND OUTLOOK
The global economic outlook continues to slow in calendar 2026. The conflict in the Middle East and resulting surge in oil prices has already lifted inflation and is
expected to continue to put downward pressure on global growth. The conflict has also increased volatility in financial and commodity markets due to uncertainty
over the duration of restricted oil flows through the Strait of Hormuz and elevated oil prices. While some economies, including parts of Europe, may see a modest
pickup in economic activity from higher government spending later in the year, the near-term fallout from the oil supply crunch will remain a dominant theme
weighing on growth in much of Asia and Europe.
Incoming data suggest that the U.S. economy has remained resilient despite a fluid policy backdrop. Activity through the first calendar quarter of 2026 was
supported by continued AI-related capital spending (shifting from construction toward equipment and software) and a rebound in government activity after last
year's shutdown. Consumer spending was a soft spot, in part reflecting bad weather and, more recently, higher gasoline prices. Looking ahead, TD Economics
expects tax cuts, continued investments in AI, and a business-friendly regulatory environment to help sustain the expansion. However, the pace of growth will
remain sensitive to labour market conditions, energy-price volatility and the evolution of trade policy.
Hiring in the U.S. was volatile through the first quarter of calendar 2026, but looking past the month-to-month volatility, the trend indicates job growth has picked
up from an anemic pace at the end of last year alongside a stabilization in the unemployment rate. Inflation pressures have also picked up, reflecting both the
pass-through from tariffs and higher energy prices. We expect core inflation to drift higher in the coming months reflecting the knock-on effects of higher energy
costs. As a result, the Federal Reserve is likely to leave the federal funds rate unchanged at a range of 3.5%-3.75% this year. Should the supply shocks fade and
inflation trends improve, TD Economics forecasts that the Federal Reserve would lower the policy rate towards estimates of a “neutral” level at 3.25%-3.50% in
2027. The timing and pace of interest rate moves will depend on whether job growth weakens further and whether inflationary pressures prove more persistent
than expected.
Canada’s economy has continued to expand at a modest pace. The impact of U.S. tariffs is evident both directly, via weaker exports in affected sectors, and
indirectly, through elevated uncertainty that has tempered hiring and delayed some investment decisions. Overall, Canada's labour market has shown a lack of
dynamism. So far this year, total employment has declined by a modest 28,000 per month on average. Slower population growth has reduced labour force growth,
which has kept the unemployment rate in a still-elevated range of 6.5%-7%. Looking ahead in 2026, a modest improvement in the economy is expected alongside
a gradual improvement in housing activity, public infrastructure and defense outlays, and some firming in business investment. However, the risks to the outlook
remain highly sensitive to geopolitical events and U.S. trade policy.
The Canadian central bank has maintained a steady policy stance in 2026, keeping the overnight rate at 2.25% after substantial easing since mid-2024. TD
Economics expects no change in the policy interest rate through the remainder of 2026. Due to the economy having excess supply and a weakened economic
growth profile, this is expected to outweigh any near-term rise in inflation within the conditions evaluated by the Bank of Canada. Once the conflict subsides, a
generally weaker U.S. dollar and a smaller gap between U.S. and Canadian short-term interest rates are expected to lift the Canadian dollar. TD Economics
expects the Canadian dollar to appreciate to the 74-75 U.S. cent range by late-2026, although the outcome of U.S. trade policy will be a key determinant for timing
and direction.
HOW OUR BUSINESSES PERFORMED
For management reporting purposes, the Bank’s business operations and activities are organized around the following four key business segments: Canadian
Personal and Commercial Banking, U.S. Banking, Wealth Management and Insurance, and Wholesale Banking. The Bank’s other activities are grouped into the
Corporate segment. Effective June 1, 2026, the Bank will implement a reorganization within the Canadian Personal and Commercial Banking segment, whereby
Small Business Banking will transition from Canadian Business Banking to Canadian Personal Banking. The reorganization will not impact the segment’s
reporting.
Results of each business segment reflect revenue, expenses, assets, and liabilities generated by the businesses in that segment. Where applicable, the Bank
measures and evaluates the performance of each segment based on adjusted results and ROE, and for those segments, the Bank indicates that the measure is
adjusted. For further details, refer to the “How We Performed” section of this document, the “Business Focus” section in the Bank’s 2025 MD&A, and Note 27 of
the Bank’s Annual Consolidated Financial Statements for the year ended October 31, 2025.
PCL related to performing (Stage 1 and Stage 2) and impaired (Stage 3) financial assets, loan commitments, and financial guarantees is recorded within the
respective segment.
Net interest income within Wholesale Banking is calculated on a taxable equivalent basis (TEB), which means that the value of non-taxable or tax-exempt
income, including certain dividends, is adjusted to its equivalent pre-tax value. Using TEB allows the Bank to measure income from all securities and loans
consistently and makes for a more meaningful comparison of net interest income with similar institutions. The TEB increase to net interest income and provision for
income taxes reflected in Wholesale Banking results is reversed in the Corporate segment. The TEB adjustment for the quarter was $18 million, compared with
$17 million in the prior quarter and $13 million in the second quarter last year.
The Bank’s U.S. strategic cards portfolio is comprised of agreements with certain U.S. retailers pursuant to which TD is the U.S. issuer of private label and co-
branded consumer credit cards to their U.S. customers. Under the terms of the individual agreements, the Bank and the retailers share in the profits generated by
the relevant portfolios after credit losses. Under IFRS, TD is required to present the gross amount of revenue and PCL related to these portfolios in the Bank’s
Interim Consolidated Statement of Income. At the segment level, the retailer program partners’ share of revenues and credit losses is presented in the Corporate
segment, with an offsetting amount (representing the partners’ net share) recorded in non-interest expenses, resulting in no impact to the Corporate segment’s
reported net income (loss). The net income included in the U.S. Banking segment includes only the portion of revenue and credit losses attributable to TD under
the agreements.
Effective the first quarter of 2026, non-interest income within U.S. Banking is adjusted for the Bank’s share of losses from community-based tax-advantaged
investments accounted for using the equity method which are reclassified to provision for income taxes. This allows the Bank to measure the effective tax rate for
U.S. Banking consistently with similar institutions. The adjustment between non-interest income and provision for income taxes reflected in U.S. Banking results is
reversed in the Corporate segment. Comparative amounts have been reclassified to conform with the presentation adopted in the first quarter of 2026.
On February 12, 2025, the Bank sold its entire remaining equity investment in Schwab. Prior to the sale, the Bank accounted for its investment in Schwab using
the equity method and the share of net income from investment in Schwab was reported in the U.S. Banking segment. Amounts for amortization of acquired
intangibles, the acquisition and integration charges related to the Schwab transaction, and the Bank’s share of restructuring and other charges incurred by Schwab
were recorded in the Corporate segment. Beginning in the third quarter of fiscal 2025, the U.S. Banking segment no longer includes contributions from Schwab
and consequently discussions of the U.S. Banking segment’s performance exclude Schwab.
TD BANK GROUP • SECOND QUARTER 2026 • REPORT TO SHAREHOLDERS
Page 16
TABLE 11: CANADIAN PERSONAL AND COMMERCIAL BANKING
(millions of Canadian dollars, except as noted)
For the three months ended
For the six months ended
April 30
January 31
April 30
April 30
April 30
2026
2026
2025
2026
2025
Net interest income
$
4,289
$
4,394
$
4,023
$
8,683
$
8,158
Non-interest income
967
1,027
968
1,994
1,982
Total revenue
5,256
5,421
4,991
10,677
10,140
Provision for (recovery of) credit losses – impaired
465
424
428
889
887
Provision for (recovery of) credit losses – performing
33
12
194
45
256
Total provision for (recovery of) credit losses
498
436
622
934
1,143
Non-interest expenses
2,088
2,147
2,052
4,235
4,138
Provision for (recovery of) income taxes
745
794
649
1,539
1,360
Net income
$
1,925
$
2,044
$
1,668
$
3,969
$
3,499
Selected volumes and ratios
Return on common equity
1
31.3
%
32.1
%
28.9
%
31.7
%
30.2
%
Net interest margin (including on securitized assets)
2
2.85
2.83
2.82
2.84
2.82
Efficiency ratio
39.7
39.6
41.1
39.7
40.8
Number of Canadian retail branches at period end
1,042
1,043
1,059
1,042
1,059
Average number of full-time equivalent staff
3
33,159
33,660
32,152
33,414
32,204
1
2
GAAP financial measure. Refer to “Non-GAAP and Other Financial Measures” in the “How We Performed” section and the Glossary of this document for additional information about
these metrics.
3
The change mainly impacts the Canadian Personal and Commercial Banking segment. Average number of full-time equivalent staff has been restated for comparative periods.
Quarterly comparison – Q2 2026 vs. Q2 2025
Canadian Personal and Commercial Banking net income for the quarter was $1,925 million, an increase of $257 million, or 15%, compared with the second
quarter last year, primarily reflecting higher revenue and lower PCL. The annualized ROE for the quarter was 31.3%, compared with 28.9% in the second quarter
last year.
Revenue for the quarter was $5,256 million, an increase of $265 million, or 5%, compared with the second quarter last year. Net interest income was
$4,289 million, an increase of $266 million, or 7%, primarily reflecting volume growth and higher margins. Average loan volumes increased $32 billion, or 6%,
reflecting 5% growth in personal loans and 7% growth in business loans. Average deposit volumes increased $12 billion, or 3%, reflecting 1% growth in personal
deposits and 5% growth in business deposits. Net interest margin was 2.85%, an increase of 3 basis points (bps), primarily due to higher margins on loans and
deposits, partially offset by changes in balance sheet mix. Non-interest income was $967 million, relatively flat compared with the second quarter last year.
PCL for the quarter was $498 million, a decrease of $124 million compared with the second quarter last year. PCL – impaired was $465 million, an increase of
$37 million, or 9%, largely reflecting credit migration in the consumer lending portfolios, partially offset by lower provisions in the commercial lending portfolio. PCL
– performing was $33 million, a decrease of $161 million compared with the second quarter last year. The performing provisions this quarter were largely driven by
the consumer lending portfolios reflecting an update to the macroeconomic outlook. Total PCL as an annualized percentage of credit volume was 0.33%, a
decrease of 11 bps compared with the second quarter last year.
Non-interest expenses for the quarter were $2,088 million, an increase of $36 million, or 2%, compared with the second quarter last year, primarily reflecting
higher employee-related expenses.
The efficiency ratio for the quarter was 39.7%, compared with 41.1% in the second quarter last year.
Quarterly comparison – Q2 2026 vs. Q1 2026
Canadian Personal and Commercial Banking net income for the quarter was $1,925 million, a decrease of $119 million, or 6%, compared with the prior quarter,
primarily reflecting the impact of fewer days in the second quarter and higher PCL. The annualized ROE for the quarter was 31.3%, compared with 32.1% in the
prior quarter.
Revenue decreased $165 million, or 3%, compared with the prior quarter. Net interest income decreased $105 million, or 2%, primarily reflecting fewer days in
the second quarter. Average loan volumes increased $3 billion, while average deposit volumes decreased $2 billion. Net interest margin was 2.85%, an increase
of 2 bps, primarily due to higher margins on loans and deposits, partially offset by changes in balance sheet mix. As we look forward to the third quarter, based on
current rate and competitive market dynamics, we expect net interest margin to be relatively stable, similar to this quarter's results
decreased $60 million, or 6%, compared with the prior quarter, reflecting lower fee revenue.
PCL for the quarter was $498 million, an increase of $62 million compared with the prior quarter. PCL – impaired was $465 million, an increase of $41 million, or
10%, largely reflecting higher provisions in the commercial lending portfolio. PCL – performing was $33 million, an increase of $21 million compared with the prior
quarter. The performing provisions this quarter were largely driven by the consumer lending portfolios reflecting an update to the macroeconomic outlook. Total
PCL as an annualized percentage of credit volume was 0.33%, an increase of 5 bps compared with the prior quarter.
Non-interest expenses decreased $59 million, or 3%, compared with the prior quarter, primarily reflecting fewer days in the second quarter.
The efficiency ratio was 39.7%, compared with 39.6% in the prior quarter
Year-to-date comparison – Q2 2026 vs. Q2 2025
Canadian Personal and Commercial Banking net income for the six months ended April 30, 2026, was $3,969 million, an increase of $470 million, or 13%,
compared with the same period last year, reflecting higher revenue and lower PCL, partially offset by higher non-interest expenses. The annualized ROE for the
period was 31.7%, compared with 30.2% in the same period last year.
Revenue for the period was $10,677 million, an increase of $537 million, or 5%, compared with the same period last year. Net interest income was
$8,683 million, an increase of $525 million, or 6%, compared with the same period last year, primarily reflecting volume growth and higher loan margins. Average
loan volumes increased $32 billion, or 5%, reflecting 5% growth in personal loans and 6% growth in business loans. Average deposit volumes increased
$14 billion, or 3%, reflecting 2% growth in personal deposits and 5% growth in business deposits. Net interest margin was 2.84%, an increase of 2 bps, primarily
due to higher margins on loans and deposits, partially offset by changes in balance sheet mix. Non-interest income was $1,994 million, an increase of $12 million,
or 1%, reflecting business growth.
7
deposit reinvestment rates and maturity profiles, and are subject to inherent risks and uncertainties, including those set out in the “Risk Factors That May Affect Future Results” section of this document.
TD BANK GROUP • SECOND QUARTER 2026 • REPORT TO SHAREHOLDERS
Page 17
PCL was $934 million, a decrease of $209 million compared with the same period last year. PCL – impaired was $889 million, an increase of $2 million,
relatively flat compared with the same period last year, reflecting credit migration in the consumer lending portfolios, largely offset by lower provisions in the
commercial lending portfolio. PCL – performing was $45 million, a decrease of $211 million compared with the same period last year. The current year performing
provisions were largely related to credit migration in the consumer lending portfolios and volume growth, partially offset by the impact of a model update in the
other personal lending portfolios. Total PCL as an annualized percentage of credit volume was 0.31%, a decrease of 8 bps compared with the same period last
year.
Non-interest expenses were $4,235 million, an increase of $97 million, or 2%, compared with the same period last year, reflecting higher employee-related
expenses.
The efficiency ratio was 39.7%, compared with 40.8% for the same period last year.
TD BANK GROUP • SECOND QUARTER 2026 • REPORT TO SHAREHOLDERS
Page 18
TABLE 12: U.S. BANKING
(millions of dollars, except as noted)
For the three months ended
For the six months ended
April 30
January 31
April 30
April 30
April 30
Canadian Dollars
2026
2026
2025
2026
2025
Net interest income – reported
$
$
$
$
$
Net interest income – adjusted
1,2
Non-interest income (loss) – reported
3
(284)
(402)
Non-interest income – adjusted
1,3,4
Total revenue – reported
Total revenue – adjusted
1
Provision for (recovery of) credit losses – impaired
Provision for (recovery of) credit losses – performing
(99)
(89)
Total provision for (recovery of) credit losses
Non-interest expenses – reported
Non-interest expenses – adjusted
1,5
Provision for (recovery of) income taxes – reported
3
(68)
(96)
Provision for (recovery of) income taxes – adjusted
1,3
U.S. Banking net income excluding Schwab – reported
U.S. Banking net income excluding Schwab – adjusted
1
Share of net income from investment in Schwab
6,7
–
–
–
U.S. Banking net income – reported
$
$
$
$
$
U.S. Banking net income – adjusted
1
U.S. Dollars
Net interest income – reported
$
$
$
$
$
Net interest income – adjusted
1,2
Non-interest income (loss) – reported
3
(193)
(275)
Non-interest income – adjusted
1,3,4
Total revenue – reported
Total revenue – adjusted
1
Provision for (recovery of) credit losses – impaired
Provision for (recovery of) credit losses – performing
(72)
(65)
Total provision for (recovery of) credit losses
Non-interest expenses – reported
Non-interest expenses – adjusted
1,5
Provision for (recovery of) income taxes – reported
3
(47)
(67)
Provision for (recovery of) income taxes – adjusted
1,3
U.S. Banking net income excluding Schwab – reported
U.S. Banking net income excluding Schwab – adjusted
1
Share of net income from investment in Schwab
6,7
–
–
–
U.S. Banking net income – reported
$
$
$
$
$
U.S. Banking net income – adjusted
1
Selected volumes and ratios
U.S. Banking return on common equity excluding Schwab – reported
8
%
%
%
%
%
U.S. Banking return on common equity excluding Schwab – adjusted
1,8
U.S. Banking return on common equity – reported
8
U.S. Banking return on common equity – adjusted
1,8
Net interest margin – reported
9
Net interest margin – adjusted
1,9
Efficiency ratio – reported
3
Efficiency ratio – adjusted
1,3
Assets under administration (billions of U.S. dollars)
10
$
$
$
$
$
Assets under management (billions of U.S. dollars)
10
Number of U.S. banking stores
Average number of full-time equivalent staff
1
document.
2
i.
2025 YTD: $36 million or US$25 million ($26 million or US$19 million after tax).
3
method which are reclassified to provision for income taxes. The adjustment between non-interest income and provision for income taxes reflected in U.S. Banking results is reversed in the Corporate
segment. The adjustment for the quarter was $179 million (US$131 million), compared with $184 million (US$132 million) in the prior quarter, and $161 million (US$113 million) in the second quarter last
year, 2026 YTD: $363 million (US$263 million); 2025 YTD: $325 million (US$229 million). Comparative amounts have been reclassified to conform with the presentation adopted in the first quarter of
2026.
4
i.
after tax).
ii.
US$144 million ($147 million or US$107 million after tax), 2026 YTD: $197 million or US$144 million ($147 million or US$107 million after tax).
5
i.
tax).
6
7
8
9
of intercompany deposits and cash collateral, which management believes better reflects segment performance. In addition, the value of tax-exempt interest income is adjusted to its equivalent before-
tax value. For investment securities, the adjustment to fair value is included in the calculation of average interest-earning assets. Net interest income and average interest-earning assets used in the
calculation are non-GAAP financial measures.
10
TD BANK GROUP • SECOND QUARTER 2026 • REPORT TO SHAREHOLDERS
Page 19
On February 12, 2025, the Bank sold its entire remaining equity investment in Schwab. Discussions of the U.S. Banking segment's performance exclude Schwab.
Refer to the "Significant Events" section of the Bank's 2025 Annual Report for further details.
During the second quarter of fiscal 2026, the Bank completed the conversion of its Nordstrom credit card portfolio onto the Bank’s servicing platform and received
a greater share of revenue and credit losses. The Bank incurred a charge of $197 million (US$144 million) pre-tax, reflecting an adjustment of amounts which will
no longer be recovered from Nordstrom for expected credit losses ("receivable adjustment").
Quarterly comparison – Q2 2026 vs. Q2 2025
U.S. Banking reported net income was $813 million (US$595 million), an increase of $771 million (US$560 million), compared with the second quarter last year,
reflecting the impact of U.S. balance sheet restructuring activities and lower PCL, partially offset by the receivable adjustment in the U.S. strategic cards portfolio,
higher governance and control investments, including costs for U.S. BSA/AML remediation in the current quarter, and higher spend supporting business growth
initiatives. U.S. Banking adjusted net income was $960 million (US$702 million), an increase of $71 million (US$76 million), or 8% (12% in U.S. dollars), compared
with the second quarter last year, reflecting lower PCL and the impact of U.S. balance sheet restructuring activities, partially offset by higher governance and
control investments, including costs for U.S. BSA/AML remediation in the current quarter, and higher spend supporting business growth initiatives. The reported
and adjusted annualized ROE for the quarter were 8.2% and 9.6%, respectively, compared with 0.5% and 8.3%, respectively, in the second quarter last year.
Reported revenue for the quarter was US$2,762 million, an increase of US$819 million, or 42%, compared with the second quarter last year. Adjusted revenue
for the quarter was US$2,906 million, an increase of US$175 million, or 6%, compared with the second quarter last year. Reported and adjusted net interest
income of US$2,332 million, increased US$196 million, or 9%, on a reported basis, and increased US$171 million, or 8%, on an adjusted basis, largely reflecting
higher product margins and the deferred cost adjustment in the second quarter last year. Reported and adjusted net interest margin of 3.41%, increased 41 bps on
a reported basis, and increased 37 bps on an adjusted basis, due to higher loan and deposit margins, the impact of U.S. balance sheet restructuring activities, and
the normalization of elevated liquidity levels (which positively impacted net interest margin by 8 bps). Reported non-interest income was US$430 million, an
increase of US$623 million, compared with the second quarter last year, reflecting the impact of U.S. balance sheet restructuring activities in the second quarter
last year, partially offset by the receivable adjustment in the U.S. strategic cards portfolio. On an adjusted basis, non-interest income was US$574 million, an
increase of US$4 million, or 1%, compared with the second quarter last year.
Average loan volumes decreased US$13 billion, or 7%, compared with the second quarter last year. Personal loans decreased 4% and business loans
decreased 10%, reflecting U.S. balance sheet restructuring activities. Excluding the impact of the loan portfolios identified for sale or run-off under our U.S.
balance sheet restructuring program, core average loan volumes increased US$4 billion, or 3%
. Average deposit volumes decreased US$17 billion, or 5%,
reflecting a 14% decrease in sweep deposits, a 2% decrease in personal deposits, and a 2% decrease in business deposits.
Assets under administration (AUA) were US$46 billion as at April 30, 2026, an increase of US$1 billion, or 2%, compared with the second quarter last year, and
assets under management (AUM) were US$11 billion as of April 30, 2026, an increase of US$2 billion, or 22%, compared with the second quarter last year, both
reflecting net asset growth and market appreciation.
PCL for the quarter was US$250 million, a decrease of US$61 million compared with the second quarter last year. PCL – impaired was US$243 million, an
increase of US$27 million, or 13%, largely reflecting credit migration in the consumer lending portfolios. PCL – performing was a build of US$7 million, a decrease
of US$88 million compared with the second quarter last year. The performing provisions this quarter were recorded in both the consumer and commercial lending
portfolios, partially offset by lower volume. U.S. Banking PCL including only the Bank’s share of PCL in the U.S. strategic cards portfolio, as an annualized
percentage of credit volume was 0.60%, a decrease of 9 bps compared with the second quarter last year.
Non-interest expenses for the quarter were US$1,807 million, an increase of US$163 million, or 10%, compared to the second quarter last year, reflecting higher
governance and control investments including costs of US$173 million for U.S. BSA/AML remediation, higher spend supporting business growth initiatives, and
higher employee-related expenses.
The reported and adjusted efficiency ratios for the quarter were 65.4% and 62.2%, respectively, compared with 84.6% and 60.2%, respectively, in the second
quarter last year.
Quarterly comparison – Q2 2026 vs. Q1 2026
U.S. Banking reported net income was $813 million (US$595 million), a decrease of $227 million (US$152 million), or 22% (20% in U.S. dollars), compared with
the prior quarter, primarily reflecting the receivable adjustment in the U.S. strategic cards portfolio, higher PCL, the impact of fewer days in the second quarter, and
the expense recovery of the FDIC special assessment charge in the prior quarter. U.S. Banking adjusted net income was $960 million (US$702 million), a
decrease of $47 million (US$21 million), or 5% (3% in U.S. dollars), compared to the prior quarter, primarily reflecting higher PCL and the impact of fewer days in
the second quarter. The reported and adjusted annualized ROE for the quarter were 8.2% and 9.6%, respectively, compared with 9.9% and 9.6%, respectively, in
the prior quarter.
Reported revenue for the quarter was US$2,762 million, a decrease of US$179 million, or 6%, compared with the prior quarter. Adjusted revenue for the quarter
was US$2,906 million, a decrease of US$35 million, or 1%, compared with the prior quarter. Reported and adjusted net interest income of US$2,332 million,
decreased US$40 million, or 2%, largely reflecting fewer days in the second quarter. Net interest margin of 3.41%, increased 3 bps, due to higher loan and deposit
margins. Net interest margin is expected to modestly increase in the third quarter of fiscal 2026
of US$139 million, or 24%, compared with the prior quarter, reflecting the receivable adjustment in the U.S. strategic cards portfolio. On an adjusted basis, non-
interest income was US$574 million, an increase of US$5 million, or 1%, compared with the prior quarter.
Average loan volumes decreased US$2 billion, or 1%, compared with the prior quarter, reflecting a 1% decrease in personal loans and a 1% decrease in
business loans. Excluding the impact of the loan portfolios identified for sale or run-off under our U.S. balance sheet restructuring program, core average loan
volumes were flat
Average deposit volumes decreased US$4 billion, or 1%, compared with the prior quarter, reflecting a 3% decrease in sweep deposits and a
3% decrease in business deposits, partially offset by a 1% increase in personal deposits, compared to the prior quarter.
AUA were US$46 billion as at April 30, 2026, a decrease of US$1 billion, or 2%, compared with the prior quarter, reflecting a decrease in net assets, and AUM
were US$11 billion as at April 30, 2026, flat compared with the prior quarter.
PCL for the quarter was US$250 million, an increase of US$38 million compared with the prior quarter. PCL – impaired was US$243 million, a decrease of
US$41 million, or 14%, reflecting lower provisions in both the commercial and consumer lending portfolios. PCL – performing was a build of US$7 million,
compared with a recovery of US$72 million in the prior quarter. The performing provisions this quarter were recorded in both the consumer and commercial lending
8
Loan portfolios identified for sale or run-off include the Point-of-Sale finance business which services third party retailers, correspondent lending, export and import lending, commercial auto dealer
portfolio, and other non-core portfolios. Q2 2026 average loan volumes: US$173 billion (Q1 2026: US$175 billion; 2026 YTD: US$174 billion; Q2 2025: US$187 billion; 2025 YTD: US$190 billion).
Q2 2026 average loan volumes of loan portfolios identified for sale or run-off: US$9 billion (Q1 2026: US$11 billion; 2026 YTD: US$10 billion; Q2 2025: US$27 billion; 2025 YTD: US$30 billion). Q2 2026
average loan volumes excluding loan portfolios identified for sale or run-off: US$164 billion (Q1 2026: US$164 billion; 2026 YTD: US$164 billion; Q2 2025: US$160 billion; 2025 YTD: US$160 billion).
9
10
planned restructuring opportunities, and other variables, and are subject to inherent risks and uncertainties, including those set out in the “Risk Factors That May Affect Future Results” section of this
document.
TD BANK GROUP • SECOND QUARTER 2026 • REPORT TO SHAREHOLDERS
Page 20
portfolios, partially offset by lower volume. U.S. Banking PCL including only the Bank’s share of PCL in the U.S. strategic cards portfolio, as an annualized
percentage of credit volume was 0.60%, an increase of 11 bps compared with the prior quarter.
Reported and adjusted non-interest expenses for the quarter were US$1,807 million, an increase of US$29 million, or 2%, on a reported basis, compared with
the prior quarter, reflecting the expense recovery of the FDIC special assessment charge in the prior quarter. On an adjusted basis, non-interest expenses were
relatively flat compared with the prior quarter.
The reported and adjusted efficiency ratios for the quarter were 65.4% and 62.2%, respectively, compared with 60.5% and 61.5%, respectively, in the prior
quarter.
Year-to-date comparison – Q2 2026 vs. Q2 2025
U.S. Banking reported net income for the six months ended April 30, 2026, was $1,853 million (US$1,342 million), an increase of $1,668 million
(US$1,202 million), compared with the same period last year, reflecting the impact of U.S. balance sheet restructuring activities, lower PCL, and the expense
recovery of the FDIC special assessment charge, partially offset by higher governance and control investments, including costs for U.S. BSA/AML remediation,
and the receivable adjustment in the U.S. strategic cards portfolio. U.S. Banking adjusted net income was $1,967 million (US$1,425 million), an increase of
$239 million (US$205 million), or 14% (17% in U.S. dollars), reflecting the impact of U.S. balance sheet restructuring activities and lower PCL, partially offset by
higher governance and control investments, including costs for U.S. BSA/AML remediation. The reported and adjusted annualized ROE for the period were 9.0%
and 9.6%, respectively, compared with 0.9% and 7.9%, respectively, in the same period last year.
Reported revenue for the period was US$5,703 million, an increase of US$1,682 million, or 42%, compared with the same period last year. On an adjusted
basis, revenue for the period was US$5,847 million, an increase of US$386 million, or 7%, compared with the same period last year. Reported and adjusted net
interest income of US$4,704 million, increased US$408 million, or 9%, on a reported basis, and increased US$383 million, or 9%, on an adjusted basis, reflecting
higher product margins, the impact of U.S. balance sheet restructuring activities, and the deferred cost adjustment in the prior year. Reported and adjusted net
interest margin of 3.40%, increased 47bps on a reported basis, and increased 45bps on an adjusted basis, due to higher deposit and loan margins and U.S.
balance sheet restructuring activities. Reported non-interest income of US$999 million, increased US$1,274 million, primarily reflecting the impact of U.S. balance
sheet restructuring activities in the prior year, partially offset by the receivable adjustment in the U.S. strategic cards portfolio. On an adjusted basis, non-interest
income of US$1,143 million, increased US$3 million, compared with the same period last year.
Average loan volumes for the period decreased US$15 billion, or 8%, compared with the same period last year, reflecting a 11% decrease in business loans and
a 6% decrease in personal loans. Excluding the impact of the loan portfolios identified for sale or run-off under our U.S. balance sheet restructuring program,
average loan volumes for the period increased US$4 billion, or 2%, compared with the same period last year
. Average deposit volumes decreased
US$15 billion, or 5%, reflecting a 13% decrease in sweep deposits, a 2% decrease in personal deposits, and a 1% decrease in business deposits, compared with
the same period last year.
PCL was US$462 million, a decrease of US$167 million compared with the same period last year. PCL – impaired was US$527 million, a decrease of
US$60 million, or 10%, largely reflecting lower provisions in both the commercial and consumer lending portfolios. PCL – performing was a recovery of
US$65 million, compared to a build of US$42 million in the same period last year. The current year performing recovery reflects an update to the macroeconomic
outlook, migration from performing to impaired in the commercial lending portfolio, and lower volume. U.S. Retail PCL including only the Bank’s share of PCL in the
U.S. strategic cards portfolio, as an annualized percentage of credit volume was 0.54%, a decrease of 14 bps, compared with the same period last year.
Reported non-interest expenses for the period were US$3,585 million, an increase of US$266 million, or 8%, compared with the same period last year, reflecting
higher governance and control investments, including costs for U.S. BSA/AML remediation, higher employee-related expenses, and spend supporting business
growth initiatives, partially offset by the expense recovery of the FDIC special assessment charge. On an adjusted basis, non-interest expenses for the period were
US$3,617 million, increased US$298 million, or 9%, reflecting higher governance and control investments, including costs for U.S. BSA/AML remediation, higher
employee-related expenses, and spend supporting business growth initiatives.
The reported and adjusted efficiency ratios for the period were 62.9% and 61.9%, respectively, compared with 82.5% and 60.8%, respectively, for the same
period last year.
TD BANK GROUP • SECOND QUARTER 2026 • REPORT TO SHAREHOLDERS
Page 21
TABLE 13: WEALTH MANAGEMENT AND INSURANCE
(millions of Canadian dollars, except as noted)
For the three months ended
For the six months ended
April 30
January 31
April 30
April 30
April 30
2026
2026
2025
2026
2025
Net interest income
$
423
$
406
$
362
$
829
$
731
Non-interest income
3,355
3,500
3,141
6,855
6,370
Total revenue
3,778
3,906
3,503
7,684
7,101
Insurance service expenses
1
1,398
1,622
1,417
3,020
2,924
Non-interest expenses
1,249
1,258
1,131
2,507
2,304
Provision for (recovery of) income taxes
294
269
248
563
486
Net income
$
837
$
757
$
707
$
1,594
$
1,387
Selected volumes and ratios
Return on common equity
51.2
%
45.3
%
46.8
%
48.2
%
44.7
%
Return on common equity – Wealth Management
2
65.0
66.3
57.8
65.7
59.9
Return on common equity – Insurance
35.9
22.7
33.5
29.2
27.3
Efficiency ratio
33.1
32.2
32.3
32.6
32.4
Efficiency ratio, net of ISE
3
52.5
55.1
54.2
53.8
55.2
Assets under administration (billions of Canadian dollars)
4
$
797
$
771
$
654
$
797
$
654
Assets under management (billions of Canadian dollars)
643
610
542
643
542
Average number of full-time equivalent staff
16,023
15,872
15,190
15,946
15,183
1
2
3
Q2 2025: $2,086 million, 2026 YTD: $4,664 million, 2025 YTD: $4,177 million. Total revenue, net of ISE is a non-GAAP financial measure. Refer to “Non-GAAP and Other Financial
Measures” in the “How We Performed” section and the Glossary of this document for additional information about this metric.
4
Includes
AUA administered by TD Investment Services Inc. which is part of the Canadian Personal and Commercial Banking segment.
Quarterly comparison – Q2 2026 vs. Q2 2025
Wealth Management and Insurance net income for the quarter was $837 million, an increase of $130 million, or 18%, compared with the second quarter last year,
reflecting Wealth Management net income of $558 million, an increase of $78 million, or 16%, compared with the second quarter last year, and Insurance net
income of $279 million, an increase of $52 million, or 23%, compared with the second quarter last year. The annualized ROE for the quarter was 51.2%, compared
with 46.8% in the second quarter last year. Wealth Management annualized ROE for the quarter was 65.0%, compared with 57.8% in the second quarter last year,
and Insurance annualized ROE for the quarter was 35.9% compared with 33.5% in the second quarter last year.
Revenue for the quarter was $3,778 million, an increase of $275 million, or 8%, compared with the second quarter last year. Non-interest income was
$3,355 million, an increase of $214 million, or 7%, reflecting higher fee-based revenues from asset growth and higher earned premiums. Net interest income was
$423 million, an increase of $61 million, or 17%, compared with the second quarter last year, reflecting higher deposit volumes.
AUA were $797 billion as at April 30, 2026, an increase of $143 billion, or 22%, and AUM were $643 billion as at April 30, 2026, an increase of $101 billion, or
19%, compared with the second quarter last year, both reflecting market appreciation and net asset growth.
Insurance service expenses for the quarter were $1,398 million, relatively flat compared with the second quarter last year.
Non-interest expenses for the quarter were $1,249 million, an increase of $118 million, or 10%, compared with the second quarter last year, reflecting higher
variable compensation commensurate with higher revenue, increased employee-related expenses and technology investments.
The efficiency ratio for the quarter was 33.1%, compared with 32.3% in the second quarter last year. The efficiency ratio, net of ISE for the quarter was 52.5%,
compared with 54.2% in the second quarter last year.
Quarterly comparison – Q2 2026 vs. Q1 2026
Wealth Management and Insurance net income for the quarter was $837 million, an increase of $80 million, or 11%, compared with the prior quarter, reflecting
Wealth Management net income of $558 million, a decrease of $16 million, or 3%, compared with the prior quarter, and Insurance net income of $279 million, an
increase of $96 million, or 52%, compared with the prior quarter. The annualized ROE for the quarter was 51.2%, compared with 45.3% in the prior quarter. Wealth
Management annualized ROE for the quarter was 65.0%, relatively flat to the prior quarter, and Insurance annualized ROE for the quarter was 35.9%, compared
with 22.7% in the prior quarter.
Revenue decreased $128 million, or 3%, compared with the prior quarter. Non-interest income decreased $145 million, or 4%, mainly reflecting the impact of
fewer days in the second quarter. Net interest income increased $17 million, or 4%, reflecting higher deposit volumes.
AUA increased $26 billion, or 3%, and AUM increased $33 billion, or 5%, compared with the prior quarter, both reflecting market appreciation.
Insurance service expenses decreased $224 million, or 14%, compared with the prior quarter, mainly driven by lower claims frequency as well as reserve
releases related to prior years.
Non-interest expenses were relatively flat compared with the prior quarter.
The efficiency ratio for the quarter was 33.1%, compared with 32.2% in the prior quarter. The efficiency ratio, net of ISE, for the quarter was 52.5%, compared
with 55.1% in the prior quarter.
Year-to-date comparison – Q2 2026 vs. Q2 2025
Wealth Management and Insurance net income for the six months ended April 30, 2026, was $1,594 million, an increase of $207 million, or 15%, compared with
the same period last year, reflecting Wealth Management net income of $1,132 million, an increase of $140 million, or 14%, compared with the same period last
year, and Insurance net income of $462 million, an increase of $67 million, or 17%, compared with the same period last year. The annualized ROE for the period
was 48.2%, compared with 44.7% in the same period last year. Wealth Management annualized ROE for the period was 65.7%, compared with 59.9% in the same
period last year, and Insurance annualized ROE for the period was 29.2%, compared with 27.3% in the same period last year.
Revenue for the period was $7,684 million, an increase of $583 million, or 8%, compared with the same period last year. Non-interest income increased
$485 million, or 8%, reflecting higher fee-based revenue from asset growth, insurance earned premiums, and transaction revenue. Net interest income increased
$98 million, or 13%, primarily reflecting higher deposit volumes.
Insurance service expenses were $3,020 million, an increase of $96 million, or 3%, compared with the same period last year, primarily due to business growth
and increased claims severity, partially offset by lower losses from catastrophe claims.
Non-interest expenses were $2,507 million, an increase of $203 million, or 9%, compared with the same period last year, reflecting higher variable compensation
commensurate with higher revenue, increased employee-related expenses and technology investments.
TD BANK GROUP • SECOND QUARTER 2026 • REPORT TO SHAREHOLDERS
Page 22
The efficiency ratio for the period was 32.6%, compared with 32.4% for the same period last year. The efficiency ratio, net of ISE, for the period was 53.8%,
compared with 55.2% in the same period last year.
TABLE 14: WHOLESALE BANKING
(millions of Canadian dollars, except as noted)
For the three months ended
For the six months ended
April 30
January 31
April 30
April 30
April 30
2026
2026
2025
2026
2025
Net interest income (loss) (TEB)
$
276
$
(75)
$
45
$
201
$
(62)
Non-interest income
2,117
2,545
2,084
4,662
4,191
Total revenue
2,393
2,470
2,129
4,863
4,129
Provision for (recovery of) credit losses – impaired
80
216
61
296
94
Provision for (recovery of) credit losses – performing
(2)
(44)
62
(46)
101
Total provision for (recovery of) credit losses
78
172
123
250
195
Non-interest expenses – reported
1,509
1,563
1,461
3,072
2,996
Non-interest expenses – adjusted
1,2
1,509
1,563
1,427
3,072
2,910
Provision for (recovery of) income taxes (TEB) – reported
194
174
126
368
220
Provision for (recovery of) income taxes (TEB) – adjusted
1
194
174
134
368
239
Net income – reported
$
612
$
561
$
419
$
1,173
$
718
Net income – adjusted
1
612
561
445
1,173
785
Selected volumes and ratios
Trading-related revenue (TEB)
1,3
$
868
$
1,146
$
856
$
2,014
$
1,760
Average gross lending portfolio (billions of Canadian dollars)
4
100.0
93.9
103.1
97.0
102.0
Return on common equity – reported
5
14.5
%
12.6
%
10.2
%
13.5
%
8.8
%
Return on common equity – adjusted
1,5
14.5
12.6
10.9
13.5
9.6
Efficiency ratio – reported
63.1
63.3
68.6
63.2
72.6
Efficiency ratio – adjusted
1
63.1
63.3
67.0
63.2
70.5
Average number of full-time equivalent staff
7,226
7,334
6,970
7,281
6,944
1
Glossary of this document.
2
($67 million after tax).
3
of $989 million, (Q1 2026: $1,601 million, Q2 2025: $1,128 million, 2026 YTD: $2,590 million, 2025 YTD: $2,436 million). Trading-related revenue (TEB) is a non-GAAP financial measure.
4
5
Quarterly comparison – Q2 2026 vs. Q2 2025
Wholesale Banking reported and adjusted net income for the quarter was $612 million. Reported net income for the quarter increased $193 million, or 46%,
compared with the second quarter last year, primarily reflecting higher revenues and lower PCL, partially offset by higher non-interest expenses. On an adjusted
basis, net income increased $167 million, or 38%, compared with the second quarter last year.
Revenue for the quarter was $2,393 million, an increase of $264 million, or 12%, compared with the second quarter last year. Higher revenue primarily reflects
higher lending and financing revenue, advisory fees and equity commissions.
PCL for the quarter was $78 million, a decrease of $45 million compared with the second quarter last year. PCL – impaired was $80 million, an increase of
$19 million compared with the prior year, reflecting a small number of impairments across various industries. PCL – performing was a recovery of $2 million,
compared to a build of $62 million in the prior year. The performing recovery this quarter reflects migration of reserves from performing to impaired, partially offset
by an update to the macroeconomic outlook.
Reported and adjusted non-interest expenses for the quarter were $1,509 million. Reported non-interest expenses increased $48 million, or 3%, compared with
the second quarter last year, primarily reflecting higher variable compensation and operating costs, including front office and technology, partially offset by the
cessation of acquisition and integration-related costs. On an adjusted basis, non-interest expenses increased $82 million, or 6%.
Quarterly comparison – Q2 2026 vs. Q1 2026
Wholesale Banking reported and adjusted net income for the quarter was $612 million. Reported and adjusted net income increased $51 million, or 9%, compared
with the prior quarter, primarily reflecting lower PCL and non-interest expenses, partially offset by lower revenues.
Revenue for the quarter decreased $77 million, or 3%, compared with the prior quarter. Lower revenue primarily reflects lower trading-related revenue, partially
offset by higher underwriting fees, lending and financing revenue and the net change in fair value of loan underwriting commitments.
PCL for the quarter was $78 million, a decrease of $94 million compared with the prior quarter. PCL – impaired was $80 million, a decrease of $136 million, due
to higher impairments in the prior period. PCL – performing was a recovery of $2 million, compared with a recovery of $44 million in the prior quarter. The
performing recovery this quarter reflects migration of reserves from performing to impaired, partially offset by an update to the macroeconomic outlook.
Reported and adjusted non-interest expenses for the quarter decreased $54 million, or 3%, compared with the prior quarter, primarily reflecting lower operating
costs, including front office and technology and variable compensation.
Year-to-date comparison – Q2 2026 vs. Q2 2025
Wholesale Banking reported and adjusted net income for the six months ended April 30, 2026 was $1,173 million. Reported net income for the quarter increased
$455 million, or 63%, compared with the same period last year, reflecting higher revenues, partially offset by higher non-interest expenses and PCL. On an
adjusted basis, net income increased $388 million, or 49%.
Revenue was $4,863 million, an increase of $734 million, or 18%, compared with the same period last year. Higher revenue primarily reflects higher lending and
financing revenue, trading-related revenue, and advisory fees.
PCL was $250 million, an increase of $55 million compared with the same period last year. PCL – impaired was $296 million, an increase of $202 million,
reflecting a small number of impairments across various industries. PCL – performing was a recovery of $46 million, compared to a build of $101 million in the
same period last year. The current year performing recovery was driven by migration from performing to impaired, partially offset by an update to the
macroeconomic outlook.
Reported and adjusted non-interest expenses were $3,072 million. Reported non-interest expenses increased $76 million, or 3%, compared with the same
period last year, primarily reflecting higher operating costs, including front office and technology, variable compensation, and spend supporting business growth,
partially offset by the cessation of acquisition and integration-related costs. On an adjusted basis, non-interest expenses increased $162 million, or 6%.
TD BANK GROUP • SECOND QUARTER 2026 • REPORT TO SHAREHOLDERS
Page 23
TABLE 15: CORPORATE
(millions of Canadian dollars)
For the three months ended
For the six months ended
April 30
January 31
April 30
April 30
April 30
2026
2026
2025
2026
2025
Net income (loss) – reported
$
64
$
(359)
$
8,215
$
(295)
$
7,856
Adjustments for items of note
Amortization of acquired intangibles
33
34
43
67
104
Restructuring charges
–
200
163
200
163
Impact from the terminated FHN acquisition-related capital hedging strategy
43
44
47
87
101
Gain on sale of Schwab shares
–
–
(8,975)
–
(8,975)
Less: impact of income taxes
Gain on sale of Schwab shares
1
288
–
(407)
288
(407)
Other items of note
18
72
61
90
83
Net income (loss) – adjusted
2
$
(166)
$
(153)
$
(161)
$
(319)
$
(427)
Decomposition of items included in net income (loss) – adjusted
Net corporate expenses
3
$
(543)
$
(515)
$
(431)
$
(1,058)
$
(801)
Other
377
362
270
739
374
Net income (loss) – adjusted
2
$
(166)
$
(153)
$
(161)
$
(319)
$
(427)
Selected volumes
Average number of full-time equivalent staff
4
18,111
18,098
18,356
18,104
18,073
1
Taxes" in the "Financial Results Overview" section of this document for further details.
2
Glossary of this document.
3
4
The change mainly impacts the Canadian Personal and Commercial Banking segment. Average number of full-time equivalent staff has been restated for comparative periods.
Quarterly comparison – Q2 2026 vs. Q2 2025
Corporate segment’s reported net income for the quarter was $64 million, compared with $8,215 million in the second quarter last year. The lower net income
primarily reflects the gain on sale of Schwab shares in the prior year. Net corporate expenses increased $112 million compared with the second quarter last year,
primarily reflecting continued investments in governance and controls. The adjusted net loss for the quarter was $166 million, compared with $161 million in the
prior year.
Quarterly comparison – Q2 2026 vs. Q1 2026
Corporate segment’s reported net income for the quarter was $64 million, compared with a reported net loss of $359 million in the prior quarter. The quarter-over-
quarter change primarily reflects the current quarter impact of a tax benefit related to the prior year's gain on sale of Schwab shares and restructuring charges in
the prior quarter. The adjusted net loss for the quarter was $166 million, compared with $153 million in the prior quarter.
Year-to-date comparison – Q2 2026 vs. Q2 2025
Corporate segment’s reported net loss for the six months ended April 30, 2026 was $295 million, compared with a reported net income of $7,856 million in the
same period last year. The year-over-year change primarily reflects the gain on sale of Schwab shares in the prior year. Net corporate expenses increased
$257 million compared to the same period last year, primarily reflecting continued investments in governance and controls. The adjusted net loss for the six
months ended April 30, 2026 was $319 million, compared with $427 million in the same period last year.
TD BANK GROUP • SECOND QUARTER 2026 • REPORT TO SHAREHOLDERS
Page 24
QUARTERLY RESULTS
The following table provides summary information related to the Bank’s eight most recently completed quarters.
TABLE 16: QUARTERLY RESULTS
(millions of Canadian dollars, except as noted)
For the three months ended
2026
2026
2025
2024
Apr. 30
Jan. 31
Oct. 31
Jul. 31
Apr. 30
Jan. 31
Oct. 31
Jul. 31
Net interest income
$
8,861
$
8,789
$
8,545
$
8,526
$
8,125
$
7,866
$
7,940
$
7,579
Non-interest income
6,936
7,796
6,949
6,771
14,812
6,183
7,574
6,597
Total revenue
15,797
16,585
15,494
15,297
22,937
14,049
15,514
14,176
Provision for (recovery of) credit losses
1,001
1,039
982
971
1,341
1,212
1,109
1,072
Insurance service expenses
1,398
1,622
1,602
1,563
1,417
1,507
2,364
1,669
Non-interest expenses
8,372
8,753
8,808
8,522
8,139
8,070
8,050
11,012
Provision for (recovery of) income taxes
775
1,128
822
905
985
698
534
794
Share of net income from investment in Schwab
–
–
–
–
74
231
178
190
Net income (loss) – reported
4,251
4,043
3,280
3,336
11,129
2,793
3,635
(181)
Pre-tax adjustments for items of note
1
Amortization of acquired intangibles
33
34
34
33
43
61
60
64
Acquisition and integration charges related to the
Schwab transaction
2,3
–
–
–
–
–
–
35
21
Restructuring charges
–
200
190
333
163
–
–
110
Acquisition and integration-related charges
–
–
44
32
34
52
82
78
Impact from the terminated FHN acquisition-related
capital hedging strategy
43
44
49
55
47
54
59
62
Gain on sale of Schwab shares
–
–
–
–
(8,975)
–
(1,022)
–
Balance sheet restructuring
–
–
485
262
1,129
927
311
–
Indirect tax matters
2,4
–
–
–
–
–
–
226
–
FDIC special assessment
–
(44)
–
–
–
–
(72)
–
Change in partnership share in the U.S. strategic
cards portfolio
197
–
–
–
–
–
–
–
Global resolution of the investigations into the
Bank’s U.S. BSA/AML program
2
–
–
–
–
–
–
52
3,566
Total pre-tax adjustments for items of note
1
273
234
802
715
(7,559)
1,094
(269)
3,901
Less: Impact of income taxes
356
61
177
180
(56)
264
161
74
Net income – adjusted
1
4,168
4,216
3,905
3,871
3,626
3,623
3,205
3,646
Preferred dividends and distributions on other
equity instruments
202
101
191
88
200
86
193
69
Net income available to common
shareholders – adjusted
1
$
3,966
$
4,115
$
3,714
$
3,783
$
3,426
$
3,537
$
3,012
$
3,577
(Canadian dollars, except as noted)
Basic earnings (loss) per share
Reported
$
2.44
$
2.35
$
1.82
$
1.89
$
6.28
$
1.55
$
1.97
$
(0.14)
Adjusted
1
2.39
2.45
2.19
2.20
1.97
2.02
1.72
2.05
Diluted earnings (loss) per share
Reported
2.43
2.34
1.82
1.89
6.27
1.55
1.97
(0.14)
Adjusted
1
2.38
2.44
2.18
2.20
1.97
2.02
1.72
2.05
Return on common equity – reported
14.7
%
13.6
%
10.7
%
11.3
%
39.1
%
10.1
%
13.4
%
(1.0)
%
Return on common equity – adjusted
1
14.4
14.2
12.8
13.2
12.3
13.2
11.7
14.1
(billions of Canadian dollars, except as noted)
Average total assets
$
2,098
$
2,121
$
2,102
$
2,112
$
2,156
$
2,063
$
2,035
$
1,968
Average interest-earning assets
5
1,865
1,882
1,863
1,855
1,894
1,883
1,835
1,778
Net interest margin – reported
1.95
%
1.85
%
1.82
%
1.82
%
1.76
%
1.66
%
1.72
%
1.70
%
Net interest margin – adjusted
1
1.96
1.86
1.83
1.83
1.78
1.67
1.74
1.71
1
document.
2
i.
ii.
iii.
3
segment:
i.
4
i.
5
Performed” section and the Glossary of this document for additional information about these metrics.
TD BANK GROUP • SECOND QUARTER 2026 • REPORT TO SHAREHOLDERS
Page 25
BALANCE SHEET REVIEW
TABLE 17: SELECTED INTERIM CONSOLIDATED BALANCE SHEET ITEMS
(millions of Canadian dollars)
As at
April 30, 2026
October 31, 2025
Assets
Cash and Interest-bearing deposits with banks
$
115,982
$
116,929
Trading loans, securities, and other
231,680
220,136
Non-trading financial assets at fair value through profit or loss
8,095
7,395
Derivatives
74,835
82,972
Financial assets designated at fair value through profit or loss
7,299
6,986
Financial assets at fair value through other comprehensive income
128,612
126,369
Debt securities at amortized cost, net of allowance for credit losses
238,677
240,439
Securities purchased under reverse repurchase agreements
220,120
247,078
Loans, net of allowance for loan losses
964,289
953,012
Other
95,516
93,242
Total assets
$
2,085,105
$
2,094,558
Liabilities
Trading deposits
$
39,308
$
37,882
Derivatives
74,532
79,356
Financial liabilities designated at fair value through profit or loss
222,503
197,635
Deposits
1,243,431
1,267,104
Obligations related to securities sold under repurchase agreements
218,392
221,150
Subordinated notes and debentures
10,345
10,733
Other
152,276
152,871
Total liabilities
1,960,787
1,966,731
Total equity
124,318
127,827
Total liabilities and equity
$
2,085,105
$
2,094,558
Total assets
appreciation in the Canadian dollar decreased total assets by $29 billion.
The decrease in total assets reflects a decrease in securities purchased under reverse repurchase agreements of $27 billion, derivatives of $8 billion, debt
securities at amortized cost of $2 billion, cash and interest-bearing deposits with banks of $1 billion. The decrease was partially offset by an increase in trading
loans, securities, and other of $12 billion, loans net of allowances for loan losses of $11 billion, financial assets at fair value through other comprehensive income
(FVOCI) of $2 billion, other assets of $2 billion, and non-trading financial assets at fair value through profit or loss (FVTPL) of $1 billion.
Cash and interest-bearing deposits with banks
decreased $1 billion primarily reflecting the impact of foreign exchange translation, partially offset by cash
management activities.
Trading loans, securities, and other
increased $12 billion primarily in equity securities and government and government-related debt securities, partially offset
by the impact of foreign currency translation.
Non-trading financial assets at fair value through profit or loss
Derivative
assets decreased $8 billion primarily reflecting a decrease in the mark-to-market values of foreign exchange contracts, partially offset by increases in
equity contracts and commodity contracts.
Financial assets at fair value through other comprehensive income
the impact of foreign exchange translation.
Debt securities at amortized cost, net of allowance for credit losses
translation, partially offset by new investments.
Securities purchased under reverse repurchase agreements
decreased $27 billion
primarily
reflecting a decrease in volume and the impact of foreign
exchange translation.
Loans, net of allowance for loan losses
increased $11 billion primarily reflecting volume growth in consumer instalment and business and government loans,
partially offset by a decrease in residential mortgages and the impact of foreign exchange translation.
Other assets
increased $2 billion primarily reflecting an increase in amounts receivable from brokers, dealers, and clients due to higher volumes of pending
trades.
Total liabilities
appreciation in the Canadian dollar decreased total liabilities by $31 billion.
The decrease in total liabilities reflects a decrease in deposits of $24 billion, derivatives of $5 billion, obligations related to securities sold under repurchase
agreements of $3 billion, and other liabilities of $1 billion. The decrease was partially offset by an increase in financial liabilities designated at FVTPL of $25 billion
and trading deposits of $2 billion.
Trading deposits
increased $2 billion primarily reflecting new issuances, partially offset by maturities.
TD BANK GROUP • SECOND QUARTER 2026 • REPORT TO SHAREHOLDERS
Page 26
Derivative
liabilities
decreased $5 billion primarily reflecting a decrease in mark-to-market values of foreign exchange contracts, partially offset by equity contracts.
Financial liabilities designated at fair value through profit or loss
impact of foreign exchange translation.
Deposits
decreased $24 billion primarily reflecting the impact of foreign exchange translation and lower volumes in business and government deposits and bank
deposits. The decrease is partially offset by higher volumes in personal deposits.
Obligations related to securities sold under repurchase agreements
decreased $3 billion primarily reflecting the impact of foreign exchange translation.
Other liabilities
decreased $1 billion primarily reflecting a decrease in obligations related to securities sold short and accrued salaries and employee benefits. The
decrease was partially offset by an increase in amounts payable to brokers, dealers, and clients, and securitization liabilities.
Equity
was $124 billion as at April 30, 2026, a decrease of $4 billion from October 31, 2025. The decrease reflects losses in accumulated other comprehensive
income, primarily driven by unrealized foreign currency translation and cash flow hedges. The retained earnings is flat as the net income for the period is offset by
the premium on the repurchase of common shares and dividend distributions.
CREDIT PORTFOLIO QUALITY
Quarterly comparison – Q2 2026 vs. Q2 2025
Gross impaired loans were $5,281 million as at April 30, 2026, an increase of $415 million, or 9%, compared with the second quarter last year. Canadian Personal
and Commercial Banking gross impaired loans increased $337 million, or 19%, compared with the second quarter last year, reflecting higher impairments in both
the consumer and commercial lending portfolios. U.S. Banking gross impaired loans increased $252 million, or 9%, compared with the second quarter last year,
reflecting higher impairments in the consumer and commercial lending portfolios, and the impact of foreign exchange. Wholesale gross impaired loans decreased
$172 million, or 53%, compared with the second quarter last year, reflecting resolutions outpacing formations. Net impaired loans were $3,751 million as at
April 30, 2026, an increase of $513 million, or 16%, compared with the second quarter last year.
The allowance for credit losses of $9,454 million as at April 30, 2026 was comprised of Stage 3 allowance for impaired loans of $1,535 million, Stage 2
allowance of $4,706 million and Stage 1 allowance of $3,208 million, and the allowance for debt securities of $5 million. The Stage 1 and 2 allowances are for
performing loans and off-balance sheet instruments.
The Stage 3 allowance for loan losses decreased $97 million, or 6%, reflecting a decrease in the Wholesale and Canadian commercial lending portfolios,
partially offset by an increase in the U.S. Banking and Canadian consumer lending portfolios. The Stage 1 and Stage 2 allowance for loan losses decreased
$38 million, or 1%, reflecting the impact of foreign exchange, partially offset by credit migration. The allowance change included a decrease of $96 million
attributable to the retailer program partners’ share of the U.S. strategic cards portfolio.
Forward-looking information, including macroeconomic variables deemed to be predictive of expected credit losses (ECLs) based on the Bank’s experience, is
used to determine ECL scenarios and associated probability weights to determine the probability-weighted ECLs. Each quarter, all base forecast macroeconomic
variables are refreshed, resulting in new upside and downside macroeconomic scenarios. The probability weightings assigned to each ECL scenario are also
reviewed each quarter and updated as required, as part of the Bank’s ECL governance process. As a result of periodic reviews and quarterly updates, the
allowance for credit losses may be revised to reflect updates in loss estimates based on the Bank’s recent loss experience and its forward-looking views. The Bank
periodically reviews the methodology and has performed certain additional quantitative and qualitative portfolio and loan level assessments of significant increase
in credit risk. Refer to Note 3 and Note 6 of the Bank’s second quarter 2026 Interim Consolidated Financial Statements for further details on forward-looking
information.
The probability-weighted allowance for credit losses reflects the Bank’s forward-looking views.
To
the extent that certain anticipated effects cannot be fully
incorporated into quantitative models, management continues to exercise expert credit judgment in determining the amount of ECLs, including for risks related to
elevated uncertainty associated with policy and trade, and such adjustments will be updated as appropriate in future quarters as additional information becomes
available. Refer to Note 6 of the Bank’s second quarter 2026 Interim Consolidated Financial Statements for additional details.
The Bank calculates allowances for ECLs on debt securities measured at amortized cost and FVOCI. The Bank has $364 billion in such debt securities, all of
which are performing (Stage 1 and 2) and none are impaired (Stage 3). The allowance for credit losses was $2 million for debt securities at amortized cost (DSAC)
and $3 million for debt securities at FVOCI, for a total of $5 million, flat, compared with the second quarter last year.
Quarterly comparison – Q2 2026 vs. Q1 2026
Gross impaired loans decreased $313 million, or 6%, compared with the prior quarter, largely reflected in the Wholesale Banking and U.S consumer portfolios,
partially offset by an increase in Canadian Personal and Commercial Banking. Impaired loans net of allowance decreased $149 million, or 4%, compared with the
prior quarter.
The allowance for credit losses of $9,454 million as at April 30, 2026 was comprised of Stage 3 allowance for impaired loans of $1,535 million, Stage 2
allowance of $4,706 million and Stage 1 allowance of $3,208 million, and the allowance for debt securities of $5 million. The Stage 1 and 2 allowances are for
performing loans and off-balance sheet instruments. The Stage 3 allowance for loan losses decreased $165 million, or 10%, compared with the prior quarter,
reflecting a lower pace of impaired provisions relative to resolutions in the Wholesale Banking portfolio, partially offset by higher impairments in the Canadian
Personal and Commercial Banking portfolio. The Stage 1 and Stage 2 allowance for loan losses increased $17 million, relatively flat compared with the prior
quarter, reflective of an update to the macroeconomic outlook, with the increase in reserves largely recorded in the Canadian Personal and Commercial Banking
segment.
The allowance for debt securities increased by $1 million, compared to the prior quarter.
For further details on loans, impaired loans, allowance for credit losses, and on the Bank’s use of forward-looking information and macroeconomic variables in
determining its allowance for credit losses, refer to Note 6 of the Bank’s second quarter 2026 Interim Consolidated Financial Statements.
TD BANK GROUP • SECOND QUARTER 2026 • REPORT TO SHAREHOLDERS
Page 27
TABLE 18: CHANGES IN GROSS IMPAIRED LOANS
1
(millions of Canadian dollars)
For the three months ended
For the six months ended
April 30
January 31
April 30
April 30
April 30
2026
2026
2025
2026
2025
Personal, Business, and Government Loans
Impaired loans as at beginning of period
$
5,594
$
5,420
$
5,453
$
5,420
$
4,949
Classified as impaired during the period
2,122
2,579
2,031
4,701
4,463
Transferred to performing during the period
(376)
(297)
(451)
(673)
(778)
Net repayments
(582)
(569)
(688)
(1,151)
(1,220)
Disposals of loans
(125)
(240)
–
(365)
(47)
Amounts written off
(1,340)
(1,210)
(1,315)
(2,550)
(2,459)
Exchange and other movements
(12)
(89)
(164)
(101)
(42)
Impaired loans as at end of period
$
5,281
$
5,594
$
4,866
$
5,281
$
4,866
1
TABLE 19: ALLOWANCE FOR CREDIT LOSSES
(millions of Canadian dollars, except as noted)
As at
April 30
January 31
April 30
2026
2026
2025
Allowance for loan losses for on-balance sheet loans
Stage 1 allowance for loan losses
$
2,736
$
2,723
$
2,645
Stage 2 allowance for loan losses
4,153
4,150
4,340
Stage 3 allowance for loan losses
1,530
1,694
1,628
Total allowance for loan losses for on-balance sheet loans
1
8,419
8,567
8,613
Allowance for off-balance sheet instruments
Stage 1 allowance for loan losses
472
469
415
Stage 2 allowance for loan losses
553
555
552
Stage 3 allowance for loan losses
5
6
4
Total allowance for off-balance sheet instruments
1,030
1,030
971
Allowance for loan losses
9,449
9,597
9,584
Allowance for debt securities
5
4
5
Allowance for credit losses
$
9,454
$
9,601
$
9,589
Impaired loans, net of allowance
2
$
3,751
$
3,900
$
3,238
Net impaired loans as a percentage of net loans
2
0.39
%
0.41
%
0.35
%
Total allowance for credit losses as a percentage of gross loans
0.97
0.99
1.01
Provision for (recovery of) credit losses as a percentage of net average loans
0.43
0.43
0.58
1
2
Real Estate Secured Lending
Retail real estate secured lending includes mortgages and lines of credit to North American consumers to satisfy financing needs including home purchases and
refinancing. While the Bank retains first lien on the majority of properties held as security, there is a small portion of loans with second liens, but most of these are
behind a TD mortgage or home equity line of credit (HELOC) that is in first position. In Canada, credit policies are designed so that the combined exposure of all
uninsured facilities on one property does not exceed 80% of the collateral value at origination. Lending at a higher loan-to-value ratio is permitted by legislation but
requires default insurance. This insurance is contractual coverage for the life of eligible facilities and protects the Bank’s real estate secured lending portfolio
against potential losses caused by borrowers’ default. The Bank may also purchase default insurance on lower loan-to-value ratio loans. The insurance is provided
by either government-backed entities or approved private mortgage insurers. In the U.S., for residential mortgage originations, mortgage insurance is usually
obtained from either government-backed entities or approved private mortgage insurers when the loan-to-value exceeds 80% of the collateral value at origination.
The Bank regularly performs stress tests on its real estate lending portfolio as part of its overall stress testing program. This is done with a view to determine the
extent to which the portfolio would be vulnerable to a severe downturn in economic conditions. The effect of severe changes in house prices, interest rates, and
unemployment levels are among the factors considered when assessing the impact on credit losses and the Bank’s overall profitability. A variety of portfolio
segments, including dwelling type and geographical regions, are examined during the exercise to determine whether specific vulnerabilities exist.
TABLE 20: CANADIAN REAL ESTATE SECURED LENDING
1
(millions of Canadian dollars)
As at
Amortizing
Non-amortizing
Total
Residential
Home equity
Total amortizing real
Home equity
mortgages
lines of credit
estate secured lending
lines of credit
April 30, 2026
Total
$
254,028
$
124,857
$
378,885
$
39,374
$
418,259
October 31, 2025
Total
$
267,469
$
110,829
$
378,298
$
37,098
$
415,396
1
TD BANK GROUP • SECOND QUARTER 2026 • REPORT TO SHAREHOLDERS
Page 28
TABLE 21: REAL ESTATE SECURED LENDING
1,2
(millions of Canadian dollars, except as noted)
As at
Residential mortgages
Home equity lines of credit
Total
Insured
3
Uninsured
Insured
3
Uninsured
Insured
3
Uninsured
April 30, 2026
Canada
Atlantic provinces
$
2,252
0.9
%
$
4,947
1.9
%
$
132
0.1
%
$
3,197
1.9
%
$
2,384
0.6
%
$
8,144
1.9
%
British Columbia
4
7,385
2.9
44,406
17.5
673
0.4
32,152
19.6
8,058
1.9
76,558
18.3
Ontario
4
20,631
8.1
118,698
46.8
2,275
1.4
89,360
54.4
22,906
5.5
208,058
49.7
Prairies
4
15,286
6.0
22,074
8.7
1,248
0.8
17,930
10.9
16,534
4.0
40,004
9.6
Québec
5,409
2.1
12,940
5.1
408
0.2
16,856
10.3
5,817
1.4
29,796
7.1
Total Canada
50,963
20.0
%
203,065
80.0
%
4,736
2.9
%
159,495
97.1
%
55,699
13.4
%
362,560
86.6
%
United States
1,483
44,483
–
12,415
1,483
56,898
Total
$
52,446
$
247,548
$
4,736
$
171,910
$
57,182
$
419,458
October 31, 2025
Canada
Atlantic provinces
$
2,377
0.9
%
$
5,038
1.9
%
$
139
0.1
%
$
2,833
1.9
%
$
2,516
0.6
%
$
7,871
1.9
%
British Columbia
4
7,849
2.9
47,101
17.6
708
0.5
28,551
19.3
8,557
2.1
75,652
18.2
Ontario
4
21,505
8.1
124,702
46.6
2,412
1.6
80,826
54.7
23,917
5.7
205,528
49.5
Prairies
4
16,350
6.1
22,746
8.5
1,320
0.9
15,738
10.6
17,670
4.3
38,484
9.3
Québec
5,933
2.2
13,868
5.2
433
0.3
14,967
10.1
6,366
1.5
28,835
6.9
Total Canada
54,014
20.2
%
213,455
79.8
%
5,012
3.4
%
142,915
96.6
%
59,026
14.2
%
356,370
85.8
%
United States
1,544
46,050
–
12,481
1,544
58,531
Total
$
55,558
$
259,505
$
5,012
$
155,396
$
60,570
$
414,901
1
2
3
caused by borrower default. It is provided by either government-backed entities or other approved private mortgage insurers.
4
The following table provides a summary of the period over which the Bank’s residential mortgages would be fully repaid based on the amount of the most recent
payment received. All figures are calculated based on current customer payment amounts, including voluntary payments larger than the original contractual
amounts and/or other voluntary prepayments. The most recent customer payment amount may exceed the original contractual amount due.
Balances with a remaining amortization longer than 30 years primarily reflect Canadian variable rate mortgages where prior interest rate increases relative to
current customer payment levels have resulted in a longer current amortization period. At renewal, the amortization period for Canadian mortgages reverts to the
remaining contractual amortization, which may require increased payments.
TABLE 22: RESIDENTIAL MORTGAGES BY REMAINING AMORTIZATION
1,2
As at
<=5
>5 – 10
>10 – 15
>15 – 20
>20 – 25
>25 – 30
>30 – 35
>35
years
years
years
years
years
years
years
years
Total
April 30, 2026
Canada
0.8
%
3.0
%
8.7
%
20.1
%
32.0
%
30.3
%
1.2
%
3.9
%
100.0
%
United States
2.5
1.7
3.6
9.3
29.4
51.9
1.0
0.6
100.0
Total
1.1
%
2.8
%
7.9
%
18.4
%
31.6
%
33.7
%
1.1
%
3.4
%
100.0
%
October 31, 2025
Canada
0.8
%
2.9
%
8.3
%
20.0
%
31.9
%
30.2
%
1.2
%
4.7
%
100.0
%
United States
2.6
1.6
3.5
9.0
24.1
57.8
0.8
0.6
100.0
Total
1.1
%
2.7
%
7.5
%
18.3
%
30.8
%
34.5
%
1.1
%
4.0
%
100.0
%
1
2
TABLE 23: UNINSURED AVERAGE LOAN-TO-VALUE – Newly Originated and Newly Acquired
1,2,3
For the three months ended
Residential
Home equity
Residential
Home equity
mortgages
lines of credit
4,5
Total
mortgages
lines of credit
4,5
Total
April 30, 2026
October 31, 2025
Canada
Atlantic provinces
68
%
69
%
69
%
70
%
69
%
69
%
British Columbia
6
67
66
66
66
66
66
Ontario
6
69
68
68
68
67
67
Prairies
6
73
72
72
72
72
72
Québec
69
71
70
69
71
71
Total Canada
69
68
68
68
68
68
United States
68
57
63
68
58
64
Total
69
%
68
%
68
%
68
%
68
%
68
%
1
2
3
4
5
6
TD BANK GROUP • SECOND QUARTER 2026 • REPORT TO SHAREHOLDERS
Page 29
Sovereign Risk
The table below provides a summary of the Bank’s direct credit exposures outside of Canada and the U.S. (Europe excludes United Kingdom).
TABLE 24: Total Net Exposure by Region and Counterparty
(millions of Canadian dollars)
As at
Loans and commitments
1
Derivatives, repos, and securities lending
2
Trading and investment portfolio
3
Total
Corporate
Sovereign
Financial
Total
Corporate
Sovereign
Financial
Total
Corporate
Sovereign
Financial
Total
Exposure
4
April 30, 2026
Region
Europe
$
9,084
$
8
$
4,903
$
13,995
$
5,236
$
1,767
$
9,864
$
16,867
$
1,140
$
25,200
$
2,388
$
28,728
$
59,590
United Kingdom
6,873
4,132
2,601
13,606
2,607
1,997
10,667
15,271
384
891
748
2,023
30,900
Asia
168
20
2,587
2,775
228
1,122
4,030
5,380
67
8,119
1,538
9,724
17,879
Other
5
342
27
676
1,045
1,130
351
1,987
3,468
88
180
2,033
2,301
6,814
Total
$
16,467
$
4,187
$
10,767
$
31,421
$
9,201
$
5,237
$
26,548
$
40,986
$
1,679
$
34,390
$
6,707
$
42,776
$
115,183
October 31, 2025
Region
Europe
$
8,895
$
8
$
5,019
$
13,922
$
5,331
$
1,359
$
9,647
$
16,337
$
1,116
$
25,876
$
1,982
$
28,974
$
59,233
United Kingdom
6,731
2,577
2,483
11,791
3,199
1,537
12,237
16,973
270
176
661
1,107
29,871
Asia
182
23
2,527
2,732
241
538
3,795
4,574
138
8,346
1,829
10,313
17,619
Other
5
227
–
690
917
705
410
2,353
3,468
110
216
1,967
2,293
6,678
Total
$
16,035
$
2,608
$
10,719
$
29,362
$
9,476
$
3,844
$
28,032
$
41,352
$
1,634
$
34,614
$
6,439
$
42,687
$
113,401
1
2
Association master netting agreement.
3
4
5
CAPITAL POSITION
REGULATORY CAPITAL
Capital requirements established by the Basel Committee on Banking Supervision (BCBS) are commonly referred to as Basel III. Under Basel III, Total Capital
consists of three components, namely CET1, Additional Tier 1, and Tier 2 Capital. Risk sensitive regulatory capital ratios are calculated by dividing CET1, Tier 1,
and Total Capital by risk-weighted assets (RWA), inclusive of any minimum requirements outlined under the regulatory floor. Basel III also introduced a non-risk
sensitive leverage ratio to act as a supplementary measure to the risk-sensitive capital requirements. The leverage ratio is calculated by dividing Tier 1 Capital by
leverage exposure which is primarily comprised of on-balance sheet assets with adjustments made to derivative and securities financing transaction exposures,
and credit equivalent amounts of off-balance sheet exposures. TD manages its regulatory capital in accordance with OSFI’s implementation of the Basel III Capital
Framework.
OSFI’s Capital Requirements under Basel III
OSFI’s CAR and LR guidelines detail how the Basel III capital rules apply to Canadian banks.
The Domestic Stability Buffer (DSB) level increased from 3% to 3.5% as of November 1, 2023, and has remained stable since. Currently, the DSB can range from
0% to 4%, with the effective level adjusted by OSFI in response to developments in Canada’s financial system and the broader economy.
OSFI has implemented the Basel III reforms with adjustments to make them suitable for domestic implementation. The Basel III reforms impact the calculation of
credit risk, market risk and operational risk for Canadian banks, as well as amend the LR Guideline to include a requirement for domestic systemically important
banks (D-SIBs) to hold a leverage ratio buffer of 0.50% in addition to the regulatory minimum requirement of 3.0%. The LR buffer requirement also applies to the
TLAC leverage ratio.
On November 1, 2023, the standardized capital floor transitioned to 67.5% of RWA from the previous 65% of RWA. OSFI has stated that the floor will remain at
67.5% until further notice.
The Bank has implemented OSFI’s Parental Stand-Alone (Solo) Total Loss Absorbing Capacity (TLAC) Framework for D-SIBs, which establishes a risk-based
measure intended to ensure that a non-viable D-SIB has sufficient loss absorbing capacity on a stand-alone, legal entity basis to support its resolution. The Bank is
compliant with the requirements set out in this framework.
The table below summarizes OSFI’s published regulatory minimum capital targets as at April 30, 2026.
REGULATORY CAPITAL AND TLAC TARGET RATIOS
Capital
Pillar 1
Pillar 1 & 2
Conservation
D-SIB / G-SIB
Regulatory
Regulatory
Minimum
Buffer
Surcharge
1
Target
2
DSB
Target
CET1
4.5
%
2.5
%
1.0
%
8.0
%
3.5
%
11.5
%
Tier 1
6.0
2.5
1.0
9.5
3.5
13.0
Total Capital
8.0
2.5
1.0
11.5
3.5
15.0
Leverage
3.0
n/a
3
0.5
3.5
n/a
3.5
TLAC
18.0
2.5
1.0
21.5
3.5
25.0
TLAC Leverage
6.75
n/a
0.50
7.25
n/a
7.25
1
requirement for risk-weighted capital ratio. The G-SIB surcharge may increase above 1%, to a maximum of 4%, if the Bank’s G-SIB score increases above certain thresholds. OSFI’s LR
Guideline includes a requirement for D-SIBs to hold a leverage ratio buffer set at 50% of a D-SIB’s higher loss absorbency risk-weighted requirements, effectively 0.50%. This buffer also
applies to the TLAC Leverage ratio.
2
3
TD BANK GROUP • SECOND QUARTER 2026 • REPORT TO SHAREHOLDERS
Page 30
The following table provides details of the Bank’s regulatory capital position.
TABLE 25: CAPITAL STRUCTURE AND RATIOS – Basel III
(millions of Canadian dollars, except as noted)
As at
April 30
October 31
April 30
2026
2025
2025
Common Equity Tier 1 Capital
Common shares plus related contributed surplus
$
24,596
$
25,010
$
25,308
Retained earnings
78,295
78,320
78,640
Accumulated other comprehensive income
9,802
12,874
11,032
Common Equity Tier 1 Capital before regulatory adjustments
112,693
116,204
114,980
Common Equity Tier 1 Capital regulatory adjustments
Prudential valuation adjustments
(180)
(165)
(164)
Goodwill (net of related tax liability)
(18,235)
(18,753)
(18,491)
Intangibles (net of related tax liability)
(3,541)
(3,316)
(3,058)
Deferred tax assets excluding those arising from temporary differences
(192)
(202)
(327)
Cash flow hedge reserve
2,104
867
1,174
Shortfall of provisions to expected losses
–
–
–
Gains and losses due to changes in own credit risk on fair valued liabilities
(158)
(166)
(317)
Defined benefit pension fund net assets (net of related tax liability)
(821)
(811)
(736)
Investment in own shares
(1)
(9)
(5)
Non-significant investments in the capital of banking, financial, and insurance entities, net of eligible
short positions (amount above 10% threshold)
–
–
–
Significant investments in the common stock of banking, financial, and insurance entities
that are outside the scope of regulatory consolidation, net of eligible short positions
(amount above 10% threshold)
–
–
–
Equity investments in funds subject to the fall-back approach
(27)
(90)
(28)
Crypto-asset deduction
(5)
–
–
Other deductions or regulatory adjustments to CET1 as determined by OSFI
23
20
20
Total regulatory adjustments to Common Equity Tier 1 Capital
(21,033)
(22,625)
(21,932)
Common Equity Tier 1 Capital
91,660
93,579
93,048
Additional Tier 1 Capital instruments
Directly issued qualifying Additional Tier 1 instruments plus stock surplus
11,625
11,623
11,111
Additional Tier 1 Capital instruments before regulatory adjustments
11,625
11,623
11,111
Additional Tier 1 Capital instruments regulatory adjustments
Non-significant investments in the capital of banking, financial, and insurance entities, net of eligible
short positions (amount above 10% threshold)
–
–
–
Significant investments in the capital of banking, financial, and insurance entities that are outside
the scope of regulatory consolidation, net of eligible short positions
(700)
(700)
(700)
Total regulatory adjustments to Additional Tier 1 Capital
(700)
(700)
(700)
Additional Tier 1 Capital
10,925
10,923
10,411
Tier 1 Capital
102,585
104,502
103,459
Tier 2 Capital instruments and provisions
Directly issued qualifying Tier 2 instruments plus related stock surplus
10,345
10,733
10,514
Collective allowances
1,158
1,661
1,553
Tier 2 Capital before regulatory adjustments
11,503
12,394
12,067
Tier 2 regulatory adjustments
Investments in own Tier 2 instruments
(8)
–
–
Non-significant investments in the capital of banking, financial, and insurance entities, net of eligible
short positions (amount above 10% threshold)
1
–
–
–
Non-significant investments in the other TLAC-eligible instruments issued by G-SIBs and Canadian
D-SIBs, where the institution does not own more than 10% of the issued common share capital
of the entity: amount previously designated for the 5% threshold but that no longer meets the
conditions
(48)
(30)
–
Significant investments in the capital of banking, financial, and insurance entities that are outside
the scope of regulatory consolidation, net of eligible short positions
–
–
–
Total regulatory adjustments to Tier 2 Capital
(56)
(30)
–
Tier 2 Capital
11,447
12,364
12,067
Total Capital
$
114,032
$
116,866
$
115,526
Risk-weighted assets
$
641,358
$
636,424
$
624,636
Capital Ratios and Multiples
Common Equity Tier 1 Capital (as percentage of risk-weighted assets)
14.3
%
14.7
%
14.9
%
Tier 1 Capital (as percentage of risk-weighted assets)
16.0
16.4
16.6
Total Capital (as percentage of risk-weighted assets)
17.8
18.4
18.5
Leverage ratio
2
4.5
4.6
4.7
1
10% of the issued common share capital of the entity.
2
TD BANK GROUP • SECOND QUARTER 2026 • REPORT TO SHAREHOLDERS
Page 31
As at April 30, 2026, the Bank’s CET1, Tier 1, and Total Capital ratios were 14.3%, 16.0%, and 17.8%, respectively. The decrease in the Bank’s CET1 Capital ratio
from 14.7% as at October 31, 2025 was primarily driven by common shares repurchased for cancellation and growth in RWA, partially offset by earnings net of
dividends, and credit risk model updates. The Bank expects to reach a CET1 ratio of approximately 13% by October 31, 2027
As at April 30, 2026, the Bank’s leverage ratio was 4.5%. Compared with the Bank’s leverage ratio of 4.6% as at October 31, 2025, the decrease was primarily
attributable to common shares repurchased for cancellation, partially offset by earnings net of dividends.
Future Regulatory Capital Developments
Future regulatory capital developments were described in the “Future Regulatory Capital Developments” section of the Bank’s 2025 MD&A.
TABLE 26: EQUITY AND OTHER SECURITIES
1
(thousands of shares/units and millions of Canadian dollars, except as noted)
As at
April 30, 2026
October 31, 2025
Number of
Number of
shares/units
Amount
shares/units
Amount
Common shares
Common shares outstanding
1,652,420
$
24,309
1,689,496
$
24,727
Treasury – common shares
(369)
(60)
–
–
Total common shares
1,652,051
$
24,249
1,689,496
$
24,727
Stock options
Vested
5,751
5,160
Non-vested
8,298
9,027
Preferred shares – Class A
Series 1
20,000
$
500
20,000
$
500
Series 16
14,000
350
14,000
350
Series 18
14,000
350
14,000
350
Series 27
850
850
850
850
Series 28
800
800
800
800
49,650
$
2,850
49,650
$
2,850
Other equity instruments
2,3
Limited Recourse Capital Notes – Series 1
1,750
1,750
1,750
1,750
Limited Recourse Capital Notes – Series 2
1,500
1,500
1,500
1,500
Limited Recourse Capital Notes – Series 3
4
1,750
2,403
1,750
2,403
Limited Recourse Capital Notes – Series 4
4
750
1,023
750
1,023
Limited Recourse Capital Notes – Series 5
750
750
750
750
Limited Recourse Capital Notes – Series 6
4
750
1,037
750
1,037
Perpetual Subordinated Capital Notes – Series 2023-9
5
1
312
1
312
56,901
$
11,625
56,901
$
11,625
Treasury – preferred shares and other equity instruments
(25)
(14)
(29)
(4)
Total preferred shares and other equity instruments
56,876
$
11,611
56,872
$
11,621
1
Statements.
2
3
details.
4
5
DIVIDENDS
On May 27, 2026, the Board approved a dividend in an amount of one dollar and twelve cents ($1.12) per fully paid common share in the capital stock of the Bank
for the quarter ending July 31, 2026, payable on and after July 31, 2026, to shareholders of record at the close of business on July 10, 2026. The Bank has a semi-
annual dividend review cycle to support the alignment of shareholder return with earnings growth.
DIVIDEND REINVESTMENT PLAN
The Bank offers a Dividend Reinvestment Plan (DRIP) for its common shareholders. Participation in the plan is optional and under the terms of the plan, cash
dividends on common shares are used to purchase additional common shares. At the option of the Bank, the common shares may be issued from treasury at an
average market price based on the last five trading days before the date of the dividend payment, with a discount of between 0% to 5% at the Bank’s discretion or
purchased from the open market at market prices.
During the three and six months ended April 30, 2026, the Bank satisfied the DRIP requirements through open market common share purchases. During the
three months ended April 30, 2025, the Bank satisfied the DRIP requirements through open market common share purchases. During the six months ended
April 30, 2025, the Bank satisfied the DRIP requirements through common shares issued from treasury with no discount for the first three months and open market
common share purchases in the last three months.
NORMAL COURSE ISSUER BID
On February 24, 2025, the Bank announced that the Toronto Stock Exchange (TSX) and OSFI had approved a normal course issuer bid (2025 NCIB) to purchase
for cancellation up to 100 million of its common shares for up to $8 billion. The Bank completed its 2025 NCIB in January 2026, under which it repurchased and
cancelled $8 billion of its common shares.
On January 16, 2026, the Bank announced that the TSX and OSFI have approved the Bank’s new normal course issuer bid (2026 NCIB) to repurchase for
cancellation up to $7 billion of its common shares, not to exceed 61 million common shares. The 2026 NCIB commenced on January 20, 2026, and will terminate
on (A) the earliest to occur of: (i) January 15, 2027; (ii) the date on which the aggregate purchase cost of common shares purchased equals $7 billion; and (iii) the
11
The Bank’s expectations for financial targets are based on forward-looking assumptions that have inherent risk and uncertainties. Results may vary depending on actual economic conditions, including
the level of unemployment, interest rates, and economic growth or contraction, the operating environment, including regulatory requirements, political environment, and competitive landscape, and the
Bank’s assumptions on future business performance, including credit conditions and performance, inclusive of policy and trade uncertainty and borrower or industry specific credit factors and
conditions, and foreign exchange impact. These assumptions are subject to inherent uncertainties and may vary based on factors outside the Bank’s control, including those set out at the beginning of
this document in the “Caution Regarding Forward-Looking Statements” section. Refer to the “Risk Factors That May Affect Future Results” section of the Bank’s 2025 MD&A for additional information
about risks and uncertainties that may impact the Bank’s estimates.
12
TD BANK GROUP • SECOND QUARTER 2026 • REPORT TO SHAREHOLDERS
Page 32
date on which the maximum number of common shares purchasable is reached; or (B) such earlier date as the Bank may determine. From the commencement of
the 2026 NCIB on January 20, 2026, to April 30, 2026, the Bank repurchased 23.2 million shares under the program, at an average price of $131.51 per share for
a total amount of $3.1 billion. During the three months ended April 30, 2026, the Bank repurchased and cancelled approximately 19.4 million shares under the
2026 NCIB program, for a total of $2.6 billion.
NON-VIABILITY CONTINGENT CAPITAL PROVISION
If an NVCC trigger event were to occur, for all series of Class A First Preferred Shares excluding the preferred shares issued with respect to LRCNs, the maximum
number of common shares that could be issued, assuming there are no declared and unpaid dividends on the respective series of preferred shares at the time of
conversion, would be 0.6 billion in aggregate.
The LRCNs, by virtue of the recourse to the preferred shares held in the Limited Recourse Trust, include NVCC provisions. For LRCNs, if an NVCC trigger were
to occur, the maximum number of common shares that could be issued, assuming there are no declared and unpaid dividends on the preferred shares series
issued in connection with such LRCNs, would be 1.7 billion in aggregate.
For NVCC subordinated notes and debentures (including Additional Tier 1 Perpetual Notes), if an NVCC trigger event were to occur, the maximum number of
common shares that could be issued, assuming there is no accrued and unpaid interest on the respective subordinated notes and debentures, would be 3.2 billion
in aggregate.
RISK FACTORS AND MANAGEMENT
Risk Factors That May Affect Future Results
In addition to the risks described in the “Managing Risk” section of the Bank’s 2025 MD&A and this Report, there are numerous other risk factors, many of which
are beyond the Bank’s control and the effects of which can be difficult to predict, that could cause the Bank’s results to differ significantly from the Bank’s plans,
objectives, and estimates or could impact the Bank’s reputation or the sustainability of its business model. All forward-looking statements, including those in this
MD&A, are, by their very nature, subject to inherent risks and uncertainties, general and specific, which may cause the Bank’s actual results to differ materially
from the plan, objectives, estimates or expectations expressed in the forward-looking statements. Some of these factors are discussed in the “Risk Factors and
Management” section of the 2025 MD&A and in the “Managing Risk” section of this document, and others are noted in the “Caution Regarding Forward-Looking
Statements” section of this document. The Bank has supplemented the following Risk Factors to reflect developments in the external environment.
Geopolitical Risk
Further to the geopolitical risks outlined in the Bank's 2025 MD&A, the conflict between the United States and Iran has increased volatility and disruption in global
energy and commodity markets, elevated energy prices, and introduced restrictions on maritime transit through key corridors such as the Strait of Hormuz. This
has led to interruption in energy production, transportation, trade flows and adverse impacts across a broader range of commodities and inputs that are energy
intensive or dependent on global supply chains and transportation networks. Higher energy costs, constrained shipping capacity, insurance limitations, and supply
dislocations have contributed to increased price levels and volatility in these markets. Prolonged disruptions or further escalation may exacerbate cost pressures,
constrain supply availability or affect demand across certain sectors and regions, which could have an impact on the Bank and its customers.
Inflation, Interest Rates and Recession Uncertainty
Further to the inflation, interest rates and recession uncertainty outlined in the Bank's 2025 MD&A, inflation has shown signs of renewed upward pressure, driven
by sharp increases in energy and related commodity prices following geopolitical disruptions in the Middle East. Elevated energy prices have increased headline
inflation and contributed to higher input costs and price volatility across a range of goods and services. While core inflation measures have remained more stable
to date, the persistence and duration of current cost pressures remain uncertain and could affect inflation expectations. Central banks have responded to this
environment by reassessing the pace and timing of anticipated interest rate adjustments. In Canada and the United States, policy rates have been held steady in
recent decisions, reflecting a balance between moderating growth, cooling labour market conditions and emerging upside risks to inflation stemming from energy
and commodity related shocks. As a result, the outlook for interest rates has become more uncertain, with the potential for interest rates to remain higher for longer
than previously expected, or to decline more rapidly should economic conditions deteriorate, which could have an impact on the Bank and its customers.
For more information on the economic outlook refer to the “Economic Summary and Outlook” section of this document.
MANAGING RISK
EXECUTIVE SUMMARY
Growing profitability in financial results based on balanced revenue, expense and capital growth services involves selectively taking and managing risks within the
Bank’s risk appetite. The Bank’s goal is to earn a stable and sustainable rate of return for every dollar of risk it takes, while putting significant emphasis on
investing in its businesses to meet its future strategic objectives.
The Bank’s businesses and operations are exposed to a broad number of risks that have been identified and defined in the Enterprise Risk Framework. The
Bank’s tolerance to those risks is defined in the Enterprise Risk Appetite which has been developed within a comprehensive framework that takes into
consideration current conditions in which the Bank operates and the impact that emerging risks will have on TD’s strategy and risk profile. The Bank’s risk appetite
states that it takes risks required to build its business, but only if those risks: (1) fit the business strategy and can be understood and managed; (2) do not expose
the enterprise to any significant single loss events; TD does not ‘bet the bank’ on any single acquisition, business, product or decision; and (3) do not risk harming
the TD brand. Each business is responsible for setting and aligning its individual risk appetites with that of the enterprise based on a thorough examination of the
specific risks to which it is exposed.
The Bank considers it critical to regularly assess its operating environment and highlight top and emerging risks. These are risks with a potential to have a
material effect on the Bank and where the attention of senior leaders is focused due to the potential magnitude or immediacy of their impact.
Risks are identified, discussed, and actioned by senior leaders and reported quarterly to the Risk Committee. Specific plans to mitigate top and emerging risks
are prepared, monitored, and adjusted as required.
The Bank’s risk governance structure and risk management approach have not substantially changed from that described in the Bank’s 2025 MD&A. During the
quarter, the Enterprise Reputational and Non-Traditional Risk Committee (ERRC) was renamed the Enterprise Strategic Resiliency Oversight Committee
(ESROC). The ESROC, chaired by the Chief Risk Officer, provides senior executive oversight, direction and guidance on strategic and reputational risks arising
from the planning and execution of TD's strategies and related activities, including traditional and non-traditional risk activities.
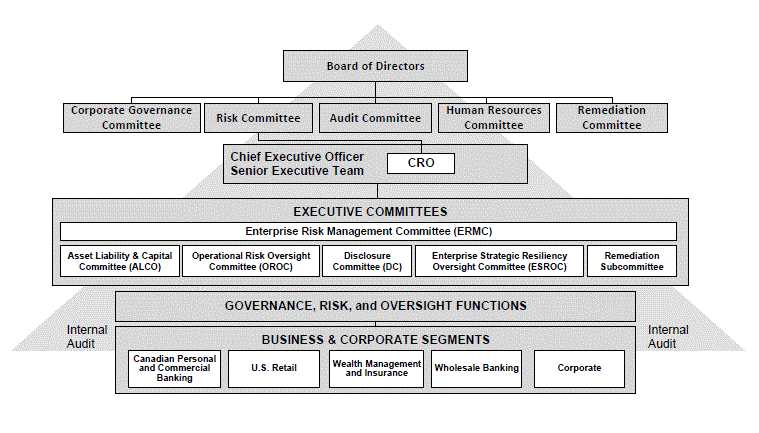
TD BANK GROUP • SECOND QUARTER 2026 • REPORT TO SHAREHOLDERS
Page 33
Additional information on risk factors can be found in this document and the 2025 MD&A under the heading “Risk Factors and Management”. For a complete
discussion of the risk governance structure and the risk management approach, refer to the “Managing Risk” section in the Bank’s 2025 MD&A.
The shaded sections of this MD&A represent a discussion relating to market and liquidity risks and form an integral part of the Interim Consolidated Financial
Statements for the period ended April 30, 2026.
CREDIT RISK
Gross credit risk exposure, also referred to as exposure at default (EAD), is the total amount the Bank is exposed to at the time of default of a loan and is
measured before counterparty-specific provisions or write-offs. Gross credit risk exposure does not reflect the effects of credit risk mitigation (CRM) and includes
both on-balance sheet and off-balance sheet exposures. On-balance sheet exposures consist primarily of outstanding loans, non-trading securities, derivatives,
and certain other repo-style transactions. Off-balance sheet exposures consist primarily of undrawn commitments, guarantees, and certain other repo-style
transactions.
Gross credit risk exposures for the two approaches the Bank uses to measure credit risk are included in the following table.
TABLE 27: GROSS CREDIT RISK EXPOSURE – Standardized and Internal Ratings-Based (IRB) Approaches
1
(millions of Canadian dollars)
As at
April 30, 2026
October 31, 2025
Standardized
IRB
Total
Standardized
IRB
Total
Retail
Residential secured
$
5,301
$
557,079
$
562,380
$
5,141
$
552,249
$
557,390
Qualifying revolving retail
841
176,156
176,997
871
177,970
178,841
Other retail
3,548
110,336
113,884
3,660
110,316
113,976
Total retail
9,690
843,571
853,261
9,672
840,535
850,207
Non-retail
Corporate
1,192
839,142
840,334
2,402
758,573
760,975
Sovereign
162
475,443
475,605
175
552,954
553,129
Bank
801
188,591
189,392
7,121
180,614
187,735
Total non-retail
2,155
1,503,176
1,505,331
9,698
1,492,141
1,501,839
Gross credit risk exposures
$
11,845
$
2,346,747
$
2,358,592
$
19,370
$
2,332,676
$
2,352,046
1
TD BANK GROUP • SECOND QUARTER 2026 • REPORT TO SHAREHOLDERS
Page 34
MARKET RISK
Market risk capital is calculated using the Standardized Approach under Basel III. The Bank continues to use Value-at-Risk (VaR) as an internal management
metric to monitor and control market risk.
Market Risk Linkage to the Balance Sheet
The following table provides a breakdown of the Bank’s balance sheet assets and liabilities exposed to trading and non-trading market risks. Market risk of assets
and liabilities included in the calculation of VaR and metrics used for regulatory market risk capital purposes is classified as trading market risk.
TABLE 28: MARKET RISK LINKAGE TO THE BALANCE SHEET
(millions of Canadian dollars)
As at
April 30, 2026
October 31, 2025
Non-trading market
Balance
Trading
Non-trading
Balance
Trading
Non-trading
risk – primary risk
sheet
market risk
market risk
Other
sheet
market risk
market risk
Other
sensitivity
Assets subject to market risk
Interest-bearing deposits with banks
$
110,124
$
2,867
$
107,257
$
–
$
109,417
$
940
$
108,477
$
–
Interest rate
Trading loans, securities, and other
231,680
222,008
9,672
–
220,136
213,151
6,985
–
Interest rate
Non-trading financial assets at
fair value through profit or loss
8,095
–
8,095
–
7,395
–
7,395
–
Equity,
foreign exchange,
interest rate
Derivatives
74,835
67,258
7,577
–
82,972
72,906
10,066
–
Equity,
foreign exchange,
interest rate
Financial assets designated at
fair value through profit or loss
7,299
–
7,299
–
6,986
–
6,986
–
Interest rate
Financial assets at fair value through
other comprehensive income
128,612
–
128,612
–
126,369
–
126,369
–
Equity,
foreign exchange,
interest rate
Debt securities at amortized cost,
net of allowance for credit losses
238,677
–
238,677
–
240,439
–
240,439
–
Foreign exchange,
interest rate
Securities purchased under
reverse repurchase agreements
220,120
6,901
213,219
–
247,078
7,574
239,504
–
Interest rate
Loans, net of allowance for
loan losses
964,289
–
964,289
–
953,012
–
953,012
–
Interest rate
Other assets
1
1,983
–
1,983
–
2,047
–
2,047
–
Interest rate
Assets not exposed to
99,391
–
–
99,391
98,707
–
–
98,707
Total Assets
$
2,085,105
$
299,034
$
1,686,680
$
99,391
$
2,094,558
$
294,571
$
1,701,280
$
98,707
Liabilities subject to market risk
Trading deposits
$
39,308
$
31,118
$
8,190
$
–
$
37,882
$
28,955
$
8,927
$
–
Equity, interest rate
Derivatives
74,532
69,513
5,019
–
79,356
74,790
4,566
–
Equity,
foreign exchange,
interest rate
Securitization liabilities at fair value
26,028
26,028
–
–
25,283
25,283
–
–
Interest rate
Financial liabilities designated at
fair value through profit or loss
222,503
8
222,495
–
197,635
3
197,632
–
Interest rate
Deposits
1,243,431
–
1,243,431
–
1,267,104
–
1,267,104
–
Interest rate,
foreign exchange
Obligations related to securities
sold short
42,293
38,785
3,508
–
43,795
42,475
1,320
–
Interest rate
Obligations related to securities sold
under repurchase agreements
218,392
20,920
197,472
–
221,150
13,922
207,228
–
Interest rate
Securitization liabilities at amortized
cost
16,017
–
16,017
–
14,841
–
14,841
–
Interest rate
Subordinated notes and debentures
10,345
–
10,345
–
10,733
–
10,733
–
Interest rate
Other liabilities
1
16,901
–
16,901
–
16,934
–
16,934
–
Equity, interest rate
Liabilities and Equity not
exposed to market risk
175,355
–
–
175,355
179,845
–
–
179,845
Total Liabilities and Equity
$
2,085,105
$
186,372
$
1,723,378
$
175,355
$
2,094,558
$
185,428
$
1,729,285
$
179,845
1

TD BANK GROUP • SECOND QUARTER 2026 • REPORT TO SHAREHOLDERS
Page 35
-75
-65
-55
-45
-35
-25
-15
-5
5
15
25
35
45
55
65
75
2/2/2026
2/9/2026
2/16/2026
2/23/2026
3/2/2026
3/9/2026
3/16/2026
3/23/2026
3/30/2026
4/6/2026
4/13/2026
4/20/2026
4/27/2026
TOTAL VALUE-AT-RISK AND TRADING NET REVENUE
(millions of Canadian dollars)
Calculating VaR
The Bank computes total VaR on a daily basis by combining the General Market Risk (GMR) and Idiosyncratic Debt Specific Risk (IDSR) associated with the
Bank’s trading positions.
GMR is determined by creating a distribution of potential changes in the market value of the current portfolio using historical simulation. The Bank values the
current portfolio using the market price and rate changes of the most recent
products. GMR is computed as the threshold level that portfolio losses are not expected to exceed more than
one
one-day
period is used for GMR calculation.
IDSR measures idiosyncratic (single-name) credit spread risk for credit exposures in the trading portfolio using Monte Carlo simulation. The IDSR model is
based on the historical behaviour of five-year idiosyncratic credit spreads. Similar to GMR, IDSR is computed as the threshold level that portfolio losses are not
expected to exceed more than
one
ten-day
The following graph discloses daily
one-day
trading income and net interest income related to positions within the Bank’s market risk capital trading books. For the second quarter ending April 30, 2026,
there were
% of the trading days, reflecting normal trading activity. Losses in the quarter did
not exceed VaR on any trading day.
VaR is a valuable risk measure but it should be used in the context of its limitations, for example:
●
●
●
The Bank continuously improves its VaR methodologies and incorporates new risk measures in line with market conventions, industry best practices, and
regulatory requirements.
To mitigate some of the shortcomings of VaR, the Bank uses additional metrics designed for risk management purposes. This includes stress testing as well as
sensitivities to various market risk factors.
The following table presents the end of quarter, average, high, and low usage of TD’s VaR metric.
TD BANK GROUP • SECOND QUARTER 2026 • REPORT TO SHAREHOLDERS
Page 36
TABLE 29: PORTFOLIO MARKET RISK MEASURES
(millions of Canadian dollars)
For the three months ended
For the six months ended
April 30
January
31
April 30
April 30
April 30
2026
2026
2025
2026
2025
As at
Average
High
Low
Average
Average
Average
Average
Interest rate risk
$
$
$
$
$
$
$
$
Credit spread risk
Equity risk
Foreign exchange risk
Commodity risk
Idiosyncratic debt specific risk
Diversification effect
1
(65.0 )
(69.1 )
2
(58.8 )
(56.9 )
(64.0 )
(49.2 )
Total Value -at-Risk (one-day)
$
$
$
$
$
$
$
$
1
The aggregate VaR is less than the sum of the VaR of the different risk types due to risk offsets resulting from portfolio diversification.
2
Average VaR decreased quarter-over-quarter due to changes in commodities forward positions. This was partially offset by changes in fixed income positions
coupled with wider credit spreads and changes in interest rate positions.
Validation of VaR Model
The Bank uses a back-testing process to compare actual profits and losses to VaR to review their consistency with the statistical results of the VaR model.
Non-Trading Interest Rate Risk
The Bank’s non-trading interest rate risk arises mainly from traditional personal and commercial banking activity and is generally the result of mismatches between
the maturities and repricing dates of the Bank’s assets and liabilities.
The primary measures for managing and controlling this risk are Economic Value of Shareholders’ Equity (EVE) Sensitivity and Net Interest Income Sensitivity
(NIIS).
The EVE Sensitivity measures the change in the net present value of the Bank’s banking book assets, liabilities, and certain off-balance sheet items given a
specific interest rate shock. It reflects a measurement of the potential present value impact on shareholders’ equity without an assumed term profile for the
management of the Bank’s own equity and excludes product margins.
The NIIS measures the NII change over a twelve-month horizon for a specified change in interest rates for banking book assets, liabilities, and certain off-
balance sheet items assuming a constant balance sheet over the period.
The Bank’s Market Risk policy sets overall limits on the non-trading interest rate risk measures. These limits are periodically reviewed and approved by the Risk
Committee. In addition to the Board policy limits, book-level risk limits are set for the Bank’s management of non-trading interest rate risk by Risk Management.
Exposures against these limits are routinely monitored and reported, and breaches of the Board limits, if any, are escalated to both the Asset Liability and Capital
Committee (ALCO) and the Risk Committee.
The following table shows the potential before-tax impact of an immediate and sustained 100 bps increase or decrease in interest rates on the EVE and NIIS
measures.
TABLE 30: NON-TRADING INTEREST RATE SENSITIVITY MEASURES
(millions of Canadian dollars)
As at
April 30, 2026
January 31, 2026
April 30, 2025
EVE
NII
EVE
NII
EVE
NII
Sensitivity
Sensitivity
1
Sensitivity
3
Sensitivity
1,3
Sensitivity
3
Sensitivity
1,3
Canadian
U.S.
Total
Canadian
U.S.
Total
Total
Total
Total
Total
dollar
2
dollar
dollar
2
dollar
Before-tax impact of
$
(1,191 )
$
(2,492 )
$
(3,683 )
$
$
$
$
(2,521 )
$
$
(2,612 )
$
(390 )
(71 )
(461 )
(815 )
(769 )
1
Represents the twelve-month NII exposure to an immediate and sustained shock in rates, and may include adjustments for non-recurring items.
2
3
.
As at April 30, 2026, an immediate and sustained 100 bps increase in interest rates would have a negative impact to the Bank’s EVE of $
of $
sustained 100 bps decrease in interest rates would have a positive impact to the Bank’s EVE of $
a negative impact to the Bank’s NII of $
attributed to Treasury activity primarily in support of lower US dollar NII sensitivity.
TD BANK GROUP • SECOND QUARTER 2026 • REPORT TO SHAREHOLDERS
Page 37
Liquidity Risk
The risk of having insufficient cash or collateral to meet financial obligations and an inability to, in a timely manner, raise funding or monetize assets at a non-
distressed price. Financial obligations can arise from deposit withdrawals, debt maturities, commitments to provide credit or liquidity support or the need to pledge
additional collateral.
TD’S LIQUIDITY RISK APPETITE
TD follows a disciplined liquidity management program, which is subject to risk governance and oversight, and is designed to maintain sufficient liquidity to permit
the Bank to operate through a significant liquidity event without relying on extraordinary central bank assistance. The Bank maintains access to a stable and
diversified funding base and aligns its funding profile with that of the assets and contingent obligations it supports.
WHO MANAGES LIQUIDITY RISK
The Risk Committee, the ALCO and the Treasurer are accountable for the identification, assessment, control, monitoring and oversight of liquidity risk.
●
policies annually.
●
governance of liquidity risk.
●
Management, identifies and monitors the Bank’s liquidity risks.
In addition to our committee oversight framework, liquidity risk management activities are subject to the three lines of defence governance model. Treasury, the
first line of defence for the management of liquidity risk, is subject to independent second line challenge and oversight by Risk Management. TD’s Internal Audit is
the third line of defence. The three lines of defence are independent of the business whose activities generate liquidity risks.
The Bank’s liquidity risk appetite and liquidity risk management approach have not changed substantially from that described in the Bank’s 2025 MD&A. For a
complete discussion of liquidity risk, refer to the “Liquidity Risk” section in the Bank’s 2025 MD&A.
Liquid assets
The Bank’s unencumbered liquid assets could be used to help address potential funding needs arising from stress events. Liquid asset eligibility considers
estimated stressed market values and trading market depth, as well as operational, legal, or other impediments to sale, rehypothecation or pledging.
Assets held by the Bank to meet liquidity requirements are summarized in the following tables. The tables do not include assets held within the Bank’s insurance
businesses as these are used to support insurance-specific liabilities and capital requirements.
TABLE 31: SUMMARY OF LIQUID ASSETS BY TYPE AND CURRENCY
(millions of Canadian dollars, except as noted)
As at
Securities
received as
collateral from
securities
financing and
Bank-owned
derivative
Total
Encumbered
Unencumbered
liquid assets
transactions
liquid assets
liquid assets
liquid assets
1
April 30, 2026
Cash and central bank reserves
$
$
$
$
$
Obligations of government, federal agencies, public sector entities,
and multilateral development banks
2
Equities
Other debt securities
Other securities
Total Canadian dollar-denominated
Cash and central bank reserves
Obligations of government, federal agencies, public sector entities,
and multilateral development banks
Equities
Other debt securities
Other securities
Total non-Canadian dollar-denominated
Total
3
$
$
$
$
$
October 31, 2025
Total Canadian dollar -denominated
$
$
$
$
$
Total non-Canadian dollar-denominated
Total
$
$
$
$
$
1
Unencumbered liquid assets include on-balance sheet assets, assets borrowed or purchased under resale agreements, and other off-balance sheet collateral received less encumbered
liquid assets.
2
3
.
TD BANK GROUP • SECOND QUARTER 2026 • REPORT TO SHAREHOLDERS
Page 38
Unencumbered liquid assets held in The Toronto-Dominion Bank, its domestic and foreign subsidiaries, and branches are summarized in the following table.
TABLE 32: SUMMARY OF UNENCUMBERED LIQUID ASSETS BY BANK, SUBSIDIARIES, AND BRANCHES
(millions of Canadian dollars)
As at
April 30
October 31
2026
2025
The Toronto-Dominion Bank (Parent)
$
$
Bank subsidiaries
Foreign branches
Total
$
$
The Bank’s average liquid assets are summarized in the following table.
TABLE 33: SUMMARY OF AVERAGE LIQUID ASSETS BY TYPE AND CURRENCY
(millions of Canadian dollars, except as noted)
Average for the three months ended
Securities
received as
collateral from
securities
financing and
Total
Bank-owned
derivative
liquid
Encumbered
Unencumbered
liquid assets
transactions
assets
liquid assets
liquid assets
1
April 30, 2026
Cash and central bank reserves
$
15,037
$
–
$
15,037
$
1,727
$
13,310
Obligations of government, federal agencies, public sector
entities, and multilateral development banks
2
113,658
103,532
217,190
98,831
118,359
Equities
20,519
8,277
28,796
21,468
7,328
Other debt securities
6,763
20,853
27,616
11,135
16,481
Other securities
–
–
–
–
–
Total Canadian dollar-denominated
155,977
132,662
288,639
133,161
155,478
Cash and central bank reserves
86,270
–
86,270
–
86,270
Obligations of government, federal agencies, public sector
entities, and multilateral development banks
219,447
156,746
376,193
183,625
192,568
Equities
66,206
70,158
136,364
77,606
58,758
Other debt securities
82,422
40,551
122,973
34,697
88,276
Other securities
30,443
2,837
33,280
9,693
23,587
Total non-Canadian dollar-denominated
484,788
270,292
755,080
305,621
449,459
Total
3
$
640,765
$
402,954
$
1,043,719
$
438,782
$
604,937
January 31, 2026
Total Canadian dollar -denominated
$
158,150
$
114,067
$
272,217
$
117,861
$
154,356
Total non-Canadian dollar-denominated
488,070
232,658
720,728
288,610
432,118
Total
$
646,220
$
346,725
$
992,945
$
406,471
$
586,474
1
liquid assets.
2
3
Average unencumbered liquid assets held in The Toronto-Dominion Bank, its domestic and foreign subsidiaries, and branches are summarized in the following
table.
TABLE 34: SUMMARY OF AVERAGE UNENCUMBERED LIQUID ASSETS BY BANK, SUBSIDIARIES, AND BRANCHES
(millions of Canadian dollars)
Average for the three months ended
April 30
January 31
2026
2026
The Toronto-Dominion Bank (Parent)
$
237,056
$
259,779
Bank subsidiaries
338,412
300,135
Foreign branches
29,469
26,560
Total
$
604,937
$
586,474
TD BANK GROUP • SECOND QUARTER 2026 • REPORT TO SHAREHOLDERS
Page 39
ASSET ENCUMBRANCE
In the course of the Bank’s daily operations, assets are pledged to obtain funding, support trading and brokerage businesses, and participate in clearing and/or
settlement systems. TD has pledging policies in place that govern the amount of assets we encumber, ensuring sufficient assets are available to meet liquidity
requirements. A summary of on- and off-balance sheet encumbered and unencumbered assets is presented as follows.
TABLE 35: ENCUMBERED AND UNENCUMBERED ASSETS
(millions of Canadian dollars)
As at
Total Assets
Encumbered
Unencumbered
Total
Pledged as
Available as
Assets
Collateral
1
Other
2
Collateral
3
Other
4
April 30, 2026
Cash and due from banks
$
5,858
$
–
$
–
$
–
$
5,858
Interest-bearing deposits with banks
110,124
6,234
–
98,974
4,916
Securities, trading loans, and other
1,081,359
493,305
26,590
505,500
55,964
Derivatives
74,835
–
–
–
74,835
Loans, net of allowance for loan losses
936,935
40,669
98,823
66,297
731,146
Other assets
5
95,516
202
–
–
95,314
Total assets
$
2,304,627
$
540,410
$
125,413
$
670,771
$
968,033
October 31, 2025
Total assets
$
2,265,385
$
525,387
$
127,282
$
672,337
$
940,379
1
requirements associated with participation in clearing houses and payment systems.
2
3
that qualify as eligible collateral in the Federal Home Loan Bank System.
4
5
dealers, and clients, and other assets on the balance sheet not reported in the above categories.
LIQUIDITY STRESS TESTING AND CONTINGENCY FUNDING PLANS
In addition to the Bank’s internal liquidity stress metric, the Bank performs liquidity stress testing on multiple alternate scenarios. These scenarios consist of a mix
of TD-specific and market-wide stress events designed to evaluate the potential impact of risk factors material to the Bank’s risk profile. Liquidity risk assessments
are also part of the Bank’s Enterprise-Wide Stress Testing program.
The Bank maintains CFPs for the enterprise and material subsidiaries operating in foreign jurisdictions. As they provide a playbook for managing stressed
liquidity conditions, these plans are an integral component of the Bank’s overall liquidity risk management framework. The CFPs outline different contingency
levels based on the severity and duration of the liquidity event and identify recovery actions appropriate for each level. To support operational readiness, CFPs
provide key steps required to implement each recovery action. Regional CFPs identify recovery actions to address region-specific stress events. The actions and
governance structure outlined in the Bank’s CFP are aligned with the Bank’s Crisis Management Recovery Plan.
CREDIT RATINGS
Credit ratings may affect the Bank’s access to, and cost of, raising funding and its ability to engage in certain business activities on a cost-effective basis. Credit
ratings and outlooks provided by rating agencies reflect their views and methodologies and are subject to change based on several factors including the Bank’s
financial strength, competitive position, and liquidity, as well as factors not entirely within the Bank’s control, including conditions affecting the overall financial
services industry.
TD BANK GROUP • SECOND QUARTER 2026 • REPORT TO SHAREHOLDERS
Page 40
TABLE 36: CREDIT RATINGS
1
As at
April 30, 2026
Moody’s
S&P
Fitch
2
DBRS
Deposits/Counterparty
3
Aa1
A+
AA+
AA
Senior Debt
4
A2
A-
AA-
AA (low)
Covered Bonds
Aaa
–
AAA
AAA
Legacy Subordinated Debt – non-NVCC
A3
A-
A
A (high)
Tier 2 Subordinated Debt – NVCC
A3 (hyb)
BBB+
A
A (low)
AT1 Perpetual Debt – NVCC
Baa2 (hyb)
BBB-
BBB+
–
Limited Recourse Capital Notes – NVCC
Baa2 (hyb)
BBB-
BBB+
BBB (high)
Preferred Shares – NVCC
Baa2 (hyb)
BBB-
BBB+
Pfd-2
Short-Term Debt (Deposits)
P-1
A-1
F1+
R-1 (high)
Outlook
Stable
Stable
Negative
Stable
1
recommendations to purchase, sell, or hold a financial obligation in as much as they do not comment on market price or suitability for a particular investor. Ratings are subject to revision
or withdrawal at any time by the rating organization.
2
3
4
The Bank regularly reviews the level of increased collateral its trading counterparties would require in the event of a downgrade of TD’s credit rating. The following
table presents the additional collateral that could have been contractually required to be posted to OTC derivative counterparties as of the reporting date in the
event of one, two, and three-notch downgrades of the Bank’s credit ratings.
TABLE 37: ADDITIONAL COLLATERAL REQUIREMENTS FOR RATING DOWNGRADES
1
(millions of Canadian dollars)
Average for the three months ended
April 30
January 31
2026
2026
One-notch downgrade
$
966
$
873
Two-notch downgrade
1,364
1,342
Three-notch downgrade
2,253
2,313
1
LIQUIDITY COVERAGE RATIO (LCR)
The LCR is a Basel III standard designed to ensure that banks have an adequate stock of unencumbered HQLA, consisting of cash or assets that can be
converted into cash, to meet their liquidity needs for a 30-calendar day liquidity stress scenario.
In accordance with OSFI’s Liquidity Adequacy Requirements (LAR), the Bank must maintain a minimum LCR of 100%, except during periods of financial stress
when institutions are permitted to use their stock of HQLA. The Bank’s LCR is calculated according to the scenario parameters in the LAR guideline, including
prescribed HQLA eligibility criteria and haircuts, deposit run-off, and other outflow and inflow rates. LCR-eligible HQLA consist primarily of central bank reserves,
sovereign-issued or sovereign-guaranteed securities, and high-quality securities issued by non-financial entities.
TD BANK GROUP • SECOND QUARTER 2026 • REPORT TO SHAREHOLDERS
Page 41
The following table summarizes the Bank’s average daily LCR as of the relevant dates.
TABLE 38: AVERAGE LIQUIDITY COVERAGE RATIO
1
(millions of Canadian dollars, except as noted)
Average for the three months ended
April 30, 2026
Total unweighted
Total weighted
value (average)
2
value (average)
3
High-quality liquid assets
Total high-quality liquid assets
$
n/a
4
$
336,237
Cash outflows
Retail deposits and deposits from small business customers, of which:
$
512,073
$
33,551
Stable deposits
269,909
8,097
Less stable deposits
242,164
25,454
Unsecured wholesale funding, of which:
396,367
196,881
Operational deposits (all counterparties) and deposits in networks of cooperative banks
144,650
33,806
Non-operational deposits (all counterparties)
220,464
131,822
Unsecured debt
31,253
31,253
Secured wholesale funding
n/a
55,509
Additional requirements, of which:
399,786
135,014
Outflows related to derivative exposures and other collateral requirements
90,550
67,754
Outflows related to loss of funding on debt products
14,000
14,000
Credit and liquidity facilities
295,236
53,260
Other contractual funding obligations
20,374
10,508
Other contingent funding obligations
863,188
13,307
Total cash outflows
$
n/a
$
444,770
Cash inflows
Secured lending
$
279,438
$
56,711
Inflows from fully performing exposures
29,317
13,665
Other cash inflows
116,169
116,169
Total cash inflows
$
424,924
$
186,545
Average for the three months ended
April 30, 2026
January 31, 2026
Total adjusted
Total adjusted
value
value
Total high-quality liquid assets
$
336,237
$
341,809
Total net cash outflows
258,225
249,469
Liquidity coverage ratio
130
%
137
%
1
is calculated as an average of the 62 daily data points in the quarter.
2
3
4
The Bank’s average LCR was 130% for the quarter ended April 30, 2026 and continues to meet regulatory requirements
The Bank holds a variety of liquid assets commensurate with its liquidity needs. Most of these liquid assets also qualify as HQLA under the OSFI LAR guideline.
The Bank’s Level 1 assets for the quarter ended April 30, 2026, as calculated according to OSFI LAR and the BCBS LCR requirements, represent 86% of total
HQLA (January 31, 2026 – 86%). In accordance with the OSFI LAR guideline, the Bank’s reported HQLA excludes excess HQLA from U.S. Banking operations to
reflect liquidity transfer considerations between U.S. Banking and affiliates as a result of the U.S. Federal Reserve Board’s regulations. By excluding excess
HQLA, the U.S. Banking LCR is effectively capped at 100% prior to total Bank consolidation.
As described in the “How TD Manages Liquidity Risk” section of the Bank’s 2025 MD&A, the Bank manages its HQLA and other liquidity buffers to the higher of
TD’s internal 90-day surplus requirement and its target buffers over regulatory requirements including those for LCR, Net Stable Funding Ratio (NSFR), and the
Net Cumulative Cash Flow metrics.
13
The Bank’s expectations regarding liquidity levels are based on the Bank’s assumptions regarding certain factors, including product growth, strategic plans, and pace of share repurchases under the
Bank’s normal course issuer bid (which is subject to financial forecasts and capital requirements). The Bank’s assumptions are subject to inherent uncertainties and may vary based on factors both
within and outside the Bank’s control, including general market conditions, economic outlook and geopolitical matters. Refer to the “Risk Factors That May Affect Future Results” section of this document
for additional information about risks and uncertainties that may impact the Bank’s estimates.
TD BANK GROUP • SECOND QUARTER 2026 • REPORT TO SHAREHOLDERS
Page 42
NET STABLE FUNDING RATIO
The NSFR is a Basel III metric calculated as the ratio of total available stable funding (ASF) to total required stable funding (RSF). The Bank must maintain an
NSFR equal to or above 100% in accordance with the LAR guideline. The Bank’s ASF comprises the Bank’s liability and capital instruments (including deposits
and wholesale funding). The assets that require stable funding are a function of the Bank’s on and off-balance sheet activities, their liquidity characteristics, and
OSFI’s LAR guideline requirements.
TABLE 39: NET STABLE FUNDING RATIO
1
(millions of Canadian dollars, except as noted)
As at
April 30, 2026
Unweighted value by residual maturity
6 months to
More than
No
Less than
less than
or equal to
Weighted
maturity
2
6 months
1 year
1 year
value
3
Available Stable Funding Item
Capital
$
120,284
$
n/a
$
n/a
$
6,456
$
126,741
Regulatory capital
120,284
n/a
n/a
6,456
126,741
Other capital instruments
n/a
n/a
n/a
–
–
Retail deposits and deposits from small business customers:
470,789
71,454
33,458
29,026
561,754
Stable deposits
260,876
28,285
14,191
14,537
302,721
Less stable deposits
209,913
43,169
19,268
14,489
259,034
Wholesale funding:
265,238
415,689
114,090
239,740
474,577
Operational deposits
118,996
2,349
–
–
60,672
Other wholesale funding
146,242
413,340
114,090
239,740
413,905
Liabilities with matching interdependent assets
4
–
2,176
1,120
37,958
–
Other liabilities:
46,952
107,425
8,339
NSFR derivative liabilities
n/a
12,283
All other liabilities and equity not included in the above categories
46,952
85,412
2,784
6,946
8,339
Total Available Stable Funding
$
1,171,411
Required Stable Funding Item
Total NSFR high-quality liquid assets
$
$
$
$
$
56,729
Deposits held at other financial institutions for operational purposes
–
–
–
–
–
Performing loans and securities
137,817
286,565
120,315
682,316
798,041
Performing loans to financial institutions secured by Level 1 HQLA
–
63,200
8,152
293
8,535
Performing loans to financial institutions secured by non-Level 1
HQLA and unsecured performing loans to financial institutions
–
87,876
5,950
15,304
28,133
Performing loans to non-financial corporate clients, loans to retail
and small business customers, and loans to sovereigns, central
banks and PSEs, of which:
42,651
63,197
42,200
301,123
349,289
With a risk weight of less than or equal to 35% under the Basel II
standardized approach for credit risk
n/a
–
–
–
–
Performing residential mortgages, of which:
38,189
63,880
57,488
287,681
289,245
With a risk weight of less than or equal to 35% under the Basel II
standardized approach for credit risk
38,189
63,880
57,488
287,681
289,245
Securities that are not in default and do not qualify as HQLA,
including exchange-traded equities
56,977
8,412
6,524
77,915
122,839
Assets with matching interdependent liabilities
4
–
2,970
2,016
36,268
–
Other assets:
80,934
154,483
118,052
Physical traded commodities, including gold
26,384
23,157
Assets posted as initial margin for derivative contracts and
contributions to default funds of CCPs
–
–
–
19,516
16,589
NSFR derivative assets
–
–
11,824
–
NSFR derivative liabilities before deduction of variation margin
posted
25,843
1,292
All other assets not included in the above categories
54,550
87,104
2,073
8,122
77,014
Off-balance sheet items
865,572
31,434
Total Required Stable Funding
$
1,004,256
Net Stable Funding Ratio
117
%
As at
January 31, 2026
5
Total Available Stable Funding
$
1,152,199
Total Required Stable Funding
1,005,388
Net Stable Funding Ratio
115
%
1
2
positions, open maturity positions, non-HQLA equities, and physical traded commodities.
3
4
asset is still on balance sheet, cannot be used to fund any other assets and principal payments from the asset cannot be used for anything other than repaying the liability. As such, the
only interdependent assets and liabilities that qualify for this treatment at the Bank are the liabilities arising from the Canada Mortgage Bonds Program and their corresponding
encumbered assets.
5
The Bank’s NSFR for the quarter ended April 30, 2026 is 117% (January 31, 2026 – 115%), representing a surplus of $167 billion and adhering to regulatory
requirements.
TD BANK GROUP • SECOND QUARTER 2026 • REPORT TO SHAREHOLDERS
Page 43
FUNDING
The Bank has access to a variety of unsecured and secured funding sources. The Bank’s funding activities are conducted in accordance with liquidity risk
management policies that require assets be funded to the appropriate term and to a prudent diversification profile.
The Bank’s primary approach to funding is to maximize the use of deposits raised through its personal, wealth and business banking channels. The deposits
raised from these sources were approximately
% (October 31, 2025 –
%) of the Bank’s total funding. Non-personal deposit funding as reflected below does
not include the Bank’s Wholesale Banking deposits (including Corporate & Investment Banking).
TABLE 40: SUMMARY OF DEPOSIT FUNDING
(millions of Canadian dollars)
As at
April 30
October 31
2026
2025
Personal
$
$
Non-personal
Total
$
$
WHOLESALE FUNDING
The Bank maintains various registered external wholesale term (greater than 1 year) funding programs to provide access to diversified funding sources, including
asset securitization, covered bonds, and unsecured wholesale debt. The Bank raises term funding through Senior Notes, NHA MBS, notes backed by credit card
receivables (Evergreen Credit Card Trust) and home equity lines of credit (Genesis Trust II). The Bank’s wholesale funding is diversified by geography, currency,
and funding types. The Bank raises short-term (1 year or less) funding using certificates of deposit and commercial paper.
The following table summarizes the term funding and capital programs by geography, with the related program size as at April 30, 2026.
Canada
United States
Europe
Capital Securities Program ($20 billion)
Canadian Senior Medium-Term Linked Notes
Program ($10 billion)
HELOC ABS Program (Genesis Trust II) ($7 billion)
U.S. SEC (F-3) Registered Capital and Debt
Program (US$75 billion)
U.K. Financial Conduct Authority (FCA) Registered
Legislative Covered Bond Program ($100 billion)
FCA Registered Global Medium-Term Note Program
(US$40 billion)
Non-Registered Structured Global Medium-Term
Linked Notes Program (US$20 billion)
The following table presents a breakdown of the Bank’s term debt by currency and funding type. Term funding was $190.9 billion as at April 30, 2026
(October 31, 2025 – $192.0 billion).
Note that Table 41: Long-Term Funding and Table 42: Wholesale Funding do not include any funding accessed via repurchase transactions or securities financing.
TABLE 41: LONG-TERM FUNDING
1
As at
April 30
October 31
Long-term funding by currency
2026
2025
Canadian dollar
28
%
26
%
U.S. dollar
34
33
Euro
29
32
British pound
5
4
Other
4
5
Total
100
%
100
%
Long-term funding by type
Senior unsecured medium-term notes
55
%
53
%
Covered bonds
34
37
Mortgage securitization
2
9
8
Term asset-backed securities
2
2
Total
100
%
100
%
1
The table includes secured and unsecured, senior and subordinated notes – excluding structured notes and commercial paper – issued to external investors with
an original term-to-maturity of greater than one year.
2
Mortgage securitization excludes the residential mortgage trading business.
The Bank maintains depositor concentration limits in respect of short-term wholesale deposits so that it is not overly reliant on individual depositors for funding.
The Bank further limits short-term wholesale funding maturity concentration in an effort to mitigate refinancing risk during a stress event.
TD BANK GROUP • SECOND QUARTER 2026 • REPORT TO SHAREHOLDERS
Page 44
The following table represents the remaining maturity of various sources of funding outstanding as at April 30, 2026 and October 31, 2025.
TABLE 42: WHOLESALE FUNDING
(millions of Canadian dollars)
As at
April 30
October 31
2026
2025
Less than
1 to 3
3 to 6
6 months
Up to 1
Over 1 to
Over
1 month
months
months
to 1 year
year
2 years
2 years
Total
Total
Deposits from banks
1
$
1,951
$
234
$
330
$
710
$
3,225
$
–
$
–
$
3,225
$
2,738
Bearer deposit notes
1,174
671
725
1,125
3,695
–
–
3,695
5,732
Certificates of deposit
14,284
17,081
32,033
48,501
111,899
3,276
–
115,175
90,513
Commercial paper
13,605
15,439
11,407
13,112
53,563
810
–
54,373
53,759
Covered bonds
–
3,423
5,337
14,194
22,954
9,785
31,894
64,633
70,558
Mortgage securitization
2
39
968
1,085
1,803
3,895
4,247
33,903
42,045
40,124
Senior unsecured medium-term notes
3
–
7,645
2,303
13,019
22,967
22,872
60,825
106,664
102,136
Subordinated notes and debentures
4
–
–
–
–
–
–
10,345
10,345
10,733
Term asset-backed securitization
1,326
1,987
2,901
6,324
12,538
1,719
1,453
15,710
15,702
Other
5
38,853
4,956
3,060
2,653
49,522
2,957
3,489
55,968
47,820
Total
$
71,232
$
52,404
$
59,181
$
101,441
$
284,258
$
45,666
$
141,909
$
471,833
$
439,815
Of which:
Secured
$
1,365
$
7,736
$
10,681
$
23,679
$
43,461
$
15,751
$
67,250
$
126,462
$
126,388
Unsecured
69,867
44,668
48,500
77,762
240,797
29,915
74,659
345,371
313,427
Total
$
71,232
$
52,404
$
59,181
$
101,441
$
284,258
$
45,666
$
141,909
$
471,833
$
439,815
1
2
3
3 months and $0.2 billion has a remaining term of 6 months to 1 year. Excludes $2.3 billion of structured notes subject to conversion under the “bail-in” regime (October 31, 2025 –
$3.3 billion).
4
5
Includes fixed-term deposits from non-bank institutions (unsecured) of $26.6 billion (October 31, 2025 – $26.9 billion) and the remaining are non-term deposits.
Excluding the Wholesale Banking residential mortgage trading business, the Bank’s total mortgage-backed securities issued to external investors for the three and
six months ended April 30, 2026, were $1.3 billion and $2.4 billion, respectively (three and six months ended April 30, 2025 – $1.3 billion and $2.3 billion,
respectively) and other asset-backed securities issued for the three and six months ended April 30, 2026, were nil (three and six months ended April 30, 2025 – nil
and $0.2 billion, respectively). The Bank also issued $8.9 billion and $15.3 billion, respectively, of unsecured medium-term notes for the three months and six
months ended April 30, 2026 (three months and six months ended April 30, 2025 – nil and $10.4 billion, respectively). Covered bonds issued for the three and six
months ended April 30, 2026 were $2.8 billion and $5.1 billion, respectively (three and six months ended April 30, 2025 – nil).
REGULATORY DEVELOPMENTS CONCERNING LIQUIDITY AND FUNDING
In January 2026, OSFI released its final revised LAR guideline which comes into effect on May 1, 2026 (starting third quarter of fiscal 2026). Amendments include
introduction of deposit categorizations for measuring liquidity risks from structured notes and deposits sourced through non-bank financial intermediaries, and
clarification of expectations for instruments with contingent features and/or uncertain maturity profiles, particularly in relation to their early redemption
characteristics and associated liquidity implications.
ISSB – IFRS S1 and IFRS S2
In March 2025, OSFI released updates to Guideline B-15 to ensure continued interoperability with the requirements of the final Canadian Sustainability Standards
Board (CSSB) standards. Key updates include postponing the implementation date for industry-based metrics and Scope 3 Greenhouse Gas (GHG) emissions
disclosures from fiscal year end 2025 to 2028. The Bank’s 2025 annual sustainability report suite will incorporate the phased-in cross-industry metrics
requirements, effective for October 31, 2025.
In April 2025, the Canadian Securities Administrators (CSA) announced that it is pausing work on the development of a new mandatory climate-related disclosure
rule that is based on the two standards issued by the CSSB. The CSSB standards were released in December 2024 and are based on the international
sustainability standards issued by the International Sustainability Standards Board (ISSB). They set out the disclosure requirements for financially material
information about sustainability and climate-related risks and opportunities to meet investor information needs. For these standards to become mandatory
requirements in Canada, they would need to be incorporated into a CSA rule. The Bank continues to assess the impact of adopting these standards and to monitor
developments from various standard setters and regulators.
TD BANK GROUP • SECOND QUARTER 2026 • REPORT TO SHAREHOLDERS
Page 45
SECURITIZATION AND OFF-BALANCE SHEET ARRANGEMENTS
The Bank enters into securitization and off-balance sheet arrangements in the normal course of operations. The Bank is involved with structured entities (SEs) that
it sponsors, as well as entities sponsored by third parties. Refer to “Securitization and Off-Balance Sheet Arrangements” section, Note 9: Transfers of Financial
Assets and Note 10: Structured Entities of the Bank’s 2025 Annual Report for further details. There have been no significant changes to the Bank’s securitization
and off-balance sheet arrangements during the quarter ended April 30, 2026.
Securitization of Third-Party Originated Assets
Significant Unconsolidated Special Purpose Entities
The Bank securitizes third-party originated assets through Bank-sponsored SEs, including its multi-seller conduits which are not consolidated. Multi-seller conduits
securitize third-party originated assets. The Bank administers multi-seller conduits and provides liquidity facilities as well as securities distribution services; it may
also provide credit enhancements. TD’s total potential exposure to loss through the provision of liquidity facilities for multi-seller conduits was $58.7 billion as at
April 30, 2026 (October 31, 2025 – $57.5 billion). As at April 30, 2026, the Bank had funded exposure of $38.6 billion under such liquidity facilities relating to
outstanding issuances of asset-backed commercial paper (ABCP) (October 31, 2025 – $38.5 billion).
ACCOUNTING POLICIES AND ESTIMATES
The Bank’s unaudited Interim Consolidated Financial Statements have been prepared in accordance with IFRS. For details of the Bank’s accounting policies under
IFRS, refer to Note 2 of the Bank’s second quarter 2026 Interim Consolidated Financial Statements and 2025 Annual Consolidated Financial Statements. For
details of the Bank’s significant accounting judgments, estimates, and assumptions under IFRS, refer to Note 3 of the Bank’s second quarter 2026 Interim
Consolidated Financial Statements and the Bank’s 2025 Annual Consolidated Financial Statements.
CURRENT CHANGES IN ACCOUNTING POLICIES
There were no new accounting policies adopted by the Bank for the three and six months ended April 30, 2026.
ACCOUNTING JUDGMENTS, ESTIMATES, AND ASSUMPTIONS
The estimates used in the Bank’s accounting policies are essential to understanding its results of operations and financial condition. Some of the Bank’s policies
require subjective, complex judgments and estimates as they relate to matters that are inherently uncertain. Changes in these judgments or estimates and
changes to accounting standards and policies could have a materially adverse impact on the Bank’s Interim Consolidated Financial Statements. The Bank has
established procedures to ensure that accounting policies are applied consistently and that the processes for changing methodologies, determining estimates, and
adopting new accounting standards are well-controlled and occur in an appropriate and systematic manner.
Impairment – Expected Credit Loss Model
The ECL model requires the application of judgments, estimates, and assumptions in the assessment of the current and forward-looking economic environment.
There remains elevated economic uncertainty, and management continues to exercise expert credit judgment in assessing if an exposure has experienced
significant increase in credit risk since initial recognition and in determining the amount of ECLs at each reporting date. To the extent that certain effects are not
fully incorporated into the model calculations, temporary quantitative and qualitative adjustments have been applied, including for risks related to elevated
uncertainty associated with policy and trade, and such adjustments will be updated as appropriate in future periods.
FUTURE CHANGES IN ACCOUNTING POLICIES
There were no new accounting standards or amendments issued during the three and six months ended April 30, 2026. Refer to Note 4 of the Bank’s 2025 Annual
Consolidated Financial Statements for a description of future changes in accounting policies.
CHANGES IN INTERNAL CONTROL OVER FINANCIAL REPORTING
During the most recent interim period, there have been no changes in the Bank’s policies and procedures and other processes that comprise its internal control
over financial reporting, that have materially affected, or are reasonably likely to materially affect, the Bank’s internal control over financial reporting. Refer to
Note 2 and Note 3 of the Bank’s second quarter 2026 Interim Consolidated Financial Statements for further information regarding the Bank’s changes to
accounting policies, procedures, and estimates.
TD BANK GROUP • SECOND QUARTER 2026 • REPORT TO SHAREHOLDERS
Page 46
GLOSSARY
FINANCIAL AND BANKING TERMS
Adjusted Results:
Bank’s businesses and to measure the Bank’s overall performance. To arrive at
adjusted results, the Bank adjusts for “items of note”, from reported results. The
items of note relate to items which management does not believe are indicative
of underlying business performance.
Allowance for Credit Losses:
financial assets, including any off-balance sheet exposures, at the balance
sheet date. Allowance for credit losses consists of Stage 3 allowance for
impaired financial assets and Stage 2 and Stage 1 allowance for performing
financial assets and off-balance sheet instruments. The allowance is increased
by the provision for credit losses, decreased by write-offs net of recoveries and
disposals, and impacted by foreign exchange.
Amortized Cost:
measured at initial recognition minus principal repayments, plus or minus the
cumulative amortization, using EIRM, of any differences between the initial
amount and the maturity amount, and minus any reduction for impairment.
Assets under Administration (AUA):
customers where the Bank provides services of an administrative nature, such
as the collection of investment income and the placing of trades on behalf of the
clients (where the client has made his or her own investment selection). The
majority of these assets are not reported on the Bank’s Consolidated Balance
Sheet.
Assets under Management (AUM):
customers, managed by the Bank, where the Bank has discretion to make
investment selections on behalf of the client (in accordance with an investment
policy). In addition to the TD family of mutual funds, the Bank manages assets
on behalf of individuals, pension funds, corporations, institutions, endowments
and foundations. These assets are not reported on the Bank’s Consolidated
Balance Sheet. Some assets under management that are also administered by
the Bank are included in assets under administration.
Asset-Backed Commercial Paper (ABCP):
collateralized by other financial assets. Institutional investors usually purchase
such instruments in order to diversify their assets and generate short-term
gains.
Asset-Backed Securities (ABS):
payments are derived from and collateralized (or “backed”) by a specified pool
of underlying assets.
Average Common Equity:
Average common equity for the business segments
reflects the average allocated capital. The Bank’s methodology for allocating
capital to its business segments is largely aligned with the common equity
capital requirements under Basel III.
Average Interest-Earning Assets:
the Bank’s financial position, and is calculated as the average carrying value of
deposits with banks, loans and securities based on daily balances for the period
ending October 31 in each fiscal year.
Basic Earnings per Share (EPS):
dividing net income available to common shareholders by the weighted average
number of common shares outstanding for the period. Adjusted basic EPS is
calculated in the same manner using adjusted net income.
Basis Points (bps):
100 basis points.
Book Value per Share:
shareholders’ equity by number of common shares at the end of the period.
Carrying Value:
Consolidated Balance Sheet.
Catastrophe Claims:
occurred in the period, for which the aggregate insurance claims are equal to
or greater than an internal threshold of $5 million before reinsurance. The
Bank’s internal threshold may change from time to time.
Collateralized Mortgage Obligation (CMO):
obligations consisting of mortgage-backed securities that are separated and
issued as different classes of mortgage pass-through securities with different
terms, interest rates, and risks. CMOs by private issuers are collectively
referred to as non-agency CMOs.
Common Equity Tier 1 (CET1) Capital:
This is a primary Basel III capital
measure comprised mainly of common equity, retained earnings and qualifying
non-controlling interest in subsidiaries. Regulatory deductions made to arrive
at the CET1 Capital include goodwill and intangibles, unconsolidated
investments in banking, financial, and insurance entities, deferred tax assets,
defined benefit pension fund assets, and shortfalls in allowances.
Common Equity Tier 1 (CET1) Capital Ratio:
CET1 Capital ratio represents
the predominant measure of capital adequacy under Basel III
and equals CET1 Capital divided by RWA.
Compound Annual Growth Rate (CAGR):
time periods from the initial investment value to the ending investment value
assuming that the investment has been compounding over the time period.
Credit Valuation Adjustment (CVA):
CVA represents a capital charge that
measures credit risk due to default of derivative counterparties. This charge
requires banks to capitalize for the potential changes in counterparty credit
spread for the derivative portfolios.
Diluted EPS:
available to common shareholders by the weighted average number of
common shares outstanding adjusting for the effect of all potentially dilutive
common shares. Adjusted diluted EPS is calculated in the same manner using
adjusted net income.
Dividend Payout Ratio:
being paid to common shareholders in the form of dividends and is calculated
by dividing common dividends by net income available to common
shareholders. Adjusted dividend payout ratio is calculated in the same manner
using adjusted net income.
Dividend Yield:
year divided by the daily average closing stock price during the year.
Effective Income Tax Rate:
A rate and performance indicator calculated by
dividing the provision for income taxes as a percentage of net income before
taxes. Adjusted effective income tax rate is calculated in the same manner
using adjusted results.
Effective Interest Rate (EIR):
flows for the expected life of the financial instrument to its carrying value. The
calculation takes into account the contractual interest rate, along with any fees
or incremental costs that are directly attributable to the instrument and all other
premiums or discounts.
Effective Interest Rate Method (EIRM):
interest rate in a period based on the amount of a financial instrument’s book
value at the beginning of the accounting period. Under EIRM, the effective
interest rate, which is a key component of the calculation, discounts the
expected future cash inflows and outflows expected over the life of a financial
instrument.
TD BANK GROUP • SECOND QUARTER 2026 • REPORT TO SHAREHOLDERS
Page 47
Efficiency Ratio:
calculated by taking the non-interest expenses as a percentage of total revenue.
A lower ratio indicates a more efficient business operation. Adjusted efficiency
ratio is calculated in the same manner using adjusted non-interest expenses
and adjusted total revenue.
Enhanced Disclosure Task Force (EDTF):
Established by the FSB in
May 2012, comprised of banks, analysts, investors, and auditors, with the goal
of enhancing the risk disclosures of banks and other financial institutions.
Expected Credit Losses (ECLs):
ECLs are the probability-weighted present
value of expected cash shortfalls over the remaining expected life of the
financial instrument and considers reasonable and supportable information
about past events, current conditions, and forecasts of future events and
economic conditions that impact the Bank’s credit risk assessment.
Fair Value:
a liability in an orderly transaction between market participants at the
measurement date, under current market conditions.
Fair value through other comprehensive income (FVOCI):
Under IFRS 9, if
the asset passes the contractual cash flows test (named SPPI), the business
model assessment determines how the instrument is classified. If the instrument
is being held to collect contractual cash flows, that is, if it is not expected to be
sold, it is measured as amortized cost. If the business model for the instrument
is to both collect contractual cash flows and potentially sell the asset, it is
measured at FVOCI.
Fair value through profit or loss (FVTPL):
Under IFRS 9, the classification is
dependent on two tests, a contractual cash flow test (named SPPI) and a
business model assessment. Unless the asset meets the requirements of both
tests, it is measured at fair value with all changes in fair value reported in profit
or loss.
Federal Deposit Insurance Corporation (FDIC):
A U.S. government
corporation which provides deposit insurance guaranteeing the safety of a
depositor’s accounts in member banks. The FDIC also examines and
supervises certain financial institutions for safety and soundness, performs
certain consumer-protection functions, and manages banks in receiverships
(failed banks).
Forward Contracts:
one party to the contract to buy and the other party to sell an asset for a fixed
price at a future date.
Futures:
price on a specified future date.
Hedging:
exposure to fluctuations in interest rates, foreign currency exchange rates, or
other market factors. The elimination or reduction of such exposure is
accomplished by engaging in capital markets activities to establish offsetting
positions.
Impaired Loans:
deterioration of credit quality to the extent that the Bank no longer has
reasonable assurance as to the timely collection of the full amount of principal
and interest.
Loss Given Default (LGD):
incur when a borrower defaults on a loan, which is expressed as a percentage
of exposure at default.
Mark-to-Market (MTM):
balance sheet date for financial instruments that are carried at fair value.
Master Netting Agreements:
have multiple derivative contracts with each other that provide for the net
settlement of all contracts through a single payment, in a single currency, in
the event of default or termination of any one contract.
Net Corporate Expenses:
Non-interest expenses related to corporate service
and control groups which are not allocated to a business segment.
Net Interest Margin:
percentage of average interest-earning assets to measure performance. This
metric is an indicator of the profitability of the Bank’s earning assets less the
cost of funding. Adjusted net interest margin is calculated in the same manner
using adjusted net interest income.
Non-Viability Contingent Capital (NVCC):
Instruments (preferred shares and
subordinated debt) that contain a feature or a provision that allows the financial
institution to either permanently convert these instruments into common shares
or fully write-down the instrument, in the event that the institution is no longer
viable.
Notional:
instruments are based.
Office of the Superintendent of Financial Institutions Canada (OSFI):
The
regulator of Canadian federally chartered financial institutions and federally
administered pension plans.
Operating Leverage:
A
non-GAAP measure that the Bank calculates as the
difference between the % change in adjusted revenue (U.S. Banking in source
currency) net of insurance service expense (ISE), and adjusted expenses
(U.S. Banking in US$) grossed up by the retailer program partners’ share of
PCL for the Bank’s U.S. strategic cards portfolio. Collectively, these
adjustments provide a measure of operating leverage that management
believes is more reflective of underlying business performance.
Options:
right, but not the obligation, to buy or to sell a security, exchange rate, interest
rate, or other financial instrument or commodity at a predetermined price at or
by a specified future date.
Price-Earnings Ratio:
EPS based on a trailing four quarters to indicate market performance. Adjusted
price-earnings ratio is calculated in the same manner using adjusted EPS.
Probability of Default (PD):
to meet its scheduled repayments.
Provision for Credit Losses (PCL):
losses to bring it to a level that management considers adequate to reflect
expected credit-related losses on its portfolio.
Return on Common Equity (ROE):
as net income available to common shareholders as a percentage of average
common shareholders’ equity, utilized in assessing the Bank’s use of equity.
ROE for the business segments is calculated as the segment net income
available to common shareholders as a percentage of average allocated
capital. Adjusted ROE is calculated in the same manner using adjusted net
income.
Return on Tangible Common Equity (ROTCE):
measure calculated as reported net income available to common shareholders
after adjusting for the after-tax amortization of acquired intangibles, which are
treated as an item of note, as a percentage of average Tangible common
equity. Adjusted ROTCE is calculated in the same manner using adjusted net
income. Both measures can be utilized in assessing the Bank’s use of equity.
TD BANK GROUP • SECOND QUARTER 2026 • REPORT TO SHAREHOLDERS
Page 48
Return on Risk-weighted Assets:
Net income available to common
shareholders as a percentage of average risk-weighted assets.
Risk-Weighted Assets (RWA):
Assets calculated by applying a regulatory risk-
weight factor to on and off-balance sheet exposures. The risk-weight factors are
established by the OSFI to convert on and off-balance sheet exposures to a
comparable risk level.
Securitization:
transferred to structures, which normally issue a series of asset-backed
securities to investors to fund the purchase of loans.
Solely Payments of Principal and Interest (SPPI):
financial asset that are consistent with a basic lending arrangement.
Swaps:
payment obligations and currencies on a notional principal for a specified period
of time.
Tangible common equity (TCE):
common shareholders’ equity less goodwill, imputed goodwill, and intangibles
on an investment in Schwab and other acquired intangible assets, net of related
deferred tax liabilities. It can be utilized in assessing the Bank’s use of equity.
Taxable Equivalent Basis (TEB):
that increases revenues and the provision for income taxes on certain tax-
exempt securities to an equivalent before-tax basis to facilitate comparison of
net interest income from both taxable and tax-exempt sources.
Tier 1 Capital Ratio:
capital, consisting primarily of common shareholders’ equity, retained earnings,
preferred shares and innovative instruments. Tier 1 Capital ratio is calculated as
Tier 1 Capital divided by RWA.
Total Capital Ratio:
Capital. Total Capital ratio is calculated as Total Capital divided by RWA.
Total Shareholder Return (TSR):
TD’s common shares. The return measures the change in shareholder value,
assuming dividends paid are reinvested in additional shares.
Trading-Related Revenue:
trading income (loss), net interest income on trading positions, and income from
financial instruments designated at FVTPL that are managed within a trading
portfolio. Trading-related revenue (TEB) in the Wholesale Banking segment is
also a non-GAAP financial measure and is calculated in the same manner,
including TEB adjustments. Both are used for measuring trading performance.
Value-at-Risk (VaR):
and to calculate the regulatory capital required for market risk in trading
activities. VaR measures the adverse impact that potential changes in market
rates and prices could have on the value of a portfolio over a specified period of
time.
TD BANK GROUP • SECOND QUARTER 2026 • REPORT TO SHAREHOLDERS
Page 49
INTERIM CONSOLIDATED FINANCIAL STATEMENTS
(unaudited)
INTERIM CONSOLIDATED BALANCE SHEET
(unaudited)
(As at and in millions of Canadian dollars)
April 30, 2026
October 31, 2025
ASSETS
Cash and due from banks
$
$
Interest-bearing deposits with banks
Trading loans, securities, and other
Non-trading financial assets at fair value through profit or loss
Derivatives
Financial assets designated at fair value through profit or loss
Financial assets at fair value through other comprehensive income
Debt securities at amortized cost, net of allowance for credit losses (Notes 4, 5)
Securities purchased under reverse repurchase agreements
Loans (Notes 4, 6)
Residential mortgages
Consumer instalment and other personal
Credit card
Business and government
Allowance for loan losses
(8,419 )
(8,689 )
Loans, net of allowance for loan losses
Other
Goodwill
Other intangibles
Land, buildings, equipment, other depreciable assets and right-of-use assets
Deferred tax assets
Amounts receivable from brokers, dealers, and clients
Other assets
Total assets
$
$
LIABILITIES
Trading deposits
$
$
Derivatives
Securitization liabilities at fair value
Financial liabilities designated at fair value through profit or loss
Deposits (Notes 4, 9)
Personal
Banks
Business and government
Other
Obligations related to securities sold short
Obligations related to securities sold under repurchase agreements
Securitization liabilities at amortized cost
Amounts payable to brokers, dealers, and clients
Insurance contract liabilities
Other liabilities
Subordinated notes and debentures (Notes 4, 11)
Total liabilities
EQUITY
Shareholders’ Equity
Common shares
Preferred shares and other equity instruments
Treasury – common shares
(60 )
Treasury – preferred shares and other equity instruments
(14 )
(4 )
Contributed surplus
Retained earnings
Accumulated other comprehensive income (loss)
Total equity
Total liabilities and equity
$
$
The accompanying Notes are an integral part of these Interim Consolidated Financial Statements.
TD BANK GROUP • SECOND QUARTER 2026 • REPORT TO SHAREHOLDERS
Page 50
INTERIM CONSOLIDATED STATEMENT OF INCOME
(unaudited)
(millions of Canadian dollars, except as noted)
For the three months ended
For the six months ended
April 30
April 30
April 30
April 30
2026
2025
2026
2025
Interest income
1
Loans
$
$
$
$
Reverse repurchase agreements
Securities
Interest
Dividends
Deposits with banks
Interest expense (Note 19)
Deposits
Securitization liabilities
Subordinated notes and debentures
Repurchase agreements and short sales
Other
Net interest income
Non-interest income
Investment and securities services
Credit fees
Trading income (loss)
Service charges
Card services
Insurance revenue
Other income (loss)
(98 )
Total revenue
Provision for (recovery of) credit losses (Note 6)
Insurance service expenses
Non-interest expenses
Salaries and employee benefits
Occupancy, including depreciation
Technology and equipment, including depreciation
Amortization of other intangibles
Communication and marketing
Restructuring charges (recovery)
(6 )
Brokerage-related and sub-advisory fees
Professional, advisory and outside services
Other
Income before income taxes and share of net income from investment
in Schwab
Provision for (recovery of) income taxes
Share of net income from investment in Schwab (Note 7)
Net income
Preferred dividends and distributions on other equity instruments
Net income available to common shareholders
$
$
$
$
Earnings per share
Basic
$
$
$
$
Diluted
Dividends per common share
1
$
The accompanying Notes are an integral part of these Interim Consolidated Financial Statements.
TD BANK GROUP • SECOND QUARTER 2026 • REPORT TO SHAREHOLDERS
Page 51
INTERIM CONSOLIDATED STATEMENT OF COMPREHENSIVE INCOME
(unaudited)
(millions of Canadian dollars)
For the three months ended
For the six months ended
April 30
April 30
April 30
April 30
2026
2025
2026
2025
Net income
$
$
$
$
Other comprehensive income (loss)
Items that will be subsequently reclassified to net income
Net change in unrealized gain/(loss) on financial assets at fair value
through other comprehensive income
Unrealized gain/(loss)
(257 )
(338 )
(204 )
Reclassification to earnings of net loss/(gain)
(3 )
(2 )
Allowance for credit losses recognized in earnings
Income taxes relating to:
Unrealized gain/(loss)
(23 )
Reclassification to earnings of net loss/(gain)
(189 )
(253 )
(144 )
Net change in unrealized foreign currency translation gain/(loss) on
investments in foreign operations, net of hedging activities
Unrealized gain/(loss)
(60 )
(6,146 )
(3,612 )
(927 )
Reclassification to earnings of net loss/(gain)
(533 )
(533 )
Net gain/(loss) on hedges
(37 )
Reclassification to earnings of net loss/(gain) on hedges
Income taxes relating to:
Net gain/(loss) on hedges
(1,138 )
(660 )
(145 )
Reclassification to earnings of net loss/(gain) on hedges
(220 )
(220 )
(87 )
(3,148 )
(1,899 )
(512 )
Net change in gain/(loss) on derivatives designated as cash flow hedges
Gain/(loss)
(1,130 )
(3,089 )
Reclassification to earnings of loss/(gain)
(218 )
(1,402 )
Income taxes relating to:
Gain/(loss)
(714 )
(1,095 )
Reclassification to earnings of loss/(gain)
(22 )
(364 )
(804 )
(1,250 )
Share of other comprehensive income (loss) from investment in Schwab
Items that will not be subsequently reclassified to net income
Remeasurement gain/(loss) on employee benefit plans
Gain/(loss)
(40 )
(17 )
Income taxes
(30 )
(11 )
(29 )
(11 )
Change in net unrealized gain/(loss) on equity securities designated at
fair value through other comprehensive income
Net unrealized gain/(loss)
Income taxes
(2 )
(13 )
(10 )
(16 )
Gain/(loss) from changes in fair value due to own credit risk on
financial liabilities designated at fair value through profit or loss
Gain/(loss)
(3 )
Income taxes
(4 )
(11 )
(8 )
(3 )
Total other comprehensive income (loss)
(988 )
(3,044 )
Total comprehensive income (loss)
$
$
$
$
Available to:
Common shareholders
$
$
$
$
Preferred shareholders and other equity instrument holders
The accompanying Notes are an integral part of these Interim Consolidated Financial Statements.
TD BANK GROUP • SECOND QUARTER 2026 • REPORT TO SHAREHOLDERS
Page 52
INTERIM CONSOLIDATED STATEMENT OF CHANGES IN EQUITY
(unaudited)
(millions of Canadian dollars)
For the three months ended
For the six months ended
April 30, 2026
April 30, 2025
April 30, 2026
April 30, 2025
Common shares (Note 12)
Balance at beginning of period
$
$
$
$
Proceeds from shares issued on exercise of stock options
Shares issued as a result of dividend reinvestment plan
Purchase of shares for cancellation and other
(284 )
(436 )
(568 )
(436 )
Balance at end of period
Preferred shares and other equity instruments (Note 12)
Balance at beginning of period
Issuance of shares and other equity instruments
Redemption of shares and other equity instruments
(500 )
Balance at end of period
Treasury – common shares (Note 12)
Balance at beginning of period
(5 )
(38 )
(17 )
Purchase of shares
(2,899 )
(2,880 )
(6,213 )
(6,384 )
Sale of shares
Balance at end of period
(60 )
(26 )
(60 )
(26 )
Treasury – preferred shares and other equity instruments (Note 12)
Balance at beginning of period
(11 )
(51 )
(4 )
(18 )
Purchase of shares and other equity instruments
(353 )
(267 )
(515 )
(1,387 )
Sale of shares and other equity instruments
Balance at end of period
(14 )
(28 )
(14 )
(28 )
Contributed surplus
Balance at beginning of period
Net premium (discount) on sale of treasury instruments
(11 )
Issuance of stock options, net of options exercised
Other
Balance at end of period
Retained earnings
Balance at beginning of period
Net income available to equity instrument holders
Common dividends
(1,786 )
(1,815 )
(3,597 )
(3,651 )
Preferred dividends and distributions on other equity instruments
(202 )
(200 )
(303 )
(286 )
Share and other equity instrument issue expenses
(2 )
Net premium on repurchase of common shares and redemption of preferred shares and other
equity instruments
(2,321 )
(2,135 )
(4,483 )
(2,135 )
Remeasurement gain/(loss) on employee benefit plans
(29 )
(11 )
Realized gain/(loss) on equity securities designated at fair value through
other comprehensive income
(28 )
(23 )
Balance at end of period
Accumulated other comprehensive income (loss)
Net unrealized gain/(loss) on financial assets at fair value through other comprehensive income:
Balance at beginning of period
(99 )
(208 )
Other comprehensive income (loss)
(189 )
(255 )
(145 )
Allowance for credit losses
Balance at end of period
(352 )
(352 )
Net unrealized gain/(loss) on equity securities designated at fair value through
other comprehensive income:
Balance at beginning of period
Other comprehensive income (loss)
Reclassification of loss/(gain) to retained earnings
(21 )
(35 )
Balance at end of period
Gain/(loss) from changes in fair value due to own credit risk on financial liabilities
designated at fair value through profit or loss:
Balance at beginning of period
(41 )
(29 )
(28 )
(22 )
Other comprehensive income (loss)
(3 )
Balance at end of period
(31 )
(1 )
(31 )
(1 )
Net unrealized foreign currency translation gain/(loss) on investments in foreign
operations, net of hedging activities:
Balance at beginning of period
Other comprehensive income (loss)
(87 )
(3,148 )
(1,899 )
(512 )
Balance at end of period
Net gain/(loss) on derivatives designated as cash flow hedges:
Balance at beginning of period
(1,215 )
(2,719 )
(769 )
(2,924 )
Other comprehensive income (loss)
(804 )
(1,250 )
Balance at end of period
(2,019 )
(1,078 )
(2,019 )
(1,078 )
Total accumulated other comprehensive income
Total equity
$
$
$
$
The accompanying Notes are an integral part of these Interim Consolidated Financial Statements.
TD BANK GROUP • SECOND QUARTER 2026 • REPORT TO SHAREHOLDERS
Page 53
INTERIM CONSOLIDATED STATEMENT OF CASH FLOWS
(millions of Canadian dollars)
For the three months ended
For the six months ended
April 30
April 30
April 30
April 30
2026
2025
2026
2025
Cash flows from (used in) operating activities
Net income
$
$
$
$
Adjustments to determine net cash flows from (used in) operating activities
Gain on Sale of Schwab shares
(9,159 )
(9,159 )
Provision for (recovery of) credit losses
Depreciation
Amortization of other intangibles
Net securities loss/(gain)
(2 )
Share of net income from investment in Schwab
(74 )
(305 )
Deferred taxes
(275 )
(457 )
(527 )
Changes in operating assets and liabilities
Interest receivable and payable
(147 )
(608 )
(227 )
(845 )
Obligations related to securities sold under repurchase agreements
(6,454 )
(2,758 )
(14,498 )
Securities purchased under reverse repurchase agreements
(8,259 )
Obligations related to securities sold short
(2,533 )
(1,502 )
Trading loans, securities, and other
(11,544 )
(19,232 )
Loans net of securitization and sales
(6,807 )
(13,334 )
Deposits
(4,733 )
(21,175 )
(22,247 )
(2,583 )
Derivatives
(427 )
Non-trading financial assets at fair value through profit or loss
(718 )
(700 )
(1,659 )
Financial assets and liabilities designated at fair value through profit or loss
(2,995 )
(16,984 )
(14,080 )
Securitization liabilities
Current income taxes
(624 )
(727 )
Amounts receivable and payable from brokers, dealers, and clients
(571 )
(3,652 )
Other, including unrealized foreign currency translation loss/(gain)
(186 )
(4,112 )
Net cash from (used in) operating activities
(38,541 )
Cash flows from (used in) financing activities
Issuance of subordinated notes and debentures
Redemption or repurchase of subordinated notes and debentures
(1,257 )
(2,927 )
(1,263 )
(2,994 )
Common shares issued, net of issuance costs
Repurchase of common shares, including tax on net value of share repurchases
(2,605 )
(2,571 )
(5,051 )
(2,571 )
Preferred shares and other equity instruments issued, net of issuance costs
Redemption of preferred shares and other equity instruments
(500 )
Sale of treasury shares and other equity instruments
Purchase of treasury shares and other equity instruments
(3,252 )
(3,147 )
(6,728 )
(7,771 )
Dividends paid on shares and distributions paid on other equity instruments
(3,759 )
(2,015 )
(3,900 )
(3,807 )
Repayment of lease liabilities
(168 )
(340 )
(331 )
(509 )
Net cash from (used in) financing activities
(6,794 )
(7,760 )
(9,458 )
(7,472 )
Cash flows from (used in) investing activities
Interest-bearing deposits with banks
(9,911 )
(3,459 )
Activities in financial assets at fair value through other comprehensive income
Purchases
(9,750 )
(21,836 )
(21,762 )
(42,813 )
Proceeds from maturities
Proceeds from sales
Activities in debt securities at amortized cost
Purchases
(14,200 )
(22,204 )
(26,245 )
(29,337 )
Proceeds from maturities
Proceeds from sales
Net purchases of land, buildings, equipment, other depreciable assets, and other intangibles
(624 )
(436 )
(1,155 )
(933 )
Net cash acquired from divestitures
Net cash from (used in) investing activities
(3,872 )
(4,808 )
(14,835 )
Effect of exchange rate changes on cash and due from banks
(4 )
(221 )
(187 )
(36 )
Net increase (decrease) in cash and due from banks
(429 )
(1,051 )
(1,654 )
(936 )
Cash and due from banks at beginning of period
Cash and due from banks at end of period
$
$
$
$
Supplementary disclosure of cash flows from operating activities
Amount of income taxes paid (refunded) during the period
$
$
$
$
Amount of interest paid during the period
Amount of interest received during the period
Amount of dividends received during the period
The accompanying Notes are an integral part of these Interim Consolidated Financial Statements.
TD BANK GROUP • SECOND QUARTER 2026 • REPORT TO SHAREHOLDERS
Page 54
NOTES TO INTERIM CONSOLIDATED FINANCIAL STATEMENTS
(unaudited)
NOTE 1: NATURE OF OPERATIONS
CORPORATE INFORMATION
The Toronto-Dominion Bank is a bank chartered under the
Bank Act (Canada)
. The shareholders of a bank are not, as shareholders, liable for any liability, act, or
default of the bank except as otherwise provided under the
Bank Act (Canada)
. The Toronto-Dominion Bank and its subsidiaries are collectively known as
TD Bank Group (“TD” or the “Bank”). The Bank was formed through the amalgamation on February 1, 1955, of The Bank of Toronto (chartered in 1855) and The
Dominion Bank (chartered in 1869). The Bank is incorporated and domiciled in Canada with its registered and principal business offices located at 66 Wellington
Street West, Toronto, Ontario. TD serves customers in four business segments operating in a number of locations in key financial centres around the globe:
Canadian Personal and Commercial Banking, U.S. Banking, Wealth Management and Insurance, and Wholesale Banking.
BASIS OF PREPARATION
The accompanying Interim Consolidated Financial Statements have been prepared on a condensed basis in accordance with International Accounting Standards
34,
Interim Financial Reporting
of the Bank’s 2025 Annual Consolidated Financial Statements, including the accounting requirements of the Office of the Superintendent of Financial Institutions
Canada (OSFI), which were consistently applied to all periods presented. The Interim Consolidated Financial Statements are presented in Canadian dollars,
unless otherwise indicated.
Certain comparative amounts have been revised to conform with the presentation adopted in the current period.
The preparation of the Interim Consolidated Financial Statements requires that management make judgments, estimates, and assumptions regarding the
reported amount of assets, liabilities, revenue and expenses, and disclosure of contingent assets and liabilities, as further described in Note 3 of the Bank’s 2025
Annual Consolidated Financial Statements and in Note 3 of this report. Accordingly, actual results may differ from estimated amounts as future confirming events
occur.
The Bank’s Interim Consolidated Financial Statements have been prepared using uniform accounting policies for like transactions and events in similar
circumstances. All intercompany transactions, balances, and unrealized gains and losses on transactions are eliminated on consolidation.
The Interim Consolidated Financial Statements for the three and six months ended April 30, 2026, were approved and authorized for issue by the Bank’s Board
of Directors on May 27, 2026, in accordance with a recommendation of the Audit Committee.
As the Interim Consolidated Financial Statements do not include all of the disclosures normally provided in the Annual Consolidated Financial Statements, they
should be read in conjunction with the Bank’s 2025 Annual Consolidated Financial Statements and the accompanying Notes, and the shaded sections of the 2025
Management’s Discussion and Analysis (MD&A). The risk management policies and procedures of the Bank are provided in the MD&A. The shaded sections of
the “Managing Risk” section of the MD&A in this report, relating to market, liquidity, and insurance risks, are an integral part of these Interim Consolidated Financial
Statements, as permitted by International Financial Reporting Standards.
NOTE 2: CURRENT AND FUTURE CHANGES IN ACCOUNTING POLICIES
CURRENT CHANGES IN ACCOUNTING POLICIES
There were no new accounting policies adopted by the Bank for the three and six months ended April 30, 2026.
FUTURE CHANGES IN ACCOUNTING POLICIES
There were no new accounting standards or amendments issued during the three and six months ended April 30, 2026. Refer to Note 4 of the Bank’s 2025 Annual
Consolidated Financial Statements for a description of future changes in accounting policies.
NOTE 3: SIGNIFICANT ACCOUNTING JUDGMENTS, ESTIMATES, AND ASSUMPTIONS
The estimates used in the Bank’s accounting policies are essential to understanding its results of operations and financial condition. Some of the Bank’s policies
require subjective, complex judgments and estimates as they relate to matters that are inherently uncertain. Changes in these judgments or estimates and
changes to accounting standards and policies could have a materially adverse impact on the Bank’s Interim Consolidated Financial Statements. The Bank has
established procedures to ensure that accounting policies are applied consistently and that the processes for changing methodologies, determining estimates, and
adopting new accounting standards are well-controlled and occur in an appropriate and systematic manner. Refer to Note 3 of the Bank’s 2025 Annual
Consolidated Financial Statements for a description of significant accounting judgments, estimates, and assumptions.
Impairment – Expected Credit Loss Model
The expected credit loss (ECL) model requires the application of judgments, estimates, and assumptions in the assessment of the current and forward-looking
economic environment. There remains elevated economic uncertainty, and management continues to exercise expert credit judgment in assessing if an exposure
has experienced significant increase in credit risk since initial recognition and in determining the amount of ECLs at each reporting date. To the extent that certain
effects are not fully incorporated into the model calculations, temporary quantitative and qualitative adjustments have been applied, including for risks related to
elevated uncertainty associated with policy and trade, and such adjustments will be updated as appropriate in future periods.
TD BANK GROUP • SECOND QUARTER 2026 • REPORT TO SHAREHOLDERS
Page 55
NOTE 4: FAIR VALUE MEASUREMENTS
There have been no significant changes to the Bank’s approach and methodologies used to determine fair value measurements for the three and six months
ended April 30, 2026.
(a)
The following table reflects the fair value of the Bank’s financial assets and liabilities not carried at fair value.
Financial Assets and Liabilities not carried at Fair Value
1
(millions of Canadian dollars)
As at
April 30, 2026
October 31, 2025
Carrying
Fair
Carrying
Fair
value
value
value
value
FINANCIAL ASSETS
Debt securities at amortized cost, net of allowance for credit losses
Government and government-related securities
$
$
$
$
Other debt securities
Total debt securities at amortized cost, net of allowance for credit losses
Total loans, net of allowance for loan losses
Total financial assets not carried at fair value
$
$
$
$
FINANCIAL LIABILITIES
Deposits
$
$
$
$
Securitization liabilities at amortized cost
Subordinated notes and debentures
Total financial liabilities not carried at fair value
$
$
$
$
1
This table excludes financial assets and liabilities where the carrying value approximates their fair value.
TD BANK GROUP • SECOND QUARTER 2026 • REPORT TO SHAREHOLDERS
Page 56
(b)
FAIR VALUE HIERARCHY
The following table presents the levels within the fair value hierarchy for each of the assets and liabilities measured at fair value on a recurring basis as at
April 30, 2026 and October 31, 2025.
Fair Value Hierarchy for Assets and Liabilities Measured at Fair Value on a Recurring Basis
(millions of Canadian dollars)
As at
April 30, 2026
October 31, 2025
Level 1
Level 2
Level 3
Total
Level 1
Level 2
Level 3
Total
FINANCIAL ASSETS AND COMMODITIES
Trading loans, securities, and other
1
Government and government-related securities
Canadian government debt
Federal
$
$
$
$
$
$
$
$
Provinces
U.S. federal, state, municipal governments,
Other OECD
2
Mortgage-backed securities
Other debt securities
Canadian issuers
Other issuers
Equity securities
Trading loans
Commodities
Retained interests
Non-trading financial assets at fair value
through profit or loss
Securities
Loans
Derivatives
Interest rate contracts
Foreign exchange contracts
Credit contracts
Equity contracts
Commodity and other contracts
Financial assets designated at
fair value through profit or loss
Securities
1
Financial assets at fair value through other
comprehensive income
Government and government-related securities
Canadian government debt
Federal
Provinces
U.S. federal, state, municipal governments,
Other OECD government-guaranteed debt
Mortgage-backed securities
Other debt securities
Asset-backed securities
Corporate and other debt
Equity securities
Loans
Securities purchased under reverse
repurchase agreements
FINANCIAL LIABILITIES
Trading deposits
Derivatives
Interest rate contracts
Foreign exchange contracts
Credit contracts
Equity contracts
Commodity and other contracts
Securitization liabilities at fair value
Financial liabilities designated at fair value
through profit or loss
Obligations related to securities sold short
1
Obligations related to securities sold
under repurchase agreements
1
Balances reflect the reduction of securities owned (long positions) by the amount of identical securities sold but not yet purchased (short positions).
2
Organisation for Economic Co-operation and Development (OECD).
TD BANK GROUP • SECOND QUARTER 2026 • REPORT TO SHAREHOLDERS
Page 57
(c)
The Bank’s policy is to record transfers of assets and liabilities between the different levels of the fair value hierarchy using the fair values as at the end of each
reporting period. Assets and liabilities are transferred between Level 1 and Level 2 depending on whether there is sufficient frequency and volume in an active
market.
Transfers Between Fair Value Hierarchy Levels
(millions of Canadian dollars)
For the three months ended
April 30, 2026
April 30, 2025
Level 1 to Level 2
Level 2 to Level 1
Level 1 to Level 2
Level 2 to Level 1
Trading loans, securities, and other
$
$
$
$
Financial assets at fair value through other comprehensive
income
Obligations related to securities sold short
For the six months ended
April 30, 2026
April 30, 2025
Level 1 to Level 2
Level 2 to Level 1
Level 1 to Level 2
Level 2 to Level 1
Trading loans, securities, and other
$
$
$
$
Financial assets at fair value through other comprehensive
income
Obligations related to securities sold short
There were no significant transfers between Level 2 and Level 3 during the three and six months ended April 30, 2026 and April 30, 2025.
There were no significant changes to the unobservable inputs and sensitivities for assets and liabilities classified as Level 3 during the three and six months ended
April 30, 2026 and April 30, 2025.
TD BANK GROUP • SECOND QUARTER 2026 • REPORT TO SHAREHOLDERS
Page 58
(d)
RECONCILIATION OF CHANGES IN FAIR VALUE FOR LEVEL 3 ASSETS AND LIABILITIES
The following tables set out changes in fair value of all assets and liabilities measured at fair value using significant Level 3 unobservable inputs for the three and
six months ended April 30, 2026 and April 30, 2025.
Reconciliation of Changes in Fair Value for Level 3 Assets and Liabilities
(millions of Canadian dollars)
Change in
unrealized
Fair
Total realized and
Fair
gains
value as at
unrealized gains (losses)
Movements
1
Transfers
value as at
(losses) on
February 1
Included
Included
Purchases/
Sales/
Into
Out of
April 30
instruments
2026
in income
2
in OCI
3,4
Issuances
Settlements
Level 3
Level 3
2026
still held
5
FINANCIAL ASSETS
Trading loans, securities,
and other
Other debt securities
$
$
$
$
$
(19 )
$
$
(1 )
$
$
(1 )
Equity securities
Trading loans
(9 )
–
(7 )
(19 )
(1 )
(1 )
Non-trading financial
assets at fair value
through profit or loss
Securities
(2 )
(184 )
Loans
(2 )
(184 )
Financial assets at fair value
through other
comprehensive income
Other debt securities
Equity securities
(25 )
$
$
$
$
$
(25 )
$
$
$
$
FINANCIAL LIABILITIES
Trading deposits
6
$
(224 )
$
$
$
(6 )
$
$
$
$
(158 )
$
Derivatives
7
Interest rate contracts
(62 )
(15 )
(77 )
(24 )
Foreign exchange contracts
(1 )
(1 )
Equity contracts
(120 )
(4 )
(2 )
(107 )
Commodity and other contracts
(17 )
(200 )
(4 )
(2 )
(149 )
Financial liabilities designated
at fair value through profit
or loss
(7 )
(3 )
(4 )
Change in
unrealized
Fair
Total realized and
Fair
gains
value as at
unrealized gains (losses)
Movements
1
Transfers
value as at
(losses) on
November 1
Included
Included
Purchases/
Sales/
Into
Out of
April 30
instruments
2025
in income
2
in OCI
4
Issuances
Settlements
Level 3
Level 3
2026
still held
5
FINANCIAL ASSETS
Trading loans, securities,
and other
Other debt securities
$
$
(1 )
$
$
$
(22 )
$
$
(1 )
$
$
(4 )
Equity securities
Trading loans
(123 )
(124 )
(22 )
(1 )
(4 )
Non-trading financial
assets at fair value
through profit or loss
Securities
(6 )
(198 )
Loans
(6 )
(198 )
Financial assets at fair value
through other
comprehensive income
Other debt securities
Equity securities
(88 )
$
$
$
$
$
(88 )
$
$
$
$
FINANCIAL LIABILITIES
Trading deposits
6
$
(273 )
$
$
$
(6 )
$
$
$
$
(158 )
$
Derivatives
7
Interest rate contracts
(68 )
(11 )
(77 )
(16 )
Foreign exchange contracts
(2 )
(3 )
(1 )
Equity contracts
(155 )
(5 )
(107 )
Commodity and other contracts
(55 )
(1 )
(280 )
(4 )
(149 )
Financial liabilities designated
at fair value through profit
or loss
(2 )
(2 )
(9 )
(4 )
(2 )
1
Includes foreign exchange.
2
3
4
5
6
7
(January 31, 2026/February 1, 2026 – $
TD BANK GROUP • SECOND QUARTER 2026 • REPORT TO SHAREHOLDERS
Page 59
Reconciliation of Changes in Fair Value for Level 3 Assets and Liabilities
(millions of Canadian dollars)
Change in
unrealized
Fair
Total realized and
Fair
gains
value as at
unrealized gains (losses)
Movements
1
Transfers
value as at
(losses) on
February 1
Included
Included
Purchases/
Sales/
Into
Out of
April 30
instruments
2025
in income
2
in OCI
3
Issuances
Settlements
Level 3
Level 3
2025
still held
4
FINANCIAL ASSETS
Trading loans, securities,
and other
Other debt securities
$
$
$
$
$
(7 )
$
$
$
$
Equity securities
(7 )
Non-trading financial
assets at fair value
through profit or loss
Securities
(40 )
(20 )
(13 )
(43 )
(40 )
(20 )
(13 )
(43 )
Financial assets at fair value
through other
comprehensive income
Other debt securities
(3 )
(3 )
Equity securities
(370 )
(357 )
$
$
$
$
$
(373 )
$
$
$
$
(360 )
FINANCIAL LIABILITIES
Trading deposits
5
$
(459 )
$
$
$
(52 )
$
$
$
$
(384 )
$
Derivatives
6
Interest rate contracts
(155 )
(81 )
Foreign exchange contracts
(23 )
(1 )
(1 )
(8 )
Equity contracts
(29 )
(98 )
(4 )
(131 )
(95 )
Commodity and other contracts
(4 )
(16 )
(20 )
(12 )
(167 )
(63 )
(1 )
(2 )
(233 )
(47 )
Financial liabilities designated
at fair value through profit
or loss
(1 )
(7 )
(1 )
Change in
unrealized
Fair
Total realized and
Fair
gains
value as at
unrealized gains (losses)
Movements
1
Transfers
value as at
(losses) on
November 1
Included
Included
Purchases/
Sales/
Into
Out of
April 30
instruments
2024
in income
2
in OCI
3
Issuances
Settlements
Level 3
Level 3
2025
still held
4
FINANCIAL ASSETS
Trading loans, securities,
and other
Other debt securities
$
$
$
$
$
(22 )
$
$
$
$
Equity securities
(7 )
(29 )
Non-trading financial
assets at fair value
through profit or loss
Securities
(14 )
(37 )
(13 )
(30 )
(14 )
(37 )
(13 )
(30 )
Financial assets at fair value
through other
comprehensive income
Other debt securities
(7 )
Equity securities
(553 )
$
$
$
$
$
(560 )
$
$
$
$
FINANCIAL LIABILITIES
Trading deposits
5
$
(505 )
$
$
$
(124 )
$
$
$
$
(384 )
$
Derivatives
6
Interest rate contracts
(158 )
(81 )
Foreign exchange contracts
(16 )
(1 )
(5 )
Equity contracts
(24 )
(103 )
(2 )
(2 )
(131 )
(102 )
Commodity and other contracts
(10 )
(10 )
(20 )
(9 )
(191 )
(62 )
(233 )
(46 )
Financial liabilities designated
at fair value through profit
or loss
(24 )
(14 )
(1 )
1
Includes foreign exchange.
2
3
4
5
6
(January 31, 2025/February 1, 2025 – $
TD BANK GROUP • SECOND QUARTER 2026 • REPORT TO SHAREHOLDERS
Page 60
NOTE 5: SECURITIES
(a)
UNREALIZED SECURITIES GAINS (LOSSES)
The following table summarizes the unrealized gains and losses as at April 30, 2026 and October 31, 2025.
Unrealized Gains (Losses) for Securities at Fair Value Through Other Comprehensive Income
(millions of Canadian dollars)
As at
April 30, 2026
October 31, 2025
Cost/
Gross
Gross
Cost/
Gross
Gross
amortized
unrealized
unrealized
Fair
amortized
unrealized
unrealized
Fair
cost
1
gains
(losses)
value
cost
1
gains
(losses)
value
Government and government-related
securities
Canadian government debt
Federal
$
$
$
(62 )
$
$
$
$
(88 )
$
Provinces
(4 )
(11 )
U.S. federal, state, municipal governments, and
(89 )
(54 )
Other OECD government-guaranteed debt
(1 )
(4 )
Mortgage-backed securities
(1 )
(2 )
(157 )
(159 )
Other debt securities
Asset-backed securities
(11 )
(15 )
Corporate and other debt
(31 )
(26 )
(42 )
(41 )
Total debt securities
(199 )
(200 )
Equity securities
Common shares
(30 )
(22 )
Preferred shares
(79 )
(79 )
(109 )
(101 )
Total securities at fair value through
$
$
$
(308 )
$
$
$
$
(301 )
$
1
Includes the foreign exchange translation of amortized cost balances at the period-end spot rate.
(b)
EQUITY SECURITIES DESIGNATED AT FAIR VALUE THROUGH OTHER COMPREHENSIVE INCOME
The Bank designated certain equity securities at FVOCI.
The following table summarizes the fair value of equity securities designated at FVOCI as at
April 30, 2026 and October 31, 2025, and dividend income recognized on these securities for the three and six months ended April 30, 2026 and April 30, 2025.
Equity Securities Designated at Fair Value Through Other Comprehensive Income
(millions of Canadian dollars)
As at
For the three months ended
For the six months ended
April 30, 2026
October 31, 2025
April 30, 2026
April 30, 2025
April 30, 2026
April 30, 2025
Fair value
Dividend income recognized
Dividend income recognized
Common shares
$
$
$
$
$
$
Preferred shares
Total
$
$
$
$
$
$
The Bank disposed of certain equity securities in line with the Bank’s investment strategy and disposed of Federal Home Loan Bank (FHLB) stock in accordance
with FHLB member stockholding requirements, as follows:
Equity Securities Net Realized Gains (Losses)
(millions of Canadian dollars)
For the three months ended
For the six months ended
April 30, 2026
April 30, 2025
April 30, 2026
April 30, 2025
Equity Securities
Fair value
$
$
$
$
Cumulative realized gain/(loss)
(26 )
(20 )
FHLB Stock
Fair value
Cumulative realized gain/(loss)
(c)
DEBT SECURITIES NET REALIZED GAINS (LOSSES)
The Bank disposed of certain debt securities measured at amortized cost and FVOCI during the quarter.
The following table summarizes the net realized gains
and losses on securities disposed of during the three and six months ended April 30, 2026 and April 30, 2025, which are included in Other income (loss) on the
Interim Consolidated Statement of Income.
Debt Securities Net Realized Gains (Losses)
(millions of Canadian dollars)
For the three months ended
For the six months ended
April 30, 2026
April 30, 2025
1
April 30, 2026
April 30, 2025
1
Debt securities at amortized cost
$
$
(285 )
$
$
(1,196 )
Debt securities at fair value through other comprehensive income
(2 )
(6 )
Total
$
(1 )
$
(282 )
$
$
(1,202 )
1
Includes $
the balance sheet restructuring initiative undertaken in the U.S. Banking segment. Refer to Note 25 of the Bank’s 2025 Annual Consolidated Financial Statements for additional
information regarding the asset limitation on TD’s two U.S. bank subsidiaries.
TD BANK GROUP • SECOND QUARTER 2026 • REPORT TO SHAREHOLDERS
Page 61
(d)
CREDIT QUALITY OF DEBT SECURITIES
The Bank evaluates non-retail credit risk on an individual borrower basis, using both a borrower risk rating (BRR) and facility risk rating, as detailed in the shaded
area of the “Managing Risk” section of the 2025 MD&A. This system is used to assess all non-retail exposures, including debt securities.
The following table provides the gross carrying amounts of debt securities measured at amortized cost and debt securities at FVOCI by internal risk rating for credit
risk management purposes, presenting separately those debt securities that are subject to Stage 1, Stage 2, and Stage 3 allowances. Refer to the “Allowance for
Credit Losses” table in Note 6 for details regarding the allowance and provision for credit losses on debt securities.
Debt Securities by Risk Rating
(millions of Canadian dollars)
As at
April 30, 2026
October 31, 2025
Stage 1
Stage 2
Stage 3
Total
Stage 1
Stage 2
Stage 3
Total
Debt securities
1
Investment grade
$
$
$
n/a
2
$
$
$
$
n/a
$
Non-investment grade
n/a
n/a
Watch and classified
n/a
n/a
n/a
n/a
Default
n/a
n/a
n/a
n/a
Total debt securities
Allowance for credit losses on debt securities
at amortized cost
Total debt securities, net of allowance
$
$
$
$
$
$
$
$
1
Includes debt securities backed by government-guaranteed loans of $
based on the issuer’s credit risk.
2
As at April 30, 2026, total debt securities, net of allowance, in the table above, include debt securities measured at amortized cost, net of allowance, of
$
difference between probability-weighted ECLs and base ECLs on debt securities at FVOCI and at amortized cost as at both April 30, 2026 and October 31, 2025,
was insignificant.
NOTE 6: LOANS, IMPAIRED LOANS, AND ALLOWANCE FOR CREDIT LOSSES
(a)
LOANS
The following table provides details regarding the Bank’s loans as at April 30, 2026 and October 31, 2025.
Loans
(millions of Canadian dollars)
As at
April 30, 2026
October 31, 2025
Residential mortgages
$
$
Consumer instalment and other personal
Credit card
Business and government
Loans at FVOCI
1
Total loans
Total allowance for loan losses
Total loans, net of allowance
$
$
1
Included in Financial assets at fair value through other comprehensive income on the Interim Consolidated Balance Sheet.
Business and government loans and loans at FVOCI are grouped together as reflected below for presentation in the “Loans by Risk Ratings” table.
Loans – Business and Government
(millions of Canadian dollars)
As at
April 30, 2026
October 31, 2025
Loans at amortized cost
$
$
Loans at FVOCI
1
Loans
Allowance for loan losses
Loans, net of allowance
$
$
1
Included in Financial assets at fair value through other comprehensive income on the Interim Consolidated Balance Sheet.
TD BANK GROUP • SECOND QUARTER 2026 • REPORT TO SHAREHOLDERS
Page 62
(b)
CREDIT QUALITY OF LOANS
In the retail portfolio, including individuals and small businesses, the Bank manages exposures on a pooled basis, using predictive credit scoring techniques. For
non-retail exposures, each borrower is assigned a BRR that reflects the probability of default (PD) of the borrower using proprietary industry and sector specific
risk models and expert judgment. Refer to the shaded areas of the “Managing Risk” section of the 2025 MD&A for further details, including the mapping of PD
ranges to risk levels for retail exposures as well as the Bank’s 21-point BRR scale to risk levels and external ratings for non-retail exposures.
The following table provides the gross carrying amounts of loans and credit risk exposures on loan commitments and financial guarantee contracts by internal risk
rating for credit risk management purposes, presenting separately those that are subject to Stage 1, Stage 2, and Stage 3 allowances.
Loans by Risk Rating
(millions of Canadian dollars)
As at
April 30, 2026
October 31, 2025
Stage 1
Stage 2
Stage 3
Total
Stage 1
Stage 2
Stage 3
Total
Residential mortgages
1,2,3
Low Risk
$
$
$
n/a
$
$
$
$
n/a
$
Normal Risk
n/a
n/a
Medium Risk
n/a
n/a
High Risk
Default
n/a
n/a
n/a
n/a
Total loans
Allowance for loan losses
Loans, net of allowance
Consumer instalment and other personal
4
Low Risk
n/a
n/a
Normal Risk
n/a
n/a
Medium Risk
n/a
n/a
High Risk
Default
n/a
n/a
n/a
n/a
Total loans
Allowance for loan losses
Loans, net of allowance
Credit card
Low Risk
n/a
n/a
Normal Risk
n/a
n/a
Medium Risk
n/a
n/a
High Risk
Default
n/a
n/a
n/a
n/a
Total loans
Allowance for loan losses
Loans, net of allowance
Business and government
1,2,3,5
Investment grade or Low/Normal Risk
n/a
n/a
Non-investment grade or Medium Risk
n/a
n/a
Watch and classified or High Risk
Default
n/a
n/a
n/a
n/a
Total loans
Allowance for loan losses
Loans, net of allowance
Total loans
Total allowance for loan losses
Total loans, net of allowance
$
$
$
$
$
$
$
$
1
Includes impaired loans with a balance of $
exceeded the loan amount.
2
Excludes trading loans and non-trading loans at fair value through profit or loss (FVTPL) with a fair value of $
– $
3
Includes insured mortgages of $
4
5
Includes loans guaranteed by government agencies of $
the borrowers’ credit risk.
TD BANK GROUP • SECOND QUARTER 2026 • REPORT TO SHAREHOLDERS
Page 63
Loans by Risk Rating
(Continued)
1
(millions of Canadian dollars)
As at
April 30, 2026
October 31, 2025
Stage 1
Stage 2
Stage 3
Total
Stage 1
Stage 2
Stage 3
Total
Retail Exposures
2
Low Risk
$
$
$
n/a
$
$
$
$
n/a
$
Normal Risk
n/a
n/a
Medium Risk
n/a
n/a
High Risk
Default
n/a
n/a
n/a
n/a
Non-Retail Exposures
3
Investment grade
n/a
n/a
Non-investment grade
n/a
n/a
Watch and classified
Default
n/a
n/a
n/a
n/a
Total off-balance sheet credit
instruments
Allowance for off-balance sheet credit
instruments
Total off-balance sheet credit
instruments, net of allowance
$
$
$
$
$
$
$
$
1
Excludes mortgage commitments.
2
3
TD BANK GROUP • SECOND QUARTER 2026 • REPORT TO SHAREHOLDERS
Page 64
(c)
ALLOWANCE FOR CREDIT LOSSES
The following table provides details on the Bank’s allowance for credit losses as at and for the three and six months ended April 30, 2026 and April 30, 2025,
including allowance for off-balance sheet instruments in the applicable categories.
Allowance for Credit Losses
(millions of Canadian dollars)
Foreign
Foreign
exchange,
exchange,
Balance at
Provision
Write-offs,
disposals,
Balance
Balance at
Provision
Write-offs,
disposals,
Balance
beginning
for credit
net of
and other
at end of
beginning
for credit
net of
and other
at end of
of period
losses
recoveries
adjustments
period
of period
losses
recoveries
adjustments
period
For the three months ended
April 30, 2026
April 30, 2025
Residential mortgages
$
$
$
(1 )
$
$
$
$
(14 )
$
$
(6 )
$
Consumer instalment and other
personal
(318 )
(1 )
(307 )
(41 )
Credit card
(411 )
(435 )
(97 )
Business and government
(394 )
(25 )
(360 )
(104 )
Total allowance for loan losses,
including off-balance sheet
instruments
(1,124 )
(24 )
(1,102 )
(248 )
Debt securities at amortized cost
Debt securities at FVOCI
Total allowance for credit
losses on debt securities
Total allowance for credit losses
$
$
$
(1,124 )
$
(24 )
$
$
$
$
(1,102 )
$
(248 )
$
Comprising:
Allowance for credit losses on
loans at amortized cost
$
$
$
$
Allowance for credit losses on
loans at FVOCI
Allowance for loan losses
Allowance for off-balance sheet
instruments
Allowance for credit losses on
debt securities
For the six months ended
April 30, 2026
April 30, 2025
Residential mortgages
$
$
$
(4 )
$
(2 )
$
$
$
(15 )
$
(1 )
$
(1 )
$
Consumer instalment and other
personal
(661 )
(25 )
(641 )
(7 )
Credit card
(831 )
(55 )
(871 )
(13 )
Business and government
(630 )
(123 )
(546 )
(25 )
Total allowance for loan losses,
including off-balance sheet
instruments
(2,126 )
(205 )
(2,059 )
(46 )
Debt securities at amortized cost
Debt securities at FVOCI
Total allowance for credit
losses on debt securities
Total allowance for credit losses
$
$
$
(2,126 )
$
(205 )
$
$
$
$
(2,059 )
$
(46 )
$
Comprising:
Allowance for credit losses on
loans at amortized cost
$
$
$
$
Allowance for credit losses on
loans at FVOCI
Allowance for loan losses
Allowance for off-balance sheet
instruments
Allowance for credit losses on
debt securities
TD BANK GROUP • SECOND QUARTER 2026 • REPORT TO SHAREHOLDERS
Page 65
(d)
ALLOWANCE FOR LOAN LOSSES BY STAGE
The following table provides details on the Bank’s allowance for loan losses by stage as at and for the three months ended April 30, 2026 and April 30, 2025.
Allowance for Loan Losses by Stage
(millions of Canadian dollars)
For the three months ended
April 30, 2026
April 30, 2025
Stage 1
Stage 2
Stage 3
Total
Stage 1
Stage 2
Stage 3
Total
Residential Mortgages
Balance at beginning of period
$
$
$
$
$
$
$
$
Provision for credit losses
Transfer to Stage 1
1
(21 )
(2 )
(20 )
(2 )
Transfer to Stage 2
(13 )
(8 )
(7 )
(10 )
Transfer to Stage 3
(10 )
(8 )
Net remeasurement due to transfers into stage
2
(5 )
(1 )
(5 )
(1 )
New originations or purchases
3
n/a
n/a
n/a
n/a
Net repayments
4
(1 )
(1 )
(2 )
(1 )
(1 )
(2 )
Derecognition of financial assets (excluding
disposals and write-offs)
5
(1 )
(5 )
(9 )
(15 )
(5 )
(6 )
(7 )
(18 )
Changes to risk, parameters, and models
6
(10 )
(15 )
Disposals
Write-offs
(3 )
(3 )
(1 )
(1 )
Recoveries
Foreign exchange and other adjustments
(2 )
(1 )
(3 )
(6 )
Balance at end of period
$
$
$
$
$
$
$
$
Consumer Instalment and Other Personal
Balance, including off-balance sheet instruments,
at beginning of period
$
$
$
$
$
$
$
$
Provision for credit losses
Transfer to Stage 1
1
(184 )
(2 )
(137 )
(2 )
Transfer to Stage 2
(65 )
(22 )
(60 )
(25 )
Transfer to Stage 3
(3 )
(79 )
(2 )
(76 )
Net remeasurement due to transfers into stage
2
(82 )
(7 )
(61 )
New originations or purchases
3
n/a
n/a
n/a
n/a
Net repayments
4
(23 )
(28 )
(4 )
(55 )
(20 )
(29 )
(4 )
(53 )
Derecognition of financial assets (excluding
disposals and write-offs)
5
(23 )
(26 )
(11 )
(60 )
(21 )
(27 )
(10 )
(58 )
Changes to risk, parameters, and models
6
(72 )
(46 )
Disposals
Write-offs
(401 )
(401 )
(399 )
(399 )
Recoveries
Foreign exchange and other adjustments
(1 )
(1 )
(15 )
(21 )
(5 )
(41 )
Balance, including off-balance sheet instruments,
at end of period
Less: Allowance for off-balance sheet instruments
7
Balance at end of period
$
$
$
$
$
$
$
$
Credit Card
8
Balance, including off-balance sheet instruments,
at beginning of period
$
$
$
$
$
$
$
$
Provision for credit losses
Transfer to Stage 1
1
(243 )
(9 )
(224 )
(11 )
Transfer to Stage 2
(92 )
(24 )
(82 )
(23 )
Transfer to Stage 3
(7 )
(271 )
(6 )
(286 )
Net remeasurement due to transfers into stage
2
(101 )
(78 )
New originations or purchases
3
n/a
n/a
n/a
n/a
Net repayments
4
(10 )
(3 )
(12 )
(1 )
Derecognition of financial assets (excluding
disposals and write-offs)
5
(12 )
(27 )
(106 )
(145 )
(9 )
(21 )
(104 )
(134 )
Changes to risk, parameters, and models
6
(87 )
(28 )
Disposals
Write-offs
(529 )
(529 )
(532 )
(532 )
Recoveries
Foreign exchange and other adjustments
(32 )
(46 )
(19 )
(97 )
Balance, including off-balance sheet instruments,
at end of period
Less: Allowance for off-balance sheet instruments
7
Balance at end of period
$
$
$
$
$
$
$
$
1
Transfers represent stage transfer movements prior to ECL remeasurement.
2
described in the “Significant Increase in Credit Risk” section of Note 2 and Note 3 of the Bank’s 2025 Annual Consolidated Financial Statements, holding all other factors impacting the
change in ECLs constant.
3
4
5
6
subsequent to stage migration. Refer to the “Measurement of Expected Credit Losses”, “Forward-Looking Information ” and “Expert Credit Judgment” sections of Note 2 and Note 3 of the
Bank’s 2025 Annual Consolidated Financial Statements for further details.
7
8
Consolidated Financial Statements for further details.
TD BANK GROUP • SECOND QUARTER 2026 • REPORT TO SHAREHOLDERS
Page 66
Allowance for Loan Losses by Stage
(Continued)
(millions of Canadian dollars)
For the three months ended
April 30, 2026
April 30, 2025
Stage 1
Stage 2
Stage 3
Total
Stage 1
Stage 2
Stage 3
Total
Business and Government
Balance, including off-balance sheet instruments,
at beginning of period
$
$
$
$
$
$
$
$
Provision for credit losses
Transfer to Stage 1
1
(81 )
(63 )
(3 )
Transfer to Stage 2
(145 )
(3 )
(161 )
(15 )
Transfer to Stage 3
(2 )
(62 )
(1 )
(72 )
Net remeasurement due to transfers into stage
1
(28 )
(18 )
New originations or purchases
1
n/a
n/a
n/a
n/a
Net repayments
1
(46 )
(42 )
(88 )
(2 )
(5 )
(76 )
(83 )
Derecognition of financial assets (excluding
disposals and write-offs)
1
(205 )
(194 )
(186 )
(585 )
(160 )
(199 )
(46 )
(405 )
Changes to risk, parameters, and models
1
(43 )
Disposals
(5 )
(5 )
Write-offs
(407 )
(407 )
(383 )
(383 )
Recoveries
Foreign exchange and other adjustments
(6 )
(4 )
(10 )
(20 )
(39 )
(56 )
(9 )
(104 )
Balance, including off-balance sheet instruments,
at end of period
Less: Allowance for off-balance sheet instruments
2
Balance at end of period
Total Allowance, including off-balance sheet
instruments, at end of period
Less: Total Allowance for off-balance sheet
instruments
2
Total Allowance for Loan Losses at end of period
$
$
$
$
$
$
$
$
1
For explanations regarding this line item, refer to the “Allowance for Loan Losses by Stage” table on the previous page in this Note.
2
TD BANK GROUP • SECOND QUARTER 2026 • REPORT TO SHAREHOLDERS
Page 67
The following table provides details on the Bank’s allowance for loan losses by stage as at and for the six months ended April 30, 2026 and April 30, 2025.
Allowance for Loan Losses by Stage
(millions of Canadian dollars)
For the six months ended
April 30, 2026
April 30, 2025
Stage 1
Stage 2
Stage 3
Total
Stage 1
Stage 2
Stage 3
Total
Residential Mortgages
Balance at beginning of period
$
$
$
$
$
$
$
$
Provision for credit losses
Transfer to Stage 1
1
(44 )
(3 )
(54 )
(3 )
Transfer to Stage 2
(21 )
(15 )
(13 )
(15 )
Transfer to Stage 3
(20 )
(19 )
Net remeasurement due to transfers into stage
2
(11 )
(2 )
(12 )
(4 )
New originations or purchases
3
n/a
n/a
n/a
n/a
Net repayments
4
(2 )
(2 )
(4 )
(2 )
(2 )
(4 )
Derecognition of financial assets (excluding
disposals and write-offs)
5
(2 )
(10 )
(18 )
(30 )
(9 )
(10 )
(13 )
(32 )
Changes to risk, parameters, and models
6
(22 )
(43 )
Disposals
Write-offs
(7 )
(7 )
(2 )
(2 )
Recoveries
Foreign exchange and other adjustments
(1 )
(1 )
(2 )
(1 )
(1 )
Balance at end of period
$
$
$
$
$
$
$
$
Consumer Instalment and Other Personal
Balance, including off-balance sheet instruments,
at beginning of period
$
$
$
$
$
$
$
$
Provision for credit losses
Transfer to Stage 1
1
(385 )
(3 )
(321 )
(3 )
Transfer to Stage 2
(125 )
(42 )
(124 )
(48 )
Transfer to Stage 3
(6 )
(157 )
(5 )
(149 )
Net remeasurement due to transfers into stage
2
(166 )
(18 )
(143 )
New originations or purchases
3
n/a
n/a
n/a
n/a
Net repayments
4
(46 )
(54 )
(9 )
(109 )
(42 )
(54 )
(8 )
(104 )
Derecognition of financial assets (excluding
disposals and write-offs)
5
(45 )
(55 )
(24 )
(124 )
(42 )
(57 )
(20 )
(119 )
Changes to risk, parameters, and models
6
(168 )
(148 )
Disposals
Write-offs
(822 )
(822 )
(811 )
(811 )
Recoveries
Foreign exchange and other adjustments
(9 )
(13 )
(3 )
(25 )
(3 )
(4 )
(7 )
Balance, including off-balance sheet instruments,
at end of period
Less: Allowance for off-balance sheet instruments
7
Balance at end of period
$
$
$
$
$
$
$
$
Credit Card
8
Balance, including off-balance sheet instruments,
at beginning of period
$
$
$
$
$
$
$
$
Provision for credit losses
Transfer to Stage 1
1
(514 )
(19 )
(698 )
(22 )
Transfer to Stage 2
(183 )
(49 )
(168 )
(44 )
Transfer to Stage 3
(16 )
(544 )
(11 )
(528 )
Net remeasurement due to transfers into stage
2
(210 )
(300 )
(62 )
New originations or purchases
3
n/a
n/a
n/a
n/a
Net repayments
4
Derecognition of financial assets (excluding
disposals and write-offs)
5
(23 )
(56 )
(223 )
(302 )
(36 )
(43 )
(179 )
(258 )
Changes to risk, parameters, and models
6
(185 )
(275 )
Disposals
Write-offs
(1,058 )
(1,058 )
(1,061 )
(1,061 )
Recoveries
Foreign exchange and other adjustments
(20 )
(23 )
(12 )
(55 )
(4 )
(6 )
(3 )
(13 )
Balance, including off-balance sheet instruments,
at end of period
Less: Allowance for off-balance sheet instruments
7
Balance at end of period
$
$
$
$
$
$
$
$
1
Transfers represent stage transfer movements prior to ECL remeasurement.
2
described in the “Significant Increase in Credit Risk” section of Note 2 and Note 3 of the Bank’s 2025 Annual Consolidated Financial Statements, holding all other factors impacting the
change in ECLs constant.
3
4
5
6
subsequent to stage migration. Refer to the “Measurement of Expected Credit Losses”, “Forward-Looking Information ” and “Expert Credit Judgment” sections of Note 2 and Note 3 of the
Bank’s 2025 Annual Consolidated Financial Statements for further details.
7
8
Consolidated Financial Statements for further details.
TD BANK GROUP • SECOND QUARTER 2026 • REPORT TO SHAREHOLDERS
Page 68
Allowance for Loan Losses by Stage
(Continued)
(millions of Canadian dollars)
For the six months ended
April 30, 2026
April 30, 2025
Stage 1
Stage 2
Stage 3
Total
Stage 1
Stage 2
Stage 3
Total
Business and Government
Balance, including off-balance sheet instruments,
at beginning of period
$
$
$
$
$
$
$
$
Provision for credit losses
Transfer to Stage 1
1
(174 )
(151 )
(3 )
Transfer to Stage 2
(283 )
(7 )
(314 )
(20 )
Transfer to Stage 3
(4 )
(213 )
(4 )
(224 )
Net remeasurement due to transfers into stage
1
(59 )
(46 )
New originations or purchases
1
n/a
n/a
n/a
n/a
Net repayments
1
(77 )
(144 )
(214 )
(24 )
(86 )
(95 )
Derecognition of financial assets (excluding
disposals and write-offs)
1
(472 )
(449 )
(288 )
(1,209 )
(329 )
(395 )
(122 )
(846 )
Changes to risk, parameters, and models
1
(135 )
Disposals
(27 )
(27 )
(9 )
(9 )
Write-offs
(663 )
(663 )
(585 )
(585 )
Recoveries
Foreign exchange and other adjustments
(16 )
(43 )
(37 )
(96 )
(7 )
(11 )
(16 )
Balance, including off-balance sheet instruments,
at end of period
Less: Allowance for off-balance sheet instruments
2
Balance at end of period
Total Allowance, including off-balance sheet
instruments, at end of period
Less: Total Allowance for off-balance sheet
instruments
2
Total Allowance for Loan Losses at end of period
$
$
$
$
$
$
$
$
1
For explanations regarding this line item, refer to the “Allowance for Loan Losses by Stage” table on the previous page in this Note.
2
The allowance for credit losses on all remaining financial assets is not significant.
(e)
Relevant macroeconomic factors are incorporated in risk parameters as appropriate. Additional risk factors that are industry or segment specific are also
incorporated, where relevant. The key macroeconomic variables used in determining ECLs include regional unemployment rates for all retail exposures and
regional housing price indices for residential mortgages and home equity lines of credit. For business and government loans, the key macroeconomic variables
include gross domestic product (GDP), unemployment rates, interest rates, and credit spreads. Refer to Note 3 of the Bank’s 2025 Annual Consolidated Financial
Statements for a discussion of how forward-looking information is generated and considered in determining whether there has been a significant increase in credit
risk and in measuring ECLs.
TD BANK GROUP • SECOND QUARTER 2026 • REPORT TO SHAREHOLDERS
Page 69
Macroeconomic Variables
Select macroeconomic variables are projected over the forecast period.
The following table sets out average values of the macroeconomic variables over the four
calendar quarters starting with the current quarter, and the remaining 4-year forecast period for the base forecast and upside and downside scenarios used in
determining the Bank’s ECLs as at April 30, 2026. As the forecast period increases, information about the future becomes less readily available and projections
are anchored on assumptions around structural relationships between economic parameters that are inherently much less certain. The ongoing conflict in the
Middle East and resulting energy shock poses a new headwind for the economic outlook which comes on top of still-elevated trade uncertainty. Accordingly, our
baseline forecast reflects some tempering in economic growth and upward adjustment to unemployment rates. Any further escalation in trade tensions or a more
prolonged Middle East conflict that results in persistently elevated energy prices would pose a further downside risk to the economic outlook. However, the Bank’s
Canadian and U.S. downside scenarios reflect a recession and help capture these risks accordingly through its allowance process.
Macroeconomic Variables
As at
April 30, 2026
Base Forecast
Upside Scenario
Downside Scenario
Average
Remaining
Average
Remaining
Average
Remaining
Q2 2026-
4-year
Q2 2026-
4-year
Q2 2026-
4-year
Q1 2027
1
period
1
Q1 2027
1
period
1
Q1 2027
1
period
1
Unemployment rate
Canada
%
%
%
%
%
%
United States
Real GDP
Canada
(0.7 )
United States
(0.2 )
Home prices
Canada (average existing price)
2
(6.3 )
United States (CoreLogic HPI)
3
(6.1 )
Central bank policy interest rate
Canada
United States
U.S. 10-year treasury yield
U.S. 10-year BBB spread (%-pts)
Exchange rate (U.S. dollar/Canadian dollar)
$
$
$
$
$
$
1
The numbers represent average values for the quoted periods and average of year-on-year growth for real GDP and home prices.
2
The average home price is the average transacted sale price of homes sold via the Multiple Listing Service; data is collected by the Canadian Real Estate Association.
3
The CoreLogic home price index (HPI) is a repeat-sales index which tracks increases and decreases in the same home’s sales price over time.
(f)
ECLs are sensitive to the inputs used in internally developed models, the macroeconomic variables in the forward-looking forecasts and respective probability
weightings in determining the probability-weighted ECLs, and other factors considered when applying expert credit judgment. Changes in these inputs,
assumptions, models, and judgments would affect the assessment of significant increase in credit risk and the measurement of ECLs.
The following table presents the base ECL scenario compared to the probability-weighted ECLs, with the latter derived from three ECL scenarios for performing
loans and off-balance sheet instruments. The difference reflects the impact of deriving multiple scenarios around the base ECLs and resultant change in ECLs due
to non-linearity and sensitivity to using macroeconomic forecasts.
Change from Base to Probability-Weighted ECLs
(millions of Canadian dollars, except as noted)
As at
April 30, 2026
October 31, 2025
Probability-weighted ECLs
$
$
Base ECLs
Difference – in amount
$
$
Difference – in percentage
%
%
ECLs for performing loans and off-balance sheet instruments consist of an aggregate amount of Stage 1 and Stage 2 probability-weighted ECLs which are twelve-
month ECLs and lifetime ECLs, respectively. Transfers from Stage 1 to Stage 2 ECLs result from a significant increase in credit risk since initial recognition.
The
following table shows the estimated impact of staging on ECLs by presenting all performing loans and off-balance sheet instruments calculated using twelve-month
ECLs compared to the current aggregate probability-weighted ECLs, holding all risk profiles constant.
Incremental Lifetime ECLs Impact
(millions of Canadian dollars)
As at
April 30, 2026
October 31, 2025
Probability-weighted ECLs
$
$
All performing loans and off-balance sheet instruments using 12-month ECLs
Incremental lifetime ECLs impact
$
$
(g)
Foreclosed assets are repossessed non-financial assets where the Bank gains title, ownership, or possession of individual properties, such as real estate
properties, which are managed for sale in an orderly manner with the proceeds used to reduce or repay any outstanding debt. The Bank does not generally occupy
foreclosed properties for its business use. The Bank predominantly relies on third-party appraisals to determine the carrying value of foreclosed assets. Foreclosed
assets held for sale were $
Balance Sheet.
TD BANK GROUP • SECOND QUARTER 2026 • REPORT TO SHAREHOLDERS
Page 70
(h)
A loan is classified as past due when a borrower has failed to make a payment by the contractual due date.
The following table summarizes loans that are past
due but not impaired. Loans less than 31 days contractually past due are excluded as they do not generally reflect a borrower’s ability to meet their payment
obligations.
Loans Past Due but not Impaired
1
(millions of Canadian dollars)
As at
April 30, 2026
October 31, 2025
31-60
61-89
31-60
61-89
days
days
Total
days
days
Total
Residential mortgages
$
$
$
$
$
$
Consumer instalment and other personal
Credit card
Business and government
Total
$
$
$
$
$
$
1
Includes loans that are measured at FVOCI.
NOTE 7: INVESTMENTS IN ASSOCIATES AND JOINT VENTURES
INVESTMENT IN THE CHARLES SCHWAB CORPORATION
On February 12, 2025, the Bank sold its entire remaining equity investment in The Charles Schwab Corporation (“Schwab”) through a registered offering and
share repurchase by Schwab. Immediately prior to the sale, TD held
% economic ownership.
The sale of the shares resulted in proceeds of approximately $
$
items, and direct transaction costs. For segment reporting, the Bank recognized an after-tax gain of $
underwriting fees in its Wholesale segment as a result of TD Securities acting as a lead bookrunner on the transaction. In the current quarter, the Bank revised its
estimate of taxes owed on the gain from its disposition of Schwab shares, which increased the Bank's after-tax gain to $
details.
The Bank discontinued recording its share of earnings available to common shareholders from its investment in Schwab following the sale. Prior to the sale, the
Bank accounted for its investment in Schwab using the equity method. The Bank’s share of Schwab’s earnings available to common shareholders was reported
with a one-month lag. The Bank’s share of net income from its prior investment in Schwab of $
April 30, 2025, respectively, reflects net income after adjustments for amortization of certain intangibles net of tax.
The Stockholder Agreement was terminated by the Bank’s sale of its equity investment in Schwab. The Bank continues to have a business relationship with
Schwab through the insured deposit account agreement (“Schwab IDA Agreement”).
INSURED DEPOSIT ACCOUNT AGREEMENT
On May 4, 2023, the Bank and Schwab entered into an amended Schwab IDA Agreement, with an initial expiration of July 1, 2034. Pursuant to the Schwab IDA
Agreement, the Bank makes sweep deposit accounts available to clients of Schwab. Schwab designates a portion of the deposits with the Bank as fixed-rate
obligation amounts. Remaining deposits are designated as floating-rate obligations. The IDA deposit floor is set at US$
Refer to Note 26 of the Bank’s 2025 Annual Consolidated Financial Statements for further details on the Schwab IDA Agreement.
NOTE 8: OTHER ASSETS
Other Assets
(millions of Canadian dollars)
As at
April 30
October 31
2026
2025
Accounts receivable and other items
$
$
Accrued interest
Cheques and other items in transit
Current income tax receivable
Defined benefit asset
Investments in other associates and joint ventures
Prepaid expenses
Reinsurance contract assets
Total
$
$
TD BANK GROUP • SECOND QUARTER 2026 • REPORT TO SHAREHOLDERS
Page 71
NOTE 9: DEPOSITS
Demand deposits are those for which the Bank does not have the right to require notice prior to withdrawal, which primarily include business and government
chequing accounts. Notice deposits are those for which the Bank can legally require notice prior to withdrawal, which include both savings and chequing
accounts. Term deposits are payable on a given date of maturity with terms ranging from one day to ten years and generally include fixed term deposits,
guaranteed investment certificates, senior debt, and similar instruments. The aggregate amount of term deposits in denominations of $100,000 or more as at
April 30, 2026, was $
Deposits
(millions of Canadian dollars)
As at
April 30
October 31
By Type
By Country
2026
2025
Demand
Notice
Term
1
Canada
United States
International
Total
Total
Personal
$
$
$
$
$
$
$
$
Banks
Business and government
2
Trading
Designated at fair value through
profit or loss
3
Total
$
$
$
$
$
$
$
$
Non-interest-bearing deposits
included above
4
Canada
$
$
United States
International
Interest-bearing deposits
included above
4
Canada
United States
5
International
Total
2,6
$
$
1
Includes $
Canada Deposit Insurance Corporation, including the ability to convert specified eligible shares and liabilities into common shares in the event that the Bank becomes non-viable.
2
Includes $
3
other liabilities designated at FVTPL.
4
5
6
currencies.
NOTE 10: OTHER LIABILITIES
Other Liabilities
(millions of Canadian dollars)
As at
April 30
October 31
2026
2025
Accounts payable, accrued expenses, and other items
$
$
Accrued interest
Accrued salaries and employee benefits
Cheques and other items in transit
Current income tax payable
Deferred tax liabilities
Defined benefit liability
Lease liabilities
Liabilities related to structured entities
Provisions
Total
$
$
TD BANK GROUP • SECOND QUARTER 2026 • REPORT TO SHAREHOLDERS
Page 72
NOTE 11: SUBORDINATED NOTES AND DEBENTURES
Issuances
On April 30, 2026, the Bank issued $
maturing on June 16, 2036. The notes will bear interest at a fixed rate of
% per annum (paid semi-annually) until June 16, 2031, and at the Daily
Compounded Canadian Overnight Repo Rate Average plus
% thereafter (paid quarterly) until maturity on June 16, 2036. With prior approval of OSFI, the
Bank may, at its option, redeem the notes on or after June 16, 2031, in whole or in part, at par plus accrued and unpaid interest on not more than
Redemptions
On March 4, 2026, the Bank redeemed all of its outstanding $
% NVCC subordinated notes due March 4, 2031, constituting subordinated
indebtedness of the Bank, at a redemption price of
date.
NOTE 12: EQUITY
The following table summarizes the changes to the shares and other equity instruments issued and outstanding, and treasury instruments held as at and for the
three and six months ended April 30, 2026 and April 30, 2025.
Shares and Other Equity Instruments Issued and Outstanding and Treasury Instruments Held
(thousands of shares or other equity instruments
and millions of Canadian dollars)
For the three months ended
For the six months ended
April 30, 2026
April 30, 2025
April 30, 2026
April 30, 2025
Number
Number
Number
Number
of shares
Amount
of shares
Amount
of shares
Amount
of shares
Amount
Common Shares
Balance as at beginning of period
$
$
$
$
Proceeds from shares issued on exercise
of stock options
Shares issued as a result of dividend
reinvestment plan
Purchase of shares for cancellation and other
(19,346 )
(284 )
(30,001 )
(436 )
(38,772 )
(568 )
(30,001 )
(436 )
Balance as at end of period – common shares
$
$
$
$
Preferred Shares and Other Equity Instruments
Preferred Shares – Class A
Balance as at beginning of period
$
$
$
$
Redemption of shares
(20,000 )
(500 )
Balance as at end of period
$
$
$
$
Other Equity Instruments
1
Balance as at beginning of period
$
$
$
$
Issue of limited recourse capital notes
Balance as at end of period
Balance as at end of period – preferred shares
and other equity instruments
$
$
$
$
Treasury – common shares
2
Balance as at beginning of period
$
(5 )
$
(38 )
$
$
(17 )
Purchase of shares
(2,899 )
(2,880 )
(6,213 )
(6,384 )
Sale of shares
(21,560 )
(34,211 )
(48,547 )
(78,841 )
Balance as at end of period – treasury
– common shares
$
(60 )
$
(26 )
$
(60 )
$
(26 )
Treasury – preferred shares and
other equity instruments
2
Balance as at beginning of period
$
(11 )
$
(51 )
$
(4 )
$
(18 )
Purchase of shares and other equity instruments
(353 )
(267 )
(515 )
(1,387 )
Sale of shares and other equity instruments
(333 )
(1,397 )
(573 )
(3,464 )
Balance as at end of period – treasury
– preferred shares and other equity instruments
$
(14 )
$
(28 )
$
(14 )
$
(28 )
1
For Other Equity Instruments, the number of shares represents the number of notes issued.
2
reduction in equity.
DIVIDENDS
On May 27, 2026, the Board approved a dividend in an amount of one dollar and twelve cents ($
) per fully paid common share in the capital stock of the Bank
for the quarter ending July 31, 2026, payable on and after July 31, 2026, to shareholders of record at the close of business on July 10, 2026.
DIVIDEND REINVESTMENT PLAN
The Bank offers a Dividend Reinvestment Plan (DRIP) for its common shareholders. Participation in the plan is optional and under the terms of the plan, cash
dividends on common shares are used to purchase additional common shares. At the option of the Bank, the common shares may be issued from treasury at an
average market price based on the last five trading days before the date of the dividend payment, with a discount of between
% to
% at the Bank’s discretion or
purchased from the open market at market prices.
During the three and six months ended April 30, 2026, the Bank satisfied the DRIP requirements through open market common share purchases. During the
three months ended April 30, 2025, the Bank satisfied the DRIP requirements through open market common share purchases. During the six months ended
April 30, 2025, the Bank satisfied the DRIP requirements through common shares issued from treasury with
common share purchases in the last three months.
TD BANK GROUP • SECOND QUARTER 2026 • REPORT TO SHAREHOLDERS
Page 73
NORMAL COURSE ISSUER BID
On February 24, 2025, the Bank announced that the Toronto Stock Exchange (TSX) and OSFI had approved a normal course issuer bid (2025 NCIB) to purchase
for cancellation up to
cancelled $
On January 16, 2026, the Bank announced that the TSX and OSFI have approved the Bank’s new normal course issuer bid (2026 NCIB) to repurchase for
cancellation up to $
on (A) the earliest to occur of: (i) January 15, 2027; (ii) the date on which the aggregate purchase cost of common shares purchased equals $
date on which the maximum number of common shares purchasable is reached; or (B) such earlier date as the Bank may determine. From the commencement of
the 2026 NCIB on January 20, 2026, to April 30, 2026, the Bank repurchased
a total amount of $
2026 NCIB program, for a total of $
NOTE 13: SHARE-BASED COMPENSATION
For the three and six months ended April 30, 2026, the Bank recognized compensation expense for stock option awards of $
respectively (three and six months ended April 30, 2025 – $
April 30, 2025,
nil
stock options were granted by the Bank at a weighted-average fair value of $
The following table summarizes the assumptions used for estimating the fair value of options for the six months ended April 30, 2026 and April 30, 2025.
Assumptions Used for Estimating the Fair Value of Options
(in Canadian dollars, except as noted)
For the six months ended
April 30
April 30
2026
2025
Risk-free interest rate
%
%
Option contractual life
Expected volatility
%
%
Expected dividend yield
%
%
Exercise price/share price
$
$
The risk-free interest rate is based on Government of Canada benchmark bond yields as at the grant date. Expected volatility is calculated based on the historical
average daily volatility and expected dividend yield is based on dividend payouts in the last fiscal year. These assumptions are measured over a period
corresponding to the option contractual life.
NOTE 14: EMPLOYEE BENEFITS
The following table summarizes expenses for the Bank’s principal pension and non-pension post-retirement defined benefit plans and the Bank’s other material
defined benefit pension plans, for the three and six months ended April 30, 2026 and April 30, 2025. Other employee defined benefit plans operated by the Bank
and certain of its subsidiaries are not considered material for disclosure purposes.
Defined Benefit Plan Expenses
(millions of Canadian dollars)
Principal post-retirement
Principal pension plans
benefit plan
Other pension plans
1
For the three months ended
April 30
April 30
April 30
April 30
April 30
April 30
2026
2025
2026
2025
2026
2025
Service cost – benefits earned
$
$
$
$
$
$
Net interest cost (income) on net defined benefit liability (asset)
(11 )
(13 )
Past service cost
Defined benefit administrative expenses
Total
$
$
$
$
$
$
For the six months ended
April 30
April 30
April 30
April 30
April 30
April 30
2026
2025
2026
2025
2026
2025
Service cost – benefits earned
$
$
$
$
$
$
Net interest cost (income) on net defined benefit liability (asset)
(23 )
(25 )
Past service cost
Defined benefit administrative expenses
Total
$
$
$
$
$
$
1
Includes Canada Trust defined benefit pension plan, TD Banknorth defined benefit pension plan, TD Auto Finance defined benefit pension plan, TD Insurance defined benefit pension
plan, and supplemental executive defined benefit pension plans.
TD BANK GROUP • SECOND QUARTER 2026 • REPORT TO SHAREHOLDERS
Page 74
The following table summarizes expenses for the Bank’s defined contribution plans for the three and six months ended April 30, 2026 and April 30, 2025.
Defined Contribution Plan Expenses
(millions of Canadian dollars)
For the three months ended
For the six months ended
April 30
April 30
April 30
April 30
2026
2025
2026
2025
Defined contribution pension plans
1
$
$
$
$
Government pension plans
2
Total
$
$
$
$
1
Includes defined contribution portion of the TD Pension Plan (Canada) and TD Bank, N.A. defined contribution 401(k) plan.
2
Federal Insurance Contributions Act
.
The following table summarizes the remeasurements recognized in OCI for the Bank’s principal pension and post-retirement defined benefit plans and certain of
the Bank’s other material defined benefit pension plans, for the three and six months ended April 30, 2026 and April 30, 2025.
Amounts Recognized in Other Comprehensive Income for Remeasurement of Defined Benefit Plans
1,2,3
(millions of Canadian dollars)
Principal post-retirement
Principal pension plans
benefit plan
Other pension plans
For the three months ended
April 30
April 30
April 30
April 30
April 30
April 30
2026
2025
2026
2025
2026
2025
Remeasurement gain/(loss) – financial
$
$
$
$
$
$
Remeasurement gain/(loss) – return on plan assets less
interest income
(110 )
(366 )
Change in asset limitation and minimum funding requirement
Total
$
$
(66 )
$
$
$
$
For the six months ended
April 30
April 30
April 30
April 30
April 30
April 30
2026
2025
2026
2025
2026
2025
Remeasurement gain/(loss) – financial
$
$
$
$
$
$
Remeasurement gain/(loss) – return on plan assets less
interest income
(421 )
(184 )
Change in asset limitation and minimum funding requirement
Total
$
$
(26 )
$
$
$
$
1
plan, and other employee defined benefit plans operated by the Bank and certain of its subsidiaries not considered material for disclosure purposes as these plans are not remeasured on
a quarterly basis.
2
3
NOTE 15: INCOME TAXES
Income Tax Adjustment on the Gain on Sale of Schwab Shares
In the current quarter, the Bank revised its estimate of taxes owed on the gain from its disposition of Schwab shares in the prior year. The revision reflects the
Bank's most recent tax filings and includes previously inestimable information. The revision reduced the Bank's provision for income taxes by $
Other Tax Matters
The Canada Revenue Agency (CRA), Revenu Québec Agency (RQA) and Alberta Tax and Revenue Administration (ATRA) are denying certain dividend and
interest deductions claimed by the Bank. As at April 30, 2026, the CRA has reassessed the Bank for $
reassessed the Bank for $
Bank has been reassessed for $
that its tax filing positions were appropriate and filed a Notice of Appeal with the Tax Court of Canada on March 21, 2023.
NOTE 16: EARNINGS PER SHARE
Basic earnings per share is calculated by dividing net income available to common shareholders by the weighted-average number of common shares outstanding
for the period.
Diluted earnings per share is calculated using the same method as basic earnings per share except that certain adjustments are made to net income available
to common shareholders and the weighted-average number of shares outstanding for the effects of all dilutive potential common shares that are assumed to be
issued by the Bank.
TD BANK GROUP • SECOND QUARTER 2026 • REPORT TO SHAREHOLDERS
Page 75
The following table presents the Bank’s basic and diluted earnings per share for the three and six months ended April 30, 2026 and April 30, 2025.
Basic and Diluted Earnings Per Share
(millions of Canadian dollars, except as noted)
For the three months ended
For the six months ended
April 30
April 30
April 30
April 30
2026
2025
2026
2025
Basic earnings per share
Net income available to common shareholders
$
$
$
$
Weighted-average number of common shares outstanding (millions)
Basic earnings per share
(Canadian dollars)
$
$
$
$
Diluted earnings per share
Net income available to common shareholders including impact of dilutive securities
$
$
$
$
Weighted-average number of common shares outstanding (millions)
Effect of dilutive securities
Stock options potentially exercisable (millions)
1
Weighted-average number of common shares outstanding – diluted (millions)
Diluted earnings per share
(Canadian dollars)
1
$
$
$
$
1
For the three and six months ended April 30, 2026,
30, 2025, the computation of diluted earnings per share excluded average options outstanding of
and $
, respectively, as the option price was greater than the average market price of the Bank’s common shares.
NOTE 17: PROVISIONS AND CONTINGENT LIABILITIES
Other than as described below, there have been no new significant events or transactions except as previously identified in Note 25 of the Bank’s 2025 Annual
Consolidated Financial Statements.
(a)
In the ordinary course of business, the Bank and its subsidiaries are involved in various legal and regulatory actions, including but not limited to civil claims and
lawsuits, regulatory examinations, investigations, audits, and requests for information by governmental, regulatory and self-regulatory agencies and law
enforcement authorities in various jurisdictions, in respect of our businesses and compliance programs. The Bank establishes provisions when it becomes
probable that the Bank will incur a loss and the amount can be reliably estimated. The Bank also estimates the aggregate range of reasonably possible losses
(RPL) in its legal and regulatory actions (that is, those which are neither probable nor remote), in excess of provisions. However, the Bank does not disclose the
specific possible loss associated with each underlying matter given the substantial uncertainty associated with each possible loss as described below and the
negative consequences to the Bank’s resolution of the matters that comprise the RPL should individual possible losses be disclosed. As at April 30, 2026, the
Bank’s RPL is from
the Bank’s best estimates based upon currently available information for actions for which estimates can be made, but there are a number of factors that could
cause the Bank’s actual losses to be significantly different from its provisions or RPL. For example, the Bank’s estimates involve significant judgment due to the
varying stages of the proceedings, the existence of multiple defendants in many proceedings whose share of liability has yet to be determined, the numerous yet-
unresolved issues in many of the proceedings, some of which are beyond the Bank’s control and/or involve novel legal theories and interpretations, the attendant
uncertainty of the various potential outcomes of such proceedings, and the fact that the underlying matters will change from time to time. In addition, some actions
seek very large or indeterminate damages. Refer to Note 25 of the Bank’s 2025 Annual Consolidated Financial Statements for details on the Bank’s significant
legal and regulatory matters. Based on the Bank’s current knowledge, and subject to the factors listed above as well as other uncertainties inherent in litigation and
regulatory matters, other than as described below: (i) there have been no notable developments to the matters previously identified in Note 25 of the Bank’s 2025
Annual Consolidated Financial Statements; and (ii) since October 31, 2025, no other legal or regulatory matter has arisen or progressed to the point that it would
reasonably be expected to result in a material financial impact to the Bank.
As previously disclosed, on October 10, 2024, the Bank announced that, following active cooperation and engagement with authorities and regulators, it
reached a resolution (the “Global Resolution”) of previously disclosed investigations related to its U.S. Bank Secrecy Act (BSA) and Anti-Money Laundering (AML)
compliance programs (collectively, the “U.S. BSA/AML program”). The Bank and certain of its U.S. subsidiaries consented to orders with the Office of the
Comptroller of the Currency (OCC), the Federal Reserve Board, and the Financial Crimes Enforcement Network and entered into plea agreements with the
Department of Justice (DOJ), Criminal Division, Money Laundering and Asset Recovery Section and the United States Attorney’s Office for the District of New
Jersey. Details of the Global Resolution include: (i) a total payment of US$
(ii) TD Bank, N.A. (TDBNA) pleading guilty to one count of conspiring to fail to maintain an adequate AML program, failing to file accurate currency transaction
reports (CTRs) and launder money and TD Bank US Holding Company (TDBUSH) pleading guilty to two counts of causing TDBNA to fail to maintain an adequate
AML program and to fail to file accurate CTRs; (iii) requirements to remediate the Bank’s U.S. BSA/AML program; (iv) a requirement to prioritize the funding and
staffing of the remediation, which includes Board certifications for dividend distributions from certain of the Bank’s U.S. subsidiaries to the Bank; (v) formal
oversight of the U.S. BSA/AML remediation through an independent compliance monitorship; (vi) a prohibition against the average combined total assets of TD’s
two U.S. banking subsidiaries (TDBNA and TD Bank USA, N.A.) (collectively, the “U.S. Bank”) exceeding US$
of the U.S. Bank as at September 30, 2024) (the “Asset Limitation”), and if the U.S. Bank does not achieve compliance with all actionable articles in the OCC
consent orders (and for each successive year that the U.S. Bank remains non-compliant), the OCC may require the U.S. Bank to further reduce total consolidated
assets by up to
%; (vii) the U.S. Bank being subject to OCC supervisory approval processes for any additions of new bank products, services, markets, and
stores prior to the OCC’s acceptance of the U.S. Bank’s improved AML policies and procedures, to ensure the AML risk of new initiatives is appropriately
considered and mitigated; (viii) requirements for the Bank and TD Group U.S. Holdings, LLC (TDGUS) to retain a third party to assess the effectiveness of the
corporate governance and U.S. management structure and composition to adequately oversee U.S. operations; (ix) requirements to comply with the terms of the
plea agreements with the DOJ during a five-year term of probation (which could be extended as a result of the Bank failing to complete the compliance
undertakings, failing to cooperate or to report alleged misconduct as required, or committing additional crimes); (x) an ongoing obligation to cooperate with DOJ
investigations; and (xi) an ongoing obligation to report evidence or allegations of violations by the Bank, its affiliates, or their employees that may be a violation of
U.S. federal law. The Bank is focused on meeting the terms of the consent orders and plea agreements, including meeting its requirements to remediate the
Bank’s U.S. BSA/AML compliance programs. During the first fiscal quarter of 2025, the Bank fully paid the remainder of the monetary penalty owed pursuant to the
consent orders and plea agreements that were entered into as part of the Global Resolution. The payment was covered by provisions previously taken by the Bank
for this matter.
TD BANK GROUP • SECOND QUARTER 2026 • REPORT TO SHAREHOLDERS
Page 76
As previously disclosed, the Bank and some former and current directors, officers and employees have been named as defendants in proposed class action
lawsuits in the United States and Canada purporting to be brought on behalf of the Bank’s shareholders alleging, among other things, that a decline in the price of
the Bank’s shares was the result of misleading disclosures with respect to the Bank’s AML compliance programs and/or the potential outcomes of the government
agencies’ or regulators’ investigations. The two proposed class actions filed in the United States have been consolidated under the caption
Tiessen v. The
Toronto-Dominion Bank, et al.,
in the United States District Court for the Southern District of New York, and a consolidated amended complaint has been filed
which names TD Bank, N.A., TDBUSH, and certain former and current officers as defendants. On May 30, 2025, the defendants filed a motion to dismiss in the
Tiessen
case, which is pending before the court. Out of the three proposed class actions in Ontario,
Parkin v. The Toronto-Dominion Bank, et al.,
has been
identified as the lead action with the other two Ontario actions being stayed. There remains one further proposed class action in Quebec which has been stayed.
The
Parkin
certification hearing and the motion to seek leave under the
Securities Act
(Ontario) were argued in part on February 17 to 20, 2026 and May 20 and
21, 2026, with an additional date for argument scheduled on May 28, 2026. A putative shareholder derivative action, captioned
Rubin v. Masrani, et al.,
has also
been filed purportedly on behalf of TD in the United States in the Supreme Court of the State of New York, New York County, against certain former and current
TD directors, officers and employees, and certain of TD’s U.S. affiliates and subsidiaries. The complaint asserts alleged breaches of duties and other claims
against the individual defendants in connection with the Bank’s U.S. BSA/AML compliance programs. On October 31, 2025, TD filed a motion to dismiss the
Rubin
action. Certain purported TD shareholders have also filed an application in the Ontario Superior Court of Justice (
The Trustees of International Brotherhood of
Electrical Workers, et al., v. The Toronto-Dominion Bank, et al.
) seeking leave to bring a shareholder derivative action in the Delaware Court of Chancery on behalf
of TD and TDBUSH against certain current and former directors and officers. The motion to seek leave was heard on April 21, 2026. On May 4, 2026, the Court
issued its decision declining the applicant's leave. The applicants have
early stages. Losses or damages cannot be estimated at this time.
As previously disclosed, the Bank has been named as defendant in a purported class action lawsuit in the United States to be brought on behalf of First Horizon
shareholders alleging that a decline in the price of First Horizon shares was the result of alleged misleading disclosures the Bank made with respect to its U.S.
BSA/AML compliance programs and its effect on the Bank’s contemplated merger with First Horizon. The lawsuit also names some of the Bank’s former and
current officers and a former employee as defendants. On November 26, 2025, the court dismissed plaintiffs’ complaint, but gave plaintiffs a final opportunity to
amend their complaint again to attempt to address its deficiencies. On January 22, 2026, the plaintiffs did not amend their complaint and instead filed a notice of
appeal. On February 26, 2026, three lawsuits brought by entities organized under the laws of the Cayman Islands were filed on an individual basis in New Jersey
state court against the Bank, TDBNA, TDGUS and current and former officers and employees claiming they were induced to purchase and hold First Horizon stock
based on TD's representations concerning TD's U.S. BSA/AML compliance programs and its effect on the Bank's contemplated merger with First Horizon.
Nineteen77 Global Multi-Strategy Alpha Master Ltd. et al v. The Toronto-Dominion Bank et al; AQR Arbitrage MA Offshore Fund L.P. et al v. The Toronto-
Dominion Bank et al; HBK Master Fund LP et al v. The Toronto-Dominion Bank et al
. On March 27, 2026, TD filed a notice to remove the cases to federal court,
which plaintiffs are contesting. Losses or damages cannot be estimated at this time.
As previously disclosed, the Bank is a defendant in Canada and/or the United States in a number of matters, including class actions, alleging claims in
connection with various fees, practices and credit decisions. The cases are in various stages of maturity and include, among others: a Quebec action against
members of the financial services industry (including the Bank) regarding the existence and amount of the insufficient or non-sufficient funds fee, a Quebec action
against certain brokers (including TD Direct Investing) regarding disclosure of foreign conversion fees, a Quebec action against members of the automobile
insurance industry (including Primmum Insurance Company) regarding underwriting practices in Quebec, and a class action that was recently certified against the
Bank related to a specific class of employees and TD’s practice of treating amounts paid under the applicable compensation plans as inclusive of vacation pay and
public holiday pay for those employees.
Refer to Note 15 for disclosures related to tax matters.
(b)
During fiscal 2026, the Bank undertook certain measures to reduce its cost base and achieve greater efficiency. The restructuring program concluded on
January 31, 2026. For the three and six months ended April 30, 2026, the Bank incurred pre-tax restructuring charges (recovery) of $
(6 )
respectively (three and six months ended April 30, 2025 – $
TD BANK GROUP • SECOND QUARTER 2026 • REPORT TO SHAREHOLDERS
Page 77
NOTE 18: SEGMENTED INFORMATION
For management reporting purposes, the Bank reports its results from business operations and activities under four key business segments: Canadian Personal
and Commercial Banking, U.S. Banking, Wealth Management and Insurance, and Wholesale Banking. The Bank’s other activities are grouped into the Corporate
segment. Effective the first quarter of 2026, the Bank renamed its U.S. Retail segment to U.S. Banking to better reflect the segment’s financial products and
services.
Canadian Personal and Commercial Banking provides financial products and services to personal, small business and commercial customers, and includes
TD Auto Finance Canada. U.S. Banking is comprised of personal and business banking in the U.S., TD Auto Finance U.S., and the U.S. wealth business. Effective
the first quarter of 2026, non-interest income within U.S. Banking is adjusted for the Bank’s share of losses from community-based tax-advantaged investments
accounted for using the equity method which are reclassified to provision for income taxes. The adjustment for the three and six months ended April 30, 2026 was
$
$
February 12, 2025, the Bank sold its entire remaining equity investment in Schwab. Prior to the sale, the Bank’s investment in Schwab was reported in the U.S.
Banking segment, refer to Note 7 for further details. Wealth Management and Insurance includes the Canadian wealth business which provides investment
products and services to institutional and retail investors, and the insurance business which provides property and casualty insurance, as well as life and health
insurance products to customers across Canada. Wholesale Banking provides a wide range of capital markets, investment banking, and corporate banking
products and services, including underwriting and distribution of new debt and equity issues, providing advice on strategic acquisitions and divestitures, and
meeting the daily trading, funding, and investment needs of the Bank’s clients. The Corporate segment includes the effects of certain asset securitization
programs, treasury management, elimination of taxable equivalent adjustments and other management reclassifications, corporate level tax items, and residual
unallocated revenue and expenses.
The following table summarizes the segment results for the three and six months ended April 30, 2026 and April 30, 2025.
Results by Business Segment
1
(millions of Canadian dollars)
Canadian
Wealth
Personal and
Management
Commercial Banking
U.S. Banking
and Insurance
Wholesale Banking
2
Corporate
2
Total
For the three months ended April 30
2026
2025
2026
2025
2026
2025
2026
2025
2026
2025
2026
2025
Net interest income (loss)
$
$
$
$
$
$
$
$
$
$
$
$
Non-interest income (loss)
(284 )
(91 )
Total revenue
Provision for (recovery of)
credit losses
Insurance service expenses
Non-interest expenses
Income (loss) before income taxes
and share of net income from
investment in Schwab
(26 )
(547 )
Provision for (recovery of)
income taxes
(68 )
(611 )
Share of net income from
investment in Schwab
3,4
(4 )
Net income (loss)
$
$
$
$
$
$
$
$
$
$
$
$
For the six months ended April 30
2026
2025
2026
2025
2026
2025
2026
2025
2026
2025
2026
2025
Net interest income (loss)
$
$
$
$
$
$
$
$
(62 )
$
$
$
$
Non-interest income (loss)
(402 )
(156 )
Total revenue
32,382
Provision for (recovery of)
credit losses
Insurance service expenses
Non-interest expenses
Income (loss) before income taxes
and share of net income from
investment in Schwab
(
1,297
)Provision for (recovery of)
income taxes
(96 )
(
1,002
)(287 )
Share of net income from
investment in Schwab
3,4
Net income (loss)
$
$
$
$
$
$
$
$
$
(295 )
$
$
$
1
The retailer program partners’ share of revenues and credit losses is presented in the Corporate segment, with an offsetting amount (representing the partners’ net share) recorded in
non-interest expenses, resulting in no impact to Corporate reported net income (loss). Net income (loss) included in the U.S. Banking segment includes only the portion of revenue and
credit losses attributable to the Bank under the agreements.
2
segment.
3
4
TD BANK GROUP • SECOND QUARTER 2026 • REPORT TO SHAREHOLDERS
Page 78
Total Assets by Business Segment
(millions of Canadian dollars)
Canadian
Wealth
Personal and
Management
Wholesale
Commercial Banking
U.S. Banking
and Insurance
Banking
Corporate
Total
As at April 30, 2026
Total assets
$
$
$
$
$
$
As at October 31, 2025
Total assets
$
$
$
$
$
$
NOTE 19: INTEREST INCOME AND EXPENSE
The following tables present interest income and interest expense by basis of accounting measurement.
Interest Income
(millions of Canadian dollars)
For the three months ended
For the six months ended
April 30, 2026
April 30, 2025
April 30, 2026
April 30, 2025
Measured at amortized cost
1
$
$
$
$
Measured at FVOCI – Debt instruments
1
Measured or designated at FVTPL
Measured at FVOCI – Equity instruments
Total
$
$
$
$
1
Interest income is calculated using EIRM.
Interest Expense
(millions of Canadian dollars)
For the three months ended
For the six months ended
April 30, 2026
April 30, 2025
April 30, 2026
April 30, 2025
Measured at amortized cost
1
$
$
$
$
Measured or designated at FVTPL
Total
$
$
$
$
1
Interest expense is calculated using EIRM.
NOTE 20: REGULATORY CAPITAL
The Bank manages its capital under guidelines established by OSFI. The regulatory capital guidelines measure capital in relation to credit, market, and operational
risks. The Bank has various capital policies, procedures, and controls which it utilizes to achieve its goals and objectives. The Bank is designated as a domestic
systemically important bank (D-SIB) and a global systemically important bank (G-SIB).
Canadian banks designated as D-SIBs are required to comply with OSFI’s minimum targets for risk-based capital and leverage ratios. The minimum targets
include a D-SIB surcharge and Domestic Stability Buffer (DSB) for Common Equity Tier 1 Capital, Tier 1 Capital, Total Capital and risk-based Total Loss
Absorbing Capacity (TLAC) ratios. The DSB level was increased to
% as of November 1, 2023, and as a result the published regulatory minimum targets are
set at
%,
%,
% and
%, respectively. The OSFI target includes the greater of the D-SIB or G-SIB surcharge, both of which are currently
% for the
Bank. The OSFI target for leverage requires D-SIBs to hold a leverage ratio buffer of
% in addition to the existing minimum requirement. This sets the
published regulatory minimum targets for leverage and TLAC leverage ratios at
% and
%, respectively.
The Bank complied with all minimum risk-based capital and leverage ratio requirements set by OSFI in the six months ended April 30, 2026.
The following table summarizes the Bank’s regulatory capital positions as at April 30, 2026 and October 31, 2025.
Regulatory Capital Position
(millions of Canadian dollars, except as noted)
As at
April 30
October 31
2026
2025
Capital
Common Equity Tier 1 Capital
$
$
Tier 1 Capital
Total Capital
Risk-weighted assets used in the calculation of capital ratios
Capital and leverage ratios
Common Equity Tier 1 Capital ratio
%
%
Tier 1 Capital ratio
Total Capital ratio
Leverage ratio
TLAC Ratio
TLAC Leverage Ratio
TD BANK GROUP • SECOND QUARTER 2026 • REPORT TO SHAREHOLDERS
Page 79
SHAREHOLDER AND INVESTOR INFORMATION
Shareholder Services
If you:
And your inquiry relates to:
Are a registered shareholder (your name appears
on your TD share certificate)
Missing dividends, lost share certificates, estate
questions, address changes to the share register,
dividend bank account changes, the dividend
reinvestment plan, eliminating duplicate mailings of
shareholder materials or stopping (or resuming)
receiving annual and quarterly reports
Transfer Agent:
TSX Trust Company
301-100 Adelaide Street West
Toronto, ON M5H 4H1
1-800-387-0825 (Canada and U.S. only)
or 416-682-3860
Facsimile: 1-888-249-6189
shareholderinquiries@tmx.com or www.tsxtrust.com
Hold your TD shares through the
Direct Registration System
in the United States
Missing dividends, lost share certificates, estate
questions, address changes to the share register,
eliminating duplicate mailings of shareholder
materials or stopping (or resuming) receiving annual
and quarterly reports
Co-Transfer Agent and Registrar:
Computershare Trust Company, N.A.
P.O. Box 43006
Providence, RI 02940-3006
or
Computershare Trust Company, N.A.
150 Royall Street
Suite 101
Canton, MA 02021
1-866-233-4836
TDD for hearing impaired: 1-800-231-5469
Shareholders outside of U.S.: 201-680-6578
TDD shareholders outside of U.S.: 201-680-6610
Email inquiries: web.queries@computershare.com
For electronic access to your account visit:
www.computershare.com/investor
Beneficially own TD shares that are held in the
name of an intermediary, such as a bank, a trust
company, a securities broker or other nominee
Your TD shares, including questions regarding the
dividend reinvestment plan and mailings of
shareholder materials
Your intermediary
For all other shareholder inquiries, please contact TD Shareholder Relations at 416-944-6367 or 1-866-756-8936 or email td.shareholderrelations@td.com. Please
note that by leaving us an e-mail or voicemail message, you are providing your consent for us to forward your inquiry to the appropriate party for response.
General Information
Products and services: Contact TD Canada Trust, 24 hours a day, seven days a week: 1-866-567-8888
French: 1-866-233-2323
Cantonese/Mandarin: 1-800-328-3698
Telephone device for the hearing impaired (TTY): 1-800-361-1180
Website:
Email:
customer.service@td.com
Quarterly Earnings Conference Call
TD Bank Group will host an earnings conference call in Toronto, Ontario on May 28, 2026. The call will be audio webcast live through TD’s website at 9:30 a.m. ET.
The call will feature presentations by TD executives on the Bank’s financial results for the second quarter and discussions of related disclosures, followed by a
question-and-answer period with analysts. The presentation material referenced during the call will be available on the TD website at
www.td.com/investor
May 28, 2026, in advance of the call. A listen-only telephone line is available at 416-855-9085 or 1-800-990-2777 (toll free), passcode 62095#.
The audio webcast and presentations will be archived at
www.td.com/investor
. Replay of the teleconference will be available until 11:59 p.m. ET on June 11, 2026,
by calling 289-819-1325 or 1-888-660-6264 (toll free). The passcode is 62095#.