v3.26.1
Pay vs Performance Disclosure - USD ($)
12 Months Ended
Dec. 31, 2025
Dec. 31, 2024
Dec. 31, 2023
Pay vs Performance Disclosure      
Pay vs Performance Disclosure, Table

Pay versus Performance

The following tables and related disclosures provide information about (i) the “total compensation” of our principal executive officers (“PEOs”) and our other NEO (the “Other NEOs”) as presented in the Summary Compensation Table (the “SCT Amounts”); (ii) the “compensation actually paid” to our PEOs and our Other NEOs, as calculated pursuant to the SEC’s pay-versus-performance rules (the “CAP Amounts”); (iii) certain financial performance measures; and (iv) the relationship of the CAP Amounts to those financial performance measures.

This disclosure has been prepared in accordance with Item 402(v) of Regulation S-K under the Exchange Act and does not necessarily reflect value actually realized by the executives or how the Compensation Committee evaluates compensation decisions in light of company or individual performance. For discussion of how the Compensation Committee seeks to align pay with performance when making compensation decisions, please review the “Executive Officers and Compensation” section.


Year
(a)


Summary
Compensation
Table Total
for
First PEO
(b)
(1)


Summary
Compensation
Table Total
for
Second PEO
(b)
(1)


Compensation
Actually Paid
to First PEO
(c)
(1)(2)


Compensation
Actually Paid
to Second PEO
(c)
(1)(2)


Average
Summary
Compensation
Table Total
for
Non-PEO
Named
Executive
Officers
(d)
(1)


Average
Compensation
Actually Paid to Non-PEO
Named
Executive
Officers
(e)
(1)(2)


Value of Initial
Fixed $100
Investment
Based
on Total
Shareholder
Return
(f)


Net Income
(Loss)
(in millions)
(g)


2025


$

882,695


$

433,940


$

1,307,440


$

433,940


$


$


$

(54.85

)


(49.9

)

2024


$

1,760,321


$

1,331,919


$

1,774,244


$

1,159,418


$

475,961


$

468,839


$

(2.95

)


(62.9

)

2023


$


$

630,735


$


$

640,513


$

417,895


$

421,508


$

28.65


(15.7

)


(1)
For 2025, our First PEO was Brian Windsor, Ph.D., our Second PEO was Timothy M. Cunningham, and there were no Other NEOs. For 2024, our First PEO was Brian Windsor, Ph.D., our Second PEO was Manuel C. Alves-Aivado, M.D., Ph.D., and our Other NEOs was Charles T. Garner. For 2023, our PEO was Manuel C. Alves-Aivado, M.D., Ph.D., and our Other NEOs were Brian Windsor, Ph.D., and D. Allen Annis, Ph.D.
(2)
The following table describes the adjustments, each of which is required by SEC rules, to calculate the CAP Amounts from the SCT Amounts of our PEO (column (b)) and our Other NEOs (column (d)). The SCT Amounts and the CAP Amounts do not reflect the actual amount of compensation earned by or paid to our executives during the applicable years, but rather are amounts determined in accordance with Item 402 of Regulation S-K under the Exchange Act. Valuation assumptions used to calculate fair values in the following table did not materially differ from those used to calculate fair values at the time of grant as reflected in the SCT Amounts.


2025


Adjustments


First PEO


Second PEO


Other NEOs*


SCT Amounts


$

882,695


$

433,940


$


Adjustments for stock and option awards


(Subtract): Aggregate value for stock awards and option awards
   included in SCT for the covered fiscal year


$


$


$


Add: Fair value at year end of awards granted during the covered fiscal
   year that were outstanding and unvested at the covered fiscal
   year end


$


$


$


Add (Subtract): Year-over-year change in fair value at covered
   fiscal year end of awards granted in any prior fiscal year that were
   outstanding and unvested at the covered fiscal year end


$

269,133


$


$


Add: Vesting date fair value of awards granted and vested during
   the covered fiscal year


$


$


$


Add (Subtract): Change as of the vesting date (from the end of the
   prior fiscal year) in fair value of awards granted in any prior fiscal
   year for which vesting conditions were satisfied during the covered
   fiscal year


$

155,612


$


$


CAP Amounts (as calculated)


$

1,307,440


$

433,940


$


* Amounts presented are averages for the entire group of Other NEOs in each respective year. There were no Other NEOs during 2025.
   
Named Executive Officers, Footnote
(1)
For 2025, our First PEO was Brian Windsor, Ph.D., our Second PEO was Timothy M. Cunningham, and there were no Other NEOs. For 2024, our First PEO was Brian Windsor, Ph.D., our Second PEO was Manuel C. Alves-Aivado, M.D., Ph.D., and our Other NEOs was Charles T. Garner. For 2023, our PEO was Manuel C. Alves-Aivado, M.D., Ph.D., and our Other NEOs were Brian Windsor, Ph.D., and D. Allen Annis, Ph.D.
   
PEO Total Compensation Amount     $ 0
PEO Actually Paid Compensation Amount     0
Adjustment To PEO Compensation, Footnote


2025


Adjustments


First PEO


Second PEO


Other NEOs*


SCT Amounts


$

882,695


$

433,940


$


Adjustments for stock and option awards


(Subtract): Aggregate value for stock awards and option awards
   included in SCT for the covered fiscal year


$


$


$


Add: Fair value at year end of awards granted during the covered fiscal
   year that were outstanding and unvested at the covered fiscal
   year end


$


$


$


Add (Subtract): Year-over-year change in fair value at covered
   fiscal year end of awards granted in any prior fiscal year that were
   outstanding and unvested at the covered fiscal year end


$

269,133


$


$


Add: Vesting date fair value of awards granted and vested during
   the covered fiscal year


$


$


$


Add (Subtract): Change as of the vesting date (from the end of the
   prior fiscal year) in fair value of awards granted in any prior fiscal
   year for which vesting conditions were satisfied during the covered
   fiscal year


$

155,612


$


$


CAP Amounts (as calculated)


$

1,307,440


$

433,940


$


* Amounts presented are averages for the entire group of Other NEOs in each respective year. There were no Other NEOs during 2025.

   
Non-PEO NEO Average Total Compensation Amount $ 0 $ 475,961 417,895
Non-PEO NEO Average Compensation Actually Paid Amount $ 0 468,839 421,508
Adjustment to Non-PEO NEO Compensation Footnote


2025


Adjustments


First PEO


Second PEO


Other NEOs*


SCT Amounts


$

882,695


$

433,940


$


Adjustments for stock and option awards


(Subtract): Aggregate value for stock awards and option awards
   included in SCT for the covered fiscal year


$


$


$


Add: Fair value at year end of awards granted during the covered fiscal
   year that were outstanding and unvested at the covered fiscal
   year end


$


$


$


Add (Subtract): Year-over-year change in fair value at covered
   fiscal year end of awards granted in any prior fiscal year that were
   outstanding and unvested at the covered fiscal year end


$

269,133


$


$


Add: Vesting date fair value of awards granted and vested during
   the covered fiscal year


$


$


$


Add (Subtract): Change as of the vesting date (from the end of the
   prior fiscal year) in fair value of awards granted in any prior fiscal
   year for which vesting conditions were satisfied during the covered
   fiscal year


$

155,612


$


$


CAP Amounts (as calculated)


$

1,307,440


$

433,940


$


* Amounts presented are averages for the entire group of Other NEOs in each respective year. There were no Other NEOs during 2025.

   
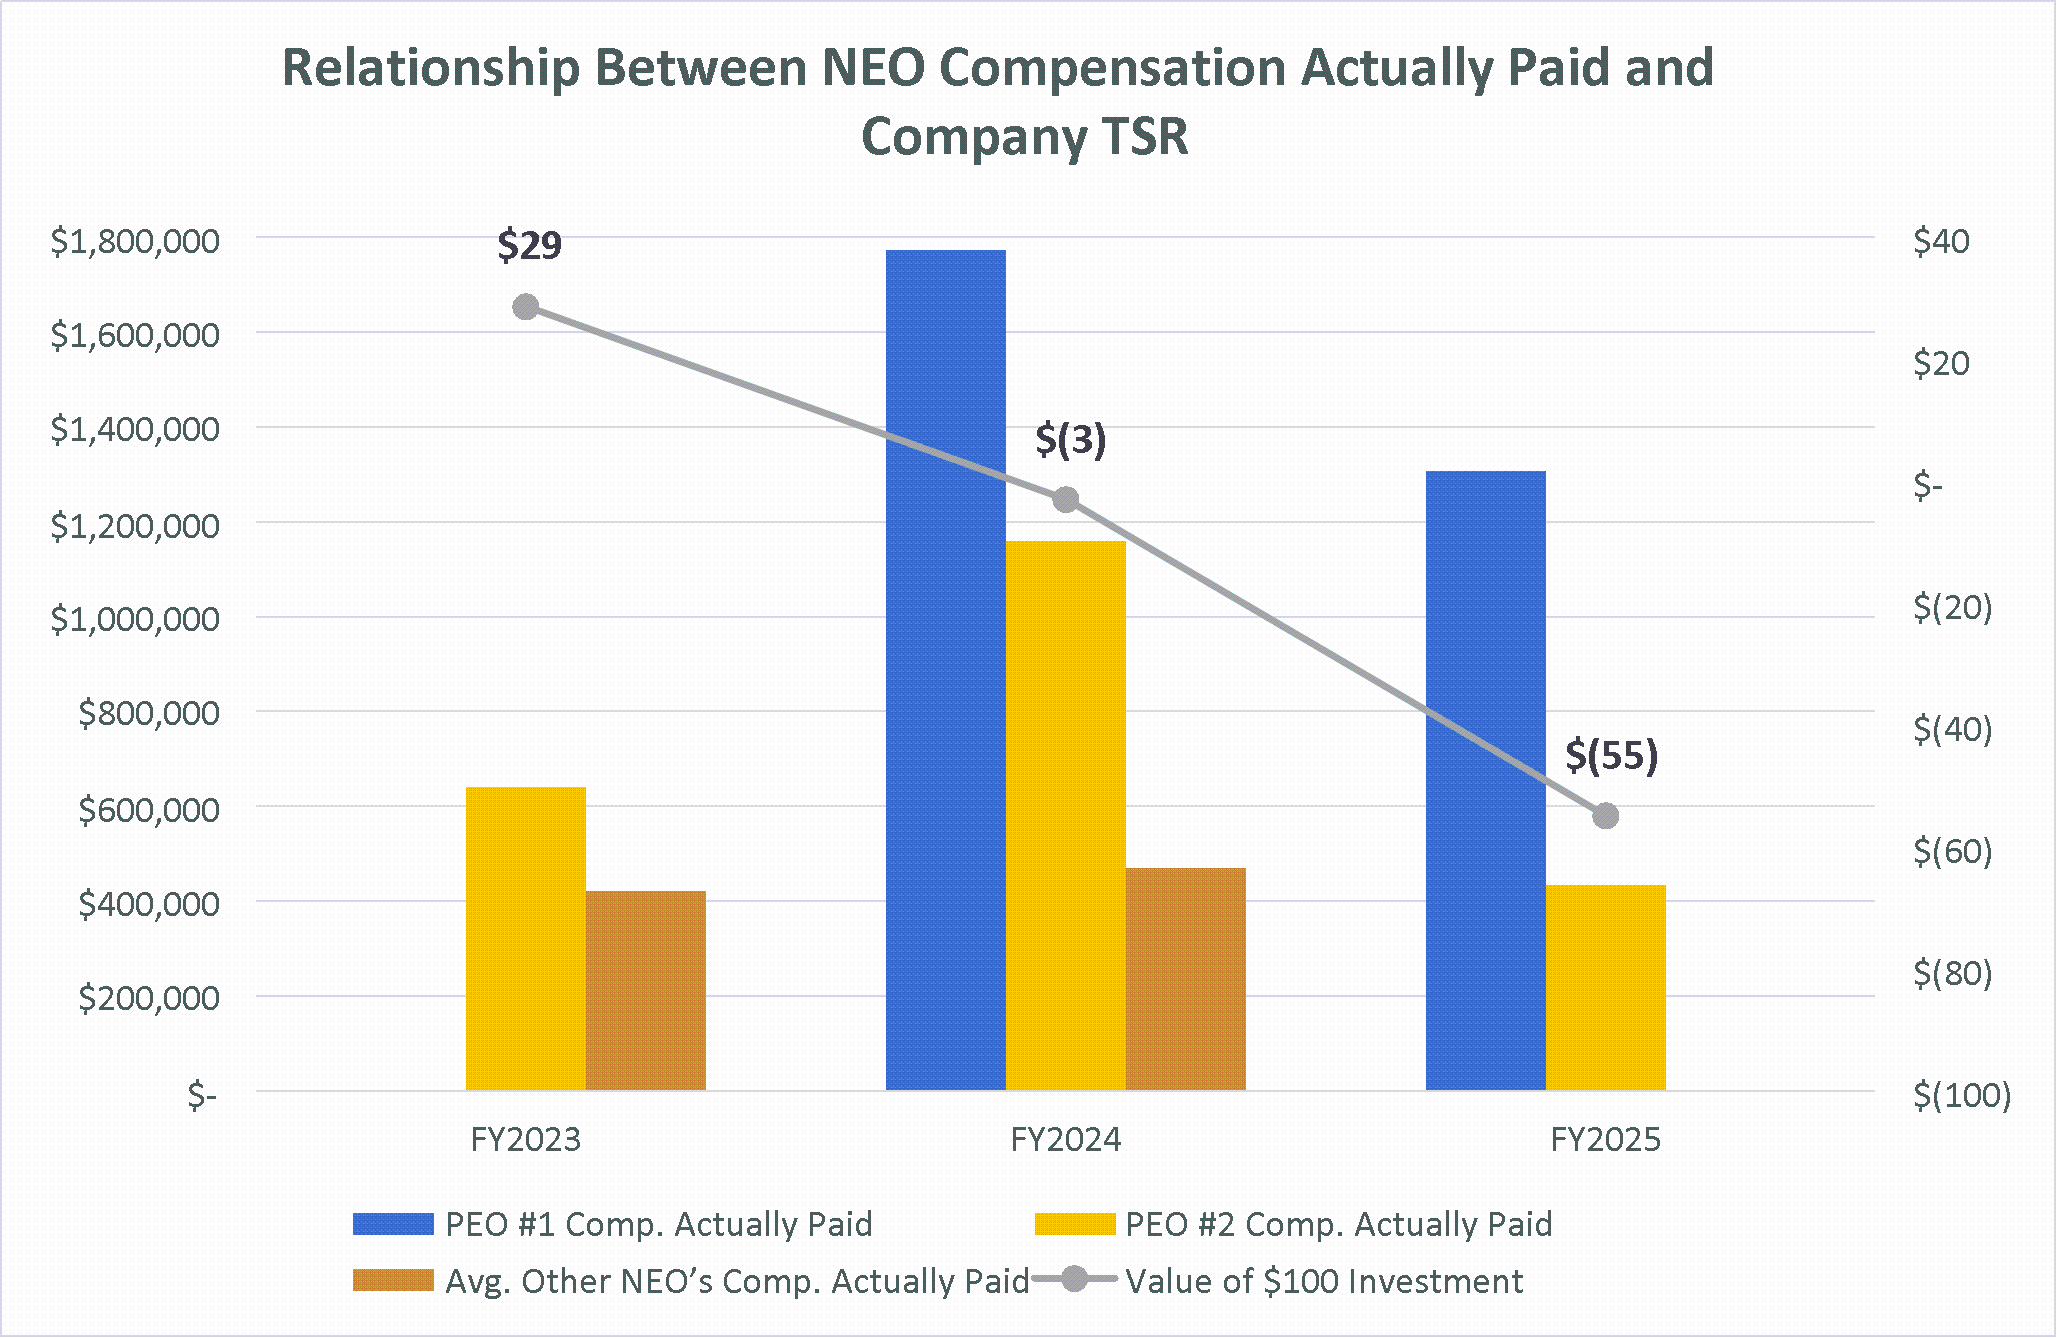
Compensation Actually Paid vs. Total Shareholder Return

img192475501_3.gif

   
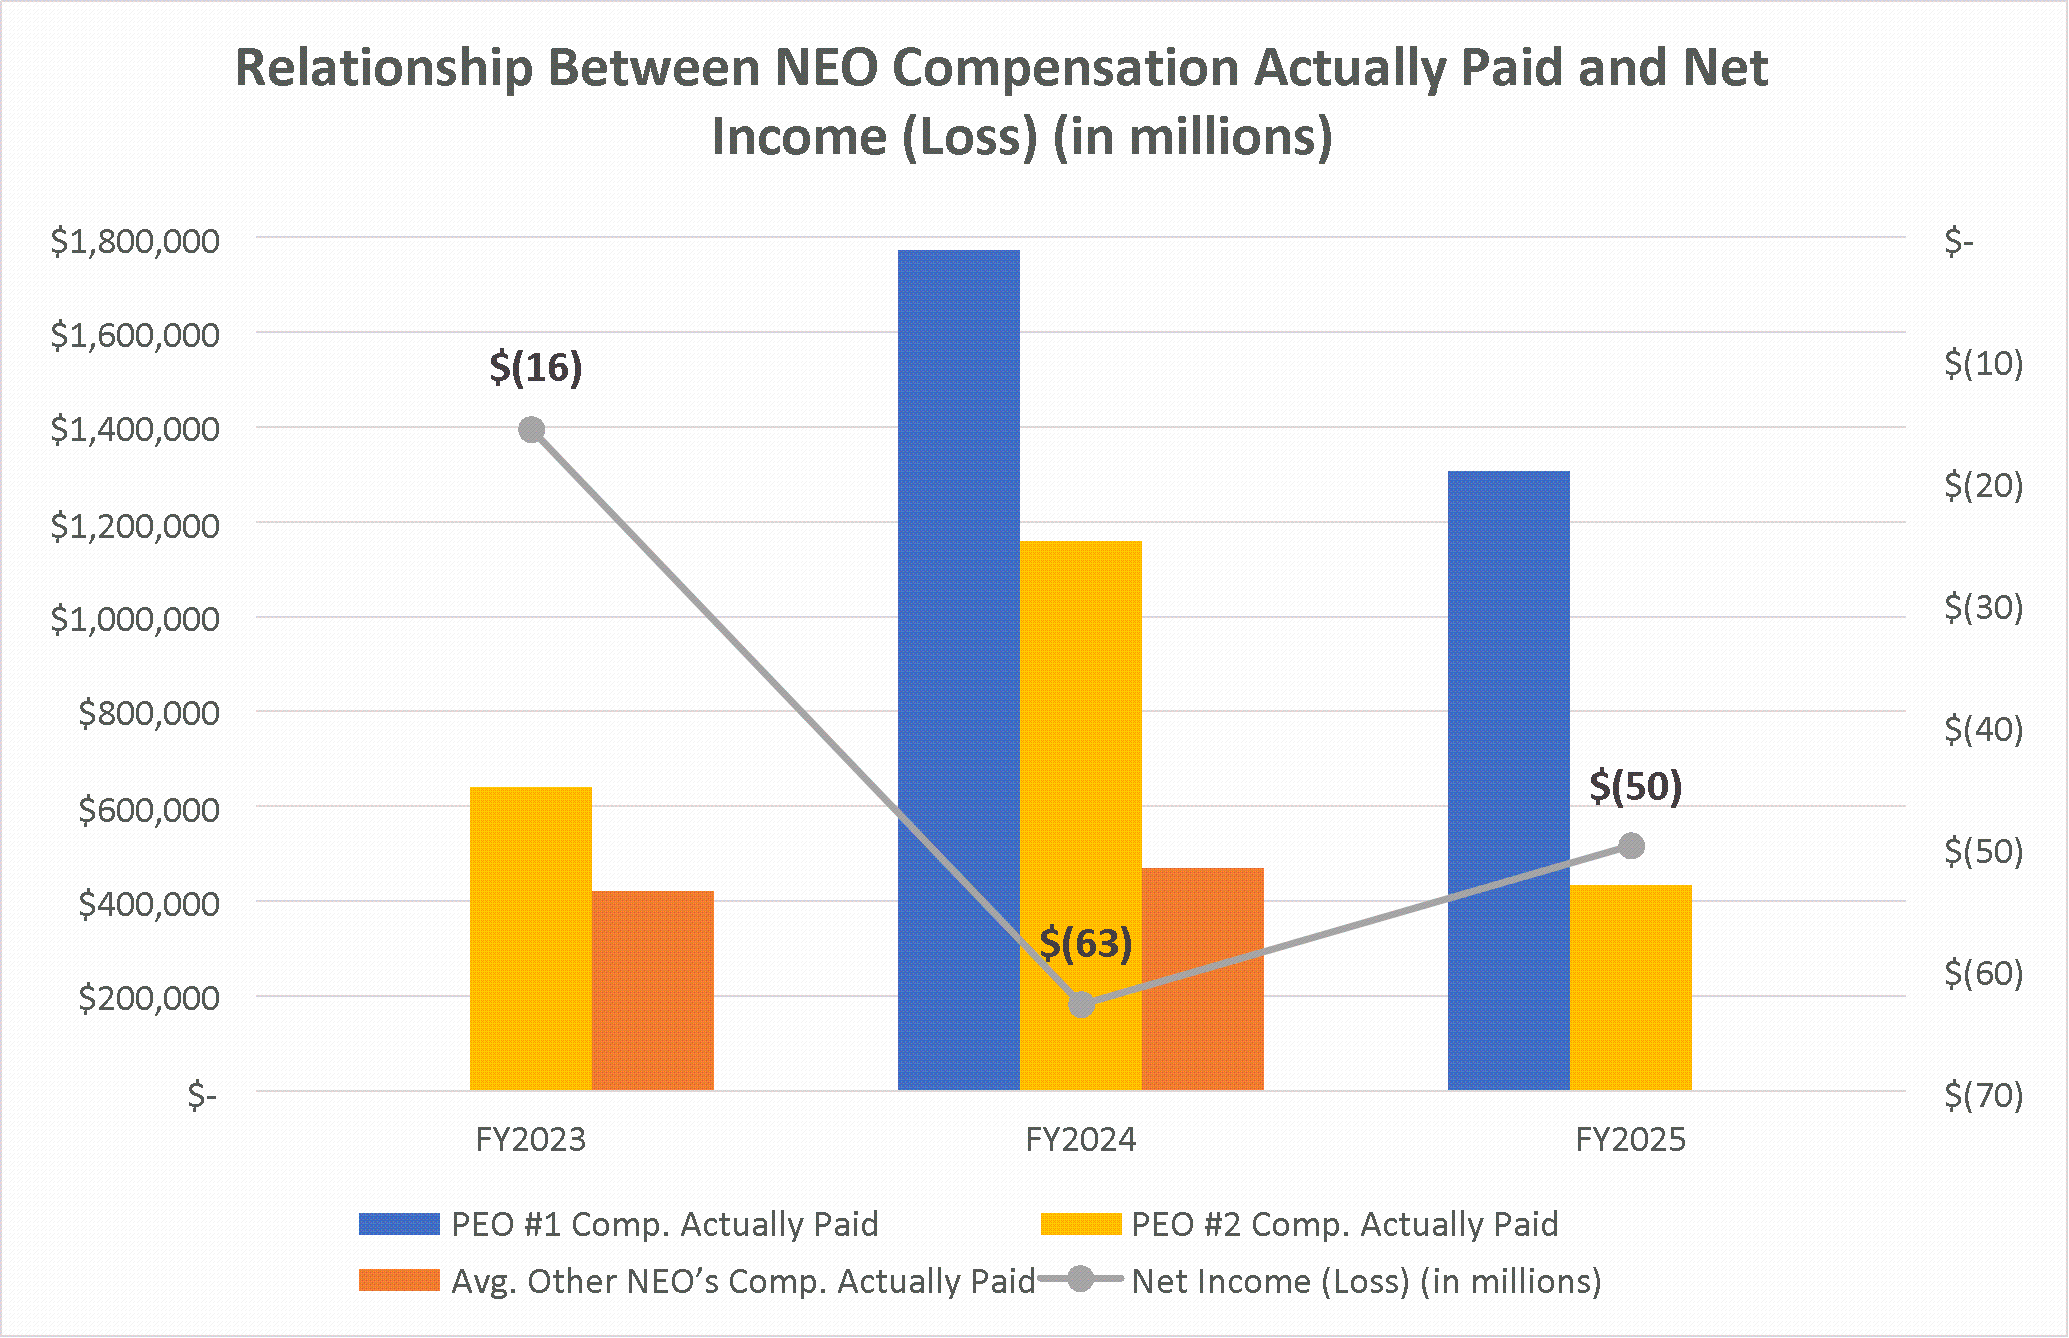
Compensation Actually Paid vs. Net Income

img192475501_4.gif

   
Total Shareholder Return Amount $ (54.85) (2.95) 28.65
Net Income (Loss) (49,900,000) (62,900,000) $ (15,700,000)
PEO Name     Manuel C. Alves-Aivado
Brian Windsor [Member]      
Pay vs Performance Disclosure      
PEO Total Compensation Amount 882,695 1,760,321  
PEO Actually Paid Compensation Amount $ 1,307,440 $ 1,774,244  
PEO Name Brian Windsor Brian Windsor  
Timothy M. Cunningham [Member]      
Pay vs Performance Disclosure      
PEO Total Compensation Amount $ 433,940    
PEO Actually Paid Compensation Amount $ 433,940    
PEO Name Timothy M. Cunningham    
Manuel C. AlvesAivado [Member]      
Pay vs Performance Disclosure      
PEO Total Compensation Amount   $ 1,331,919 $ 630,735
PEO Actually Paid Compensation Amount   $ 1,159,418 $ 640,513
PEO Name   Manuel C. Alves-Aivado  
PEO | Brian Windsor [Member] | Aggregate Grant Date Fair Value of Equity Award Amounts Reported in Summary Compensation Table      
Pay vs Performance Disclosure      
Adjustment to Compensation, Amount $ 0    
PEO | Brian Windsor [Member] | Year-end Fair Value of Equity Awards Granted in Covered Year that are Outstanding and Unvested      
Pay vs Performance Disclosure      
Adjustment to Compensation, Amount 0    
PEO | Brian Windsor [Member] | Year-over-Year Change in Fair Value of Equity Awards Granted in Prior Years That are Outstanding and Unvested      
Pay vs Performance Disclosure      
Adjustment to Compensation, Amount 269,133    
PEO | Brian Windsor [Member] | Vesting Date Fair Value of Equity Awards Granted and Vested in Covered Year      
Pay vs Performance Disclosure      
Adjustment to Compensation, Amount 0    
PEO | Brian Windsor [Member] | Change in Fair Value as of Vesting Date of Prior Year Equity Awards Vested in Covered Year      
Pay vs Performance Disclosure      
Adjustment to Compensation, Amount 155,612    
PEO | Timothy M. Cunningham [Member] | Aggregate Grant Date Fair Value of Equity Award Amounts Reported in Summary Compensation Table      
Pay vs Performance Disclosure      
Adjustment to Compensation, Amount 0    
PEO | Timothy M. Cunningham [Member] | Year-end Fair Value of Equity Awards Granted in Covered Year that are Outstanding and Unvested      
Pay vs Performance Disclosure      
Adjustment to Compensation, Amount 0    
PEO | Timothy M. Cunningham [Member] | Year-over-Year Change in Fair Value of Equity Awards Granted in Prior Years That are Outstanding and Unvested      
Pay vs Performance Disclosure      
Adjustment to Compensation, Amount 0    
PEO | Timothy M. Cunningham [Member] | Vesting Date Fair Value of Equity Awards Granted and Vested in Covered Year      
Pay vs Performance Disclosure      
Adjustment to Compensation, Amount 0    
PEO | Timothy M. Cunningham [Member] | Change in Fair Value as of Vesting Date of Prior Year Equity Awards Vested in Covered Year      
Pay vs Performance Disclosure      
Adjustment to Compensation, Amount 0    
Non-PEO NEO | Aggregate Grant Date Fair Value of Equity Award Amounts Reported in Summary Compensation Table      
Pay vs Performance Disclosure      
Adjustment to Compensation, Amount 0    
Non-PEO NEO | Year-end Fair Value of Equity Awards Granted in Covered Year that are Outstanding and Unvested      
Pay vs Performance Disclosure      
Adjustment to Compensation, Amount 0    
Non-PEO NEO | Year-over-Year Change in Fair Value of Equity Awards Granted in Prior Years That are Outstanding and Unvested      
Pay vs Performance Disclosure      
Adjustment to Compensation, Amount 0    
Non-PEO NEO | Vesting Date Fair Value of Equity Awards Granted and Vested in Covered Year      
Pay vs Performance Disclosure      
Adjustment to Compensation, Amount 0    
Non-PEO NEO | Change in Fair Value as of Vesting Date of Prior Year Equity Awards Vested in Covered Year      
Pay vs Performance Disclosure      
Adjustment to Compensation, Amount $ 0