Pay vs Performance Disclosure - USD ($) |
12 Months Ended | |||||||||||||||||||||||||||||||||||||||||||||||||||||||||||||||||||||||||||||||||
|---|---|---|---|---|---|---|---|---|---|---|---|---|---|---|---|---|---|---|---|---|---|---|---|---|---|---|---|---|---|---|---|---|---|---|---|---|---|---|---|---|---|---|---|---|---|---|---|---|---|---|---|---|---|---|---|---|---|---|---|---|---|---|---|---|---|---|---|---|---|---|---|---|---|---|---|---|---|---|---|---|---|---|
Jan. 31, 2026 |
Jan. 31, 2025 |
Jan. 31, 2024 |
Jan. 31, 2023 |
Jan. 31, 2022 |
||||||||||||||||||||||||||||||||||||||||||||||||||||||||||||||||||||||||||||||
| Pay vs Performance Disclosure | ||||||||||||||||||||||||||||||||||||||||||||||||||||||||||||||||||||||||||||||||||
| Company Selected Measure Name | GAAPRevenue (5)(6) | |||||||||||||||||||||||||||||||||||||||||||||||||||||||||||||||||||||||||||||||||
| Named Executive Officers, Footnote | Our Non-PEO NEOs, for each year presented above were:
|
|||||||||||||||||||||||||||||||||||||||||||||||||||||||||||||||||||||||||||||||||
| Peer Group Issuers, Footnote | (4)
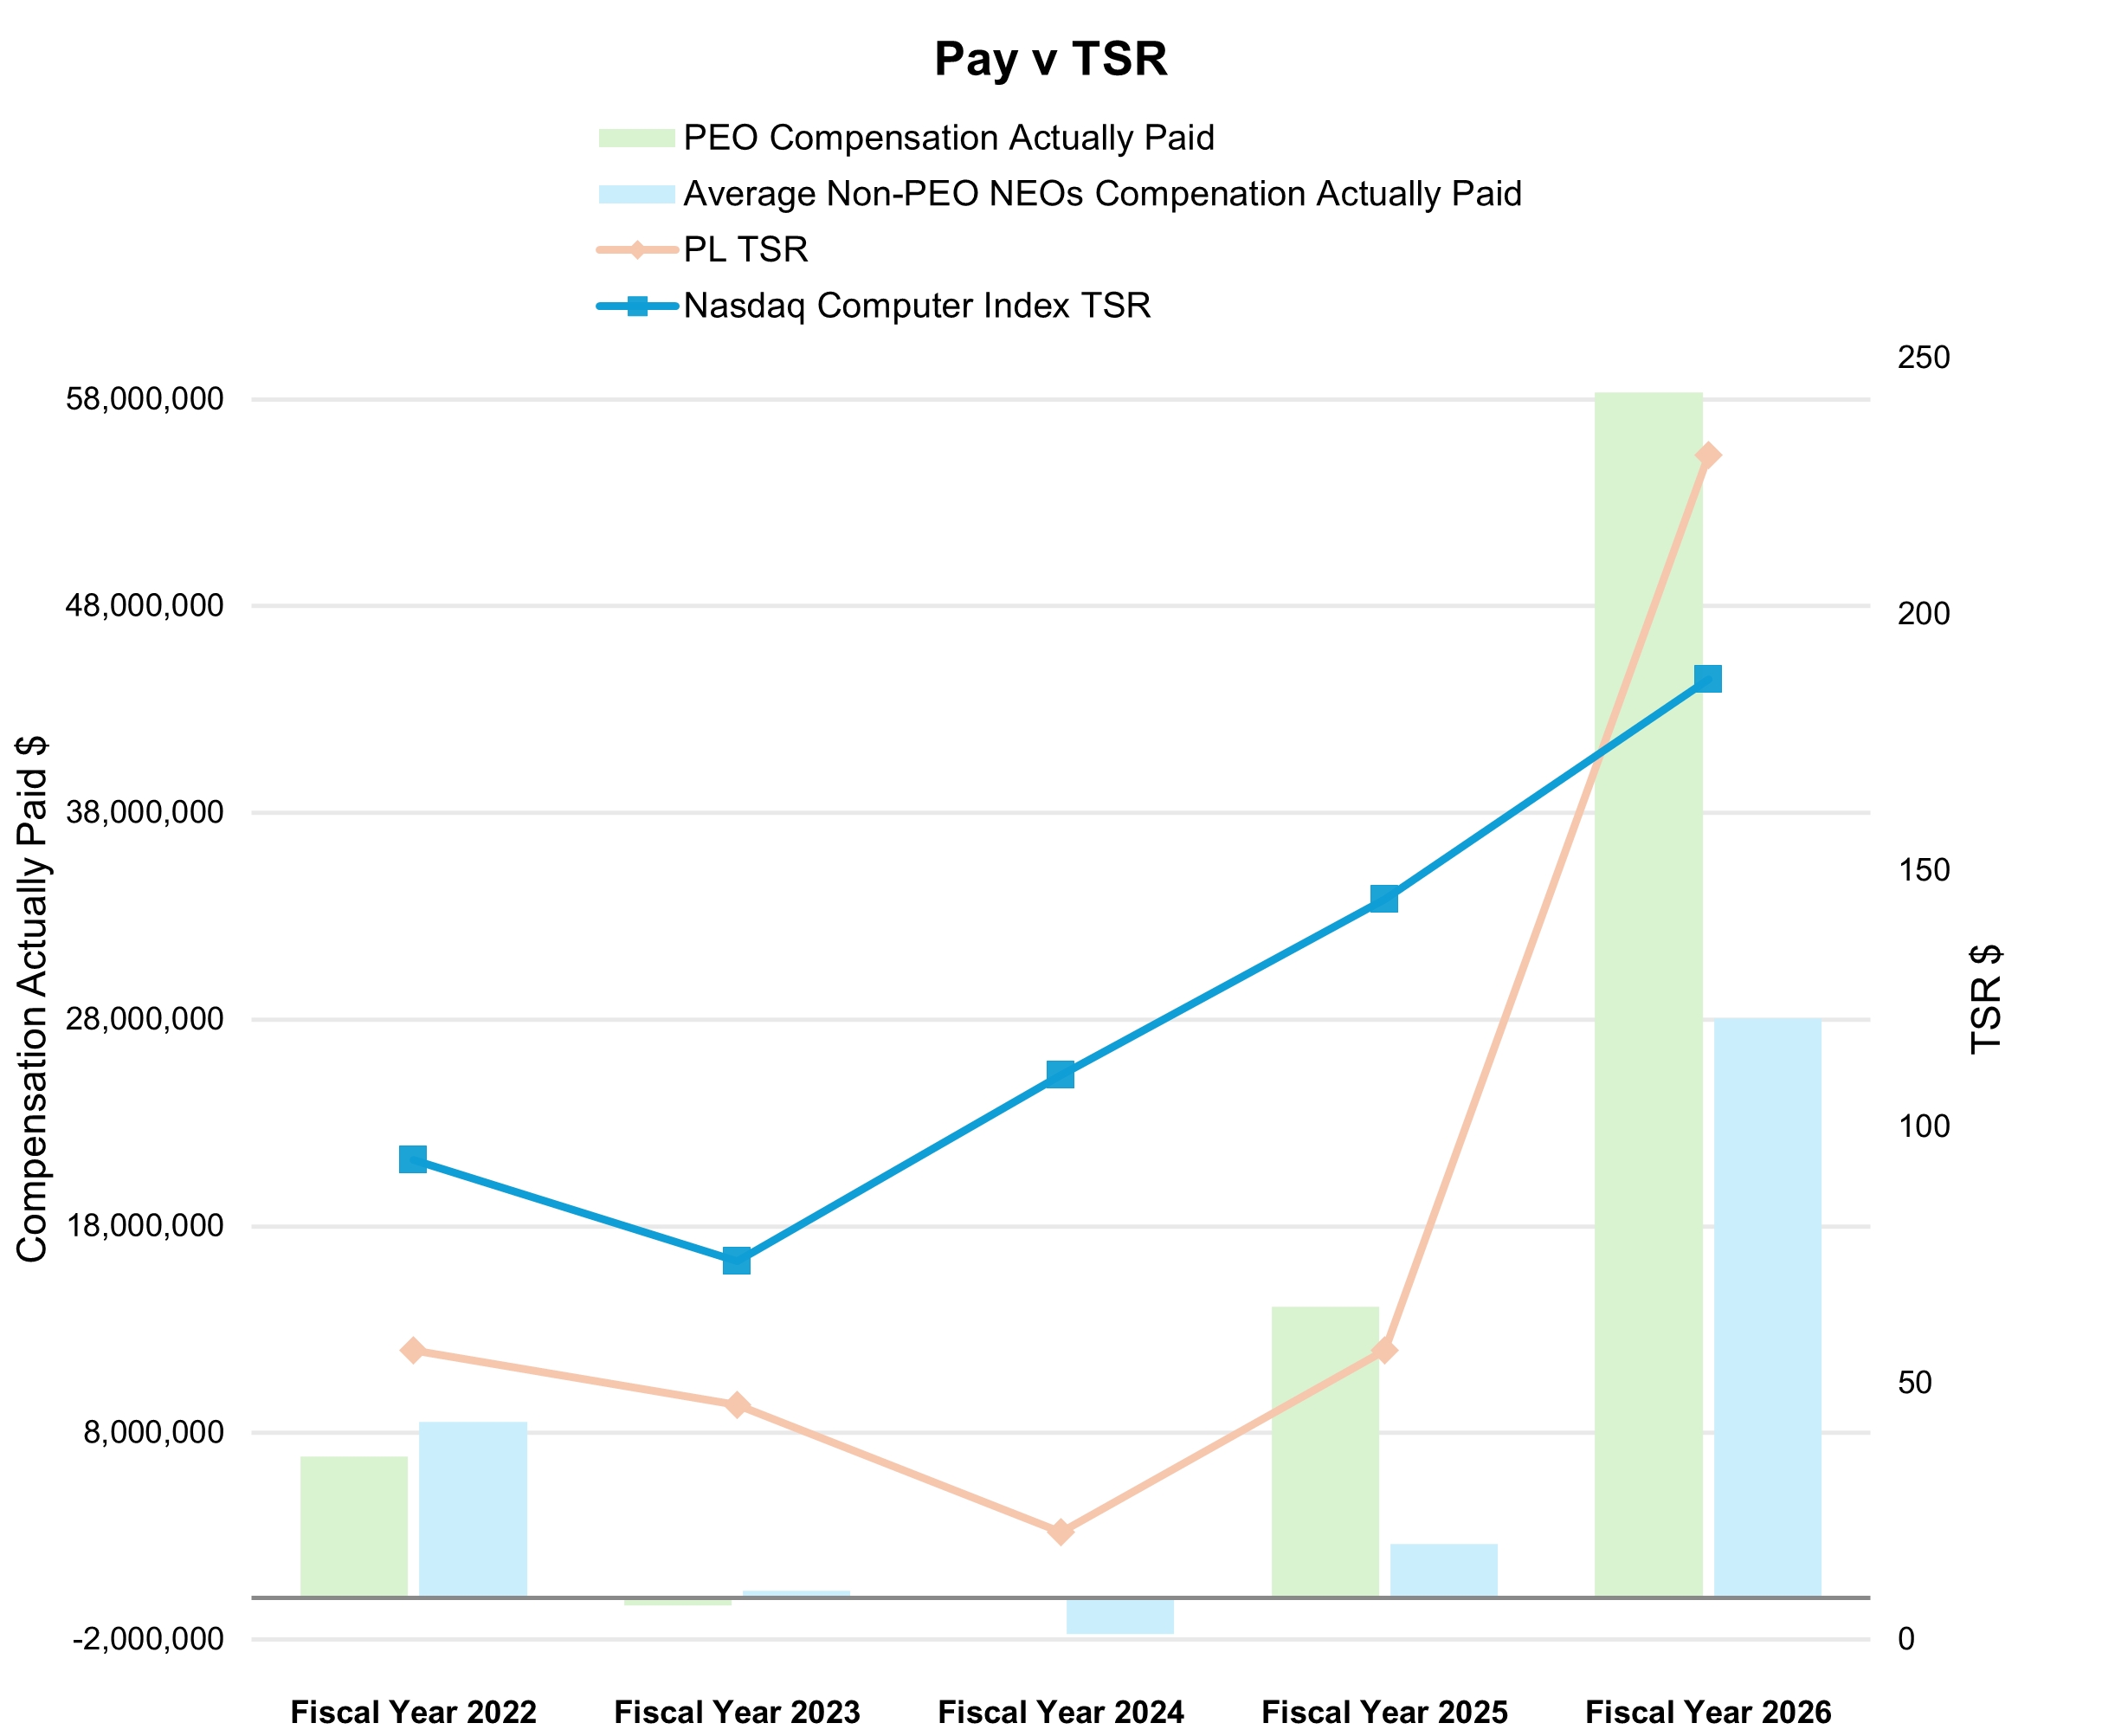
The peer group used in this disclosure is the Nasdaq Computer Index, which is the same peer group used in the stock performance graph required by Item 201(e) of Regulation S-K and included in Part II, Item 5 of our Annual Report on Form 10-K for the year ended January 31, 2026. |
|||||||||||||||||||||||||||||||||||||||||||||||||||||||||||||||||||||||||||||||||
| PEO Total Compensation Amount | $ 4,626,138 | $ 4,746,341 | $ 6,250,741 | $ 610,285 | $ 10,863,643 | |||||||||||||||||||||||||||||||||||||||||||||||||||||||||||||||||||||||||||||
| PEO Actually Paid Compensation Amount | 58,345,469 | 14,120,283 | (38,589) | (351,766) | 6,866,622 | |||||||||||||||||||||||||||||||||||||||||||||||||||||||||||||||||||||||||||||
| Non-PEO NEO Average Total Compensation Amount | 2,115,985 | 2,049,822 | 2,789,191 | 1,024,613 | 12,275,147 | |||||||||||||||||||||||||||||||||||||||||||||||||||||||||||||||||||||||||||||
| Non-PEO NEO Average Compensation Actually Paid Amount | $ 28,034,777 | 2,609,080 | (1,738,432) | 380,184 | 8,529,208 | |||||||||||||||||||||||||||||||||||||||||||||||||||||||||||||||||||||||||||||
| Equity Valuation Assumption Difference, Footnote | (2) The following table summarizes the adjustments made to each of the PEO's total compensation and the average of the Non-PEOs' total compensation, in each case, reported in the Summary Compensation Table, as required by SEC rules, to calculate "Compensation Actually Paid" amounts included in the table above. The fair value or change in fair value, as applicable, of equity awards in the “Compensation Actually Paid” columns was determined by reference to (i) for RSU and PSU awards, the closing price per share as of the applicable date; (ii) for stock options, using the Black-Scholes option pricing model as of the applicable date; and (iii) for earn-out awards, using a model based on multiple stock price paths developed through the use of a Monte Carlo simulation that incorporates into the valuation the possibility that the market condition targets may not be satisfied as of the applicable date. For further details, please see Notes 2 and 15 to our consolidated financial statements included in our 2026 Annual Report. The valuation methods used to calculate fair values did not materially differ from those disclosed as of the grant date of the equity awards. The fair value of the employee stock options outstanding at the end of the fiscal years 2026, 2025, 2024, 2023, and 2022, was estimated using the following assumptions:
|
|||||||||||||||||||||||||||||||||||||||||||||||||||||||||||||||||||||||||||||||||
| Compensation Actually Paid vs. Total Shareholder Return |
|
|||||||||||||||||||||||||||||||||||||||||||||||||||||||||||||||||||||||||||||||||
| Compensation Actually Paid vs. Net Income |
|
|||||||||||||||||||||||||||||||||||||||||||||||||||||||||||||||||||||||||||||||||
| Compensation Actually Paid vs. Company Selected Measure |
|
|||||||||||||||||||||||||||||||||||||||||||||||||||||||||||||||||||||||||||||||||
| Total Shareholder Return Amount | $ 231 | 56.43 | 20.91 | 45.79 | 56.43 | |||||||||||||||||||||||||||||||||||||||||||||||||||||||||||||||||||||||||||||
| Peer Group Total Shareholder Return Amount | 187 | 144.4 | 110.07 | 73.74 | 93.59 | |||||||||||||||||||||||||||||||||||||||||||||||||||||||||||||||||||||||||||||
| Net Income (Loss) | $ (246,860,000) | $ (123,196,000) | $ (140,509,000) | $ (161,966,000) | $ (137,124,000) | |||||||||||||||||||||||||||||||||||||||||||||||||||||||||||||||||||||||||||||
| Company Selected Measure Amount | 307,727,000 | 244,352,000 | 220,696,000 | 191,256,000 | 131,209,000 | |||||||||||||||||||||||||||||||||||||||||||||||||||||||||||||||||||||||||||||
| PEO Name | William Marshall | William Marshall | William Marshall | William Marshall | William Marshall | |||||||||||||||||||||||||||||||||||||||||||||||||||||||||||||||||||||||||||||
| Measure:: 1 | ||||||||||||||||||||||||||||||||||||||||||||||||||||||||||||||||||||||||||||||||||
| Pay vs Performance Disclosure | ||||||||||||||||||||||||||||||||||||||||||||||||||||||||||||||||||||||||||||||||||
| Name | GAAP Revenue | |||||||||||||||||||||||||||||||||||||||||||||||||||||||||||||||||||||||||||||||||
| Measure:: 2 | ||||||||||||||||||||||||||||||||||||||||||||||||||||||||||||||||||||||||||||||||||
| Pay vs Performance Disclosure | ||||||||||||||||||||||||||||||||||||||||||||||||||||||||||||||||||||||||||||||||||
| Name | Adjusted EBITDA | |||||||||||||||||||||||||||||||||||||||||||||||||||||||||||||||||||||||||||||||||
| PEO | Aggregate Grant Date Fair Value of Equity Award Amounts Reported in Summary Compensation Table | ||||||||||||||||||||||||||||||||||||||||||||||||||||||||||||||||||||||||||||||||||
| Pay vs Performance Disclosure | ||||||||||||||||||||||||||||||||||||||||||||||||||||||||||||||||||||||||||||||||||
| Adjustment to Compensation, Amount | $ (4,175,687) | $ (4,304,224) | $ (5,750,272) | $ 0 | $ (10,379,018) | |||||||||||||||||||||||||||||||||||||||||||||||||||||||||||||||||||||||||||||
| PEO | Year-end Fair Value of Equity Awards Granted in Covered Year that are Outstanding and Unvested | ||||||||||||||||||||||||||||||||||||||||||||||||||||||||||||||||||||||||||||||||||
| Pay vs Performance Disclosure | ||||||||||||||||||||||||||||||||||||||||||||||||||||||||||||||||||||||||||||||||||
| Adjustment to Compensation, Amount | 20,582,571 | 8,662,604 | 2,583,806 | 0 | 5,751,773 | |||||||||||||||||||||||||||||||||||||||||||||||||||||||||||||||||||||||||||||
| PEO | Year-over-Year Change in Fair Value of Equity Awards Granted in Prior Years That are Outstanding and Unvested | ||||||||||||||||||||||||||||||||||||||||||||||||||||||||||||||||||||||||||||||||||
| Pay vs Performance Disclosure | ||||||||||||||||||||||||||||||||||||||||||||||||||||||||||||||||||||||||||||||||||
| Adjustment to Compensation, Amount | 24,024,574 | 3,861,383 | (3,422,646) | (815,992) | 0 | |||||||||||||||||||||||||||||||||||||||||||||||||||||||||||||||||||||||||||||
| PEO | Vesting Date Fair Value of Equity Awards Granted and Vested in Covered Year | ||||||||||||||||||||||||||||||||||||||||||||||||||||||||||||||||||||||||||||||||||
| Pay vs Performance Disclosure | ||||||||||||||||||||||||||||||||||||||||||||||||||||||||||||||||||||||||||||||||||
| Adjustment to Compensation, Amount | 2,330,425 | 963,511 | 866,335 | 0 | 630,224 | |||||||||||||||||||||||||||||||||||||||||||||||||||||||||||||||||||||||||||||
| PEO | Change in Fair Value as of Vesting Date of Prior Year Equity Awards Vested in Covered Year | ||||||||||||||||||||||||||||||||||||||||||||||||||||||||||||||||||||||||||||||||||
| Pay vs Performance Disclosure | ||||||||||||||||||||||||||||||||||||||||||||||||||||||||||||||||||||||||||||||||||
| Adjustment to Compensation, Amount | 10,957,448 | 190,668 | (566,553) | (146,059) | 0 | |||||||||||||||||||||||||||||||||||||||||||||||||||||||||||||||||||||||||||||
| Non-PEO NEO | Aggregate Grant Date Fair Value of Equity Award Amounts Reported in Summary Compensation Table | ||||||||||||||||||||||||||||||||||||||||||||||||||||||||||||||||||||||||||||||||||
| Pay vs Performance Disclosure | ||||||||||||||||||||||||||||||||||||||||||||||||||||||||||||||||||||||||||||||||||
| Adjustment to Compensation, Amount | (1,714,378) | (1,600,028) | (2,513,781) | (494,188) | (11,960,050) | |||||||||||||||||||||||||||||||||||||||||||||||||||||||||||||||||||||||||||||
| Non-PEO NEO | Year-end Fair Value of Equity Awards Granted in Covered Year that are Outstanding and Unvested | ||||||||||||||||||||||||||||||||||||||||||||||||||||||||||||||||||||||||||||||||||
| Pay vs Performance Disclosure | ||||||||||||||||||||||||||||||||||||||||||||||||||||||||||||||||||||||||||||||||||
| Adjustment to Compensation, Amount | 9,129,007 | 3,244,218 | 1,014,059 | 419,698 | 6,417,961 | |||||||||||||||||||||||||||||||||||||||||||||||||||||||||||||||||||||||||||||
| Non-PEO NEO | Year-over-Year Change in Fair Value of Equity Awards Granted in Prior Years That are Outstanding and Unvested | ||||||||||||||||||||||||||||||||||||||||||||||||||||||||||||||||||||||||||||||||||
| Pay vs Performance Disclosure | ||||||||||||||||||||||||||||||||||||||||||||||||||||||||||||||||||||||||||||||||||
| Adjustment to Compensation, Amount | 12,677,223 | 349,101 | (2,743,352) | (487,409) | 655,031 | |||||||||||||||||||||||||||||||||||||||||||||||||||||||||||||||||||||||||||||
| Non-PEO NEO | Vesting Date Fair Value of Equity Awards Granted and Vested in Covered Year | ||||||||||||||||||||||||||||||||||||||||||||||||||||||||||||||||||||||||||||||||||
| Pay vs Performance Disclosure | ||||||||||||||||||||||||||||||||||||||||||||||||||||||||||||||||||||||||||||||||||
| Adjustment to Compensation, Amount | 1,054,616 | 375,386 | 377,401 | 73,520 | 183,824 | |||||||||||||||||||||||||||||||||||||||||||||||||||||||||||||||||||||||||||||
| Non-PEO NEO | Change in Fair Value as of Vesting Date of Prior Year Equity Awards Vested in Covered Year | ||||||||||||||||||||||||||||||||||||||||||||||||||||||||||||||||||||||||||||||||||
| Pay vs Performance Disclosure | ||||||||||||||||||||||||||||||||||||||||||||||||||||||||||||||||||||||||||||||||||
| Adjustment to Compensation, Amount | $ 4,772,324 | $ 80,982 | $ (661,950) | $ (156,050) | $ 957,295 | |||||||||||||||||||||||||||||||||||||||||||||||||||||||||||||||||||||||||||||