Performance Management
|
May 26, 2026 |
| Intelligent Real Estate ETF |
|
| Prospectus [Line Items] |
|
| Bar Chart and Performance Table [Heading] |
Performance
|
| Performance Narrative [Text Block] |
The
following performance information provides some indication of the risks of investing in the Fund by showing changes in the Fund’s
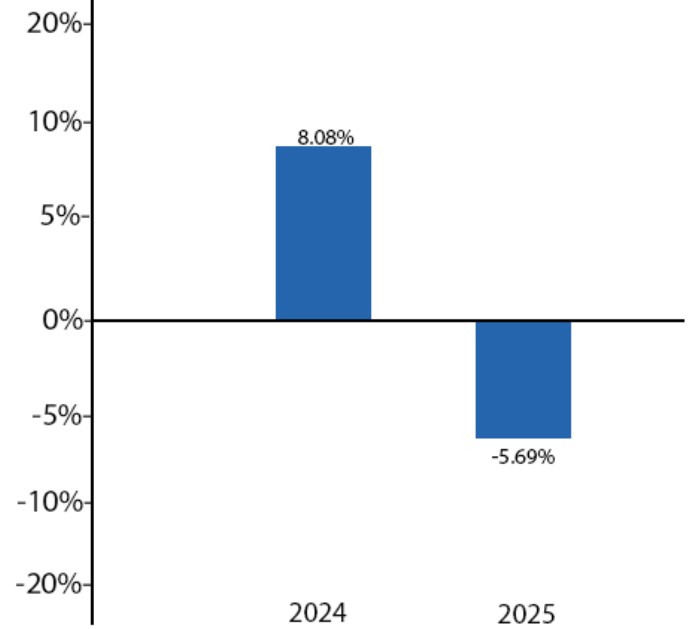
performance. The bar chart shows the annual returns for the Fund from year-to-year. The table illustrates how the Fund’s
average annual total returns for the 1-year and since inception periods compare with those of a broad measure of market performance
as well as a more narrowly-tailored index. The Fund’s past performance, before and after taxes, does not necessarily indicate
how it will perform in the future. Updated performance information is available on the Fund’s website at www.armadaetfs.com/reai/.
|
| Performance Past Does Not Indicate Future [Text] |
The Fund’s past performance, before and after taxes, does not necessarily indicate
how it will perform in the future.
|
| Performance Information Illustrates Variability of Returns [Text] |
The
following performance information provides some indication of the risks of investing in the Fund by showing changes in the Fund’s
performance.
|
| Bar Chart [Heading] |
Calendar
Year Ended December 31,
|
| Bar Chart [Table] |
|
| Bar Chart Closing [Text Block] |
The
Fund’s year-to-date return as of March 31, 2026 was 4.10%. During the period of time shown in the bar chart, the Fund’s
highest quarterly return was 15.37% for the quarter ended September 30, 2024 and the lowest quarterly return was -7.08% for the
quarter ended December 31, 2024.
|
| Year to Date Return, Label [Optional Text] |
year-to-date return
|
| Bar Chart, Year to Date Return |
4.10%
|
| Bar Chart, Year to Date Return, Date |
Mar. 31, 2026
|
| Highest Quarterly Return, Label [Optional Text] |
highest quarterly return
|
| Highest Quarterly Return |
15.37%
|
| Highest Quarterly Return, Date |
Sep. 30, 2024
|
| Lowest Quarterly Return, Label [Optional Text] |
lowest quarterly return
|
| Lowest Quarterly Return |
(7.08%)
|
| Lowest Quarterly Return, Date |
Dec. 31, 2024
|
| Performance Table Heading |
Average
Annual Total Returns
For
the Periods Ended December 31, 2025
|
| Performance Table Uses Highest Federal Rate |
After-tax
returns are calculated using the historical highest individual federal marginal income tax rates during the period covered by
the table above and do not reflect the impact of state and local taxes.
|
| Performance Table Not Relevant to Tax Deferred |
After-tax returns shown are not relevant to investors who hold their Shares through
tax-deferred arrangements or other tax-advantaged accounts, such as an individual retirement account (“IRA”).
|
| Performance Table Explanation after Tax Higher |
In certain
cases, the figure representing “Return After Taxes on Distributions and Sale of Fund Shares” may be higher than other
return figures for the same period due to a capital loss that occurs upon redemption and provides an assumed tax deduction that
benefits the investor.
|
| Performance [Table] |
| |
1
Year |
|
Since
Inception
(06/12/2023) |
| Return
Before Taxes |
-5.69% |
|
1.64% |
| Return
After Taxes on Distributions |
-7.32% |
|
0.26% |
| Return
After Taxes on Distributions and Sale of Fund Shares |
-3.15% |
|
0.84% |
Dow
Jones U.S. Select REIT Index
(reflects
no deduction for fees, expenses or taxes) |
3.67% |
|
8.42% |
S&P
500® Total Return Index
(reflects no deduction for fees, expenses, or taxes) |
17.88% |
|
21.21% |
|
| Index No Deduction for Fees, Expenses, or Taxes [Text] |
(reflects
no deduction for fees, expenses or taxes)
|
| Performance Table Closing [Text Block] |
After-tax
returns are calculated using the historical highest individual federal marginal income tax rates during the period covered by
the table above and do not reflect the impact of state and local taxes. Actual after-tax returns depend on an investor’s
tax situation and may differ from those shown. After-tax returns shown are not relevant to investors who hold their Shares through
tax-deferred arrangements or other tax-advantaged accounts, such as an individual retirement account (“IRA”). In certain
cases, the figure representing “Return After Taxes on Distributions and Sale of Fund Shares” may be higher than other
return figures for the same period due to a capital loss that occurs upon redemption and provides an assumed tax deduction that
benefits the investor.
|
| Performance Availability Website Address [Text] |
www.armadaetfs.com/reai/
|
| Residential REIT ETF |
|
| Prospectus [Line Items] |
|
| Bar Chart and Performance Table [Heading] |
Performance
|
| Performance Narrative [Text Block] |
The
following performance information provides some indication of the risks of investing in the Fund by showing changes in the Fund’s
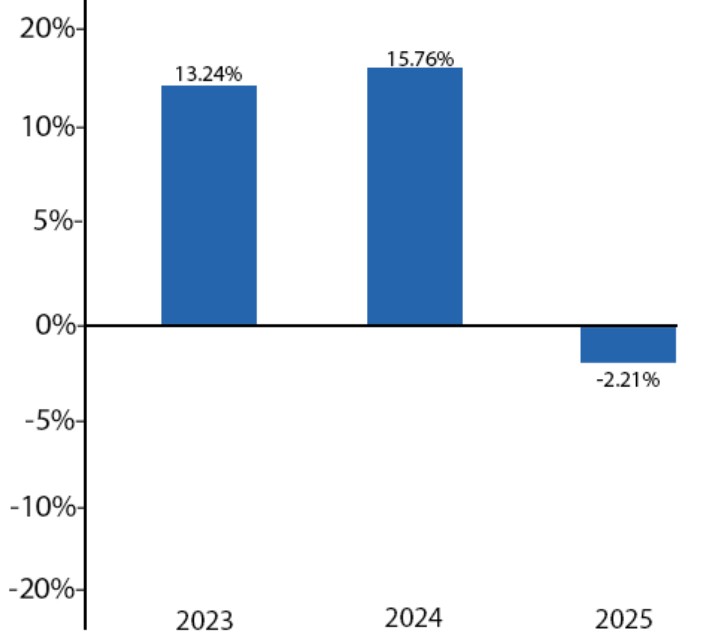
performance over time. The bar chart shows the annual returns for the Fund from year-to-year. The table illustrates how the Fund’s
average annual total returns for the 1-year and since inception periods compare with those of a broad measure of market performance
as well as a more narrowly-tailored index. The Fund’s past performance, before and after taxes, does not necessarily indicate
how it will perform in the future. Updated performance information is available on the Fund’s website at www.armadaetfs.com/haus/.
|
| Performance Past Does Not Indicate Future [Text] |
The Fund’s past performance, before and after taxes, does not necessarily indicate
how it will perform in the future.
|
| Performance Information Illustrates Variability of Returns [Text] |
The
following performance information provides some indication of the risks of investing in the Fund by showing changes in the Fund’s
performance over time.
|
| Bar Chart [Heading] |
Calendar
Year Ended December 31,
|
| Bar Chart [Table] |
| |
|
| 2023 |
13.24% |
| 2024 |
15.76% |
| 2025 |
-2.21% |
|
| Bar Chart Closing [Text Block] |
The
Fund’s year-to-date return as of March 31, 2026 was -3.00%. During the period of time shown in the bar chart, the Fund’s
highest quarterly return was 13.37% for the quarter ended December 31, 2023 and the lowest quarterly return was -8.65% for the
quarter ended September 30, 2023.
|
| Year to Date Return, Label [Optional Text] |
year-to-date return
|
| Bar Chart, Year to Date Return |
(3.00%)
|
| Bar Chart, Year to Date Return, Date |
Mar. 31, 2026
|
| Highest Quarterly Return, Label [Optional Text] |
highest quarterly return
|
| Highest Quarterly Return |
13.37%
|
| Highest Quarterly Return, Date |
Dec. 31, 2023
|
| Lowest Quarterly Return, Label [Optional Text] |
lowest quarterly return
|
| Lowest Quarterly Return |
(8.65%)
|
| Lowest Quarterly Return, Date |
Sep. 30, 2023
|
| Performance Table Heading |
Average
Annual Total Returns
For
the Periods Ended December 31, 2025
|
| Performance Table Uses Highest Federal Rate |
After-tax
returns are calculated using the historical highest individual federal marginal income tax rates during the period covered by
the table above and do not reflect the impact of state and local taxes.
|
| Performance Table Not Relevant to Tax Deferred |
After-tax returns shown are not relevant to investors who hold their Shares through
tax-deferred arrangements or other tax-advantaged accounts, such as an individual retirement account (“IRA”).
|
| Performance Table Explanation after Tax Higher |
In certain
cases, the figure representing “Return After Taxes on Distributions and Sale of Fund Shares” may be higher than other
return figures for the same period due to a capital loss that occurs upon redemption and provides an assumed tax deduction that
benefits the investor.
|
| Performance [Table] |
| |
1
Year |
|
Since
Inception
(02/28/2022) |
| Return
Before Taxes |
-2.21% |
|
-0.47% |
| Return
After Taxes on Distributions |
-3.18% |
|
-1.26% |
| Return
After Taxes on Distributions and Sale of Fund Shares |
-1.02% |
|
0.61% |
Dow Jones
U.S. Select REIT Index
(reflects no deduction for fees, expenses or taxes) |
3.67%
|
|
1.23% |
S&P
500® Total Return Index
(reflects no deduction for fees, expenses, or taxes) |
17.88% |
|
14.06% |
|
| Index No Deduction for Fees, Expenses, or Taxes [Text] |
(reflects no deduction for fees, expenses or taxes)
|
| Performance Table Closing [Text Block] |
After-tax
returns are calculated using the historical highest individual federal marginal income tax rates during the period covered by
the table above and do not reflect the impact of state and local taxes. Actual after-tax returns depend on an investor’s
tax situation and may differ from those shown. After-tax returns shown are not relevant to investors who hold their Shares through
tax-deferred arrangements or other tax-advantaged accounts, such as an individual retirement account (“IRA”). In certain
cases, the figure representing “Return After Taxes on Distributions and Sale of Fund Shares” may be higher than other
return figures for the same period due to a capital loss that occurs upon redemption and provides an assumed tax deduction that
benefits the investor.
|
| Performance Availability Website Address [Text] |
www.armadaetfs.com/haus/
|